Análises para Intel Core i5-1335U processador
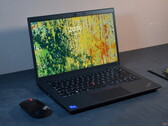
Análise do Lenovo ThinkPad L14 Gen 4 Intel: Não está mais à altura
Antes de testar os modelos mais novos da série ThinkPad L, vamos dar uma olhada no passado. O Lenovo ThinkPad L14 Gen 4 Intel tem muitos atributos que valem a pena para os trabalhadores de escritório, mas falha em algumas disciplinas importantes em comparação com os concorrentes mais modernos - com a tela como um exemplo importante.
Intel Core i5-1335U, Iris Xe G7 80EUs, 14", 1.6 kgAnálise do laptop HP EliteBook x360 830 G10: Conversível de metal com tela sensível ao toque não reflexiva
Os laptops conversíveis não são a maior parte do mercado, mas para os usuários que precisam da caneta e do toque, eles são indispensáveis. O HP EliteBook x360 830 G10 vai para o lado empresarial do mercado, enfrentando empresas como o Lenovo ThinkPad X13 Yoga Gen 4.
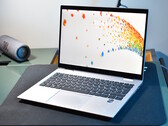
Intel Core i5-1335U, Iris Xe G7 80EUs, 13.3", 1.3 kgAnálise do laptop Acer TravelMate P4: O eufemismo é para os chefes
Emissões imperceptíveis, visual discreto, teclas silenciosas, um ClickPad grande e hardware que pode ser atualizado: O laptop de 14 polegadas da Acer pode competir com notebooks Windows no nível do HP ProBook, Lenovo ThinkPad e Dell Latitude. Mas, em contraste com esses, ele evita se destacar a todo custo.
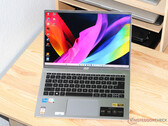
Intel Core i5-1335U, Iris Xe G7 80EUs, 14", 1.5 kgAnálise do Acer Swift Go 14 (2023): O laptop de 14 polegadas com um painel OLED de 2,9k por US$ 800
O Swift Go 14 tem baixo peso (1,3 kg), um gabinete de alumínio e uma tela OLED (2.880 x 1.800 pixels, 90 Hz) com uma proporção de 16:10 que facilita o trabalho. Além disso, o laptop possui duas portas USB 4, uma webcam QHD e um preço atraente (US$ 800).
Intel Core i5-1335U, Iris Xe G7 80EUs, 14", 1.3 kgAnálise do Lenovo ThinkPad E16 G1 Intel: O Core i5 está no mesmo nível do AMD Ryzen 7
Se o senhor não estiver animado para gastar milhares de dólares em um ThinkPad X1 Carbon sofisticado, então o ThinkPad E16 G1, mais prático, pode valer a pena. Apenas certifique-se de escolher a opção correta de tela, bateria e CPU.
Intel Core i5-1335U, Iris Xe G7 80EUs, 16", 1.8 kgLenovo ThinkPad X13 Yoga G4 21F20017GE: Intel Iris Xe Graphics G7 80EUs, 13.30", 1.3 kg
ánalise » Análise do laptop Lenovo ThinkPad X13 Yoga G4: Conversível com bateria de longa duração e desempenho fraco
Lenovo ThinkPad T14 G4 21HD0043GE: Intel Iris Xe Graphics G7 80EUs, 14.00", 1.4 kg
ánalise » Análise do laptop Lenovo ThinkPad T14 G4 Intel: Atualização do Raptor Lake para a série T
HP EliteBook 1040 G10 818N7EA: Intel Iris Xe Graphics G7 80EUs, 14.00", 1.3 kg
ánalise » Análise do laptop HP EliteBook 1040 G10 - A resposta da HP ao ThinkPad X1 Carbon
Lenovo IdeaPad Flex 5 14IRU8: Intel Iris Xe Graphics G7 80EUs, 14.00", 1.6 kg
ánalise » Análise do Lenovo IdeaPad Flex 5i 14IRU8: Conversível acessível de 14 polegadas com Thunderbolt 4
Acer Aspire 5 Spin 14: Intel Iris Xe Graphics G7 80EUs, 14.00", 1.6 kg
ánalise » Avaliação do Acer Aspire 5 Spin 14: O laptop 2 em 1 com uma caneta stylus ativa
Samsung Galaxy Book3 15, Core i5-1335U: Intel Iris Xe Graphics G7 80EUs, 15.60", 1.5 kg
ánalise » Análise do Samsung Galaxy Book3: O Intel Core i5-1335U comemora uma estréia sólida
Lenovo Thinkpad E14 G5, i5-1335U: Intel Iris Xe Graphics G7 80EUs, 14.00", 1.5 kg
ánalise externa » Lenovo Thinkpad E14 G5, i5-1335U
MSI Modern 14 F13MG: Intel Iris Xe Graphics G7 80EUs, 14.00", 1.5 kg
ánalise externa » MSI Modern 14 F13MG
Asus Chromebook Plus CX3402CVA : Intel Iris Xe Graphics G7 80EUs, 14.00", 1.5 kg
ánalise externa » Asus Chromebook Plus CX3402CVA
Acer TravelMate P4 TMP414-53-58XQ: Intel Iris Xe Graphics G7 80EUs, 14.00", 1.5 kg
ánalise externa » Acer TravelMate P4 TMP414-53-58XQ
Asus ExpertBook B1 B1503CVA: Intel Iris Xe Graphics G7 80EUs, 15.60", 1.7 kg
ánalise externa » Asus ExpertBook B1 B1503CVA
MSI Modern 15 F13MG: Intel Iris Xe Graphics G7 80EUs, 15.60", 1.7 kg
ánalise externa » MSI Modern 15 F13MG
Dell Latitude 3550: Intel Iris Xe Graphics G7 80EUs, 15.60", 1.8 kg
ánalise externa » Dell Latitude 3550
Acer Swift Go 14 SFG14-71: Intel Iris Xe Graphics G7 80EUs, 14.00", 1.3 kg
ánalise externa » Acer Swift Go 14 SFG14-71
Acer Aspire 5 A514-56M, i5-1335U: Intel Iris Xe Graphics G7 80EUs, 14.00", 1.7 kg
ánalise externa » Acer Aspire 5 A514-56M, i5-1335U
Asus ExpertBook B1 B1502CVA: Intel Iris Xe Graphics G7 80EUs, 15.60", 1.7 kg
ánalise externa » Asus ExpertBook B1 B1502CVA
Acer Swift Go 16 SFG16-71, i5-1335U: Intel Iris Xe Graphics G7 80EUs, 16.00", 1.6 kg
ánalise externa » Acer Swift Go 16 SFG16-71, i5-1335U
Acer Chromebook Plus 515 CB515-2H, i5-1335U: Intel Iris Xe Graphics G7 80EUs, 15.60", 1.7 kg
ánalise externa » Acer Chromebook Plus 515 CB515-2H, i5-1335U
Dell Latitude 13 5340: Intel Iris Xe Graphics G7 80EUs, 13.30", 1.2 kg
ánalise externa » Dell Latitude 13 5340
Acer TravelMate P6 TMP614-53, i5-1335U: Intel Iris Xe Graphics G7 80EUs, 14.00", 1.1 kg
ánalise externa » Acer TravelMate P6 TMP614-53, i5-1335U
Lenovo ThinkBook 16 G6 IRL: Intel Iris Xe Graphics G7 80EUs, 16.00", 1.7 kg
ánalise externa » Lenovo ThinkBook 16 G6 IRL
Lenovo ThinkPad T16 G2, i5-1335U: Intel Iris Xe Graphics G7 80EUs, 16.00", 1.7 kg
ánalise externa » Lenovo ThinkPad T16 G2, i5-1335U
HP 470 G10: Intel Iris Xe Graphics G7 80EUs, 17.30", 2.1 kg
ánalise externa » HP 470 G10
Lenovo ThinkPad L13 G4: Intel Iris Xe Graphics G7 80EUs, 13.30", 1.3 kg
ánalise externa » Lenovo ThinkPad L13 G4
HP Pavilion 15-eg3000ng: Intel Iris Xe Graphics G7 80EUs, 15.60", 1.7 kg
ánalise externa » HP Pavilion 15-eg3000ng
HP EliteBook 640 G10: Intel Iris Xe Graphics G7 80EUs, 14.00", 1.4 kg
ánalise externa » HP EliteBook 640 G10
Acer TravelMate P4 TMP413-51: Intel Iris Xe Graphics G7 80EUs, 13.30", 1.4 kg
ánalise externa » Acer TravelMate P4 TMP413-51
HP Pavilion SE 14-ep0000: Intel Iris Xe Graphics G7 80EUs, 14.00", 2.3 kg
ánalise externa » HP Pavilion SE 14-ep0000
HP 240 G10: Intel Iris Xe Graphics G7 80EUs, 14.00", 1.4 kg
ánalise externa » HP 240 G10
HP EliteBook 650 G10: Intel Iris Xe Graphics G7 80EUs, 15.60", 1.8 kg
ánalise externa » HP EliteBook 650 G10
Acer TravelMate P2 TMP216-51: Intel Iris Xe Graphics G7 80EUs, 16.00", 1.9 kg
ánalise externa » Acer TravelMate P2 TMP216-51
Lenovo IdeaPad Duet 5 12IRU8: Intel Iris Xe Graphics G7 80EUs, 12.40", 0.7 kg
ánalise externa » Lenovo IdeaPad Duet 5 12IRU8
HP 250 G10: Intel Iris Xe Graphics G7 80EUs, 15.60", 1.5 kg
ánalise externa » HP 250 G10
HP Pavilion 15-eg3000: Intel Iris Xe Graphics G7 80EUs, 15.60", 1.7 kg
ánalise externa » HP Pavilion 15-eg3000
HP Spectre x360 14-ef2000: Intel Iris Xe Graphics G7 80EUs, 13.50", 1.4 kg
ánalise externa » HP Spectre x360 14-ef2000
Asus Vivobook 14 X1404VA: Intel Iris Xe Graphics G7 80EUs, 14.00", 1.4 kg
ánalise externa » Asus Vivobook 14 X1404VA
HP Envy Move: Intel Iris Xe Graphics G7 80EUs, 23.80", 4.1 kg
ánalise externa » HP Envy Move
Lenovo ThinkPad E16 G1 Core i5-1335U: Intel Iris Xe Graphics G7 80EUs, 16.00", 1.8 kg
ánalise externa » Lenovo ThinkPad E16 G1 Core i5-1335U
HP 14-ee0000: Intel Iris Xe Graphics G7 80EUs, 14.00", 1.4 kg
ánalise externa » HP 14-ee0000
Lenovo ThinkPad T14 G4 21HD0043GE: Intel Iris Xe Graphics G7 80EUs, 14.00", 1.4 kg
ánalise externa » Lenovo ThinkPad T14 G4 21HD0043GE
Asus Vivobook 17 F1704: Intel Iris Xe Graphics G7 96EUs, 17.30", 2.1 kg
ánalise externa » Asus Vivobook 17 F1704
Dell Vostro 14 3430: Intel Iris Xe Graphics G7 80EUs, 14.00", 1.4 kg
ánalise externa » Dell Vostro 14 3430
Dell Inspiron 15 3530: Intel Iris Xe Graphics G7 80EUs, 15.60", 1.7 kg
ánalise externa » Dell Inspiron 15 3530
Asus VivoBook 16 X1605VA: Intel Iris Xe Graphics G7 80EUs, 16.00", 1.9 kg
ánalise externa » Asus VivoBook 16 X1605VA
Acer Swift Go 14 SFG14-71, i5-1335U: Intel Iris Xe Graphics G7 80EUs, 14.00", 1.3 kg
ánalise externa » Acer Swift Go 14 SFG14-71, i5-1335U
Acer Aspire Vero AV15-53P-59MT: Intel Iris Xe Graphics G7 80EUs, 15.60", 1.7 kg
ánalise externa » Acer Aspire Vero AV15-53P-59MT
Lenovo ThinkPad X13 Yoga G4 21F20017GE: Intel Iris Xe Graphics G7 80EUs, 13.30", 1.3 kg
ánalise externa » Lenovo ThinkPad X13 Yoga G4 21F20017GE
HP Envy x360 15-fe0000: Intel Iris Xe Graphics G7 80EUs, 15.60", 1.8 kg
ánalise externa » HP Envy x360 15-fe0000
Dell Inspiron 16 7630 2-in-1: Intel Iris Xe Graphics G7 80EUs, 16.00", 2.1 kg
ánalise externa » Dell Inspiron 16 7630 2-in-1
Acer Chromebook Spin 714 CP714-2WN: Intel Iris Xe Graphics G7 80EUs, 14.00", 1.4 kg
ánalise externa » Acer Chromebook Spin 714 CP714-2WN
HP 15s-fd0082ns: Intel Iris Xe Graphics G7 80EUs, 15.60", 1.6 kg
ánalise externa » HP 15s-fd0082ns
HP ProBook 440 G10: Intel Iris Xe Graphics G7 80EUs, 14.00", 1.4 kg
ánalise externa » HP ProBook 440 G10
HP ProBook 450 G10: Intel Iris Xe Graphics G7 80EUs, 15.60", 1.8 kg
ánalise externa » HP ProBook 450 G10
Lenovo ThinkBook 14s Yoga IRU G3: Intel Iris Xe Graphics G7 80EUs, 14.00", 1.5 kg
ánalise externa » Lenovo ThinkBook 14s Yoga IRU G3
Asus Vivobook 15 X1504VA: Intel Iris Xe Graphics G7 80EUs, 15.60", 1.7 kg
ánalise externa » Asus Vivobook 15 X1504VA
Samsung Galaxy Book3 15, Core i5-1335U: Intel Iris Xe Graphics G7 80EUs, 15.60", 1.5 kg
ánalise externa » Samsung Galaxy Book3 15, Core i5-1335U
MSI Modern 14 C13M: Intel Iris Xe Graphics G7 80EUs, 14.00", 1.4 kg
ánalise externa » MSI Modern 14 C13M
Asus ZenBook S13 OLED UX5304, i5-1335U: Intel Iris Xe Graphics G7 80EUs, 13.30", 1.1 kg
ánalise externa » Asus ZenBook S13 OLED UX5304, i5-1335U
Acer Aspire 5 Spin 14: Intel Iris Xe Graphics G7 80EUs, 14.00", 1.6 kg
ánalise externa » Acer Aspire 5 Spin 14
Dell Inspiron 14 5430: Intel Iris Xe Graphics G7 80EUs, 14.00", 1.7 kg
ánalise externa » Dell Inspiron 14 5430
Lenovo IdeaPad Flex 5 14IRU8: Intel Iris Xe Graphics G7 80EUs, 14.00", 1.6 kg
ánalise externa » Lenovo IdeaPad Flex 5 14IRU8
HP Pavilion x360 14-ek1000: Intel Iris Xe Graphics G7 80EUs, 14.00", 1.5 kg
ánalise externa » HP Pavilion x360 14-ek1000
Acer Aspire 5 A515-58: Intel Iris Xe Graphics G7 80EUs, 15.60", 1.8 kg
ánalise externa » Acer Aspire 5 A515-58