O AMD Ryzen 7 7840U é um processador rápido para laptop de ponta da série Phoenix e o modelo mais rápido da série U. Ele oferece 8 núcleos (octa core) com base na arquitetura Zen 4 que suporta hyperthreading (16 threads). Os núcleos têm clock de 3,3 (base) a 5,1 GHz (aumento de um único núcleo). O processador inclui 8 MB de cache L2 e 16 MB de cache L3.
O desempenho do R7 7840U é, dependendo da carga de trabalho, apenas ligeiramente inferior ao do Ryzen 7 7840HS (velocidade de clock base e TDP mais altos). Em comparação com a geração anterior, o Ryzen 7 PRO 6850U da geração anterior, o 7840U é claramente mais rápido graças à arquitetura Zen 4 e às velocidades de clock mais altas.
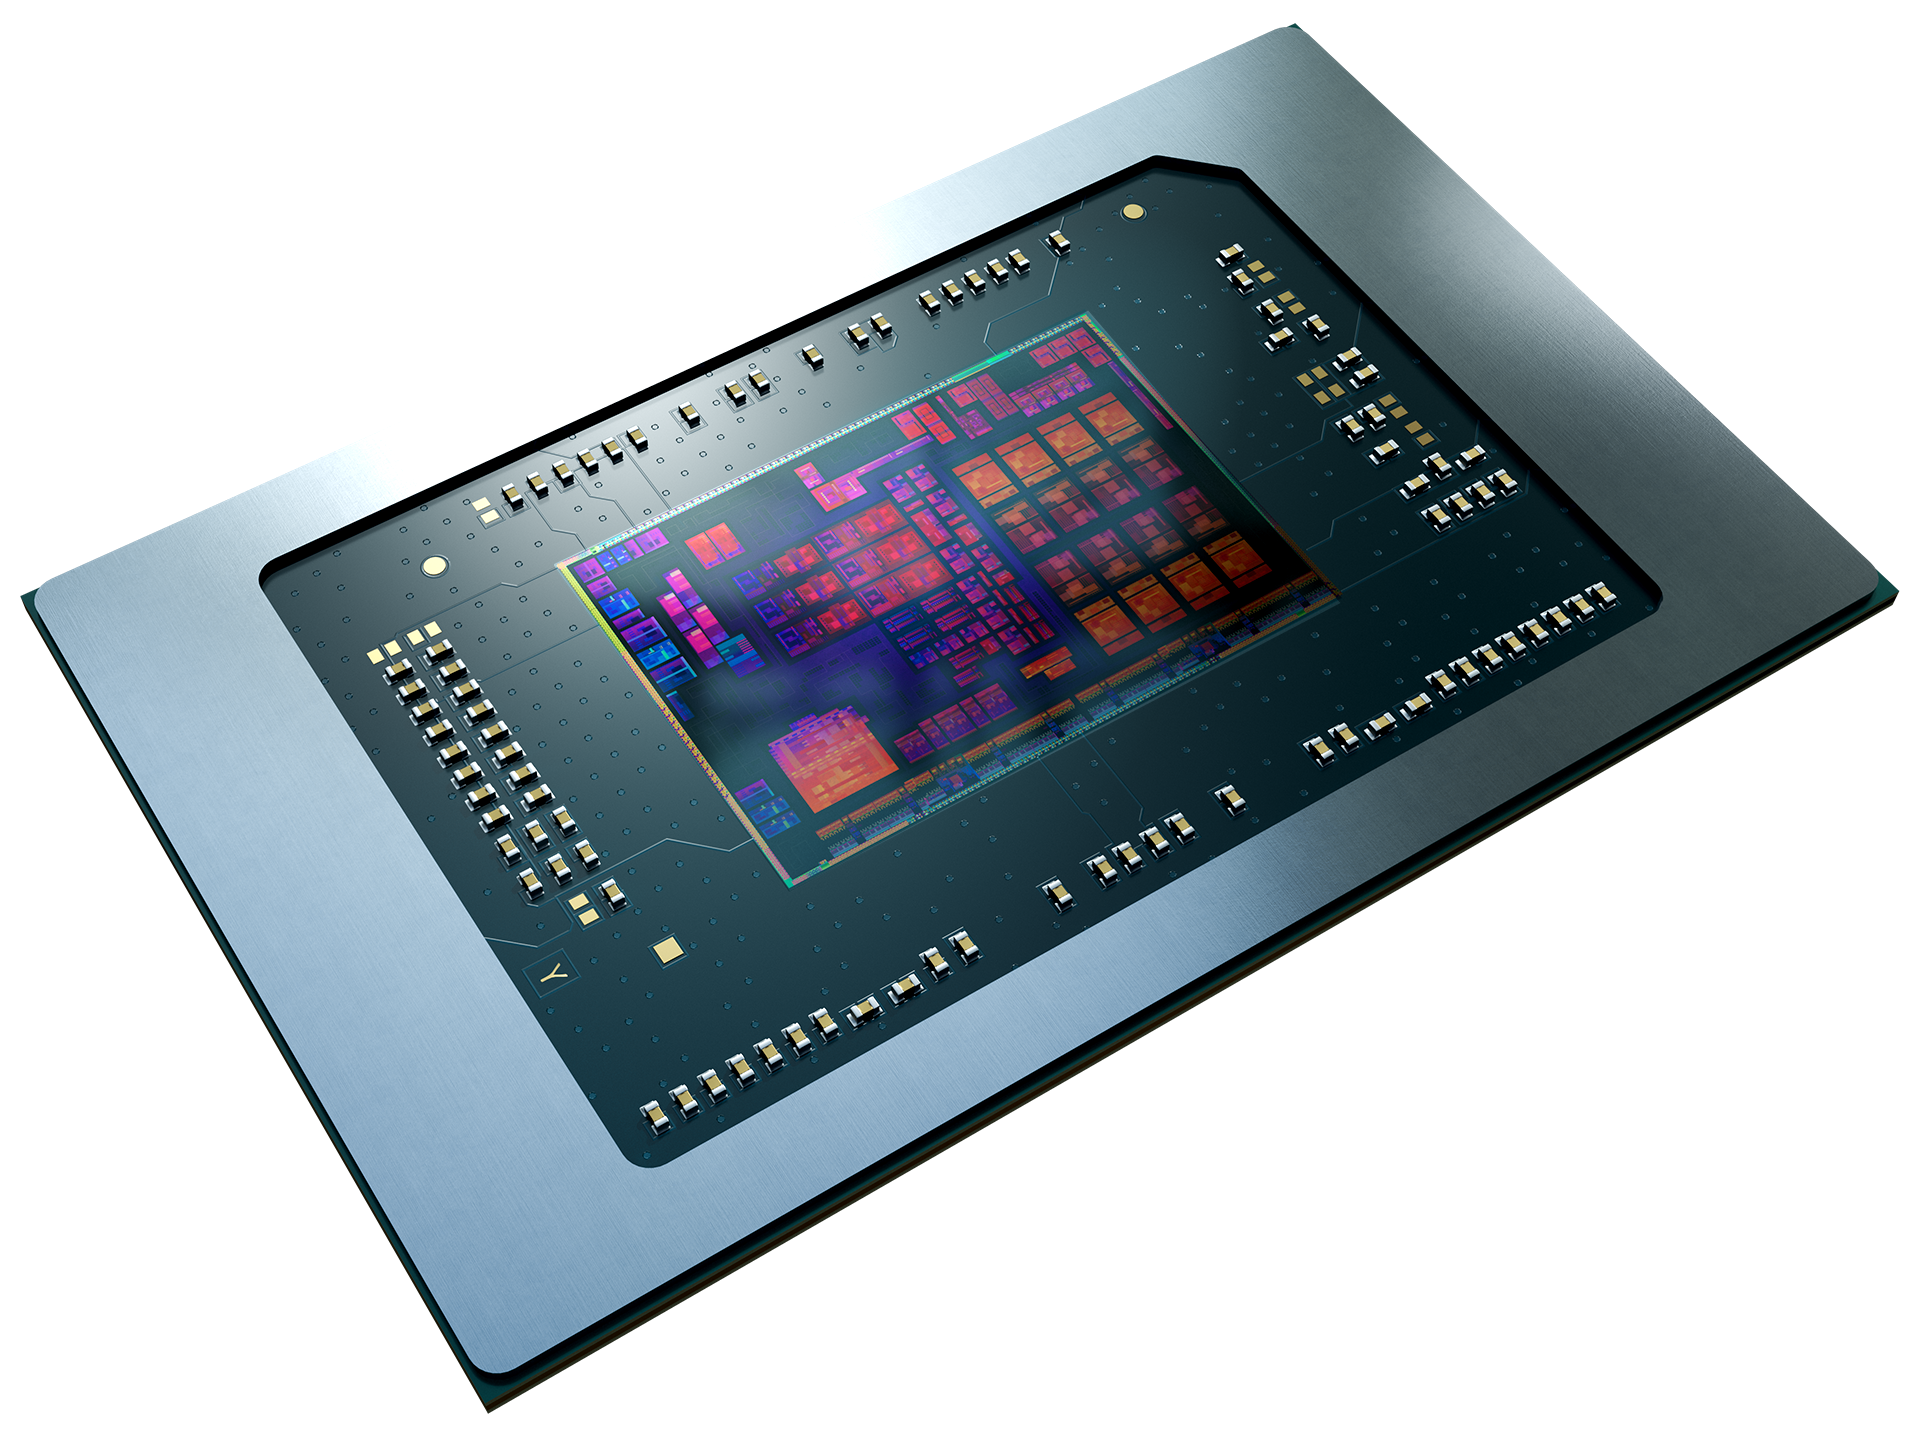
A série Phoenix usa um design monolítico único (diferente do design de chiplet da série 7045HX) e é fabricada no moderno processo de 4 nm da TSMC. O TDP pode ser configurado entre 15 e 30 watts (padrão de 28 watts).
Codinome Phoenix-U (Zen 4) Série AMD Phoenix (Zen 4) Serie: Phoenix (Zen 4) Phoenix-U (Zen 4) AMD Ryzen 7 7840U « 3.3 - 5.1 GHz 8 / 16 16 MB L3 AMD Ryzen 5 7640U 3.5 - 4.9 GHz 6 / 12 16 MB L3
Frequência 3300 - 5100 MHz Cache de Nível 1 512 KB Cache de Nível 2 8 MB Cache de Nível 3 16 MB Número de Núcelos / Subprocessos 8 / 16 Consumo de Energia (TDP = Thermal Design Power) 28 Watt Tecnologia de Produção 4 nm Tamanho da Matriz 178 mm2 Tempratura Máx. 100 °C Conector FP7/FP7r2/FP8 Características DDR5-5600/LPDDR5x-7500 RAM, PCIe 4, Ryzen AI, AES, AVX, AVX2, AVX512, FMA3, MMX (+), SHA, SSE, SSE2, SSE3, SSE4.1, SSE4.2, SSE4A, SSSE3 GPU AMD Radeon 780M ( - 2700 MHz)NPU / AI 10 TOPS INT8 Chip AI 32 TOPS INT8 64 Bit Suporte para 64 Bit Architecture x86 Data do Anúncio 05/03/2023 Link do Produto (externo) www.amd.com
Performance Rating - CB R15 + R20 + 7-Zip + X265 + Blender + 3DM11 CPU
Cinebench 2026 - Cinebench 2026 CPU Single Thread
...
Intel Core Ultra 5 115U
Apple M1
...
Apple M5 Pro 18-Core
Cinebench 2026 - Cinebench 2026 CPU Multi
...
Apple M5 10-Core
...
Apple M5 Pro 18-Core
max:
Cinebench 2024 - Cinebench 2024 CPU Single Core
min: 81 média: 92.3 mediano: 94 (11%) max: 100.1 Points
CPU TDP ? TDP 24 W TDP 28 W TDP 30 W 81% 97% 91% 100%
...
Intel Core Ultra 5 115U
...
Apple M5 Pro 18-Core
Cinebench 2024 - Cinebench 2024 CPU Multi Core
min: 609 média: 719 mediano: 749 (14%) max: 768 Points
CPU TDP ? TDP 24 W TDP 28 W TDP 30 W 95% 79% 100% 100%
...
...
Apple M5 Pro 18-Core
max:
Cinebench R23 - Cinebench R23 Multi Core
min: 11739 média: 12884 mediano: 12719 (12%) max: 15074 Points
CPU TDP ? TDP 18 W TDP 24 W TDP 25 W TDP 28 W TDP 30 W TDP 32 W TDP 35 W 91% 80% 78% 80% 100% 88% 87% 93%
...
...
AMD Ryzen 9 9955HX3D
max:
Cinebench R23 - Cinebench R23 Single Core
min: 1373 média: 1646 mediano: 1677.5 (68%) max: 1742 Points
CPU TDP ? TDP 18 W TDP 24 W TDP 25 W TDP 28 W TDP 30 W TDP 32 W TDP 35 W 79% 99% 100% 95% 92% 99% 98% 95%
...
Intel Core i5-1245U
...
Apple M5 10-Core
Cinebench R20 - Cinebench R20 CPU (Single Core)
min: 533 média: 644 mediano: 661.5 (71%) max: 678 Points
CPU TDP ? TDP 18 W TDP 24 W TDP 25 W TDP 28 W TDP 30 W TDP 32 W TDP 35 W 79% 99% 100% 95% 92% 100% 100% 96%
...
Intel Core i5-1245U
...
max:
Cinebench R20 - Cinebench R20 CPU (Multi Core)
min: 4469 média: 5039 mediano: 4967.5 (12%) max: 5917 Points
CPU TDP ? TDP 18 W TDP 24 W TDP 25 W TDP 28 W TDP 30 W TDP 32 W TDP 35 W 91% 80% 78% 79% 100% 87% 86% 92%
...
...
AMD Ryzen 9 9955HX3D
max:
Cinebench R15 - Cinebench R15 CPU Multi 64 Bit
min: 1024.7 média: 1946 mediano: 1990 (13%) max: 2439 Points
CPU TDP ? TDP 18 W TDP 24 W TDP 25 W TDP 28 W TDP 30 W TDP 32 W TDP 35 W 65% 81% 79% 80% 100% 86% 87% 90%
...
...
AMD Ryzen 9 9955HX3D
max:
0 50 100 150 200 250 300 350 400 450 500 550 600 650 700 750 800 850 900 950 1000 1050 1100 1150 1200 1250 1300 1350 1400 1450 1500 1550 1600 1650 1700 1750 1800 1850 1900 1950 2000 2050 2100 2150 2200 2250 2300 2350 2400 Tooltip Lenovo ThinkPad T14s G4-21F8002TGE Power Saver: Ø1016 (1007.91-1027.09)
Lenovo ThinkPad T14s G4-21F8002TGE Balanced: Ø1509 (1362.63-1658.72)
Ayaneo Air 1S Retro Power : Ø1855 (1830.91-1873.89)
Lenovo ThinkPad T14s G4-21F8002TGE High Performance: Ø1811 (1798.56-1931.99)
HP Pavilion Plus 14-ey0095cl: Ø1746 (1507.22-1962.23)
Acer Swift Edge SFE16 Ryzen 7 7840U: Ø1628 (1515.15-1985.51)
HP EliteBook 845 G10 5Z4X0ES: Ø1925 (1898.97-1993.92)
Minisforum Mercury Series EM780: Ø1896 (1886.17-1902.5)
ONEXPLAYER 2 Pro AR18: Ø2092 (2081.49-2100.51)
Lenovo ThinkPad T16 G2 21K70035GE: Ø2040 (2010.86-2119.65)
Framework Laptop 13.5 Ryzen 7 7840U: Ø2158 (2124.16-2204.83)
Ayaneo Kun: Ø2405 (2346.87-2439.02)
Cinebench R15 - Cinebench R15 CPU Single 64 Bit
min: 217 média: 256.3 mediano: 264 (72%) max: 272 Points
CPU TDP ? TDP 18 W TDP 24 W TDP 25 W TDP 28 W TDP 30 W TDP 32 W TDP 35 W 80% 99% 100% 96% 90% 97% 98% 92%
...
...
max:
Intel Core Ultra 9 285K
Cinebench R11.5 - Cinebench R11.5 CPU Multi 64 Bit
min: 20.46 média: 22.6 mediano: 22.6 (28%) max: 24.8 Points
CPU TDP ? TDP 25 W 100% 83%
Cinebench R11.5 - Cinebench R11.5 CPU Single 64 Bit
min: 2.6 média: 2.8 mediano: 2.8 (66%) max: 2.97 Points
CPU TDP ? TDP 25 W 88% 100%
...
...
max:
Intel Core Ultra 9 285K
Cinebench R10 - Cinebench R10 Rend. Single (32bit)
min: 5996 média: 6669 mediano: 6669 (40%) max: 7342 pontos
CPU TDP ? TDP 25 W 82% 100%
AMD Geode LX 800
...
Intel Core i5-8400H
Intel Core i7-8809G
Intel Core i5-1038NG7
Intel Core i7-8850H
Intel Core i5-1035G4
Intel Core i5-1035G1
Intel Core i7-9750H
...
max:
Cinebench R10 - Cinebench R10 Rend. Multi (32bit)
min: 36812 média: 38490 mediano: 38489.5 (28%) max: 40167 pontos
CPU TDP ? TDP 25 W 100% 92%
...
Intel Core i5-1245U
Intel Core i7-1265U
...
max:
Cinebench R10 - Cinebench R10 Rend. Multi (64bit)
min: 59874 média: 63534 mediano: 63533.5 (38%) max: 67193 Points
CPU TDP ? TDP 25 W 100% 89%
...
Intel Core i7-1265U
AMD Ryzen 7 7735H
Intel Core i5-1245U
...
Cinebench R10 - Cinebench R10 Rend. Single (64bit)
min: 11172 média: 12089 mediano: 12089 (15%) max: 13006 Points
CPU TDP ? TDP 25 W 86% 100%
...
Intel Core i5-1230U
AMD Ryzen 7 7735H
Intel Core Ultra 5 115U
...
max:
wPrime 2.10 - wPrime 2.0 1024m *
...
AMD Ryzen 9 9955HX
...
VIA C3-M C3-M-1200
wPrime 2.10 - wPrime 2.0 32m *
wPrime 1.55 - wPrime 1.55 1024m *
...
Intel Core i7-8650U
Intel Core i5-7200U
Intel Core i5-7Y54
AMD A6-7310
Intel Core i5-7Y57
...
Intel Celeron M 373
wPrime 1.55 - wPrime 1.55 32m *
...
Intel Core i7-8650U
Intel Core i5-7200U
Intel Core i5-7Y54
AMD A6-7310
AMD Phenom II X3 N850
AMD Phenom II X2 X640 BE
...
Intel Pentium M 713
WinRAR - WinRAR 4.0
min: 5629 média: 5723 mediano: 5723 (9%) max: 5817 pontos
CPU TDP ? TDP 25 W 100% 97%
...
Intel Core i7-8850H
Intel Core i7-1265U
...
max:
7-Zip 18.03 - 7-Zip 18.03 Multi Thread 4 runs
min: 50087 média: 55687 mediano: 55145 (32%) max: 62156 MIPS
CPU TDP ? TDP 18 W TDP 24 W TDP 25 W TDP 28 W TDP 30 W TDP 32 W TDP 35 W 81% 87% 86% 87% 100% 91% 91% 100%
...
...
AMD Ryzen 9 9955HX3D
max:
7-Zip 18.03 - 7-Zip 18.03 Single Thread 4 runs
min: 4657 média: 5816 mediano: 5952 (68%) max: 6408 MIPS
CPU TDP ? TDP 18 W TDP 24 W TDP 25 W TDP 28 W TDP 30 W TDP 32 W TDP 35 W 73% 94% 95% 93% 86% 89% 93% 100%
...
...
max:
AMD Ryzen 7 9850X3D
X264 HD Benchmark 4.0 - x264 Pass 2
min: 105.52 média: 108.8 mediano: 108.8 (3%) max: 112.1 fps
CPU TDP ? TDP 25 W 100% 94%
X264 HD Benchmark 4.0 - x264 Pass 1
min: 232 média: 237.3 mediano: 237.3 (6%) max: 242.64 fps
CPU TDP ? TDP 25 W 96% 100%
...
Intel Core i5-11500B
...
HWBOT x265 Benchmark v2.2 - HWBOT x265 4k Preset
min: 14.4 média: 15.7 mediano: 15.2 (27%) max: 18.6 fps
CPU TDP ? TDP 18 W TDP 24 W TDP 25 W TDP 28 W TDP 30 W TDP 32 W TDP 35 W 78% 83% 77% 80% 100% 85% 88% 94%
...
...
AMD Ryzen 9 9955HX3D
max:
0 5 10 15 20 Tooltip Lenovo ThinkPad T14s G4-21F8002TGE: Ø14.3 (0.47-17.7)
Ayaneo Air 1S Retro Power : Ø14.3 (0.52-17.3)
Minisforum Mercury Series EM780: Ø14.2 (0.43-16.4)
HP EliteBook 845 G10 5Z4X0ES: Ø14.5 (0.4-17.3)
HP Pavilion Plus 14-ey0095cl: Ø15.5 (1.02-23.8)
Acer Swift Edge SFE16 Ryzen 7 7840U: Ø15.2 (0.49-18.8)
ONEXPLAYER 2 Pro AR18: Ø14.8 (0.3-15.8)
Lenovo ThinkPad T16 G2 21K70035GE: Ø16.4 (0.63-20.8)
Framework Laptop 13.5 Ryzen 7 7840U: Ø17.1 (0.49-20.3)
Ayaneo Kun: Ø18.4 (0.76-23.5)
TrueCrypt - TrueCrypt Serpent
min: 0.953 média: 1 mediano: 1 (29%) max: 1 GB/s
CPU TDP ? TDP 25 W 100% 95%
...
Intel Core i7-1265U
...
AMD Ryzen 9 9955HX3D
max:
TrueCrypt - TrueCrypt Twofish
min: 1.5 média: 1.6 mediano: 1.6 (27%) max: 1.6 GB/s
CPU TDP ? TDP 25 W 100% 94%
...
Intel Core i5-1245U
AMD Ryzen 7 7735H
Intel Core i7-1265U
...
AMD Ryzen 9 9955HX
max:
TrueCrypt - TrueCrypt AES
min: 6.1 média: 8.5 mediano: 8.5 (22%) max: 10.8 GB/s
CPU TDP ? TDP 25 W 100% 56%
...
Intel Core i5-11500B
...
max:
Blender - Blender 3.3 Classroom CPU *
min: 332 média: 418.5 mediano: 421 (5%) max: 503 Seconds
CPU TDP ? TDP 18 W TDP 24 W TDP 25 W TDP 28 W TDP 30 W TDP 32 W TDP 35 W 100% 100% 100% 100% 101% 101% 101% 101%
AMD Ryzen 9 9955HX3D
...
...
Blender - Blender 2.79 BMW27 CPU *
min: 208 média: 250.7 mediano: 259.5 (2%) max: 270 Seconds
CPU TDP ? TDP 18 W TDP 24 W TDP 25 W TDP 28 W TDP 30 W TDP 32 W TDP 35 W 100% 100% 100% 100% 100% 100% 100% 100%
Intel Core i5-1038NG7
...
...
R Benchmark 2.5 - R Benchmark 2.5 *
min: 0.4559 média: 0.5 mediano: 0.5 (10%) max: 0.581 sec
CPU TDP ? TDP 18 W TDP 24 W TDP 25 W TDP 28 W TDP 30 W TDP 32 W TDP 35 W 100% 103% 103% 103% 102% 103% 103% 103%
AMD Ryzen 9 9955HX3D
...
...
3DMark 06 - CPU - 3DMark 06 - CPU
min: 12402 média: 12635 mediano: 12482 (21%) max: 13021 Points
VIA C7-M C7-M-1200
...
Intel Core i5-11500B
AMD Ryzen 7 7735H
...
max:
Super Pi mod 1.5 XS 1M - Super Pi mod 1.5 XS 1M *
min: 7.238 média: 8.3 mediano: 8.3 (2%) max: 9.397 s
CPU TDP ? TDP 25 W 100% 100%
...
Intel Core i5-1140G7
Intel Core i7-8559U
Intel Core i5-1245U
...
VIA C3-M C3-M-1200
Super Pi mod 1.5 XS 2M - Super Pi mod 1.5 XS 2M *
min: 18.168 média: 20.9 mediano: 20.9 (1%) max: 23.633 s
CPU TDP ? TDP 25 W 100% 100%
...
Intel Core i5-1035G4
Intel Core i7-8706G
Intel Core i7-8705G
Intel Core i3-1110G4
...
Super Pi Mod 1.5 XS 32M - Super Pi mod 1.5 XS 32M *
min: 626.26 média: 706 mediano: 705.7 (3%) max: 785.226 s
CPU TDP ? TDP 25 W 100% 101%
...
Intel Core i5-5300U
...
VIA C3-M C3-M-1200
3DMark Vantage - 3DM Vant. Perf. CPU no Physx
min: 60726 média: 63048 mediano: 63563 (47%) max: 64340 Points
3DMark 11 - 3DM11 Performance Physics
min: 12375 média: 16776 mediano: 16474 (41%) max: 19923 Points
AMD E-240
...
...
AMD Ryzen 9 9955HX3D
max:
AMD Ryzen 9 9950X3D
3DMark - 3DMark Ice Storm Physics
min: 64410 média: 71391 mediano: 72497 (59%) max: 76886 Points
...
Intel Core Ultra 5 115U
Intel Core i5-11500B
...
max:
3DMark - 3DMark Ice Storm Extreme Physics
min: 64515 média: 70689 mediano: 72428 (59%) max: 75123 Points
...
Intel Core i5-1245U
Intel Core i5-11500B
...
max:
3DMark - 3DMark Ice Storm Unlimited Physics
min: 65423 média: 72363 mediano: 74802 (60%) max: 76863 Points
...
Intel Core i5-11500B
Intel Core i5-1245U
...
max:
Intel Core Ultra 5 250K Plus
3DMark - 3DMark Cloud Gate Physics
min: 9655 média: 15204 mediano: 16264 (41%) max: 17714 Points
3DMark - 3DMark Fire Strike Standard Physics
min: 17823 média: 21641 mediano: 21584 (38%) max: 25050 Points
3DMark - 3DMark Time Spy CPU
min: 6548 média: 8155 mediano: 8138.5 (34%) max: 9501 Points
CPU TDP ? TDP 18 W TDP 24 W TDP 25 W TDP 28 W TDP 30 W TDP 32 W TDP 35 W 83% 69% 84% 85% 87% 90% 87% 100%
AMD PRO A12-9800B
...
AMD Ryzen 7 7735H
...
max:
Geekbench 6.7 - Geekbench 6.7.1 Single-Core
min: 1982 média: 2367 mediano: 2394 (55%) max: 2562 pontos
CPU TDP ? TDP 18 W TDP 24 W TDP 25 W TDP 28 W TDP 30 W TDP 32 W TDP 35 W 77% 100% 94% 94% 86% 88% 98% 100%
...
Apple M1
Intel Core i5-12600H
Intel Core i7-1265U
...
Apple M5 Pro 15-Core
Geekbench 6.7 - Geekbench 6.7.1 Multi-Core
min: 7310 média: 9791 mediano: 10584 (36%) max: 11489 pontos
CPU TDP ? TDP 18 W TDP 24 W TDP 25 W TDP 28 W TDP 30 W TDP 32 W TDP 35 W 83% 94% 95% 83% 68% 65% 99% 100%
...
AMD Ryzen 7 7435HS
...
Apple M5 Max
Geekbench 6.0 - Geekbench 6.0 Single-Core
min: 1925 média: 2150 mediano: 2149.5 (67%) max: 2374 pontos
CPU TDP ? TDP 24 W 81% 100%
...
Intel Core i5-11500B
...
max:
Geekbench 6.0 - Geekbench 6.0 Multi-Core
min: 9176 média: 9796 mediano: 9796 (40%) max: 10416 pontos
CPU TDP ? TDP 24 W 88% 100%
Geekbench 5.5 - Geekbench 5.1 - 5.5 64 Bit Single-Core
min: 1355 média: 1705 mediano: 1738 (58%) max: 1933 pontos
CPU TDP ? TDP 18 W TDP 24 W TDP 25 W TDP 28 W TDP 30 W TDP 32 W TDP 35 W 76% 100% 92% 90% 70% 84% 91% 99%
...
Intel Core i7-1265U
Intel Core i5-1245U
Apple M1
...
Apple M5 10-Core
Geekbench 5.5 - Geekbench 5.1 - 5.5 64 Bit Multi-Core
min: 7399 média: 9113 mediano: 9382 (17%) max: 10558 pontos
CPU TDP ? TDP 18 W TDP 24 W TDP 25 W TDP 28 W TDP 30 W TDP 32 W TDP 35 W 83% 90% 91% 84% 79% 73% 95% 100%
...
Apple M2
Intel Xeon W-2145
...
max:
Geekbench 5.0 - Geekbench 5.0 64 Bit Single-Core
min: 1411 média: 1488 mediano: 1487.5 (6%) max: 1564 pontos
CPU TDP ? TDP 25 W 90% 100%
...
Intel Core Ultra 5 115U
Intel Core i5-1230U
AMD Ryzen 7 7735H
...
max:
AMD Ryzen 7 9850X3D
Geekbench 5.0 - Geekbench 5.0 64 Bit Multi-Core
min: 8055 média: 8417 mediano: 8417 (27%) max: 8779 pontos
CPU TDP ? TDP 25 W 100% 92%
...
Intel Core i7-1265U
AMD Ryzen 7 7735H
Intel Core i5-1245U
...
max:
AMD Ryzen Threadripper PRO 3995WX
Geekbench 4.4 - Geekbench 4.1 - 4.4 64 Bit Single-Core
CPU TDP ? TDP 25 W 100% 100%
...
Intel Core i5-1140G7
Intel Core i7-1180G7
Intel Core Ultra 5 115U
...
max:
Samsung Exynos 2600
Geekbench 4.4 - Geekbench 4.1 - 4.4 64 Bit Multi-Core
min: 30359 média: 32401 mediano: 32400.5 (31%) max: 34442 pontos
CPU TDP ? TDP 25 W 100% 88%
...
Intel Core i5-1245U
Intel Core i7-1265U
...
max:
Mozilla Kraken 1.1 - Kraken 1.1 Total Score *
min: 509 média: 567 mediano: 550 (1%) max: 746 ms
CPU TDP ? TDP 18 W TDP 24 W TDP 25 W TDP 28 W TDP 30 W TDP 32 W TDP 35 W 100% 100% 100% 100% 100% 100% 100% 100%
Apple M5 Pro 18-Core
...
Intel Core i7-1265U
Intel Core i5-1245U
...
max:
Octane V2 - Octane V2 Total Score
min: 81820 média: 82676 mediano: 82676 (54%) max: 83532 Points
CPU TDP 24 W TDP 25 W 100% 98%
unknown
...
...
Apple M5 Pro 18-Core
WebXPRT 4 - WebXPRT 4 Score
min: 179.4 média: 216.6 mediano: 208 (52%) max: 256 Points
CPU TDP ? TDP 18 W TDP 24 W TDP 25 W TDP 28 W TDP 32 W TDP 35 W 78% 98% 81% 86% 70% 76% 100%
...
Intel Core i5-1240U
Intel Core Ultra 5 115U
AMD Ryzen 7 7735H
...
Apple M5 Pro 18-Core
WebXPRT 3 - WebXPRT 3 Score
min: 188.4 média: 262.1 mediano: 262 (44%) max: 322 Points
CPU TDP ? TDP 18 W TDP 24 W TDP 25 W TDP 28 W TDP 30 W TDP 32 W TDP 35 W 80% 95% 82% 86% 65% 71% 81% 100%
...
Intel Core i5-1240U
Apple M1
...
Apple M5 Pro 18-Core
CrossMark - CrossMark Overall
min: 1256 média: 1498 mediano: 1533.5 (54%) max: 1804 Points
CPU TDP ? TDP 18 W TDP 24 W TDP 25 W TDP 28 W TDP 30 W TDP 32 W TDP 35 W 73% 100% 86% 80% 76% 74% 89% 93%
...
Apple M2
...
Apple M5 Max
Power Consumption - Prime95 Power Consumption - external Monitor *
min: 33.1 média: 45.7 mediano: 47.2 (8%) max: 54.7 Watt
CPU TDP ? TDP 18 W TDP 24 W TDP 25 W TDP 28 W TDP 30 W TDP 35 W 101% 102% 104% 103% 100% 101% 100%
...
...
AMD Ryzen 9 9955HX3D
max:
AMD Ryzen Threadripper PRO 3975WX
0 5 10 15 20 25 30 35 40 45 50 55 Tooltip HP EliteBook 845 G10 5Z4X0ES: Ø33.1 (32.5-39.5)
Lenovo ThinkPad T14s G4-21F8002TGE: Ø34.3 (33.2-42.1)
Acer Swift Edge SFE16 Ryzen 7 7840U: Ø42.9 (37.7-50.3)
HP Pavilion Plus 14-ey0095cl: Ø43.6 (42.1-50.6)
ONEXPLAYER 2 Pro AR18: Ø50.8 (49.2-52.6)
Minisforum Mercury Series EM780: Ø51.6 (48.5-55)
Ayaneo Kun: Ø54.3 (46.8-58.6)
Framework Laptop 13.5 Ryzen 7 7840U: Ø54.7 (54.3-55)
Power Consumption - Cinebench R15 Multi Power Consumption - external Monitor *
min: 36.2 média: 42.6 mediano: 41.4 (8%) max: 50.4 Watt
CPU TDP ? TDP 18 W TDP 24 W TDP 25 W TDP 35 W 100% 103% 102% 102% 100%
Intel Celeron N4100
...
Intel Core i7-1160G7
Intel Core i5-1035G4
Intel Core i7-5557U
Intel Core i7-1180G7
Intel Core i5-8260U
...
AMD Ryzen 9 9955HX3D
max:
0 5 10 15 20 25 30 35 40 45 50 Tooltip HP EliteBook 845 G10 5Z4X0ES: Ø36.2 (33.2-40.1)
Acer Swift Edge SFE16 Ryzen 7 7840U: Ø37.7 (36.3-39.4)
Lenovo ThinkPad T14s G4-21F8002TGE: Ø40.4 (34.7-42.8)
HP Pavilion Plus 14-ey0095cl: Ø42.3 (39-46.4)
Minisforum Mercury Series EM780: Ø48.7 (45.9-49.7)
Framework Laptop 13.5 Ryzen 7 7840U: Ø50.4 (40.1-54.8)
Power Consumption - Idle Power Consumption - external Monitor *
min: 3.38 média: 8.6 mediano: 7.8 (5%) max: 14.9 Watt
CPU TDP ? TDP 18 W TDP 24 W TDP 25 W TDP 28 W TDP 30 W TDP 32 W TDP 35 W 103% 106% 108% 105% 102% 100% 105% 108%
...
AMD Ryzen 7 7735H
...
max:
0 5 10 15 20 25 30 35 Tooltip HP EliteBook 845 G10 5Z4X0ES: Ø3.38 (2.94-4.6)
Framework Laptop 13.5 Ryzen 7 7840U: Ø4.05 (3.56-6.57)
Lenovo ThinkPad T14s G4-21F8002TGE: Ø4.19 (3.95-5.14)
HP Pavilion Plus 14-ey0095cl: Ø6.42 (5.44-8.23)
Acer Swift Edge SFE16 Ryzen 7 7840U: Ø7.18 (6.63-8.66)
Lenovo ThinkPad T16 G2 21K70035GE: Ø8.35 (8.13-9.43)
Minisforum Mercury Series EM780: Ø10.9 (10.2-11.6)
Ayaneo Kun: Ø12.1 (10.8-15.9)
Ayaneo Air 1S Retro Power : Ø14.8 (12.2-37.5)
ONEXPLAYER 2 Pro AR18: Ø14.9 (13.8-19.5)
Power Consumption - Idle Power Consumption 150cd 1min *
min: 3.99 média: 7.7 mediano: 6.2 (5%) max: 15.1 Watt
CPU TDP 18 W TDP 24 W TDP 25 W TDP 28 W TDP 30 W TDP 32 W TDP 35 W 106% 109% 107% 103% 100% 107% 108%
...
Apple M5 Pro 18-Core
Intel Core i5-1240U
...
max:
0 1 2 3 4 5 6 7 8 9 10 11 12 13 14 15 16 17 18 19 Tooltip Lenovo ThinkPad T14s G4-21F8002TGE: Ø3.99 (3.73-4.99)
HP EliteBook 845 G10 5Z4X0ES: Ø4.13 (3.75-5.08)
Framework Laptop 13.5 Ryzen 7 7840U: Ø4.74 (4.28-8.77)
Lenovo ThinkPad T16 G2 21K70035GE: Ø5.94 (5.62-7.48)
HP Pavilion Plus 14-ey0095cl: Ø6.24 (5.2-11.2)
Acer Swift Edge SFE16 Ryzen 7 7840U: Ø7.63 (7.15-10.3)
Ayaneo Air 1S Retro Power : Ø9.25 (8.51-10.2)
Ayaneo Kun: Ø12 (11-16.5)
ONEXPLAYER 2 Pro AR18: Ø15.1 (13.9-19.4)
Power Consumption - Power Efficiency - Cinebench R15 Multi external Monitor
min: 42.1 média: 48 mediano: 47.1 (35%) max: 55.1 Points per Watt
CPU TDP ? TDP 18 W TDP 24 W TDP 25 W TDP 35 W 80% 100% 91% 96% 83%
- Gama de valores benchmark para essa solução gráfica
- Média de valores benchmark para essa solução gráfica
* Números menores significam um desempenho maior
log 28. 04:25:25
#0 ran 0s before starting gpusingle class +0s ... 0s
#1 no ids found in url (should be separated by "_") +0s ... 0s
#2 not redirecting to Ajax server +0s ... 0s
#3 did not recreate cache, as it is less than 5 days old! Created at Mon, 27 Jul 2026 10:46:59 +0200 +0.006s ... 0.006s
#4 no comparison url found in template nbc.compare_page_2 needed +0.017s ... 0.023s
#5 composed specs +0.001s ... 0.023s
#6 did output specs +0s ... 0.023s
#7 getting avg benchmarks for device 15023 +0.049s ... 0.072s
#8 got single benchmarks 15023 +0.032s ... 0.104s
#9 got avg benchmarks for devices +0s ... 0.104s
#10 min, max, avg, median took s +3.614s ... 3.717s
#11 no comparison url found in template nbc.compare_page_2 needed +0.481s ... 4.199s
#12 return log +0s ... 4.199s