Análise do Lenovo Legion Pro 7 16 (2024): A nata da cultura entre os notebooks RTX 4080
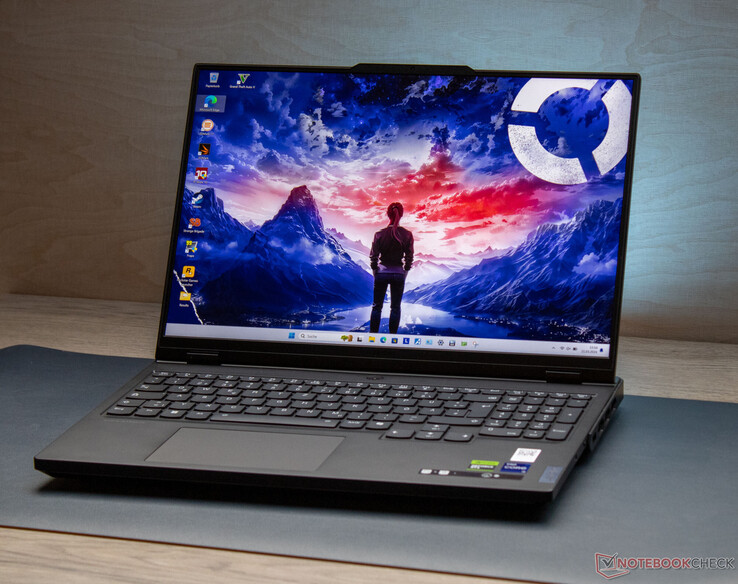
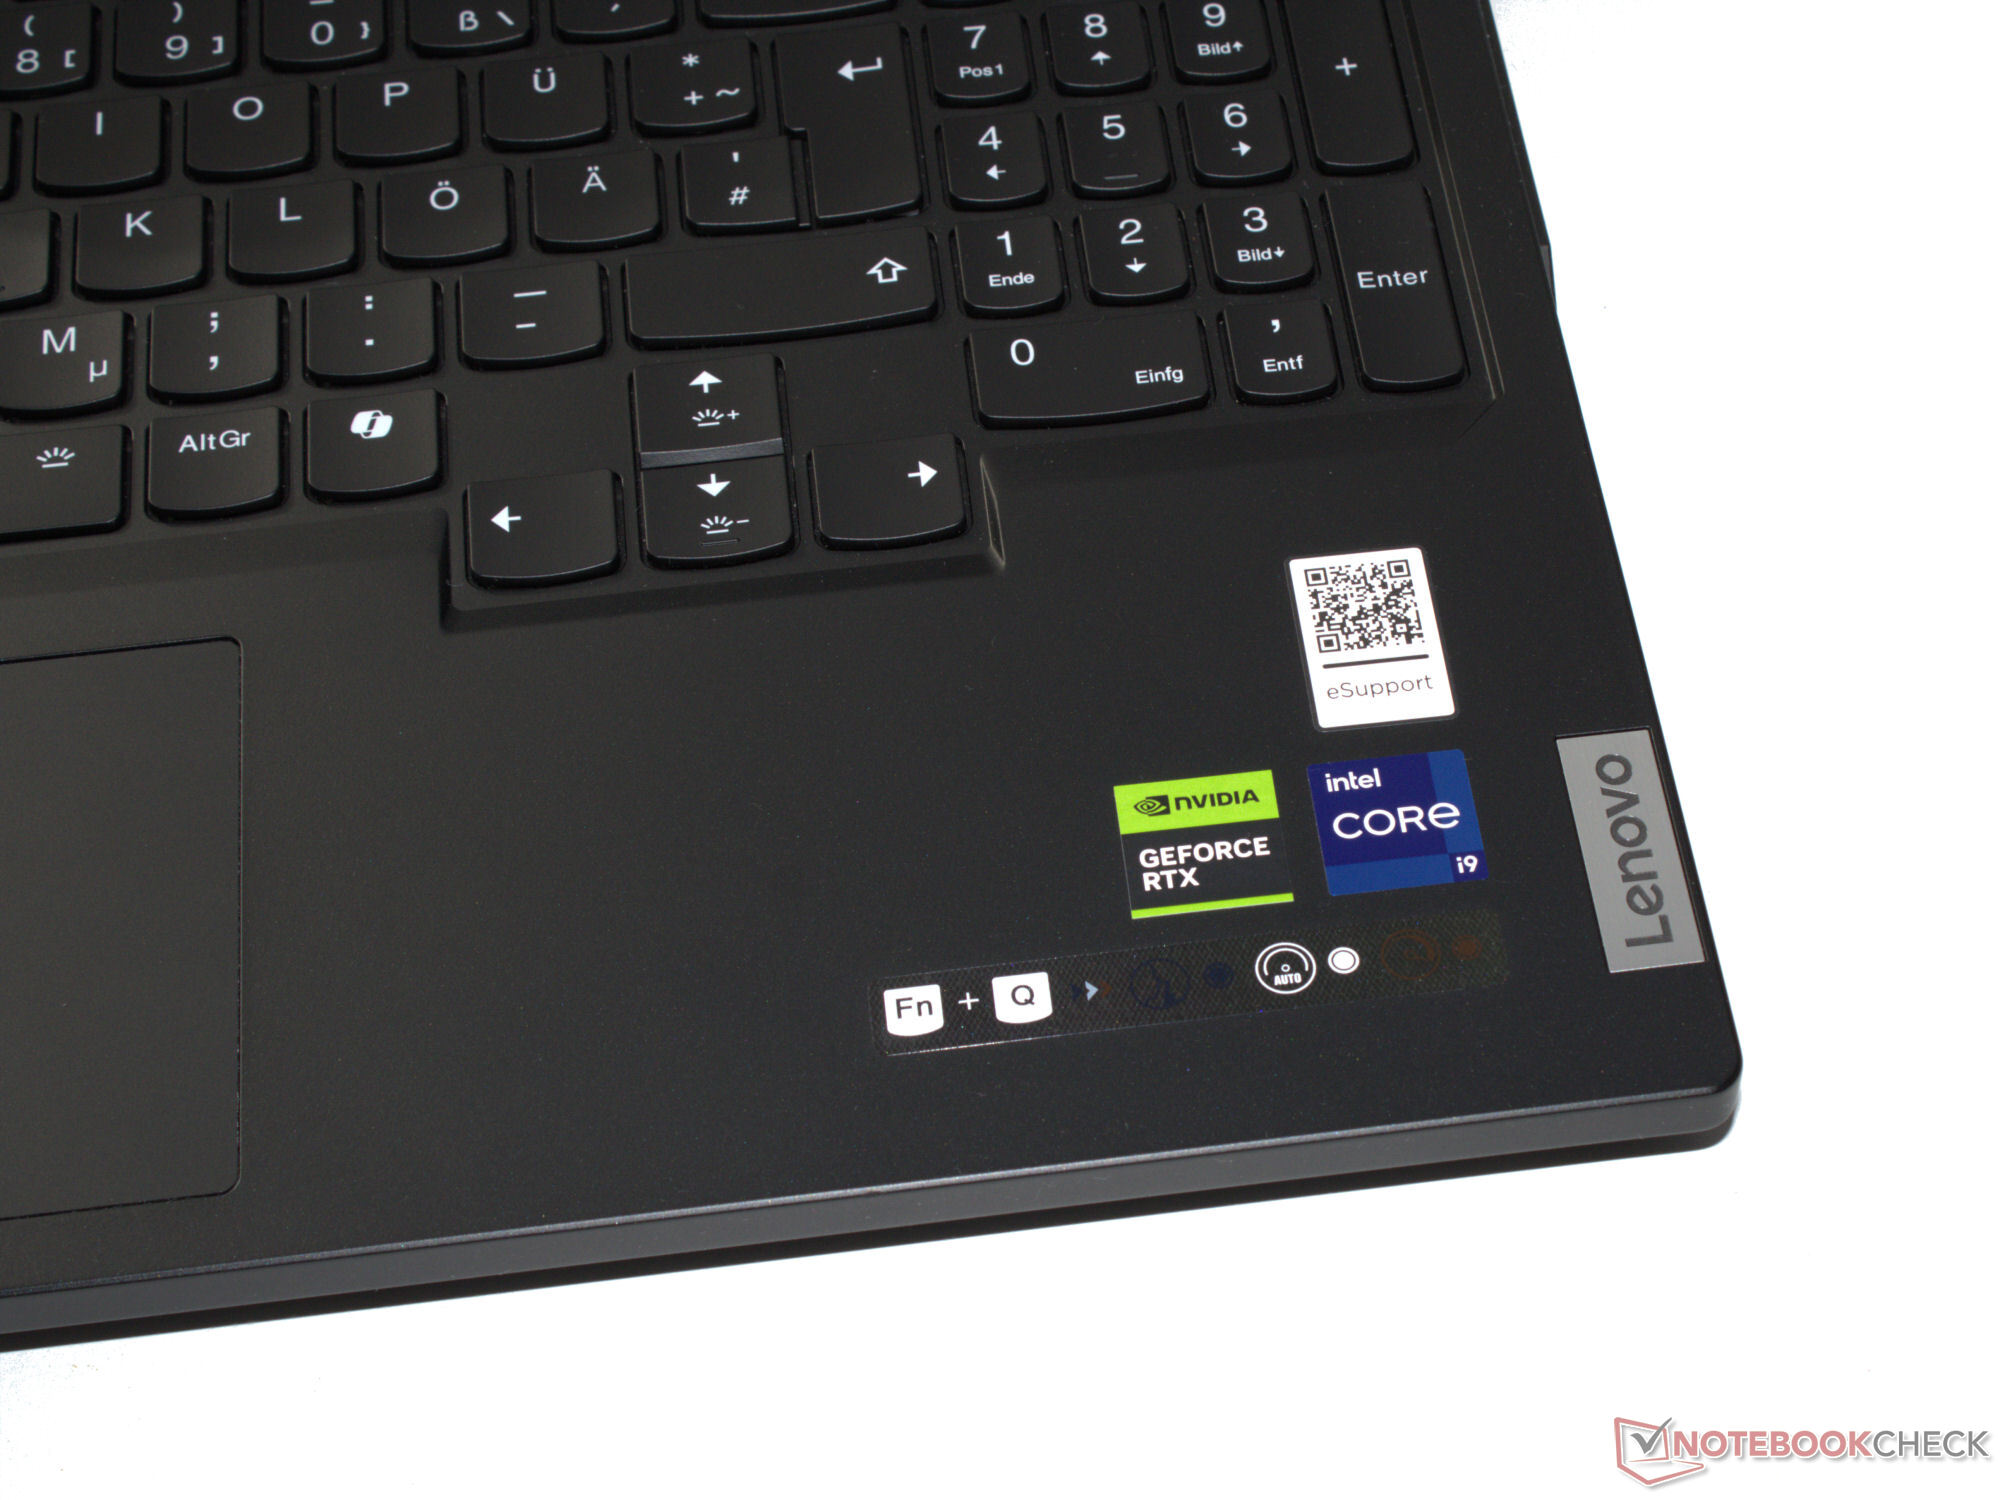
O Legion Pro 7 - um laptop de 16 polegadas destinado a jogadores e criadores - está na extremidade superior do espectro de desempenho. E ele vem com um hardware adequadamente potente, com um Core i9-14900HX, a GeForce RTX 408032 GB de RAM e uma tela IPS com cores vivas e precisas (cobertura DCI-P3, Dolby Vision, G-Sync) com proporção de 16:10. O Legion Pro está competindo com modelos como o MSI Vector 16 HX A14V, o Alienware m16 R1 AMD, o HP Omen 16 (2024).
O Legion Pro 7 16IRX9H é o sucessor do Legion Pro 7 16IRX8H e compartilha o mesmo design externo. Consulte a nossa análise do 16IRX8H para obter mais detalhes sobre o chassi, os recursos e os dispositivos de entrada.
Possíveis concorrentes em comparação
Avaliação | Data | Modelo | Peso | Altura | Size | Resolução | Preço |
|---|---|---|---|---|---|---|---|
| 89.5 % v7 (old) | 03/2024 | Lenovo Legion Pro 7 16IRX9H i9-14900HX, GeForce RTX 4080 Laptop GPU | 2.7 kg | 21.95 mm | 16.00" | 2560x1600 | |
| 89.2 % v7 (old) | 08/2023 | Alienware m16 R1 AMD R9 7845HX, GeForce RTX 4080 Laptop GPU | 3.1 kg | 25.4 mm | 16.00" | 2560x1600 | |
| 88 % v7 (old) | 02/2024 | MSI Vector 16 HX A14V i9-14900HX, GeForce RTX 4080 Laptop GPU | 2.7 kg | 28.55 mm | 16.00" | 2560x1600 | |
| 86.7 % v7 (old) | 02/2024 | HP Omen 16 (2024) i9-14900HX, GeForce RTX 4080 Laptop GPU | 2.4 kg | 23.5 mm | 16.10" | 2560x1440 |
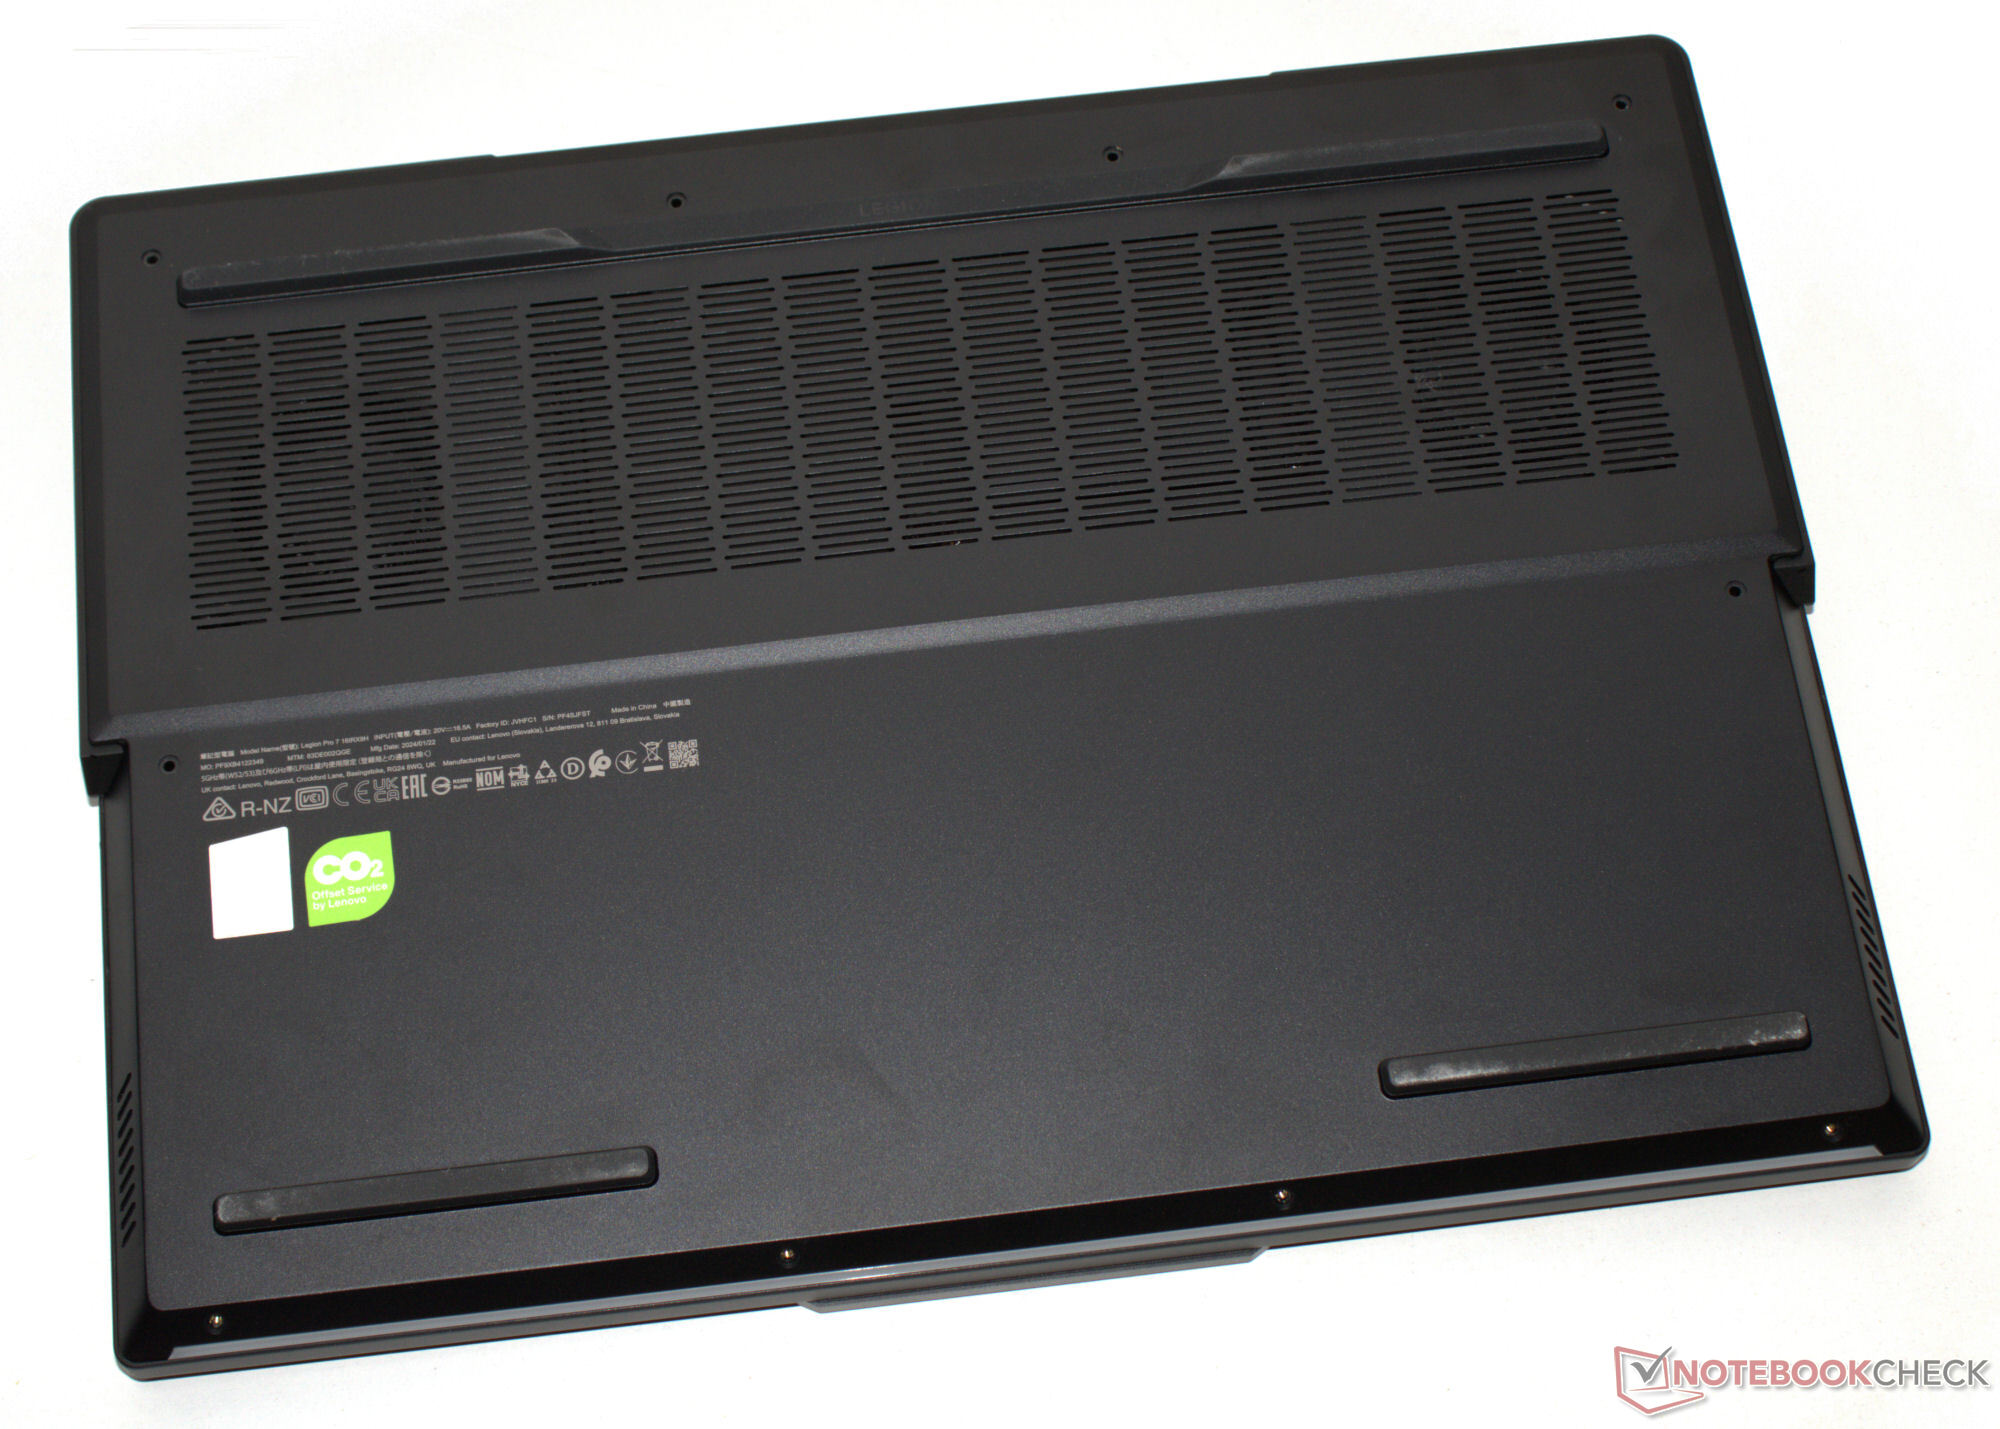
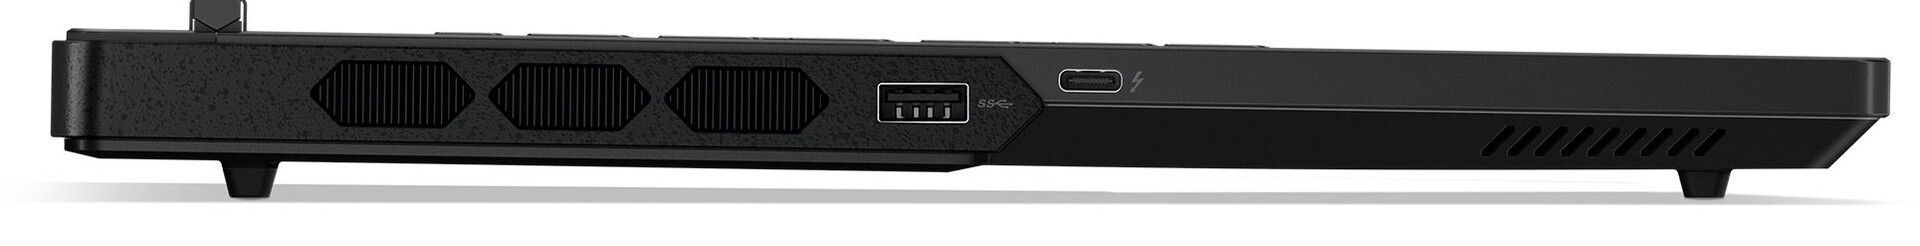
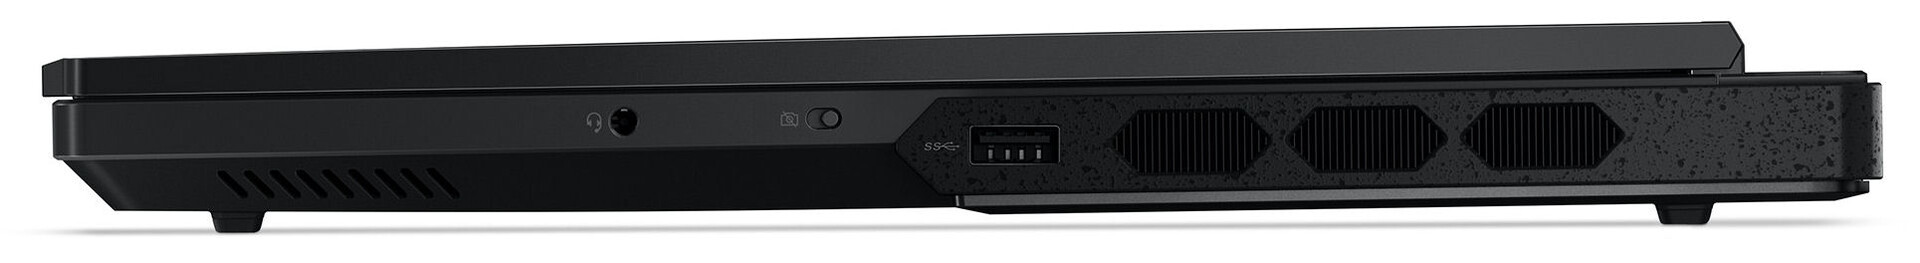
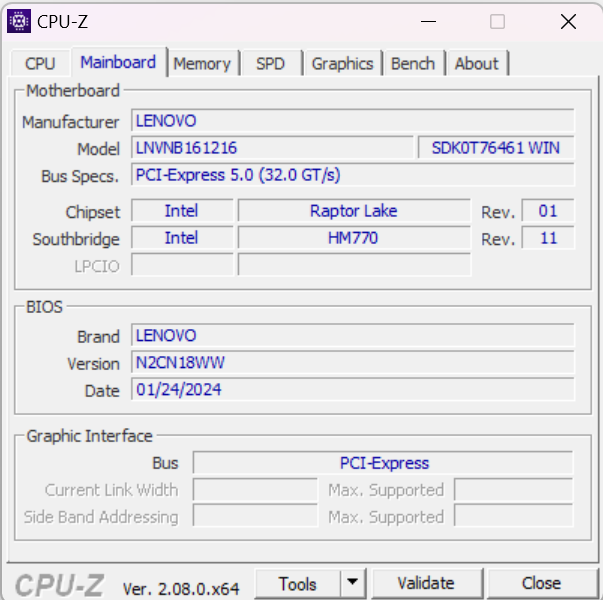
Chassi e especificações - Vem com Thunderbolt 4
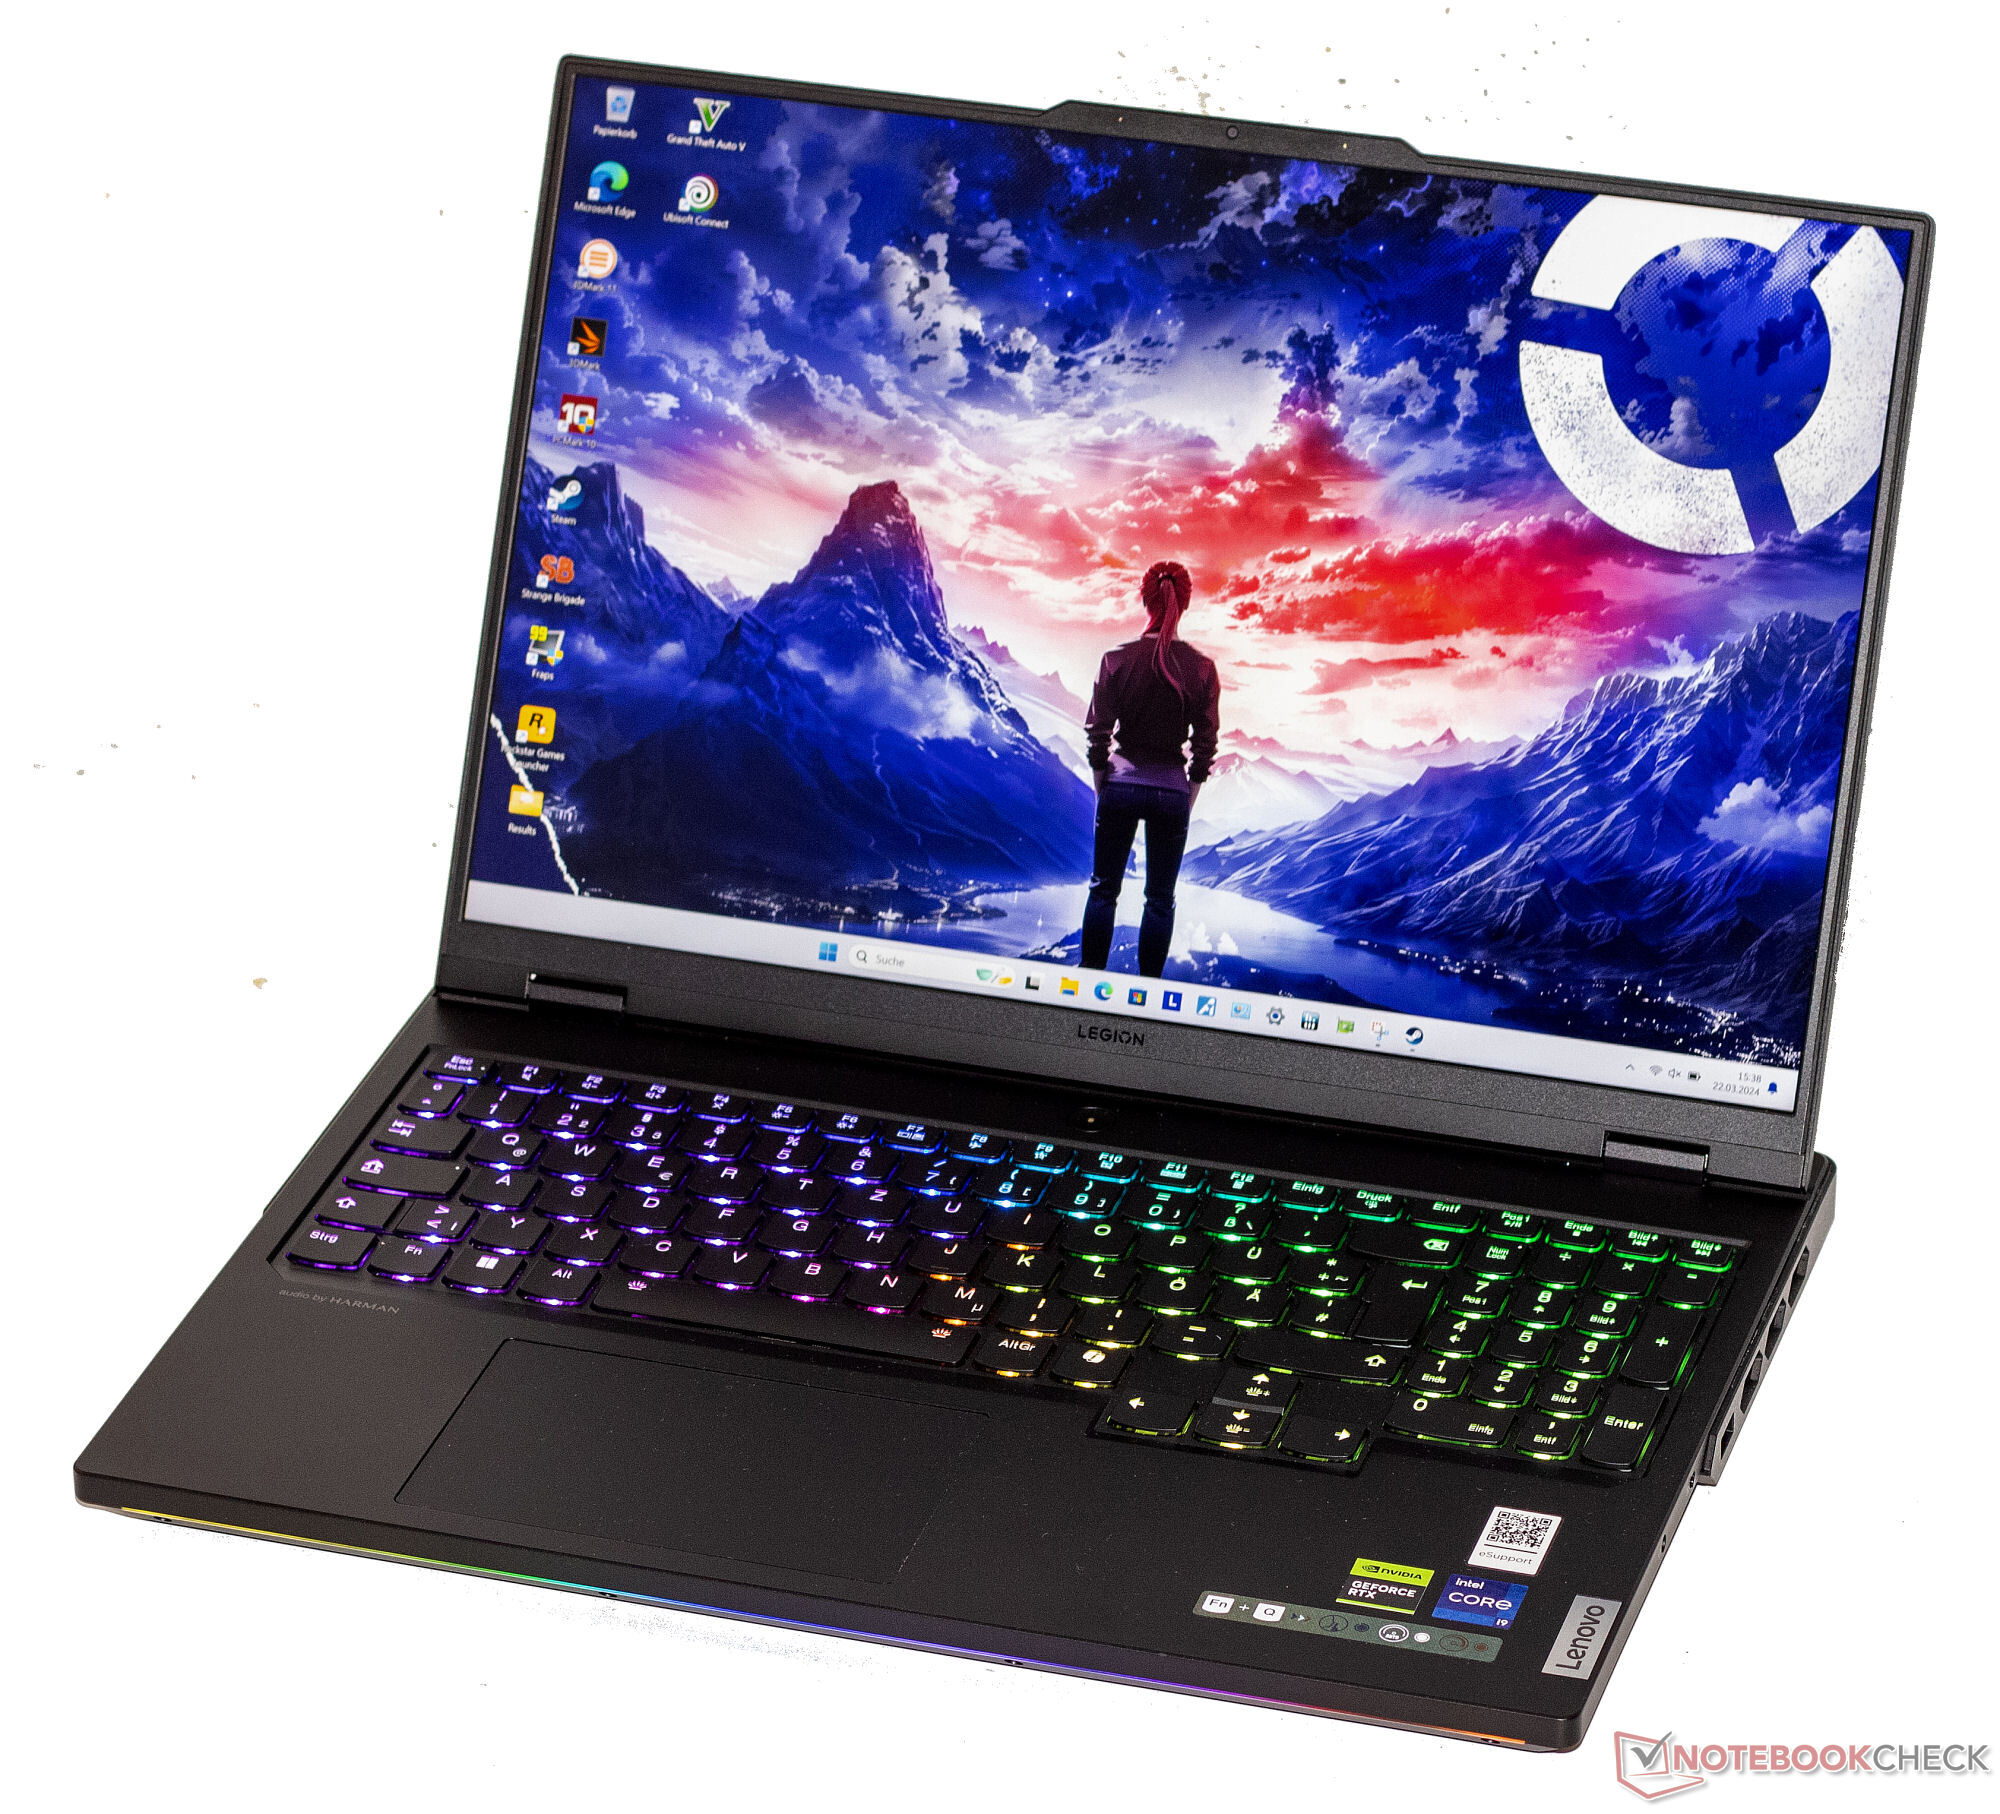
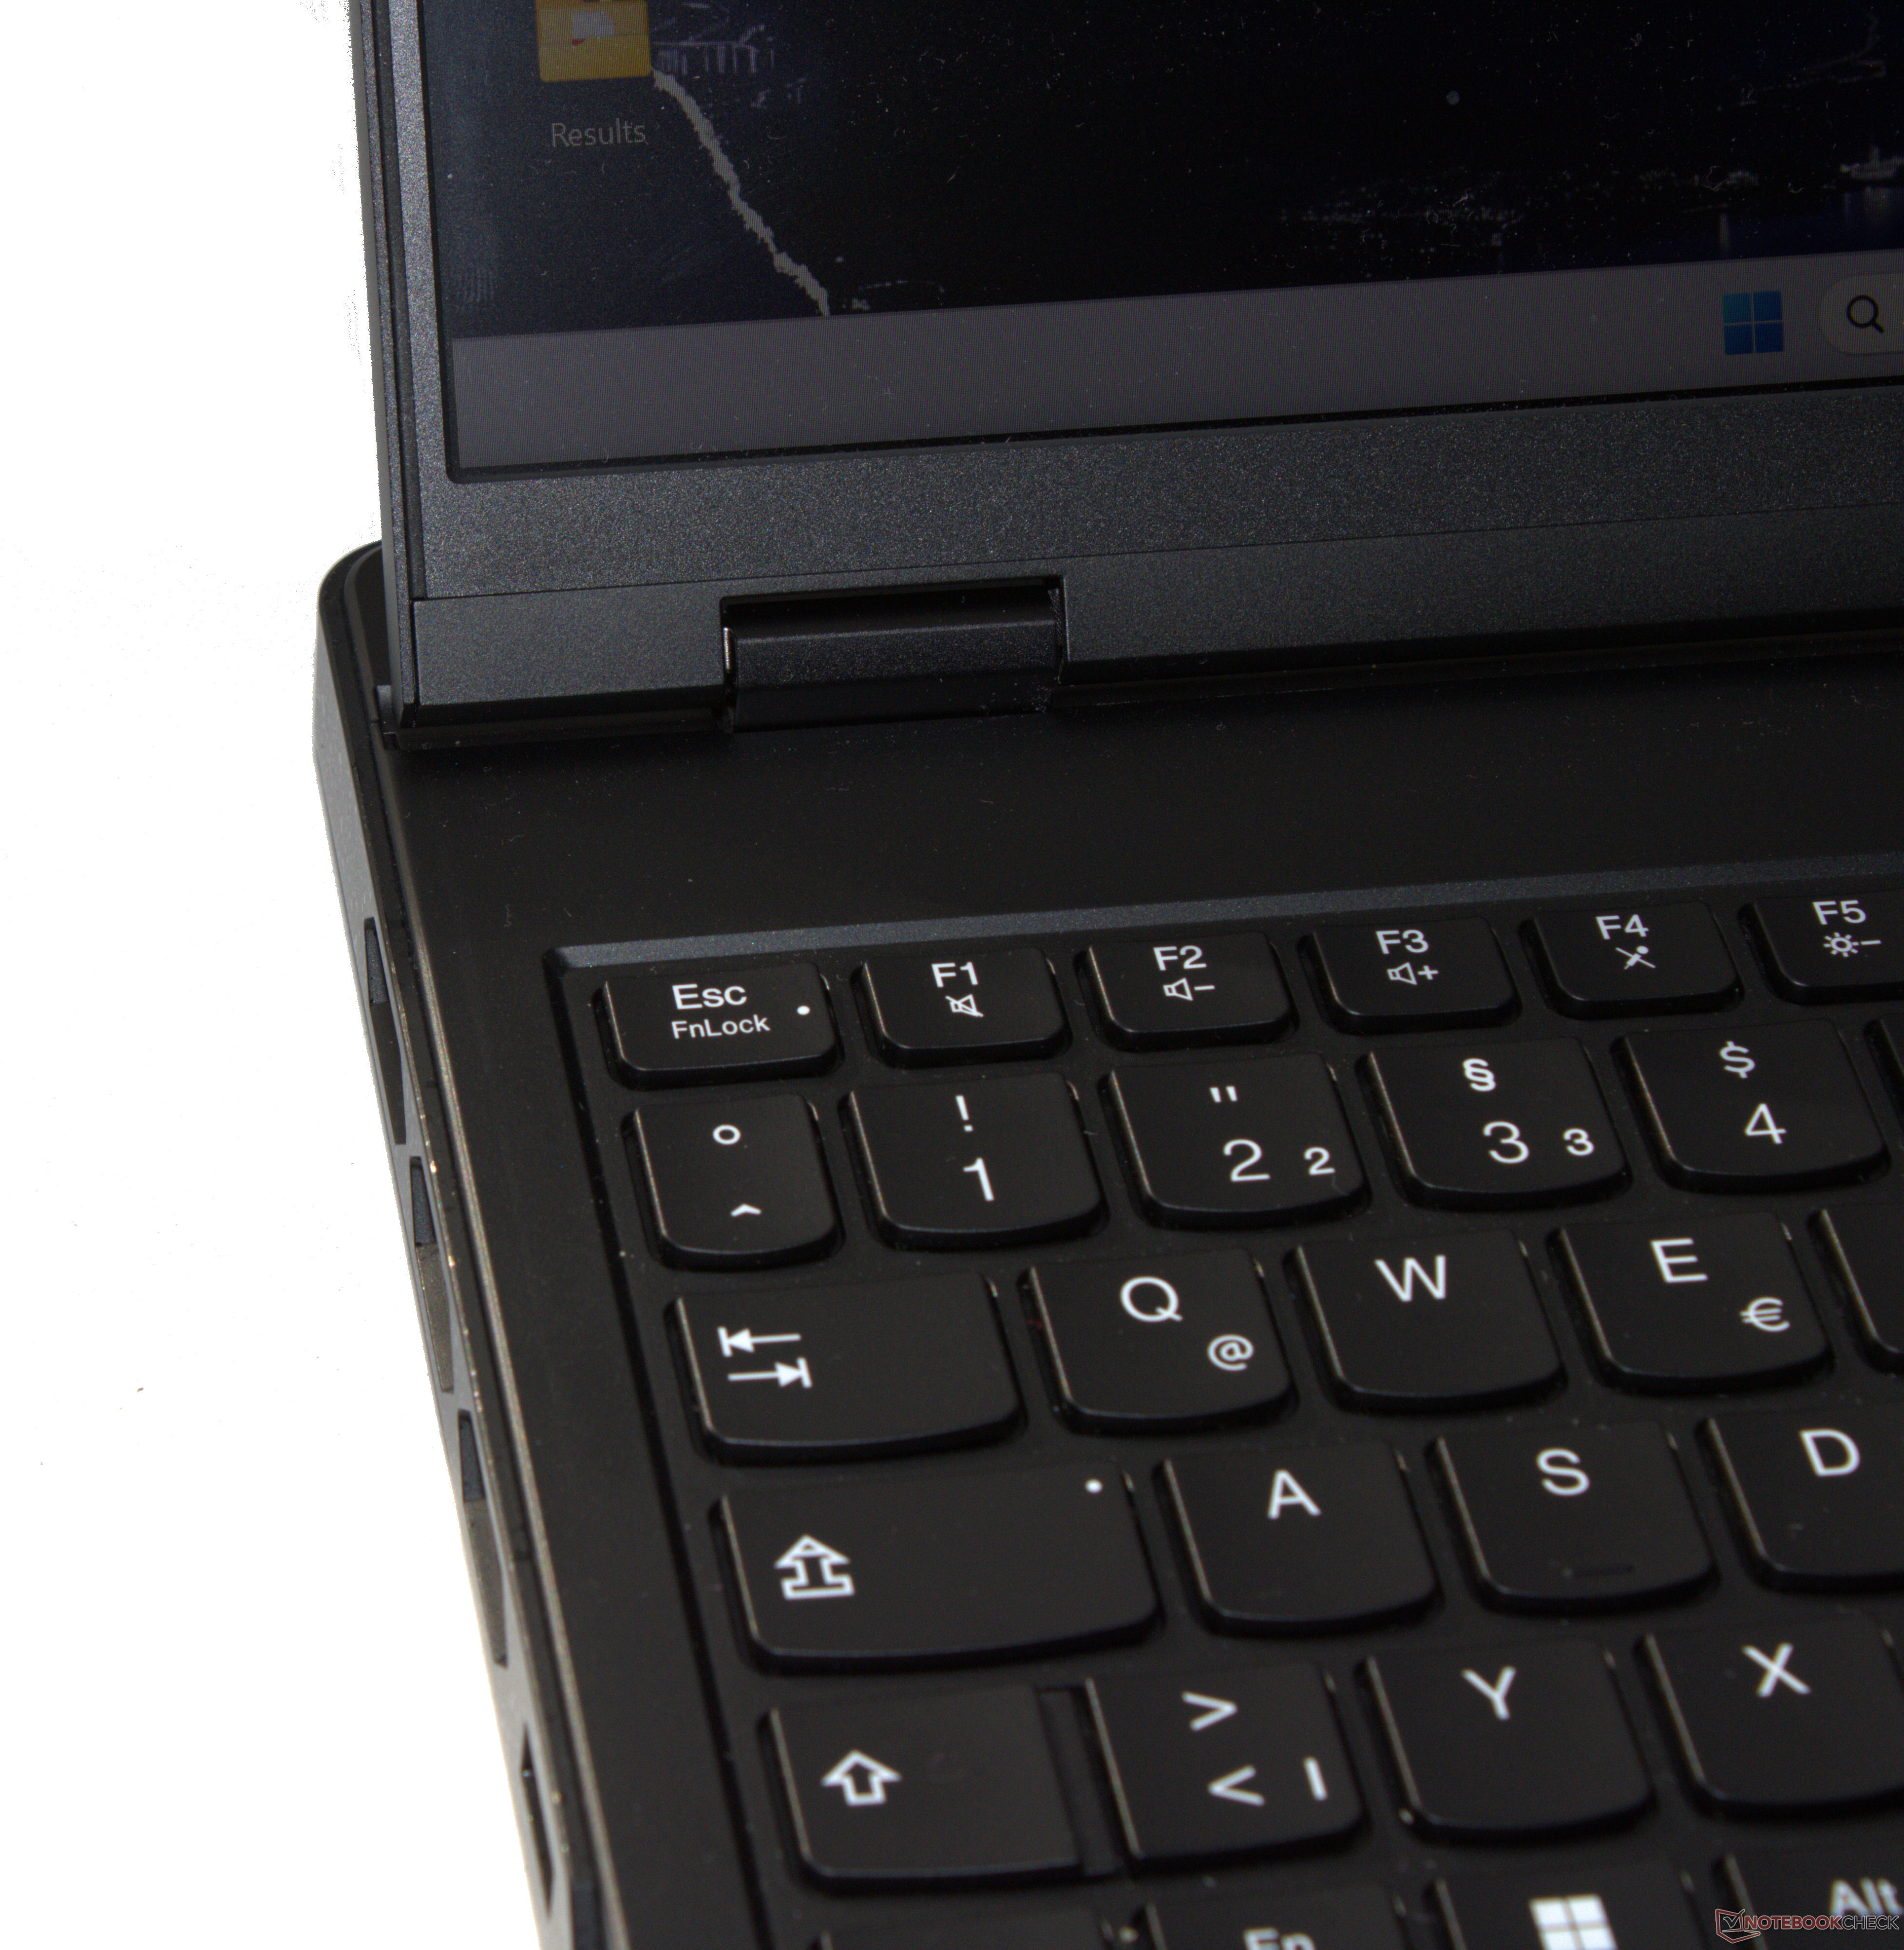
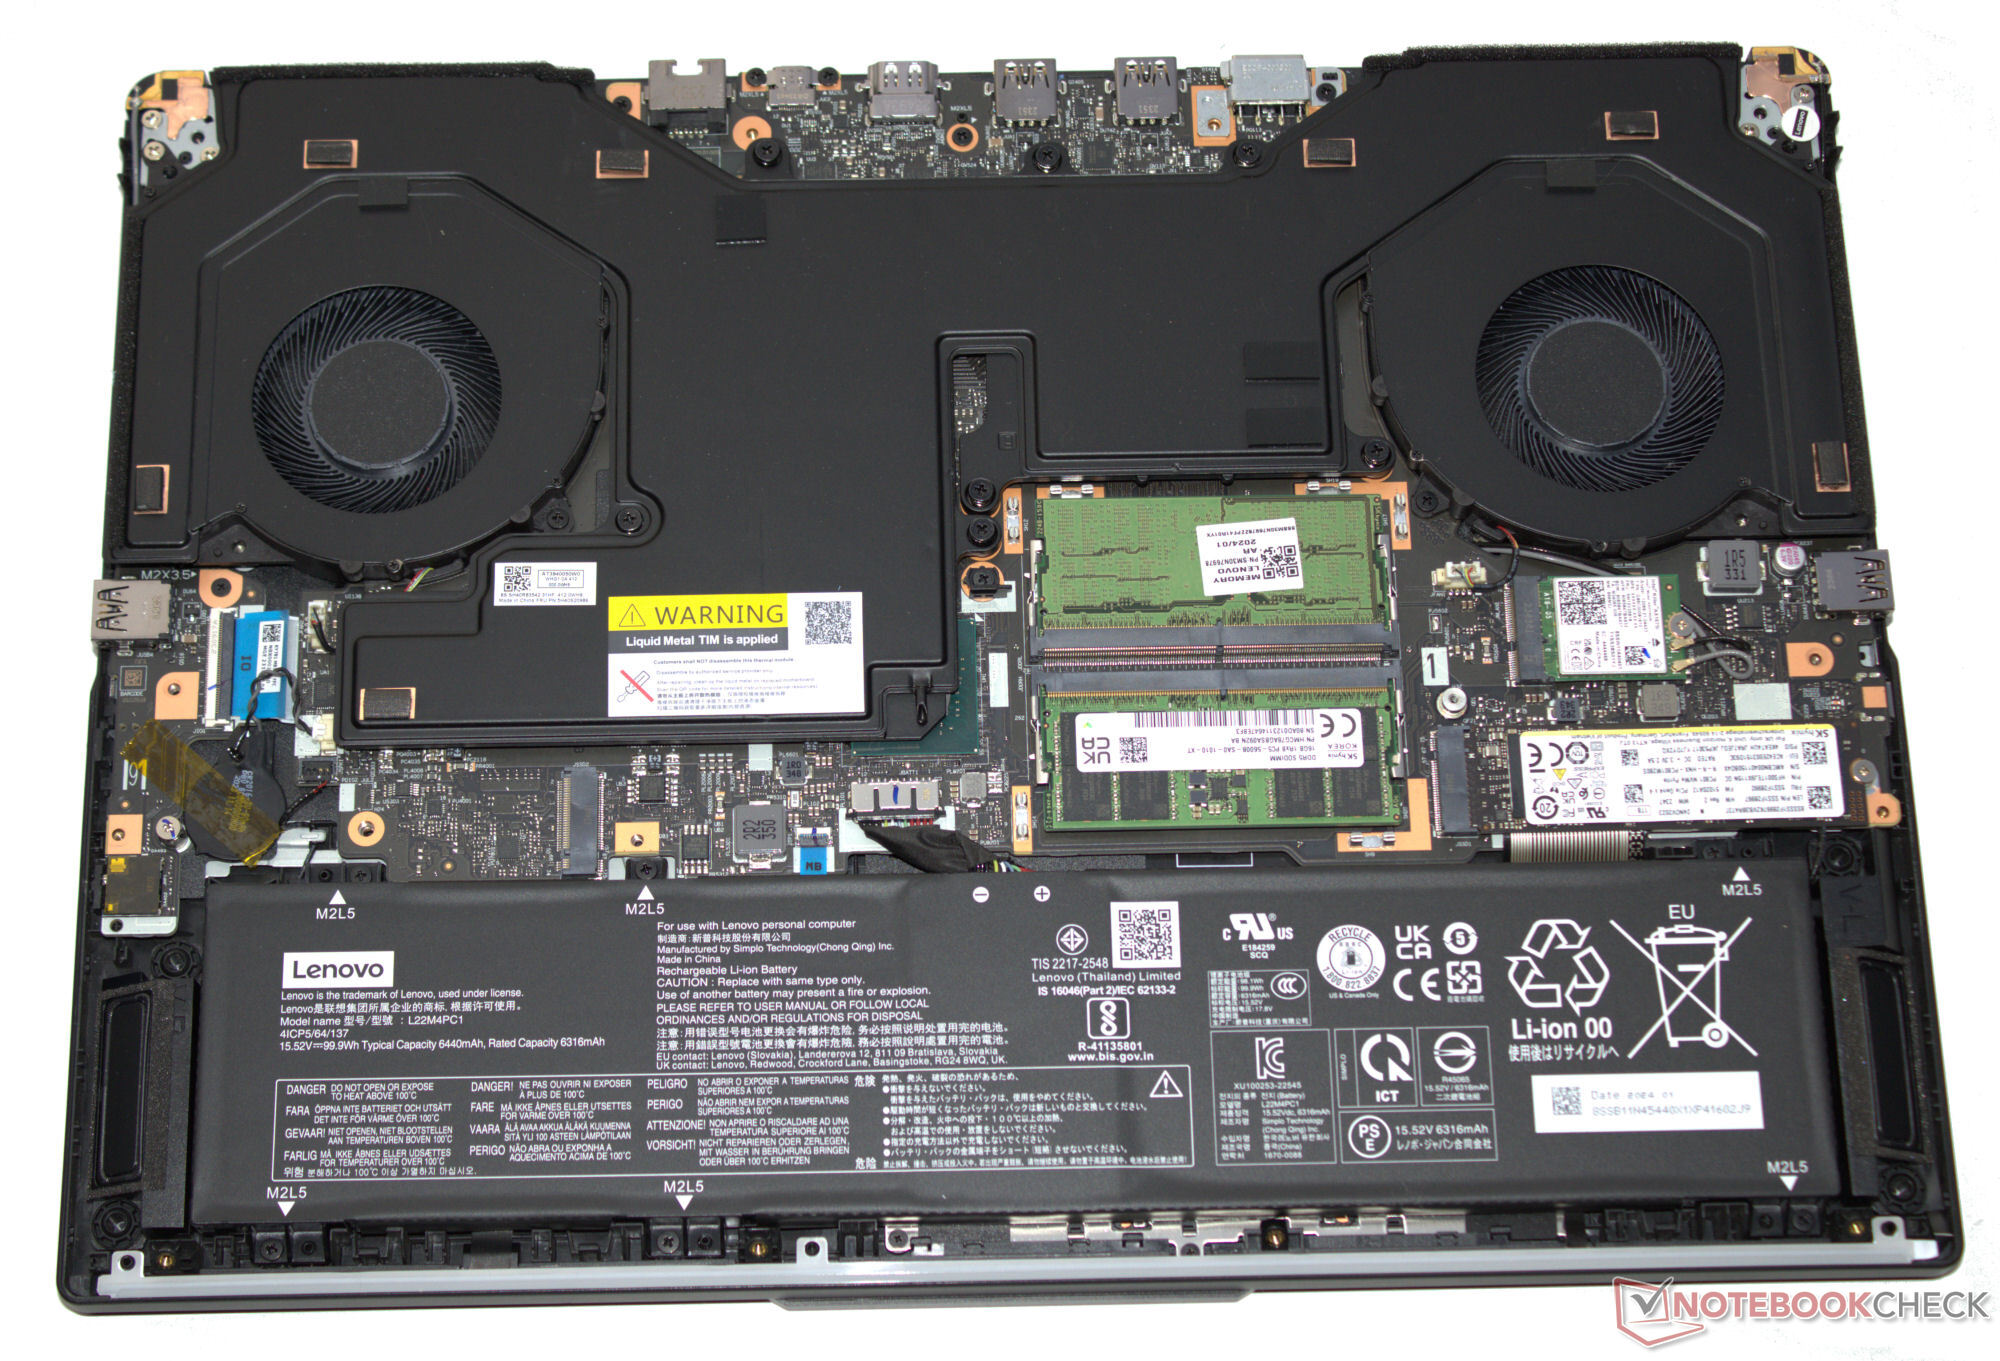
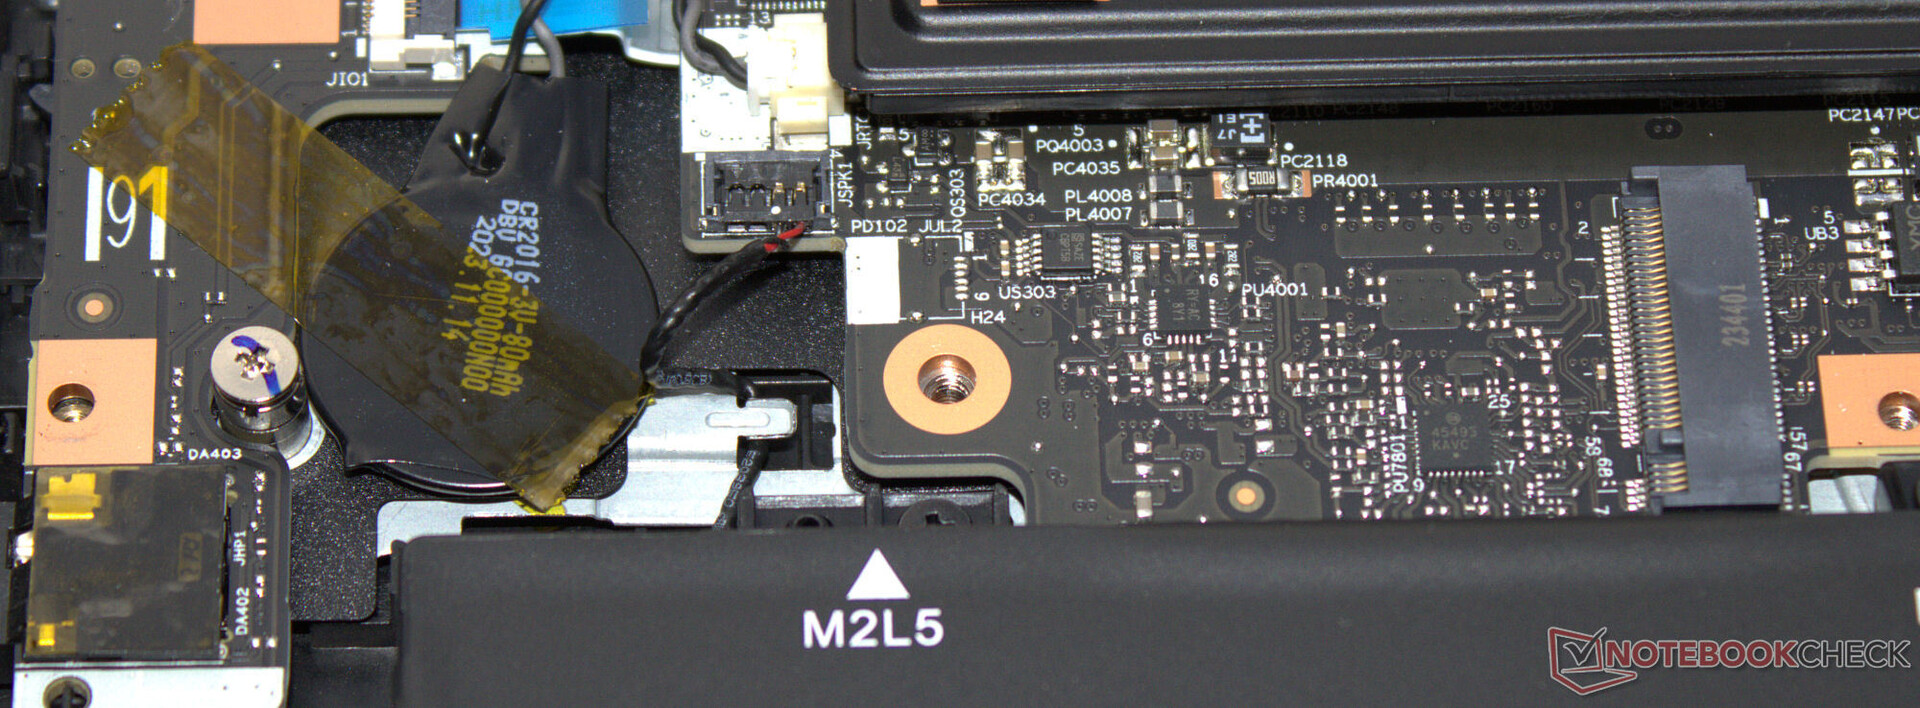
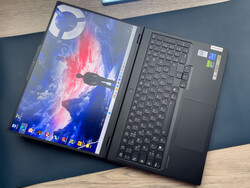
O hardware do Legioné embalado em um chassi de alumínio resistente, preto fosco e com superfície lisa. A luz de fundo do teclado e uma faixa de LED voltada para o usuário dão um toque colorido. As dobradiças rígidas com um ângulo máximo de abertura de 180 graus merecem ser elogiadas. A bateria (aparafusada, não colada) e o restante dos componentes internos são acessíveis quando a tampa inferior é removida.
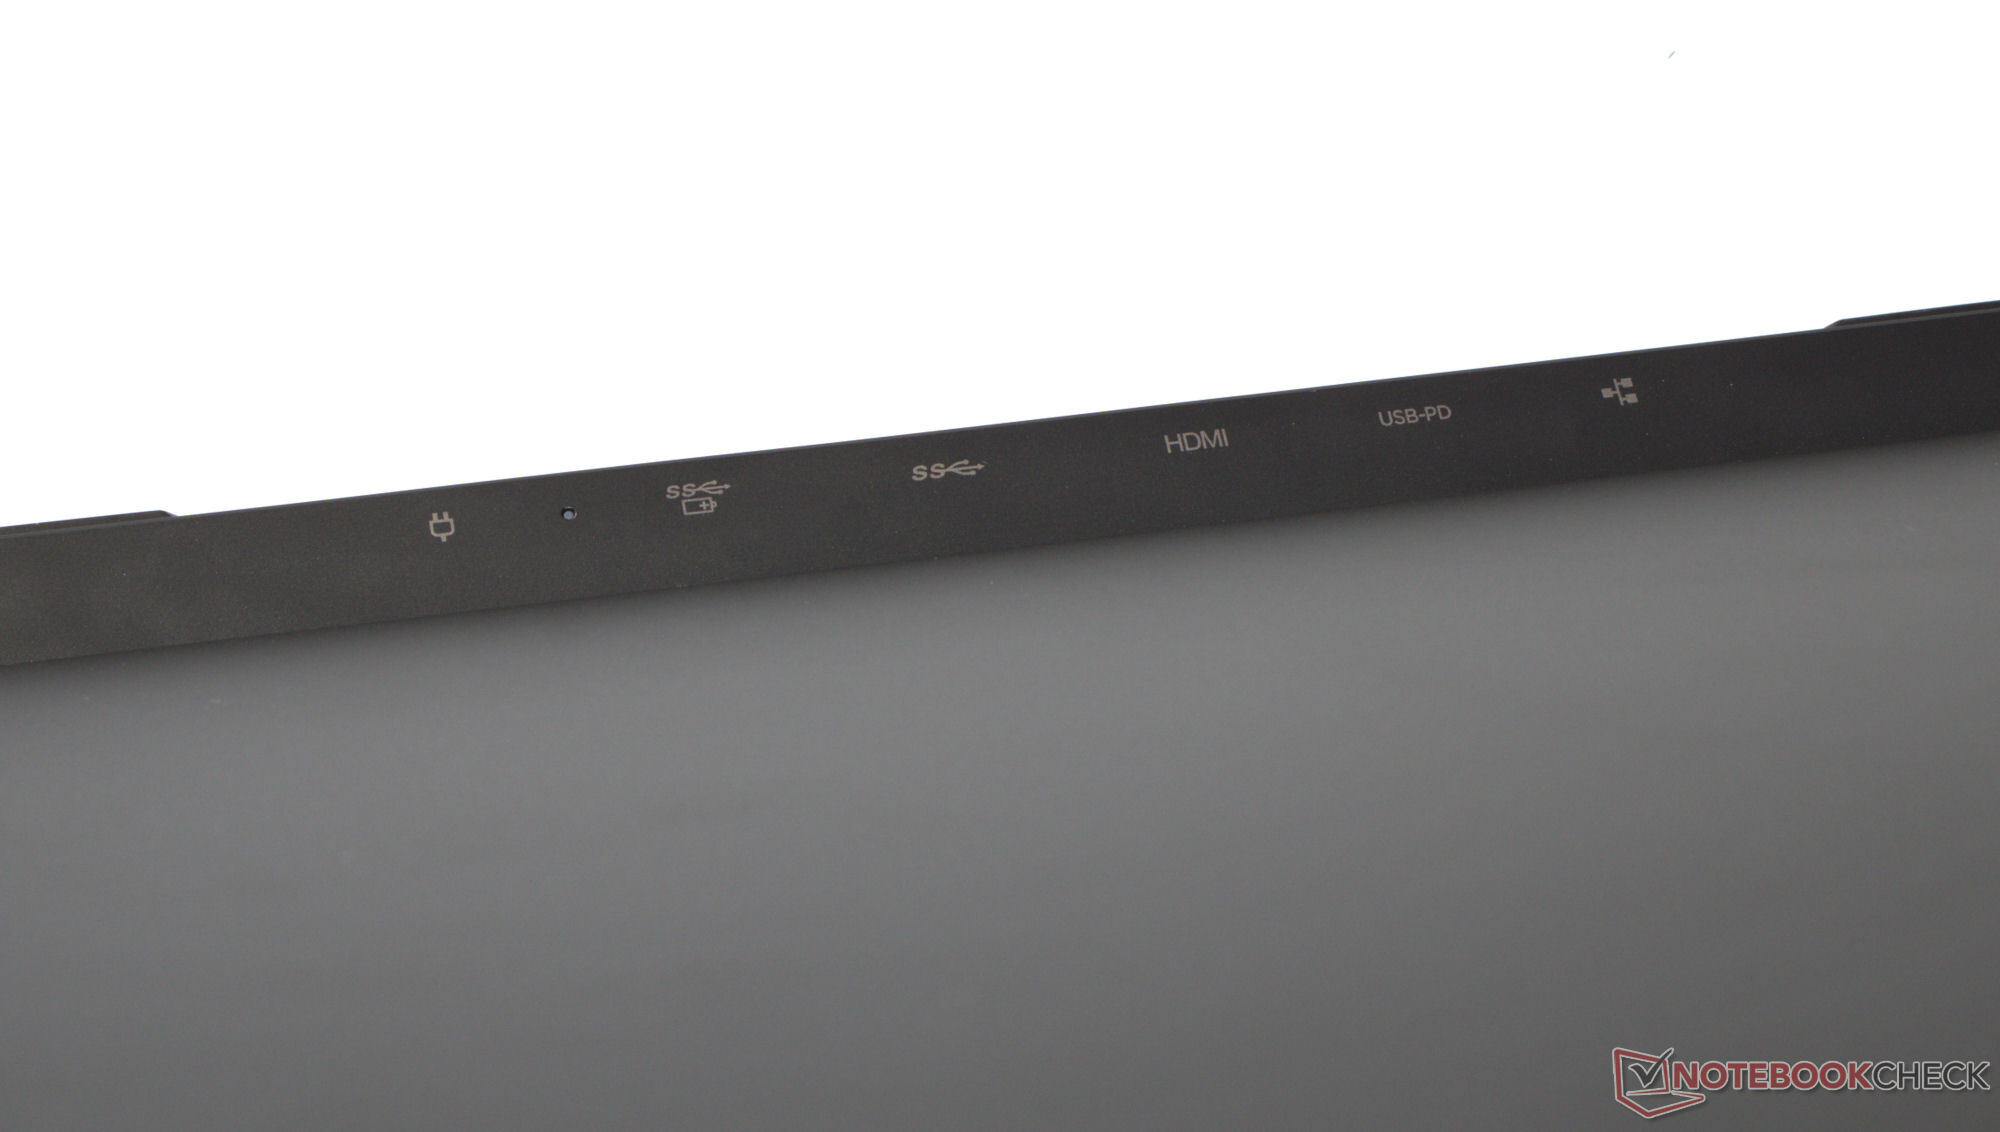
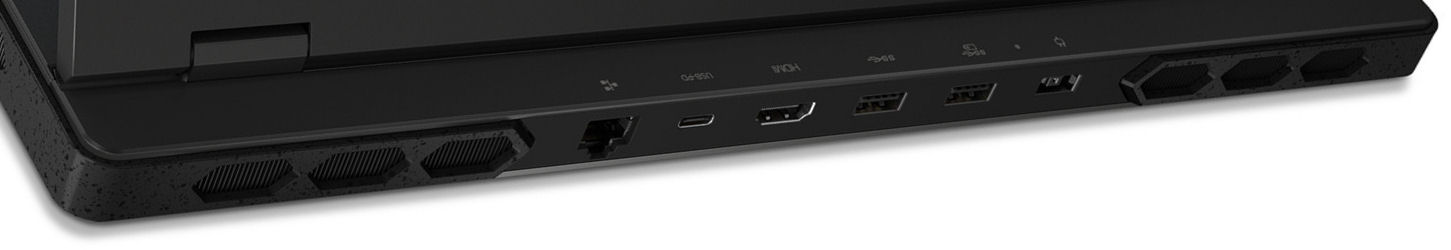
O laptop não deixa a desejar no departamento de E/S, com quatro portas USB-A (USB 3.2 Gen 1) e duas portas USB-C (1x Thunderbolt 4, 1 x USB 3.2 Gen 2; 1x PD, 2x DP). Ele oferece um total de três saídas de vídeo (1x HDMI, 2x DP). A webcam de 2,1 MP e 1080p é equipada com um obturador de privacidade e produz resultados muito bons. Não há nenhum leitor de cartão de memória integrado.
Em condições ideais (ou seja, nenhum outro dispositivo Wi-Fi por perto, distância curta entre o notebook e o PC servidor), o Legion Pro 7 atingiu taxas de dados Wi-Fi excelentes. O notebook usa um chip Killer AX1675i Wi-Fi 6E (também conhecido como Intel AX211). A conectividade com fio é gerenciada por um controlador Realtek RTL8168/8111.
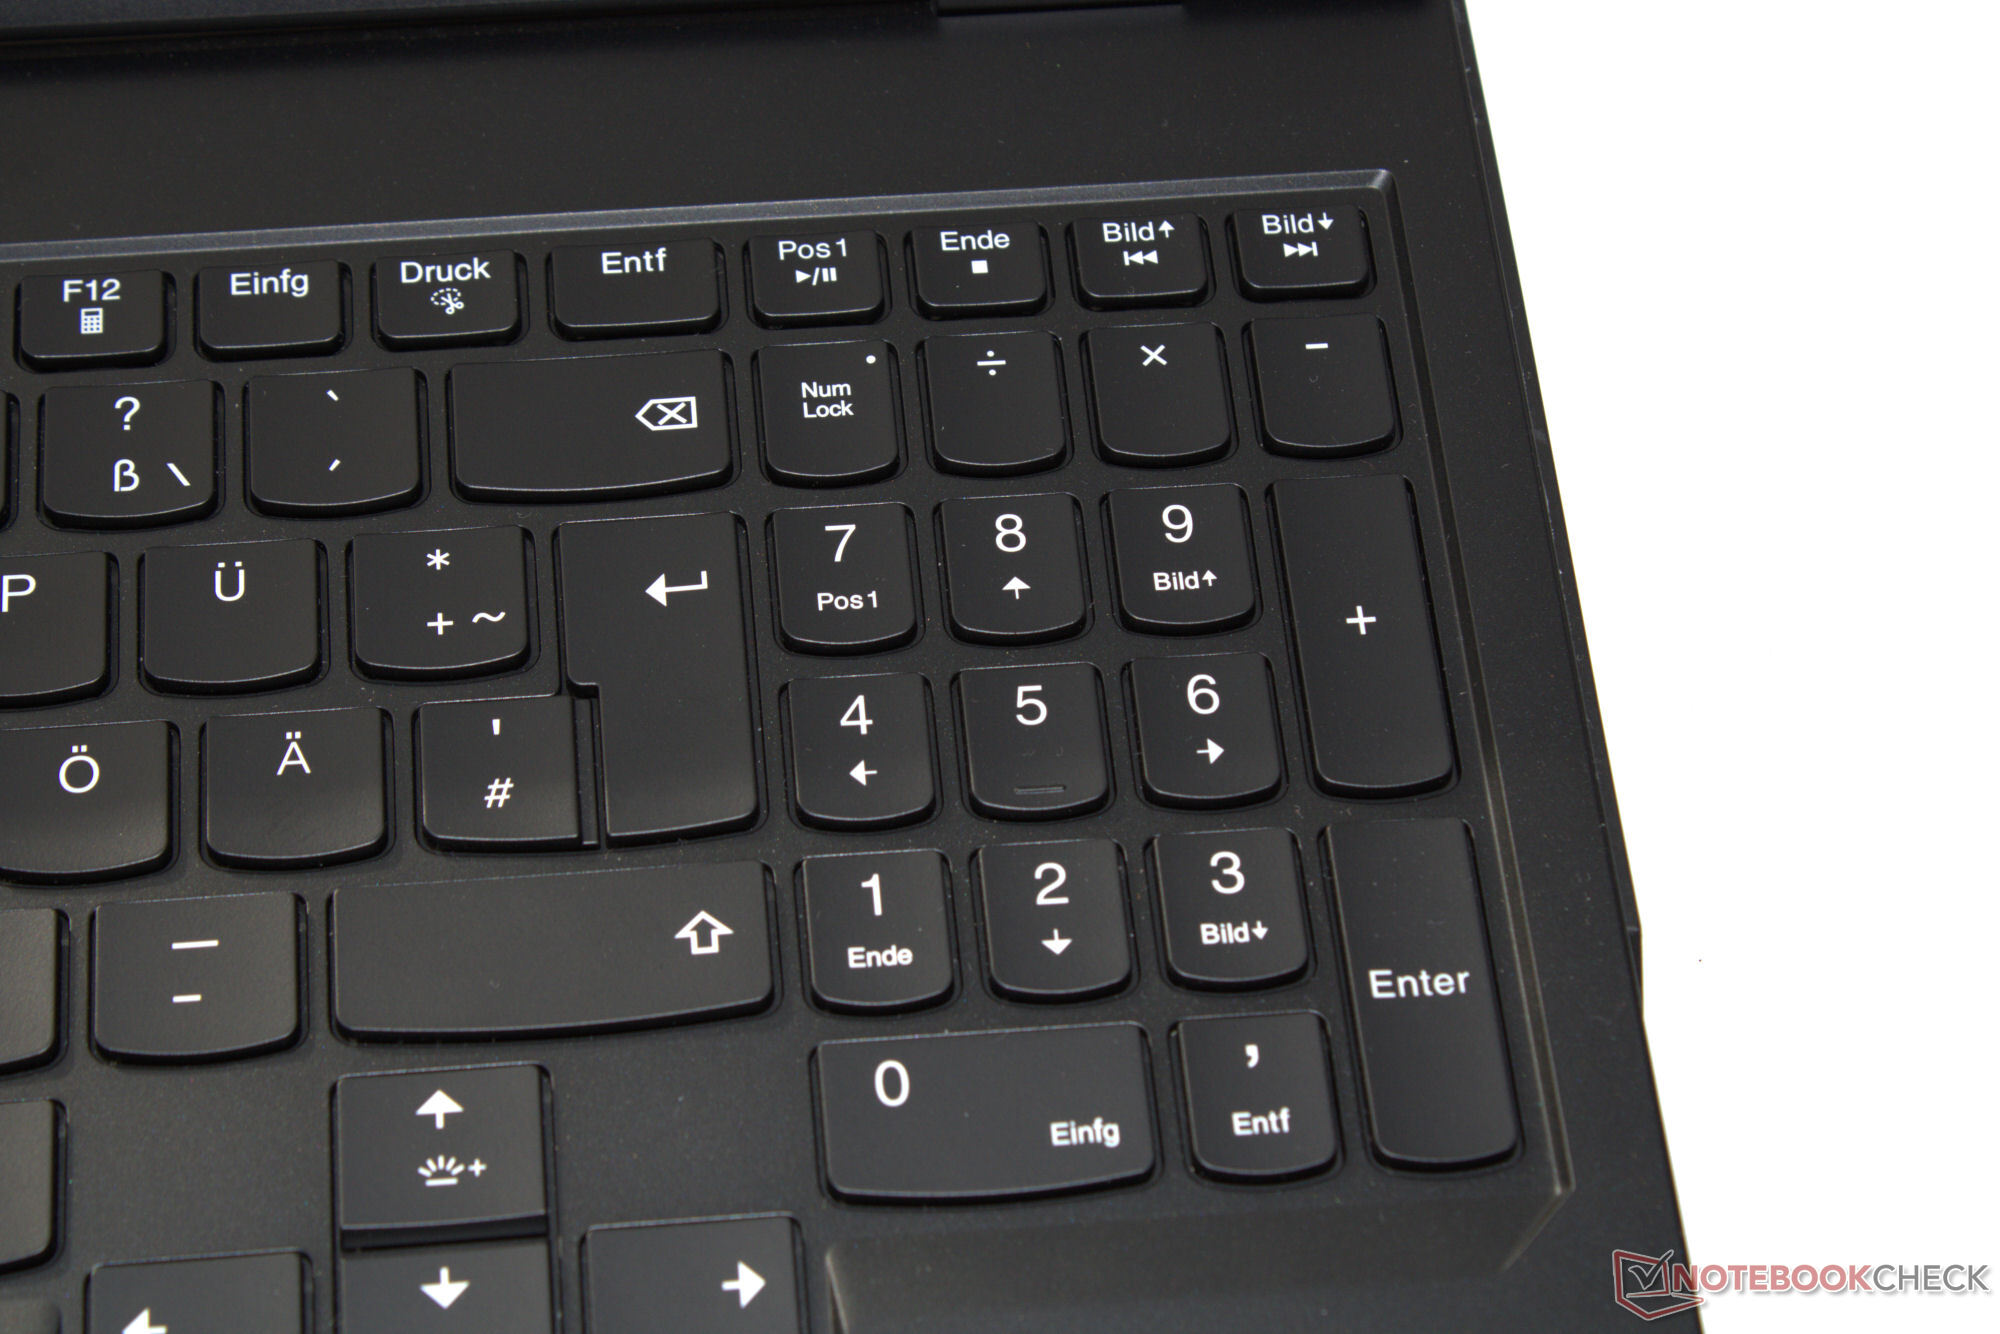
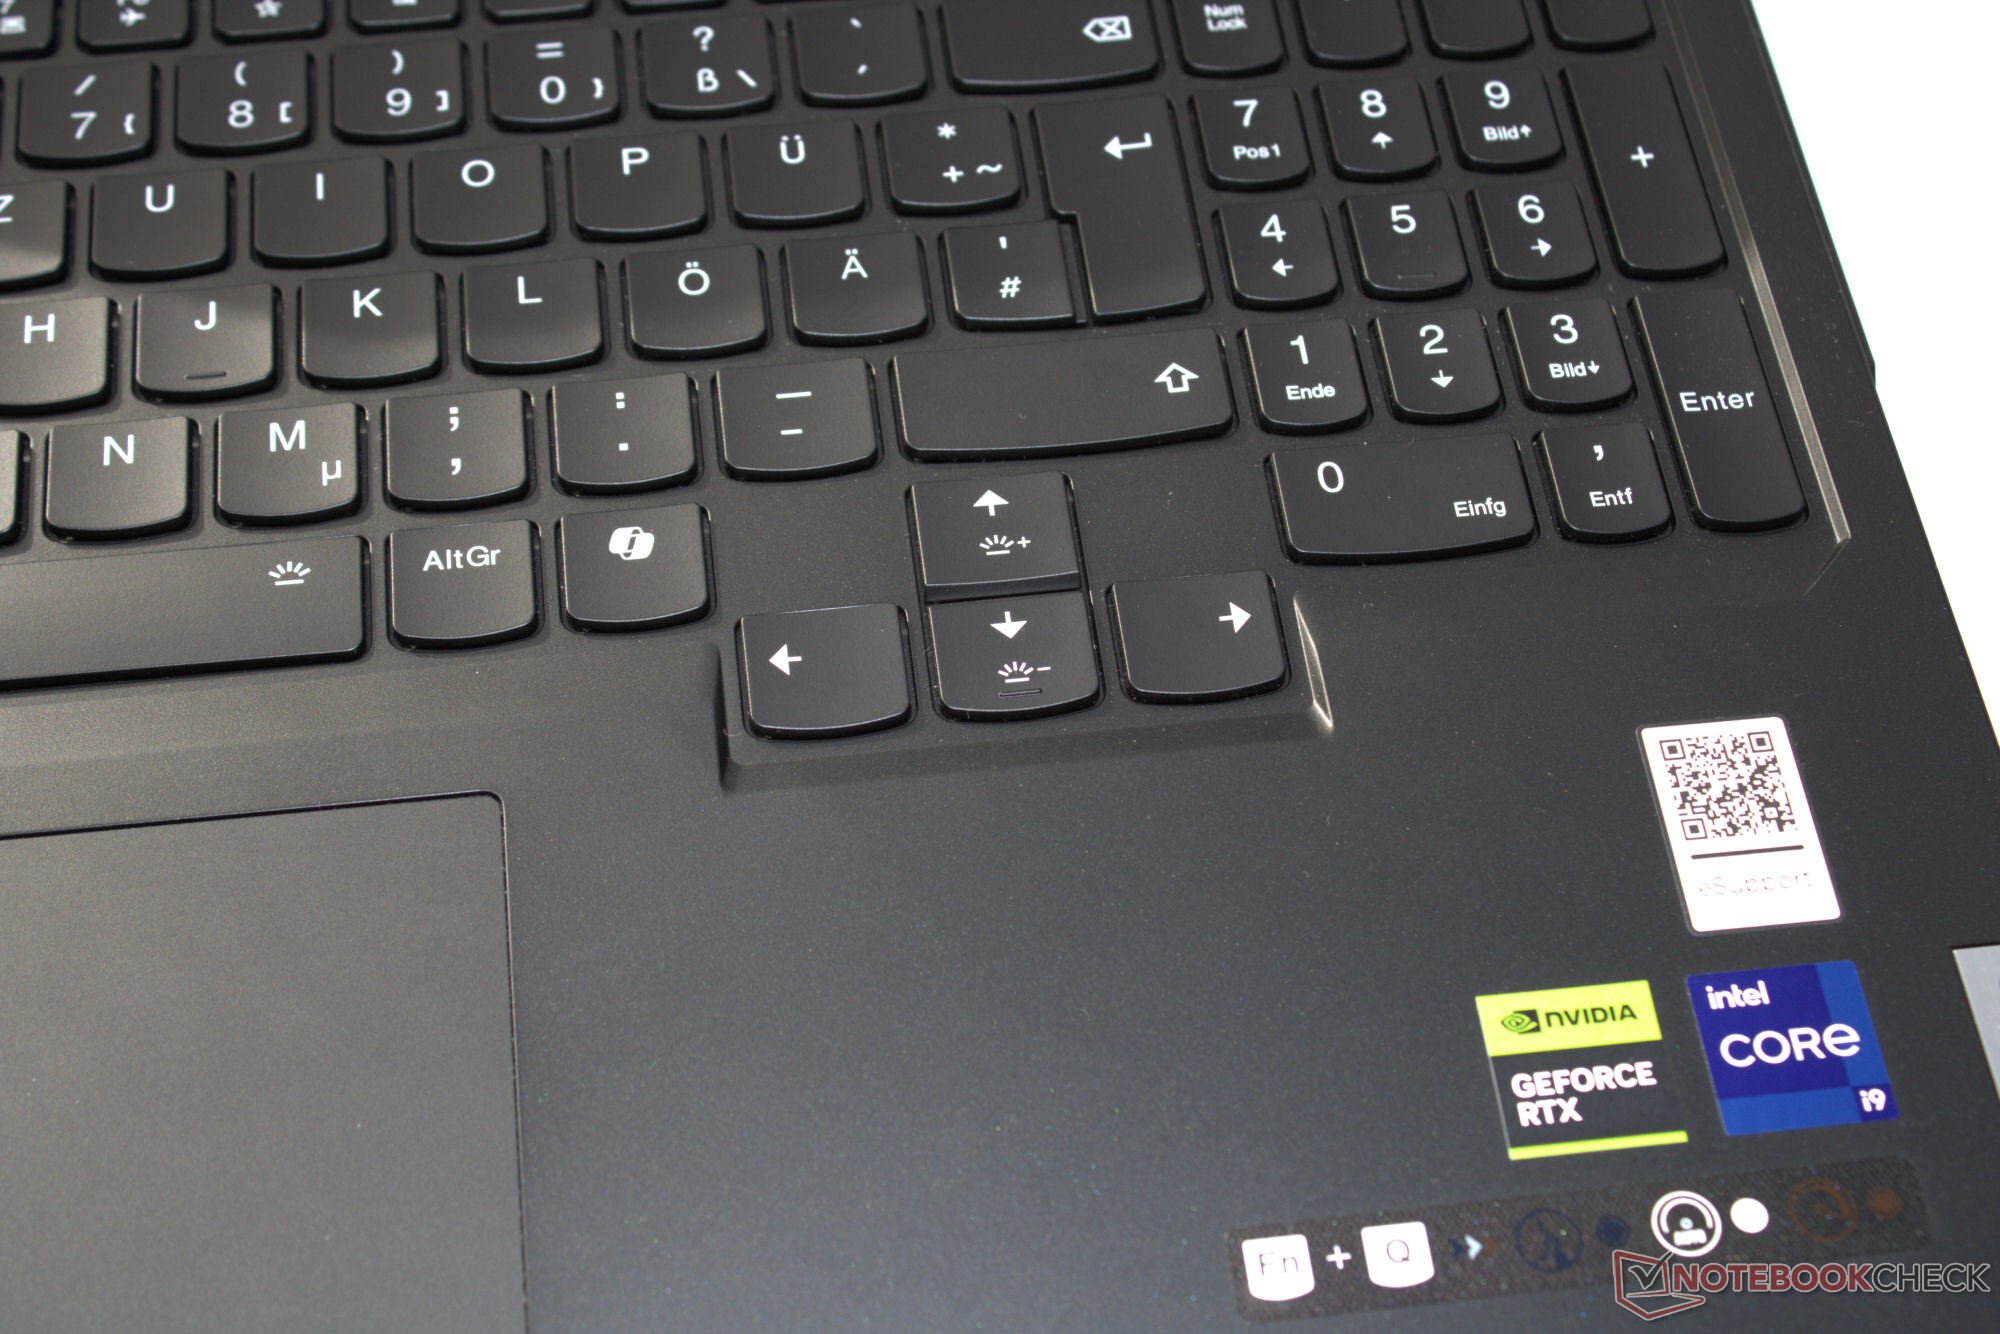
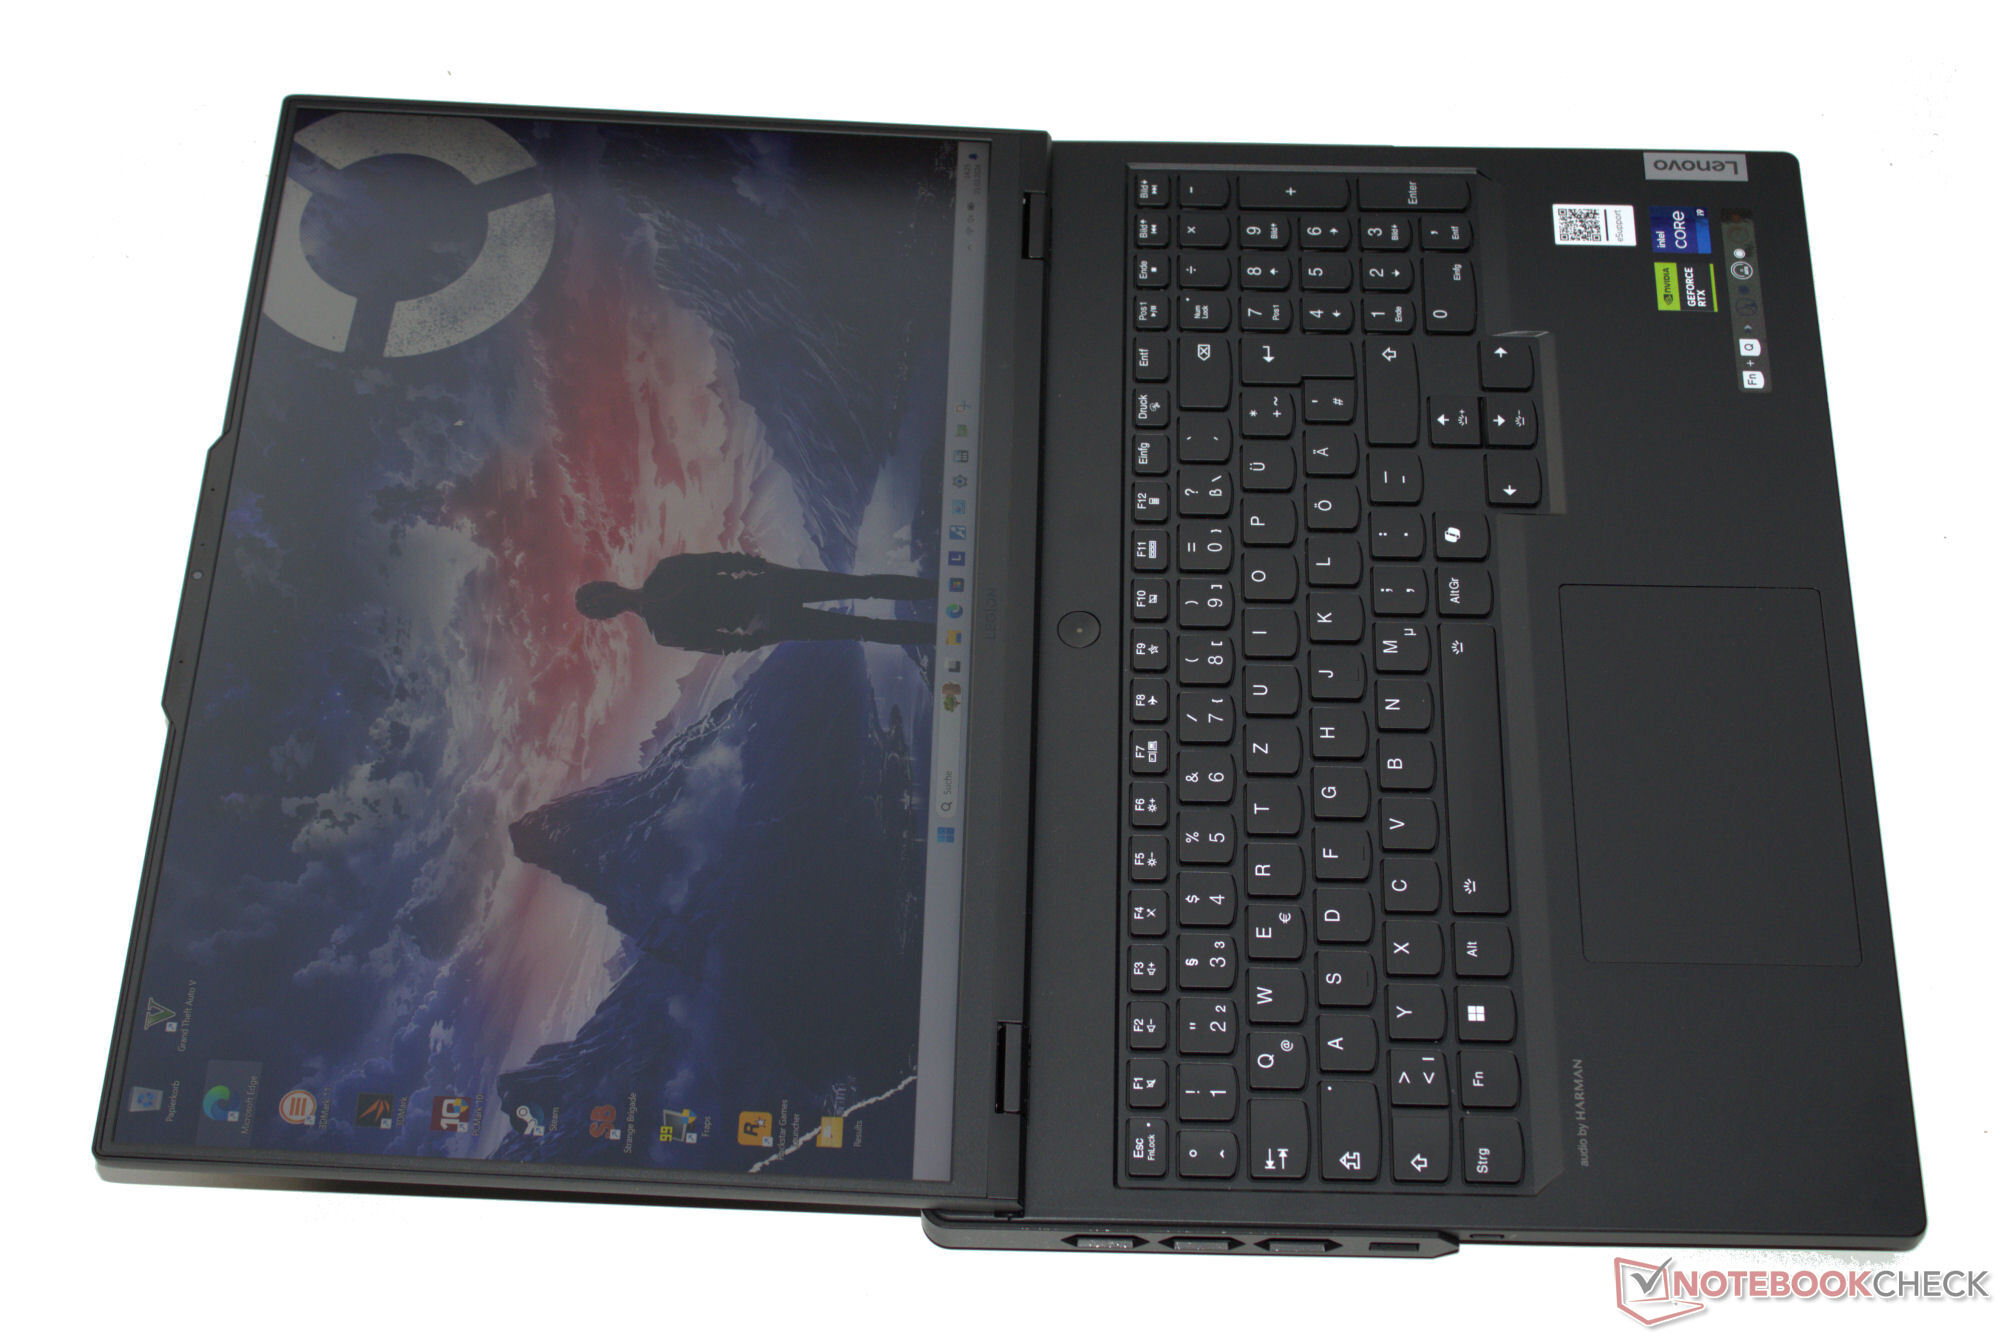


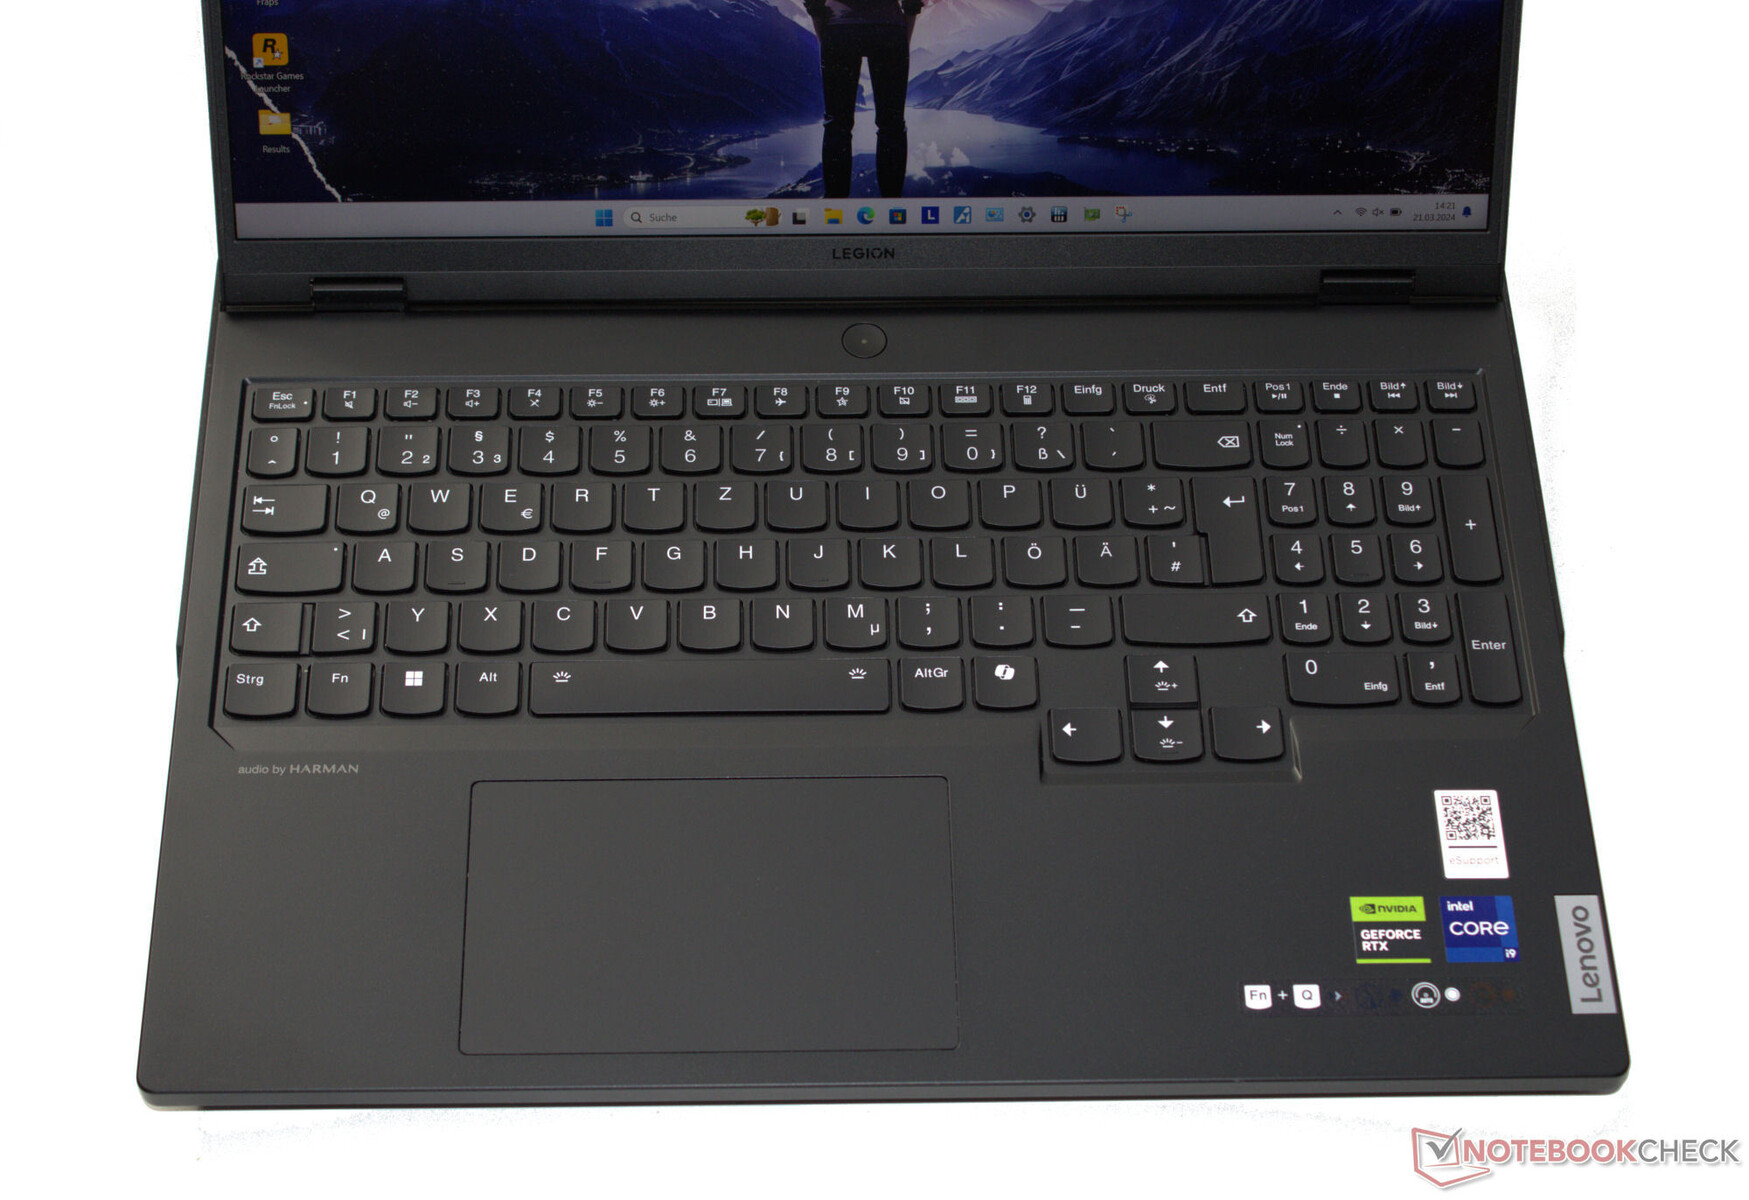
Dispositivos de entrada - Equipado com um teclado nítido
As teclas chiclet côncavas com iluminação RGB por tecla têm uma resistência agradavelmente firme e um ponto de atuação claro. O teclado se flexiona levemente quando o usuário digita, mas isso não afeta a experiência de digitação. As teclas de seta são de tamanho normal. Para o controle do mouse, o laptop tem um clickpad habilitado para multitouch (medindo aprox. 12 x 7,5 cm, ou 4,7 x 3,0 pol.) com um curso curto e um ponto de clique distinto.
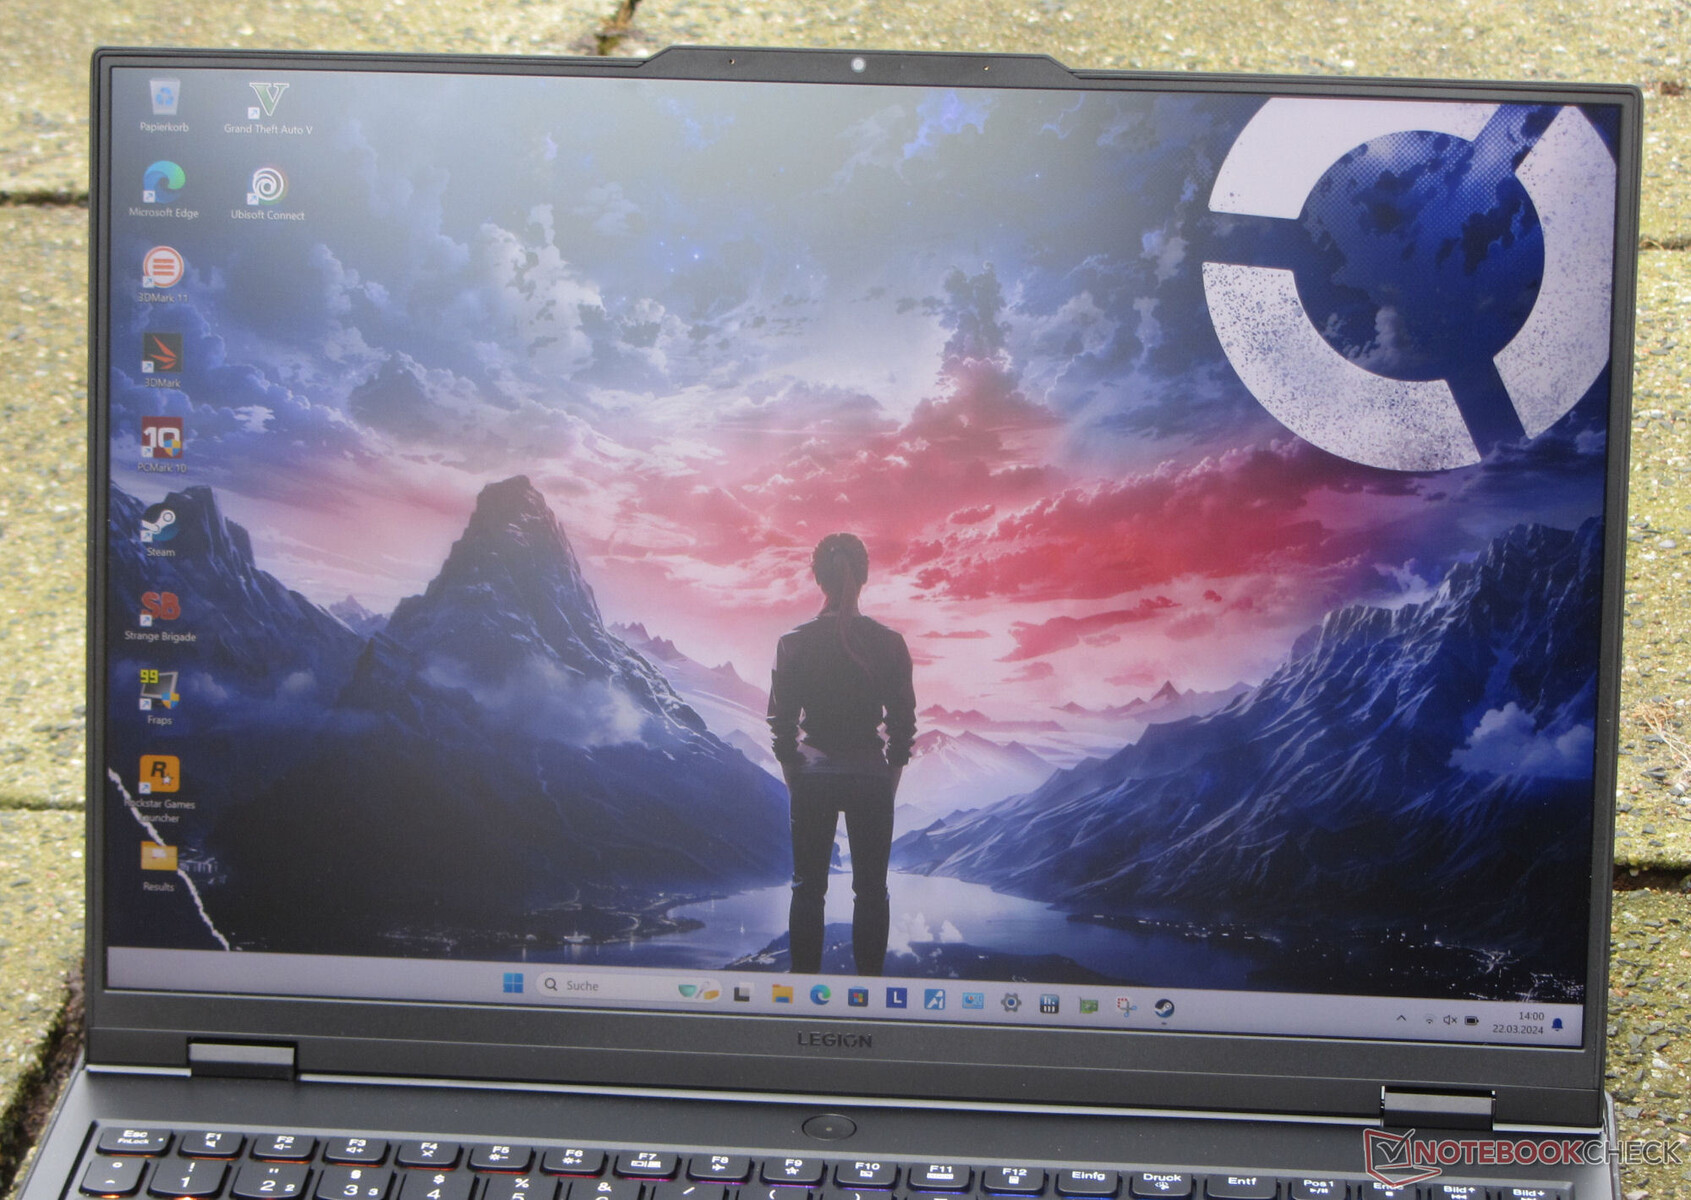
Tela - 16:10, DCI-P3, Dolby Vision
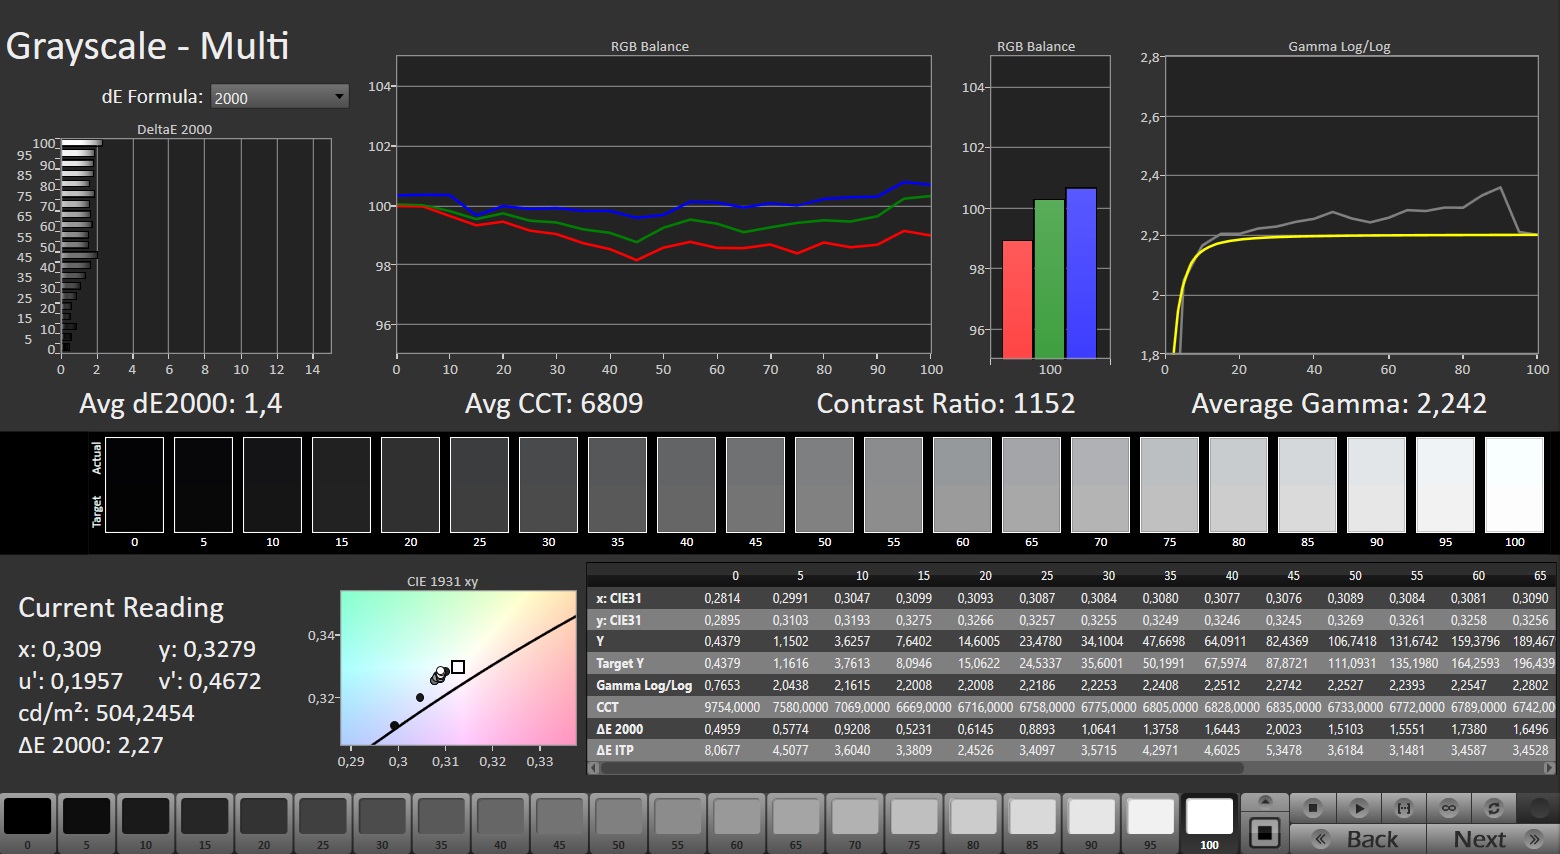
A tela IPS fosca de 16 polegadas (resolução de 2.560 x 1.600) com proporção de 16:10 apresenta suporte a G-Sync, Dolby Vision, tempo de resposta rápido e ausência de cintilação PWM. O brilho e o contraste do painel de 240 Hz também alcançaram níveis que podem ser considerados bons (> 300 cd/m² e 1.000:1 respectivamente). A Lenovo não oferece nenhuma outra opção de tela.
| |||||||||||||||||||||||||
iluminação: 88 %
iluminação com acumulador: 487 cd/m²
Contraste: 1160:1 (Preto: 0.42 cd/m²)
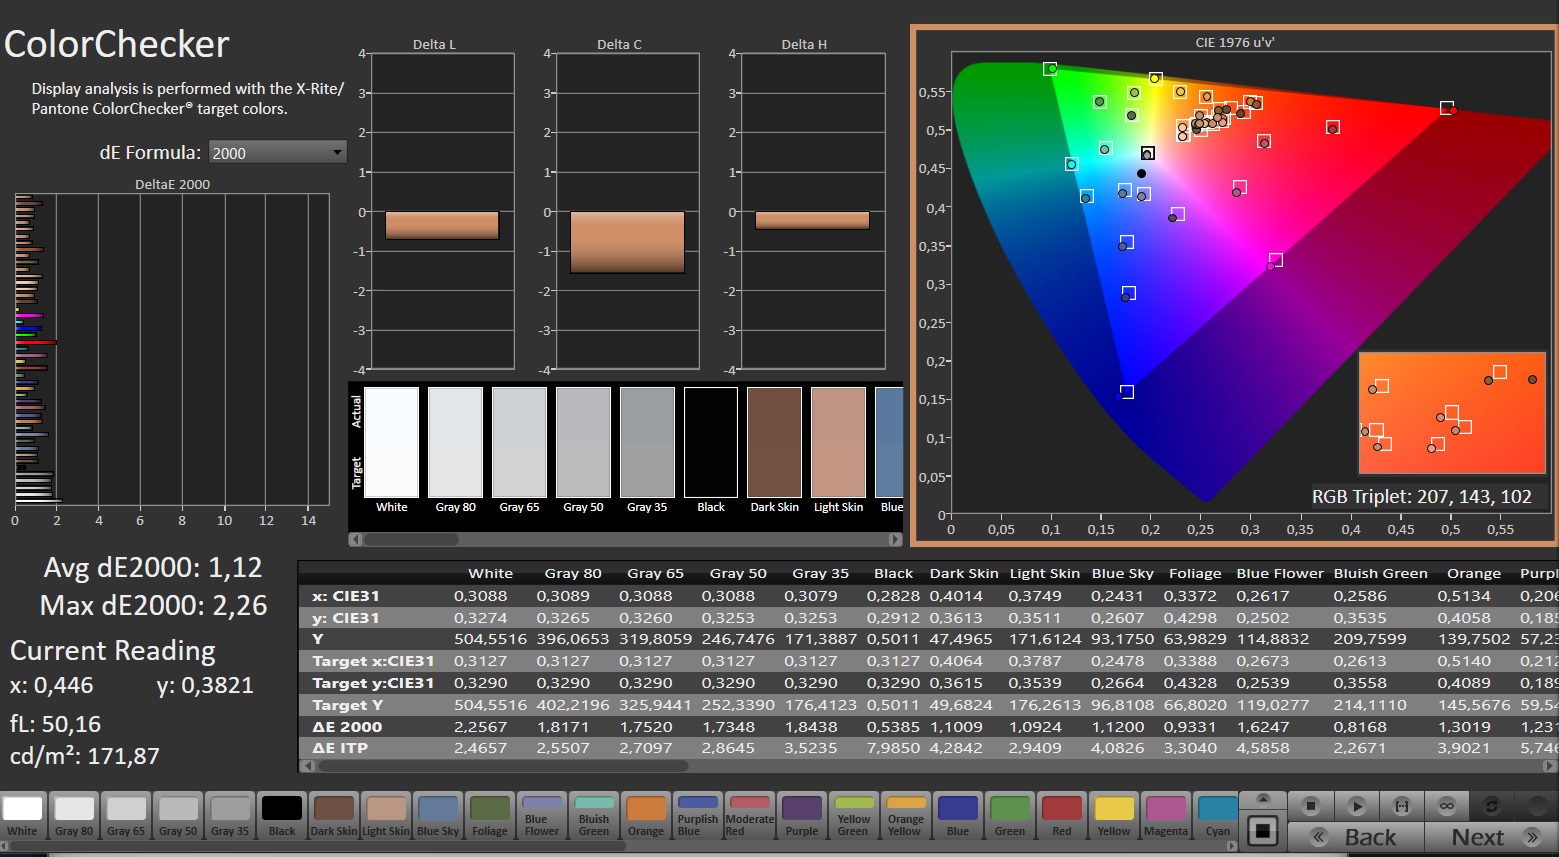
ΔE ColorChecker Calman: 1.12 | ∀{0.5-29.43 Ø4.71}
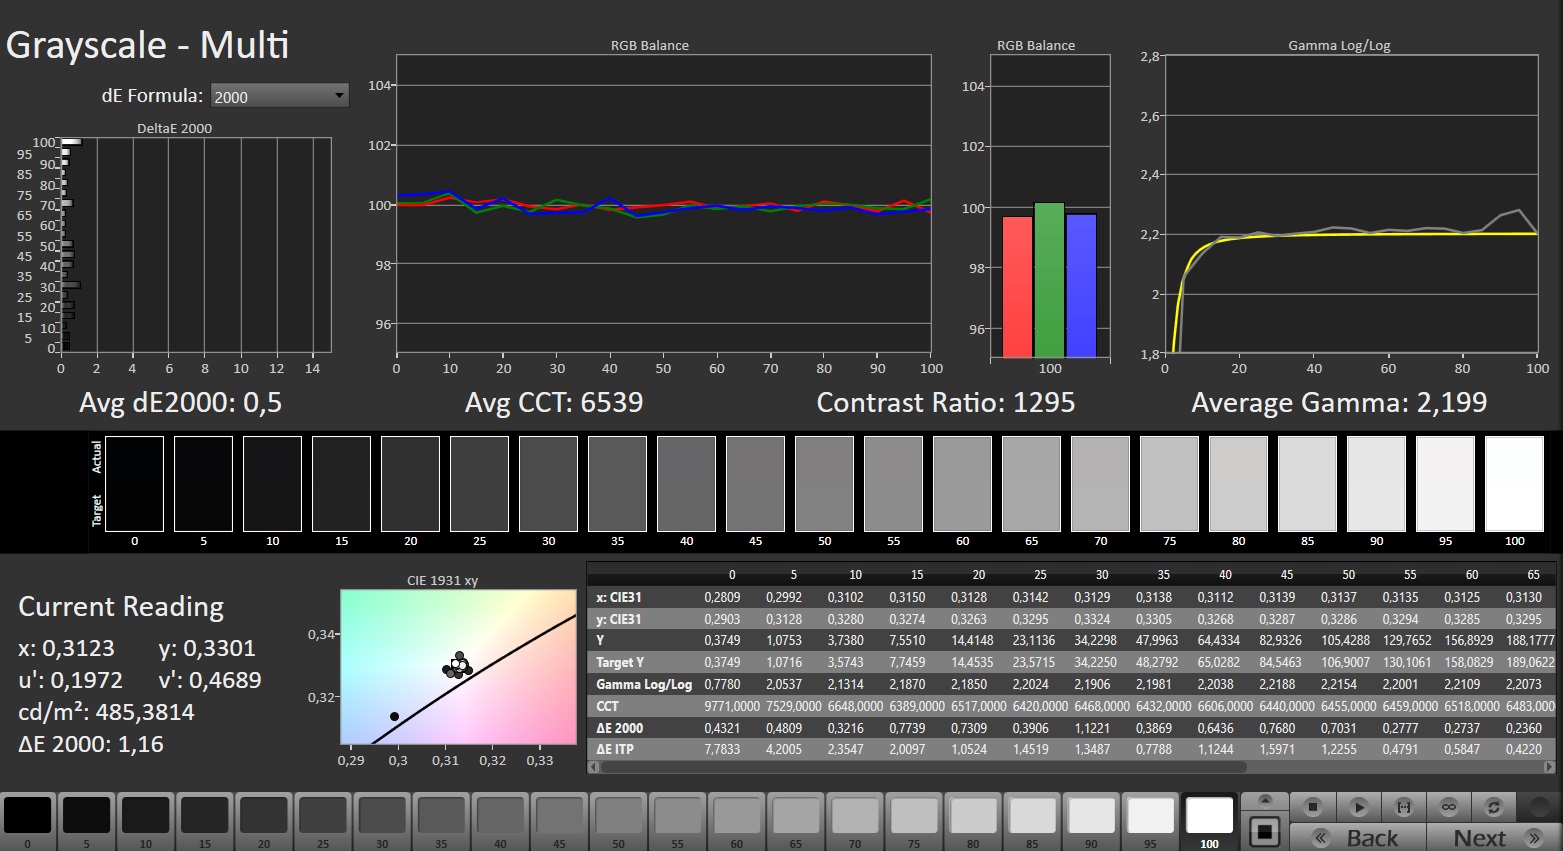
calibrated: 0.54
ΔE Greyscale Calman: 1.4 | ∀{0.09-98 Ø4.96}
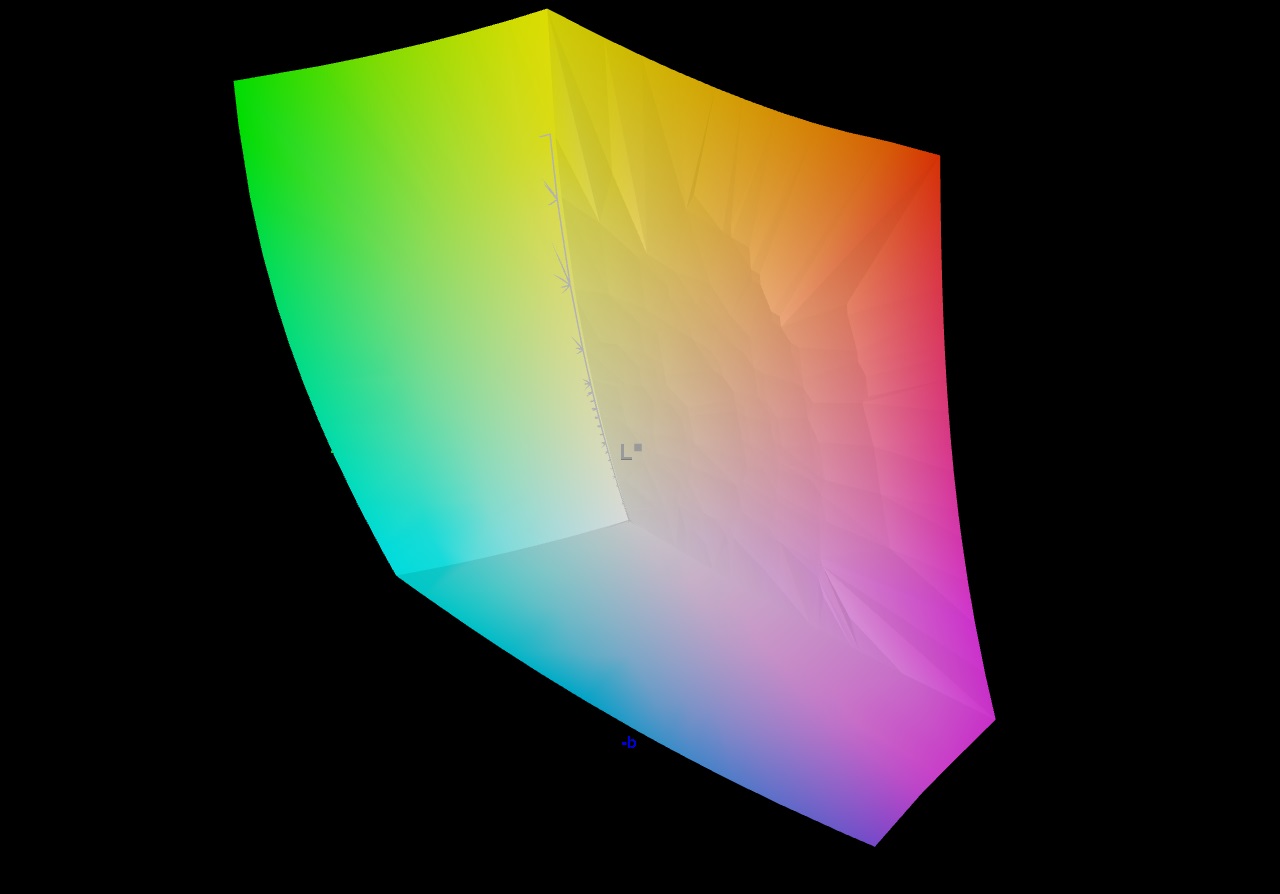
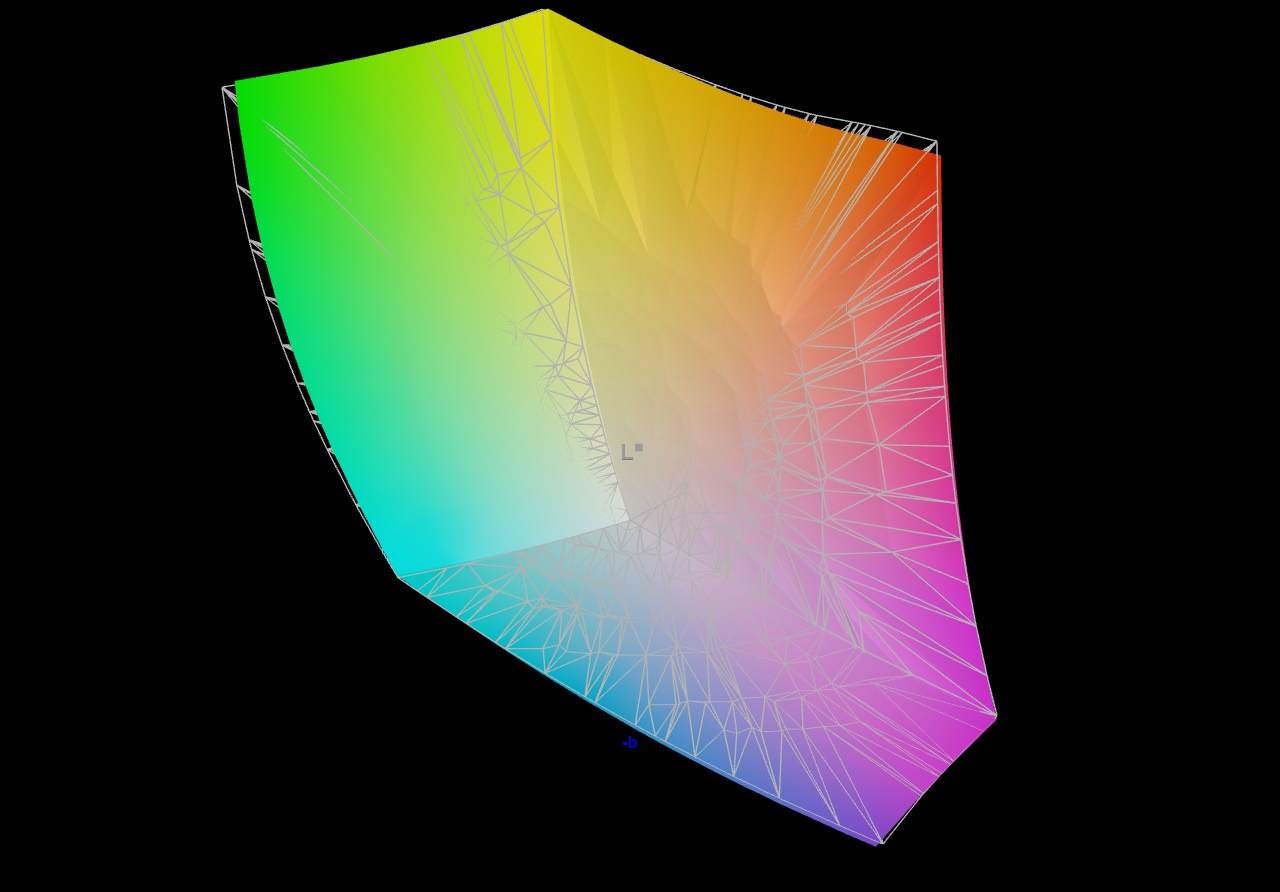
86.7% AdobeRGB 1998 (Argyll 3D)
99.9% sRGB (Argyll 3D)
98.5% Display P3 (Argyll 3D)
Gamma: 2.242
CCT: 6809 K
| Lenovo Legion Pro 7 16IRX9H BOE CQ NE16QDM-NZB, IPS, 2560x1600, 16" | Alienware m16 R1 AMD BOE NE16NZ4, IPS, 2560x1600, 16" | MSI Vector 16 HX A14V Chi Mei N160GME-GTB, IPS, 2560x1600, 16" | HP Omen 16 (2024) BOE BOE0B7D, IPS, 2560x1440, 16.1" | Lenovo Legion Pro 7 16IRX8H MNG007DA2-3 (CSO1628), IPS, 2560x1600, 16" | |
|---|---|---|---|---|---|
| Display | 1% | -1% | -17% | -16% | |
| Display P3 Coverage (%) | 98.5 | 98.6 0% | 95.4 -3% | 68.6 -30% | 69.1 -30% |
| sRGB Coverage (%) | 99.9 | 99.9 0% | 99.7 0% | 98.6 -1% | 99.7 0% |
| AdobeRGB 1998 Coverage (%) | 86.7 | 88.9 3% | 85.4 -1% | 70.6 -19% | 71.2 -18% |
| Response Times | 3% | -21% | -36% | 0% | |
| Response Time Grey 50% / Grey 80% * (ms) | 12.6 ? | 5.1 ? 60% | 5.7 ? 55% | 14.1 ? -12% | 12.3 ? 2% |
| Response Time Black / White * (ms) | 5.8 ? | 9 ? -55% | 11.4 ? -97% | 9.3 ? -60% | 5.9 ? -2% |
| PWM Frequency (Hz) | |||||
| Screen | -109% | -73% | -46% | 3% | |
| Brightness middle (cd/m²) | 487 | 329 -32% | 557.2 14% | 292 -40% | 511 5% |
| Brightness (cd/m²) | 460 | 317 -31% | 506 10% | 291 -37% | 469 2% |
| Brightness Distribution (%) | 88 | 89 1% | 83 -6% | 85 -3% | 86 -2% |
| Black Level * (cd/m²) | 0.42 | 0.32 24% | 0.41 2% | 0.24 43% | 0.4 5% |
| Contrast (:1) | 1160 | 1028 -11% | 1359 17% | 1217 5% | 1278 10% |
| Colorchecker dE 2000 * | 1.12 | 3.71 -231% | 2.91 -160% | 2.36 -111% | 0.95 15% |
| Colorchecker dE 2000 max. * | 2.26 | 7.23 -220% | 5.94 -163% | 4.08 -81% | 2.07 8% |
| Colorchecker dE 2000 calibrated * | 0.54 | 2.82 -422% | 1.63 -202% | 0.93 -72% | 0.91 -69% |
| Greyscale dE 2000 * | 1.4 | 2.2 -57% | 3.8 -171% | 3 -114% | 0.6 57% |
| Gamma | 2.242 98% | 2.3 96% | 2.23 99% | 2.101 105% | 2.176 101% |
| CCT | 6809 95% | 6270 104% | 6408 101% | 5976 109% | 6545 99% |
| Média Total (Programa/Configurações) | -35% /
-69% | -32% /
-50% | -33% /
-38% | -4% /
-1% |
* ... menor é melhor
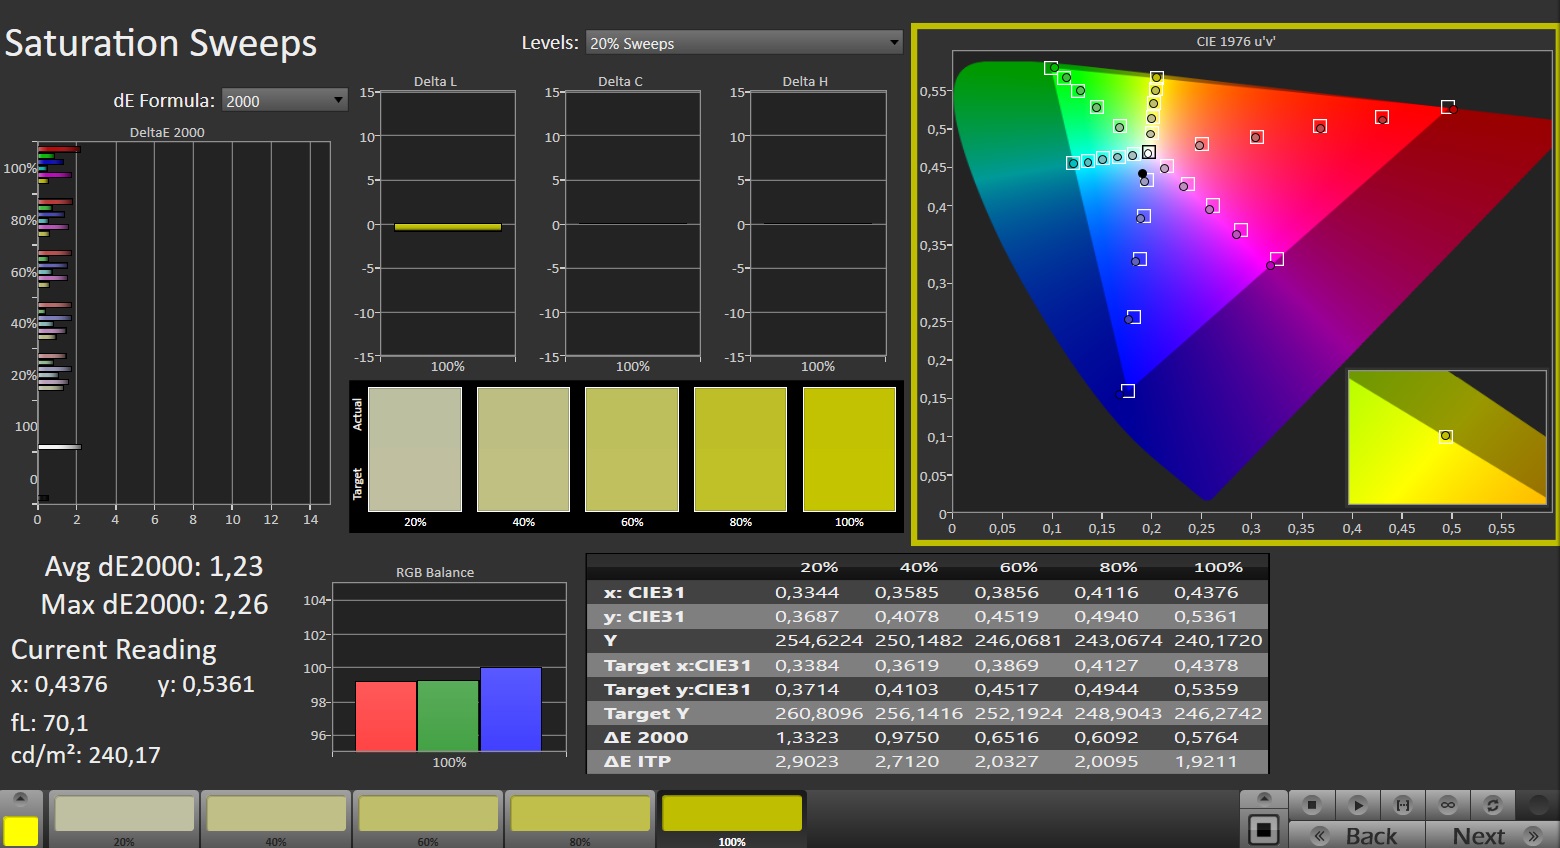
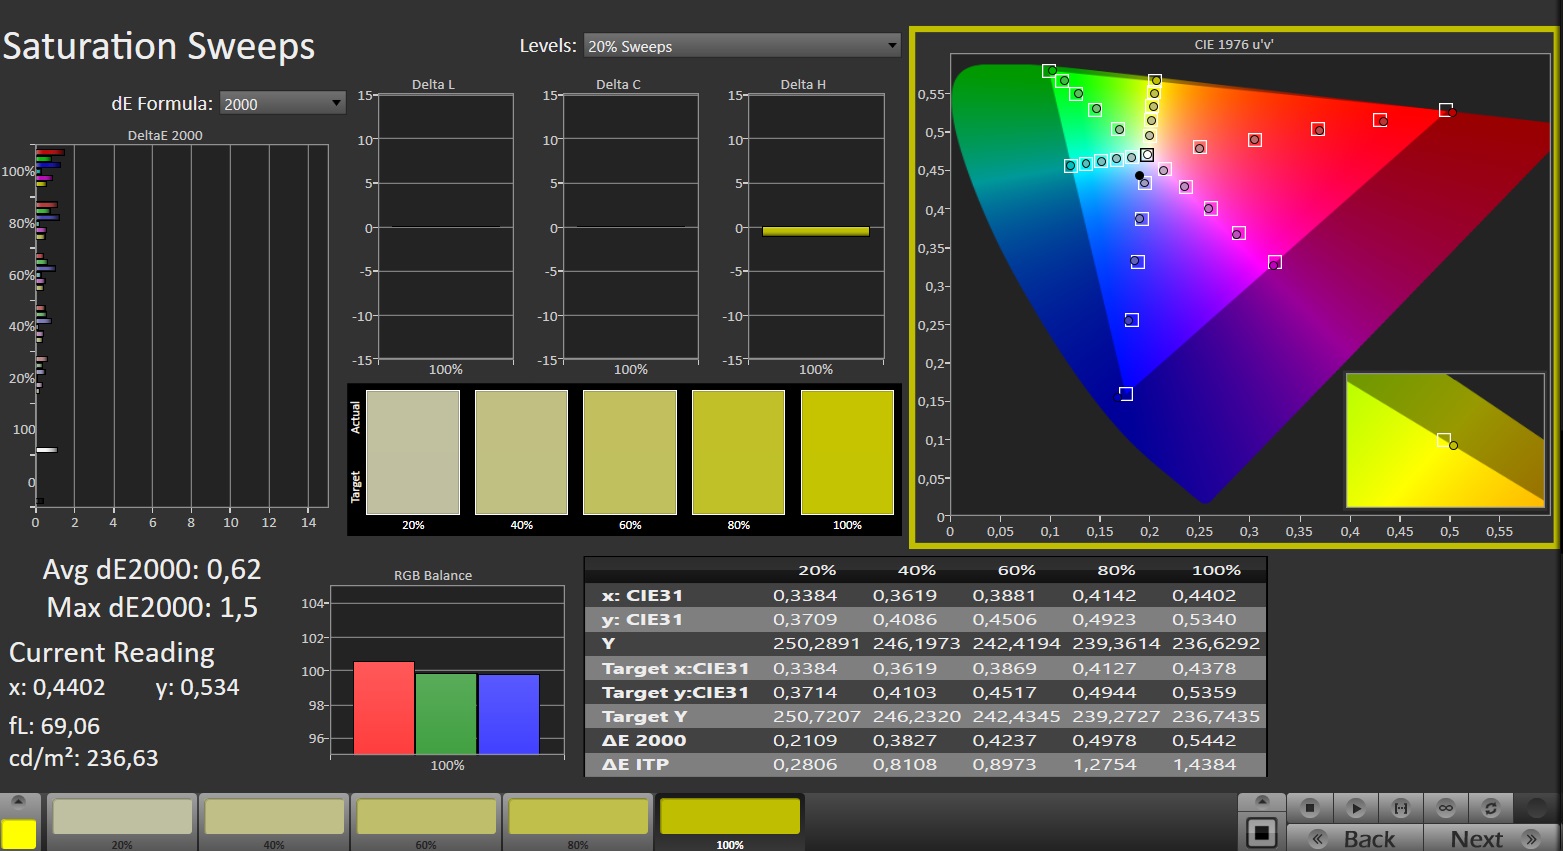
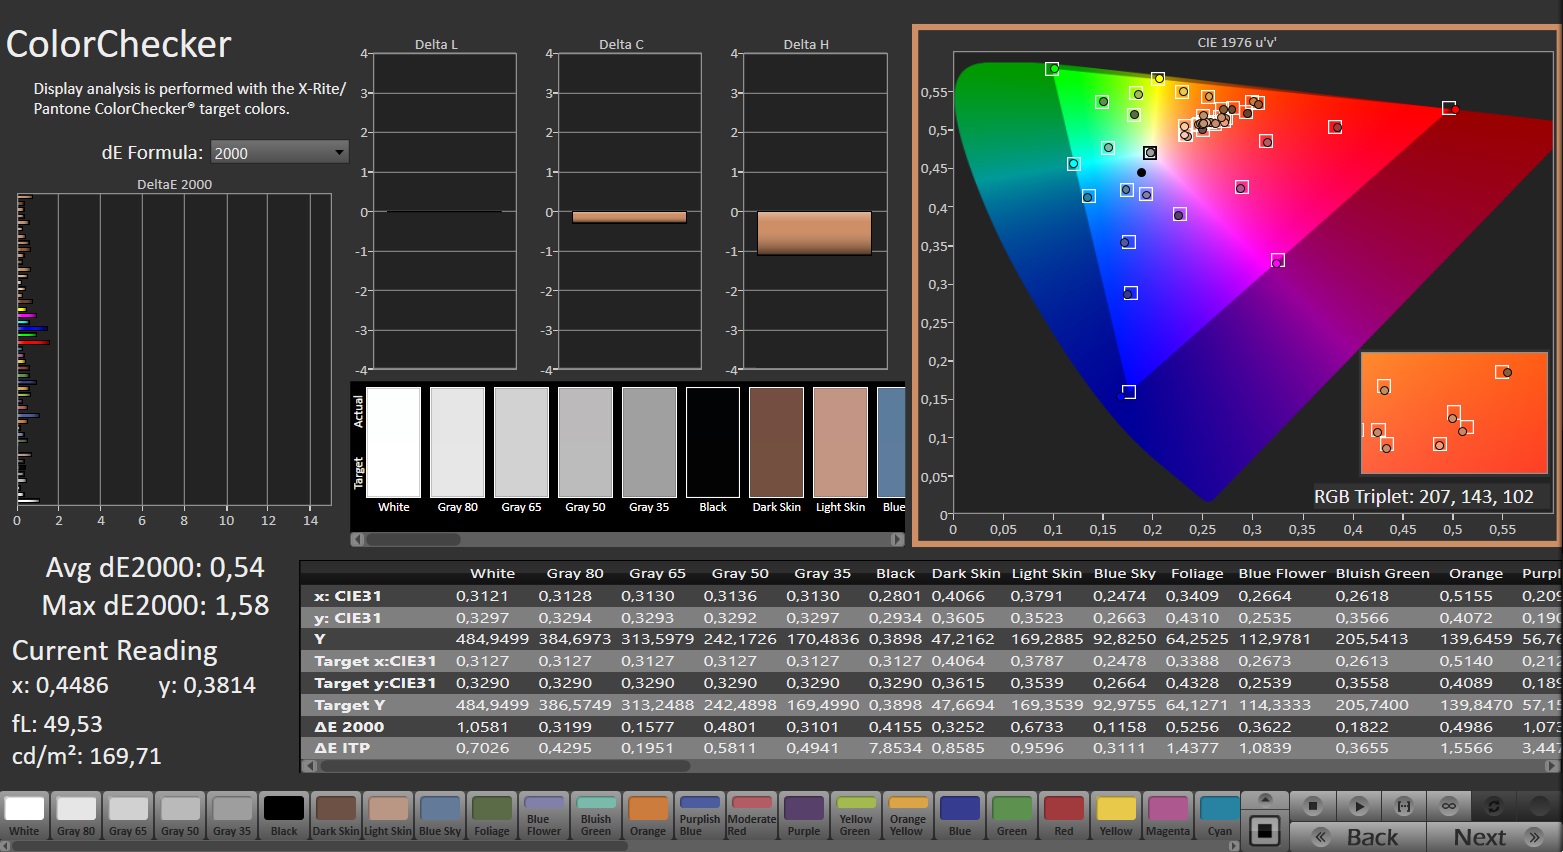
A tela já apresentava uma fantástica reprodução de cores logo ao sair da caixa. Ela apresentou um Delta E de cerca de 1,1, atingindo o nível desejado de menos de 3. A calibração da tela reduziu a diferença média de cores para 0,54 e produziu uma escala de cinza mais equilibrada. O painel é capaz de cobrir totalmente as gamas sRGB e DCI-P3, mas não o espaço de cores AdobeRGB. Isso é semelhante ao que é oferecido pelas telas da maioria dos laptops concorrentes.

Exibir tempos de resposta
| ↔ Tempo de resposta preto para branco | ||
|---|---|---|
| 5.8 ms ... ascensão ↗ e queda ↘ combinadas | ↗ 2.1 ms ascensão | 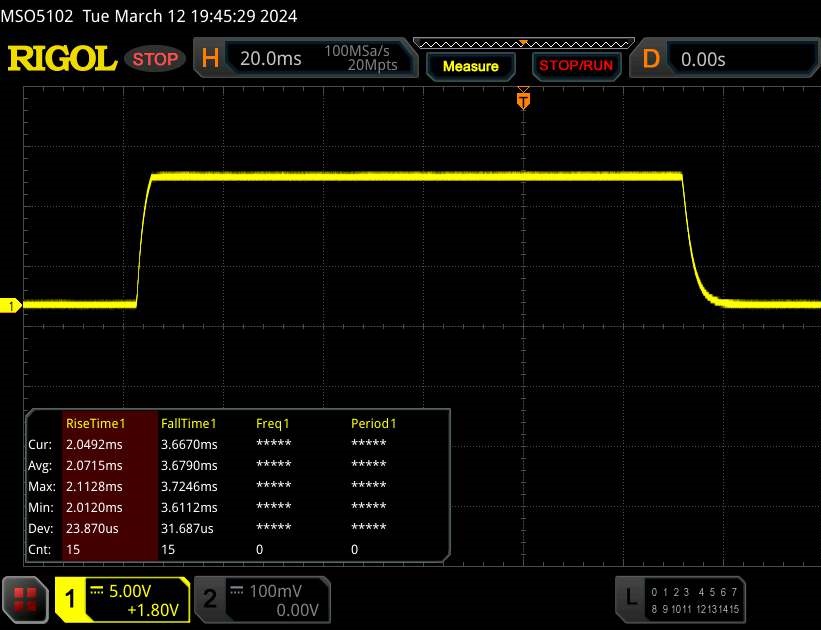 |
| ↘ 3.7 ms queda | ||
| A tela mostra taxas de resposta muito rápidas em nossos testes e deve ser muito adequada para jogos em ritmo acelerado. Em comparação, todos os dispositivos testados variam de 0.1 (mínimo) a 240 (máximo) ms. » 18 % de todos os dispositivos são melhores. Isso significa que o tempo de resposta medido é melhor que a média de todos os dispositivos testados (19.8 ms). | ||
| ↔ Tempo de resposta 50% cinza a 80% cinza | ||
| 12.6 ms ... ascensão ↗ e queda ↘ combinadas | ↗ 6 ms ascensão | 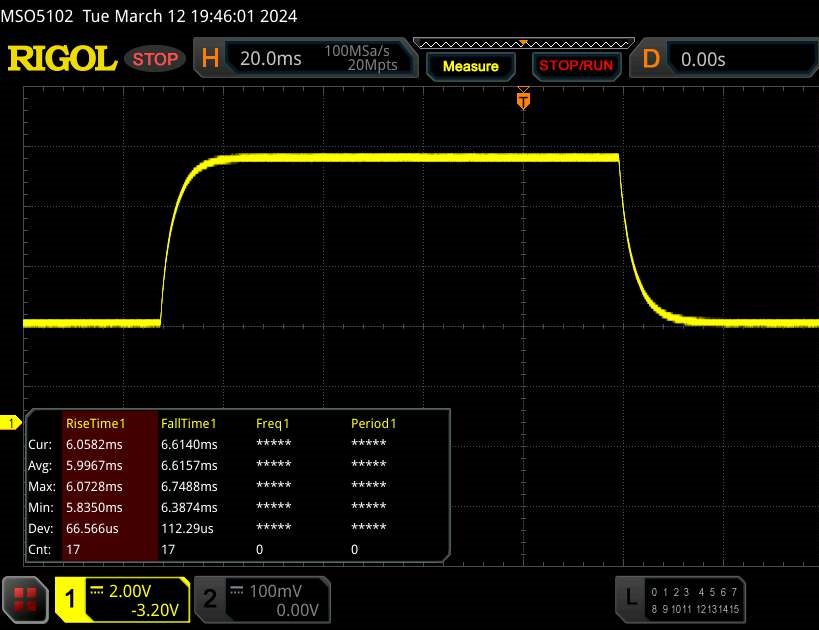 |
| ↘ 6.6 ms queda | ||
| A tela mostra boas taxas de resposta em nossos testes, mas pode ser muito lenta para jogadores competitivos. Em comparação, todos os dispositivos testados variam de 0.165 (mínimo) a 636 (máximo) ms. » 26 % de todos os dispositivos são melhores. Isso significa que o tempo de resposta medido é melhor que a média de todos os dispositivos testados (31 ms). | ||
Cintilação da tela / PWM (modulação por largura de pulso)
| Tela tremeluzindo / PWM não detectado | 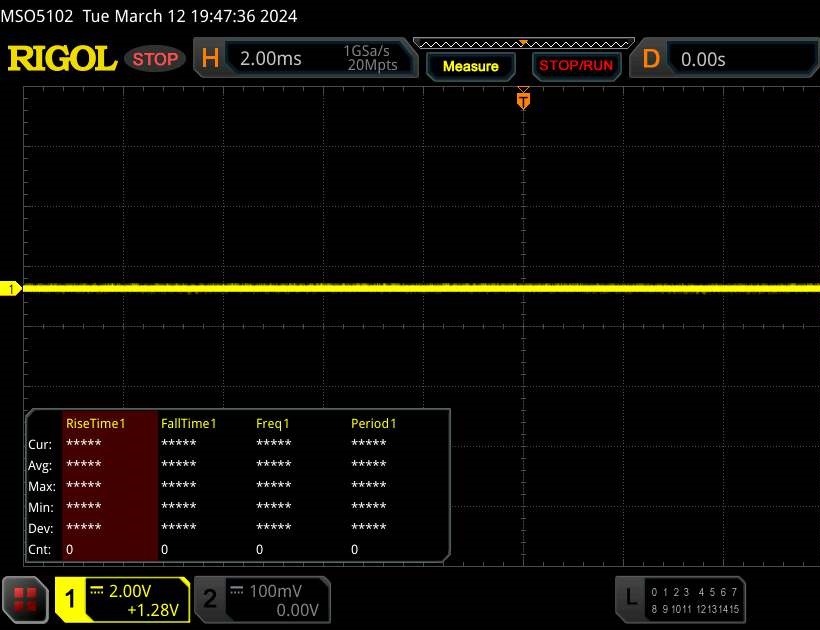 | ||
[pwm_comparison] Em comparação: 52 % de todos os dispositivos testados não usam PWM para escurecer a tela. Se PWM foi detectado, uma média de 7757 (mínimo: 5 - máximo: 343500) Hz foi medida. | |||
O painel IPS tem um ângulo de visão amplo e pode ser lido de qualquer posição. É possível usar a tela em ambientes externos, desde que o sol não seja muito forte.
Leistung - Hardware de ponta da Intel e da Nvidia
O Lenovo Legion Pro 7 é um notebook de 16 polegadas de alto desempenho criado para gamers e criadores. A potência de computação necessária é fornecida pelo Raptor Lake e Ada Lovelace. Nosso modelo de análise pode ser adquirido por pouco menos de € 3.000 (aproximadamente US$ 3.245) com um desconto para educação. Ainda não há outras variantes disponíveis no momento desta análise.
Condições de teste
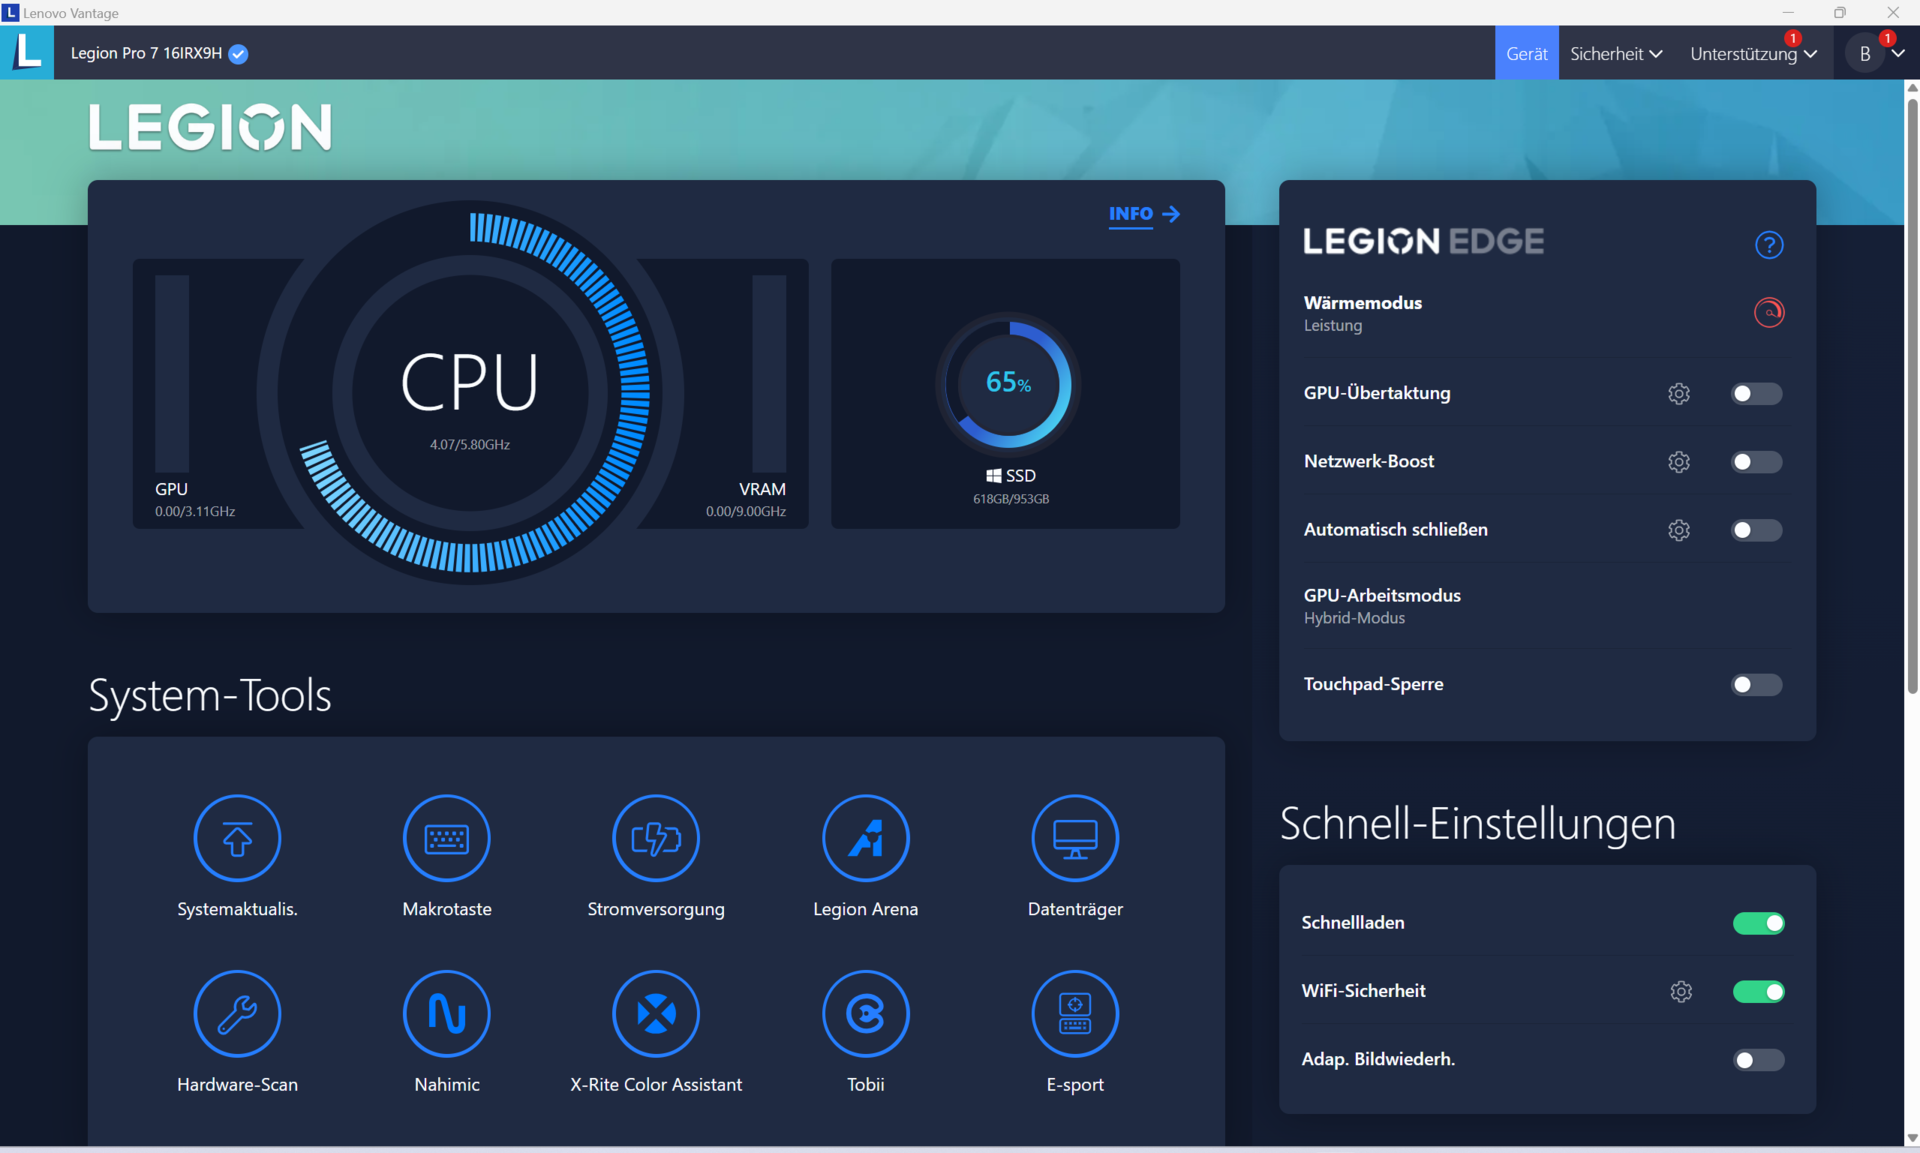
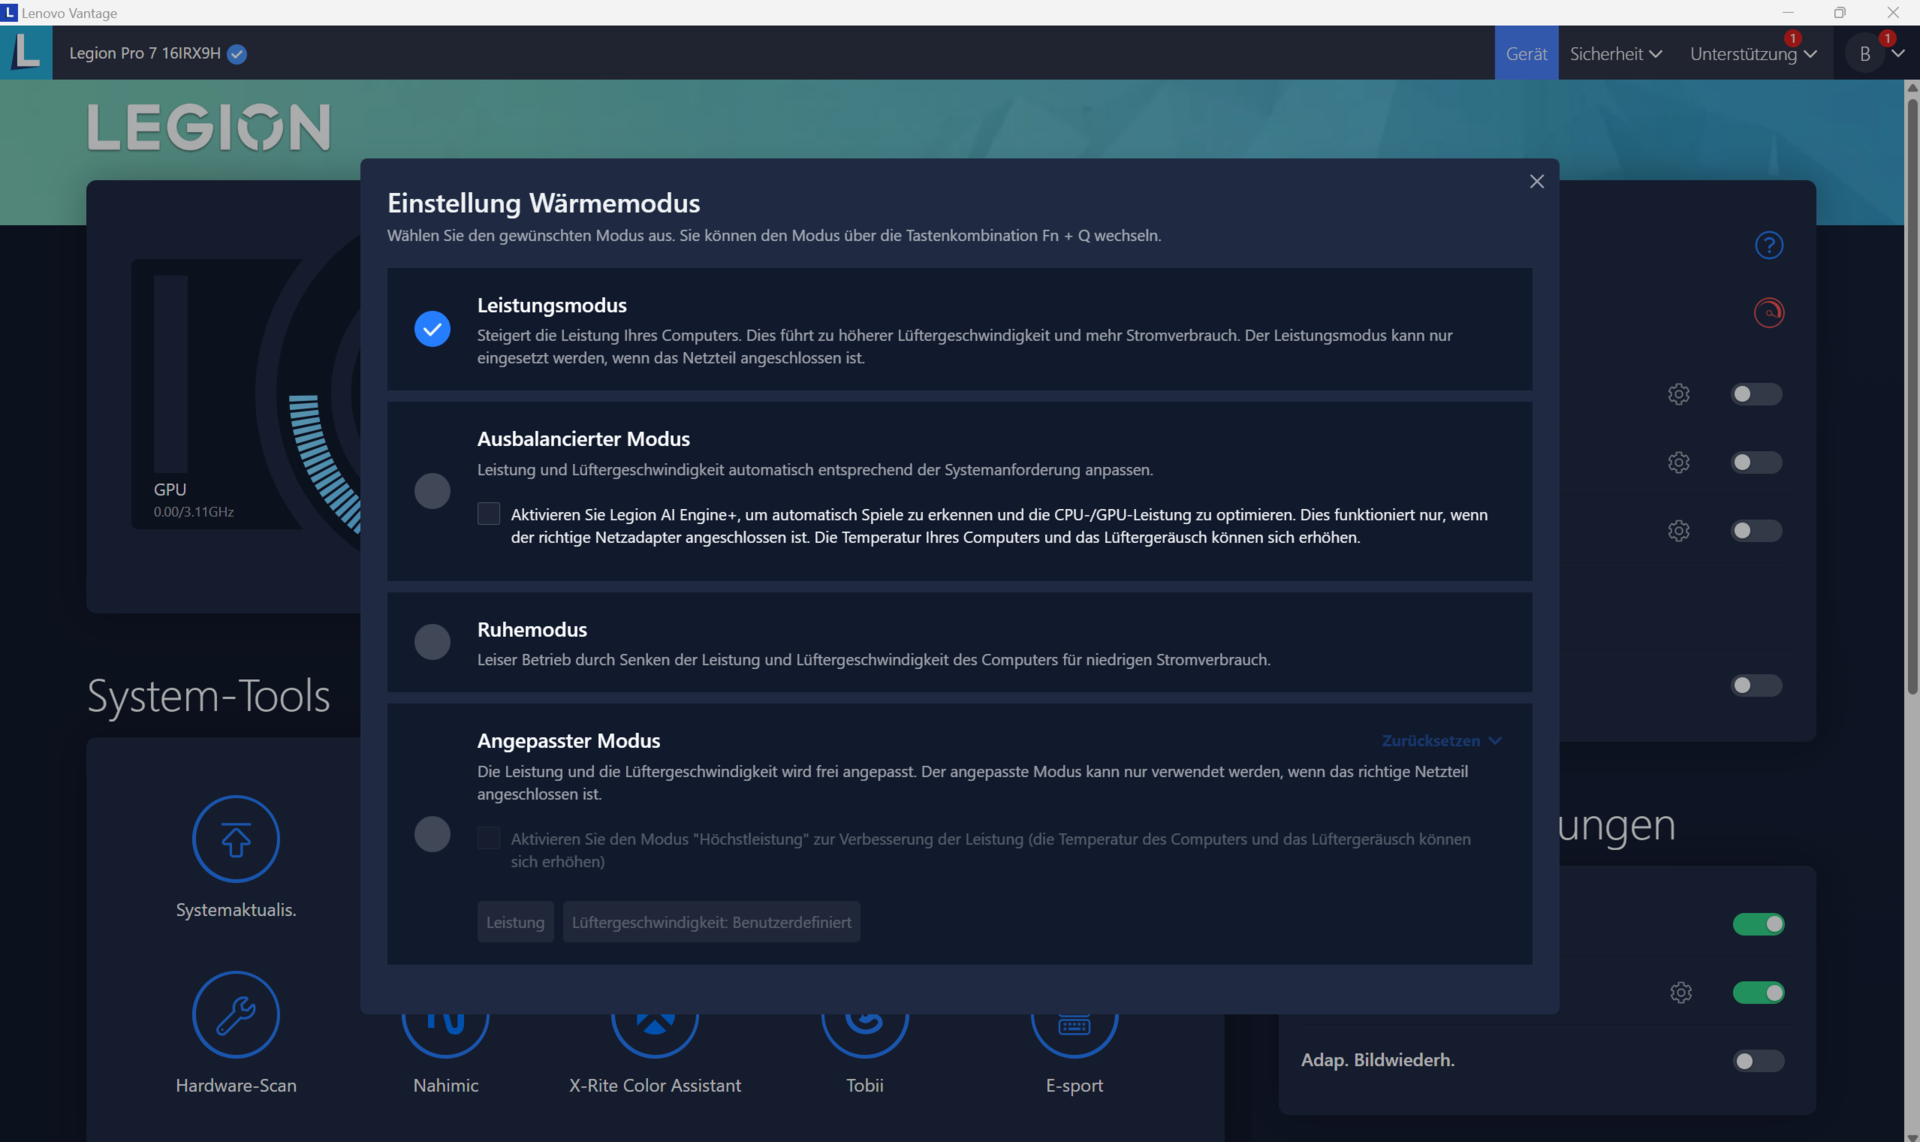
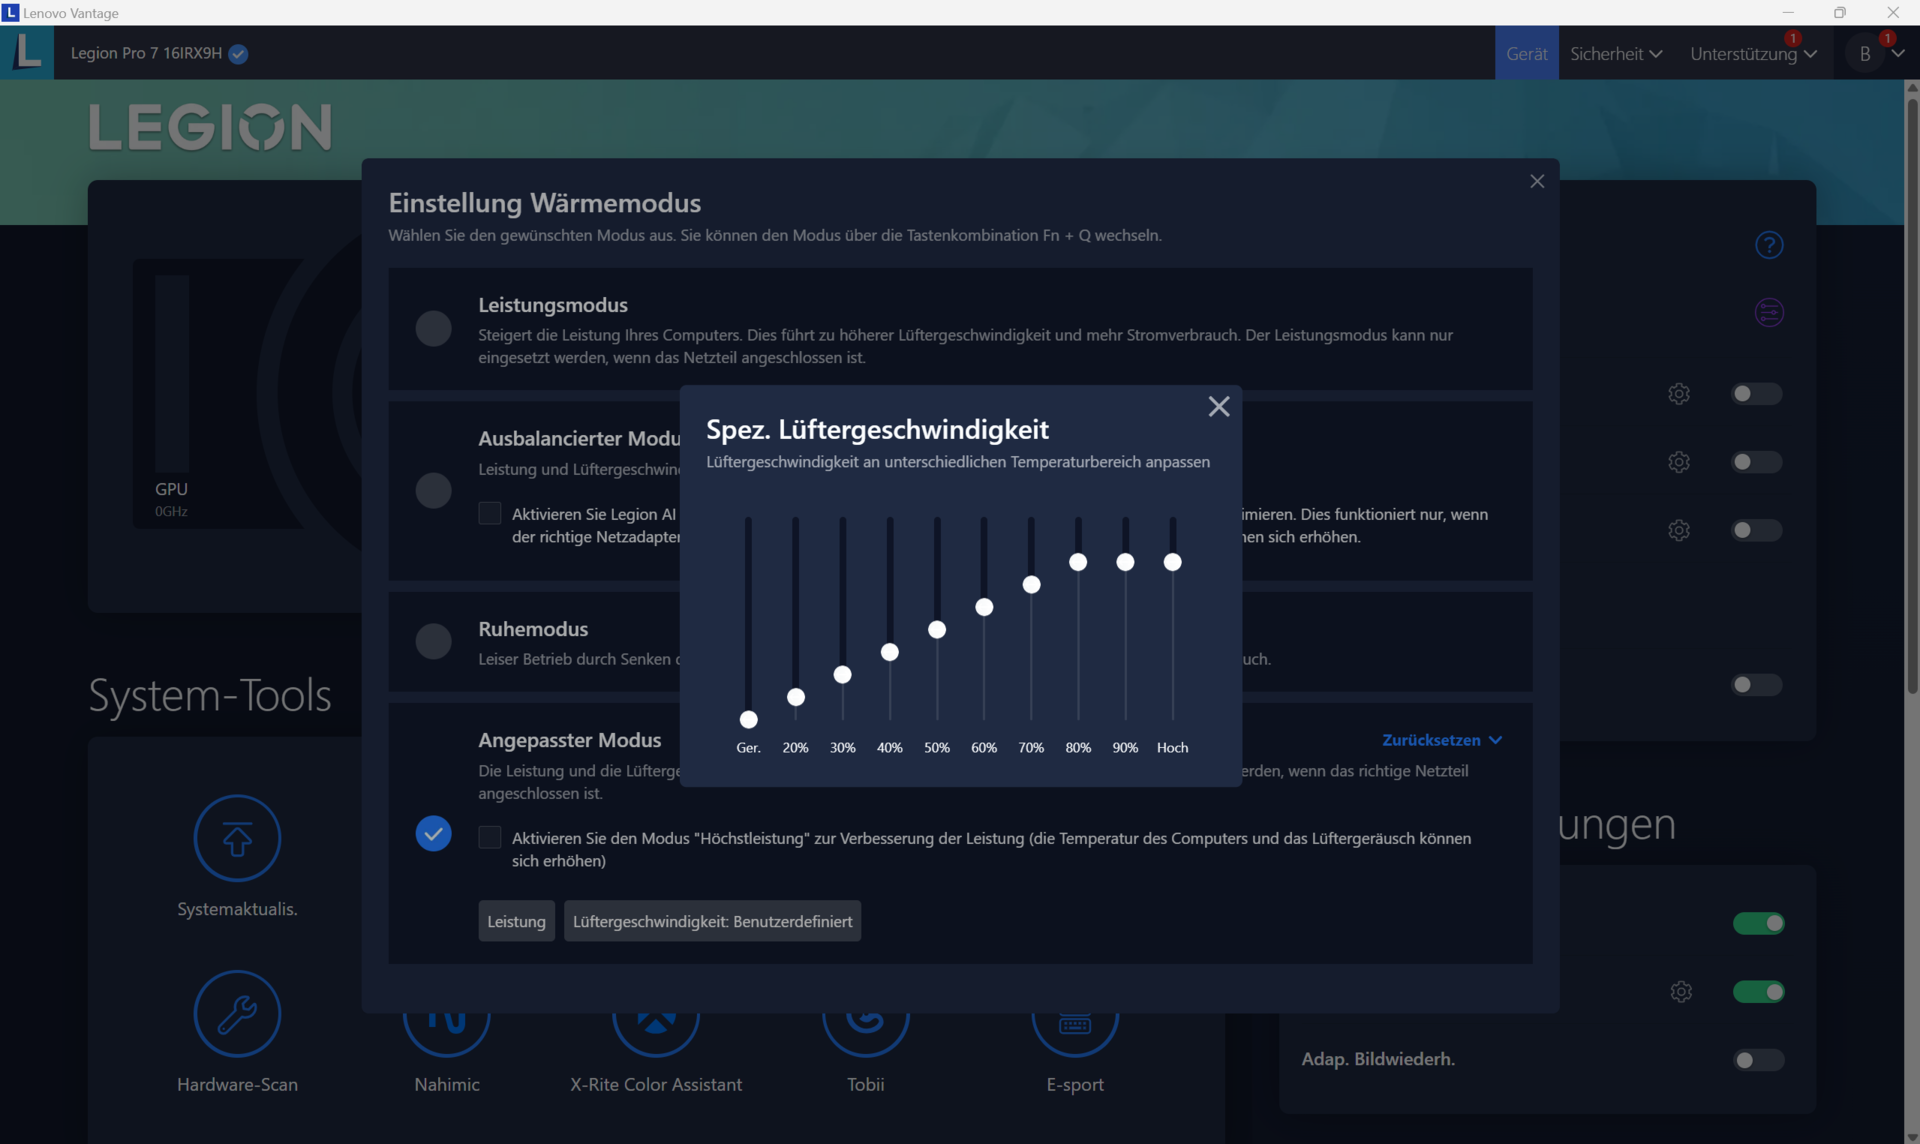
O notebook oferece três modos de desempenho específicos do fabricante (consulte a tabela). O senhor pode alternar entre eles usando a combinação de teclas Fn + Q. Usamos os modos Desempenho e Silencioso para nossos benchmarks e teste de bateria, respectivamente.
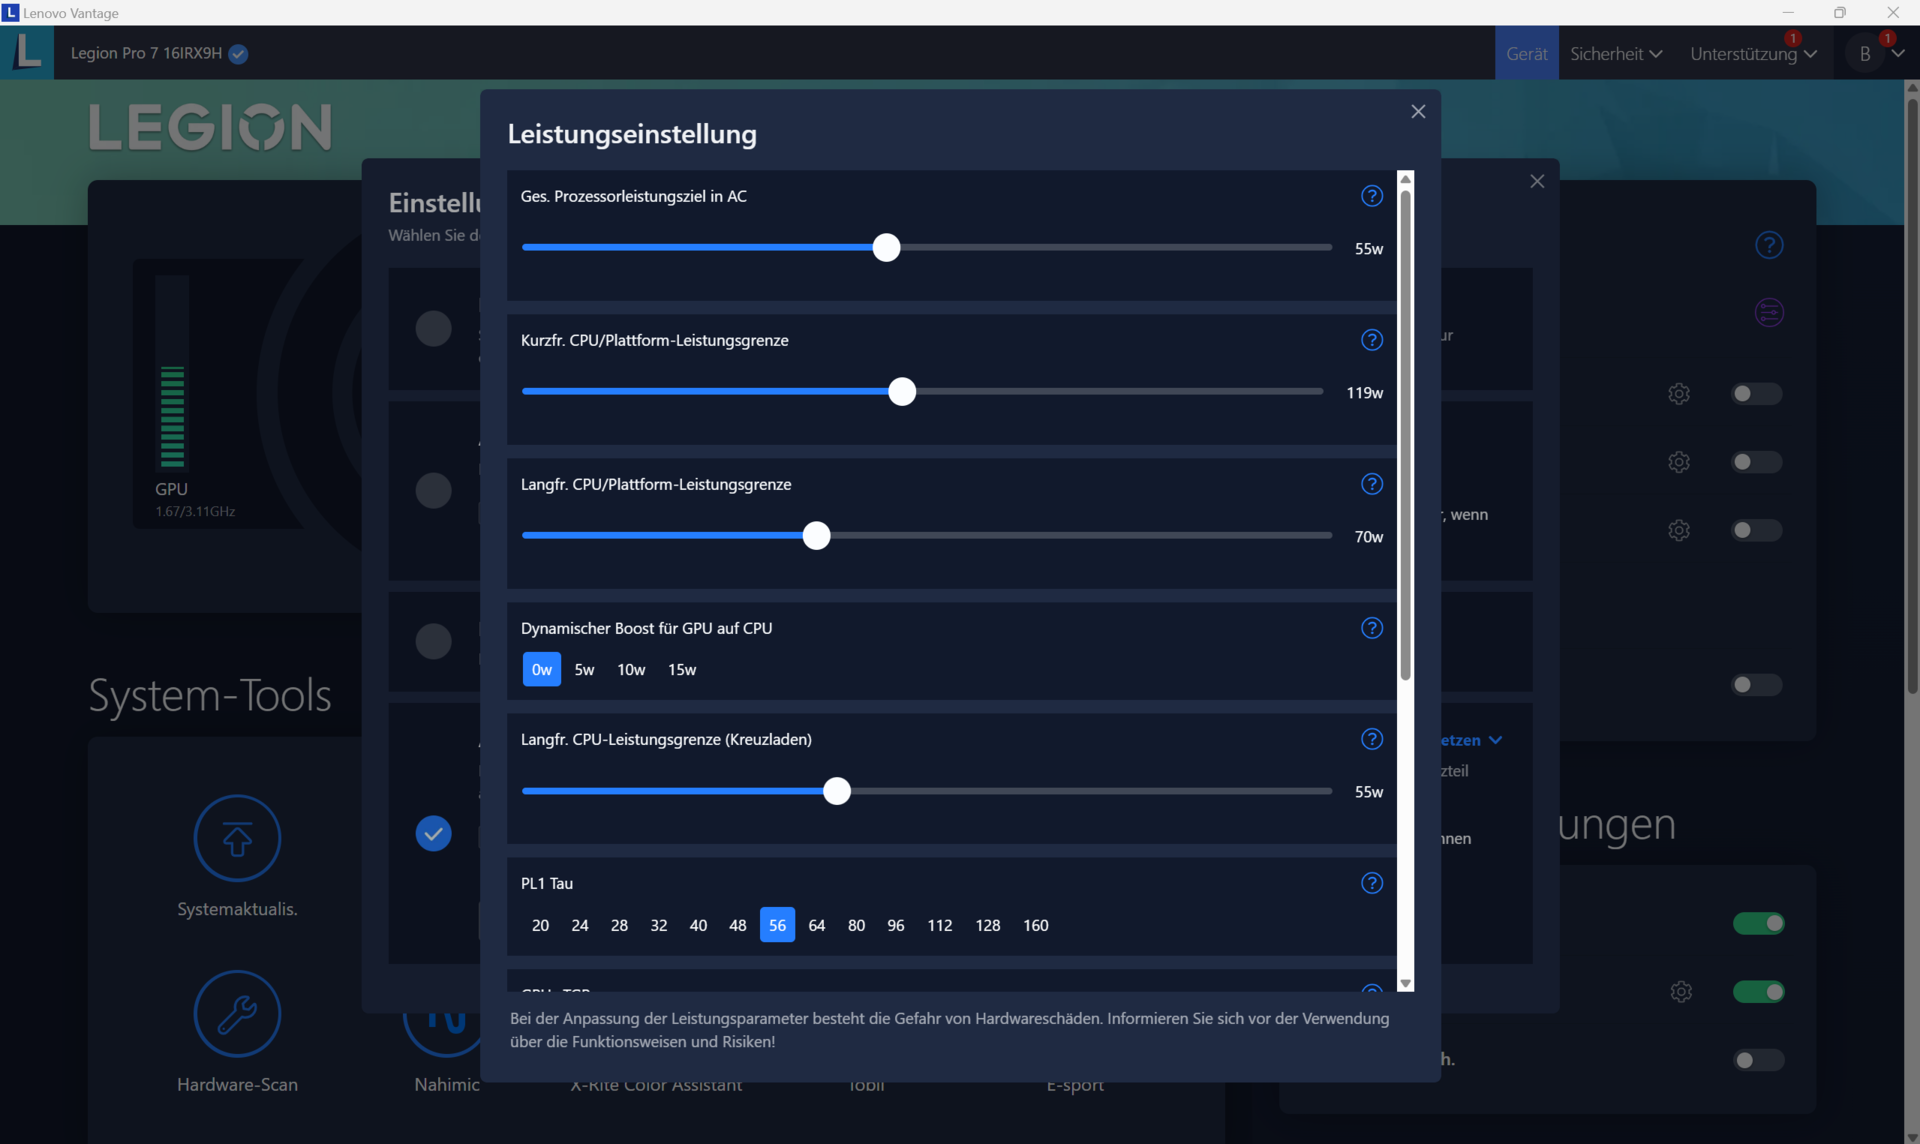
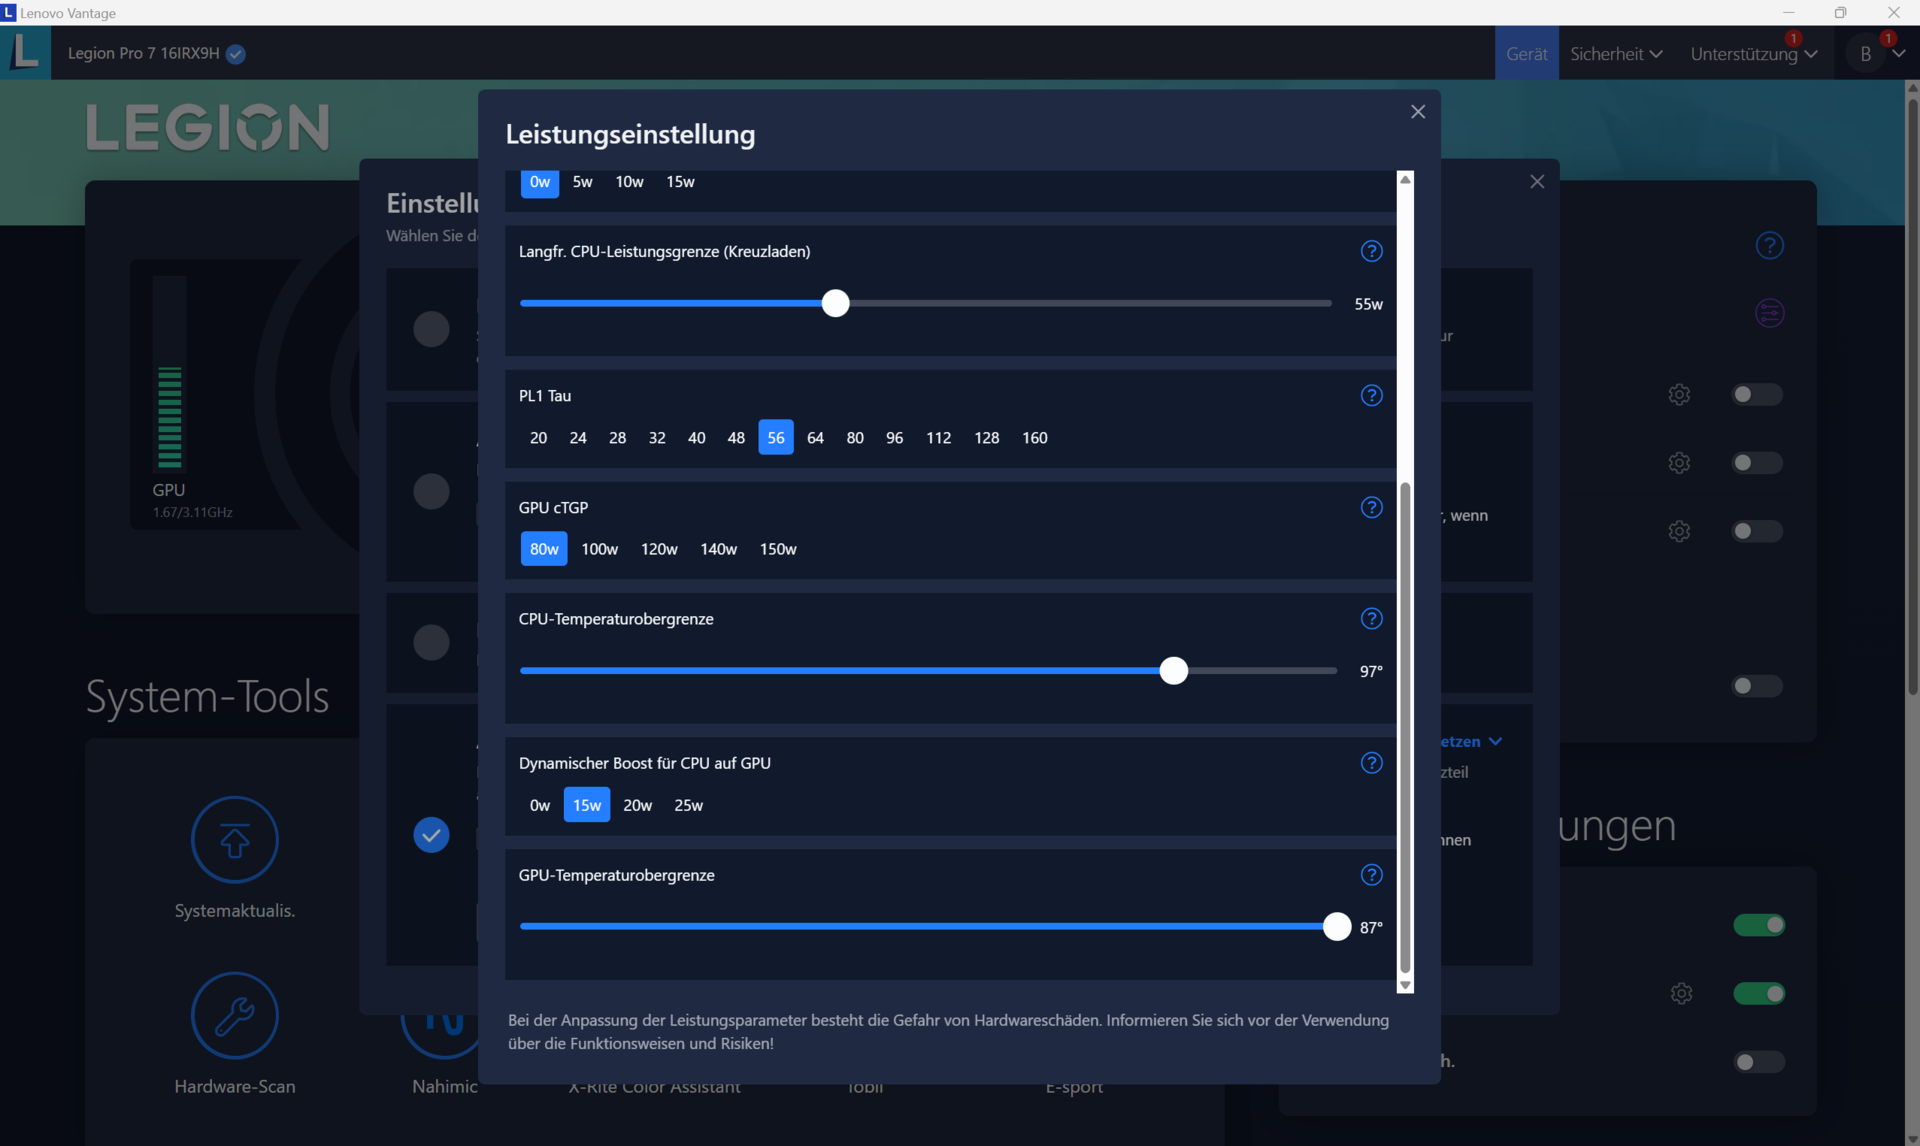
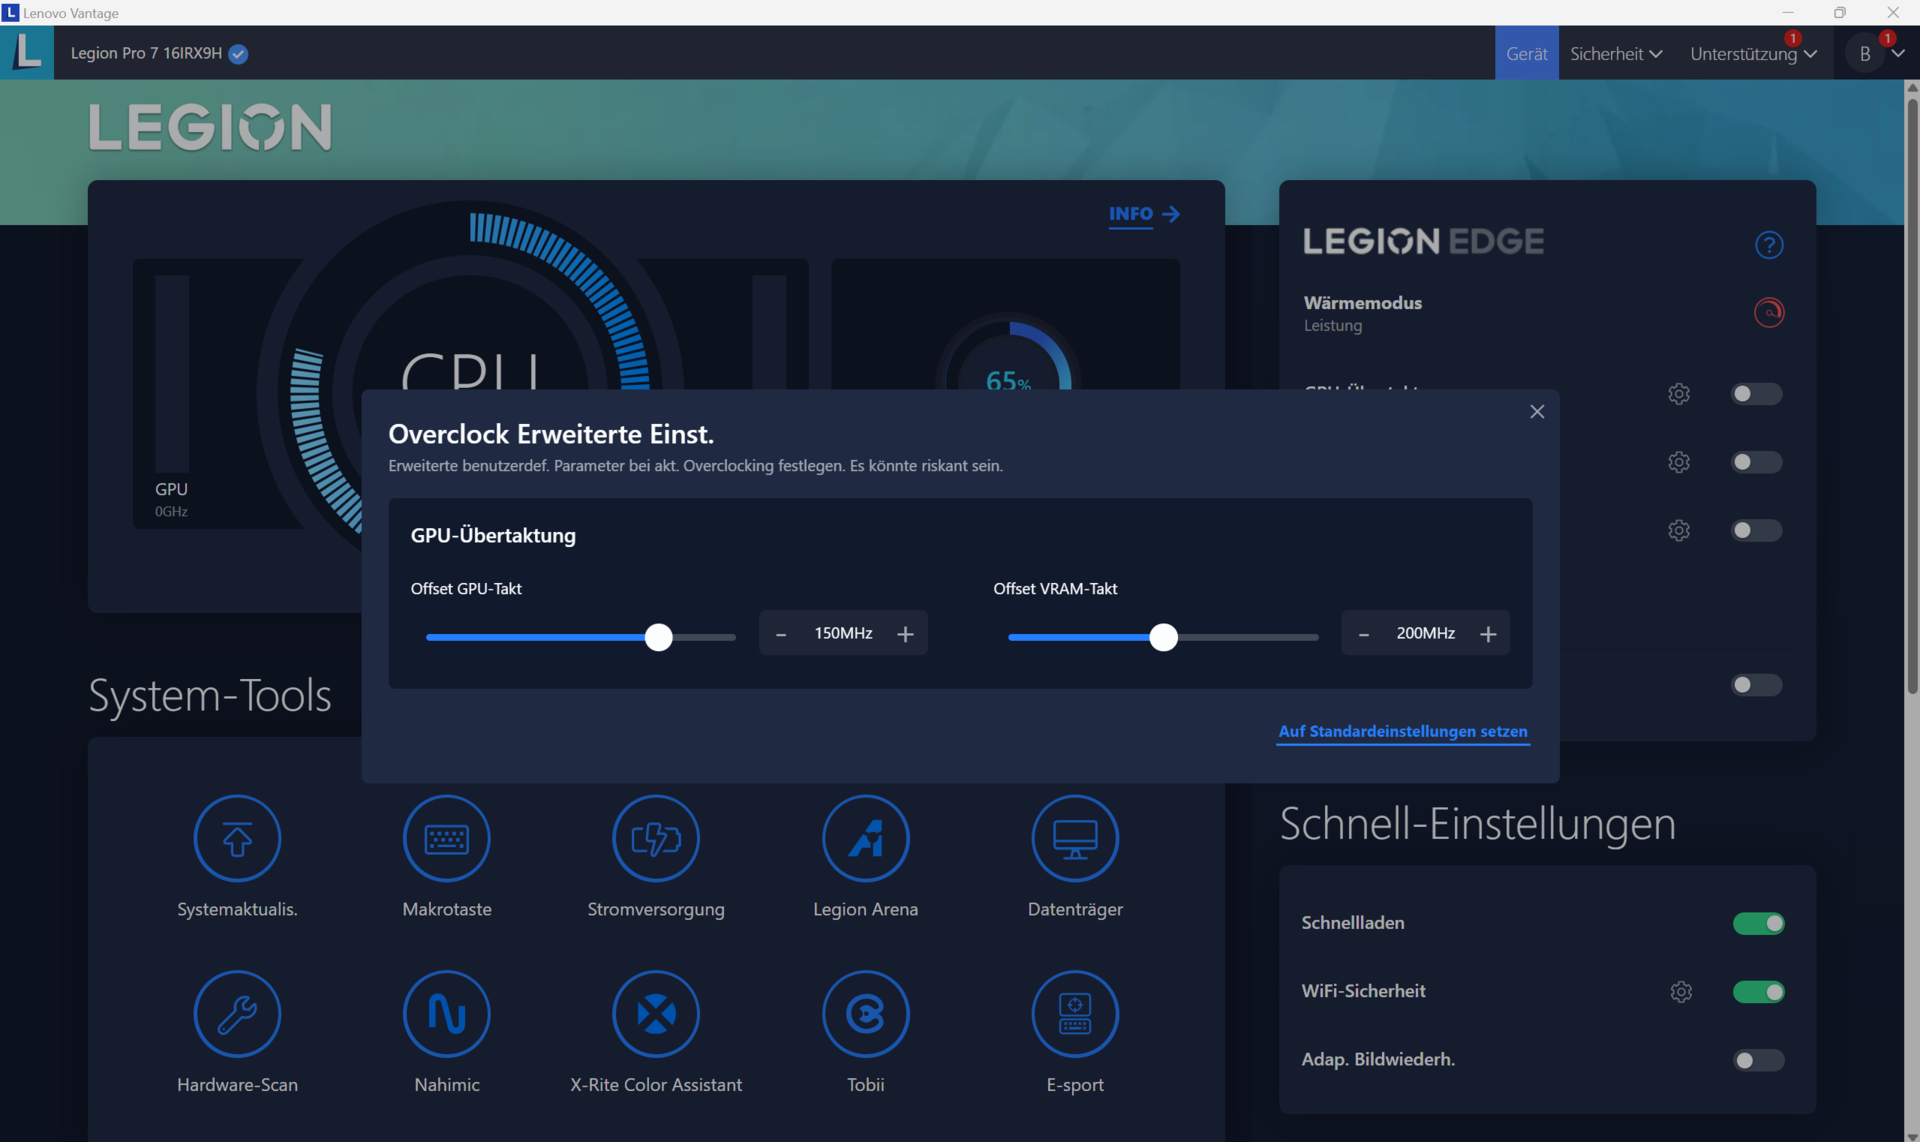
Há também um quarto modo disponível no Lenovo Vantage (o centro de controle do notebook): Modo personalizado. Esse modo permite especificar as configurações de desempenho do processador (limite de energia) e da placa de vídeo (TGP, Dynamic Boost e limite de temperatura), bem como ajustar a velocidade da ventoinha. Além disso, é possível fazer overclock da GPU e da memória gráfica, independentemente do perfil selecionado.
| Modo de desempenho | Modo balanceado | Modo silencioso | |
|---|---|---|---|
| Limite de energia 1 (HWInfo) | 130 Watt | 80 Watt | 55 Watt |
| Limite de potência 2 (HWInfo) | 185 Watt | 119 Watt | 65 Watt |
| Ruído (Witcher 3) | 54 dB(A) | 45 dB(A) | 33 dB(A) |
| Desempenho (Witcher 3) | ~184 fps | ~160 fps | 40 fps (bloqueado) |

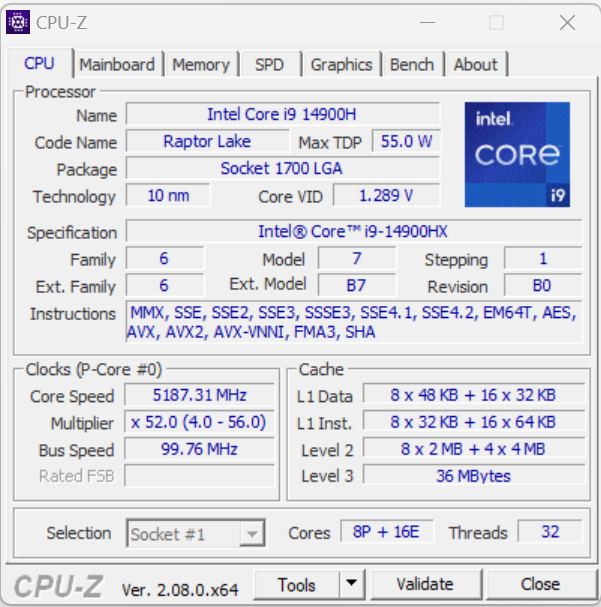
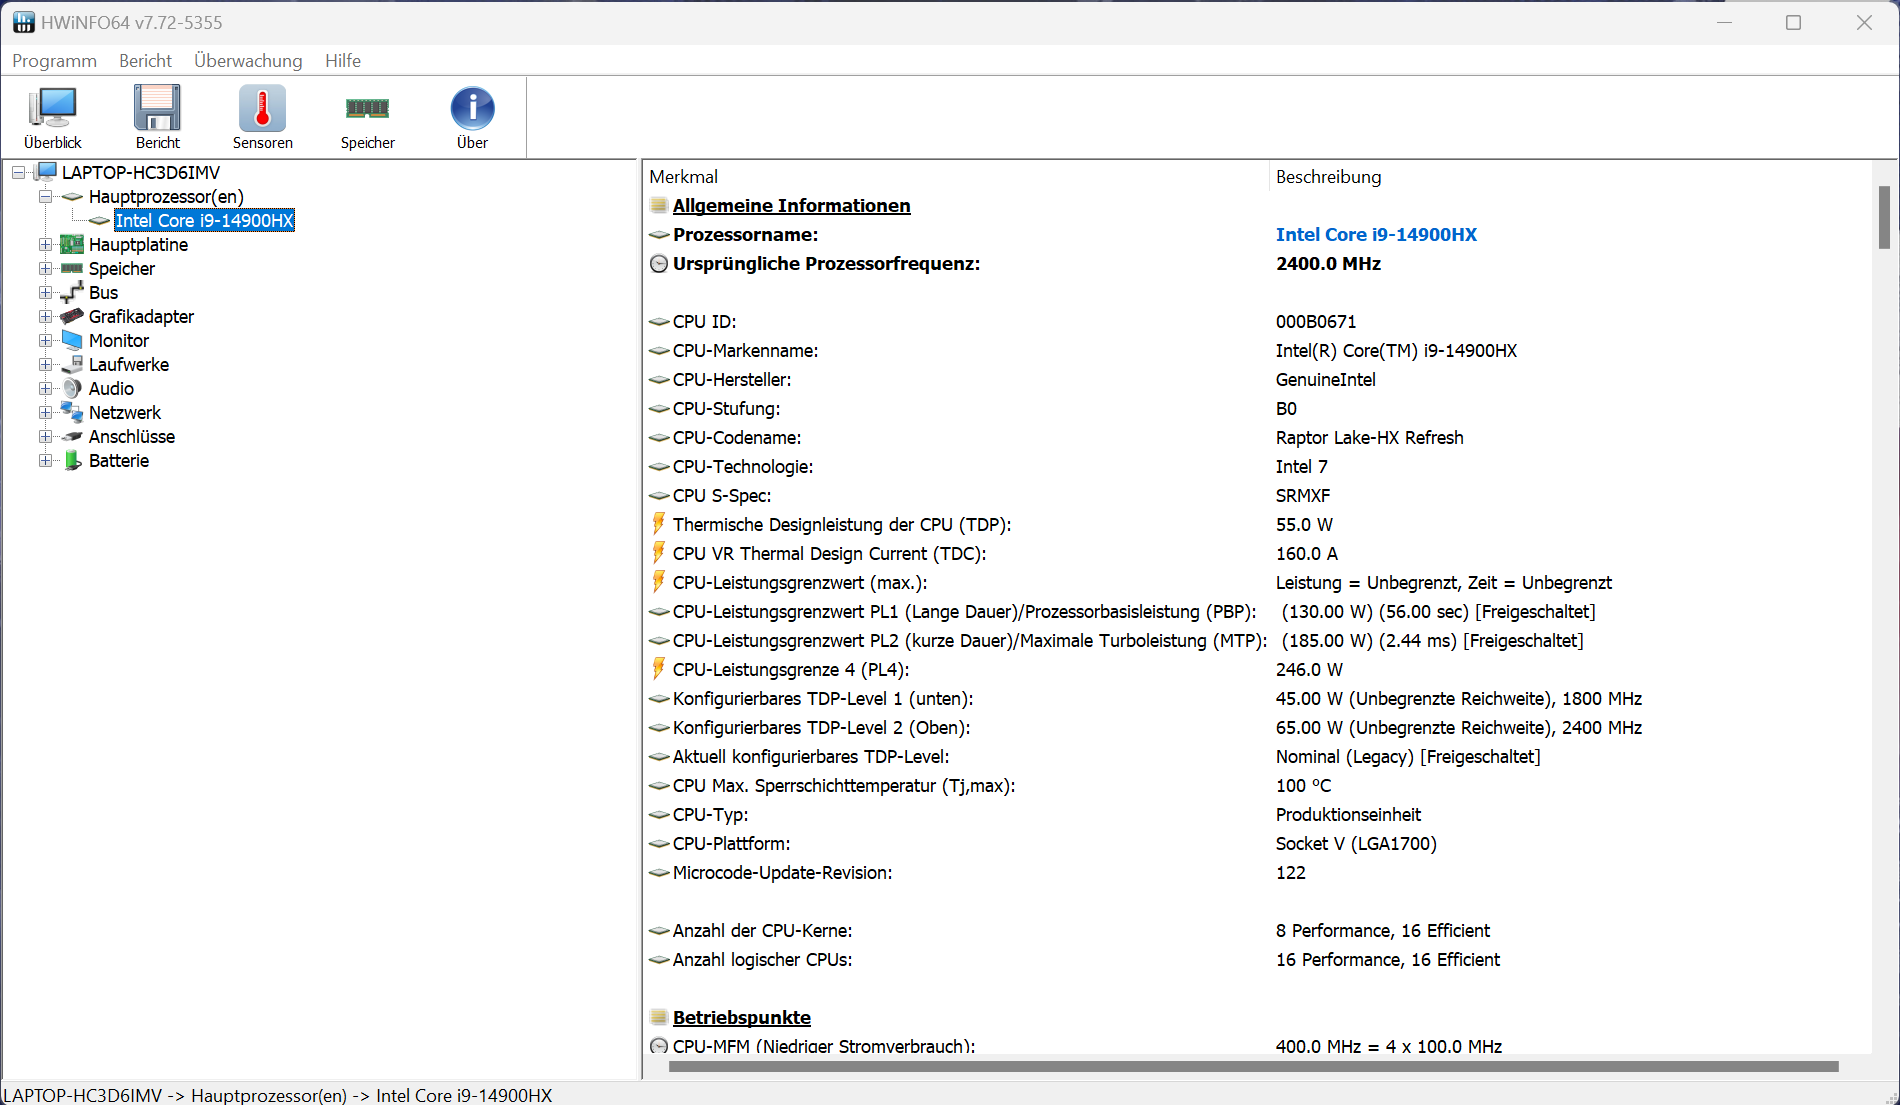
Processador
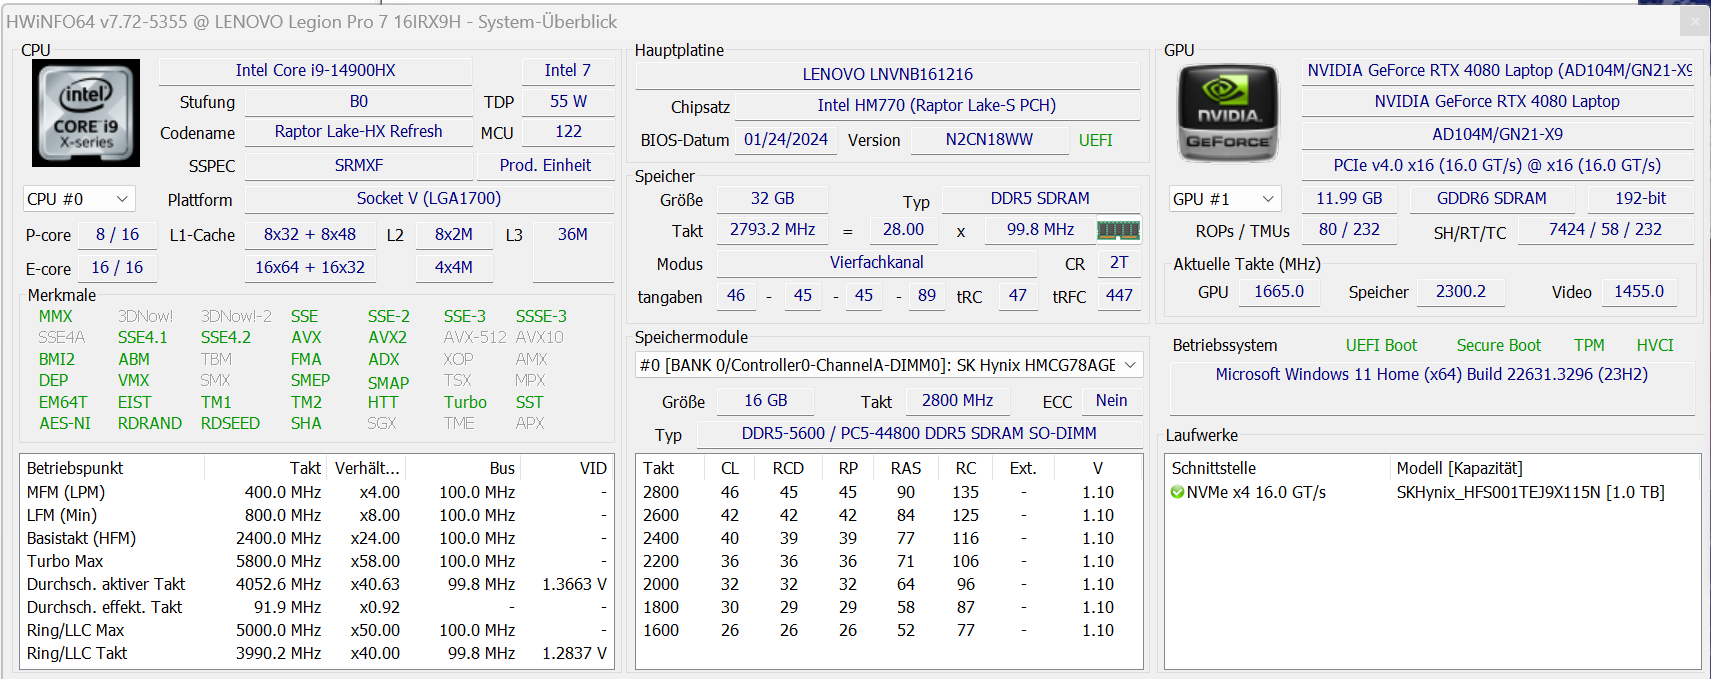
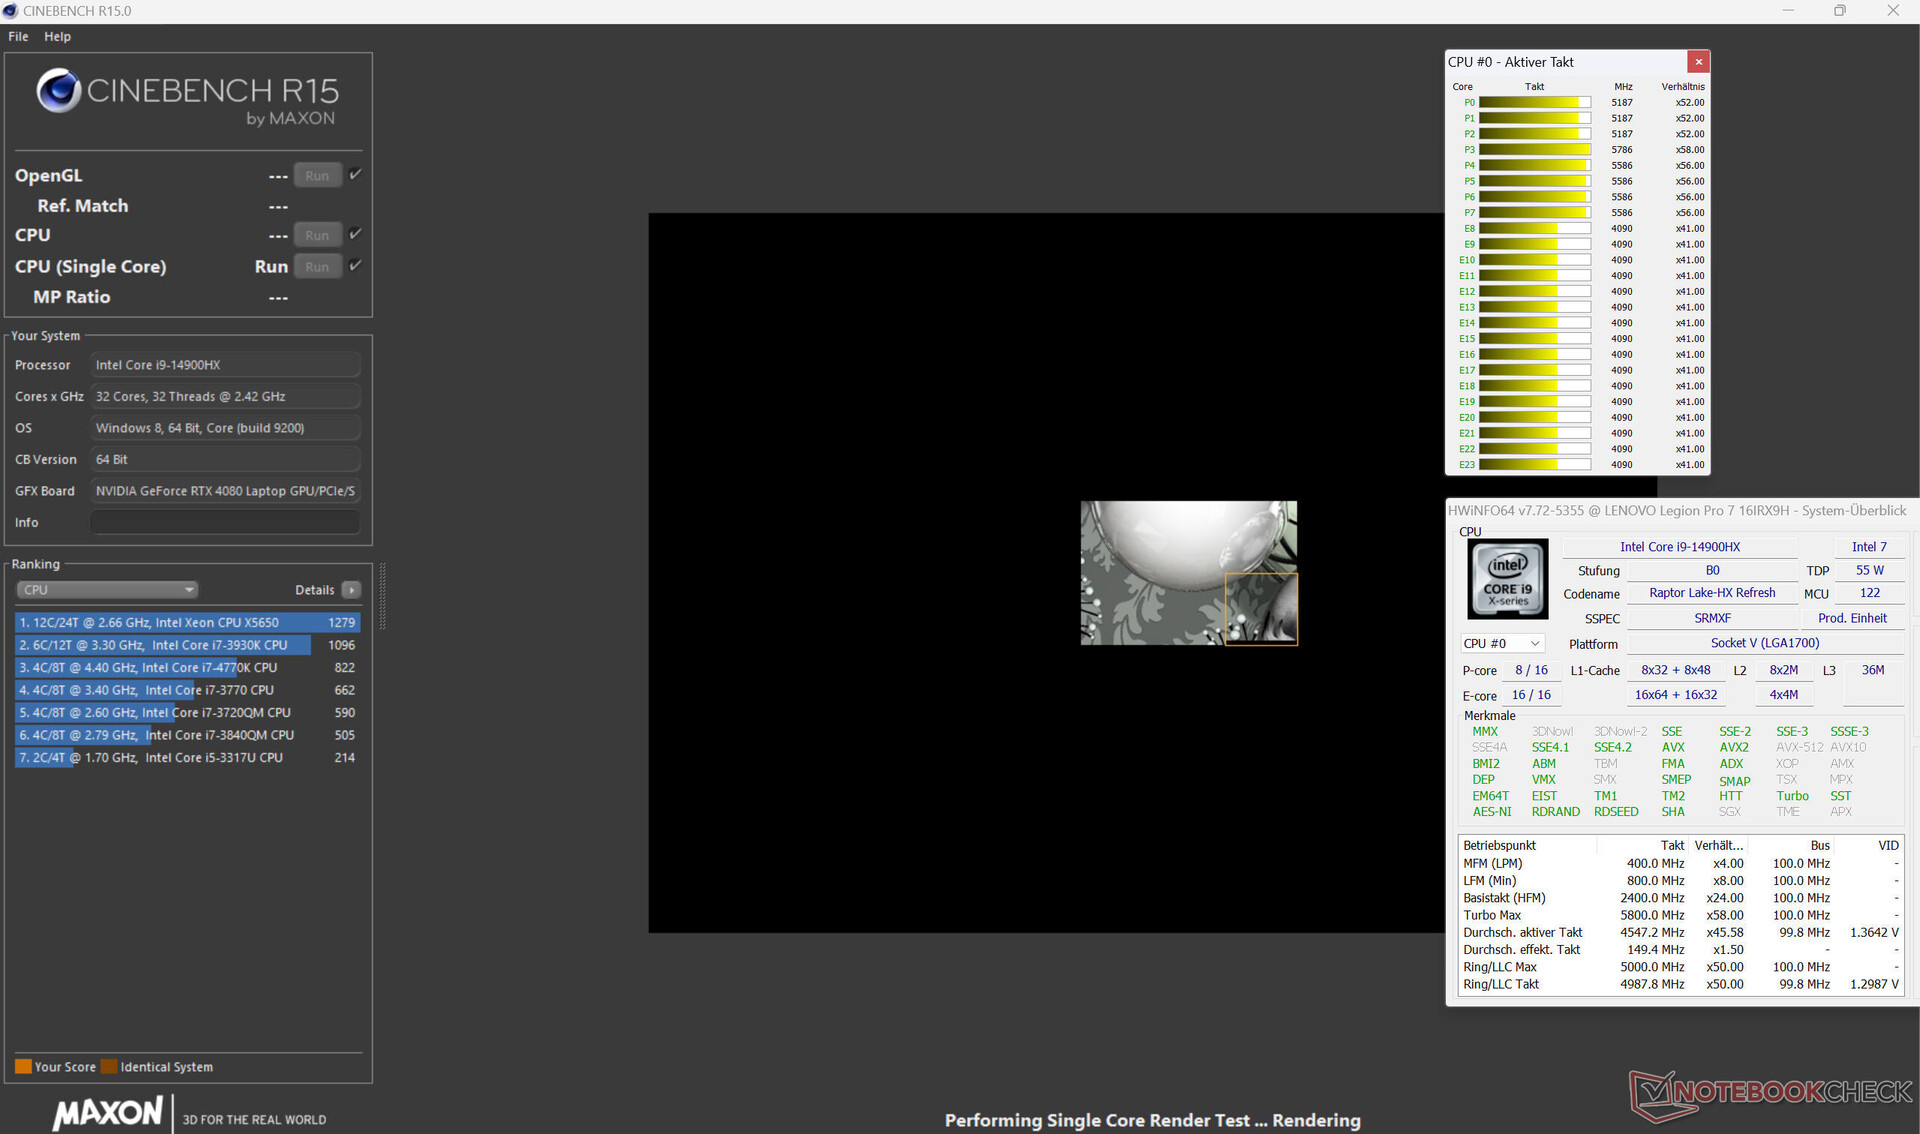
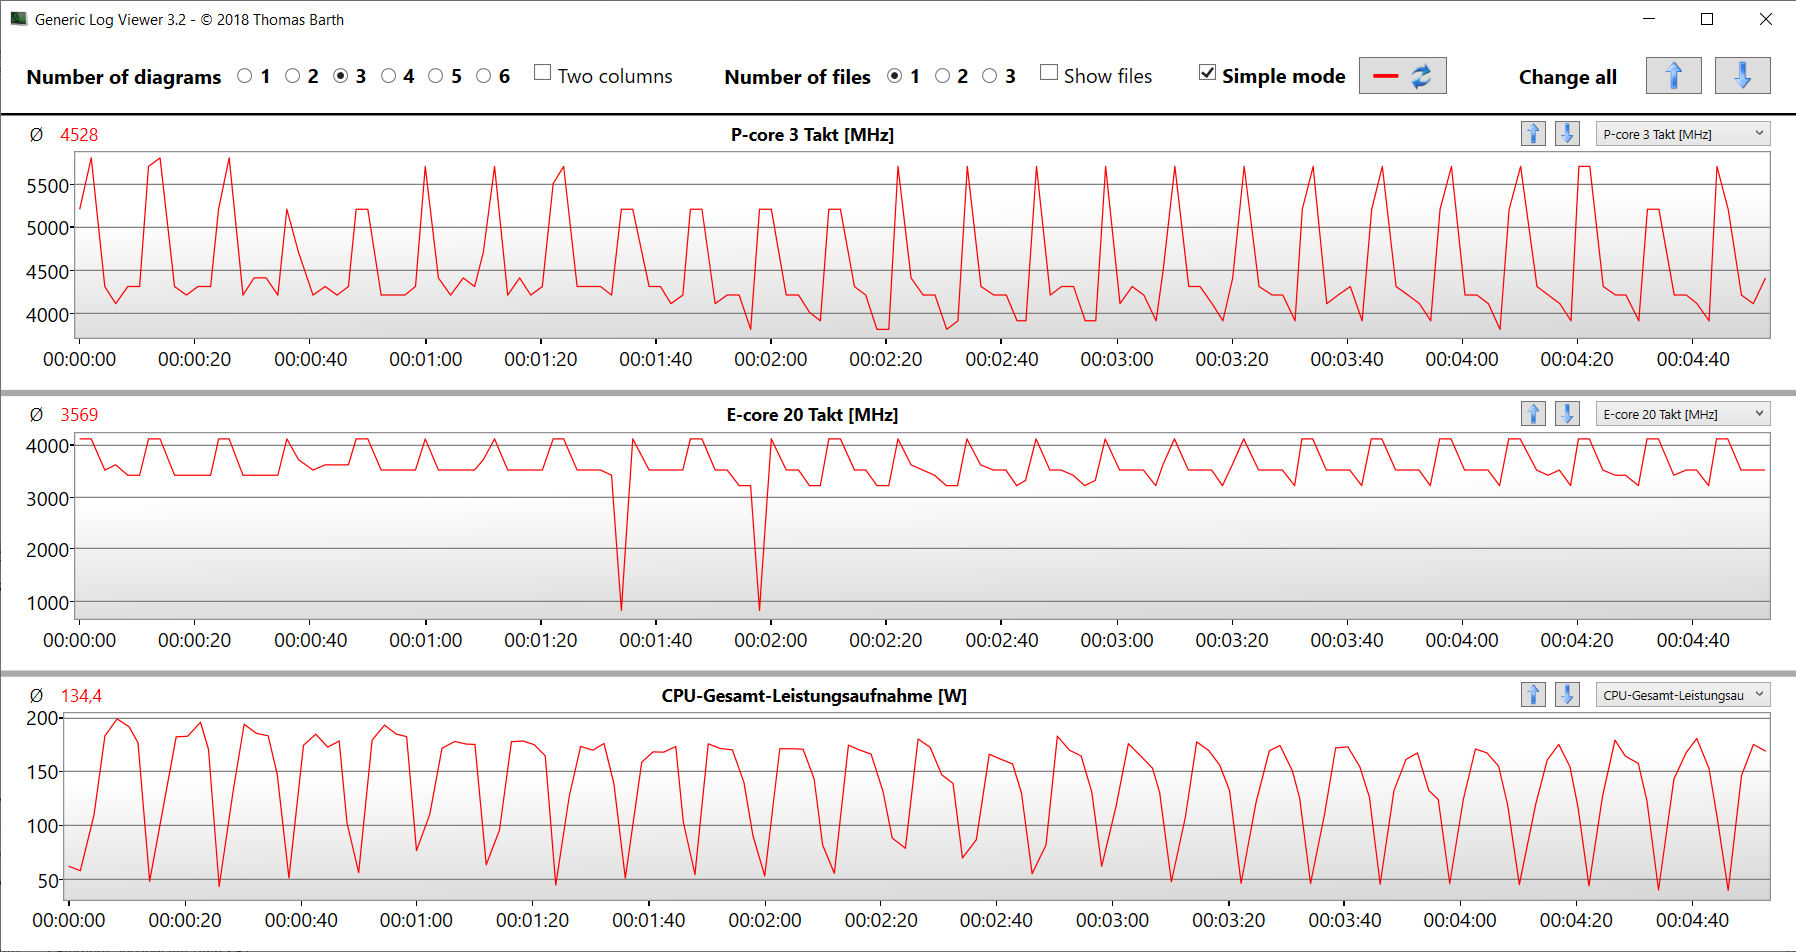
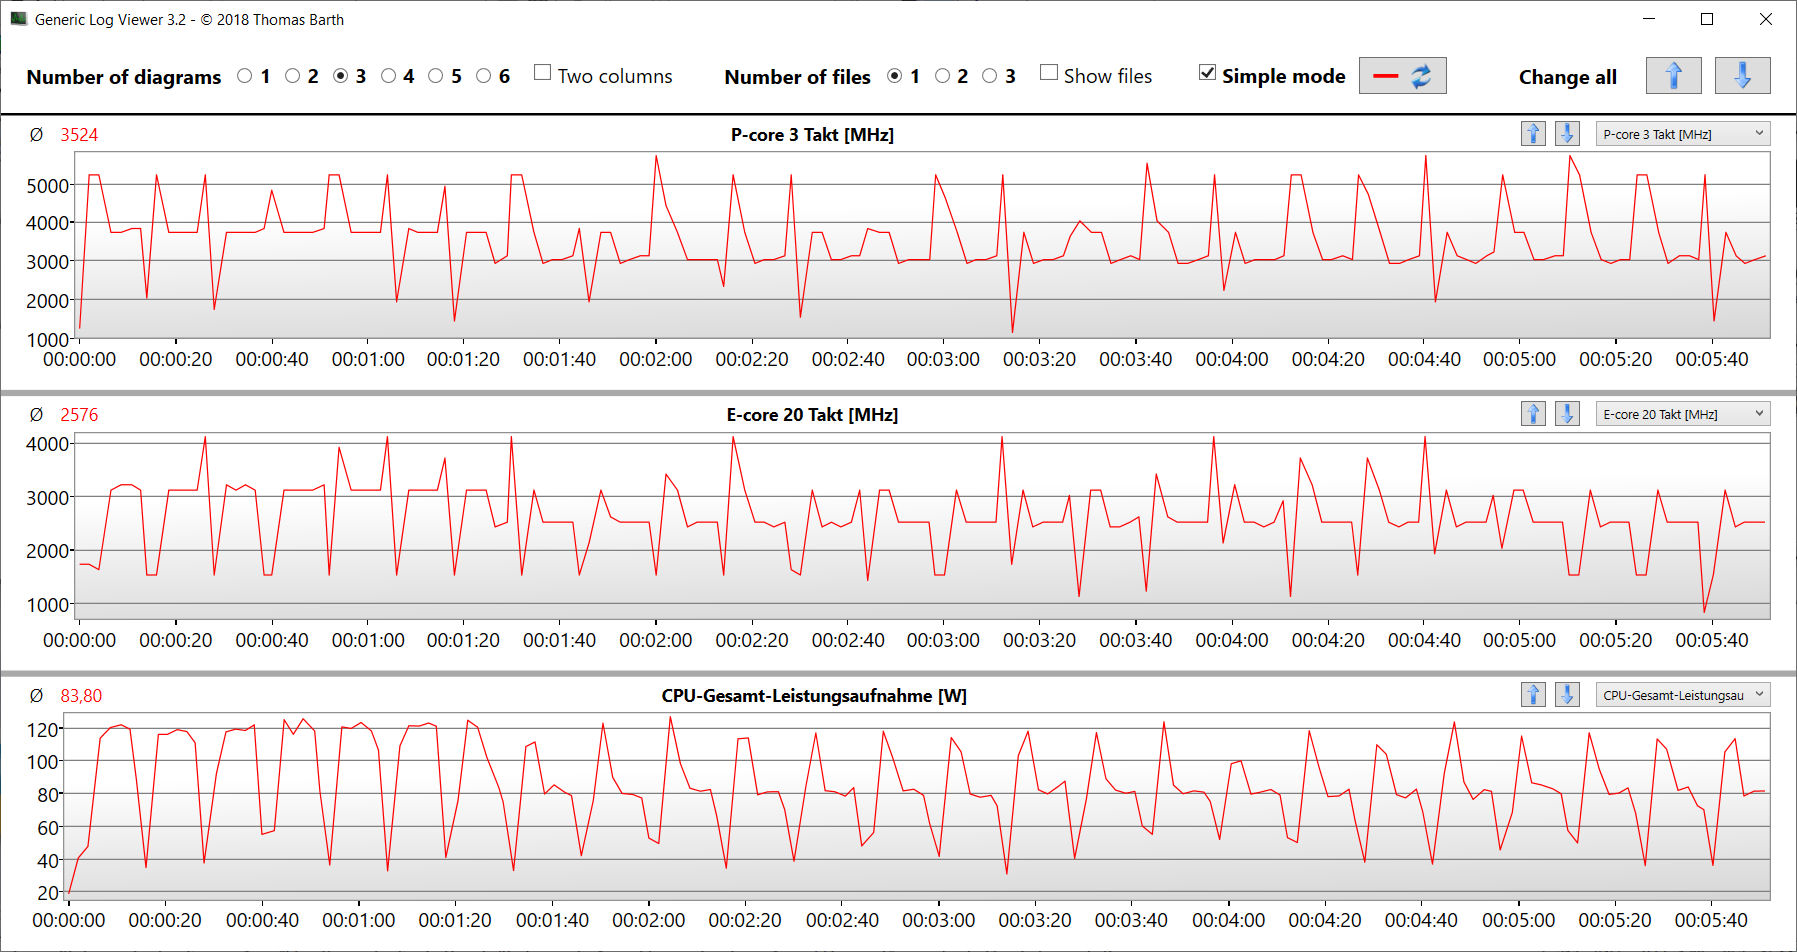
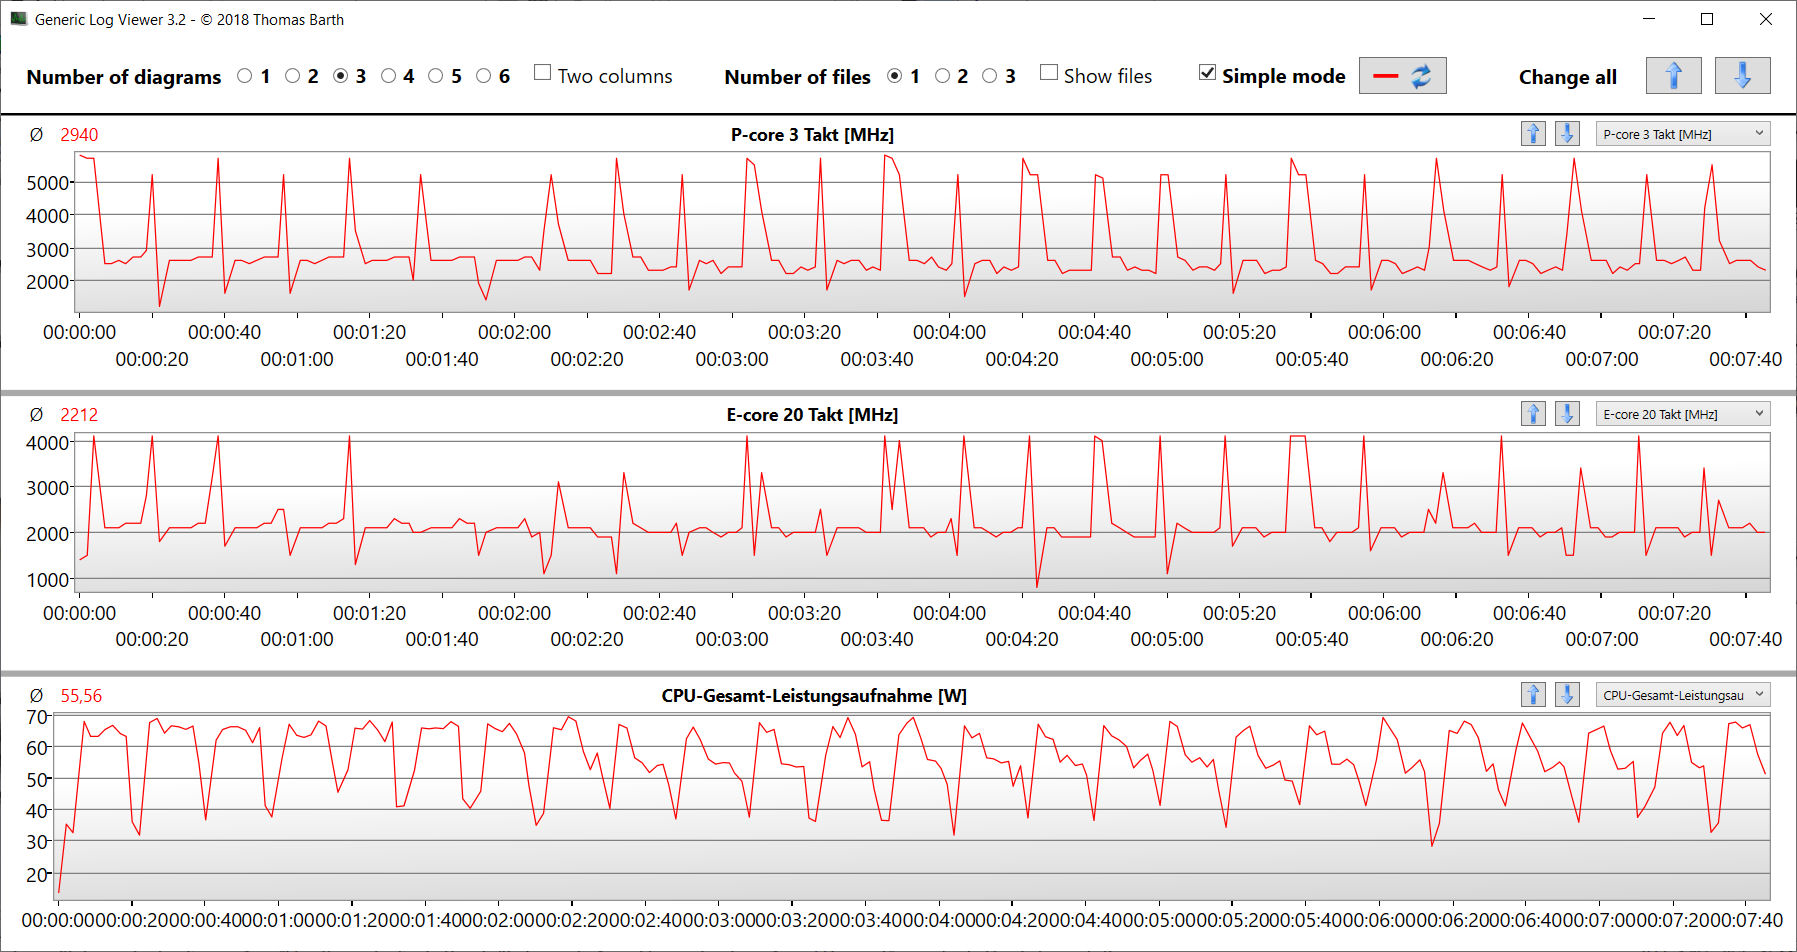
Os 24 núcleos de CPU (8P + 16E = 32 threads) no Core i9-14900HX (Raptor Lake) atingiram velocidades de clock máximas de 5,8 GHz (P) e 4,1 GHz (E). O processador lidou com a carga sustentada de vários threads (executando o Cinebench 15 em um loop) em velocidades de clock consistentemente altas. No modo Desempenho, as pontuações de benchmark obtidas estão acima do que a CPU pode fazer em média. Com a energia da bateria, o desempenho de thread único não diminuiu muito (307 pontos no CB15), mas o desempenho de multi-thread sofreu um impacto significativo (2.482 pontos no CB15).
O senhor pode consultar esta análise para obter mais informações sobre o Core i9.
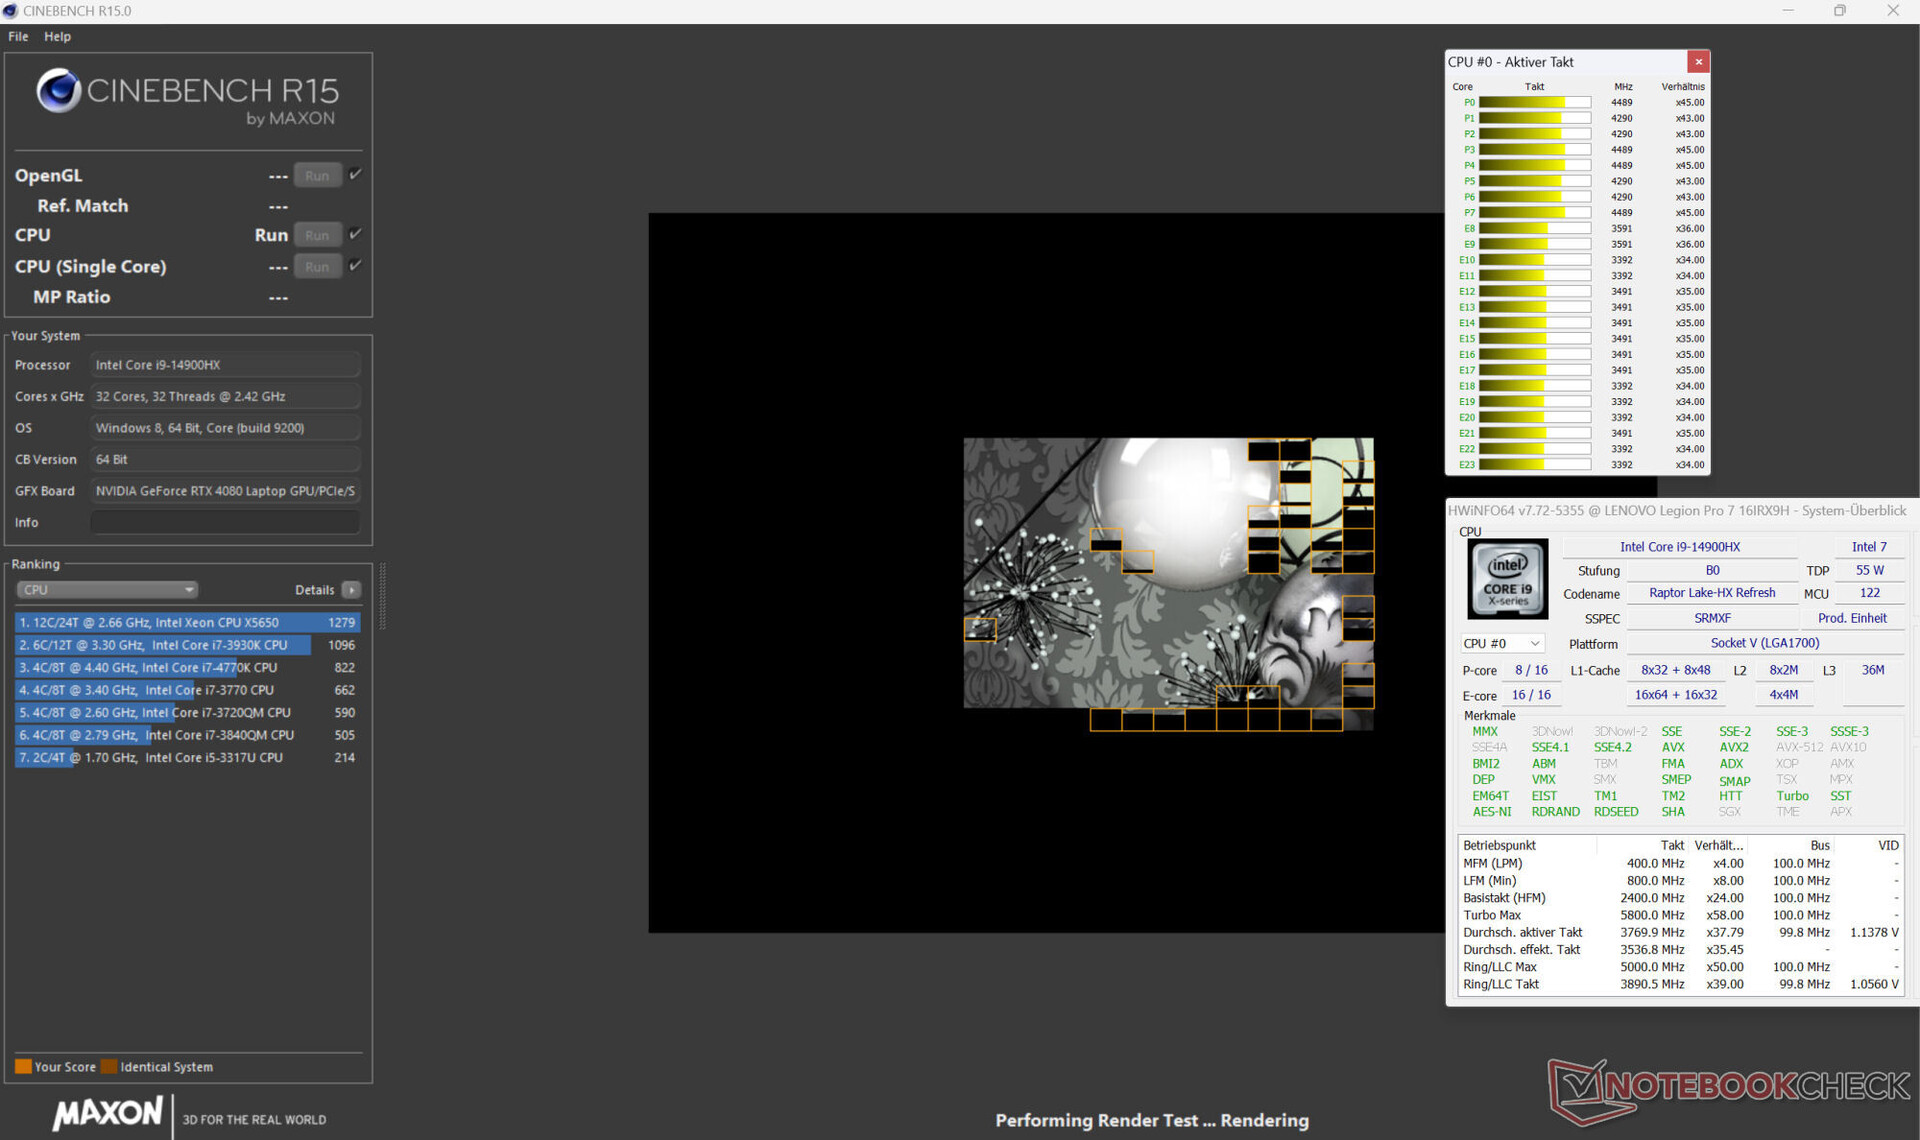
Cinebench R15 Multi Sustained load
| CPU Performance rating - Percent | |
| Lenovo Legion Pro 7 16IRX9H | |
| MSI Vector 16 HX A14V | |
| Média Intel Core i9-14900HX | |
| Lenovo Legion Pro 7 16IRX8H -2! | |
| HP Omen 16 (2024) | |
| Alienware m16 R1 AMD | |
| Média da turma Gaming | |
* ... menor é melhor
AIDA64: FP32 Ray-Trace | FPU Julia | CPU SHA3 | CPU Queen | FPU SinJulia | FPU Mandel | CPU AES | CPU ZLib | FP64 Ray-Trace | CPU PhotoWorxx
| Performance rating | |
| Alienware m16 R1 AMD | |
| MSI Vector 16 HX A14V | |
| Lenovo Legion Pro 7 16IRX9H | |
| Lenovo Legion Pro 7 16IRX8H | |
| Média da turma Gaming | |
| Média Intel Core i9-14900HX | |
| HP Omen 16 (2024) | |
| AIDA64 / FP32 Ray-Trace | |
| Alienware m16 R1 AMD | |
| Média da turma Gaming (10227 - 85542, n=105, últimos 2 anos) | |
| MSI Vector 16 HX A14V | |
| Lenovo Legion Pro 7 16IRX9H | |
| Lenovo Legion Pro 7 16IRX8H | |
| Média Intel Core i9-14900HX (13098 - 33474, n=36) | |
| HP Omen 16 (2024) | |
| AIDA64 / FPU Julia | |
| Alienware m16 R1 AMD | |
| MSI Vector 16 HX A14V | |
| Média da turma Gaming (51376 - 238426, n=105, últimos 2 anos) | |
| Lenovo Legion Pro 7 16IRX9H | |
| Lenovo Legion Pro 7 16IRX8H | |
| Média Intel Core i9-14900HX (67573 - 166040, n=36) | |
| HP Omen 16 (2024) | |
| AIDA64 / CPU SHA3 | |
| Alienware m16 R1 AMD | |
| Lenovo Legion Pro 7 16IRX9H | |
| MSI Vector 16 HX A14V | |
| Lenovo Legion Pro 7 16IRX8H | |
| Média da turma Gaming (2180 - 10115, n=105, últimos 2 anos) | |
| Média Intel Core i9-14900HX (3589 - 7979, n=36) | |
| HP Omen 16 (2024) | |
| AIDA64 / CPU Queen | |
| Alienware m16 R1 AMD | |
| Lenovo Legion Pro 7 16IRX9H | |
| MSI Vector 16 HX A14V | |
| Média Intel Core i9-14900HX (118405 - 148966, n=36) | |
| Lenovo Legion Pro 7 16IRX8H | |
| HP Omen 16 (2024) | |
| Média da turma Gaming (49785 - 173351, n=90, últimos 2 anos) | |
| AIDA64 / FPU SinJulia | |
| Alienware m16 R1 AMD | |
| Lenovo Legion Pro 7 16IRX9H | |
| MSI Vector 16 HX A14V | |
| Lenovo Legion Pro 7 16IRX8H | |
| Média Intel Core i9-14900HX (10475 - 18517, n=36) | |
| Média da turma Gaming (4424 - 33636, n=105, últimos 2 anos) | |
| HP Omen 16 (2024) | |
| AIDA64 / FPU Mandel | |
| Alienware m16 R1 AMD | |
| Média da turma Gaming (25115 - 128721, n=105, últimos 2 anos) | |
| MSI Vector 16 HX A14V | |
| Lenovo Legion Pro 7 16IRX9H | |
| Lenovo Legion Pro 7 16IRX8H | |
| Média Intel Core i9-14900HX (32543 - 83662, n=36) | |
| HP Omen 16 (2024) | |
| AIDA64 / CPU AES | |
| Média Intel Core i9-14900HX (86964 - 241777, n=36) | |
| Lenovo Legion Pro 7 16IRX9H | |
| MSI Vector 16 HX A14V | |
| Lenovo Legion Pro 7 16IRX8H | |
| Alienware m16 R1 AMD | |
| Média da turma Gaming (39258 - 247074, n=105, últimos 2 anos) | |
| HP Omen 16 (2024) | |
| AIDA64 / CPU ZLib | |
| Lenovo Legion Pro 7 16IRX9H | |
| MSI Vector 16 HX A14V | |
| Lenovo Legion Pro 7 16IRX8H | |
| Média Intel Core i9-14900HX (1054 - 2292, n=36) | |
| Alienware m16 R1 AMD | |
| Média da turma Gaming (574 - 2531, n=105, últimos 2 anos) | |
| HP Omen 16 (2024) | |
| AIDA64 / FP64 Ray-Trace | |
| Alienware m16 R1 AMD | |
| Média da turma Gaming (5509 - 45446, n=105, últimos 2 anos) | |
| MSI Vector 16 HX A14V | |
| Lenovo Legion Pro 7 16IRX9H | |
| Lenovo Legion Pro 7 16IRX8H | |
| Média Intel Core i9-14900HX (6809 - 18349, n=36) | |
| HP Omen 16 (2024) | |
| AIDA64 / CPU PhotoWorxx | |
| HP Omen 16 (2024) | |
| MSI Vector 16 HX A14V | |
| Lenovo Legion Pro 7 16IRX8H | |
| Lenovo Legion Pro 7 16IRX9H | |
| Média Intel Core i9-14900HX (23903 - 54702, n=36) | |
| Média da turma Gaming (12271 - 89891, n=105, últimos 2 anos) | |
| Alienware m16 R1 AMD | |
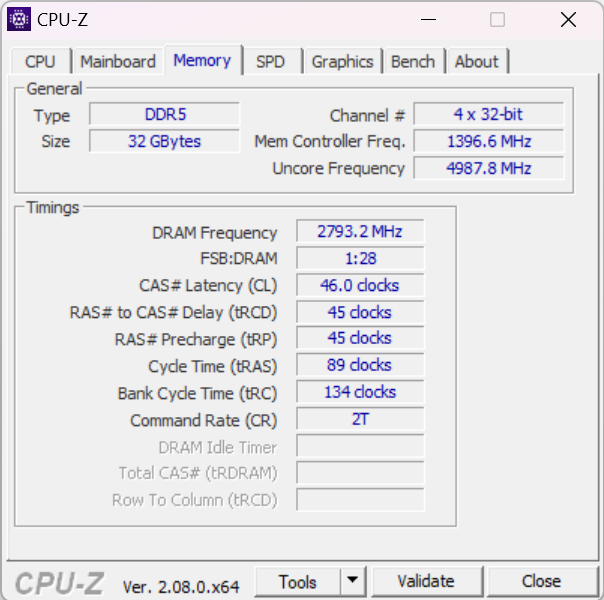
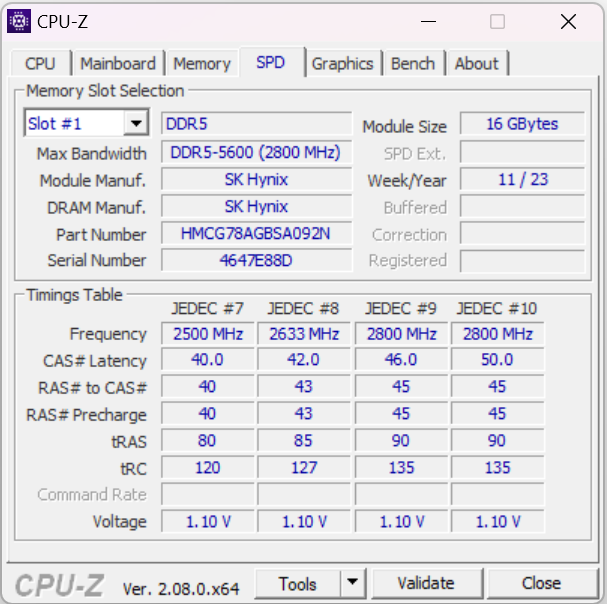
Desempenho do sistema
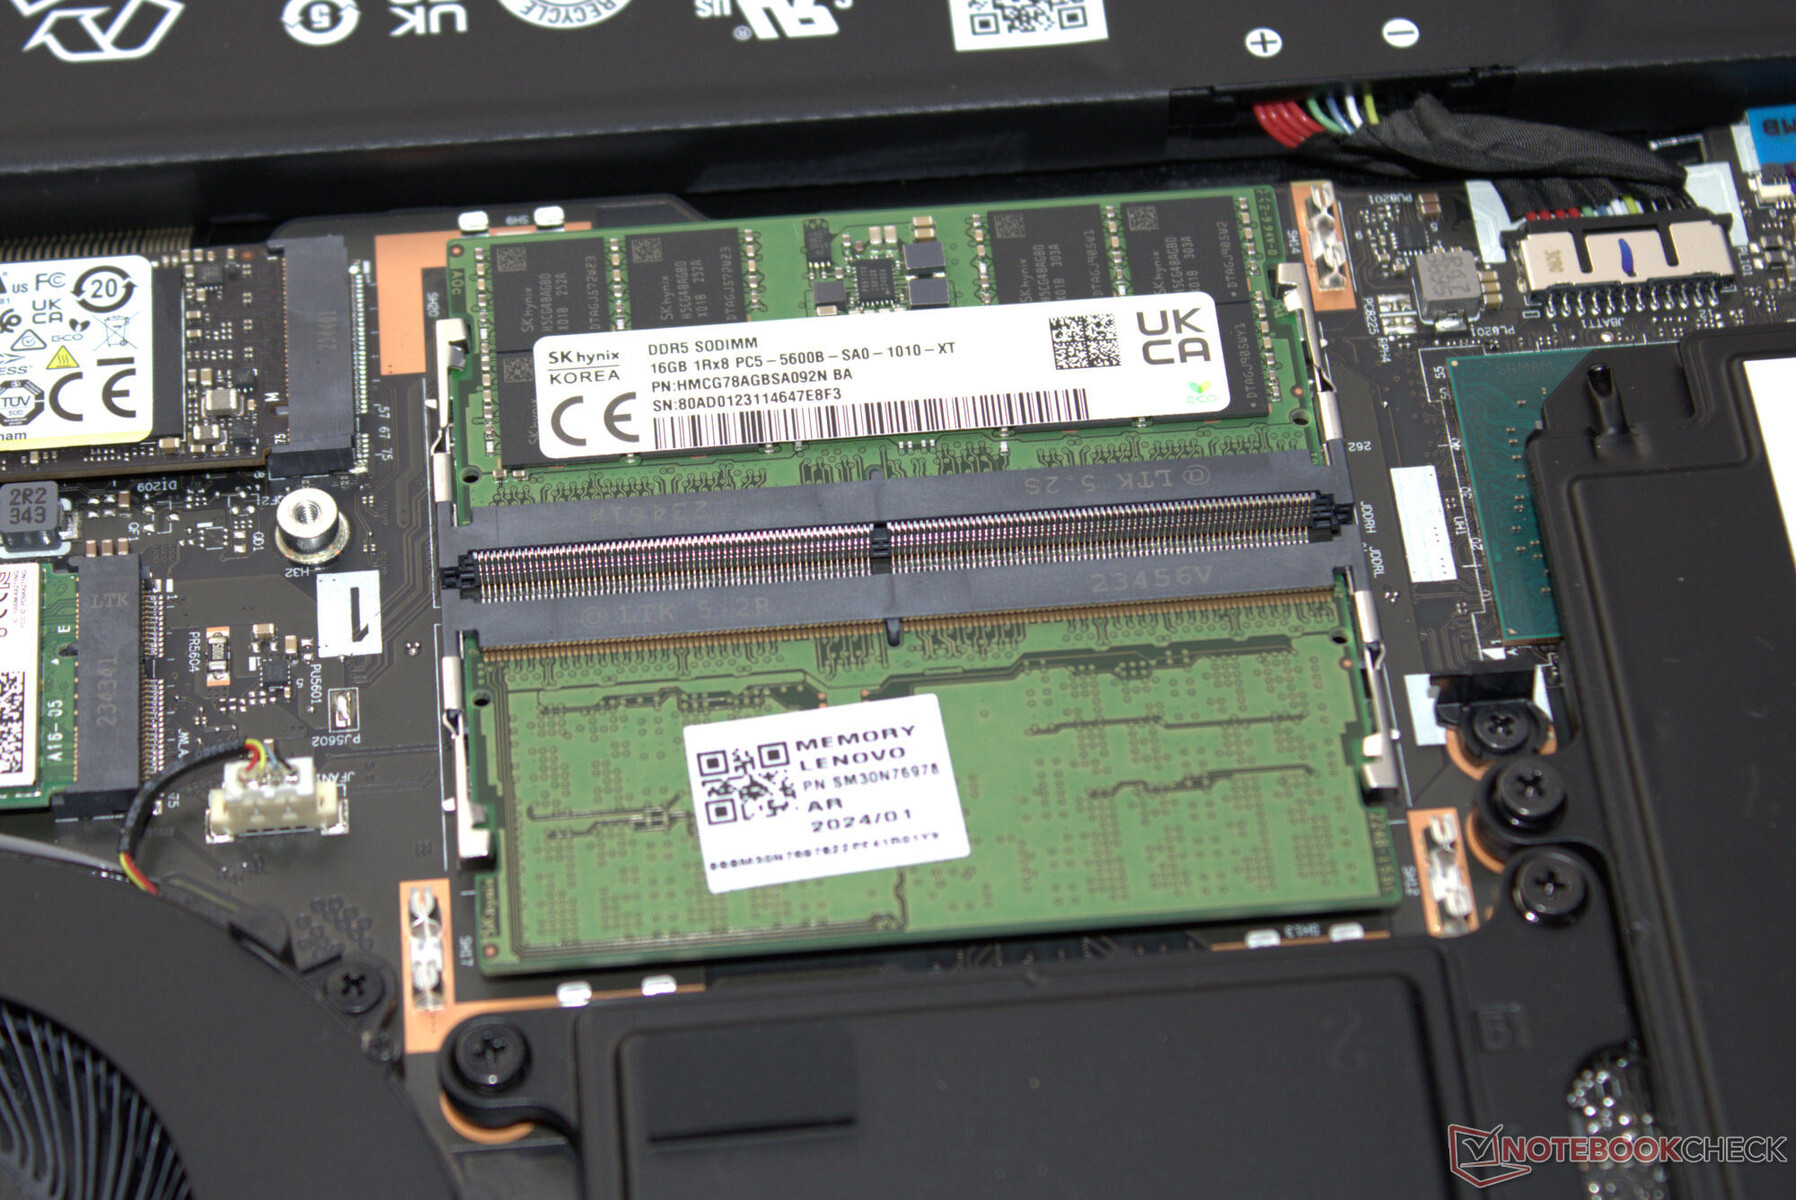
O sistema de funcionamento suave não carece de desempenho de computação. O Legion Pro 7 pode lidar sem esforço com coisas como jogos, streaming e renderização. As taxas de transferência da memória estão em um nível normal para a RAM DDR5-5600.
CrossMark: Overall | Productivity | Creativity | Responsiveness
WebXPRT 3: Overall
WebXPRT 4: Overall
Mozilla Kraken 1.1: Total
| PCMark 10 / Score | |
| Lenovo Legion Pro 7 16IRX9H | |
| HP Omen 16 (2024) | |
| Alienware m16 R1 AMD | |
| Média Intel Core i9-14900HX, NVIDIA GeForce RTX 4080 Laptop GPU (7703 - 9223, n=7) | |
| MSI Vector 16 HX A14V | |
| Média da turma Gaming (5828 - 12414, n=93, últimos 2 anos) | |
| Lenovo Legion Pro 7 16IRX8H | |
| PCMark 10 / Essentials | |
| Lenovo Legion Pro 7 16IRX9H | |
| Lenovo Legion Pro 7 16IRX8H | |
| Média Intel Core i9-14900HX, NVIDIA GeForce RTX 4080 Laptop GPU (11255 - 12600, n=7) | |
| Alienware m16 R1 AMD | |
| MSI Vector 16 HX A14V | |
| HP Omen 16 (2024) | |
| Média da turma Gaming (8810 - 11935, n=97, últimos 2 anos) | |
| PCMark 10 / Productivity | |
| HP Omen 16 (2024) | |
| Lenovo Legion Pro 7 16IRX9H | |
| Média da turma Gaming (6845 - 25323, n=95, últimos 2 anos) | |
| Lenovo Legion Pro 7 16IRX8H | |
| Alienware m16 R1 AMD | |
| Média Intel Core i9-14900HX, NVIDIA GeForce RTX 4080 Laptop GPU (6662 - 11410, n=7) | |
| MSI Vector 16 HX A14V | |
| PCMark 10 / Digital Content Creation | |
| MSI Vector 16 HX A14V | |
| Alienware m16 R1 AMD | |
| Média Intel Core i9-14900HX, NVIDIA GeForce RTX 4080 Laptop GPU (14211 - 16246, n=7) | |
| HP Omen 16 (2024) | |
| Lenovo Legion Pro 7 16IRX9H | |
| Média da turma Gaming (7602 - 19954, n=95, últimos 2 anos) | |
| Lenovo Legion Pro 7 16IRX8H | |
| CrossMark / Overall | |
| Lenovo Legion Pro 7 16IRX9H | |
| HP Omen 16 (2024) | |
| MSI Vector 16 HX A14V | |
| Média Intel Core i9-14900HX, NVIDIA GeForce RTX 4080 Laptop GPU (1992 - 2334, n=7) | |
| Alienware m16 R1 AMD | |
| Média da turma Gaming (1366 - 2409, n=94, últimos 2 anos) | |
| CrossMark / Productivity | |
| Lenovo Legion Pro 7 16IRX9H | |
| HP Omen 16 (2024) | |
| MSI Vector 16 HX A14V | |
| Média Intel Core i9-14900HX, NVIDIA GeForce RTX 4080 Laptop GPU (1812 - 2204, n=7) | |
| Alienware m16 R1 AMD | |
| Média da turma Gaming (1386 - 2254, n=94, últimos 2 anos) | |
| CrossMark / Creativity | |
| Lenovo Legion Pro 7 16IRX9H | |
| MSI Vector 16 HX A14V | |
| Média Intel Core i9-14900HX, NVIDIA GeForce RTX 4080 Laptop GPU (2327 - 2500, n=7) | |
| HP Omen 16 (2024) | |
| Média da turma Gaming (1343 - 2786, n=94, últimos 2 anos) | |
| Alienware m16 R1 AMD | |
| CrossMark / Responsiveness | |
| Lenovo Legion Pro 7 16IRX9H | |
| HP Omen 16 (2024) | |
| MSI Vector 16 HX A14V | |
| Média Intel Core i9-14900HX, NVIDIA GeForce RTX 4080 Laptop GPU (1520 - 2254, n=7) | |
| Alienware m16 R1 AMD | |
| Média da turma Gaming (1226 - 2334, n=94, últimos 2 anos) | |
| WebXPRT 3 / Overall | |
| Lenovo Legion Pro 7 16IRX8H | |
| Lenovo Legion Pro 7 16IRX8H | |
| Alienware m16 R1 AMD | |
| Lenovo Legion Pro 7 16IRX9H | |
| Média Intel Core i9-14900HX, NVIDIA GeForce RTX 4080 Laptop GPU (310 - 345, n=7) | |
| HP Omen 16 (2024) | |
| MSI Vector 16 HX A14V | |
| Média da turma Gaming (220 - 532, n=98, últimos 2 anos) | |
| WebXPRT 4 / Overall | |
| Lenovo Legion Pro 7 16IRX9H | |
| Média Intel Core i9-14900HX, NVIDIA GeForce RTX 4080 Laptop GPU (300 - 321, n=7) | |
| HP Omen 16 (2024) | |
| Lenovo Legion Pro 7 16IRX8H | |
| MSI Vector 16 HX A14V | |
| Média da turma Gaming (165 - 354, n=98, últimos 2 anos) | |
| Alienware m16 R1 AMD | |
| Mozilla Kraken 1.1 / Total | |
| Alienware m16 R1 AMD | |
| Média da turma Gaming (391 - 590, n=100, últimos 2 anos) | |
| Lenovo Legion Pro 7 16IRX8H | |
| Lenovo Legion Pro 7 16IRX8H | |
| MSI Vector 16 HX A14V | |
| Média Intel Core i9-14900HX, NVIDIA GeForce RTX 4080 Laptop GPU (437 - 446, n=7) | |
| Lenovo Legion Pro 7 16IRX9H | |
| HP Omen 16 (2024) | |
* ... menor é melhor
| PCMark 10 Score | 8923 pontos | |
Ajuda | ||
| AIDA64 / Memory Copy | |
| HP Omen 16 (2024) | |
| Lenovo Legion Pro 7 16IRX9H | |
| MSI Vector 16 HX A14V | |
| Média Intel Core i9-14900HX (38028 - 83392, n=36) | |
| Média da turma Gaming (21750 - 129946, n=105, últimos 2 anos) | |
| Alienware m16 R1 AMD | |
| AIDA64 / Memory Read | |
| HP Omen 16 (2024) | |
| Lenovo Legion Pro 7 16IRX9H | |
| MSI Vector 16 HX A14V | |
| Média Intel Core i9-14900HX (43306 - 87568, n=36) | |
| Média da turma Gaming (22956 - 118858, n=105, últimos 2 anos) | |
| Alienware m16 R1 AMD | |
| AIDA64 / Memory Write | |
| HP Omen 16 (2024) | |
| MSI Vector 16 HX A14V | |
| Média da turma Gaming (22297 - 135096, n=105, últimos 2 anos) | |
| Média Intel Core i9-14900HX (37146 - 80589, n=36) | |
| Lenovo Legion Pro 7 16IRX9H | |
| Alienware m16 R1 AMD | |
| AIDA64 / Memory Latency | |
| Média da turma Gaming (75.3 - 259, n=105, últimos 2 anos) | |
| Alienware m16 R1 AMD | |
| Média Intel Core i9-14900HX (76.1 - 105, n=36) | |
| HP Omen 16 (2024) | |
| MSI Vector 16 HX A14V | |
| Lenovo Legion Pro 7 16IRX9H | |
* ... menor é melhor
Latência DPC
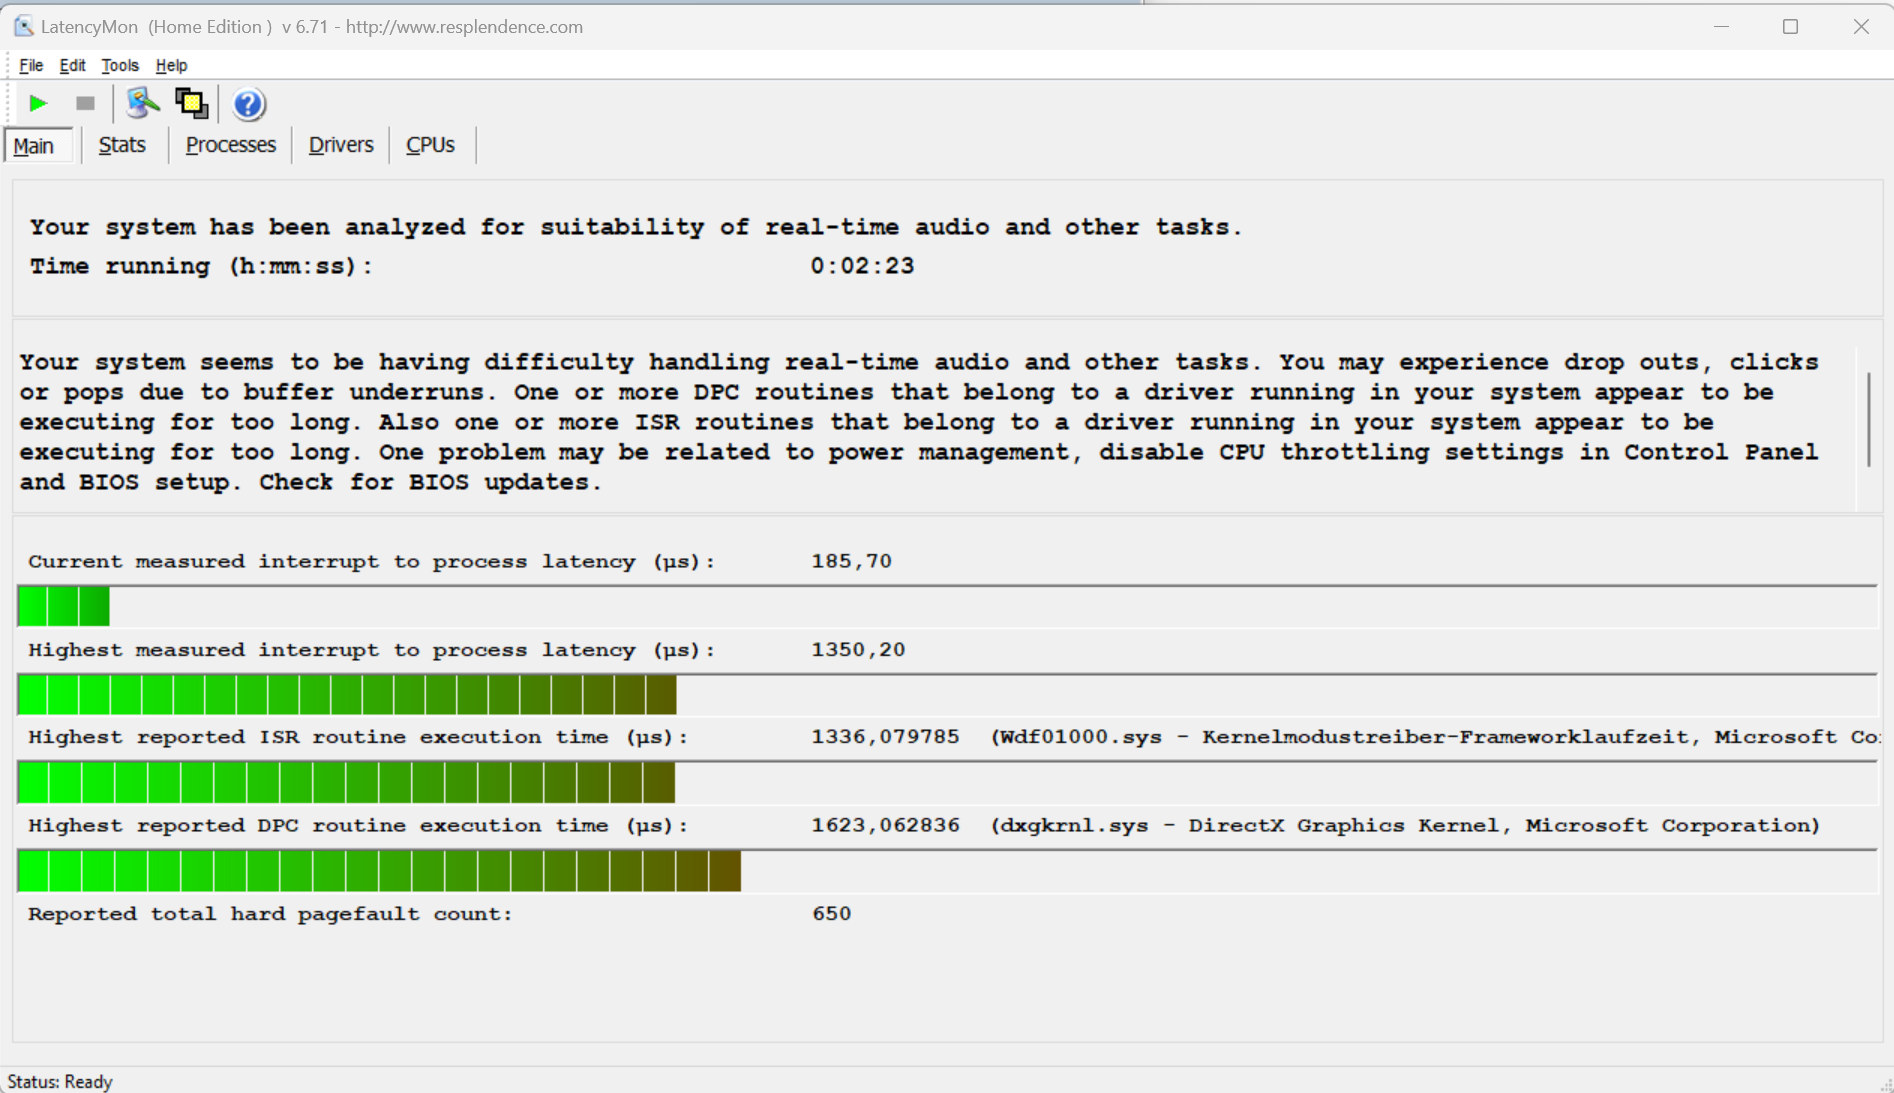
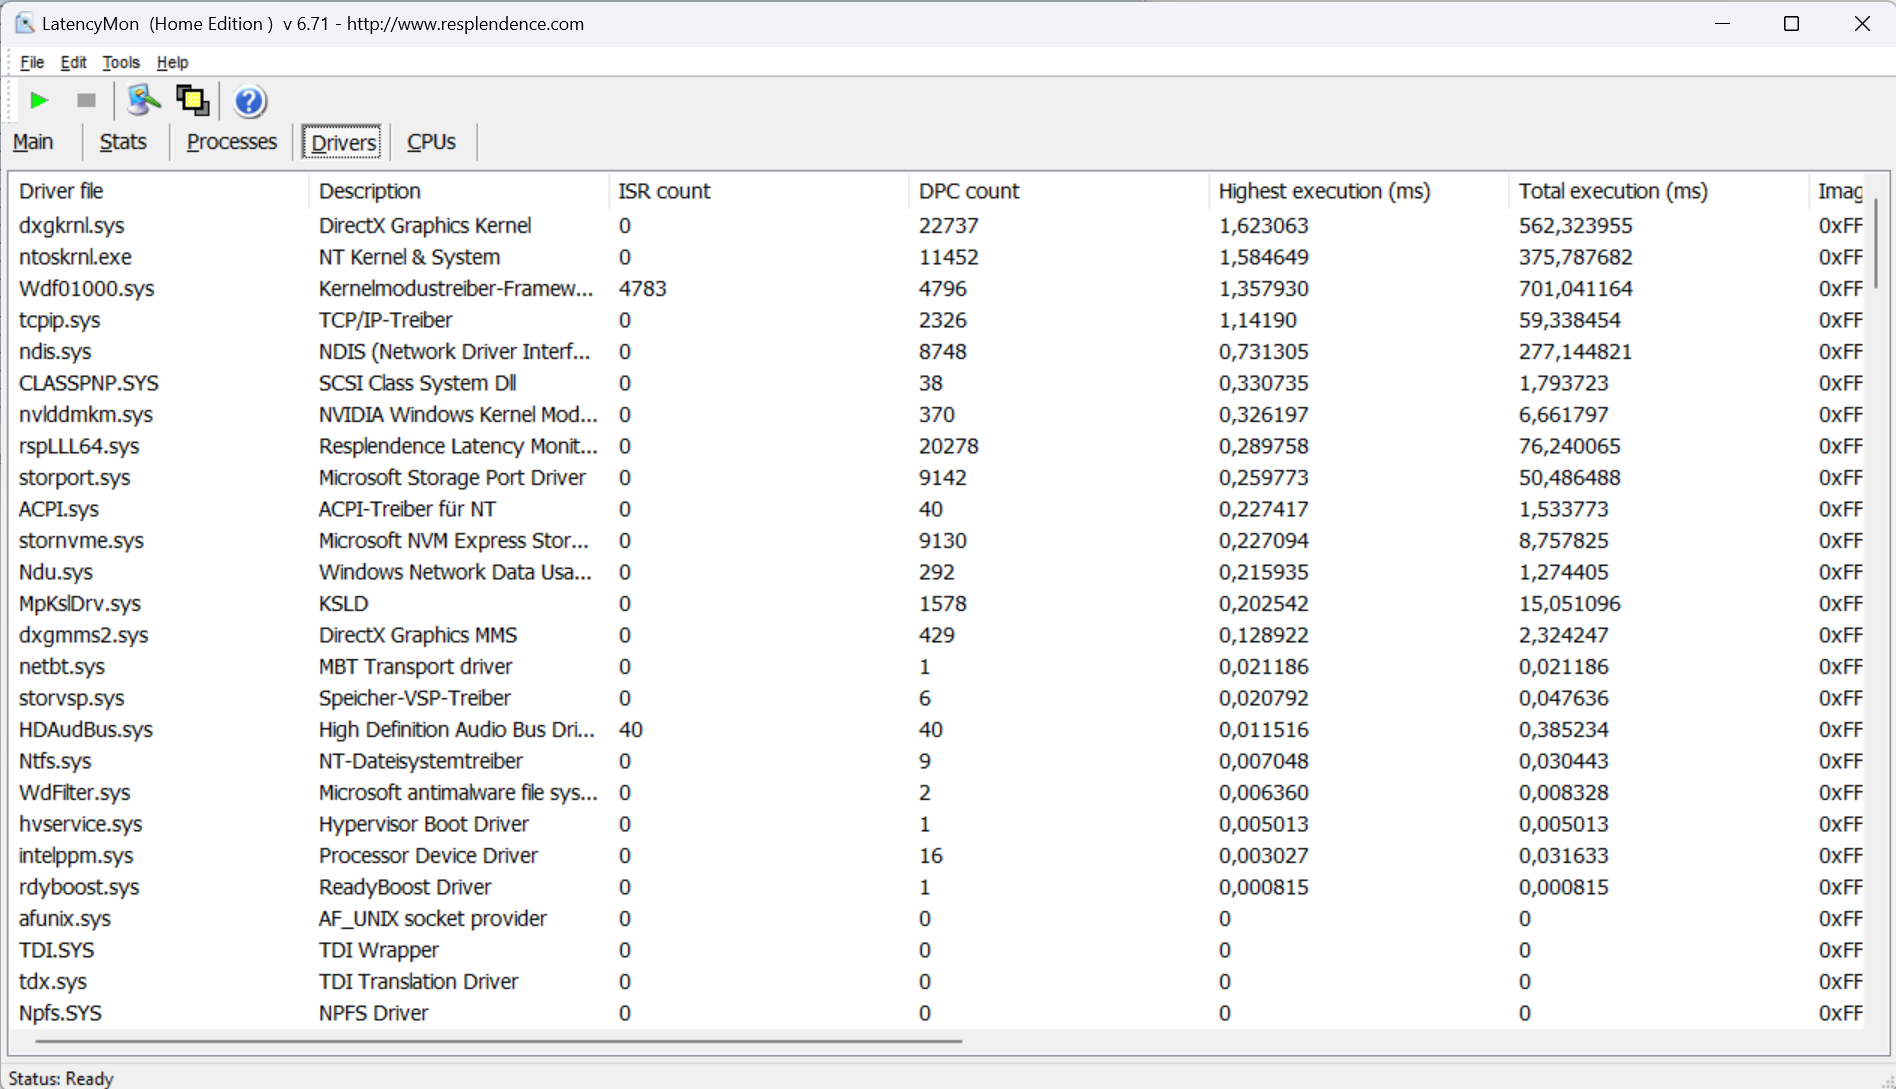
O Latency Monitor revelou alguns problemas durante o teste de latência (navegação na Web, reprodução de vídeo 4K, alta carga do Prime95). O sistema não parece ser adequado para tarefas de vídeo e áudio em tempo real. Esperamos que as futuras atualizações de software possam melhorar a situação.
| DPC Latencies / LatencyMon - interrupt to process latency (max), Web, Youtube, Prime95 | |
| Alienware m16 R1 AMD | |
| MSI Vector 16 HX A14V | |
| Lenovo Legion Pro 7 16IRX9H | |
| HP Omen 16 (2024) | |
| Lenovo Legion Pro 7 16IRX8H | |
* ... menor é melhor
Armazenamento em massa
O site Legion tem espaço para um total de dois SSDs PCIe 4.0. O SSD SK Hynix M.2 2280 (1 TB) em nossa unidade de análise apresentou excelentes velocidades de leitura e gravação. Outro ponto positivo é que não houve estrangulamento térmico durante nossos testes.


| Drive Performance rating - Percent | |
| Lenovo Legion Pro 7 16IRX9H | |
| HP Omen 16 (2024) | |
| Lenovo Legion Pro 7 16IRX8H | |
| Média SK Hynix HFS001TEJ9X115N | |
| Alienware m16 R1 AMD | |
| Média da turma Gaming | |
| MSI Vector 16 HX A14V | |
* ... menor é melhor
Sustained load Read: DiskSpd Read Loop, Queue Depth 8
Placa de vídeo
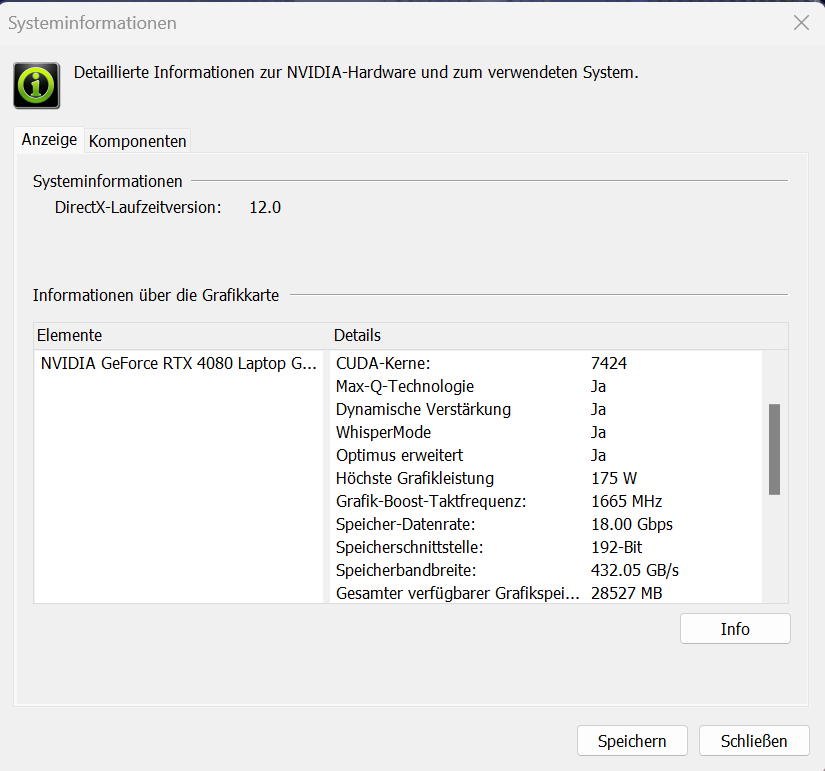
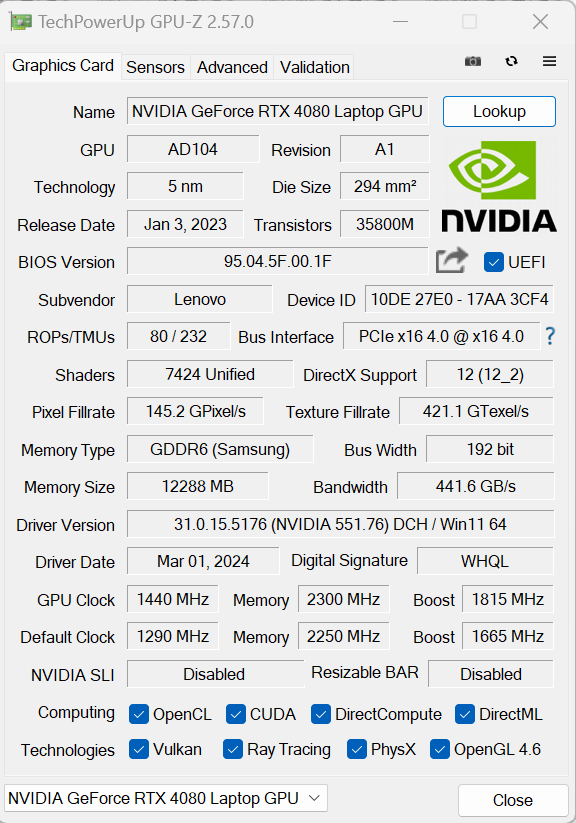
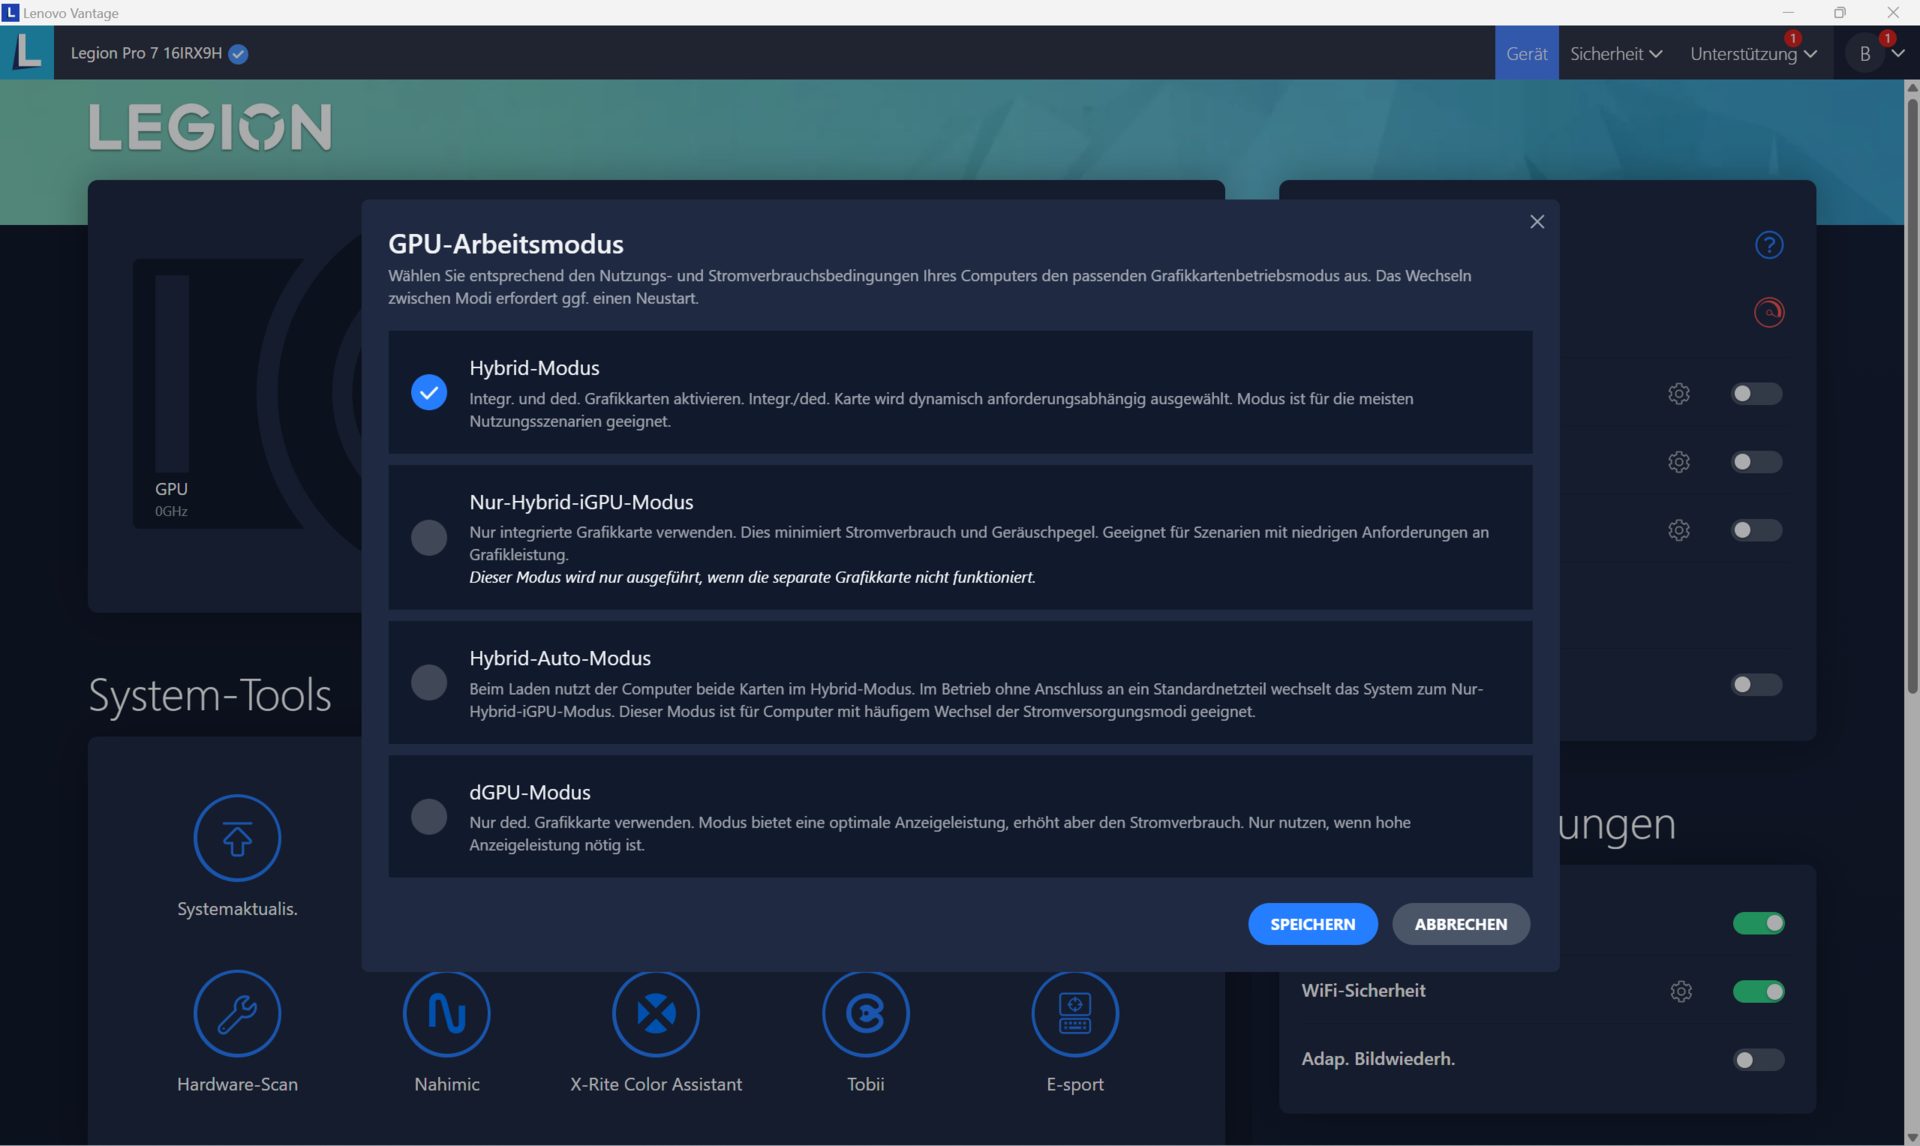
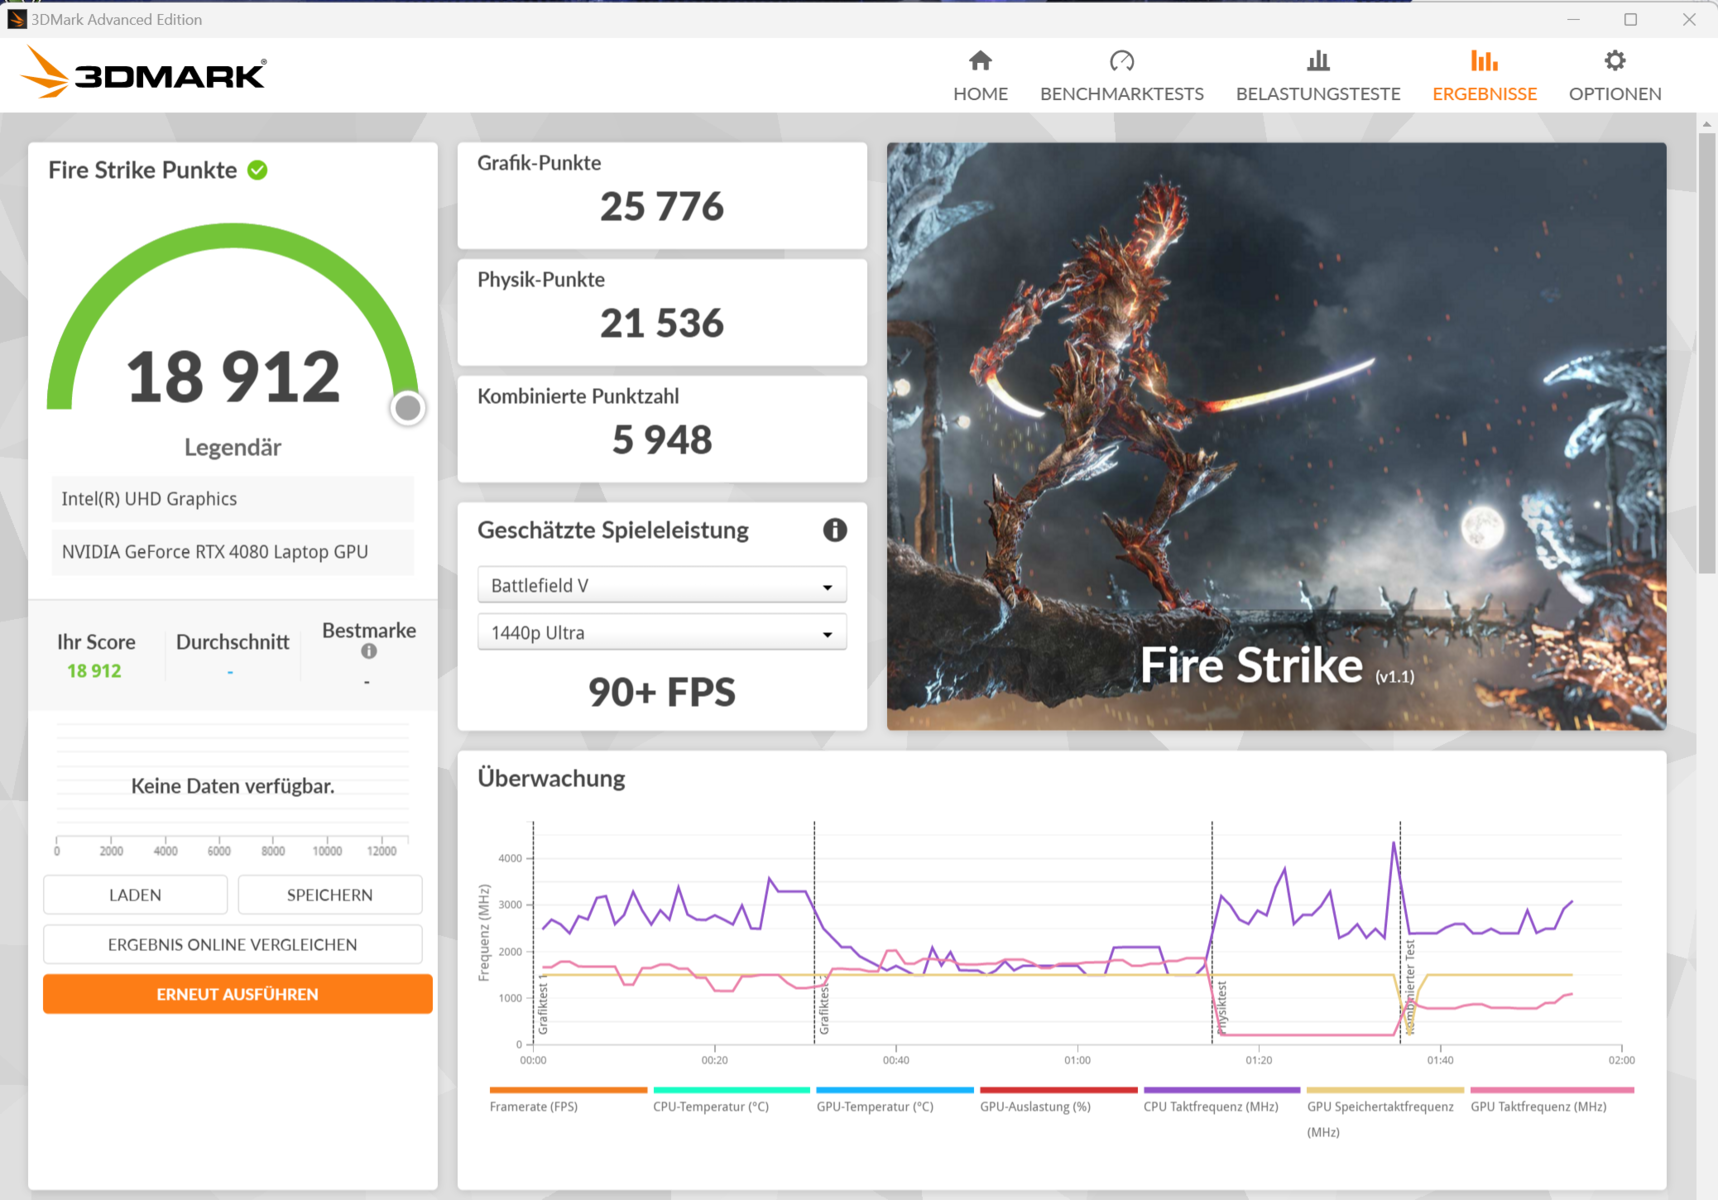
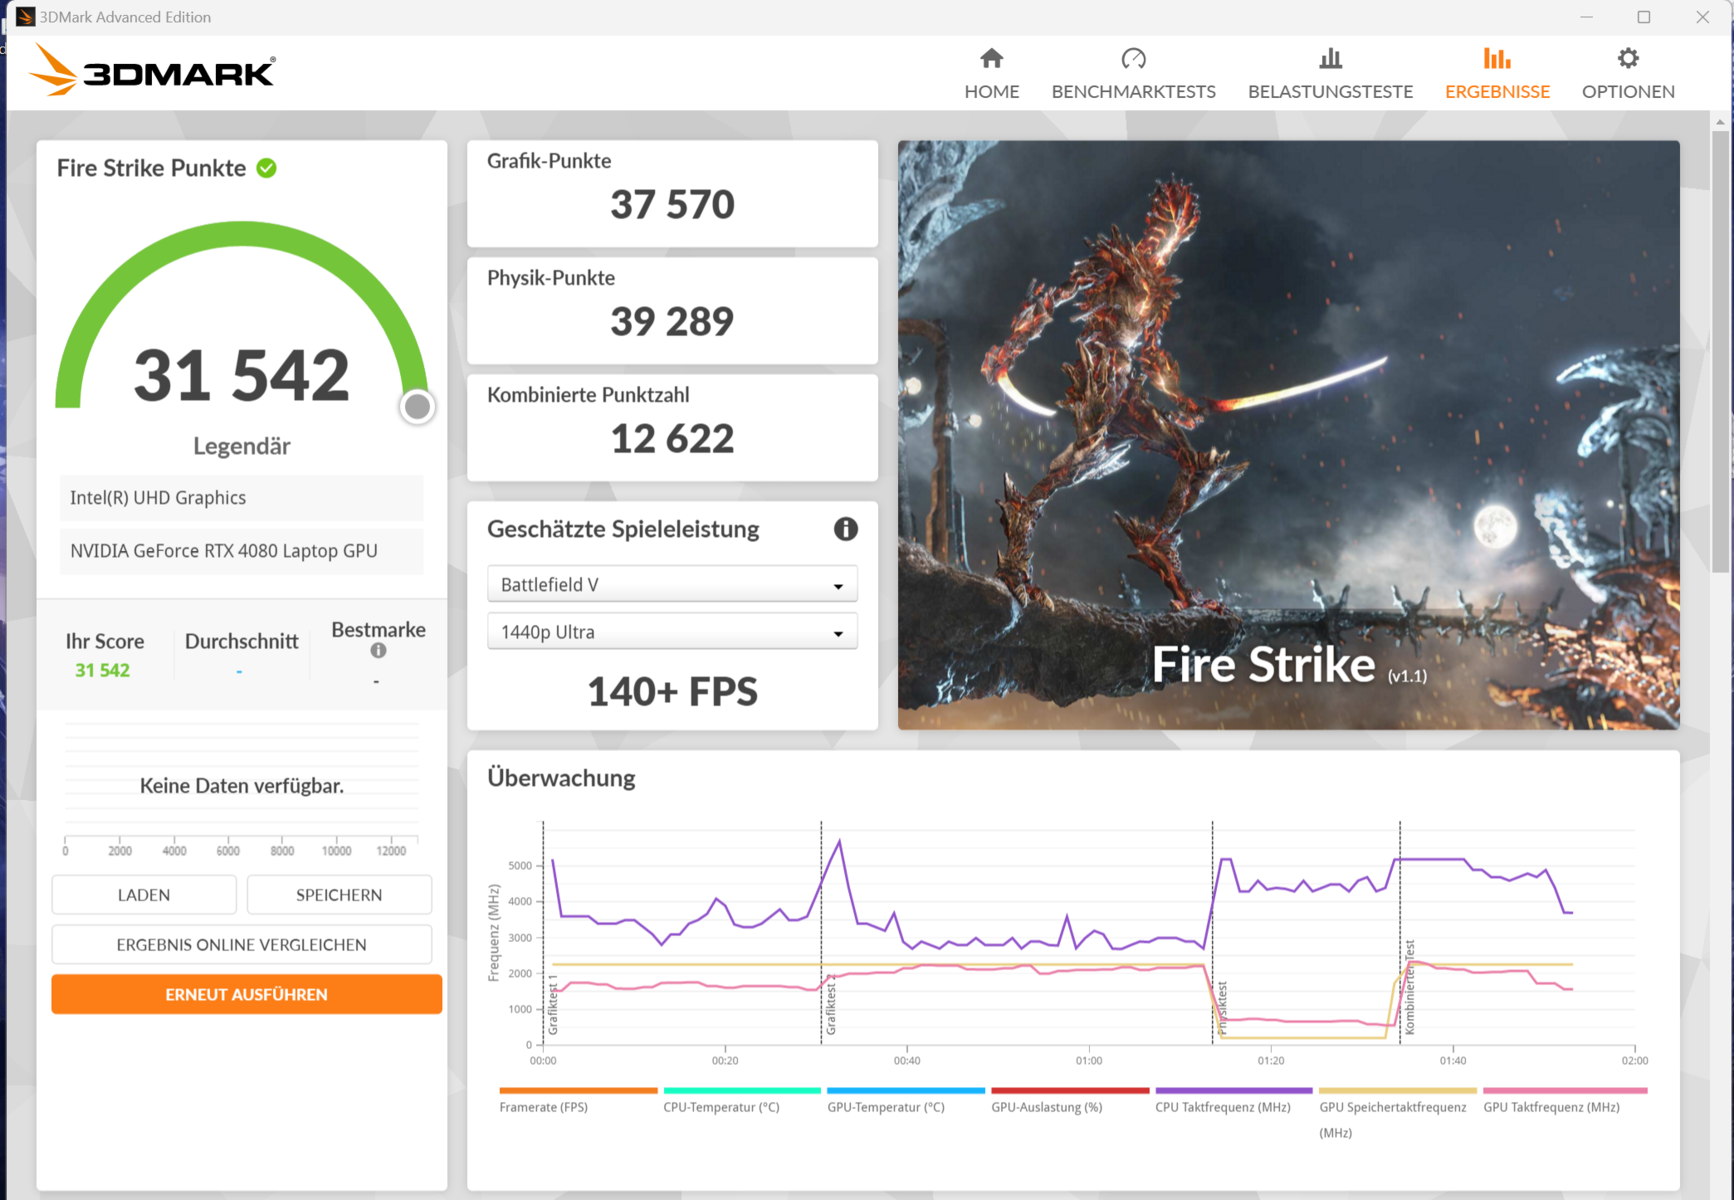
A Lenovo equipou o Legion Pro 7 com uma GeForce RTX 4080 (7.424 unidades de sombreamento, um barramento de memória de 192 bits, 12 GB de GDDR6, 175 watts), que é a atual número dois na linha de GPUs móveis da Nvidia. As pontuações de benchmark e as taxas de quadros obtidas em nossos testes estão acima do que o RTX 4080 Laptop pode fazer em média. Alguns desses resultados são os melhores que já vimos de uma RTX 4080 até agora. A alternância entre os modos dGPU-only e Optimus não requer reinicialização; o Optimus avançado também é suportado.
A placa de vídeo é potente o suficiente para jogos QHD em configurações altas ou máximas. Com a ajuda do DLSS 3 e do Frame Generation, o senhor também pode usar resoluções mais altas nas configurações máximas e com ray tracing ativado, mas somente em jogos compatíveis com esses recursos.
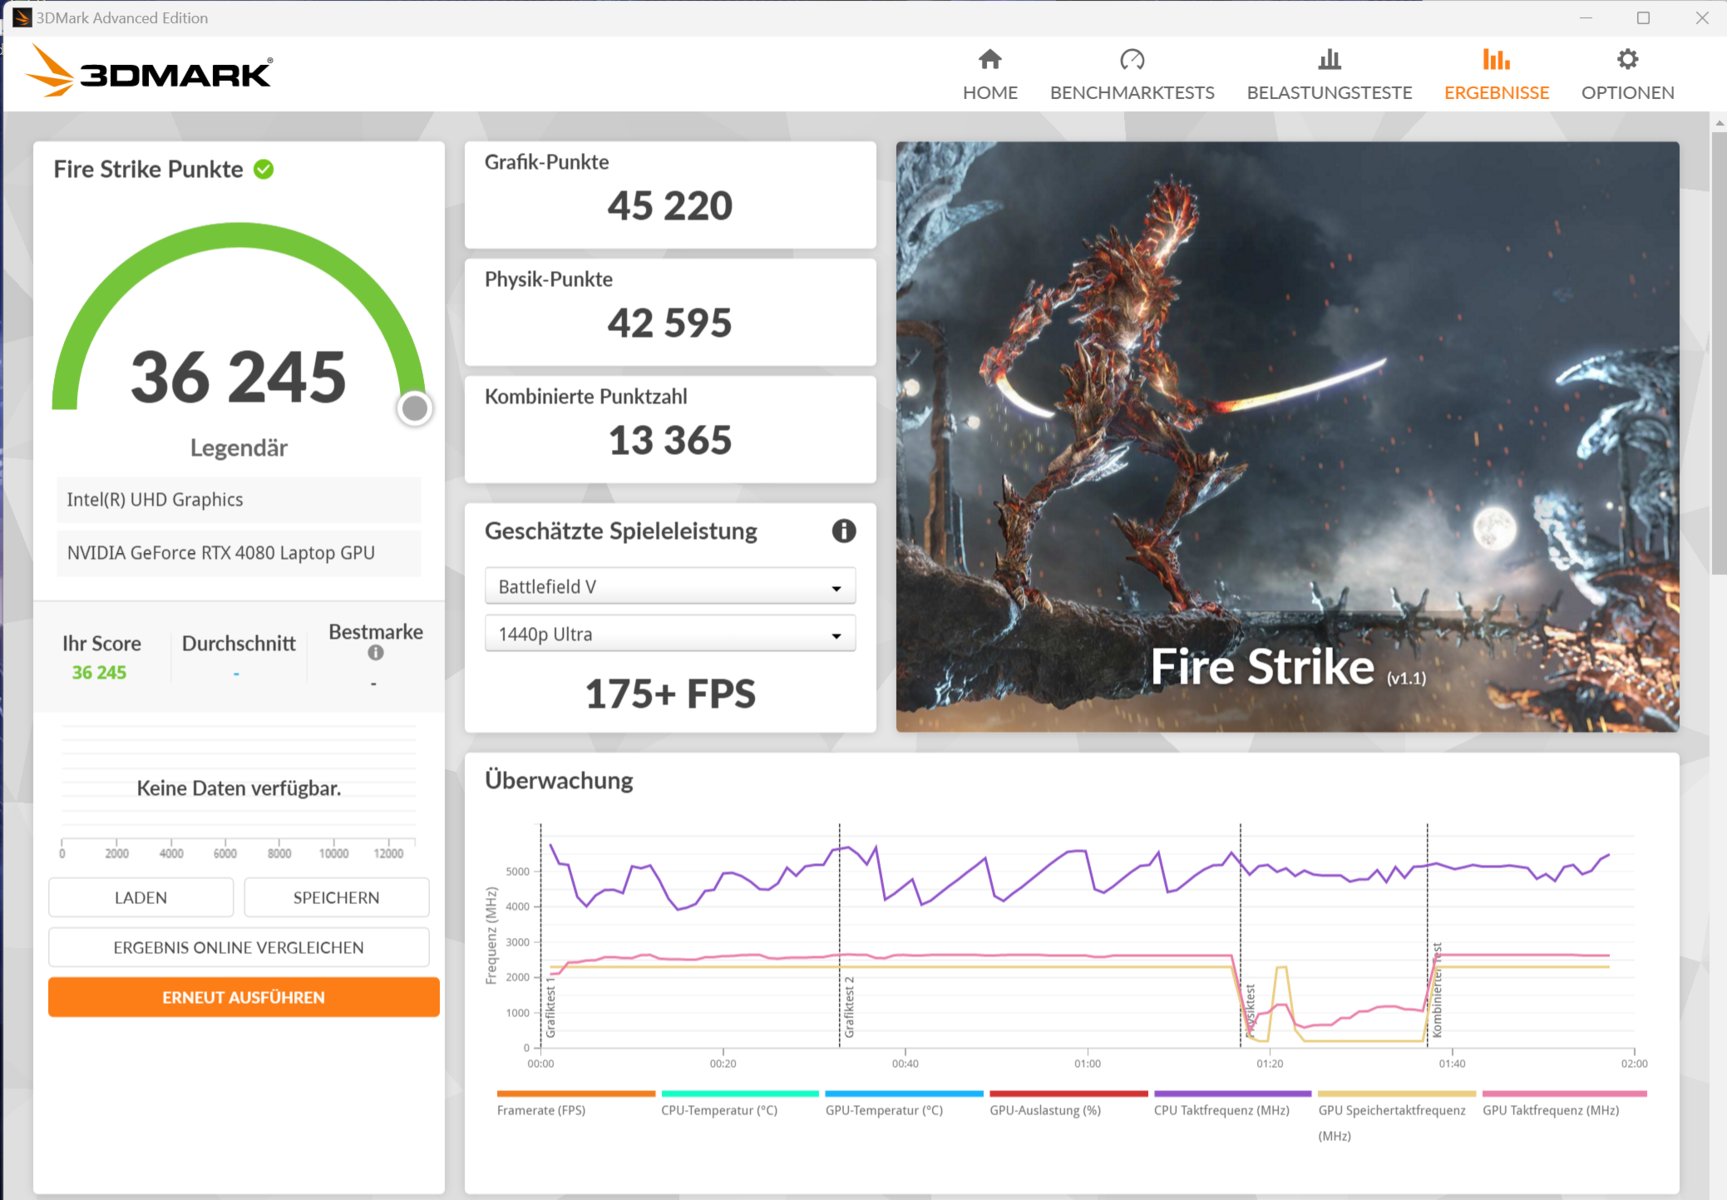
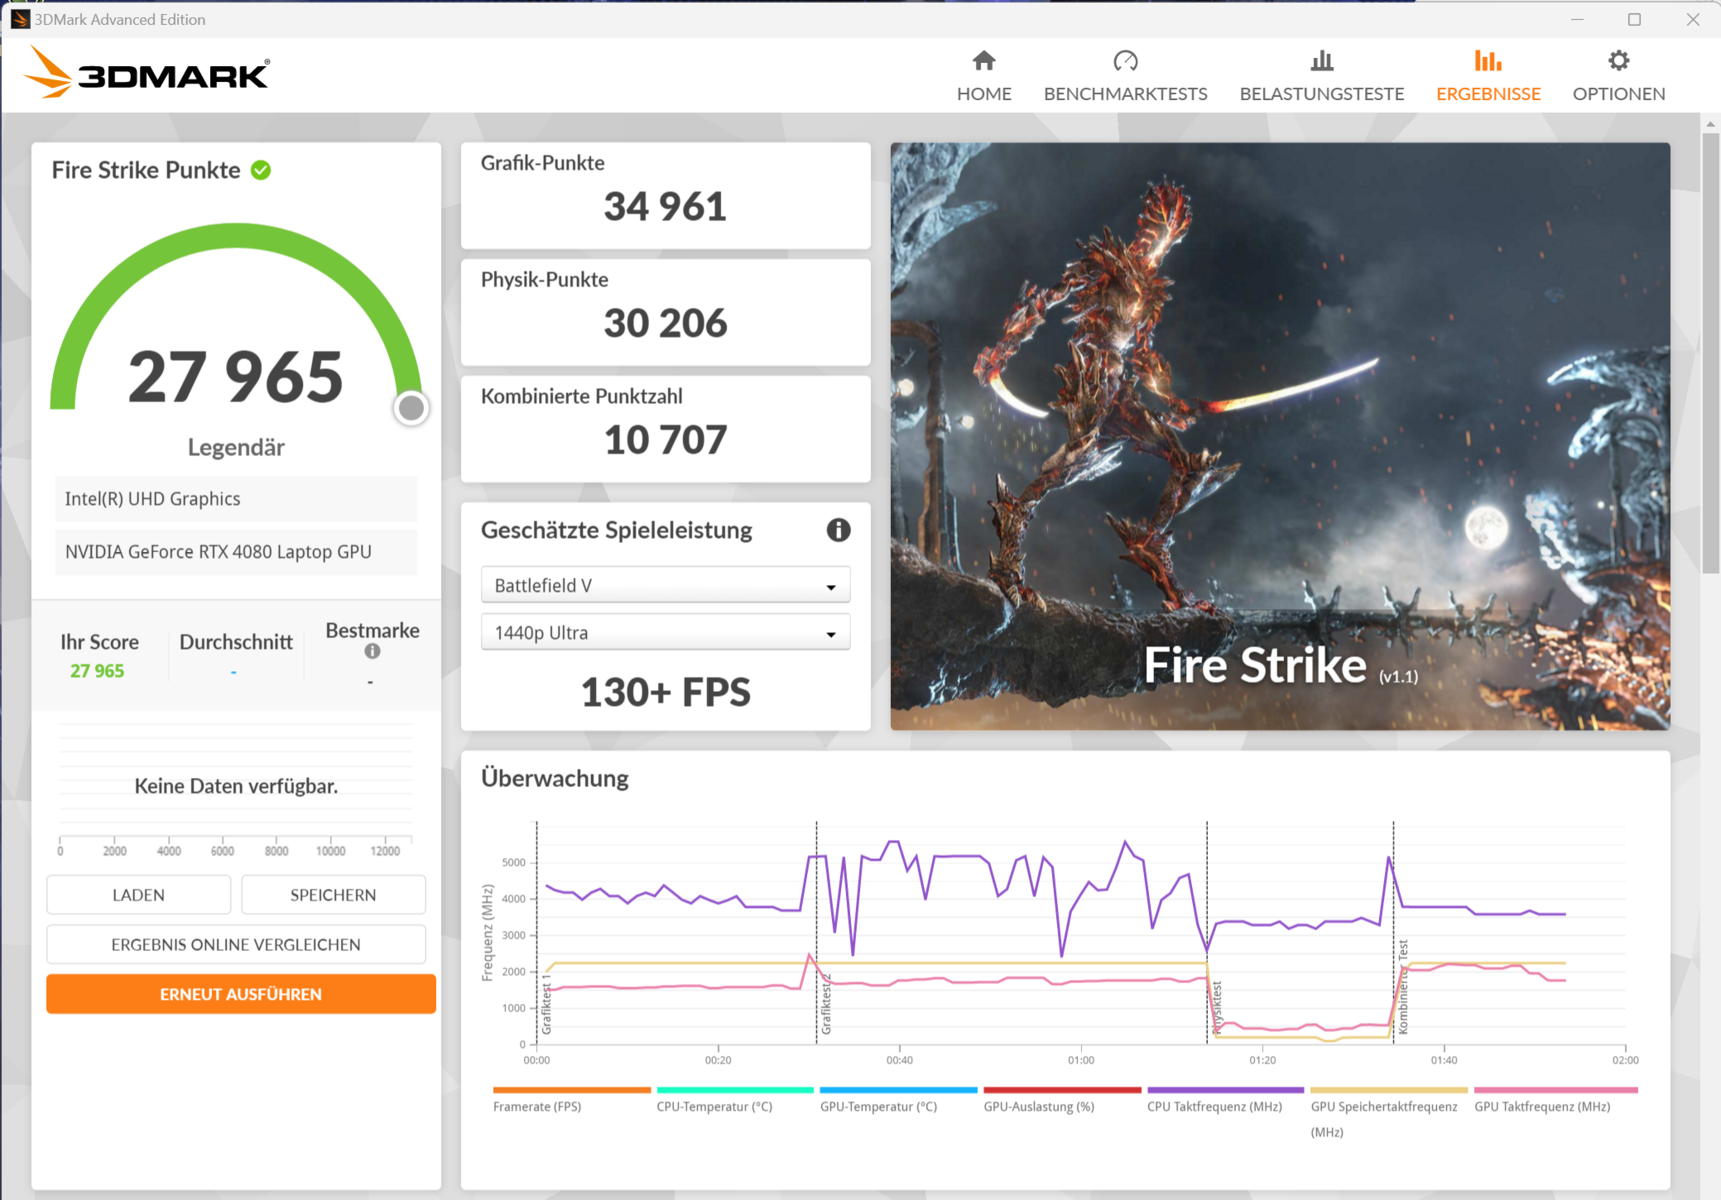
| 3DMark 11 Performance | 46847 pontos | |
| 3DMark Fire Strike Score | 36245 pontos | |
| 3DMark Time Spy Score | 19518 pontos | |
Ajuda | ||
* ... menor é melhor
| Performance rating - Percent | |
| Lenovo Legion Pro 7 16IRX9H | |
| MSI Vector 16 HX A14V | |
| Alienware m16 R1 AMD -1! | |
| Média NVIDIA GeForce RTX 4080 Laptop GPU | |
| Média da turma Gaming | |
| HP Omen 16 (2024) | |
| The Witcher 3 - 1920x1080 Ultra Graphics & Postprocessing (HBAO+) | |
| Média da turma Gaming (104.7 - 240, n=7, últimos 2 anos) | |
| Lenovo Legion Pro 7 16IRX9H | |
| MSI Vector 16 HX A14V | |
| Alienware m16 R1 AMD | |
| Média NVIDIA GeForce RTX 4080 Laptop GPU (130.4 - 186.1, n=20) | |
| HP Omen 16 (2024) | |
| GTA V - 1920x1080 Highest AA:4xMSAA + FX AF:16x | |
| Lenovo Legion Pro 7 16IRX9H | |
| MSI Vector 16 HX A14V | |
| Média da turma Gaming (48.3 - 186.9, n=94, últimos 2 anos) | |
| Média NVIDIA GeForce RTX 4080 Laptop GPU (102.9 - 152.7, n=21) | |
| HP Omen 16 (2024) | |
| Final Fantasy XV Benchmark - 1920x1080 High Quality | |
| MSI Vector 16 HX A14V | |
| Lenovo Legion Pro 7 16IRX9H | |
| Alienware m16 R1 AMD | |
| Média NVIDIA GeForce RTX 4080 Laptop GPU (129 - 182.1, n=23) | |
| Média da turma Gaming (41 - 215, n=95, últimos 2 anos) | |
| HP Omen 16 (2024) | |
| Strange Brigade - 1920x1080 ultra AA:ultra AF:16 | |
| Alienware m16 R1 AMD | |
| MSI Vector 16 HX A14V | |
| Lenovo Legion Pro 7 16IRX9H | |
| Média NVIDIA GeForce RTX 4080 Laptop GPU (239 - 357, n=22) | |
| Média da turma Gaming (76.3 - 458, n=87, últimos 2 anos) | |
| HP Omen 16 (2024) | |
| Dota 2 Reborn - 1920x1080 ultra (3/3) best looking | |
| Lenovo Legion Pro 7 16IRX9H | |
| MSI Vector 16 HX A14V | |
| Alienware m16 R1 AMD | |
| Média NVIDIA GeForce RTX 4080 Laptop GPU (133 - 194.7, n=23) | |
| HP Omen 16 (2024) | |
| Média da turma Gaming (84.8 - 248, n=107, últimos 2 anos) | |
| X-Plane 11.11 - 1920x1080 high (fps_test=3) | |
| MSI Vector 16 HX A14V | |
| Lenovo Legion Pro 7 16IRX9H | |
| HP Omen 16 (2024) | |
| Média NVIDIA GeForce RTX 4080 Laptop GPU (89.3 - 143.5, n=25) | |
| Alienware m16 R1 AMD | |
| Média da turma Gaming (55.5 - 143.5, n=109, últimos 2 anos) | |
| Cyberpunk 2077 | |
| 1920x1080 Ray Tracing Ultra Preset (DLSS off) | |
| Lenovo Legion Pro 7 16IRX9H | |
| MSI Vector 16 HX A14V | |
| Média NVIDIA GeForce RTX 4080 Laptop GPU (43.8 - 67.2, n=12) | |
| Média da turma Gaming (19.1 - 84.9, n=36, últimos 2 anos) | |
| HP Omen 16 (2024) | |
| 2560x1440 Ultra Preset (FSR off) | |
| MSI Vector 16 HX A14V | |
| Média da turma Gaming (24.8 - 122.8, n=93, últimos 2 anos) | |
| Lenovo Legion Pro 7 16IRX9H | |
| Média NVIDIA GeForce RTX 4080 Laptop GPU (56.2 - 86.3, n=15) | |
| HP Omen 16 (2024) | |
| 1920x1080 Ultra Preset (FSR off) | |
| MSI Vector 16 HX A14V | |
| Lenovo Legion Pro 7 16IRX9H | |
| Média NVIDIA GeForce RTX 4080 Laptop GPU (83.9 - 127.1, n=15) | |
| Média da turma Gaming (17.7 - 169.9, n=115, últimos 2 anos) | |
| HP Omen 16 (2024) | |
| 1920x1080 Ultra Preset (FSR2 on) | |
| Média da turma Gaming (58 - 173.1, n=7, últimos 2 anos) | |
| Lenovo Legion Pro 7 16IRX9H | |
| MSI Vector 16 HX A14V | |
| Média NVIDIA GeForce RTX 4080 Laptop GPU (94.6 - 128, n=8) | |
| HP Omen 16 (2024) | |
| Call of Duty Modern Warfare 3 2023 - 1920x1080 Extreme Preset | |
| Média NVIDIA GeForce RTX 4080 Laptop GPU (153 - 171, n=3) | |
| Lenovo Legion Pro 7 16IRX9H | |
| Média da turma Gaming (27 - 95, n=2, últimos 2 anos) | |
| Skull & Bones | |
| 1920x1080 Ultra High Preset AA:T | |
| Lenovo Legion Pro 7 16IRX9H | |
| Média NVIDIA GeForce RTX 4080 Laptop GPU (96 - 115, n=3) | |
| 2560x1440 Ultra High Preset AA:T | |
| Lenovo Legion Pro 7 16IRX9H | |
| Média NVIDIA GeForce RTX 4080 Laptop GPU (76 - 91, n=3) | |
| Assassin's Creed Mirage | |
| 1920x1080 Ultra High Preset (Adaptive Quality Off) | |
| Lenovo Legion Pro 7 16IRX9H | |
| Média NVIDIA GeForce RTX 4080 Laptop GPU (129 - 157, n=3) | |
| 2560x1440 Ultra High Preset (Adaptive Quality Off) | |
| Lenovo Legion Pro 7 16IRX9H | |
| Média NVIDIA GeForce RTX 4080 Laptop GPU (112 - 136, n=3) | |
| Avatar Frontiers of Pandora | |
| 1920x1080 Ultra Preset AA:T | |
| Média NVIDIA GeForce RTX 4080 Laptop GPU (87 - 97, n=4) | |
| Lenovo Legion Pro 7 16IRX9H | |
| Média da turma Gaming (n=1últimos 2 anos) | |
| 2560x1440 Ultra Preset AA:T | |
| Média NVIDIA GeForce RTX 4080 Laptop GPU (59 - 66, n=4) | |
| Lenovo Legion Pro 7 16IRX9H | |
| Média da turma Gaming (n=1últimos 2 anos) | |
| Last Epoch | |
| 1920x1080 Ultra Preset AA:T | |
| Lenovo Legion Pro 7 16IRX9H | |
| Média NVIDIA GeForce RTX 4080 Laptop GPU (156.5 - 204, n=2) | |
| Média da turma Gaming (n=1últimos 2 anos) | |
| 2560x1440 Ultra Preset AA:T | |
| Lenovo Legion Pro 7 16IRX9H | |
| Média NVIDIA GeForce RTX 4080 Laptop GPU (127.4 - 139, n=2) | |
| Média da turma Gaming (n=1últimos 2 anos) | |
| Alone in the Dark | |
| 1920x1080 Cinematic Preset | |
| Lenovo Legion Pro 7 16IRX9H | |
| Média NVIDIA GeForce RTX 4080 Laptop GPU (120 - 176.4, n=2) | |
| 2560x1440 Cinematic Preset | |
| Lenovo Legion Pro 7 16IRX9H | |
| Média NVIDIA GeForce RTX 4080 Laptop GPU (86 - 91.6, n=2) | |
| Horizon Forbidden West | |
| 1920x1080 Very High Preset AA:T | |
| Lenovo Legion Pro 7 16IRX9H | |
| Média NVIDIA GeForce RTX 4080 Laptop GPU (89.2 - 103.5, n=2) | |
| Média da turma Gaming (14.7 - 140.3, n=12, últimos 2 anos) | |
| 2560x1440 Very High Preset AA:T | |
| Lenovo Legion Pro 7 16IRX9H | |
| Média NVIDIA GeForce RTX 4080 Laptop GPU (71 - 83.7, n=2) | |
| Média da turma Gaming (45.7 - 100.9, n=9, últimos 2 anos) | |
Witcher 3 FPS chart
| baixo | média | alto | ultra | QHD | |
|---|---|---|---|---|---|
| GTA V (2015) | 187.2 | 186.6 | 186.5 | 152 | 135.3 |
| The Witcher 3 (2015) | 628.4 | 518.3 | 342.2 | 186.1 | 142.6 |
| Dota 2 Reborn (2015) | 229 | 211 | 197.3 | 183.5 | |
| Final Fantasy XV Benchmark (2018) | 232 | 211 | 173.1 | 139.3 | |
| X-Plane 11.11 (2018) | 196.4 | 162.3 | 127.5 | ||
| Strange Brigade (2018) | 538 | 446 | 377 | 339 | 243 |
| Cyberpunk 2077 (2023) | 152.3 | 137.2 | 126.7 | 118.3 | 79.1 |
| Assassin's Creed Mirage (2023) | 208 | 207 | 199 | 157 | 136 |
| Call of Duty Modern Warfare 3 2023 (2023) | 224 | 205 | 164 | 153 | 110 |
| Avatar Frontiers of Pandora (2023) | 141 | 130 | 114 | 89 | 59 |
| Skull & Bones (2024) | 161 | 151 | 135 | 112 | 89 |
| Last Epoch (2024) | 248 | 237 | 229 | 204 | 139 |
| Alone in the Dark (2024) | 249 | 230 | 214 | 176.4 | 91.6 |
| Horizon Forbidden West (2024) | 153.3 | 145.5 | 108.1 | 103.5 | 83.7 |
Emissões e gerenciamento de energia - O laptop Lenovo pode funcionar silenciosamente
Emissões de ruído
O nível de ruído chegou a 56 dB(A) sob carga no modo Performance. O modo Equilibrado oferece um bom equilíbrio entre ruído e desempenho; o modo Silencioso poupa os nervos, mas causa uma queda considerável no desempenho. Em geral, o laptop é silencioso e, às vezes, até mesmo silencioso no modo inativo e no uso diário (por exemplo, aplicativos de escritório, navegação na Internet). É uma pena que tenhamos notado um ruído eletrônico (suave) ocasionalmente vindo do interior da nossa unidade de análise.
Barulho
| Ocioso |
| 25 / 30 / 45 dB |
| Carga |
| 50 / 56 dB |
 | ||
30 dB silencioso 40 dB(A) audível 50 dB(A) ruidosamente alto |
||
min: | ||
| Lenovo Legion Pro 7 16IRX9H i9-14900HX, GeForce RTX 4080 Laptop GPU | Alienware m16 R1 AMD R9 7845HX, GeForce RTX 4080 Laptop GPU | MSI Vector 16 HX A14V i9-14900HX, GeForce RTX 4080 Laptop GPU | HP Omen 16 (2024) i9-14900HX, GeForce RTX 4080 Laptop GPU | Lenovo Legion Pro 7 16IRX8H i9-13900HX, GeForce RTX 4080 Laptop GPU | |
|---|---|---|---|---|---|
| Noise | 13% | -7% | 7% | 4% | |
| desligado / ambiente * (dB) | 24 | 22.9 5% | 23.2 3% | 25 -4% | 24 -0% |
| Idle Minimum * (dB) | 25 | 22.9 8% | 33.5 -34% | 29 -16% | 26 -4% |
| Idle Average * (dB) | 30 | 29.7 1% | 33.5 -12% | 30 -0% | 28 7% |
| Idle Maximum * (dB) | 45 | 29.7 34% | 33.5 26% | 31 31% | 34 24% |
| Load Average * (dB) | 50 | 29.8 40% | 52.1 -4% | 46 8% | 47 6% |
| Witcher 3 ultra * (dB) | 54 | 54.7 -1% | 62 -15% | 47 13% | 55 -2% |
| Load Maximum * (dB) | 56 | 54.7 2% | 62 -11% | 47 16% | 56 -0% |
* ... menor é melhor
Temperatura
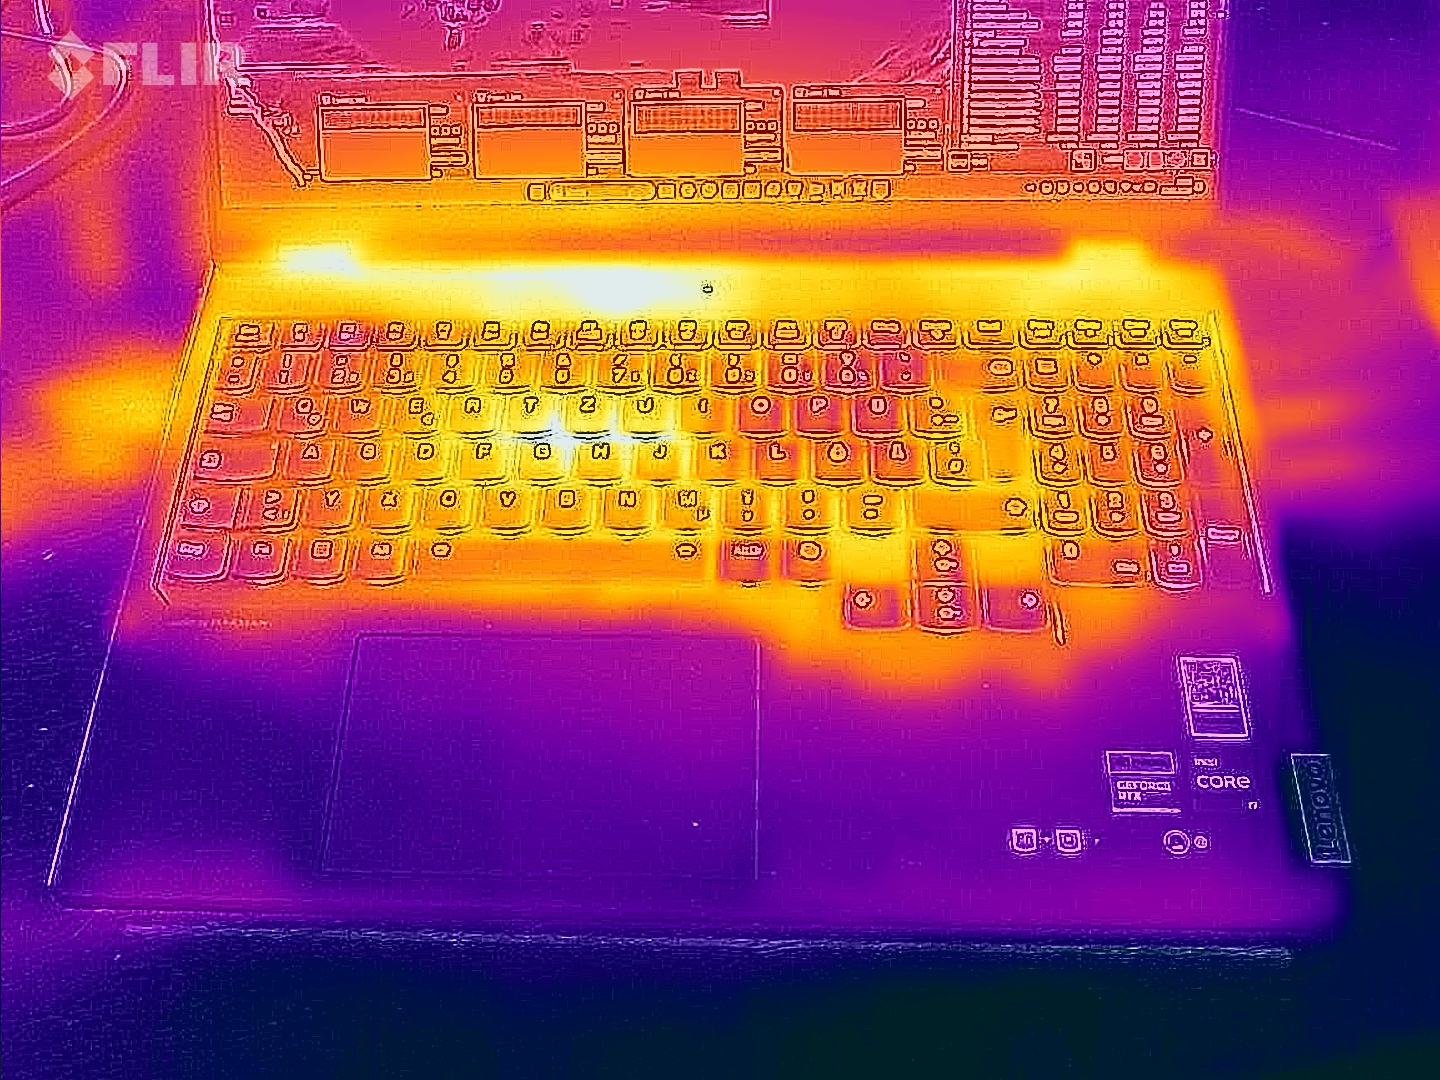
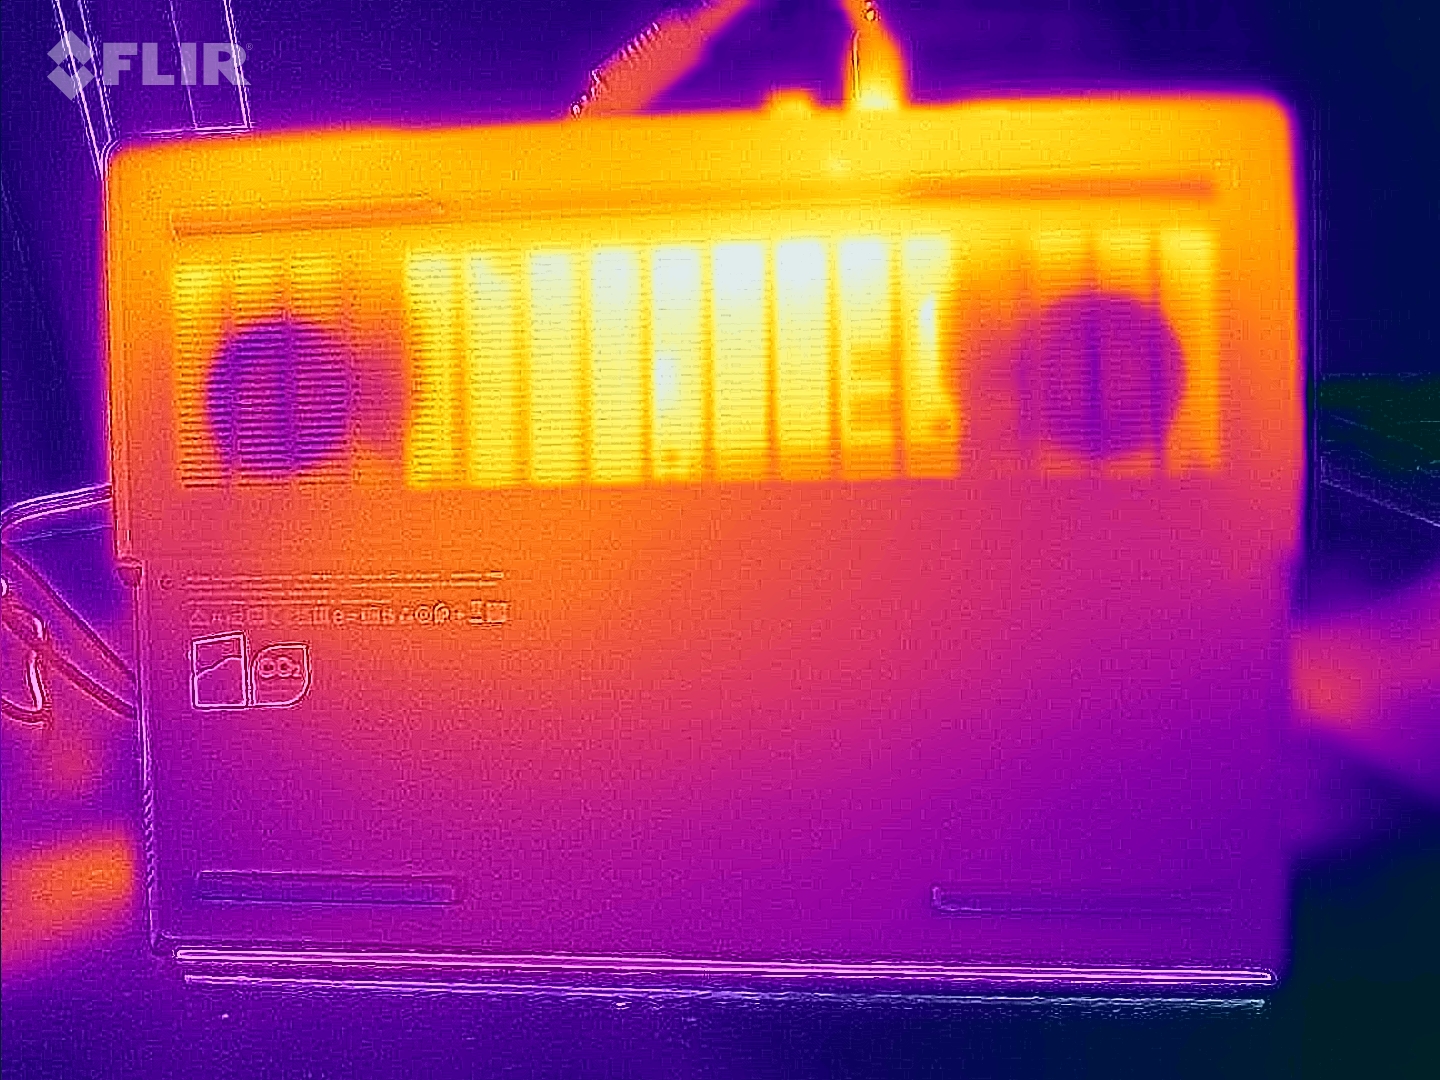
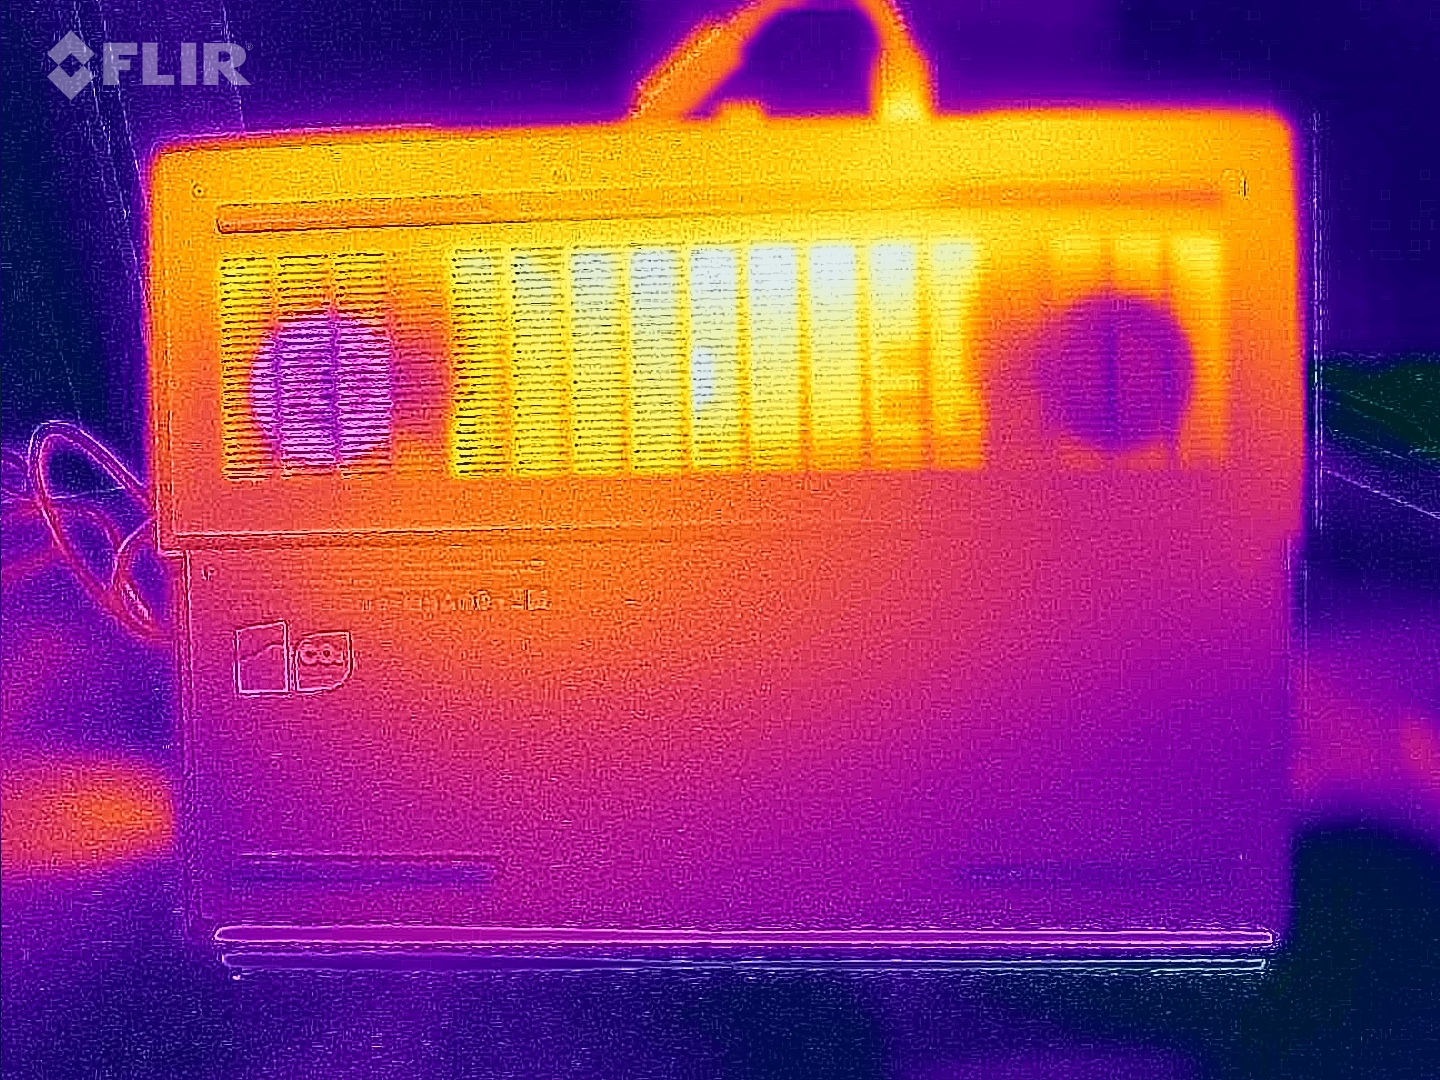
O notebook ficou visivelmente mais quente durante o teste de estresse e o teste Witcher 3. Alguns pontos do chassi chegaram a ultrapassar os 50°C (122°F). As temperaturas do chassi permaneceram dentro de uma faixa confortável no uso diário, como aplicativos de escritório e navegação na Internet.
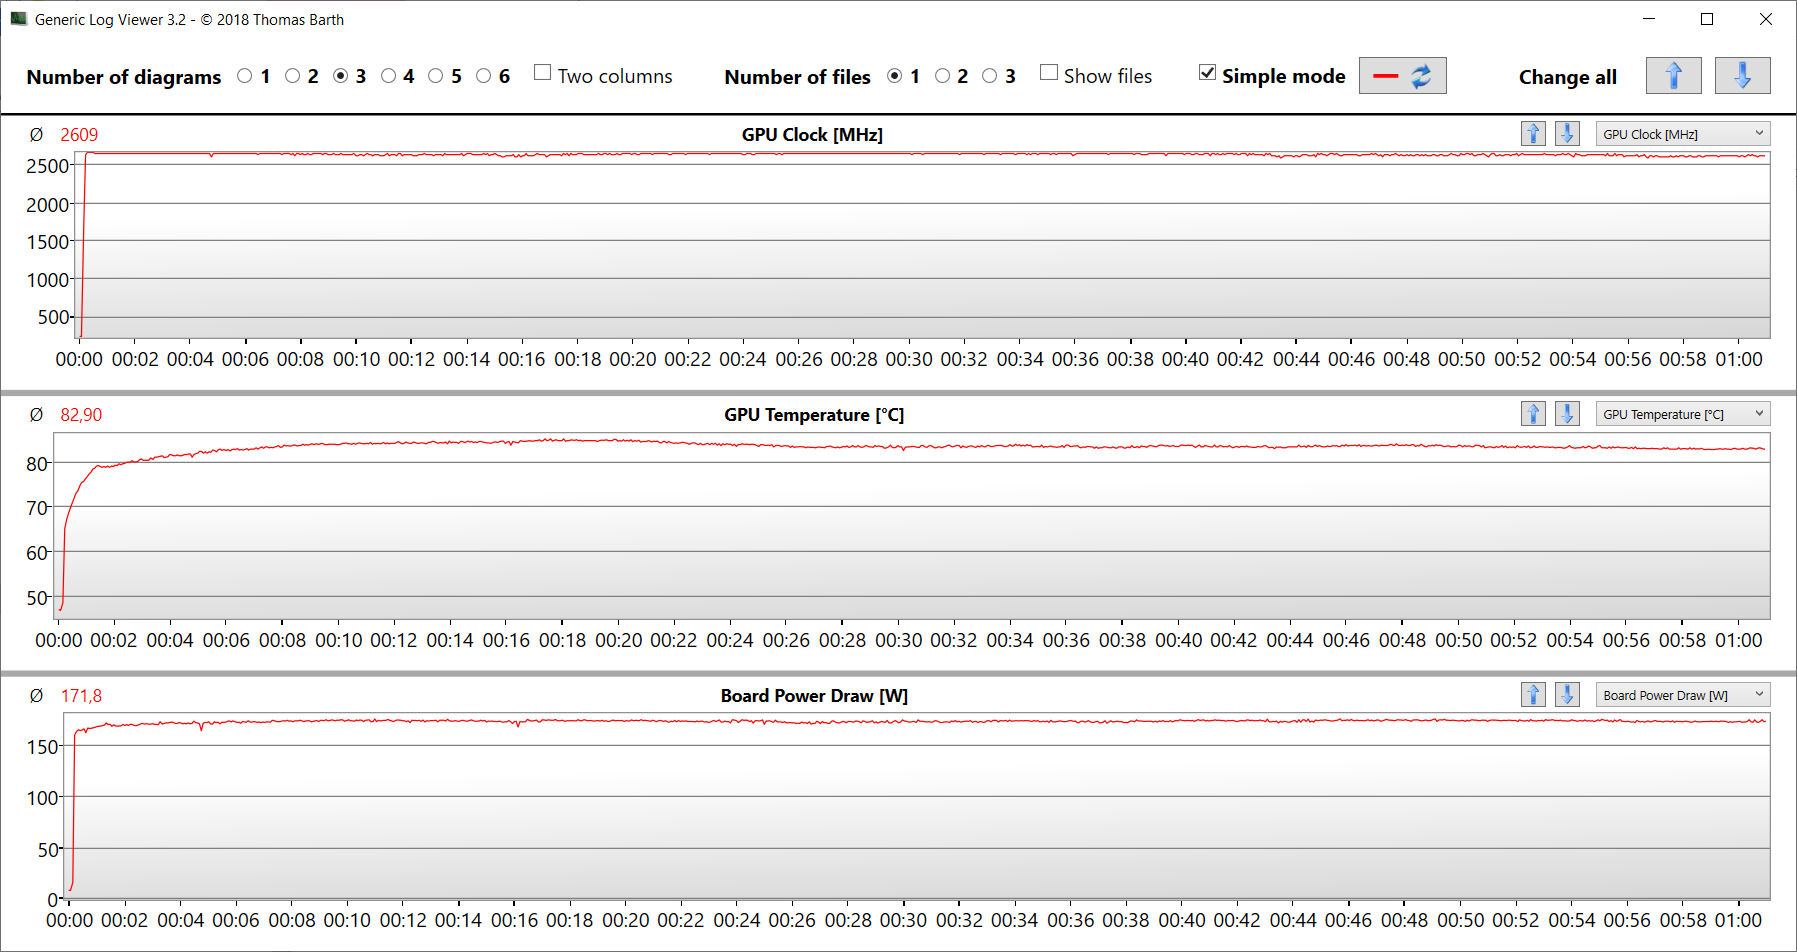
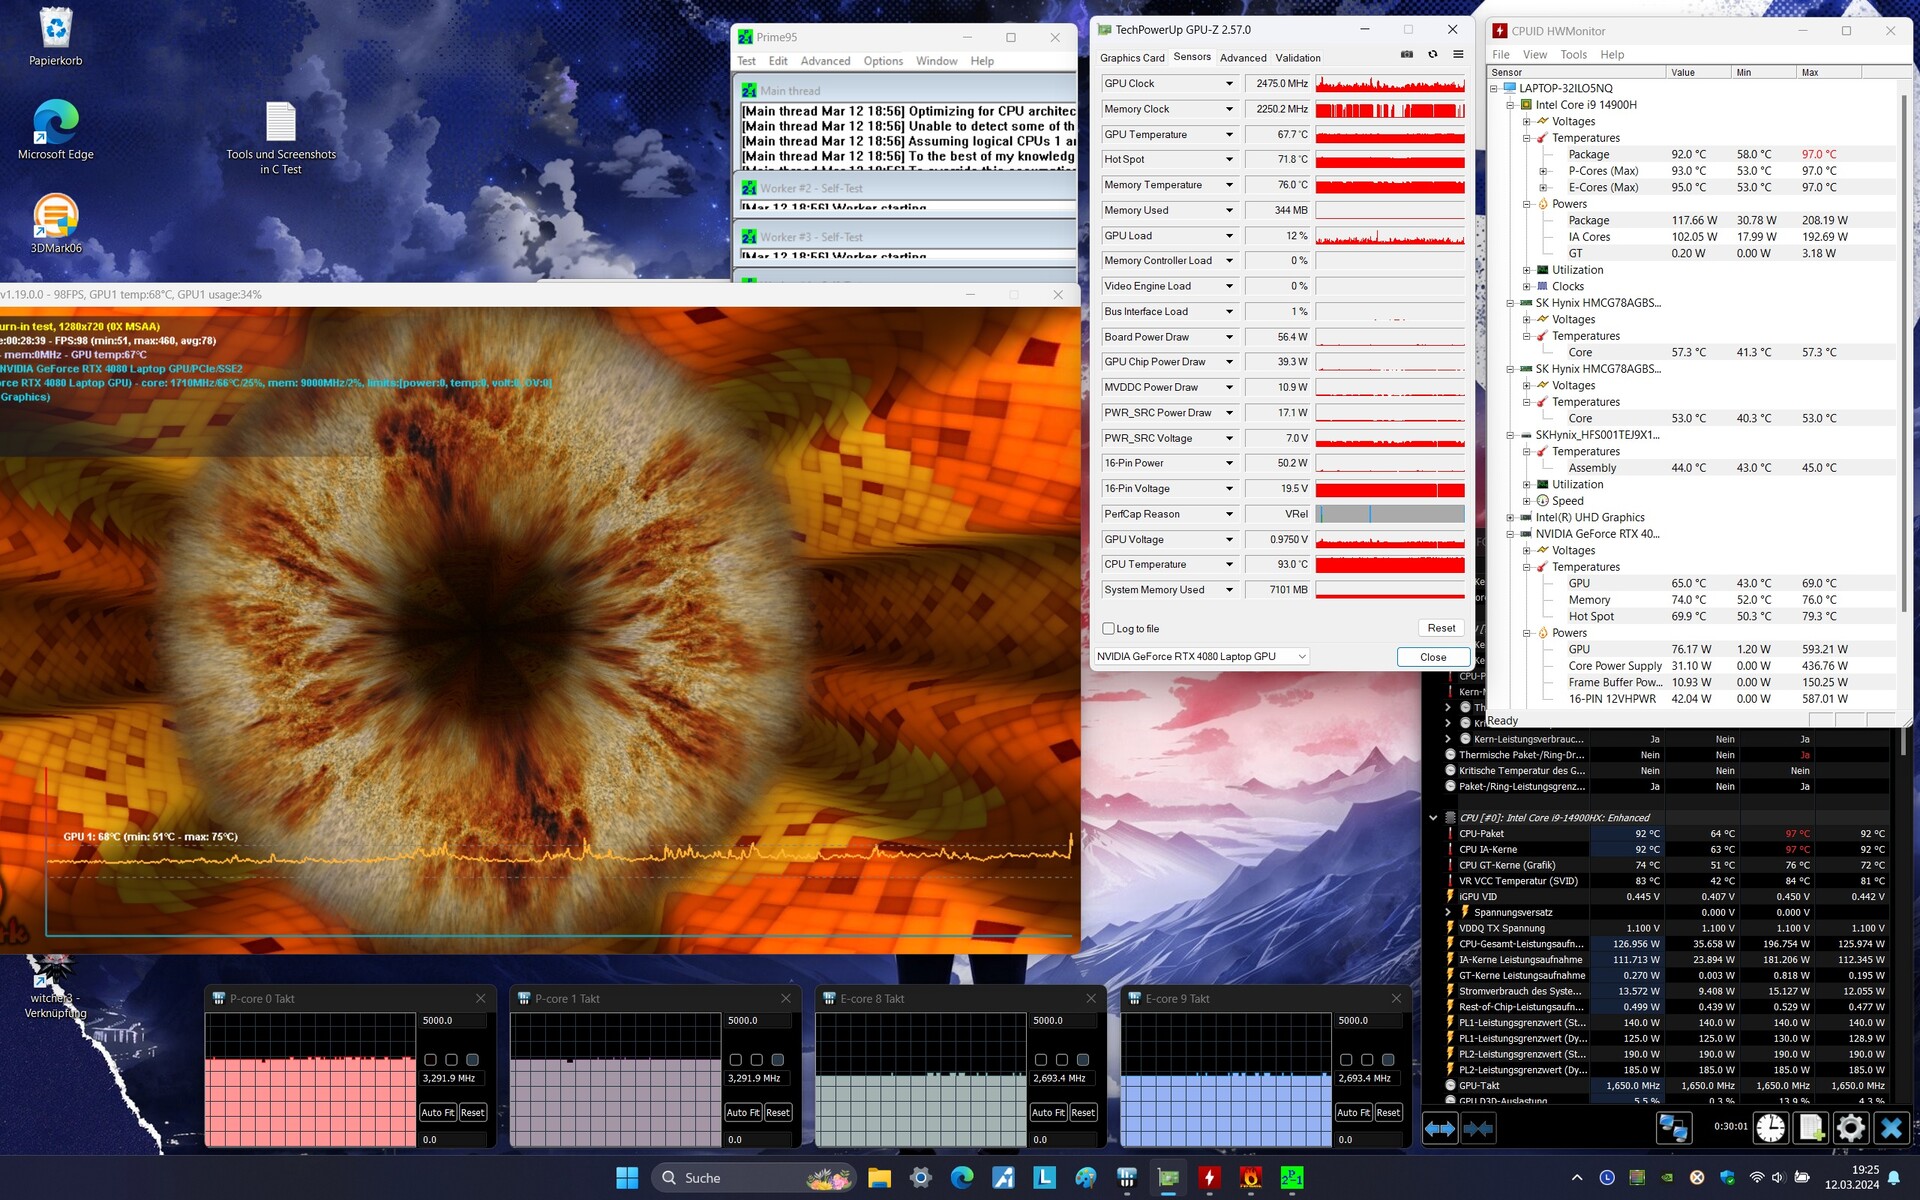
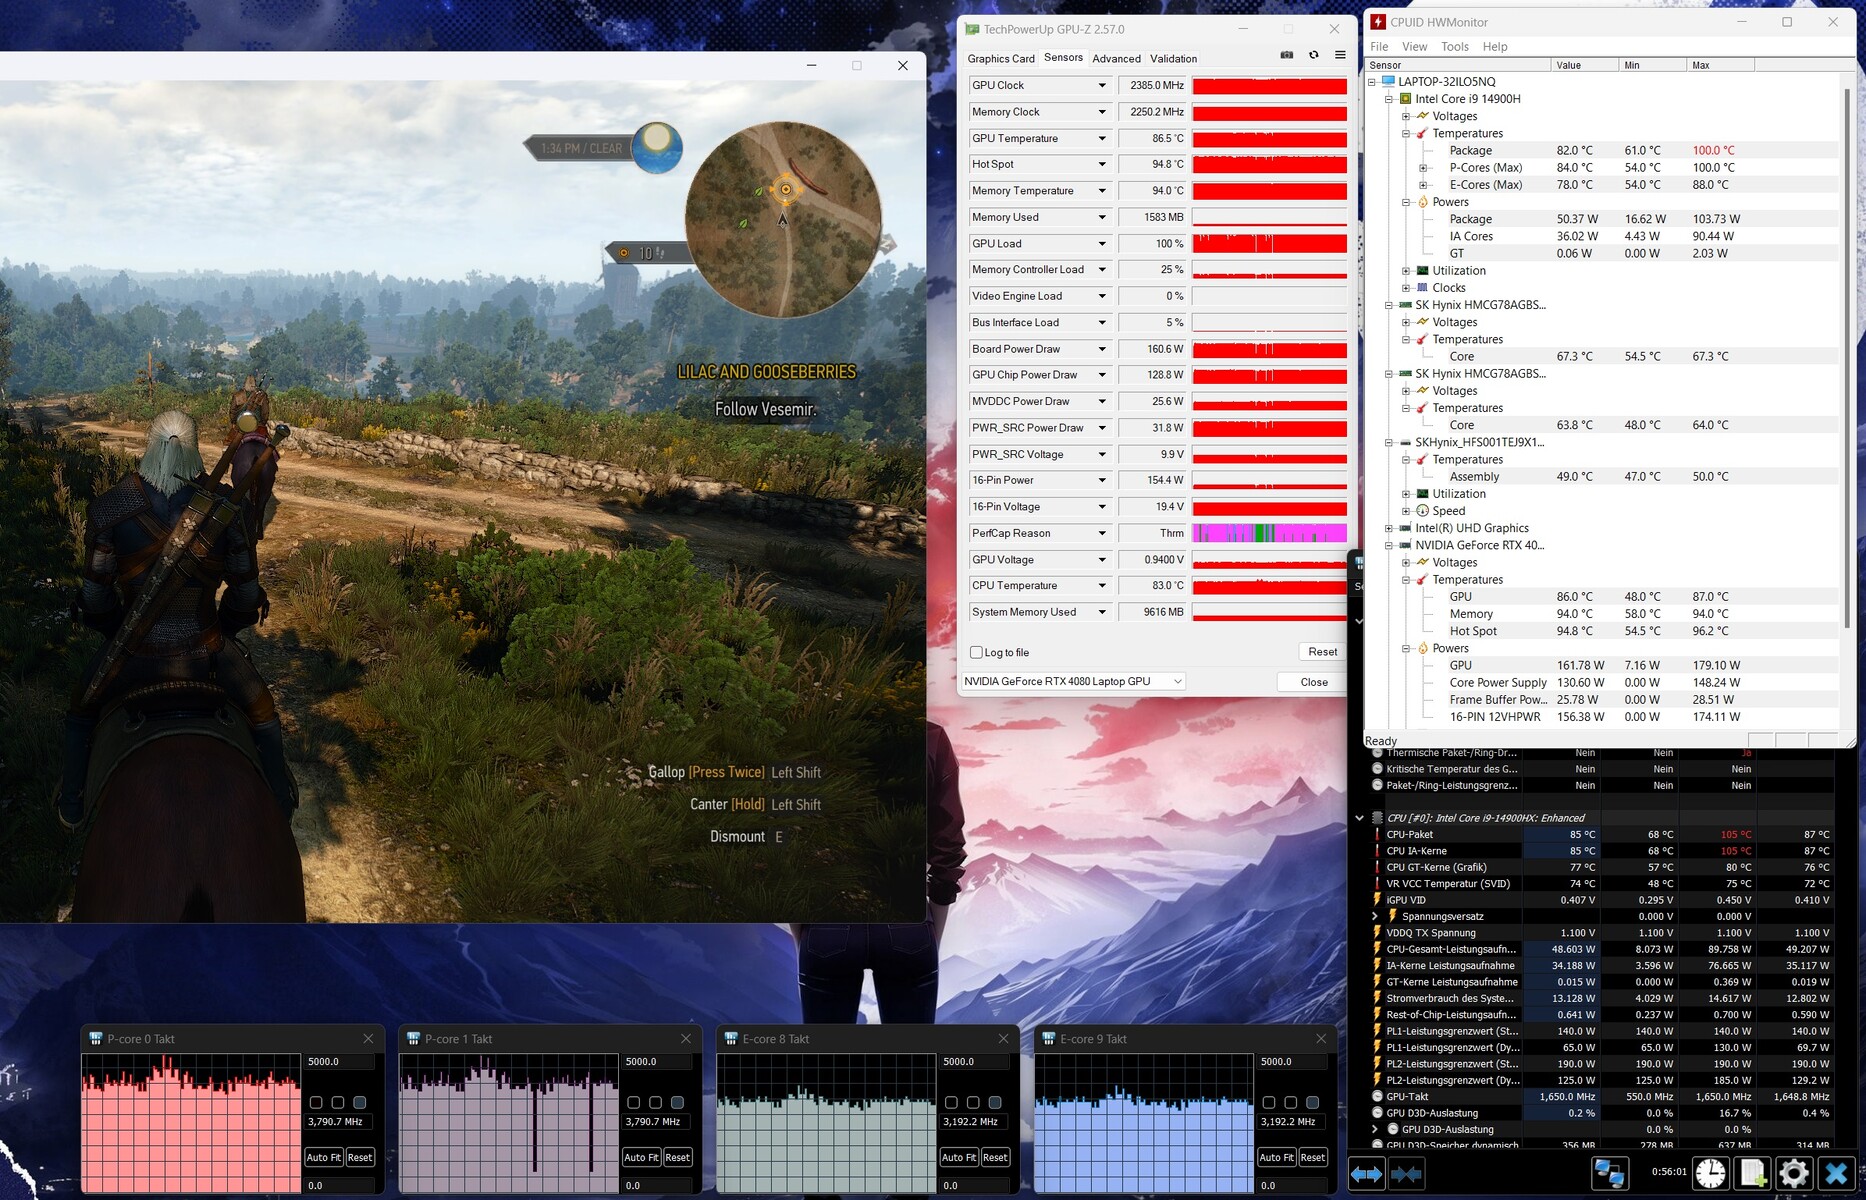
Nosso teste de estresse envolve a execução simultânea do Prime95 e do FurMark por um período prolongado e foi projetado para determinar a estabilidade de um sistema sob carga total. Tanto a CPU quanto a GPU foram capazes de manter altas velocidades de clock durante o teste.
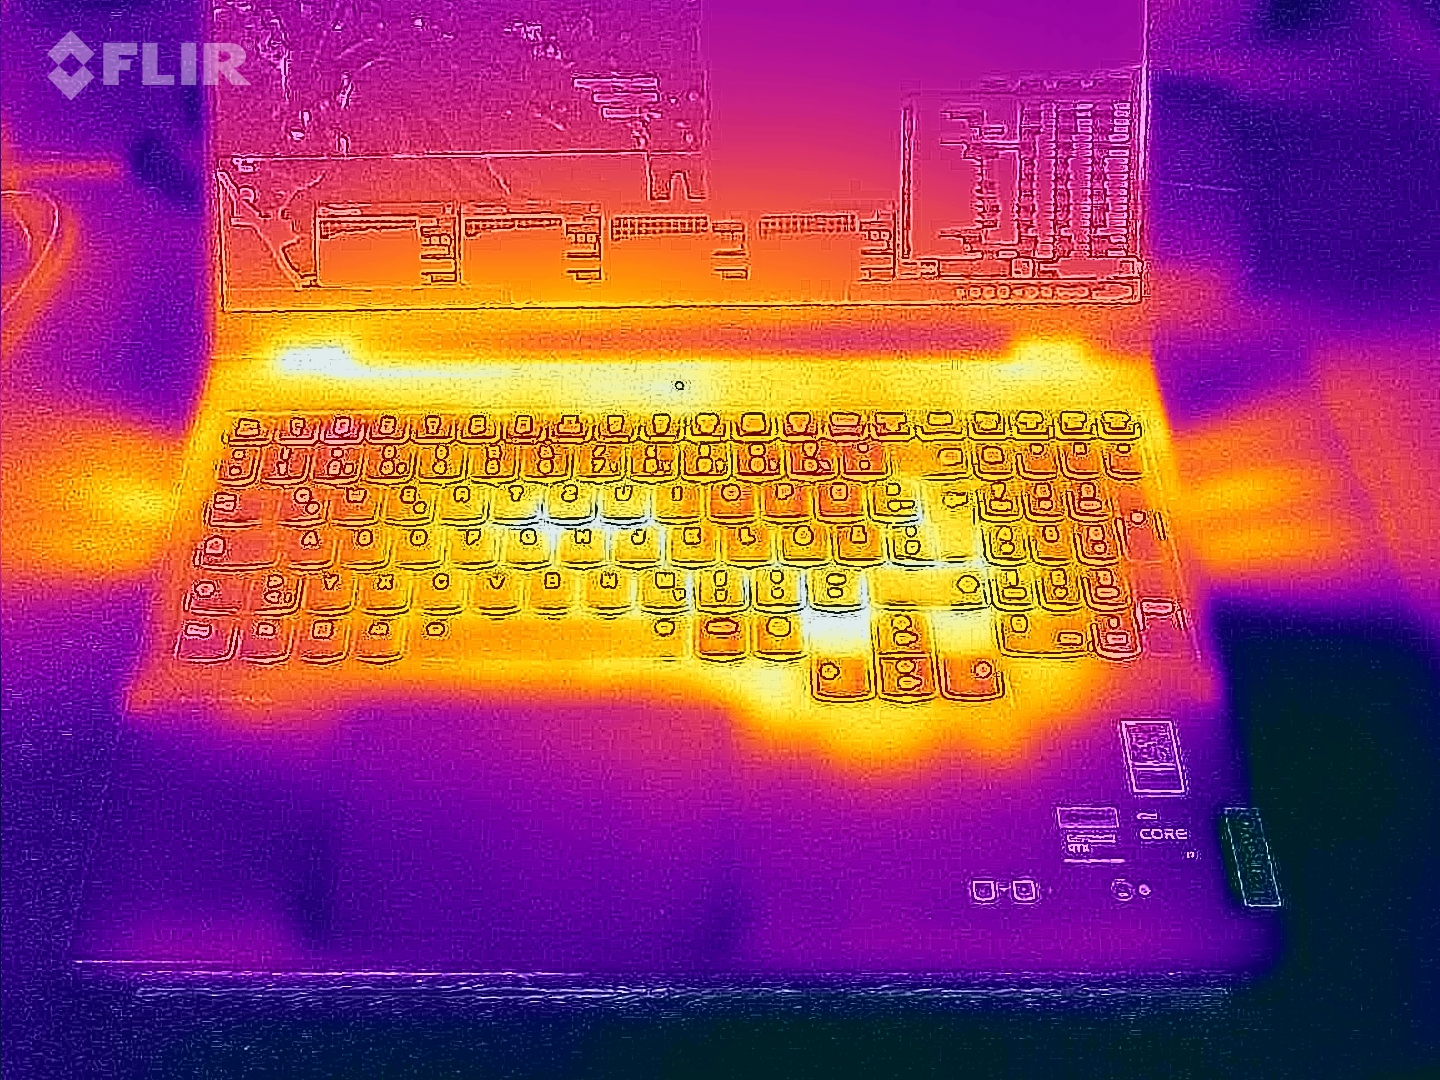
(-) A temperatura máxima no lado superior é 46 °C / 115 F, em comparação com a média de 40.4 °C / 105 F , variando de 21.2 a 68.8 °C para a classe Gaming.
(-) A parte inferior aquece até um máximo de 49 °C / 120 F, em comparação com a média de 43.2 °C / 110 F
(±) Em uso inativo, a temperatura média para o lado superior é 33.3 °C / 92 F, em comparação com a média do dispositivo de 33.9 °C / ### class_avg_f### F.
(-) Jogando The Witcher 3, a temperatura média para o lado superior é 42.7 °C / 109 F, em comparação com a média do dispositivo de 33.9 °C / ## #class_avg_f### F.
(-) Os apoios para as mãos e o touchpad podem ficar muito quentes ao toque, com um máximo de 40 °C / 104 F.
(-) A temperatura média da área do apoio para as mãos de dispositivos semelhantes foi 28.8 °C / 83.8 F (-11.2 °C / -20.2 F).
| Lenovo Legion Pro 7 16IRX9H i9-14900HX, GeForce RTX 4080 Laptop GPU | Alienware m16 R1 AMD R9 7845HX, GeForce RTX 4080 Laptop GPU | MSI Vector 16 HX A14V i9-14900HX, GeForce RTX 4080 Laptop GPU | HP Omen 16 (2024) i9-14900HX, GeForce RTX 4080 Laptop GPU | Lenovo Legion Pro 7 16IRX8H i9-13900HX, GeForce RTX 4080 Laptop GPU | |
|---|---|---|---|---|---|
| Heat | 5% | 26% | 12% | 1% | |
| Maximum Upper Side * (°C) | 46 | 48 -4% | 36.4 21% | 47 -2% | 48 -4% |
| Maximum Bottom * (°C) | 49 | 39 20% | 35.6 27% | 57 -16% | 49 -0% |
| Idle Upper Side * (°C) | 38 | 37 3% | 26.6 30% | 25 34% | 40 -5% |
| Idle Bottom * (°C) | 37 | 36.2 2% | 27 27% | 26 30% | 33 11% |
* ... menor é melhor
Alto-falantes
Os alto-falantes estéreo produzem um som excelente, considerando todos os aspectos.
Lenovo Legion Pro 7 16IRX9H análise de áudio
(+) | os alto-falantes podem tocar relativamente alto (###valor### dB)
Graves 100 - 315Hz
(±) | graves reduzidos - em média 8.9% menor que a mediana
(±) | a linearidade dos graves é média (7.4% delta para a frequência anterior)
Médios 400 - 2.000 Hz
(+) | médios equilibrados - apenas 2.8% longe da mediana
(+) | médios são lineares (4% delta para frequência anterior)
Altos 2 - 16 kHz
(+) | agudos equilibrados - apenas 3% longe da mediana
(+) | os máximos são lineares (5% delta da frequência anterior)
Geral 100 - 16.000 Hz
(+) | o som geral é linear (8.4% diferença em relação à mediana)
Comparado com a mesma classe
» 2% de todos os dispositivos testados nesta classe foram melhores, 1% semelhantes, 97% piores
» O melhor teve um delta de 6%, a média foi 18%, o pior foi 132%
Comparado com todos os dispositivos testados
» 2% de todos os dispositivos testados foram melhores, 1% semelhantes, 97% piores
» O melhor teve um delta de 4%, a média foi 23%, o pior foi 134%
HP Omen 16 (2024) análise de áudio
(±) | o volume do alto-falante é médio, mas bom (###valor### dB)
Graves 100 - 315Hz
(-) | quase nenhum baixo - em média 15.2% menor que a mediana
(±) | a linearidade dos graves é média (14.3% delta para a frequência anterior)
Médios 400 - 2.000 Hz
(+) | médios equilibrados - apenas 4.8% longe da mediana
(+) | médios são lineares (5% delta para frequência anterior)
Altos 2 - 16 kHz
(+) | agudos equilibrados - apenas 2% longe da mediana
(+) | os máximos são lineares (4.1% delta da frequência anterior)
Geral 100 - 16.000 Hz
(+) | o som geral é linear (14.7% diferença em relação à mediana)
Comparado com a mesma classe
» 29% de todos os dispositivos testados nesta classe foram melhores, 7% semelhantes, 64% piores
» O melhor teve um delta de 6%, a média foi 18%, o pior foi 132%
Comparado com todos os dispositivos testados
» 19% de todos os dispositivos testados foram melhores, 4% semelhantes, 77% piores
» O melhor teve um delta de 4%, a média foi 23%, o pior foi 134%
Consumo de energia
Não há surpresas no que diz respeito ao consumo de energia. Os níveis de uso estão em um nível típico para o hardware interno. O Legion Pro 7 concluiu nosso teste Witcher 3 e o teste de estresse com um nível consistente de uso de energia. O carregador de 330 watts incluído é suficientemente potente para o laptop.
| desligado | |
| Ocioso | |
| Carga |
|
Key:
min: | |
Power consumption Witcher 3 / Stress test
Power consumption with external monitor
Duração da bateria
O laptop de 16 polegadas durou 6h 13min em nosso teste realista de Wi-Fi, que simula uma carga ao acessar sites usando um script. O Legion tem a melhor duração de bateria entre todos os dispositivos em nossa comparação.
Pro
Contra
Veredicto - Potente laptop de ponta

Com o Legion Pro 7, a Lenovo oferece um notebook potente de 16 polegadas para jogadores e criadores. A bordo do notebook há uma tela QHD+ de 16 polegadas (2.560 x 1.600 pixels, DCI-P3, G-Sync, HDR, 240 Hz) com uma proporção de 16:10, ideal para o trabalho.
O Lenovo Legion Pro 7 16IRX9H oferece uma grande quantidade de potência a um preço razoável.
O GeForce RTX 4080 e o Core i9-14900HX em seu interior conseguiram alcançar seus novos melhores resultados em alguns dos testes - ambos os chips são, sem dúvida, capazes de funcionar a todo vapor constantemente. Não há como evitar as altas quantidades de calor e ruído comuns a essa classe de laptop. No entanto, há um modo Silencioso para aliviar esse problema, mas ao custo do desempenho.
Duas portas USB-C (1x Thunderbolt 4, 1x USB 3.2 Gen 2) facilitam a integração do laptop em uma configuração de trabalho existente e abrem opções de expansão (por exemplo, GPU externa, docks). Ambas as portas são capazes de emitir um sinal DisplayPort e uma delas suporta até mesmo o Power Delivery. A duração da bateria é bastante razoável.
O MSI Vector 16 HX A14V é uma alternativa que vale a pena considerar. Ele está no mesmo nível do Legion em termos de desempenho, mas a duração da bateria é um pouco menor.
Preço e disponibilidade
Na Europa, o modelo Lenovo Legion Pro 7 apresentado aqui está disponível a partir de €2.999 (US$3.245) Campuspoint.de und Notebooksbilliger.de depois de considerar os descontos especiais para estudantes e educadores.
Embora o novo Legion Pro 7 ainda não esteja disponível nos EUA, é possível encontrar seu antecessor por cerca de US$ 2.490 na Amazon US. Esse modelo específico tem um Core i9-13900HX de última geração, mas, fora isso, é praticamente o mesmo.
Lenovo Legion Pro 7 16IRX9H
- 03/25/2024 v7 (old)
Sascha Mölck
Transparência
A seleção dos dispositivos a serem analisados é feita pela nossa equipe editorial. A amostra de teste foi fornecida ao autor como empréstimo pelo fabricante ou varejista para fins desta revisão. O credor não teve influência nesta revisão, nem o fabricante recebeu uma cópia desta revisão antes da publicação. Não houve obrigação de publicar esta revisão. Como empresa de mídia independente, a Notebookcheck não está sujeita à autoridade de fabricantes, varejistas ou editores.
É assim que o Notebookcheck está testando
Todos os anos, o Notebookcheck analisa de forma independente centenas de laptops e smartphones usando procedimentos padronizados para garantir que todos os resultados sejam comparáveis. Desenvolvemos continuamente nossos métodos de teste há cerca de 20 anos e definimos padrões da indústria no processo. Em nossos laboratórios de teste, equipamentos de medição de alta qualidade são utilizados por técnicos e editores experientes. Esses testes envolvem um processo de validação em vários estágios. Nosso complexo sistema de classificação é baseado em centenas de medições e benchmarks bem fundamentados, o que mantém a objetividade.Price comparison

