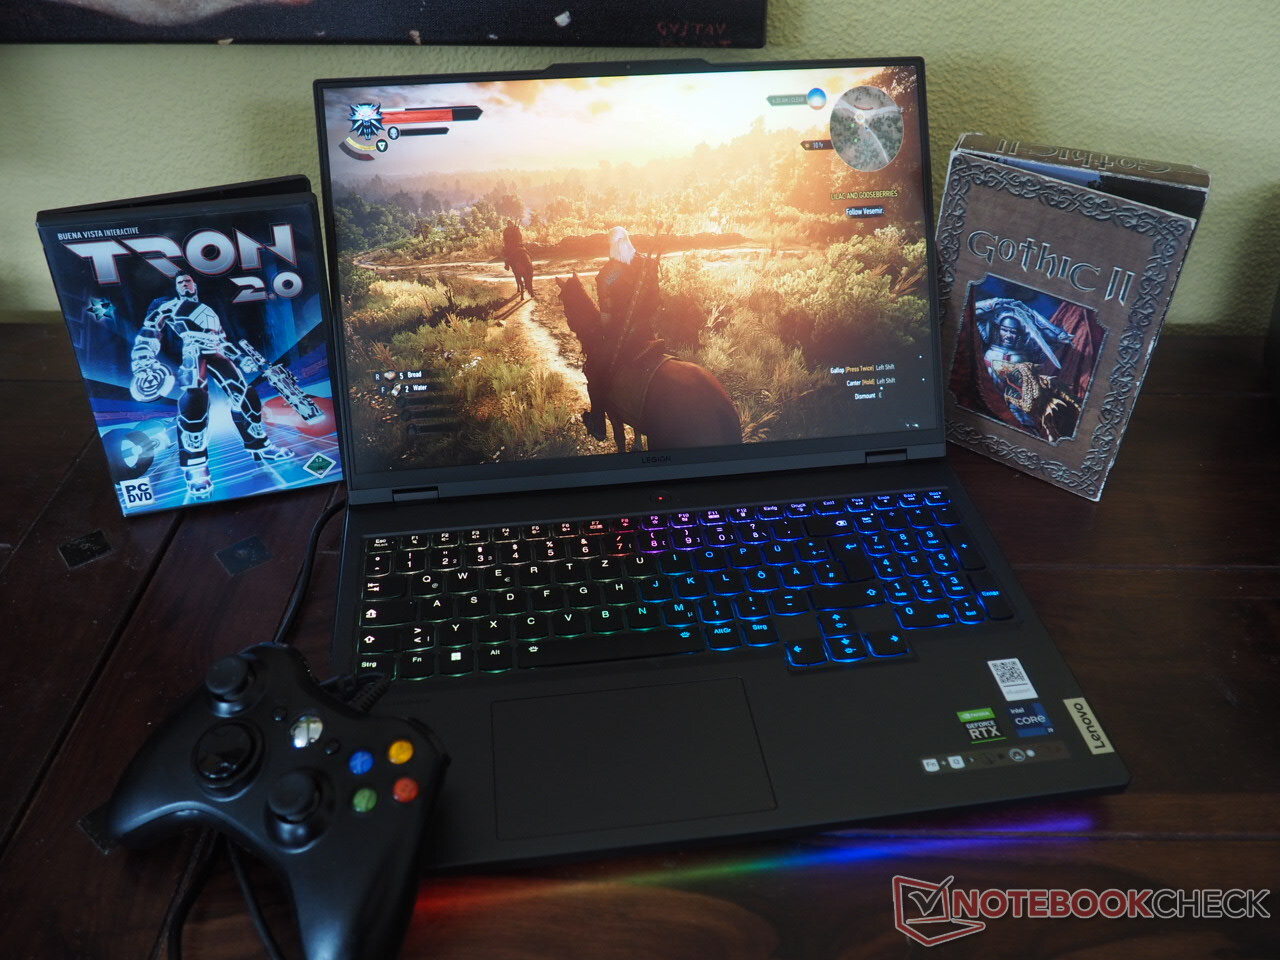
Lenovo Legion Pro 7 16IRX8H Revisão: Potência de alto desempenho RTX 4080

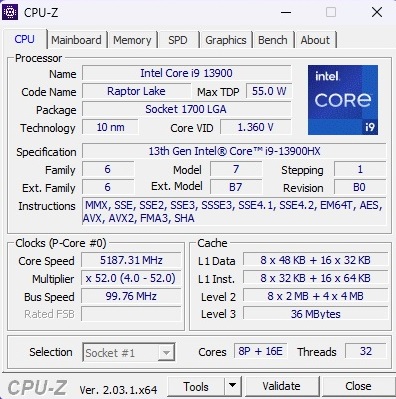
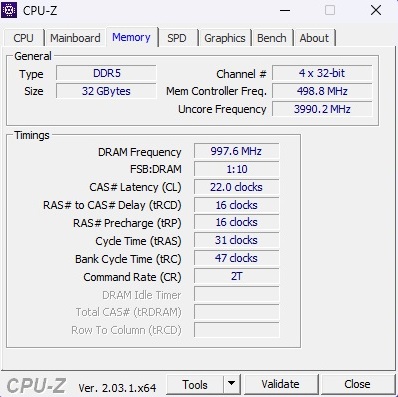
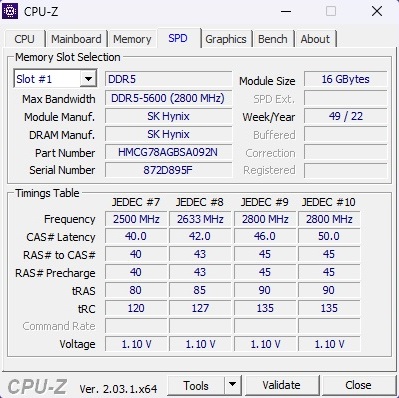
Com um preço de varejo próximo a 4.000 euros, a Lenovo Legion Pro 7 16IRX8H, que agora temos para revisão, não pode realmente ser considerada uma pechincha. No entanto, este preço lhe oferece um Núcleo i9-13900HX32 GB de DDR5-5600-RAM (2x 16 GB), e um 1 TB PCIe Gen 4x4 NVMe M.2 2280 SSD.
O Nvidia GeForce RTX 4080 GPU para notebookcom 12 GB GDDR6 VRAM cuida de tarefas gráficas exigentes. A tela IPS mate em formato 16:10 com uma resolução de 2560 x 1600 pixels é classificada para atingir 100% sRGB e 500 lêndeas de brilho de pico. A Lenovo equipou o painel de 240 Hz com suporte para Nvidia G-Sync, além do AMD FreeSync, o que é uma coisa boa.
O Windows 11 Home vem instalado como o sistema operacional de sua escolha.
A principal competição da Lenovo Legion 7 Pro até agora é aLâmina Razer 16 Início de 2023embora também seja interessante ver como as tarifas dos laptops são comparadas às da geração anterior. Portanto, incluímos também Legion 7 SKUs com as seguintes combinações:Core i9-12900HXeRTX 3080 Ti, Ryzen 9 5900HXeRTX 3080e o Ryzen 9 6900HXe RX 6850M XT.
Possíveis concorrentes em comparação
Avaliação | Data | Modelo | Peso | Altura | Size | Resolução | Preço |
|---|---|---|---|---|---|---|---|
| 89.4 % v7 (old) | 02/2023 | Lenovo Legion Pro 7 16IRX8H i9-13900HX, GeForce RTX 4080 Laptop GPU | 2.7 kg | 26 mm | 16.00" | 2560x1600 | |
| 91.2 % v7 (old) | 02/2023 | Razer Blade 16 Early 2023 i9-13950HX, GeForce RTX 4080 Laptop GPU | 2.4 kg | 21.99 mm | 16.00" | 2560x1600 | |
| 88.9 % v7 (old) | 09/2022 | Lenovo Legion 7 16IAX7-82TD004SGE i9-12900HX, GeForce RTX 3080 Ti Laptop GPU | 2.6 kg | 20 mm | 16.00" | 2560x1600 | |
| 88.1 % v7 (old) | 06/2021 | Lenovo Legion 7 16ACHg6 R9 5900HX, GeForce RTX 3080 Laptop GPU | 2.5 kg | 23.5 mm | 16.00" | 2560x1600 | |
| 90.8 % v7 (old) | 09/2022 | Lenovo Legion 7 16ARHA7 R9 6900HX, Radeon RX 6850M XT | 2.6 kg | 19.4 mm | 16.00" | 2560x1600 |
Caso: Não muito diferente de seu predecessor
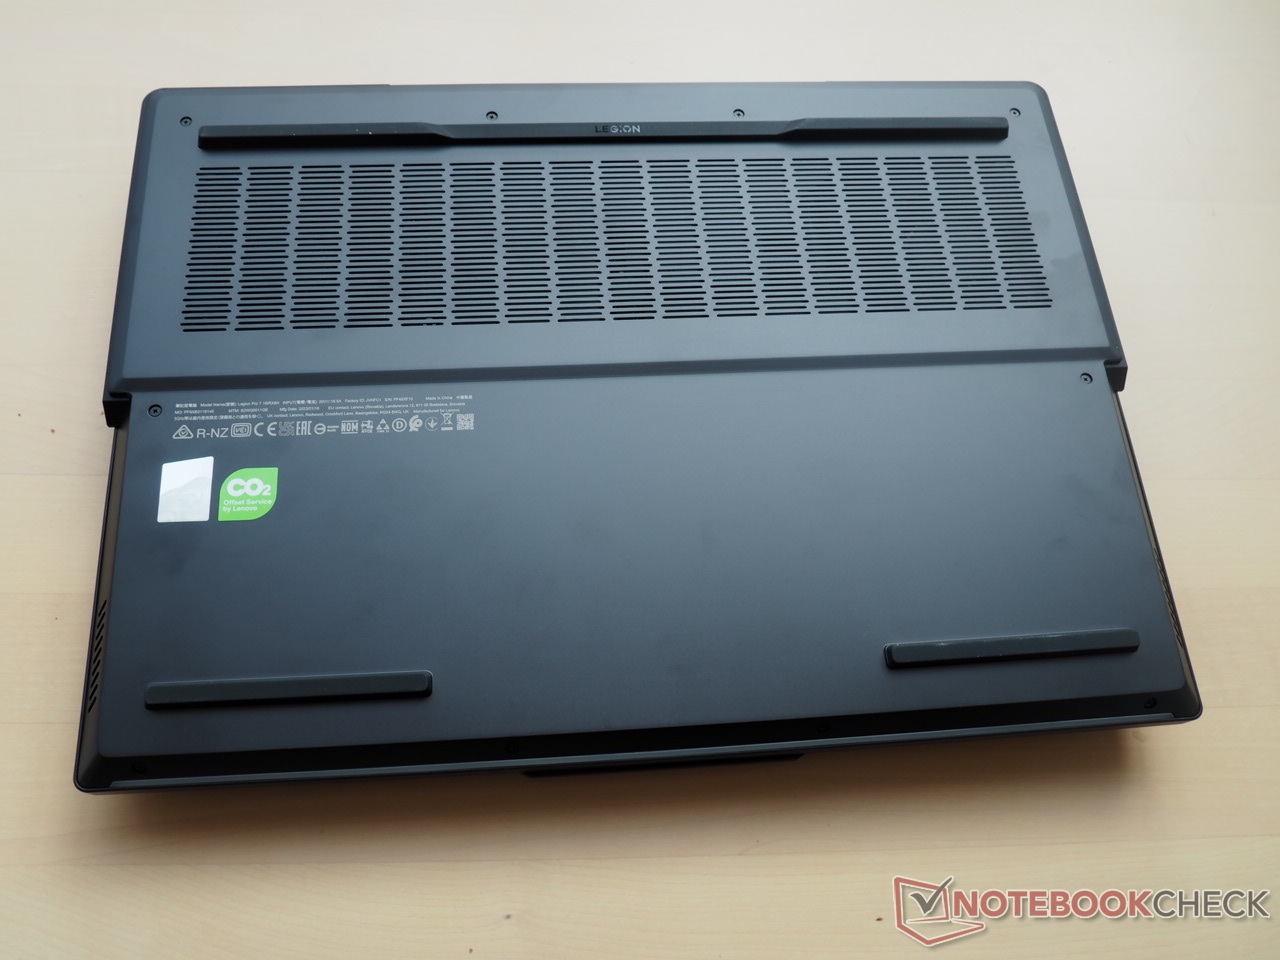
O projeto do chassi é bastante semelhante ao de seu predecessor, o Legion 7 16ARHA7com algumas pequenas alterações, tais como o redesenho das aberturas laterais e traseiras. Mesmo com estas mudanças, o projeto do chassi permanece bom. A estabilidade e a resistência das dobradiças, que podem abrir até 180°, também está acima da média para a classe.
A qualidade geral da sensação é ótima. A tampa metálica, em particular, parece de classe e pode rapidamente se tornar um ímã de impressões digitais. A aparência é, em sua maioria, discreta quando desligada, exceto para a marcação Legion na tampa.
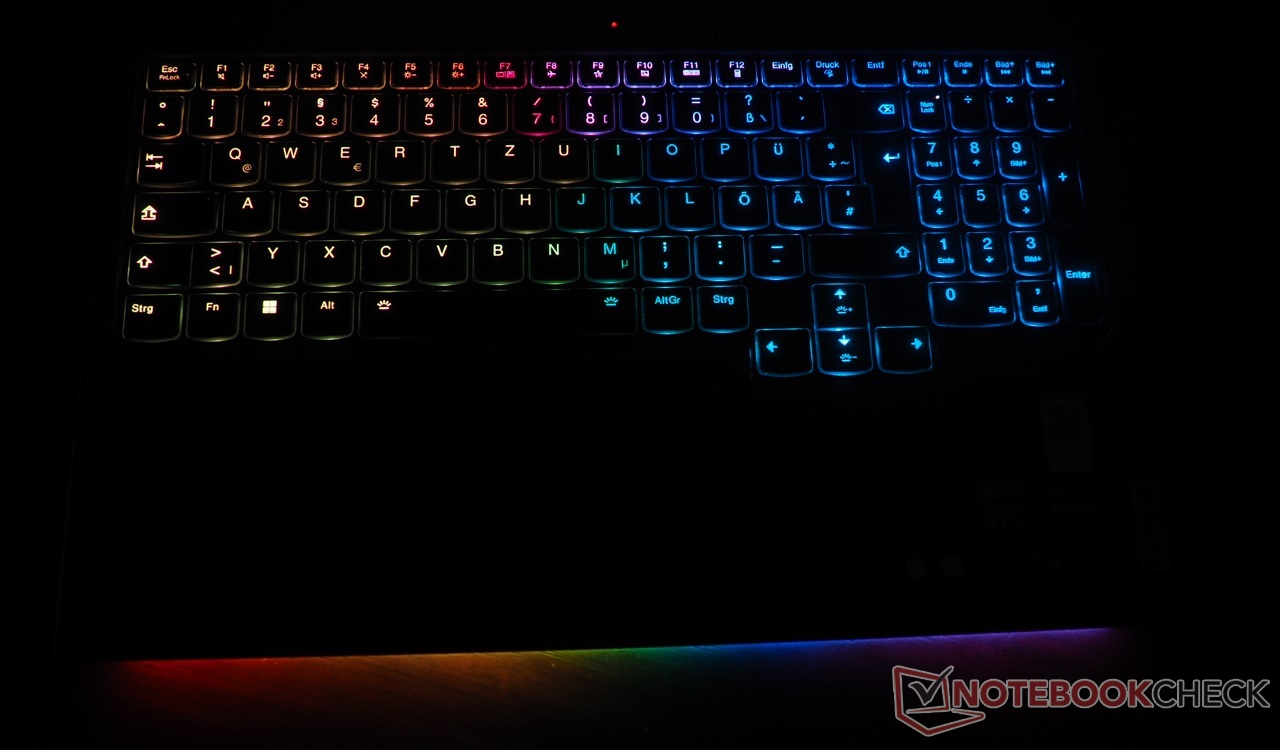
Durante a operação, porém, o Legion 7 Pro pode ser imediatamente reconhecido como um laptop para jogos devido ao teclado iluminado por RGB e à faixa de LED na parte frontal.
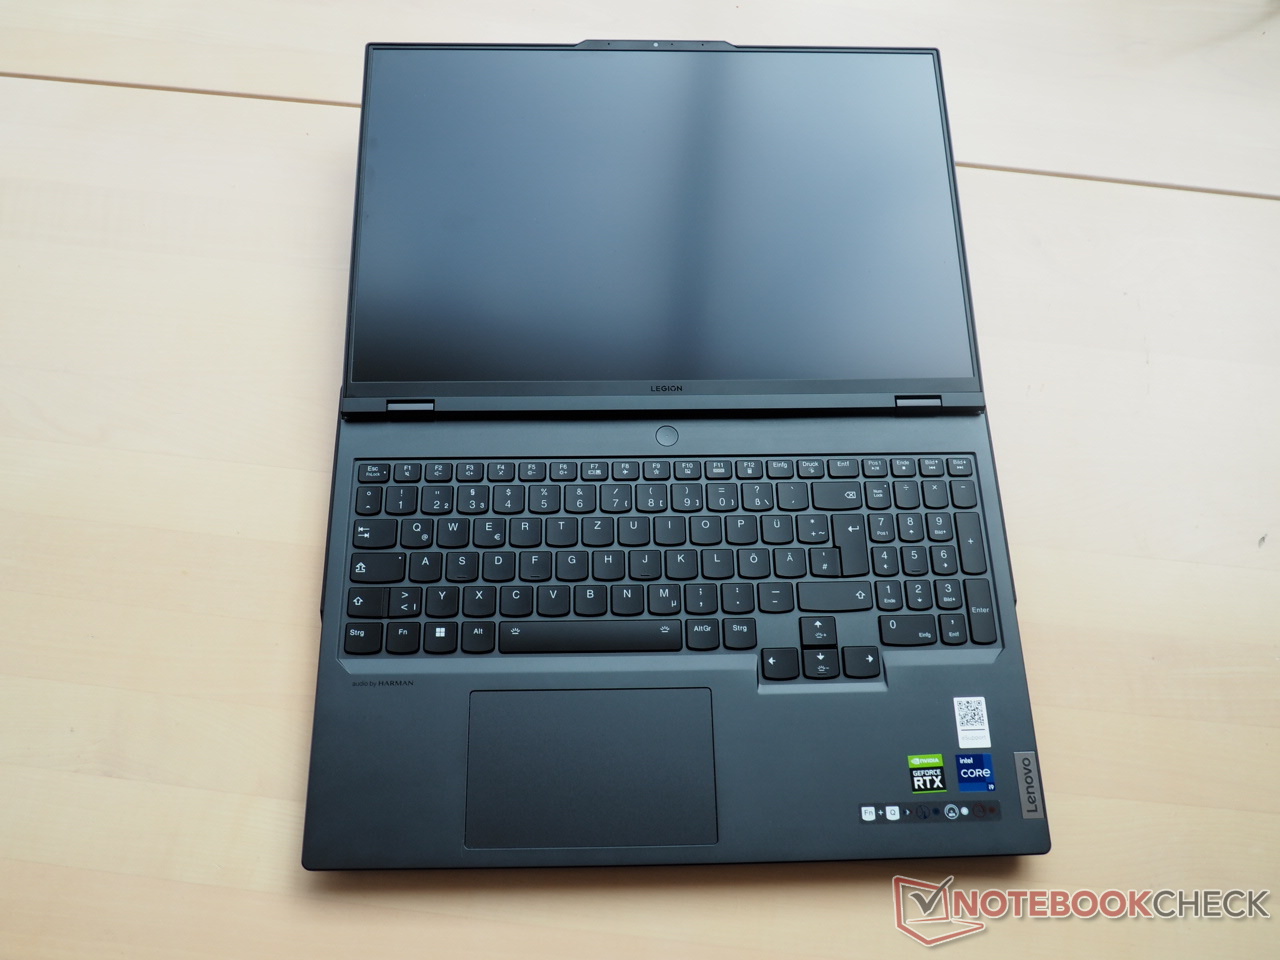

Com cerca de 2,7 kg, o Razer Blade 16 pesa menos 300 g Legion 7 Pro tende a ser um dos laptops mais pesados de sua categoria (o Razer Blade 16 pesa menos 300 g). Da mesma forma, a altura de 2,6 cm é cerca de 4 mm a mais do que a lâmina 16, o que teoricamente deveria ajudar a um melhor resfriamento.
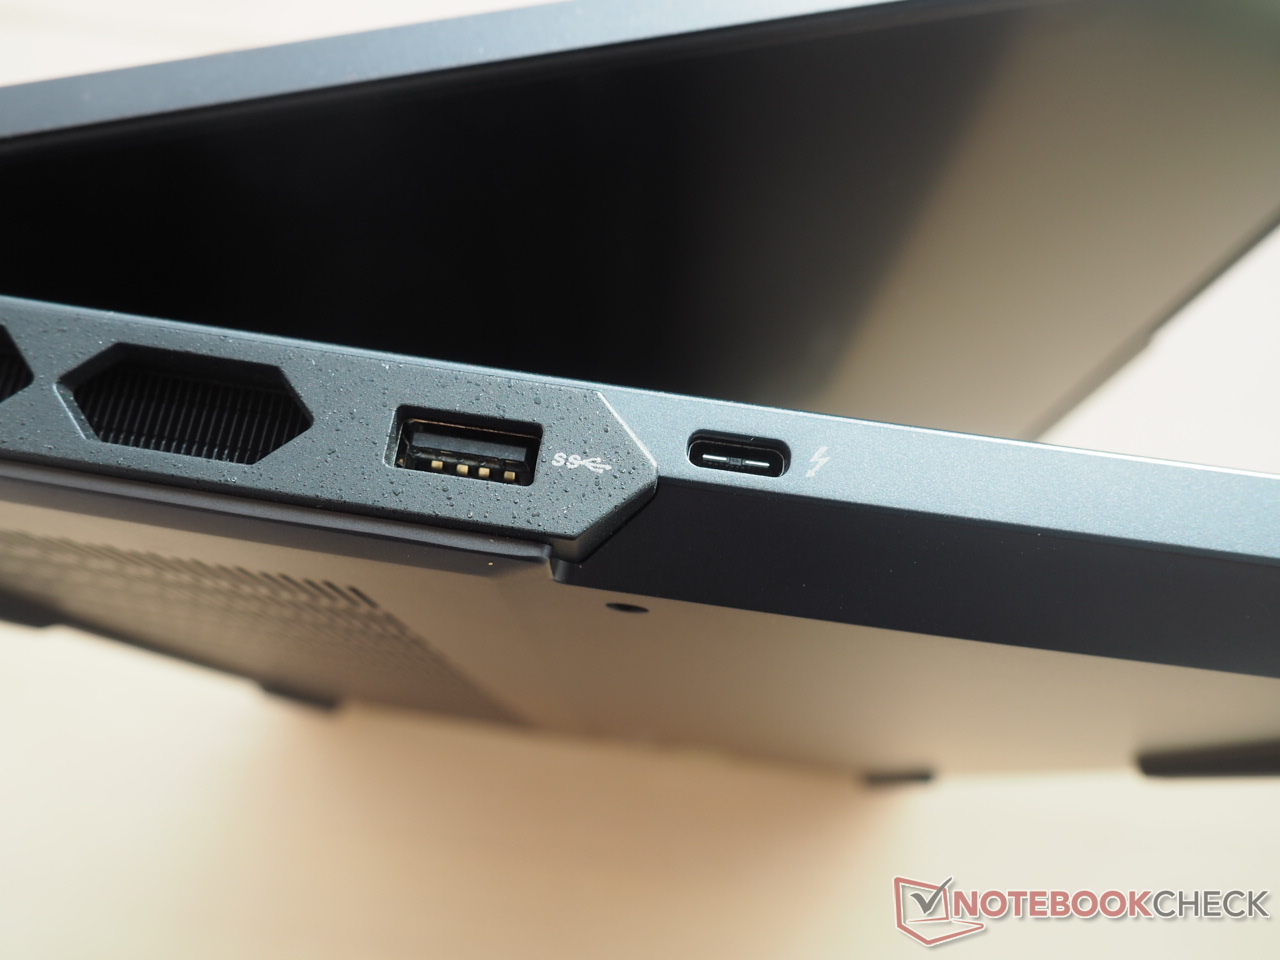
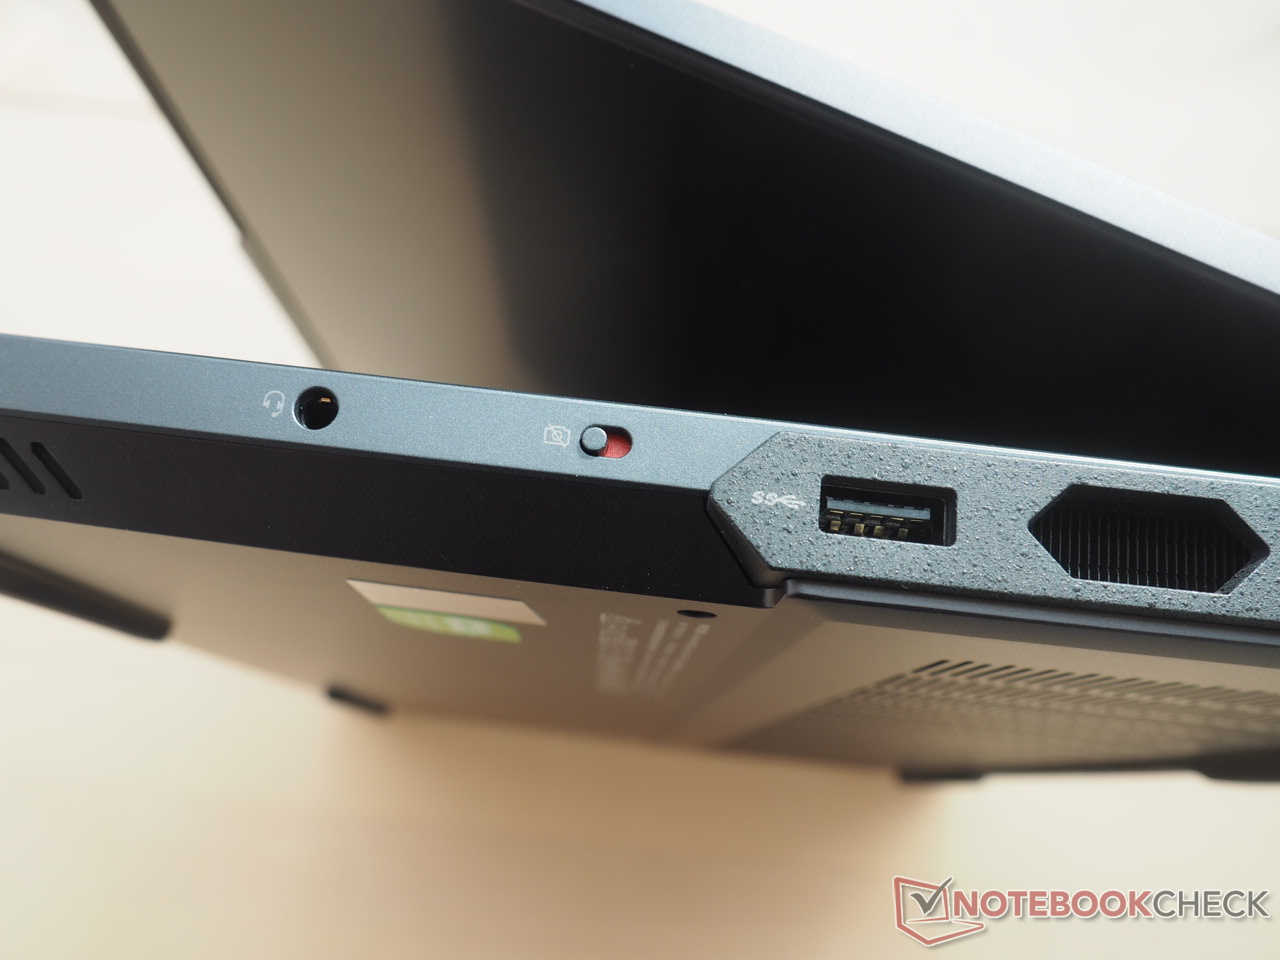
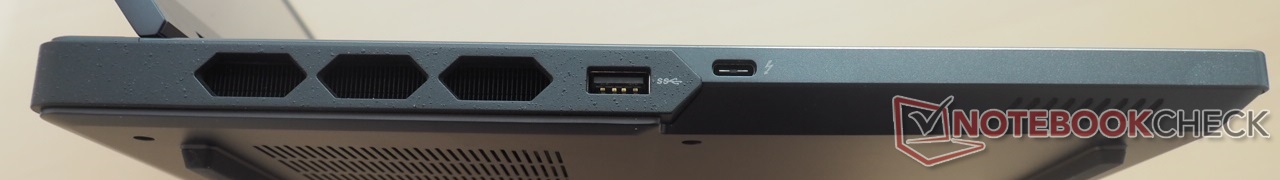
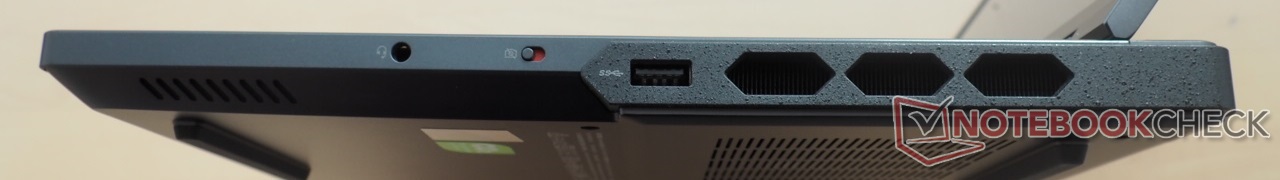
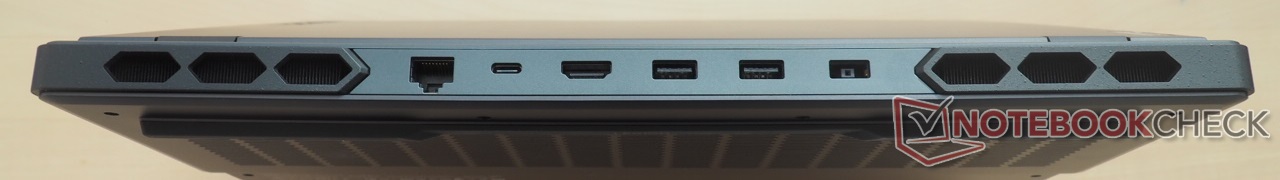
Conectividade: Um conjunto de portas USB
Portos
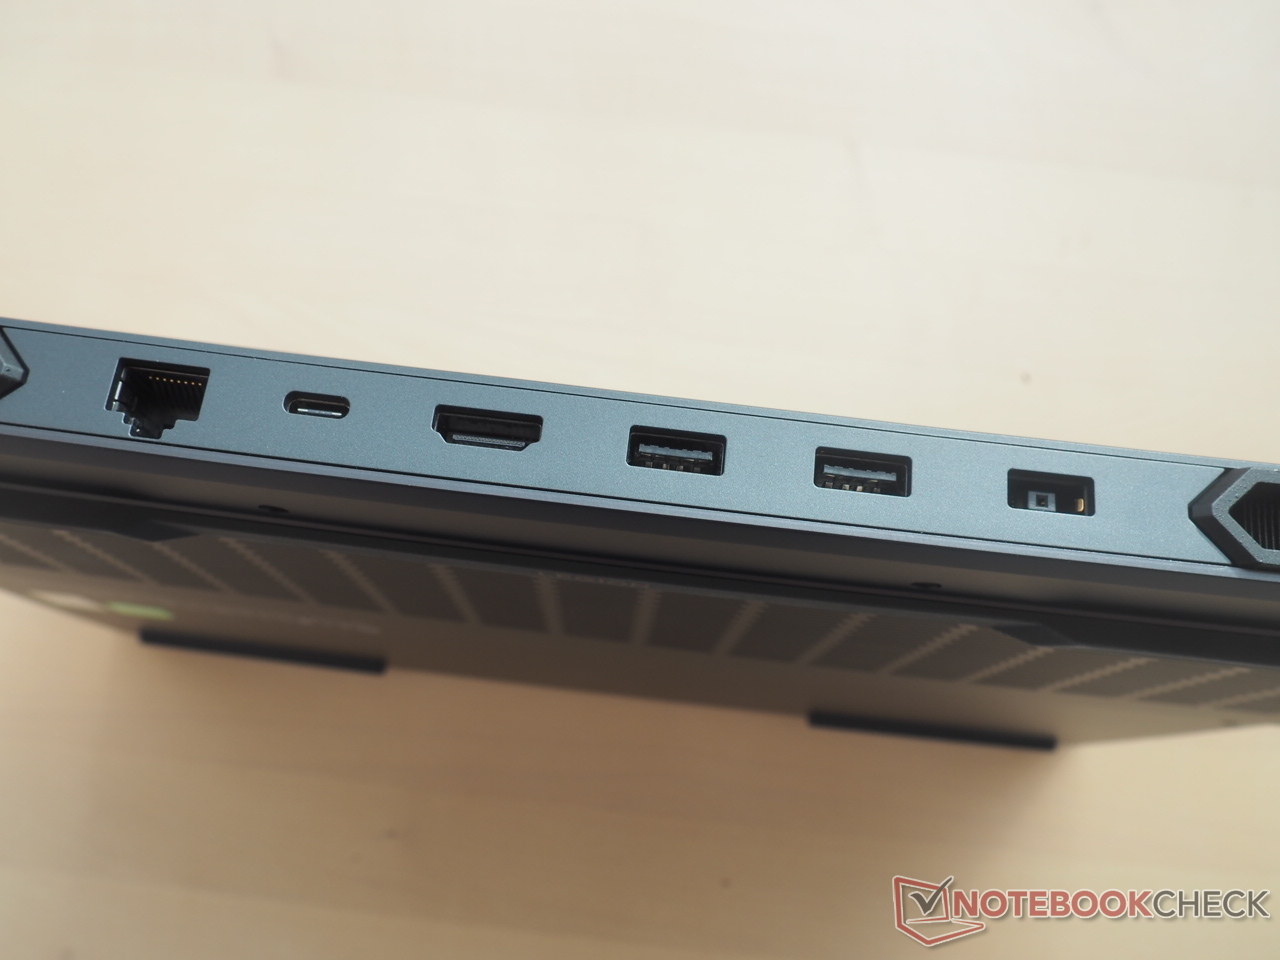
O Legion 7 Pro impressiona com sua abundância de portos. Um total de seis portas USB estão disponíveis (2x Tipo C, 4x Tipo A), o que não é o caso com freqüência, mesmo em laptops de jogos de alta qualidade. Três monitores externos podem ser conectados graças ao suporte HDMI 2.1-out e DisplayPort-out nas duas portas USB Type-C. Também impressionante é o fornecimento de energia de 140 W via USB Type-C.
Uma porta RJ-45, e uma tomada de áudio completam a seleção de portas. A presença de um interruptor físico do obturador da webcam no lado direito é uma vantagem. A única desvantagem no Legion 7 Pro é a ausência de um leitor de cartões.
Como a maioria das portas está localizada na parte de trás do dispositivo, tanto os jogadores da esquerda como os da direita receberão seu dinheiro ao usar um mouse de jogo com fio.
Comunicação
Não encontramos nenhuma discrepância no desempenho do Wi-Fi. O Legion Pro 7 atingiu um rendimento de 1.600 Mb/s a uma distância de 1 m de nosso roteador de referência Asus ROG Rapture GT-AXE11000, o que corresponde a uma transmissão e recepção muito boa. O Razer Blade 16 se acomoda a uns poucos 100 Mbps de menor capacidade de transmissão.
Webcam
A qualidade da webcam está um pouco acima da média. A câmera de 2 MP oferece nitidez de imagem decente e precisão de cor passável, o que é aceitável para um notebook (os padrões aqui são muito ruins, infelizmente).


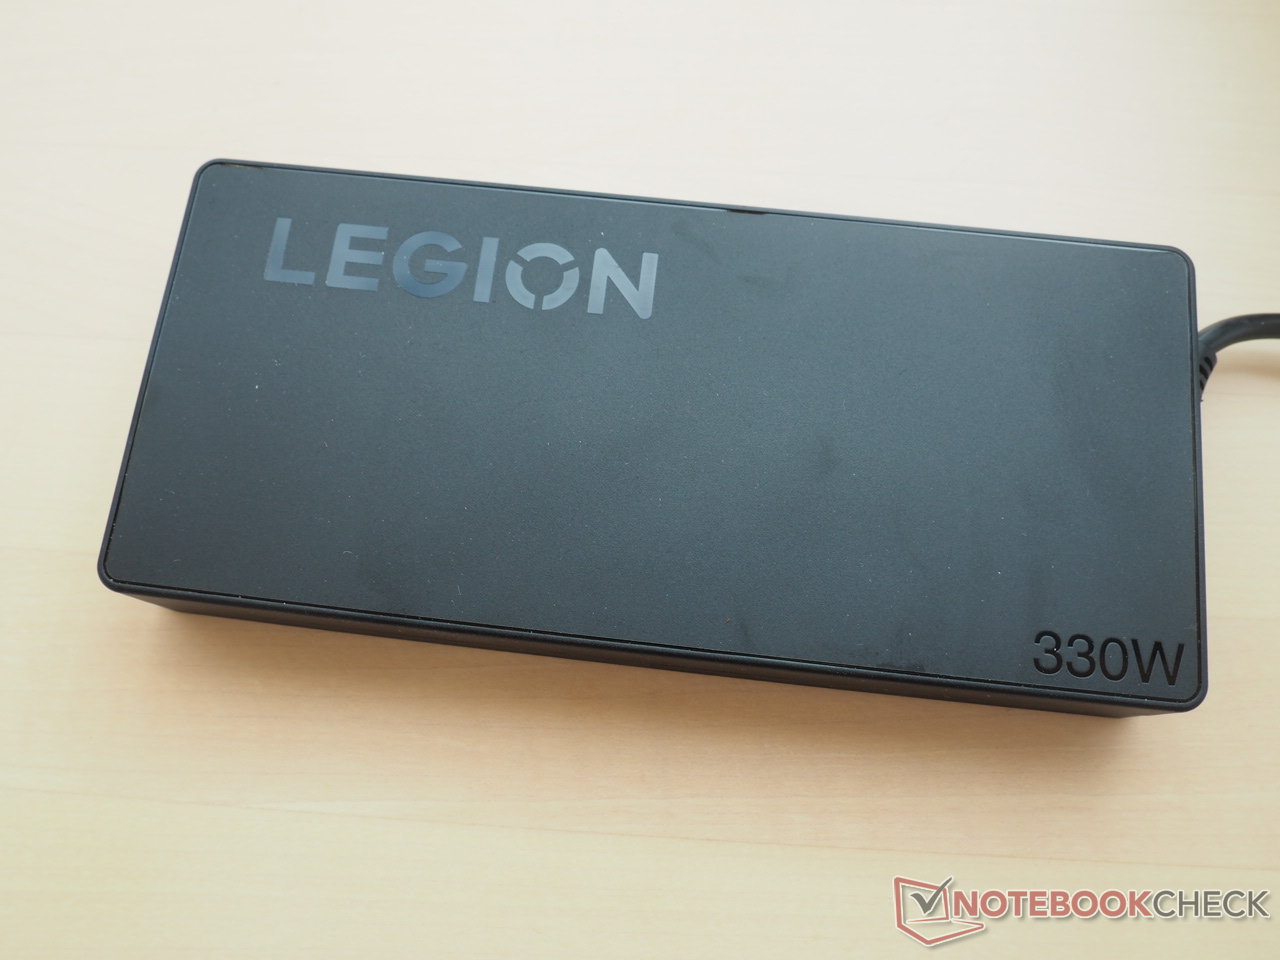
Acessórios
O escopo da entrega inclui uma fonte de alimentação maciça de 800 g que mede 18,5 x 8 x 2,5 cm, que está em linhas previstas para um modelo de 330 W. Alguns livretos informativos são fornecidos como padrão.
Manutenção
A Lenovo poderia ter tornado a desmontagem do Legion 7 Pro mais amigável para o cliente. Mesmo depois de remover todos os parafusos da carcaça, a placa de base é tão apertada (especialmente na parte traseira) que há um medo de danificar o chassi se for aplicada demasiada força.
Devido a esta razão, e ao fato de ser uma amostra de varejo da loja, não tentamos abrir o laptop por segurança.
Garantia
De acordo com as informações do fabricante na Alemanha, a garantia do Legion 7 Pro pode ser estendida para mais de três anos com o Premium Care.
Dispositivos de entrada: Não há muito espaço para reclamações
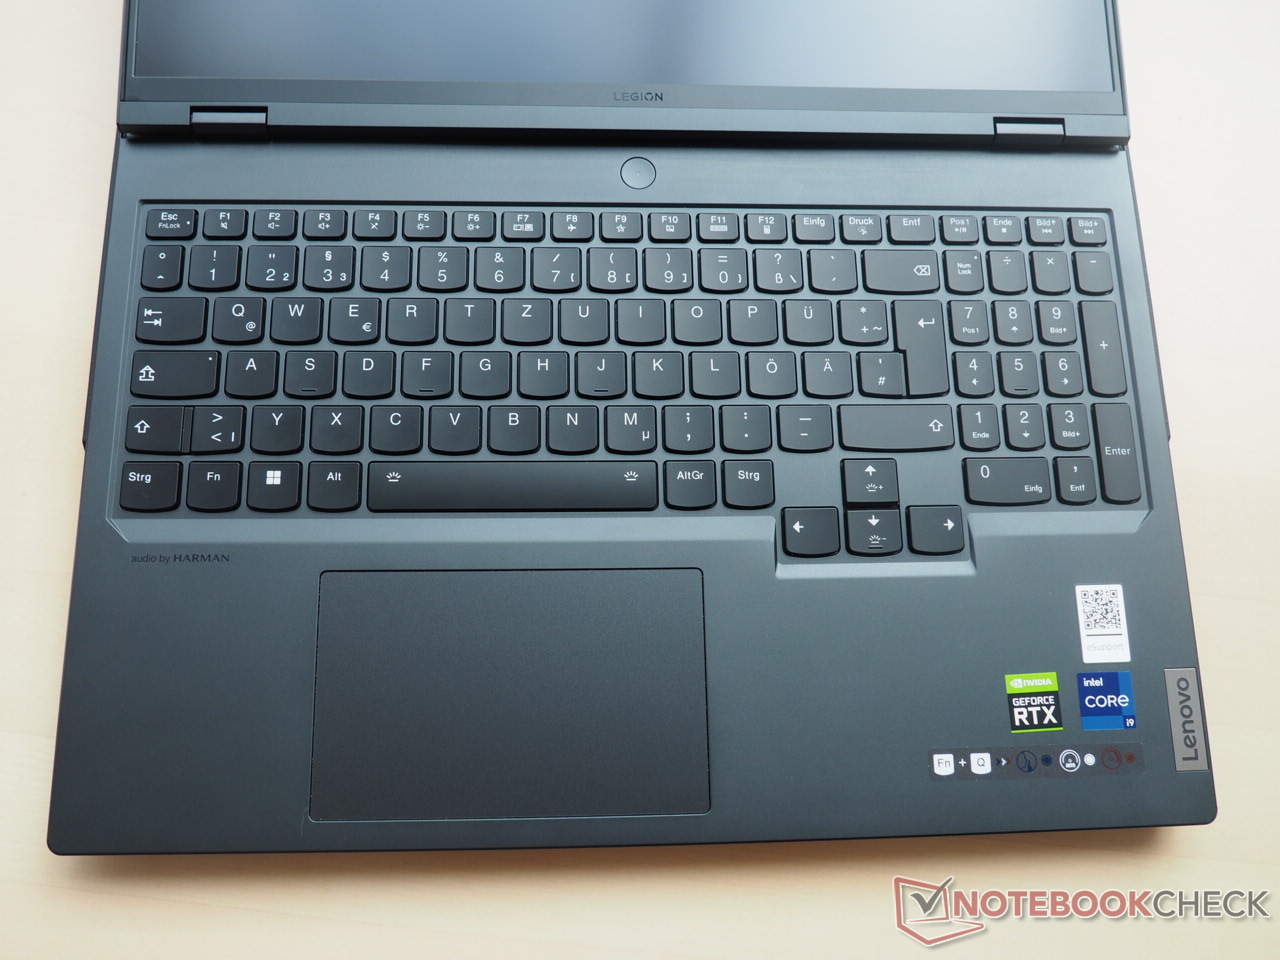
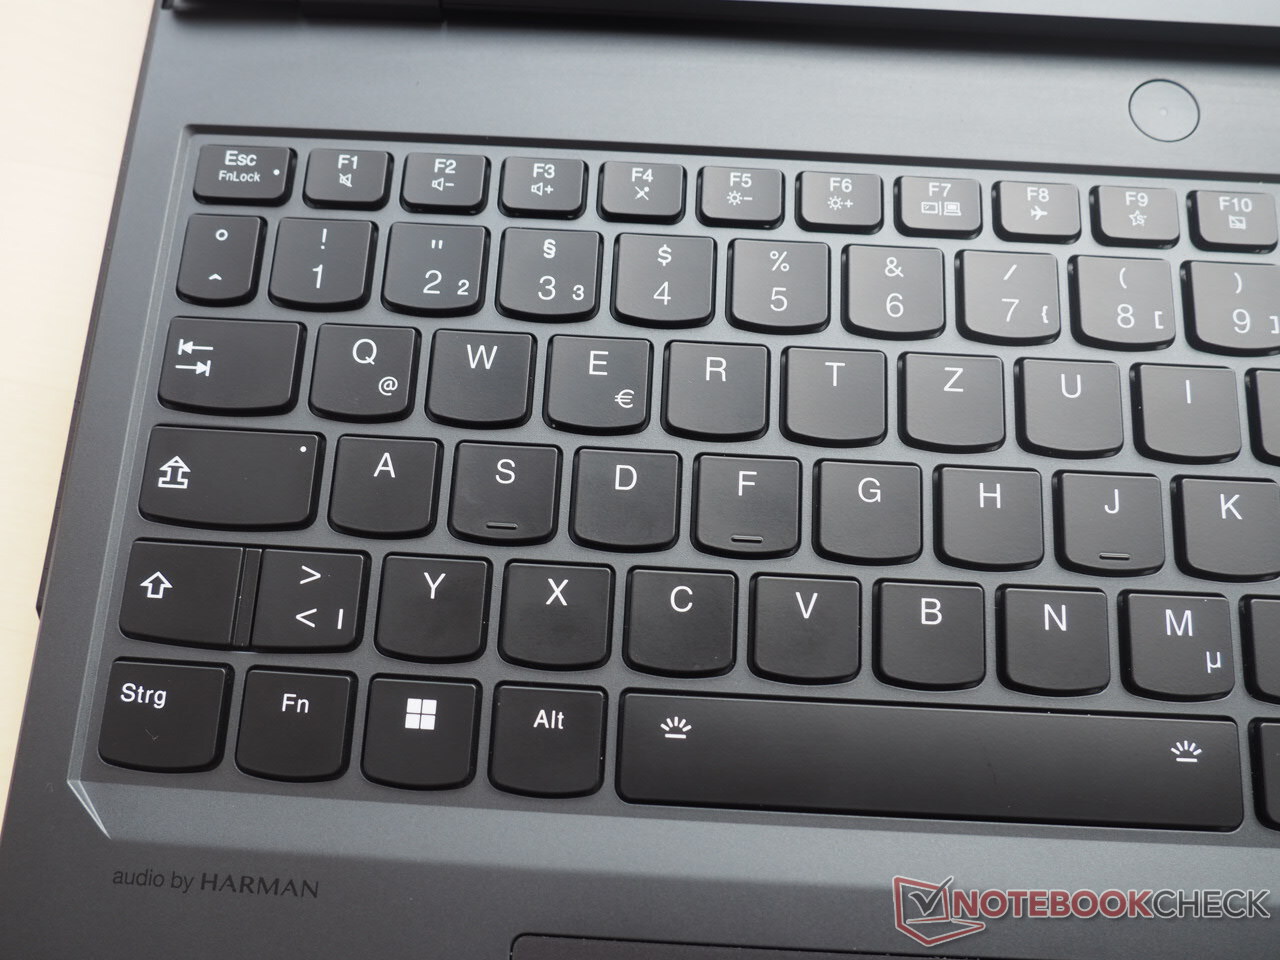
Teclado
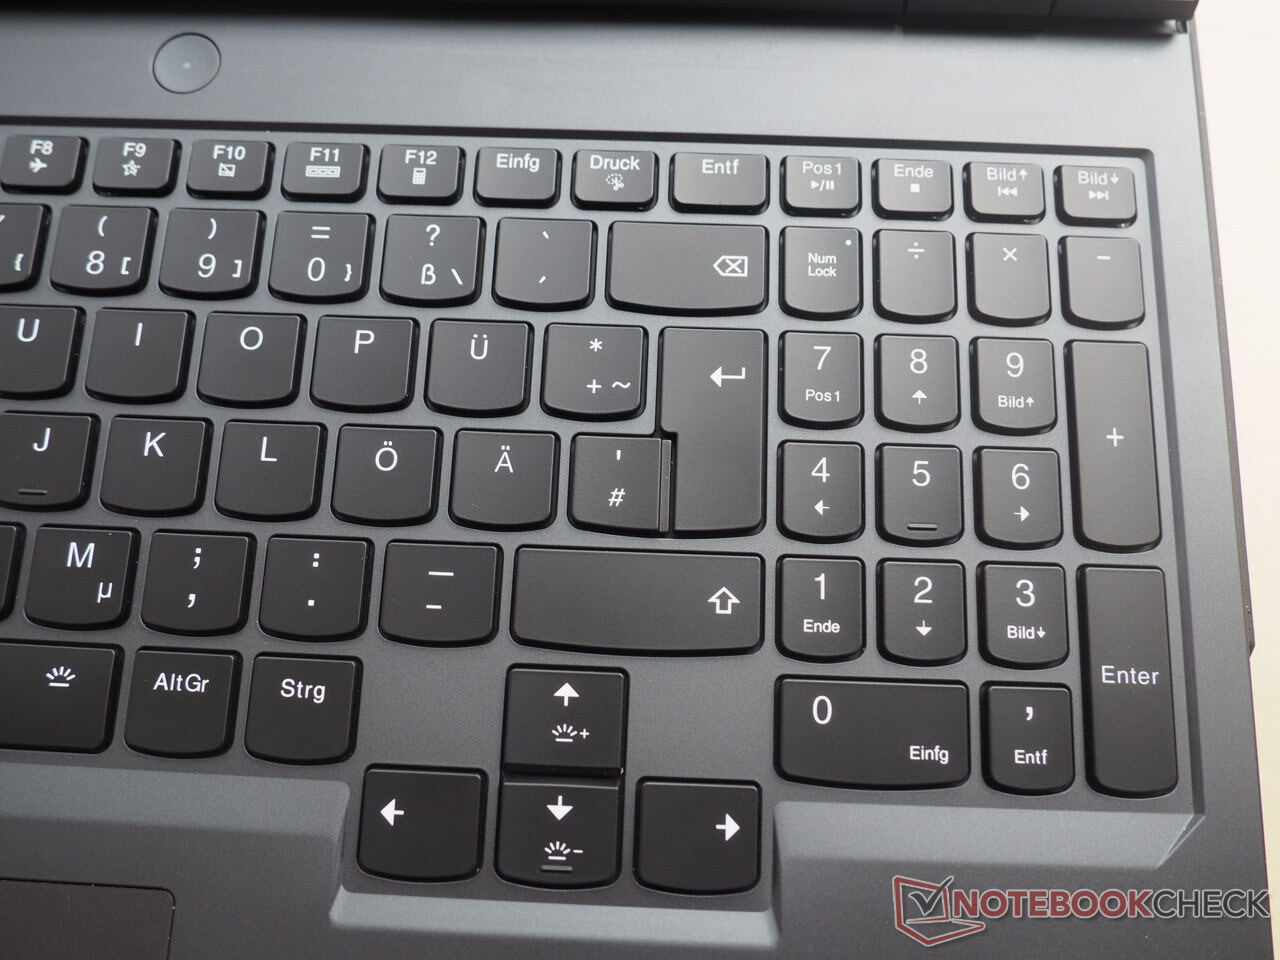
O teclado oferece pouco espaço para reclamações. As típicas teclas estilo Lenovo- com bordas inferiores curvas garantem uma agradável experiência de digitação após alguma familiarização. O ponto de atuação e pressão são bastante bons, embora não exatamente perto do nível de um teclado mecânico.
O layout do teclado parece convincente em nossa opinião. Aqueles que dependem muito das teclas de seta podem ansiar por um dimensionamento decente. Um teclado numérico completo também está disponível. A etiquetagem clara das teclas significa que você pode apagar a luz de fundo durante o dia. Caso contrário, a retroiluminação oferece uma intensidade útil e vários modos de ajuste.
Touchpad
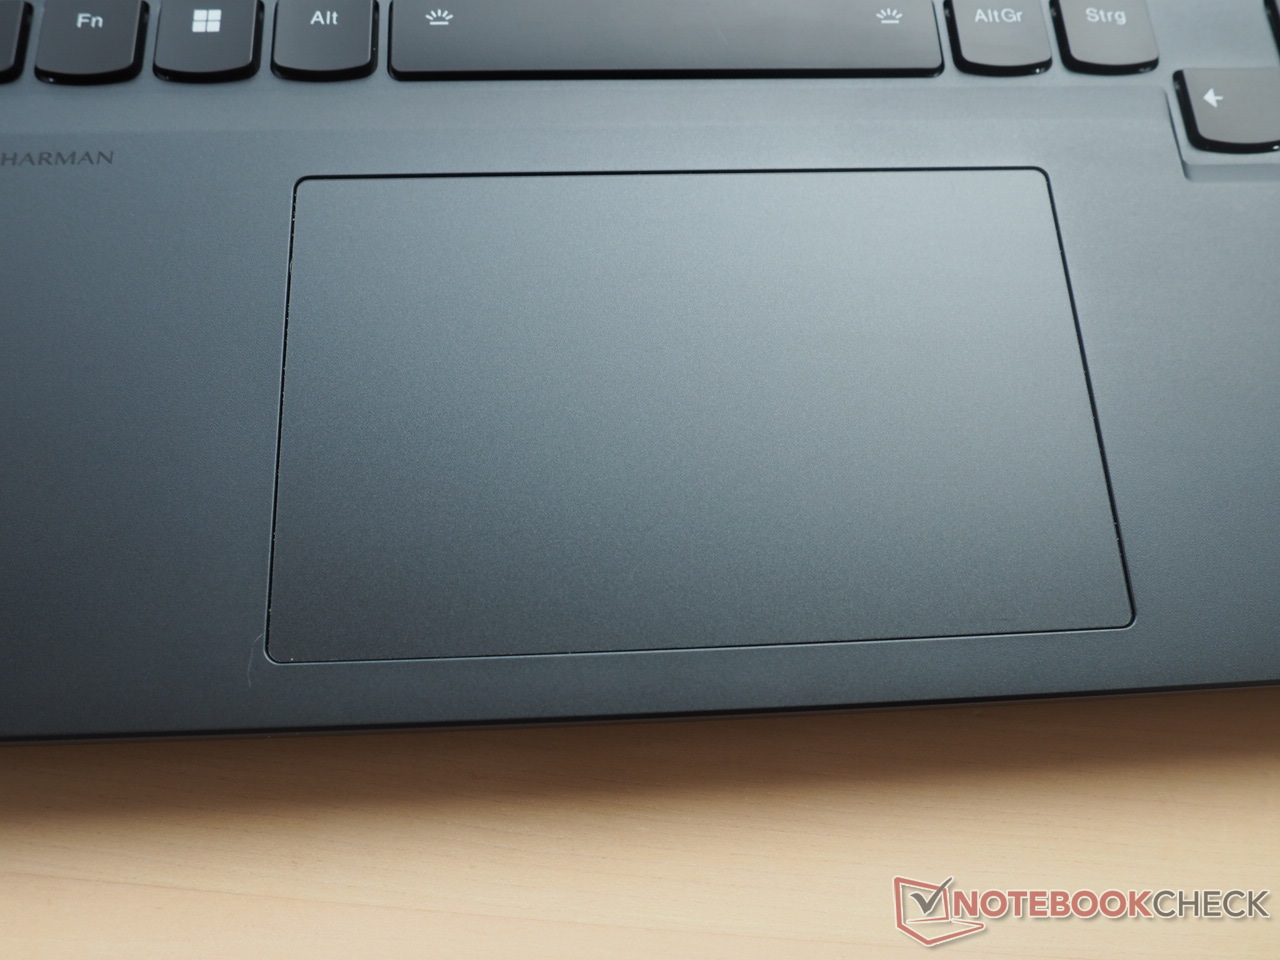
O touchpad liso de 12 x 7,5 cm parece suficiente para um dispositivo de 16 polegadas e é colocado relativamente longe à esquerda. Não encontramos nenhum problema com precisão e propriedades de deslizamento, o que permite uma operação suave.
As áreas de clique perto do fundo são muito estáveis e podem ser facilmente acionadas, mas soam bem alto e raquítico.
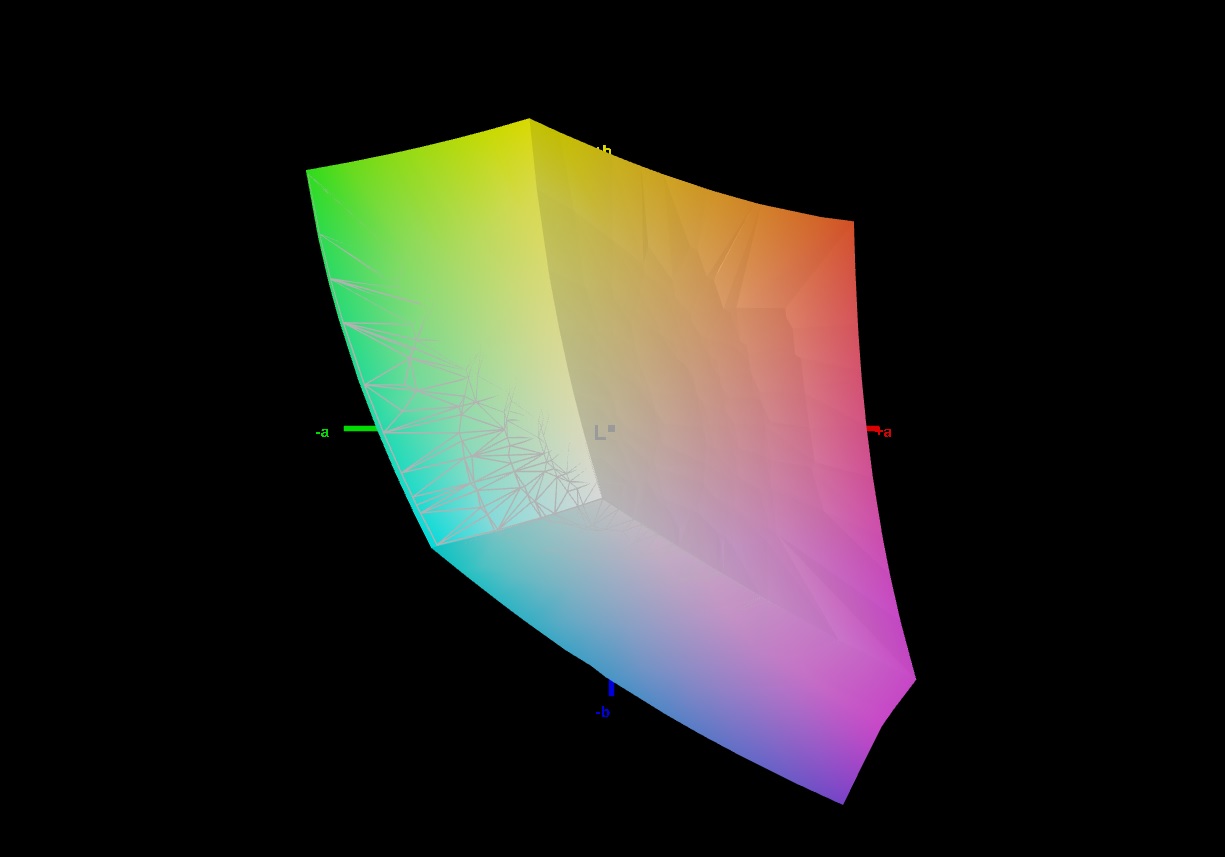
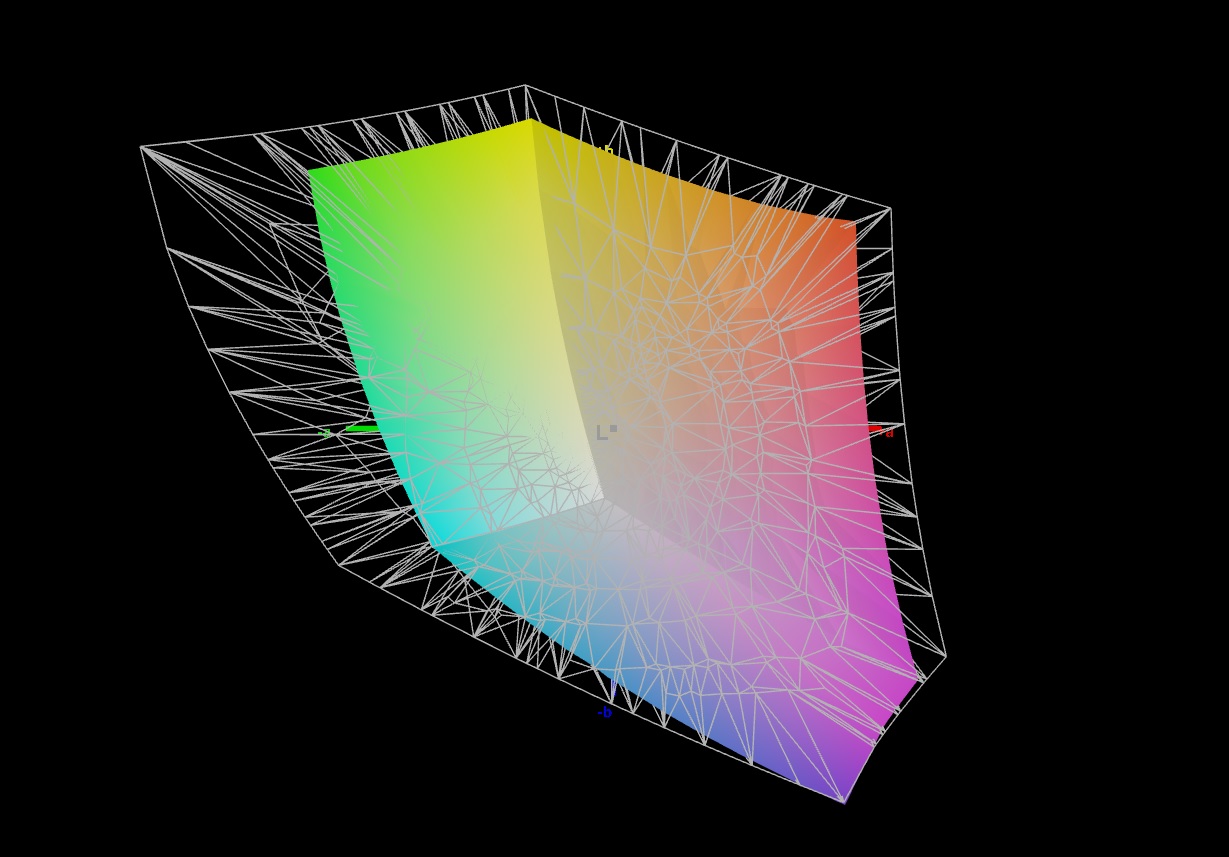
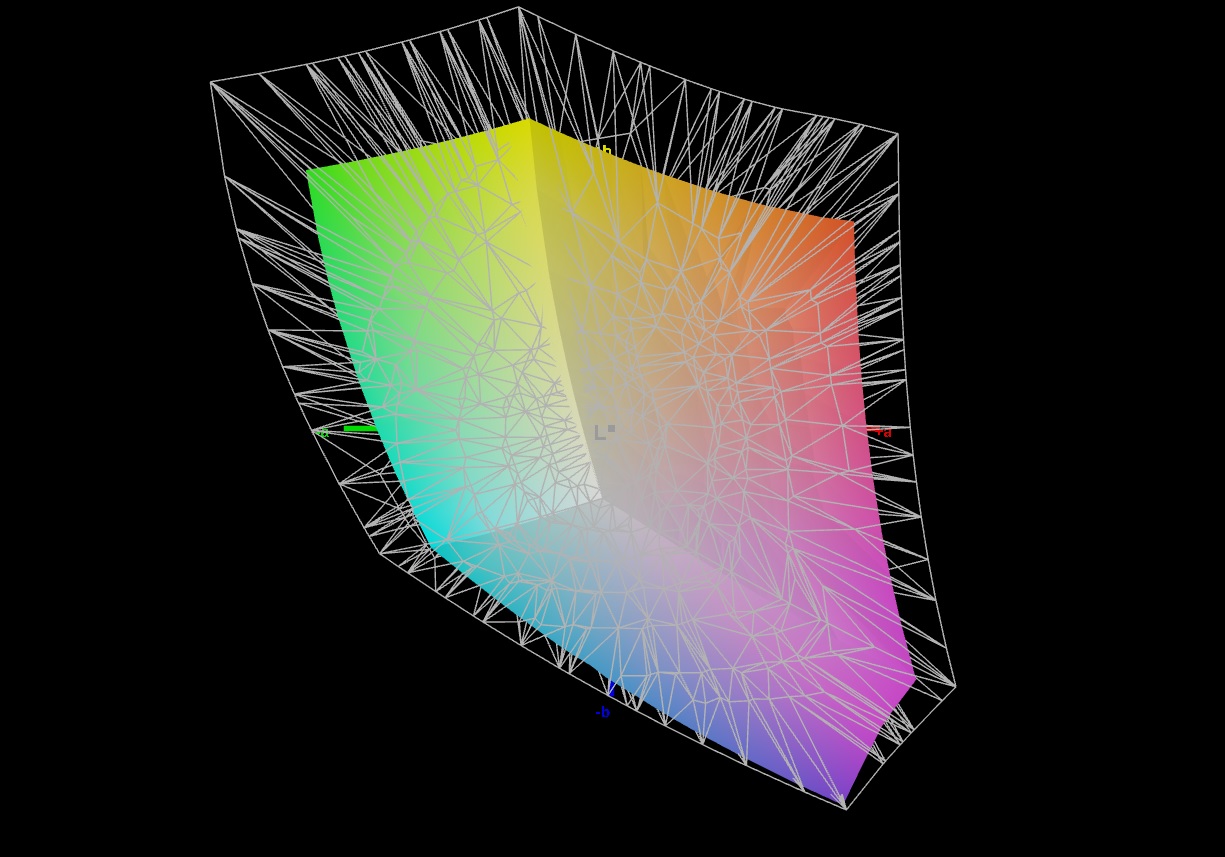
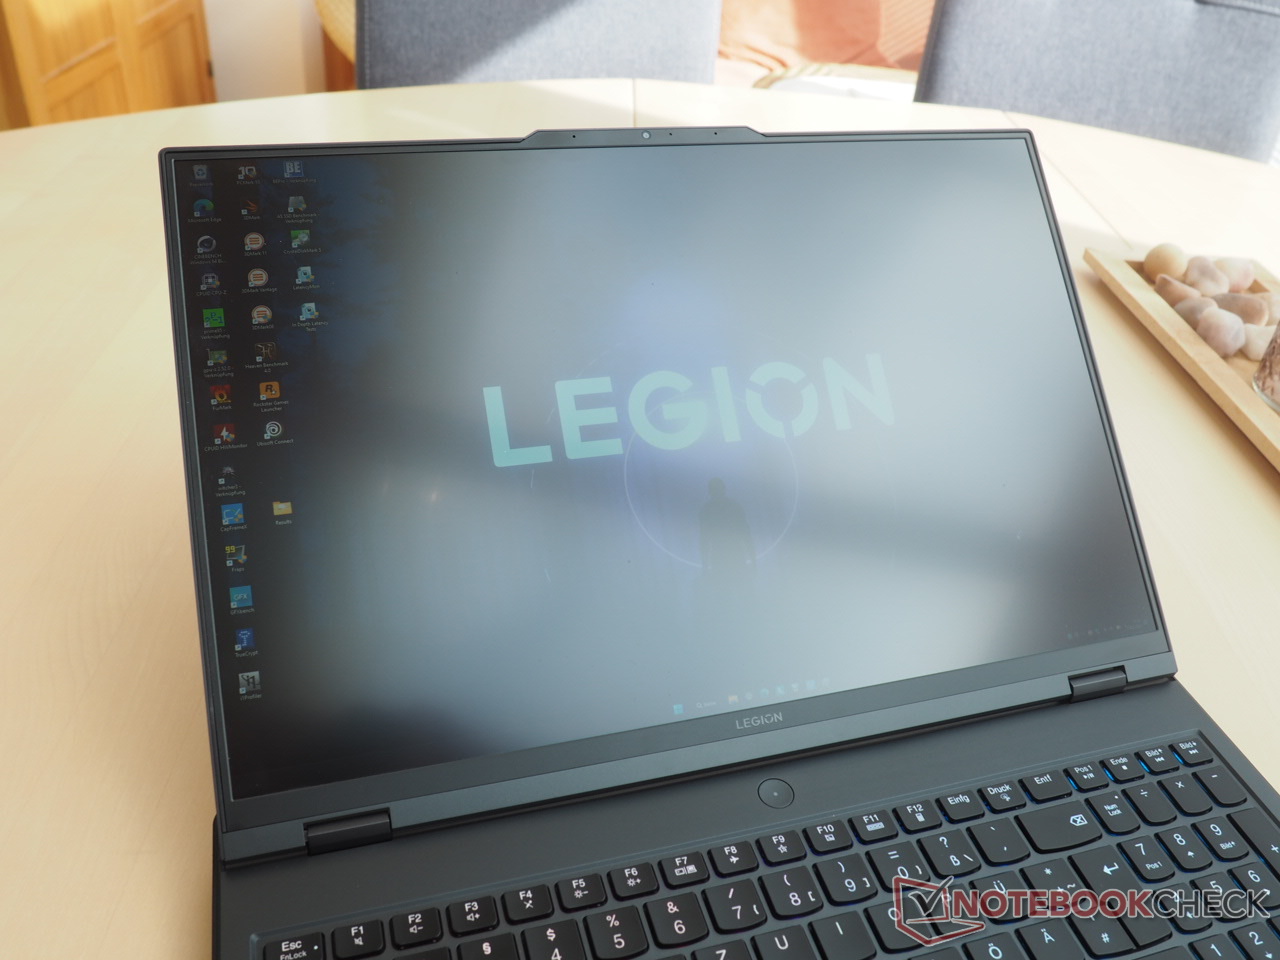
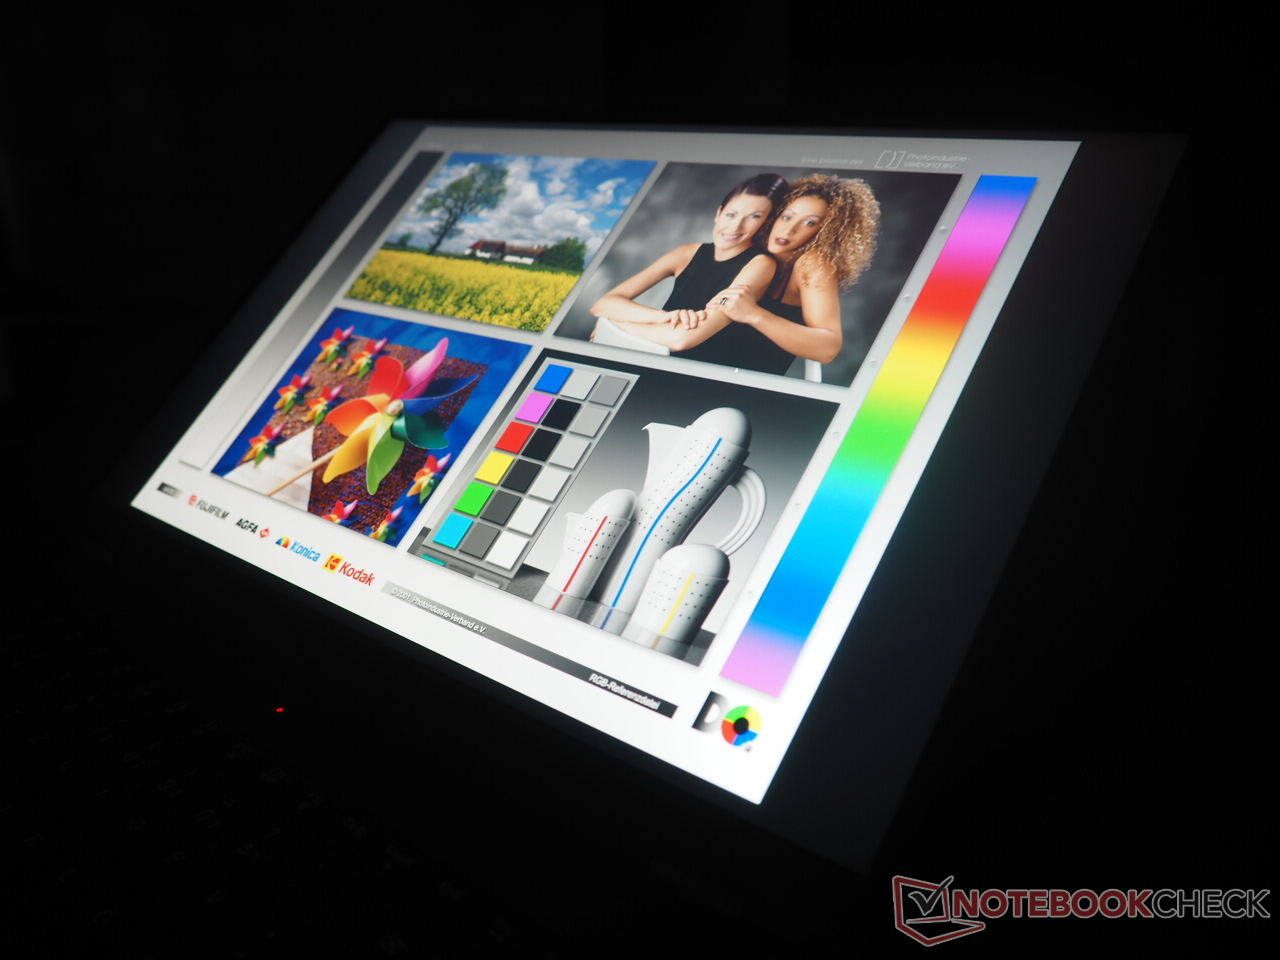
Display: painel de 240 Hz com alto nível de luminosidade e sem PWM
O painel WQXGA de 240 Hz da Legion 7 Pro oferece uma luminosidade média alta de 469 cd/m2, o que deve augurar bem para visualização ao ar livre. Entretanto, a concorrência também oferece níveis de luminosidade semelhantes.
| |||||||||||||||||||||||||
iluminação: 86 %
iluminação com acumulador: 511 cd/m²
Contraste: 1278:1 (Preto: 0.4 cd/m²)
ΔE ColorChecker Calman: 0.95 | ∀{0.5-29.43 Ø4.73}
calibrated: 0.91
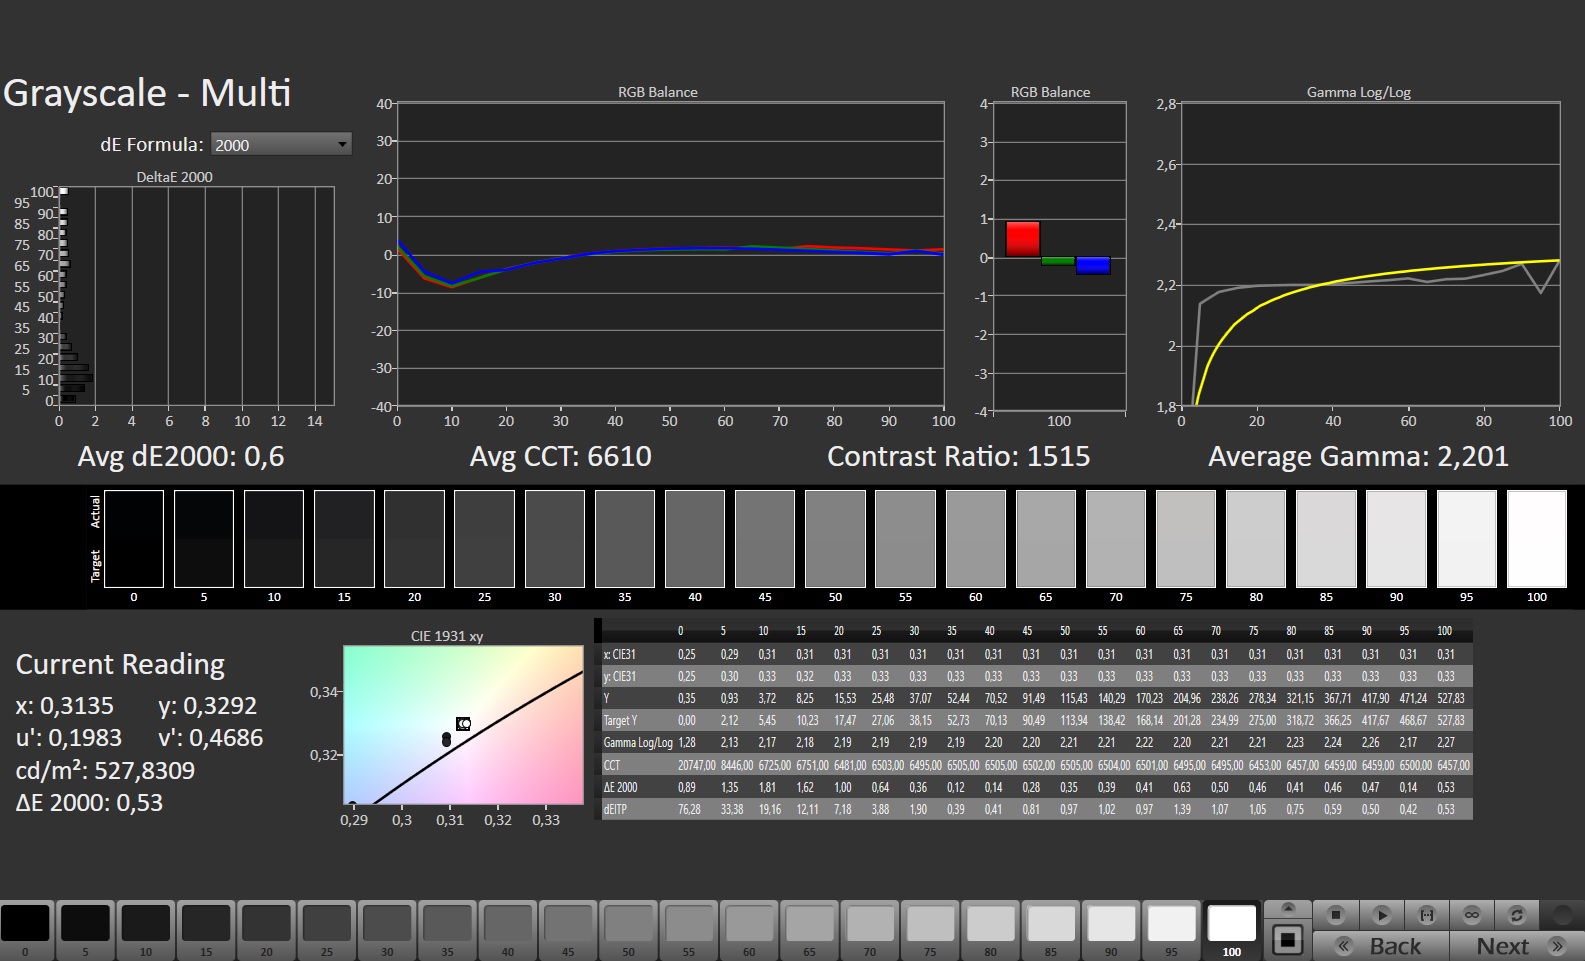
ΔE Greyscale Calman: 0.6 | ∀{0.09-98 Ø4.97}
71.2% AdobeRGB 1998 (Argyll 3D)
99.7% sRGB (Argyll 3D)
69.1% Display P3 (Argyll 3D)
Gamma: 2.176
CCT: 6545 K
| Lenovo Legion Pro 7 16IRX8H MNG007DA2-3 (CSO1628), IPS, 2560x1600, 16" | Razer Blade 16 Early 2023 CSOT T3 MNG007DA4-1, IPS, 2560x1600, 16" | Lenovo Legion 7 16IAX7-82TD004SGE NE160QDM-NY1, IPS, 2560x1600, 16" | Lenovo Legion 7 16ACHg6 CSOT T3 MNG007DA1-1, IPS, 2560x1600, 16" | Lenovo Legion 7 16ARHA7 BOE CQ NE160QDM-NY1, IPS, 2560x1600, 16" | |
|---|---|---|---|---|---|
| Display | 23% | -1% | 1% | -7% | |
| Display P3 Coverage (%) | 69.1 | 98.5 43% | 69.3 0% | 70.3 2% | 63.7 -8% |
| sRGB Coverage (%) | 99.7 | 100 0% | 98.2 -2% | 99.4 0% | 95.3 -4% |
| AdobeRGB 1998 Coverage (%) | 71.2 | 89.7 26% | 70.8 -1% | 72.7 2% | 65.7 -8% |
| Response Times | -29% | 2% | -11% | -19% | |
| Response Time Grey 50% / Grey 80% * (ms) | 12.3 ? | 6.6 ? 46% | 12.6 ? -2% | 14 ? -14% | 9.2 ? 25% |
| Response Time Black / White * (ms) | 5.9 ? | 12 ? -103% | 5.6 ? 5% | 6.4 ? -8% | 9.6 ? -63% |
| PWM Frequency (Hz) | |||||
| Screen | -90% | -87% | -27% | -74% | |
| Brightness middle (cd/m²) | 511 | 456.8 -11% | 547 7% | 489 -4% | 478.8 -6% |
| Brightness (cd/m²) | 469 | 437 -7% | 523 12% | 469 0% | 477 2% |
| Brightness Distribution (%) | 86 | 83 -3% | 88 2% | 92 7% | 90 5% |
| Black Level * (cd/m²) | 0.4 | 0.35 13% | 0.44 -10% | 0.38 5% | 0.43 -8% |
| Contrast (:1) | 1278 | 1305 2% | 1243 -3% | 1287 1% | 1113 -13% |
| Colorchecker dE 2000 * | 0.95 | 3.7 -289% | 2.1 -121% | 1.45 -53% | 2.24 -136% |
| Colorchecker dE 2000 max. * | 2.07 | 6.42 -210% | 7 -238% | 2.16 -4% | 4.49 -117% |
| Colorchecker dE 2000 calibrated * | 0.91 | 0.66 27% | 0.9 1% | 1.16 -27% | 1.89 -108% |
| Greyscale dE 2000 * | 0.6 | 2.6 -333% | 3.2 -433% | 1.6 -167% | 2.3 -283% |
| Gamma | 2.176 101% | 2.3 96% | 2.23 99% | 2.197 100% | 2.25 98% |
| CCT | 6545 99% | 6108 106% | 6979 93% | 6377 102% | 6955 93% |
| Color Space (Percent of AdobeRGB 1998) (%) | 73 | ||||
| Color Space (Percent of sRGB) (%) | 94 | ||||
| Média Total (Programa/Configurações) | -32% /
-57% | -29% /
-56% | -12% /
-19% | -33% /
-52% |
* ... menor é melhor
A relação de contraste de 1.278:1 está em linhas similares às da Lâmina 16. Entretanto, o carro-chefe da Razer oferece uma cobertura de gama de cores mais alta. O Legion Pro 7 pode gerenciar 100% sRGB, mas fica aquém da cobertura Adobe RGB e Display P3.
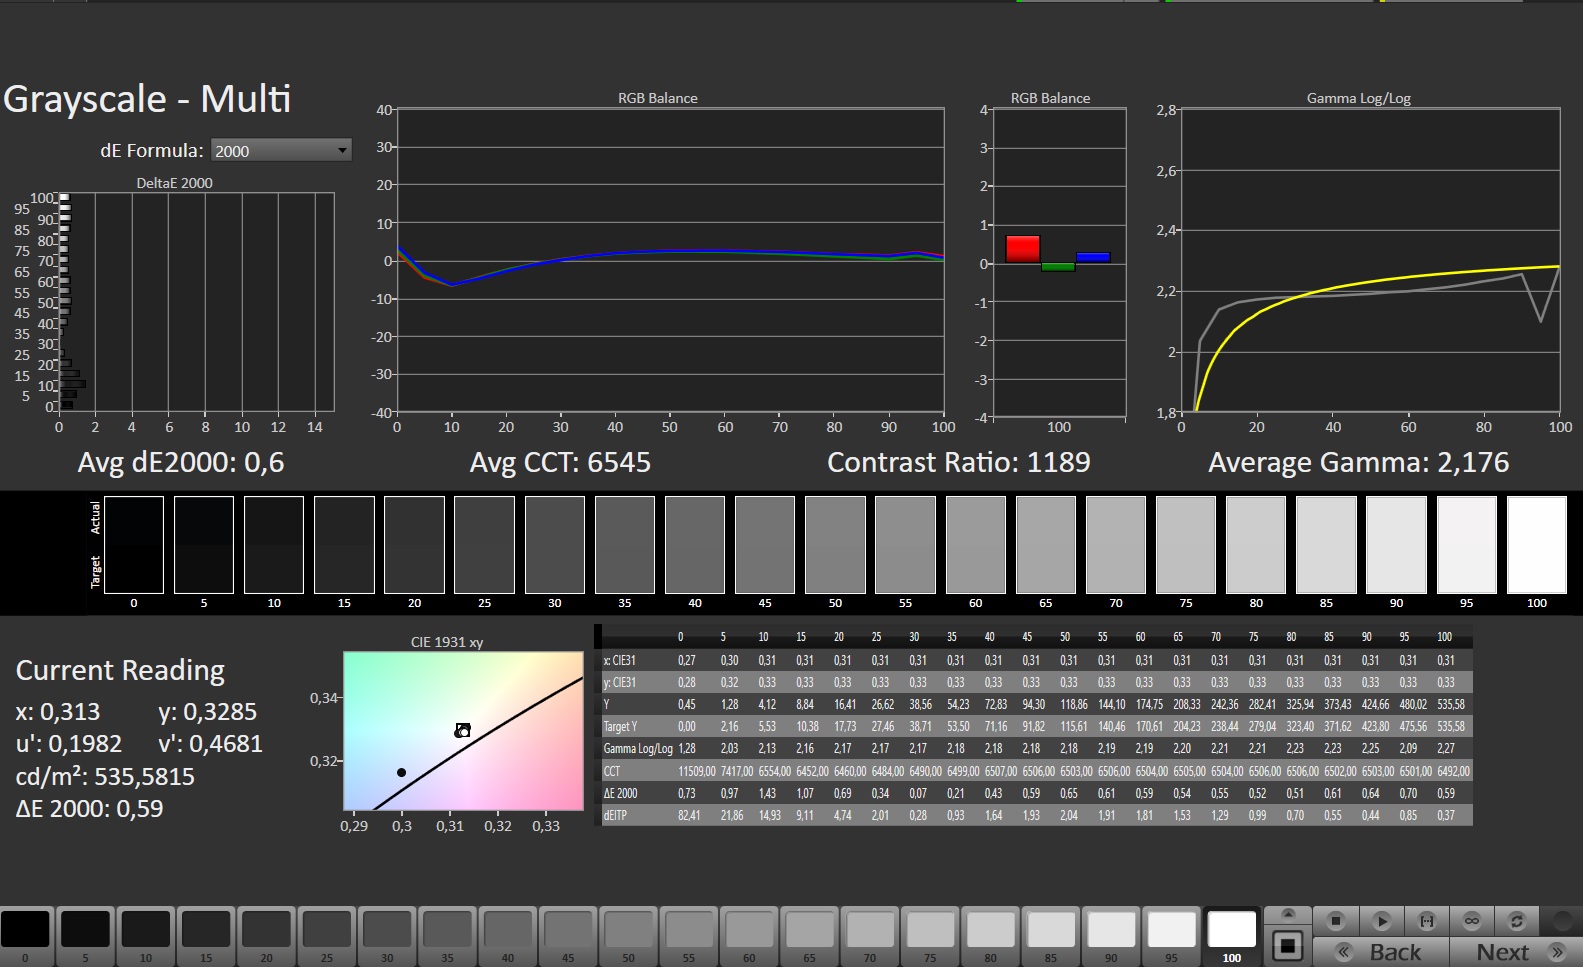
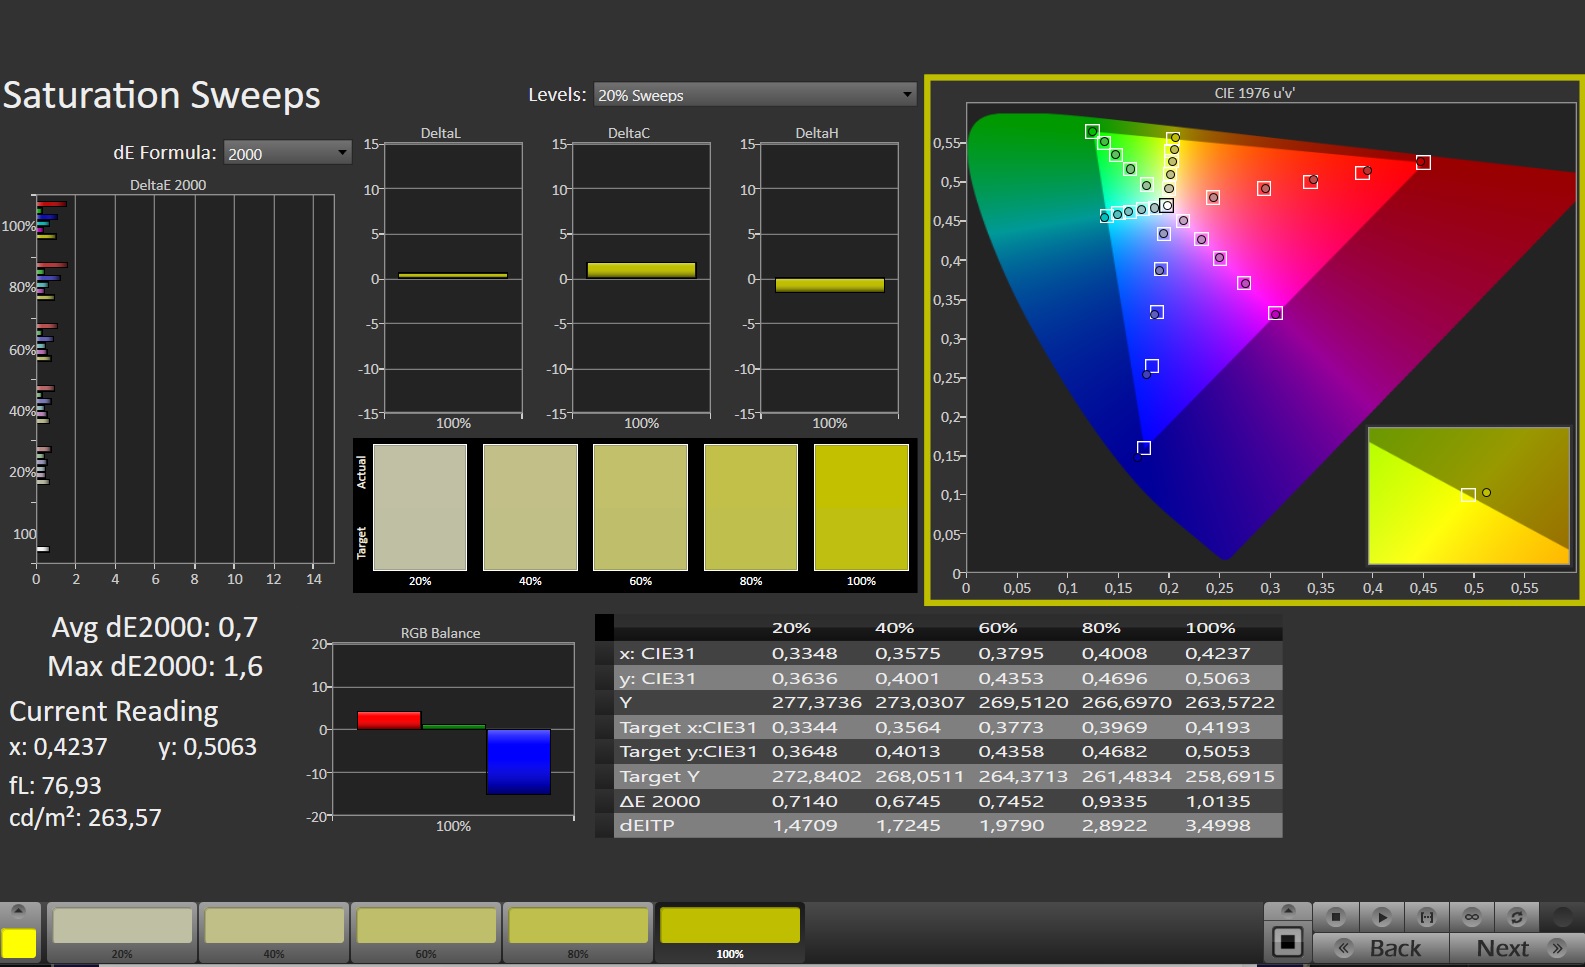
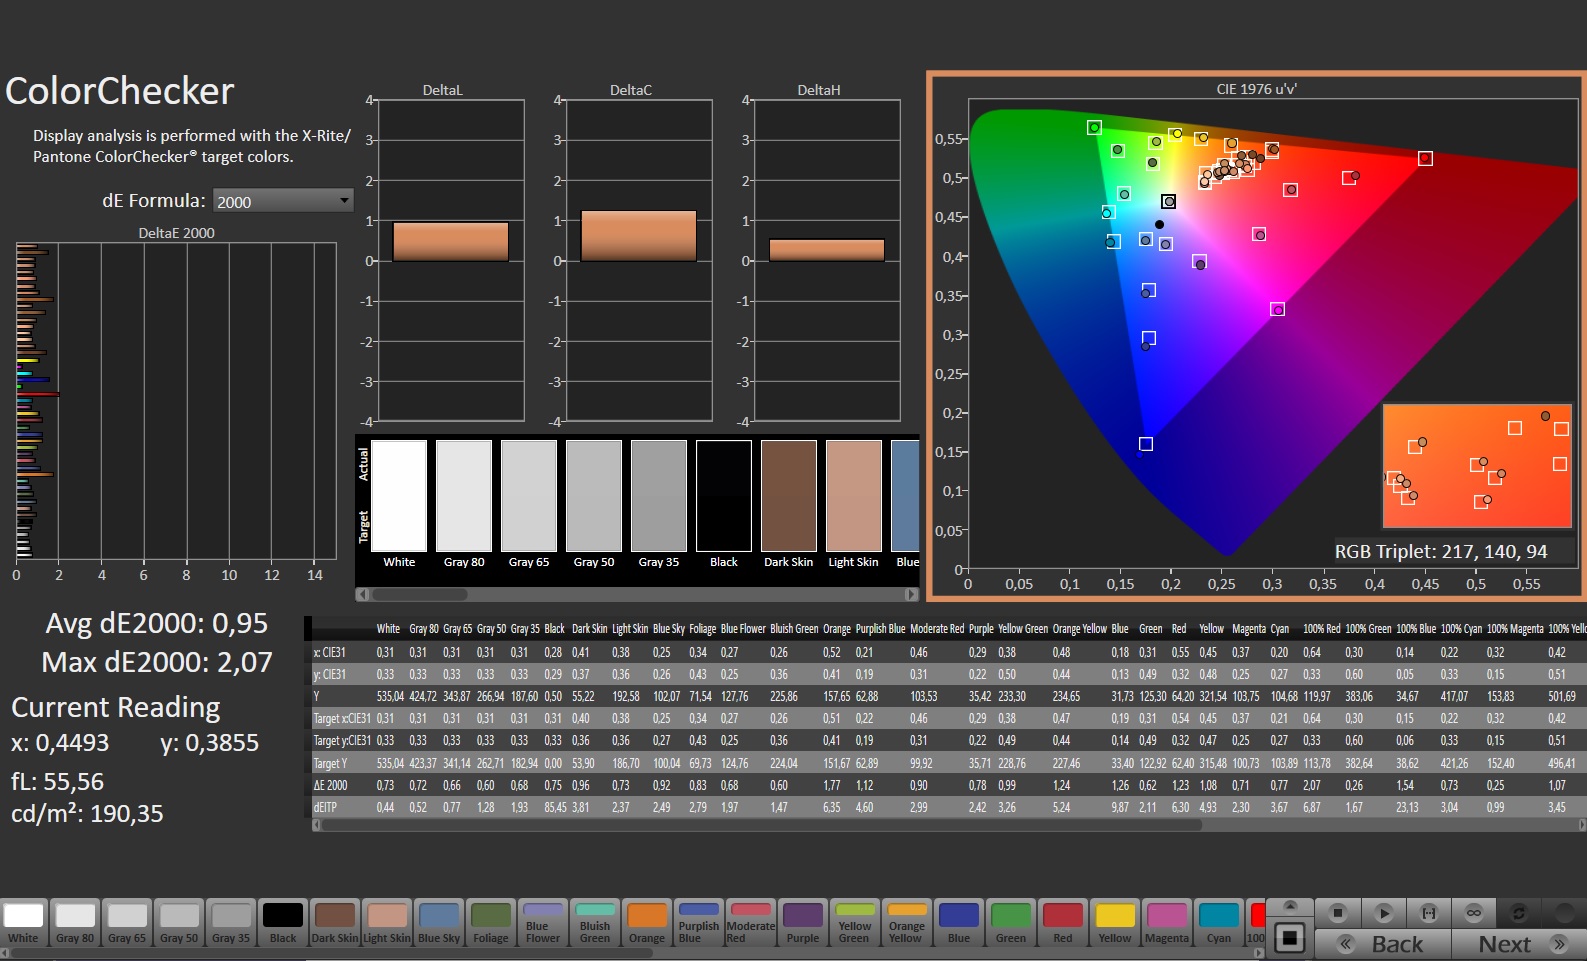
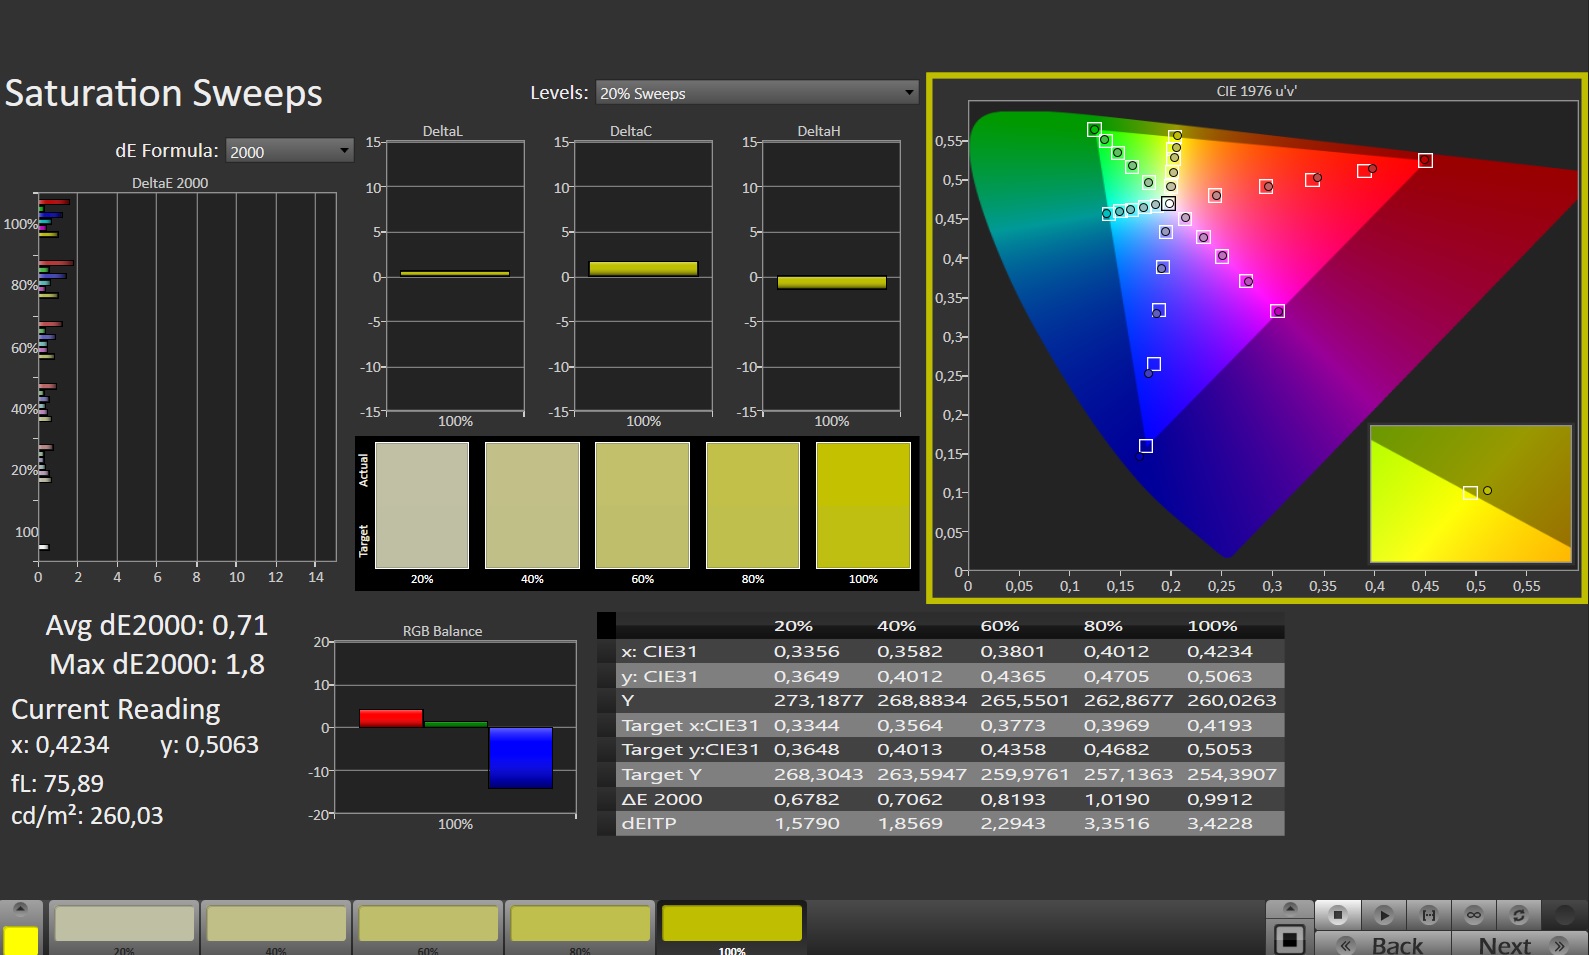

Dito isto, o Legion Pro 7 oferece excelente precisão de cor out-of-the-box graças à calibração X-Rite Pantone.
Os tempos de resposta (~6 ms de preto a branco) estão nas linhas previstas. A estabilidade do ângulo de visão geralmente depende do nível do IPS, parece ser relativamente boa a partir de posições oblíquas.
Exibir tempos de resposta
| ↔ Tempo de resposta preto para branco | ||
|---|---|---|
| 5.9 ms ... ascensão ↗ e queda ↘ combinadas | ↗ 2.2 ms ascensão | 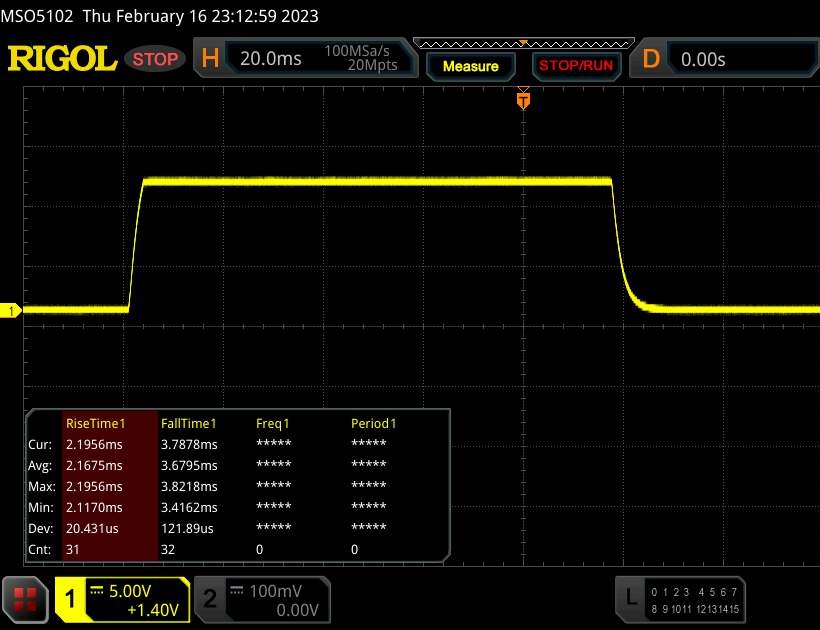 |
| ↘ 3.7 ms queda | ||
| A tela mostra taxas de resposta muito rápidas em nossos testes e deve ser muito adequada para jogos em ritmo acelerado. Em comparação, todos os dispositivos testados variam de 0.1 (mínimo) a 240 (máximo) ms. » 18 % de todos os dispositivos são melhores. Isso significa que o tempo de resposta medido é melhor que a média de todos os dispositivos testados (19.9 ms). | ||
| ↔ Tempo de resposta 50% cinza a 80% cinza | ||
| 12.3 ms ... ascensão ↗ e queda ↘ combinadas | ↗ 5.7 ms ascensão | 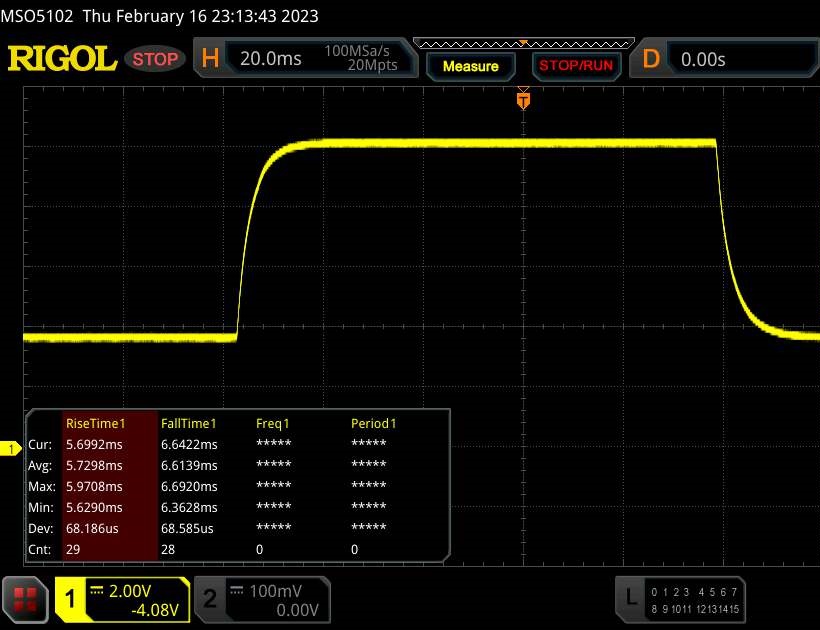 |
| ↘ 6.6 ms queda | ||
| A tela mostra boas taxas de resposta em nossos testes, mas pode ser muito lenta para jogadores competitivos. Em comparação, todos os dispositivos testados variam de 0.165 (mínimo) a 636 (máximo) ms. » 26 % de todos os dispositivos são melhores. Isso significa que o tempo de resposta medido é melhor que a média de todos os dispositivos testados (31.1 ms). | ||
Cintilação da tela / PWM (modulação por largura de pulso)
| Tela tremeluzindo / PWM não detectado | 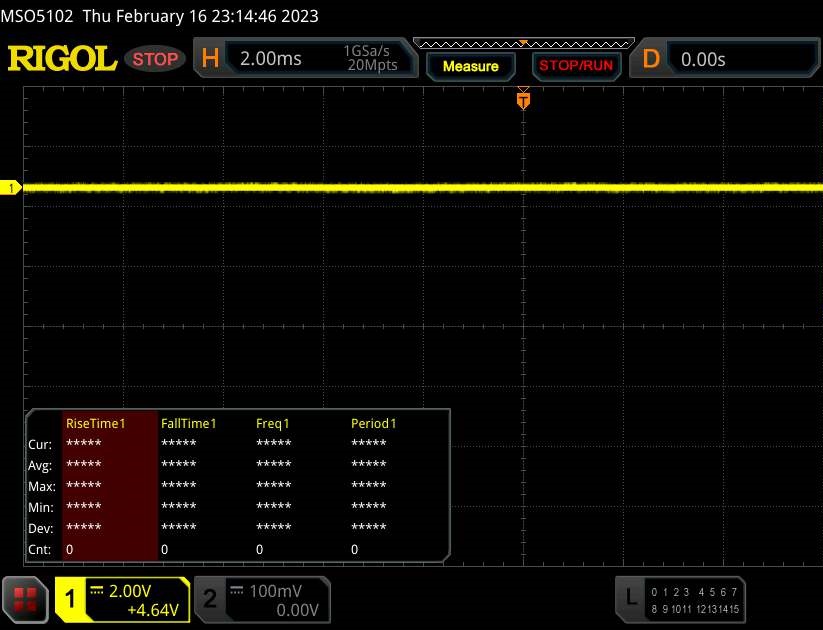 | ||
[pwm_comparison] Em comparação: 52 % de todos os dispositivos testados não usam PWM para escurecer a tela. Se PWM foi detectado, uma média de 7798 (mínimo: 5 - máximo: 343500) Hz foi medida. | |||
Desempenho: Core i9-13900HX e RTX 4080 encabeçam os gráficos
A configuração atual coloca a Lenovo Legion Pro 7 na categoria de alta qualidade absoluta, o que significa que você terá que tossir os centavos de acordo (consideramos o nível de preços atual excessivo, no entanto).
Em qualquer caso, esta configuração oferece energia suficiente para navegar por todos os tipos de cargas de trabalho durante anos futuros.
Condições de teste
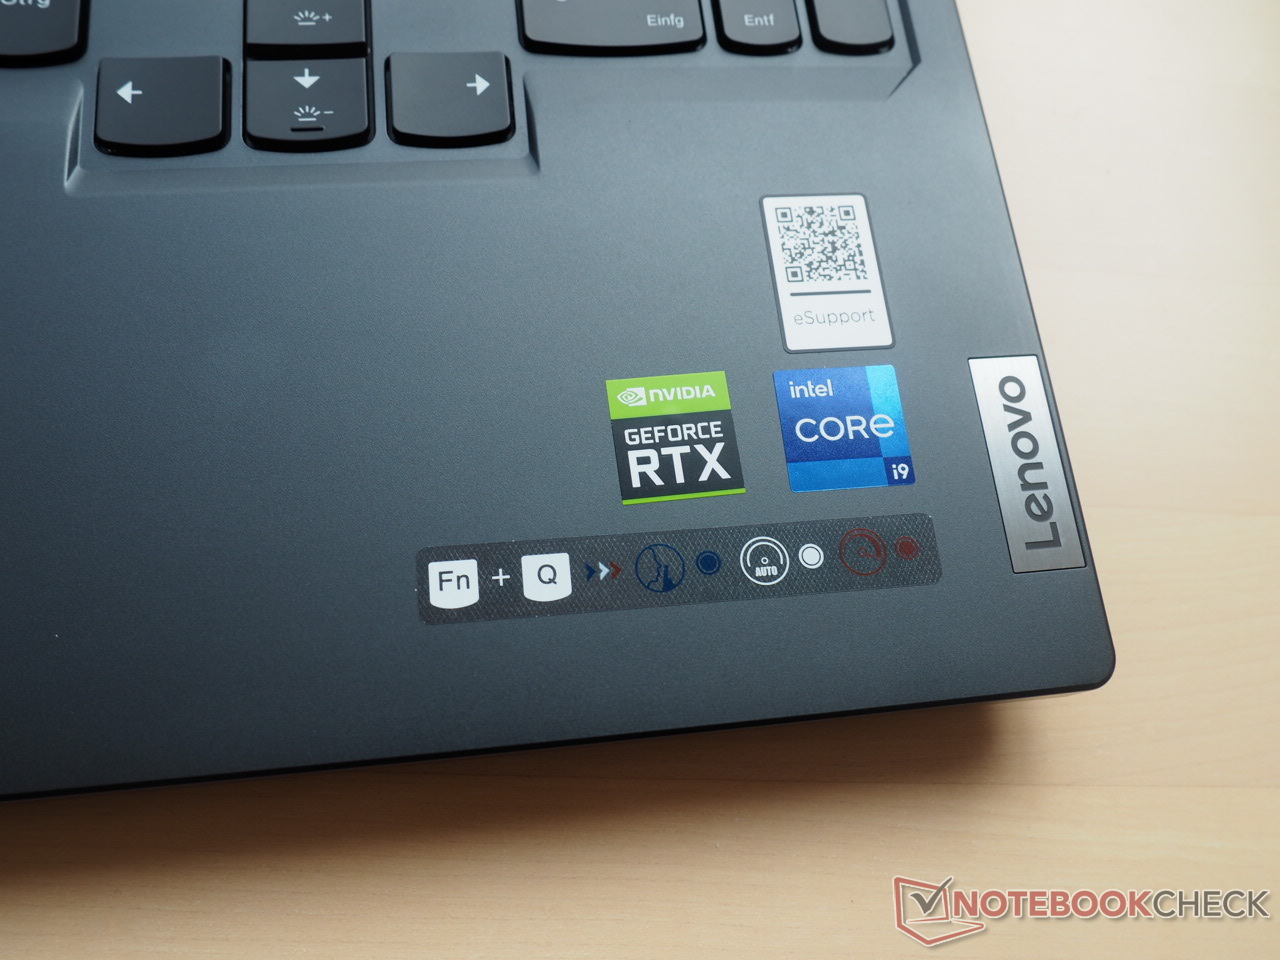
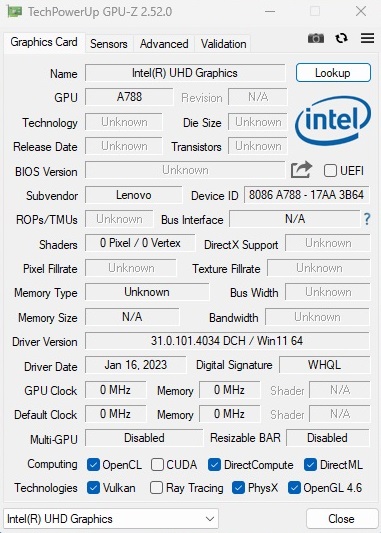
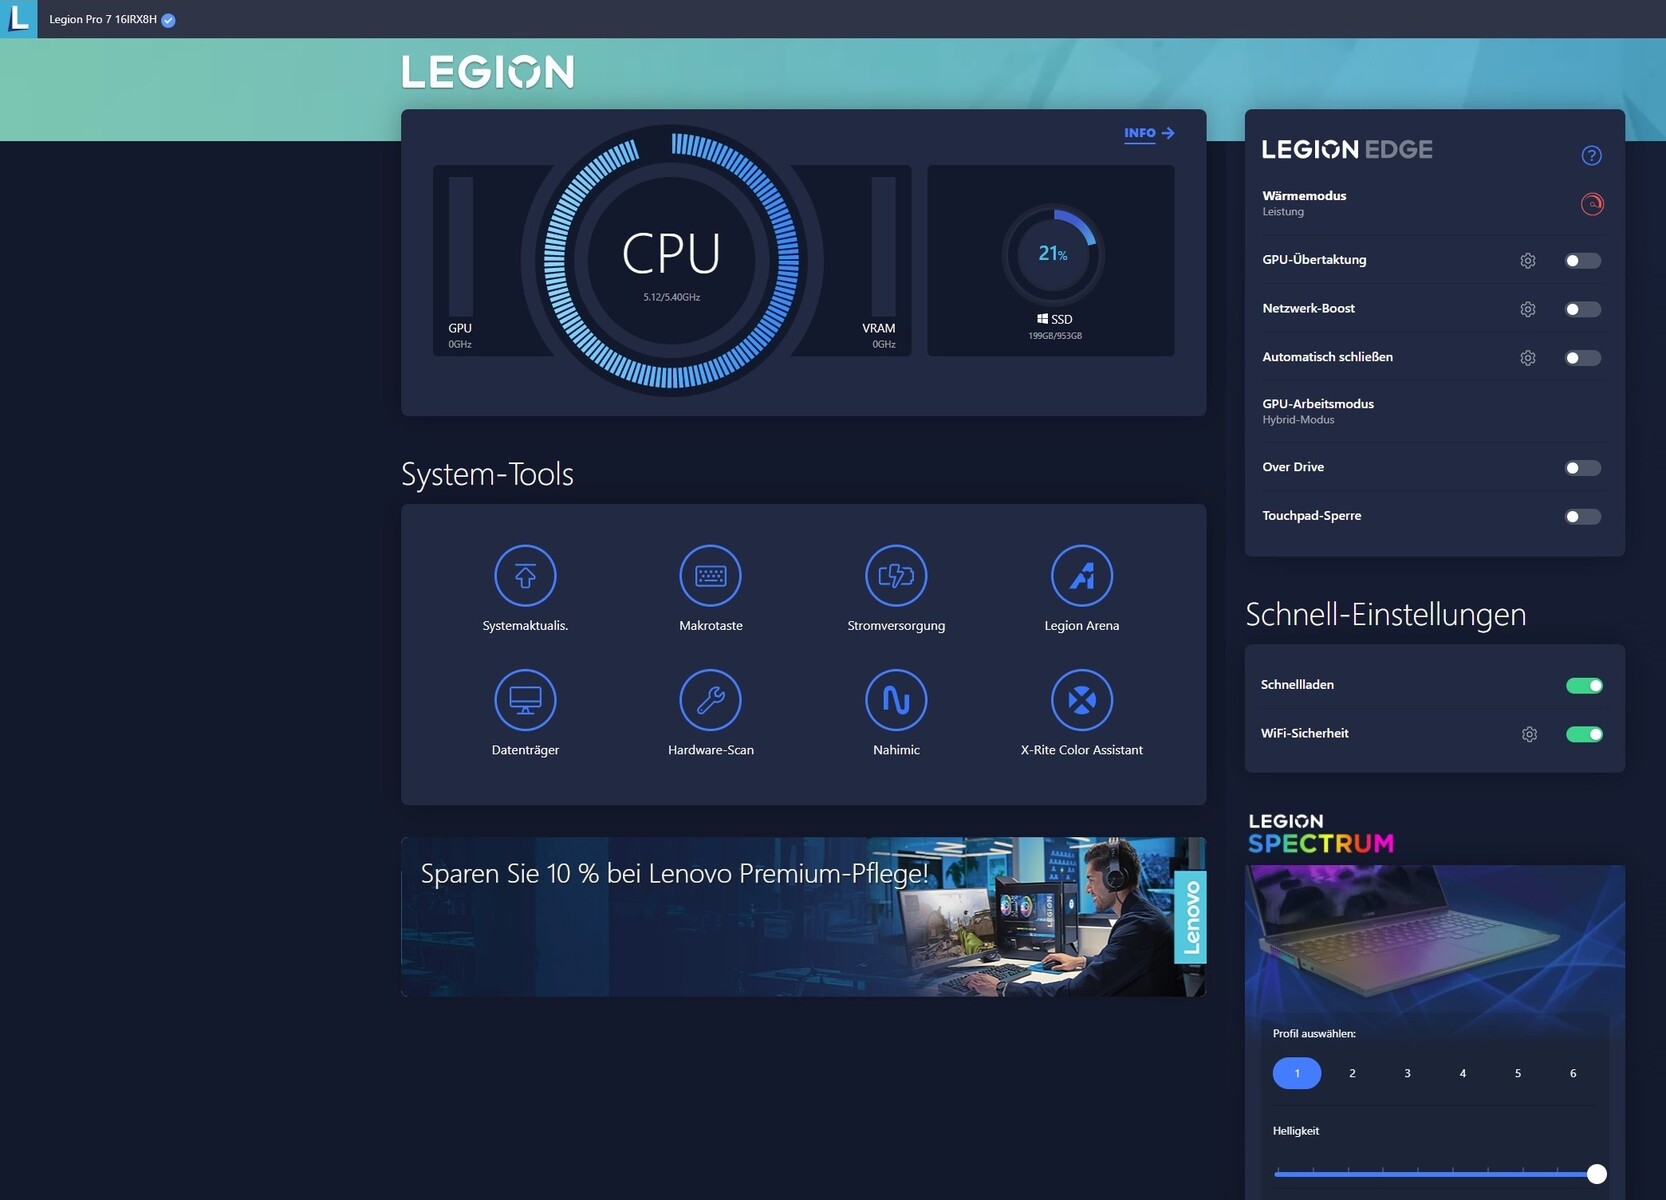
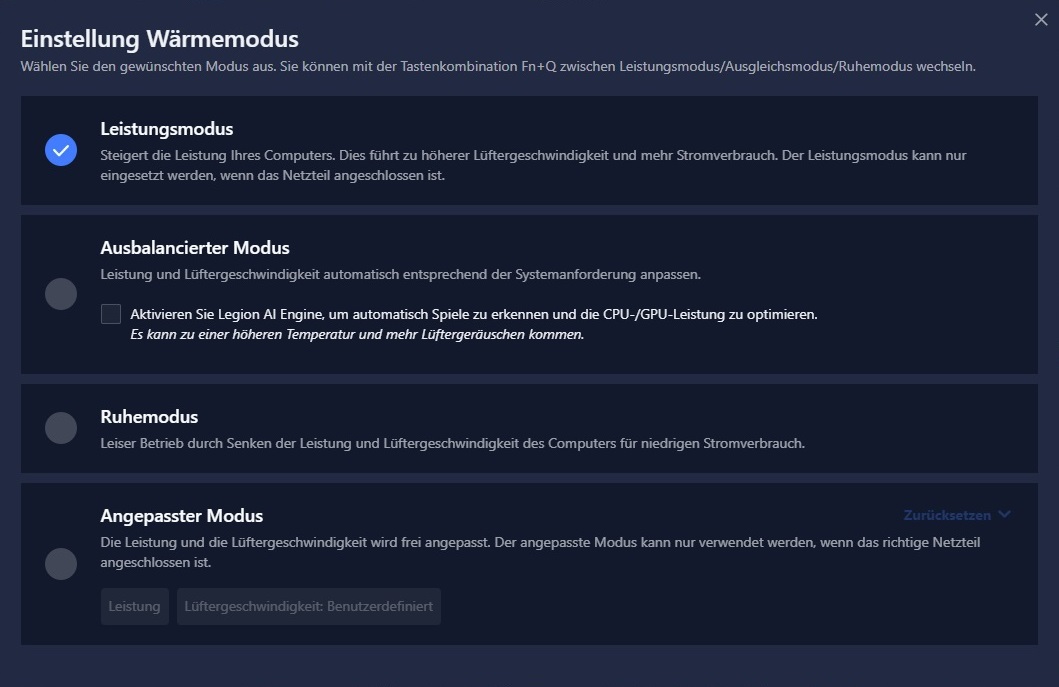
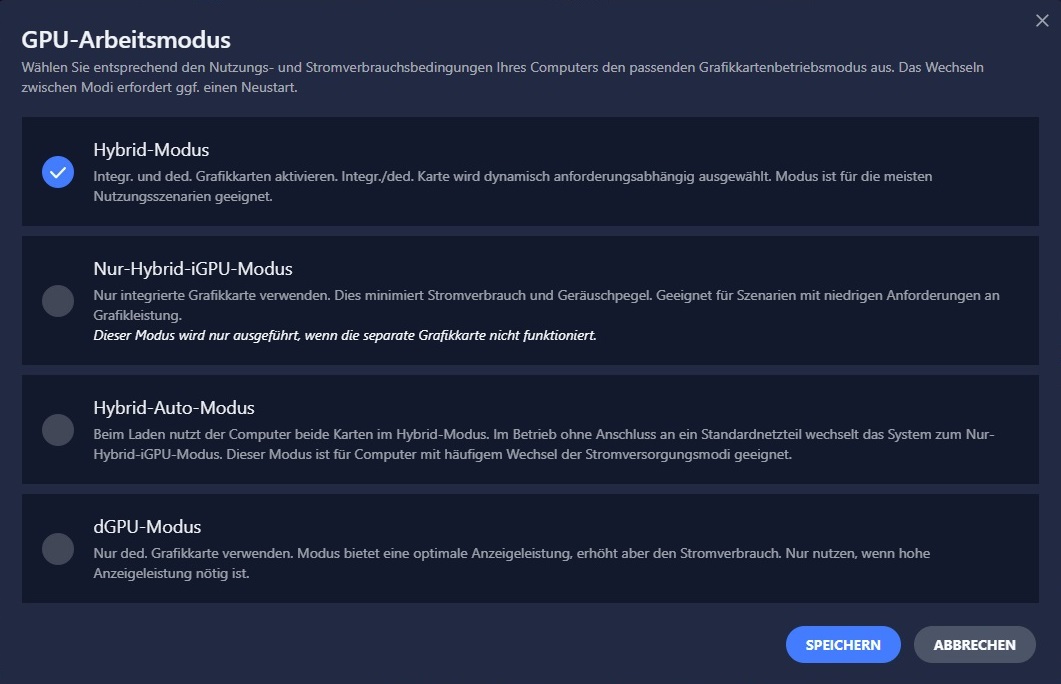
O aplicativo Lenovo Vantage vem pré-instalado dentro do qual você pode escolher entre vários modos de operação de performance e GPU. Você também pode mudar os modos de performance através do atalho Fn + Q.
Usamos o modo Performance para todas as nossas medições juntamente com a comutação gráfica ativa que alterna dinamicamente entre o iGPU e o dGPU. Um modo dGPU puro também está disponível (veja as screenshots abaixo).
A tabela abaixo ilustra o efeito de diferentes modos de desempenho sobre os valores PL1/PL2 e o ruído do ventilador.
| Silencioso | Equilibrado | Desempenho | |
| CPU PL1 (HWiNFO) | 55 W | 75 W | 130 W |
| CPU PL2 (HWiNFO) | 65 W | 119 W | 185 W |
| Ruído (The Witcher 3 ) | 39 dB(A) | 43 - 46 dB(A) | 49 - 55 dB(A) |
| Desempenho (The Witcher 3 ) | 40 fps (Bloqueado) | 150 fps | 180 fps |
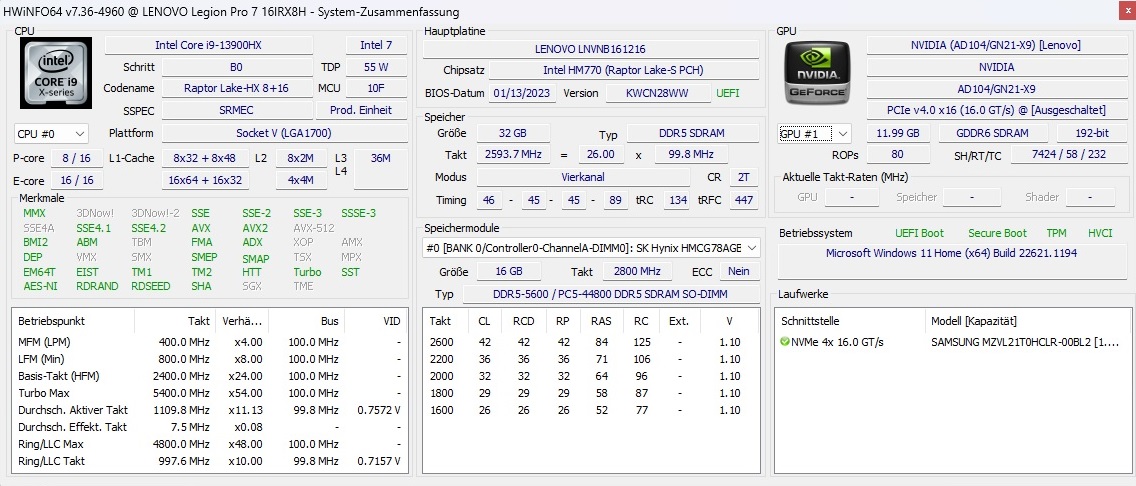
Prozessor
O Intel Core i9-13900HX é um monstro de desempenho. A parte de 10 nm oferece oito núcleos de desempenho com relógios de 2,2 GHz a 5,4 GHz e suporte de hiperthreading juntamente com 16 núcleos de eficiência com relógio de 1,6 GHz a 3,9 GHz sem hiperthreading, resultando em um total de 32 fios em paralelo.
O exuberante cache L3 de 36 MB e 55 W TDP reafirmam ainda mais que o Core i9-13900HX é um poderoso chip.
Cinebench R15 Multi Dauertest
* ... menor é melhor
AIDA64: FP32 Ray-Trace | FPU Julia | CPU SHA3 | CPU Queen | FPU SinJulia | FPU Mandel | CPU AES | CPU ZLib | FP64 Ray-Trace | CPU PhotoWorxx
| Performance rating | |
| Lenovo Legion Pro 7 16IRX8H | |
| Média da turma Gaming | |
| Média Intel Core i9-13900HX | |
| Razer Blade 16 Early 2023 | |
| Lenovo Legion 7 16ARHA7 | |
| Lenovo Legion 7 16IAX7-82TD004SGE | |
| Lenovo Legion 7 16ACHg6 | |
| AIDA64 / FP32 Ray-Trace | |
| Média da turma Gaming (10227 - 85542, n=110, últimos 2 anos) | |
| Lenovo Legion Pro 7 16IRX8H | |
| Razer Blade 16 Early 2023 | |
| Razer Blade 16 Early 2023 | |
| Razer Blade 16 Early 2023 | |
| Média Intel Core i9-13900HX (17589 - 27615, n=22) | |
| Lenovo Legion 7 16ARHA7 | |
| Lenovo Legion 7 16ACHg6 | |
| Lenovo Legion 7 16IAX7-82TD004SGE | |
| AIDA64 / FPU Julia | |
| Média da turma Gaming (51376 - 238426, n=110, últimos 2 anos) | |
| Lenovo Legion Pro 7 16IRX8H | |
| Razer Blade 16 Early 2023 | |
| Razer Blade 16 Early 2023 | |
| Razer Blade 16 Early 2023 | |
| Média Intel Core i9-13900HX (88686 - 137015, n=22) | |
| Lenovo Legion 7 16ARHA7 | |
| Lenovo Legion 7 16ACHg6 | |
| Lenovo Legion 7 16IAX7-82TD004SGE | |
| AIDA64 / CPU SHA3 | |
| Lenovo Legion Pro 7 16IRX8H | |
| Razer Blade 16 Early 2023 | |
| Razer Blade 16 Early 2023 | |
| Razer Blade 16 Early 2023 | |
| Média da turma Gaming (2180 - 9817, n=110, últimos 2 anos) | |
| Média Intel Core i9-13900HX (4362 - 7029, n=22) | |
| Lenovo Legion 7 16IAX7-82TD004SGE | |
| Lenovo Legion 7 16ARHA7 | |
| Lenovo Legion 7 16ACHg6 | |
| AIDA64 / CPU Queen | |
| Razer Blade 16 Early 2023 | |
| Razer Blade 16 Early 2023 | |
| Lenovo Legion Pro 7 16IRX8H | |
| Média Intel Core i9-13900HX (125644 - 141385, n=22) | |
| Média da turma Gaming (49785 - 173351, n=101, últimos 2 anos) | |
| Lenovo Legion 7 16ARHA7 | |
| Lenovo Legion 7 16ACHg6 | |
| Lenovo Legion 7 16IAX7-82TD004SGE | |
| AIDA64 / FPU SinJulia | |
| Razer Blade 16 Early 2023 | |
| Razer Blade 16 Early 2023 | |
| Razer Blade 16 Early 2023 | |
| Lenovo Legion Pro 7 16IRX8H | |
| Média Intel Core i9-13900HX (12334 - 17179, n=22) | |
| Média da turma Gaming (4424 - 33636, n=110, últimos 2 anos) | |
| Lenovo Legion 7 16IAX7-82TD004SGE | |
| Lenovo Legion 7 16ARHA7 | |
| Lenovo Legion 7 16ACHg6 | |
| AIDA64 / FPU Mandel | |
| Média da turma Gaming (25115 - 128721, n=110, últimos 2 anos) | |
| Lenovo Legion Pro 7 16IRX8H | |
| Razer Blade 16 Early 2023 | |
| Razer Blade 16 Early 2023 | |
| Razer Blade 16 Early 2023 | |
| Média Intel Core i9-13900HX (43850 - 69202, n=22) | |
| Lenovo Legion 7 16ARHA7 | |
| Lenovo Legion 7 16ACHg6 | |
| Lenovo Legion 7 16IAX7-82TD004SGE | |
| AIDA64 / CPU AES | |
| Razer Blade 16 Early 2023 | |
| Razer Blade 16 Early 2023 | |
| Razer Blade 16 Early 2023 | |
| Lenovo Legion 7 16ARHA7 | |
| Média Intel Core i9-13900HX (89413 - 237881, n=22) | |
| Lenovo Legion 7 16ACHg6 | |
| Lenovo Legion Pro 7 16IRX8H | |
| Lenovo Legion 7 16IAX7-82TD004SGE | |
| Média da turma Gaming (39258 - 247074, n=110, últimos 2 anos) | |
| AIDA64 / CPU ZLib | |
| Lenovo Legion Pro 7 16IRX8H | |
| Razer Blade 16 Early 2023 | |
| Razer Blade 16 Early 2023 | |
| Razer Blade 16 Early 2023 | |
| Média Intel Core i9-13900HX (1284 - 1958, n=22) | |
| Média da turma Gaming (574 - 2531, n=110, últimos 2 anos) | |
| Lenovo Legion 7 16IAX7-82TD004SGE | |
| Lenovo Legion 7 16ARHA7 | |
| Lenovo Legion 7 16ACHg6 | |
| AIDA64 / FP64 Ray-Trace | |
| Média da turma Gaming (5509 - 45446, n=110, últimos 2 anos) | |
| Lenovo Legion Pro 7 16IRX8H | |
| Razer Blade 16 Early 2023 | |
| Razer Blade 16 Early 2023 | |
| Razer Blade 16 Early 2023 | |
| Média Intel Core i9-13900HX (9481 - 15279, n=22) | |
| Lenovo Legion 7 16ARHA7 | |
| Lenovo Legion 7 16ACHg6 | |
| Lenovo Legion 7 16IAX7-82TD004SGE | |
| AIDA64 / CPU PhotoWorxx | |
| Razer Blade 16 Early 2023 | |
| Razer Blade 16 Early 2023 | |
| Razer Blade 16 Early 2023 | |
| Lenovo Legion Pro 7 16IRX8H | |
| Média Intel Core i9-13900HX (42994 - 51994, n=22) | |
| Média da turma Gaming (12271 - 89891, n=110, últimos 2 anos) | |
| Lenovo Legion 7 16IAX7-82TD004SGE | |
| Lenovo Legion 7 16ARHA7 | |
| Lenovo Legion 7 16ACHg6 | |
Desempenho do sistema
O desempenho geral do sistema é de pescoço e pescoço com o da Lâmina 16. O Legion Pro 7 pontua 7.830 pontos no PCMark 10, o que é um excelente resultado que está 11% acima da média da classe.
CrossMark: Overall | Productivity | Creativity | Responsiveness
| PCMark 10 / Score | |
| Lenovo Legion 7 16IAX7-82TD004SGE | |
| Média da turma Gaming (5828 - 11574, n=96, últimos 2 anos) | |
| Média Intel Core i9-13900HX, NVIDIA GeForce RTX 4080 Laptop GPU (7609 - 8549, n=3) | |
| Razer Blade 16 Early 2023 | |
| Lenovo Legion Pro 7 16IRX8H | |
| Lenovo Legion 7 16ARHA7 | |
| Lenovo Legion 7 16ACHg6 | |
| PCMark 10 / Essentials | |
| Lenovo Legion Pro 7 16IRX8H | |
| Média Intel Core i9-13900HX, NVIDIA GeForce RTX 4080 Laptop GPU (10982 - 11824, n=3) | |
| Lenovo Legion 7 16IAX7-82TD004SGE | |
| Razer Blade 16 Early 2023 | |
| Média da turma Gaming (8810 - 12600, n=100, últimos 2 anos) | |
| Lenovo Legion 7 16ARHA7 | |
| Lenovo Legion 7 16ACHg6 | |
| PCMark 10 / Productivity | |
| Lenovo Legion 7 16IAX7-82TD004SGE | |
| Lenovo Legion Pro 7 16IRX8H | |
| Média da turma Gaming (6845 - 18766, n=98, últimos 2 anos) | |
| Média Intel Core i9-13900HX, NVIDIA GeForce RTX 4080 Laptop GPU (9976 - 10788, n=3) | |
| Lenovo Legion 7 16ACHg6 | |
| Lenovo Legion 7 16ARHA7 | |
| Razer Blade 16 Early 2023 | |
| PCMark 10 / Digital Content Creation | |
| Razer Blade 16 Early 2023 | |
| Lenovo Legion 7 16IAX7-82TD004SGE | |
| Média da turma Gaming (7602 - 19657, n=98, últimos 2 anos) | |
| Média Intel Core i9-13900HX, NVIDIA GeForce RTX 4080 Laptop GPU (10135 - 14720, n=3) | |
| Lenovo Legion 7 16ARHA7 | |
| Lenovo Legion 7 16ACHg6 | |
| Lenovo Legion Pro 7 16IRX8H | |
| CrossMark / Overall | |
| Lenovo Legion 7 16IAX7-82TD004SGE | |
| Média Intel Core i9-13900HX, NVIDIA GeForce RTX 4080 Laptop GPU (1991 - 2194, n=2) | |
| Média da turma Gaming (1366 - 2409, n=98, últimos 2 anos) | |
| Lenovo Legion 7 16ARHA7 | |
| Razer Blade 16 Early 2023 | |
| CrossMark / Productivity | |
| Lenovo Legion 7 16IAX7-82TD004SGE | |
| Média Intel Core i9-13900HX, NVIDIA GeForce RTX 4080 Laptop GPU (1828 - 2059, n=2) | |
| Média da turma Gaming (1386 - 2254, n=98, últimos 2 anos) | |
| Lenovo Legion 7 16ARHA7 | |
| Razer Blade 16 Early 2023 | |
| CrossMark / Creativity | |
| Média Intel Core i9-13900HX, NVIDIA GeForce RTX 4080 Laptop GPU (2239 - 2411, n=2) | |
| Lenovo Legion 7 16IAX7-82TD004SGE | |
| Média da turma Gaming (1343 - 2729, n=98, últimos 2 anos) | |
| Razer Blade 16 Early 2023 | |
| Lenovo Legion 7 16ARHA7 | |
| CrossMark / Responsiveness | |
| Lenovo Legion 7 16IAX7-82TD004SGE | |
| Média Intel Core i9-13900HX, NVIDIA GeForce RTX 4080 Laptop GPU (1808 - 1998, n=2) | |
| Média da turma Gaming (1226 - 2334, n=98, últimos 2 anos) | |
| Razer Blade 16 Early 2023 | |
| Lenovo Legion 7 16ARHA7 | |
| PCMark 10 Score | 7830 pontos | |
Ajuda | ||
| AIDA64 / Memory Copy | |
| Razer Blade 16 Early 2023 | |
| Razer Blade 16 Early 2023 | |
| Razer Blade 16 Early 2023 | |
| Lenovo Legion Pro 7 16IRX8H | |
| Média Intel Core i9-13900HX (67716 - 79193, n=22) | |
| Média da turma Gaming (21750 - 129946, n=110, últimos 2 anos) | |
| Lenovo Legion 7 16IAX7-82TD004SGE | |
| Lenovo Legion 7 16ARHA7 | |
| Lenovo Legion 7 16ACHg6 | |
| AIDA64 / Memory Read | |
| Razer Blade 16 Early 2023 | |
| Razer Blade 16 Early 2023 | |
| Razer Blade 16 Early 2023 | |
| Lenovo Legion Pro 7 16IRX8H | |
| Média Intel Core i9-13900HX (73998 - 88462, n=22) | |
| Média da turma Gaming (22956 - 118858, n=110, últimos 2 anos) | |
| Lenovo Legion 7 16IAX7-82TD004SGE | |
| Lenovo Legion 7 16ARHA7 | |
| Lenovo Legion 7 16ACHg6 | |
| AIDA64 / Memory Write | |
| Razer Blade 16 Early 2023 | |
| Razer Blade 16 Early 2023 | |
| Razer Blade 16 Early 2023 | |
| Média da turma Gaming (22297 - 135096, n=110, últimos 2 anos) | |
| Média Intel Core i9-13900HX (65472 - 77045, n=22) | |
| Lenovo Legion Pro 7 16IRX8H | |
| Lenovo Legion 7 16IAX7-82TD004SGE | |
| Lenovo Legion 7 16ARHA7 | |
| Lenovo Legion 7 16ACHg6 | |
| AIDA64 / Memory Latency | |
| Média da turma Gaming (75.3 - 259, n=110, últimos 2 anos) | |
| Razer Blade 16 Early 2023 | |
| Razer Blade 16 Early 2023 | |
| Razer Blade 16 Early 2023 | |
| Lenovo Legion 7 16IAX7-82TD004SGE | |
| Média Intel Core i9-13900HX (75.3 - 91.1, n=22) | |
| Lenovo Legion 7 16ARHA7 | |
| Lenovo Legion Pro 7 16IRX8H | |
| Lenovo Legion 7 16ACHg6 | |
* ... menor é melhor
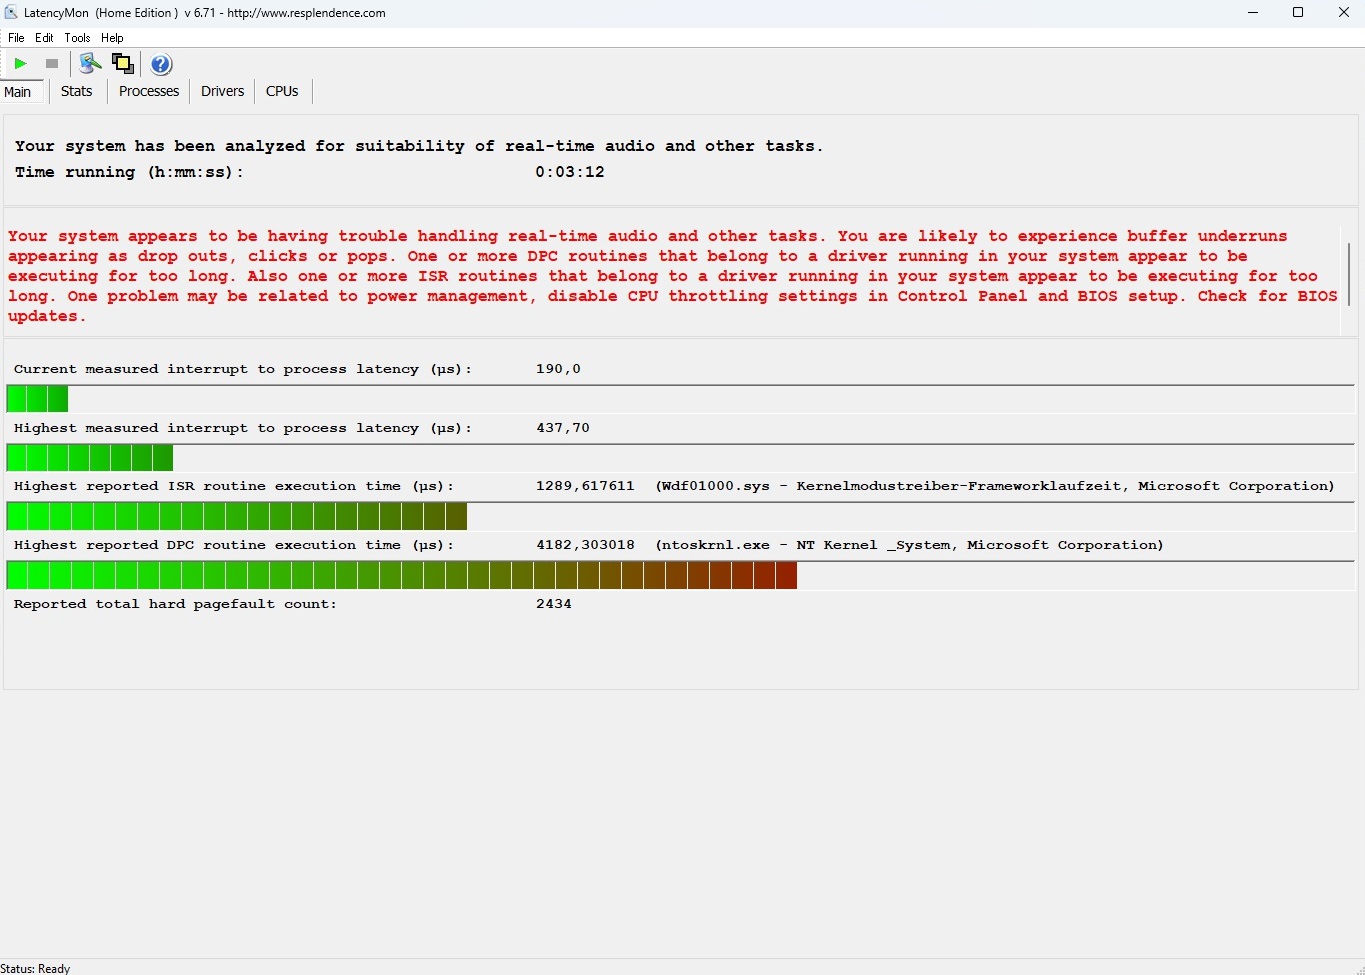
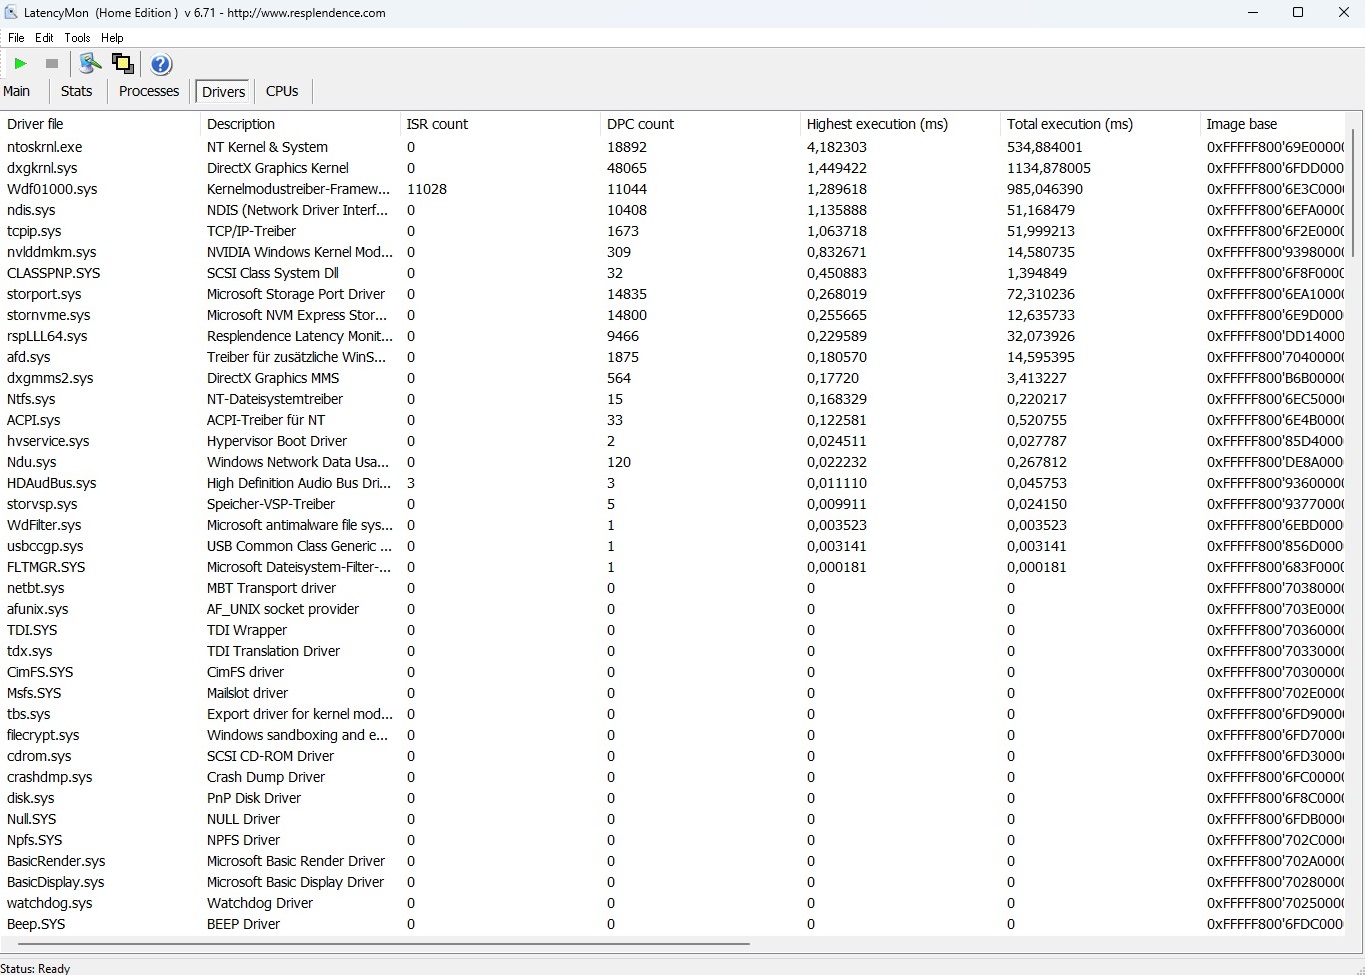
Latência do DPC
A latência do DPC revela-se mais uma vez problemática, embora isto só possa ser relevante para um pequeno subconjunto de usuários. Segundo o LatencyMon, o Legion Pro 7 não é ideal para a edição de áudio em tempo real sem mais ajustes finos.
| DPC Latencies / LatencyMon - interrupt to process latency (max), Web, Youtube, Prime95 | |
| Razer Blade 16 Early 2023 | |
| Lenovo Legion 7 16ARHA7 | |
| Lenovo Legion 7 16IAX7-82TD004SGE | |
| Lenovo Legion 7 16ACHg6 | |
| Lenovo Legion Pro 7 16IRX8H | |
* ... menor é melhor
Dispositivos de armazenamento
O Legion Pro 7 pontua bem no departamento de armazenamento. Nosso modelo de teste utiliza um rápido Samsung PM9A1 1 TB NVMe SSD, o que coloca um bom show em nossos benchmarks. O drive atinge uma velocidade de leitura sequencial de cerca de 5.400 MB/s e escreve sequencialmente mais de 4.000 MB/s.
Entretanto, nosso teste de loop DiskSpd prova fortes flutuações de desempenho sob carga contínua. A concorrência não parece ser afetada por uma estrangulamento tão forte.

* ... menor é melhor
Disk Throttling: DiskSpd Read Loop, Queue Depth 8
Desempenho da GPU
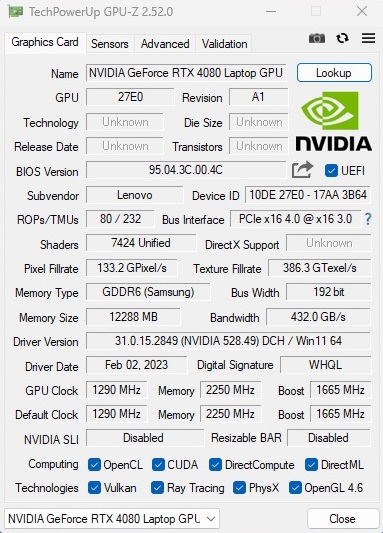
Com um TGP máximo de 175 W, incluindo o Dynamic Boost, o GPU para notebook RTX 4080 é provavelmente o componente mais excitante no Legion Pro 7 da perspectiva de um jogador. As especificações desta parte de 4 nm da geração Ada da Nvidia são impressionantes no papel.
Um total de 7.424 núcleos CUDA prometem um excelente desempenho. Entretanto, 12 GB de VRAM GDDR6 na interface de memória de 192 bits não inspiram muito em 2023 - 16 GB de VRAM teriam sido mais adequados, considerando as exigências dos jogos de hoje e o alto preço pedido. Mais informações e análises de desempenho podem ser encontradas em nossa página dedicada Análise da GPU Nvidia Ada RTX 40.
Apesar de não ter VRAM particularmente abundante, o GPU portátil RTX 4080 limpa o chão com a competição AMD e seus predecessores. Tomando todas as pontuações 3DMark juntas, a GPU do laptop RTX 4080 é mais de 30% mais rápida do que a GPU do GPU para laptop RTX 3080 Ti e o RX 6850M XT das Legiões da geração anterior, que também operavam em um TGP elevado.
| 3DMark 06 Standard Score | 59578 pontos | |
| 3DMark Vantage P Result | 111294 pontos | |
| 3DMark 11 Performance | 44468 pontos | |
| 3DMark Ice Storm Standard Score | 208555 pontos | |
| 3DMark Cloud Gate Standard Score | 66531 pontos | |
| 3DMark Fire Strike Score | 34434 pontos | |
| 3DMark Time Spy Score | 17928 pontos | |
Ajuda | ||
* ... menor é melhor
Desempenho nos jogos
Nos jogos, a GPU portátil RTX 4080 tem uma vantagem ainda maior, como visto na classificação de desempenho acumulado, especialmente em relação ao GPU para notebook RTX 3080 e o RX 6850M XT. No entanto, a CPU tem uma influência sobre os framerados com resoluções de 1080p.
Uma comparação mais significativa é vista quando o raytracing é ativado e nas resoluções QHD e 4K. Escolhemos títulos modernos, tais como Homem-Aranha Miles Morales, Vila Malvada Residentee Guardiães do Galaxy para ilustrar a proeza da GPU RTX 4080 em resoluções e configurações superiores.
Em média, a GPU por laptop RTX 4080 é cerca de um terço mais rápida que uma GPU por laptop RTX 3080 Ti 175 e cerca de 60% mais rápida que uma GPU por laptop RTX 3080 de 165 W nestes testes.
Comparações detalhadas de desempenho estão disponíveis em nossa extensa lista de benchmarks de jogos.
| Performance rating - Percent | |
| Razer Blade 16 Early 2023 | |
| Lenovo Legion Pro 7 16IRX8H | |
| Média da turma Gaming | |
| Lenovo Legion 7 16IAX7-82TD004SGE | |
| Lenovo Legion 7 16ACHg6 | |
| Lenovo Legion 7 16ARHA7 | |
| The Witcher 3 - 1920x1080 Ultra Graphics & Postprocessing (HBAO+) | |
| Lenovo Legion Pro 7 16IRX8H | |
| Razer Blade 16 Early 2023 | |
| Média da turma Gaming (95 - 240, n=8, últimos 2 anos) | |
| Lenovo Legion 7 16ARHA7 | |
| Lenovo Legion 7 16IAX7-82TD004SGE | |
| Lenovo Legion 7 16ACHg6 | |
| GTA V - 1920x1080 Highest AA:4xMSAA + FX AF:16x | |
| Lenovo Legion Pro 7 16IRX8H | |
| Razer Blade 16 Early 2023 | |
| Média da turma Gaming (48.3 - 186.9, n=103, últimos 2 anos) | |
| Lenovo Legion 7 16IAX7-82TD004SGE | |
| Lenovo Legion 7 16ACHg6 | |
| Lenovo Legion 7 16ARHA7 | |
| Final Fantasy XV Benchmark - 1920x1080 High Quality | |
| Lenovo Legion Pro 7 16IRX8H | |
| Razer Blade 16 Early 2023 | |
| Média da turma Gaming (41 - 215, n=104, últimos 2 anos) | |
| Lenovo Legion 7 16IAX7-82TD004SGE | |
| Lenovo Legion 7 16ARHA7 | |
| Lenovo Legion 7 16ACHg6 | |
| Strange Brigade - 1920x1080 ultra AA:ultra AF:16 | |
| Razer Blade 16 Early 2023 | |
| Lenovo Legion Pro 7 16IRX8H | |
| Média da turma Gaming (76.3 - 456, n=94, últimos 2 anos) | |
| Lenovo Legion 7 16ARHA7 | |
| Lenovo Legion 7 16ACHg6 | |
| Lenovo Legion 7 16IAX7-82TD004SGE | |
| Dota 2 Reborn - 1920x1080 ultra (3/3) best looking | |
| Razer Blade 16 Early 2023 | |
| Lenovo Legion Pro 7 16IRX8H | |
| Lenovo Legion 7 16IAX7-82TD004SGE | |
| Média da turma Gaming (84.8 - 248, n=113, últimos 2 anos) | |
| Lenovo Legion 7 16ACHg6 | |
| Lenovo Legion 7 16ARHA7 | |
| X-Plane 11.11 - 1920x1080 high (fps_test=3) | |
| Razer Blade 16 Early 2023 | |
| Lenovo Legion Pro 7 16IRX8H | |
| Lenovo Legion 7 16IAX7-82TD004SGE | |
| Média da turma Gaming (52.1 - 143.5, n=116, últimos 2 anos) | |
| Lenovo Legion 7 16ACHg6 | |
| Lenovo Legion 7 16ARHA7 | |
| Spider-Man Miles Morales | |
| 1920x0180 Very High Preset + Ray-Tracing AA:T | |
| Lenovo Legion Pro 7 16IRX8H | |
| Média NVIDIA GeForce RTX 4080 Laptop GPU (n=1) | |
| MSI Raider GE76 12UHS @175 W TGP | |
| XMG Neo 15 @165 W TGP | |
| 2560x1440 Very High Preset AA:T | |
| Lenovo Legion Pro 7 16IRX8H | |
| Média NVIDIA GeForce RTX 4080 Laptop GPU (n=1) | |
| MSI Raider GE76 12UHS @175 W TGP | |
| XMG Neo 15 @165 W TGP | |
| 3840x2160 Very High Preset AA:T | |
| Lenovo Legion Pro 7 16IRX8H | |
| Média NVIDIA GeForce RTX 4080 Laptop GPU (n=1) | |
| MSI Raider GE76 12UHS @175 W TGP | |
| XMG Neo 15 @165 W TGP | |
| Resident Evil Village | |
| 1920x1080 Ray Tracing Preset | |
| Lenovo Legion Pro 7 16IRX8H | |
| Média NVIDIA GeForce RTX 4080 Laptop GPU (n=1) | |
| MSI GE76 Raider | |
| Lenovo Legion 7 16ACHg6 | |
| 2560x1440 Max Preset | |
| Lenovo Legion Pro 7 16IRX8H | |
| Média NVIDIA GeForce RTX 4080 Laptop GPU (n=1) | |
| MSI GE76 Raider | |
| Lenovo Legion 7 16ACHg6 | |
| 3840x2160 Max Preset | |
| Lenovo Legion Pro 7 16IRX8H | |
| Média NVIDIA GeForce RTX 4080 Laptop GPU (n=1) | |
| MSI GE76 Raider | |
| Guardians of the Galaxy | |
| 1920x1080 Ultra Preset + Ultra Ray-Tracing | |
| Lenovo Legion Pro 7 16IRX8H | |
| Média NVIDIA GeForce RTX 4080 Laptop GPU (n=1) | |
| MSI GE76 Raider | |
| XMG Neo 15 @165 W TGP | |
| 2560x1440 Ultra Preset | |
| Lenovo Legion Pro 7 16IRX8H | |
| Média NVIDIA GeForce RTX 4080 Laptop GPU (n=1) | |
| MSI GE76 Raider | |
| XMG Neo 15 @165 W TGP | |
| Lenovo Legion 7 16ARHA7 | |
| 3840x2160 Ultra Preset | |
| Lenovo Legion Pro 7 16IRX8H | |
| Média NVIDIA GeForce RTX 4080 Laptop GPU (n=1) | |
| MSI GE76 Raider | |
| XMG Neo 15 @165 W TGP | |
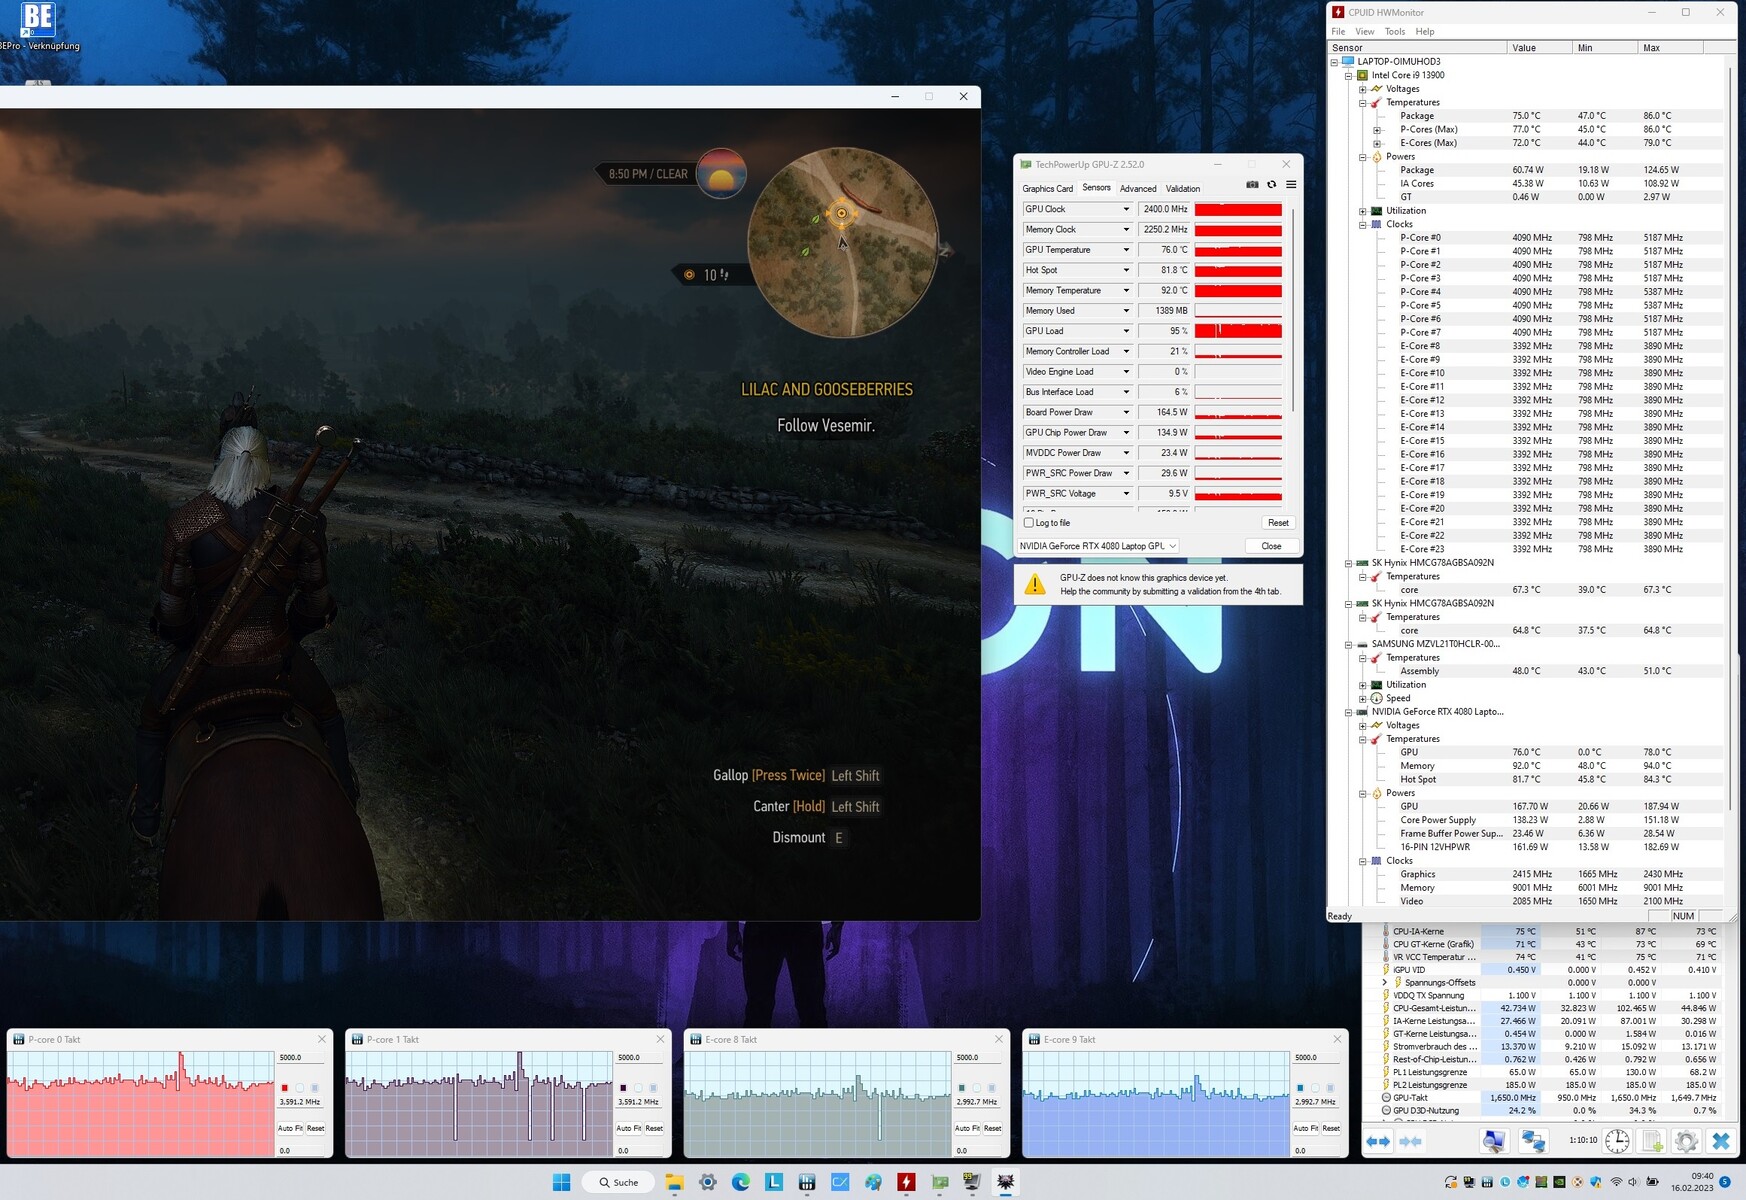
Ao contrário da SSD e, em menor grau, da CPU, a GPU permanece relativamente estável durante um longo período de tempo. Não vemos quedas drásticas na taxa de quadros ou inconsistências nos 60 minutos de estresse comO Witcher 3a 1080p Ultra.
The Witcher 3 FPS Chart
| baixo | média | alto | ultra | QHD | 4K | |
|---|---|---|---|---|---|---|
| GTA V (2015) | 187.6 | 185.1 | 145.5 | |||
| The Witcher 3 (2015) | 509 | 325 | 178 | |||
| Dota 2 Reborn (2015) | 206 | 194.4 | 179 | |||
| Final Fantasy XV Benchmark (2018) | 192.1 | 162.4 | ||||
| X-Plane 11.11 (2018) | 167.9 | 131.8 | ||||
| Far Cry 5 (2018) | 179 | 158 | 156 | |||
| Strange Brigade (2018) | 392 | 351 | 318 | |||
| Outriders (2021) | 157.7 | 151.1 | 149.9 | 130.5 | 72.3 | |
| Resident Evil Village (2021) | 239 | 239 | 239 | 193.7 | 100.5 | |
| Days Gone (2021) | 243 | 215 | 171.3 | 125.1 | 70.9 | |
| Deathloop (2021) | 130.5 | 129.4 | 123.5 | 112.8 | 60.7 | |
| Back 4 Blood (2021) | 345 | 295 | 276 | 188.4 | 112 | |
| Guardians of the Galaxy (2021) | 165 | 165 | 163 | 146 | 96 | |
| Riders Republic (2021) | 172 | 169 | 168 | 133 | 76 | |
| Farming Simulator 22 (2021) | 263 | 217 | 194.4 | 191.6 | 145.2 | |
| Halo Infinite (2021) | 239 | 209 | 197.5 | 150.7 | 88.6 | |
| God of War (2022) | 160.6 | 137.7 | 101.4 | 86.7 | 60 | |
| Rainbow Six Extraction (2022) | 278 | 272 | 221 | 172 | 88 | |
| Elden Ring (2022) | 59.9 | 59.8 | 59.8 | 59.6 | 59.3 | |
| Elex 2 (2022) | 118.7 | 118.7 | 118.5 | 114.5 | 63 | |
| Vampire Bloodhunt (2022) | 266 | 239 | 221 | 195.5 | 124.6 | |
| F1 22 (2022) | 247 | 222 | 101 | 72 | 38 | |
| The Quarry (2022) | 206 | 174.1 | 142 | 102.5 | 48.7 | |
| A Plague Tale Requiem (2022) | 110.9 | 97.7 | 86 | 63.4 | 36.1 | |
| Uncharted Legacy of Thieves Collection (2022) | 102.3 | 100.3 | 99.5 | 86.5 | 54.1 | |
| Call of Duty Modern Warfare 2 2022 (2022) | 182 | 149 | 140 | 104 | 67 | |
| Spider-Man Miles Morales (2022) | 115.2 | 103.3 | 101.3 | 94.8 | 68.5 | |
| Need for Speed Unbound (2022) | 101.2 | 94.7 | 83 | 79.7 | 63.6 | |
| High On Life (2023) | 214 | 162.8 | 148.4 | 100.6 | 42.6 | |
| The Witcher 3 v4 (2023) | 161.4 | 144 | 125.3 | 81.1 | 42.8 | |
| Dead Space Remake (2023) | 121.5 | 113.3 | 109.3 | 81.8 | 41.3 |
Emissões: Emissões mais elevadas de temperatura e ruído em comparação com a Lâmina 16
Ruído do sistema
Não é de surpreender que os componentes de alta qualidade oferecidos tenham altas emissões de calor e, conseqüentemente, alto ruído. Enquanto o Legion Pro 7 ainda está razoavelmente silencioso em modo inativo com um nível médio de pressão sonora (SPL) de 28 dB(A), as coisas ficam perturbadoramente barulhentas sem um fone de ouvido enquanto se joga no modo Performance com o SPL variando de 49 a 55 dB(A).
O modo balanceado, que não causa um grande déficit de desempenho, resulta em um SPL de 43 a 46 db(A) mais suportável. A Razer Blade 16 comparativamente permanece mais silenciosa em todas as condições de teste, apesar de sua altura e peso menores.
Barulho
| Ocioso |
| 26 / 28 / 34 dB |
| Carga |
| 47 / 56 dB |
 | ||
30 dB silencioso 40 dB(A) audível 50 dB(A) ruidosamente alto |
||
min: | ||
| Lenovo Legion Pro 7 16IRX8H i9-13900HX, GeForce RTX 4080 Laptop GPU | Razer Blade 16 Early 2023 i9-13950HX, GeForce RTX 4080 Laptop GPU | Lenovo Legion 7 16IAX7-82TD004SGE i9-12900HX, GeForce RTX 3080 Ti Laptop GPU | Lenovo Legion 7 16ACHg6 R9 5900HX, GeForce RTX 3080 Laptop GPU | Lenovo Legion 7 16ARHA7 R9 6900HX, Radeon RX 6850M XT | |
|---|---|---|---|---|---|
| Noise | 14% | 3% | 3% | 16% | |
| desligado / ambiente * (dB) | 24 | 23 4% | 24.5 -2% | 26 -8% | 22.8 5% |
| Idle Minimum * (dB) | 26 | 23 12% | 24.5 6% | 26 -0% | 23 12% |
| Idle Average * (dB) | 28 | 23 18% | 30 -7% | 30 -7% | 23 18% |
| Idle Maximum * (dB) | 34 | 23.6 31% | 32.5 4% | 35 -3% | 23 32% |
| Load Average * (dB) | 47 | 39 17% | 43.9 7% | 40 15% | 26.8 43% |
| Witcher 3 ultra * (dB) | 55 | 51.6 6% | 48.8 11% | 46 16% | 54.3 1% |
| Load Maximum * (dB) | 56 | 51.3 8% | 54.2 3% | 50 11% | 54.2 3% |
* ... menor é melhor
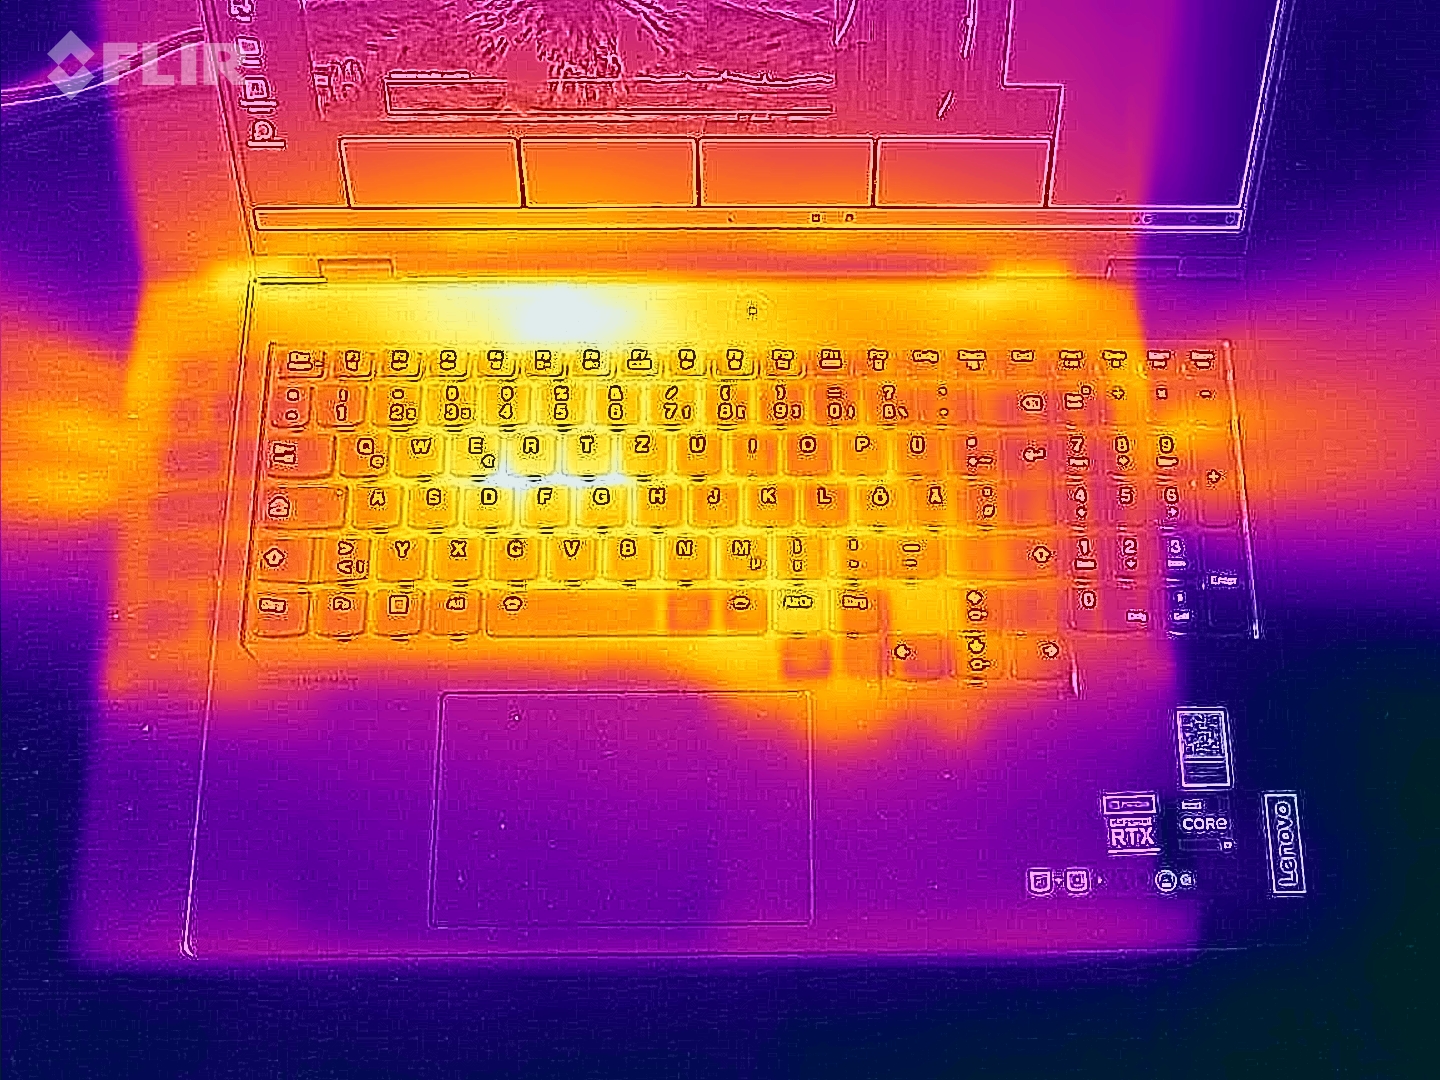
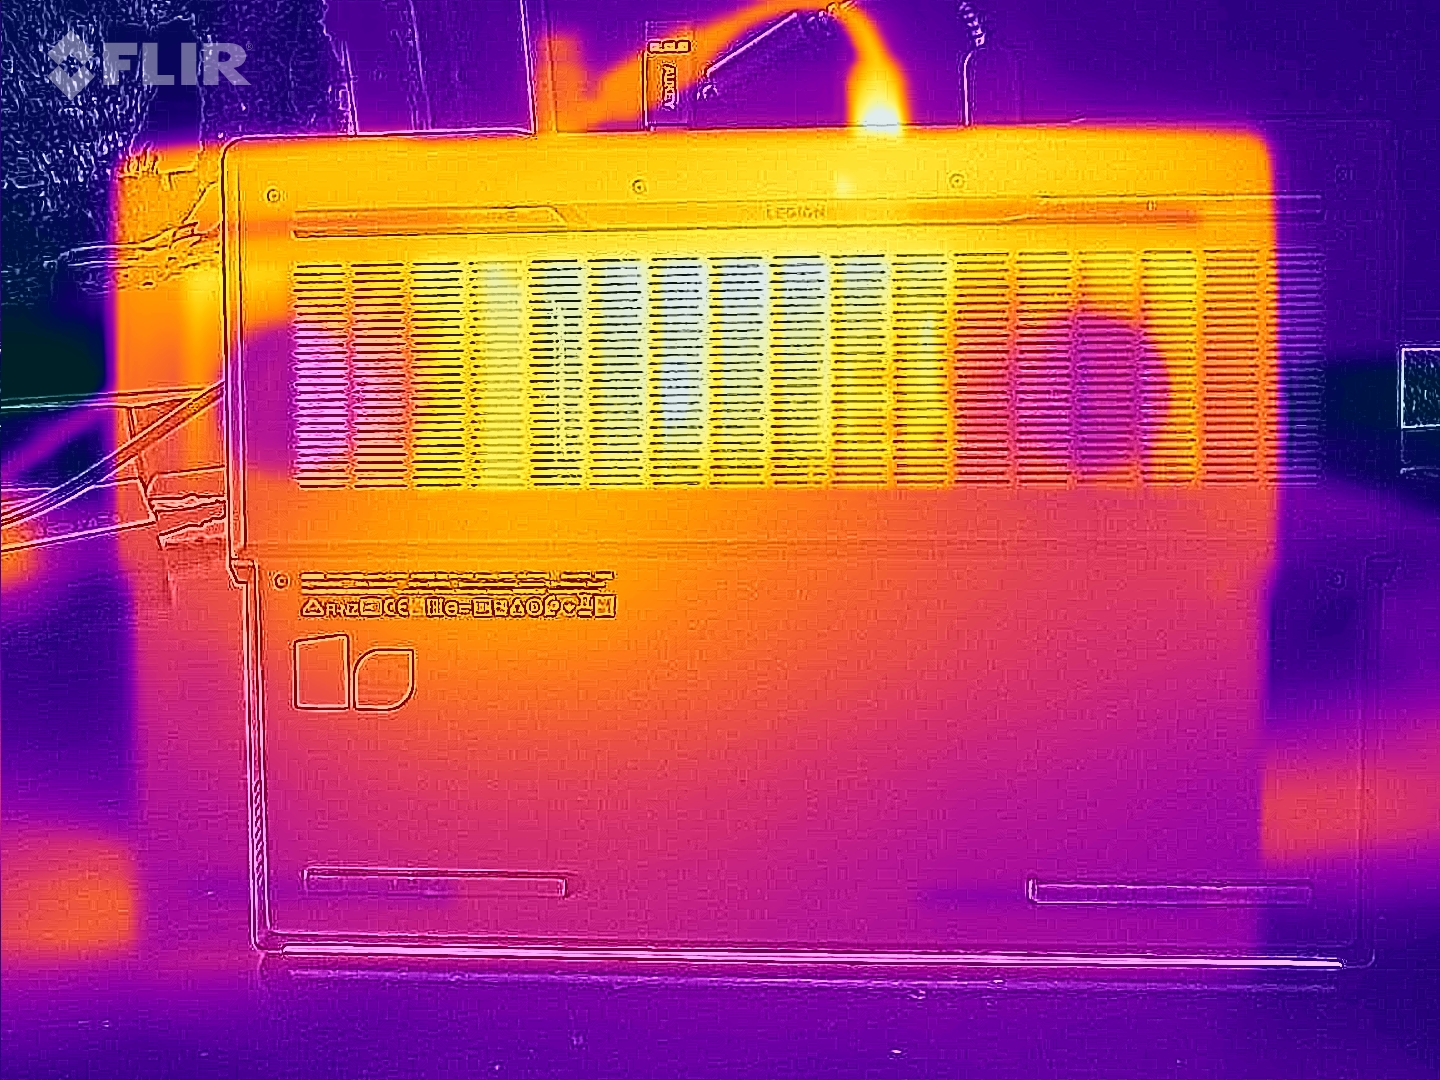
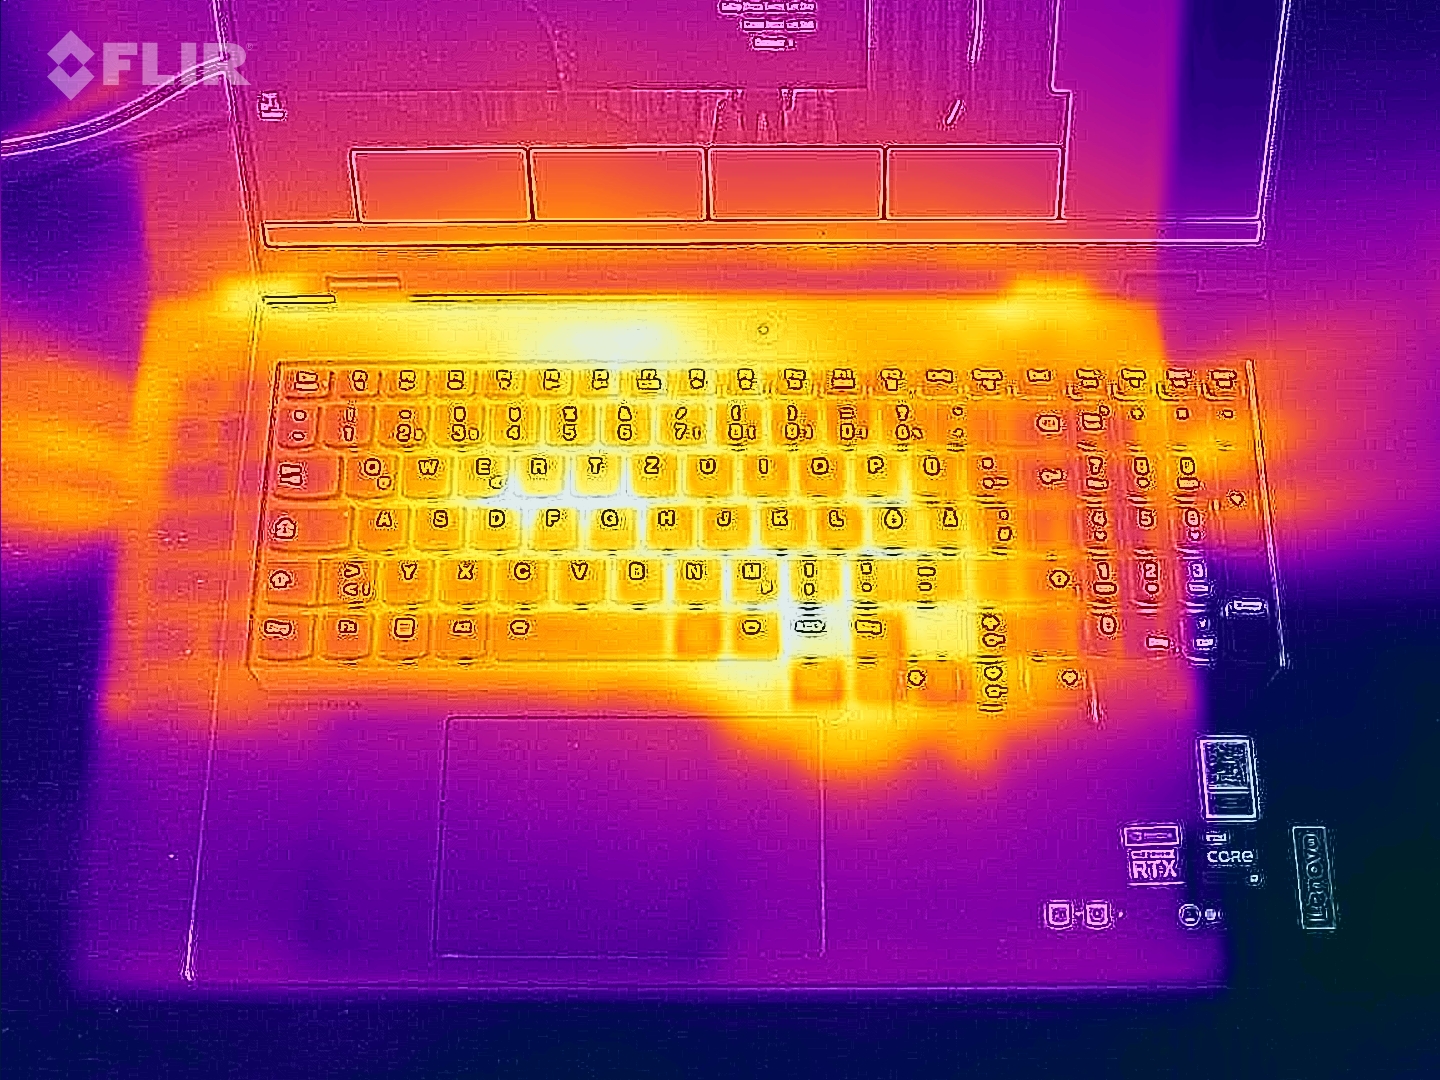
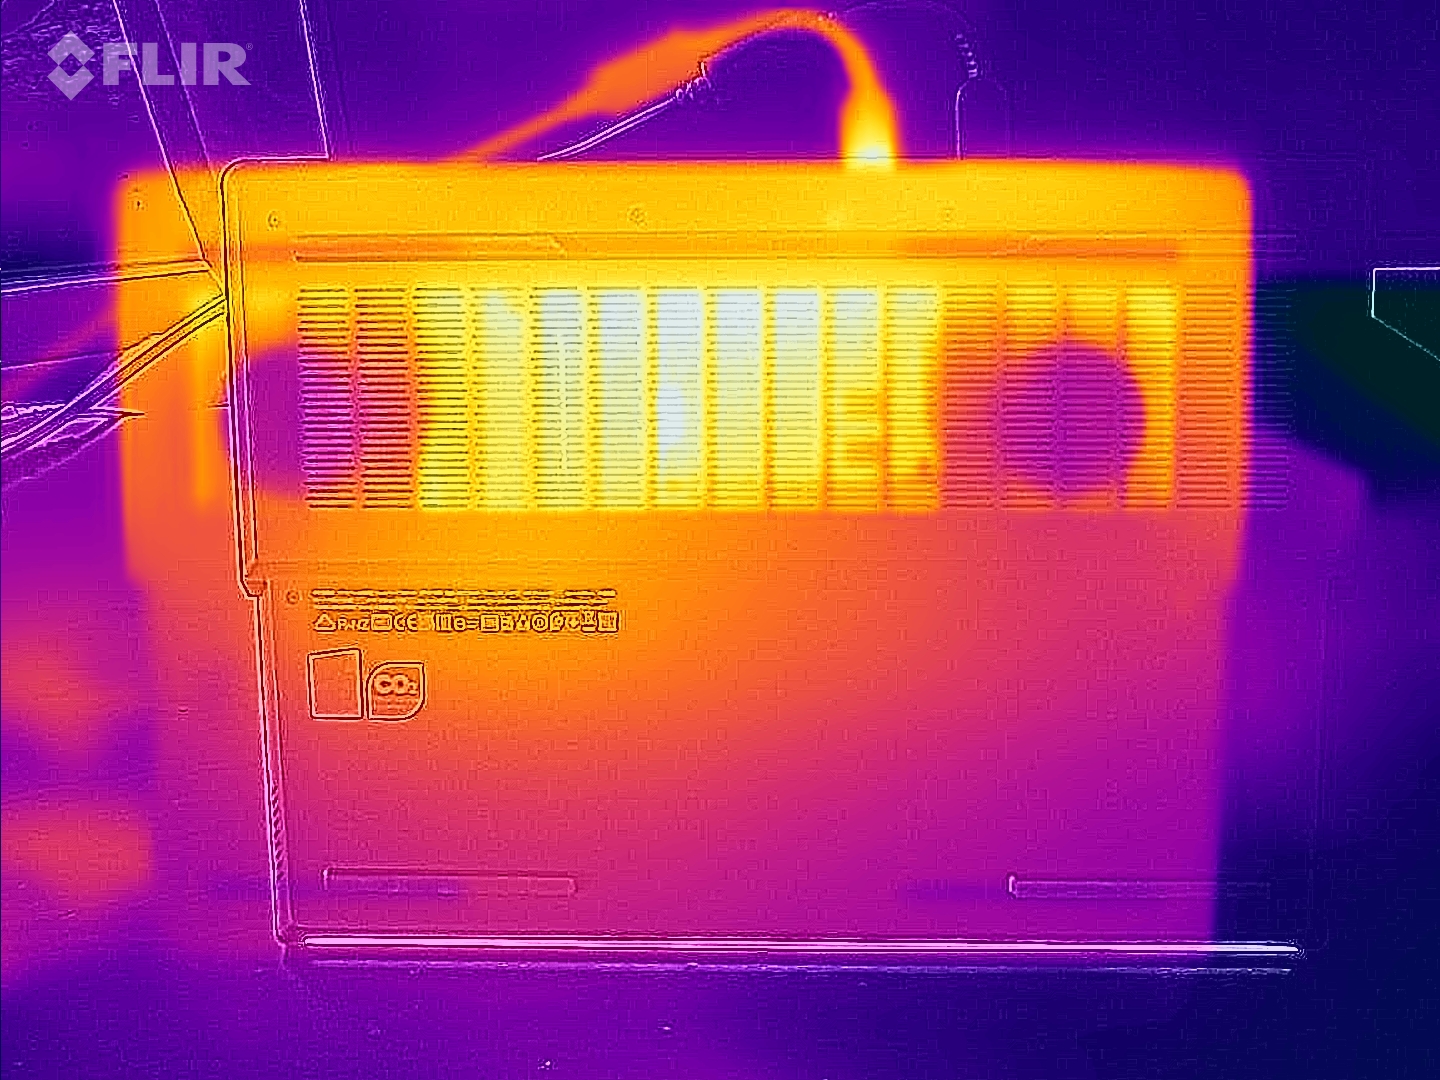
Temparatura
Ao enfatizar com o The Witcher 3 a 1080p Ultra, a parte inferior do Legion Pro 7 cruza os 50 °C em alguns lugares, o que significa que isto não é adequado para jogos na volta. No inativo, a parte superior aquece até 40 °C, o que é relativamente alto.
Mesmo quando se trata de emissões de calor, o Razer Blade 16 parece estar funcionando melhor do que o Legion Pro 7.
(-) A temperatura máxima no lado superior é 48 °C / 118 F, em comparação com a média de 40.4 °C / 105 F , variando de 21.2 a 68.8 °C para a classe Gaming.
(-) A parte inferior aquece até um máximo de 49 °C / 120 F, em comparação com a média de 43.2 °C / 110 F
(±) Em uso inativo, a temperatura média para o lado superior é 32.7 °C / 91 F, em comparação com a média do dispositivo de 33.9 °C / ### class_avg_f### F.
(-) Jogando The Witcher 3, a temperatura média para o lado superior é 43.3 °C / 110 F, em comparação com a média do dispositivo de 33.9 °C / ## #class_avg_f### F.
(-) Os apoios para as mãos e o touchpad podem ficar muito quentes ao toque, com um máximo de 42 °C / 107.6 F.
(-) A temperatura média da área do apoio para as mãos de dispositivos semelhantes foi 28.8 °C / 83.8 F (-13.2 °C / -23.8 F).
| Lenovo Legion Pro 7 16IRX8H i9-13900HX, GeForce RTX 4080 Laptop GPU | Razer Blade 16 Early 2023 i9-13950HX, GeForce RTX 4080 Laptop GPU | Lenovo Legion 7 16IAX7-82TD004SGE i9-12900HX, GeForce RTX 3080 Ti Laptop GPU | Lenovo Legion 7 16ACHg6 R9 5900HX, GeForce RTX 3080 Laptop GPU | Lenovo Legion 7 16ARHA7 R9 6900HX, Radeon RX 6850M XT | |
|---|---|---|---|---|---|
| Heat | 16% | -5% | -5% | 13% | |
| Maximum Upper Side * (°C) | 48 | 40 17% | 44.4 7% | 51 -6% | 37.2 22% |
| Maximum Bottom * (°C) | 49 | 37.6 23% | 60.8 -24% | 52 -6% | 43 12% |
| Idle Upper Side * (°C) | 40 | 32.4 19% | 33.8 15% | 37 7% | 34 15% |
| Idle Bottom * (°C) | 33 | 31.4 5% | 38.8 -18% | 38 -15% | 32.8 1% |
* ... menor é melhor
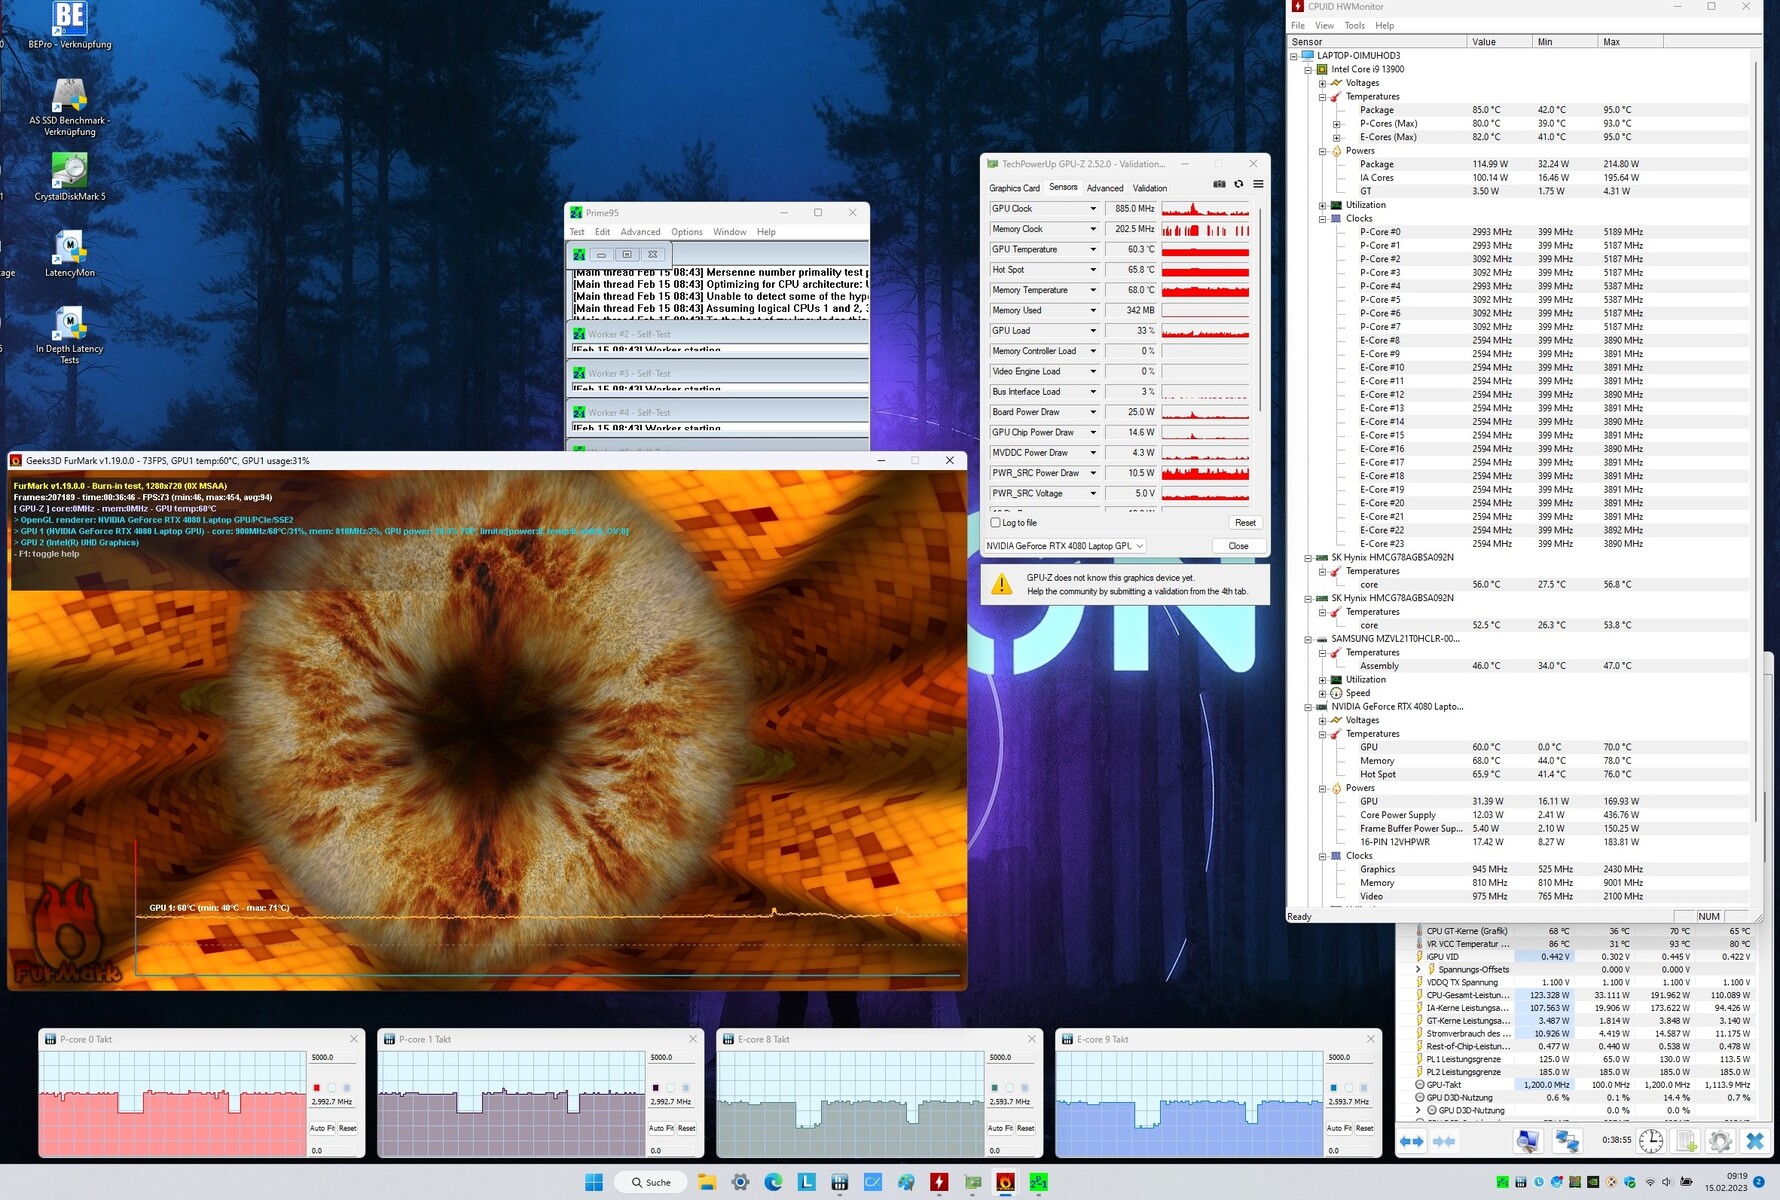
Teste de estresse
Um teste de estresse combinado com FurMark e Prime95 não é muito útil, pois a GPU mostra estrangulamento. Durante o teste de estresse Witcher 3, a CPU e a GPU aquecem até uma média de 75 °C, o que não é problemático.
Oradores
Um destaque do Legion Pro 7 é a colaboração da Lenovo com Harman que resulta em alto-falantes de bom som. Nossa análise de áudio não mostra nenhuma fraqueza gritante em nenhuma faixa de freqüência, o que é uma raridade nos cadernos - a lâmina 16 tem que se contentar com graves mais fracos, por exemplo.
Alto-falantes externos ou um fone de ouvido não são absolutamente necessários, dado o alto nível máximo de volume de 82 dB(A).
Lenovo Legion Pro 7 16IRX8H análise de áudio
(+) | os alto-falantes podem tocar relativamente alto (###valor### dB)
Graves 100 - 315Hz
(±) | graves reduzidos - em média 8.9% menor que a mediana
(+) | o baixo é linear (6.4% delta para a frequência anterior)
Médios 400 - 2.000 Hz
(+) | médios equilibrados - apenas 2.8% longe da mediana
(+) | médios são lineares (4.2% delta para frequência anterior)
Altos 2 - 16 kHz
(+) | agudos equilibrados - apenas 2.5% longe da mediana
(+) | os máximos são lineares (6% delta da frequência anterior)
Geral 100 - 16.000 Hz
(+) | o som geral é linear (9.4% diferença em relação à mediana)
Comparado com a mesma classe
» 3% de todos os dispositivos testados nesta classe foram melhores, 2% semelhantes, 95% piores
» O melhor teve um delta de 6%, a média foi 18%, o pior foi 132%
Comparado com todos os dispositivos testados
» 3% de todos os dispositivos testados foram melhores, 1% semelhantes, 96% piores
» O melhor teve um delta de 4%, a média foi 24%, o pior foi 134%
Razer Blade 16 Early 2023 análise de áudio
(+) | os alto-falantes podem tocar relativamente alto (###valor### dB)
Graves 100 - 315Hz
(-) | quase nenhum baixo - em média 16.4% menor que a mediana
(±) | a linearidade dos graves é média (10.8% delta para a frequência anterior)
Médios 400 - 2.000 Hz
(+) | médios equilibrados - apenas 2.5% longe da mediana
(+) | médios são lineares (2.4% delta para frequência anterior)
Altos 2 - 16 kHz
(+) | agudos equilibrados - apenas 4.9% longe da mediana
(±) | a linearidade dos máximos é média (7.9% delta para frequência anterior)
Geral 100 - 16.000 Hz
(+) | o som geral é linear (12.6% diferença em relação à mediana)
Comparado com a mesma classe
» 16% de todos os dispositivos testados nesta classe foram melhores, 3% semelhantes, 81% piores
» O melhor teve um delta de 6%, a média foi 18%, o pior foi 132%
Comparado com todos os dispositivos testados
» 11% de todos os dispositivos testados foram melhores, 2% semelhantes, 86% piores
» O melhor teve um delta de 4%, a média foi 24%, o pior foi 134%
Gestão de energia: Alto consumo, mesmo em modo inativo
Consumo de energia
Como é o caso dos portáteis de jogos de alta qualidade, o Legion Pro 7 tem uma alta exigência de potência, apesar da comutação gráfica mesmo em modo ocioso. Com consumo de 18 a 32 W (incluindo picos de carga curtos) em modo inativo, o Legion Pro 7 está quase 20% acima da média da classe.
Registramos um consumo de 130 W da parede sob carga média (3DMark06) e 320 W sob tensão máxima. Durante os jogos, pode-se esperar que o consumo atinja cerca de 260 W, que é um pouco mais que o da lâmina 16 (242 W).
| desligado | |
| Ocioso | |
| Carga |
|
Key:
min: | |
| Lenovo Legion Pro 7 16IRX8H i9-13900HX, GeForce RTX 4080 Laptop GPU | Razer Blade 16 Early 2023 i9-13950HX, GeForce RTX 4080 Laptop GPU | Lenovo Legion 7 16IAX7-82TD004SGE i9-12900HX, GeForce RTX 3080 Ti Laptop GPU | Lenovo Legion 7 16ACHg6 R9 5900HX, GeForce RTX 3080 Laptop GPU | Lenovo Legion 7 16ARHA7 R9 6900HX, Radeon RX 6850M XT | Média da turma Gaming | |
|---|---|---|---|---|---|---|
| Power Consumption | -1% | 1% | -14% | 21% | 22% | |
| Idle Minimum * (Watt) | 18 | 15.2 16% | 19.2 -7% | 31 -72% | 9.9 45% | 13.3 ? 26% |
| Idle Average * (Watt) | 24 | 22.8 5% | 25.1 -5% | 33 -38% | 22 8% | 19 ? 21% |
| Idle Maximum * (Watt) | 32 | 49.8 -56% | 27.1 15% | 46 -44% | 23.1 28% | 24.5 ? 23% |
| Load Average * (Watt) | 130 | 121.2 7% | 132 -2% | 110 15% | 94.4 27% | 108.1 ? 17% |
| Witcher 3 ultra * (Watt) | 260 | 242 7% | 253 3% | 180 31% | 249 4% | |
| Load Maximum * (Watt) | 320 | 273.7 14% | 308.9 3% | 235 27% | 276 14% | 254 ? 21% |
* ... menor é melhor
Power consumption: The Witcher 3 / Stress test
Power consumption: External Monitor
Duração da bateria
A Lenovo equipa o Legion Pro 7 com uma potente bateria de 99 WHr, que só pode ser um pouco útil devido ao gerenciamento subótimo de energia. Até 6,5 horas de tempo de funcionamento é possível em modo inativo, sem nenhuma outra tarefa em execução e com o mínimo de brilho. Este é um resultado modesto em comparação com as 9,5 horas do Blade 16.
No uso diário, como a navegação pela Internet sobre Wi-Fi a uma luminosidade reduzida de 150 lêndeas, podemos conseguir 5 horas de tempo de funcionamento.
| Lenovo Legion Pro 7 16IRX8H i9-13900HX, GeForce RTX 4080 Laptop GPU, 99.9 Wh | Razer Blade 16 Early 2023 i9-13950HX, GeForce RTX 4080 Laptop GPU, 95.2 Wh | Lenovo Legion 7 16IAX7-82TD004SGE i9-12900HX, GeForce RTX 3080 Ti Laptop GPU, 99 Wh | Lenovo Legion 7 16ACHg6 R9 5900HX, GeForce RTX 3080 Laptop GPU, 80 Wh | Lenovo Legion 7 16ARHA7 R9 6900HX, Radeon RX 6850M XT, 99 Wh | Média da turma Gaming | |
|---|---|---|---|---|---|---|
| Duração da bateria | 9% | -40% | 12% | 2% | 14% | |
| Reader / Idle (h) | 6.4 | 8.9 39% | 8.2 28% | 4.9 -23% | 8.71 ? 36% | |
| WiFi v1.3 (h) | 5.1 | 6.1 20% | 4.5 -12% | 6.8 33% | 7.3 43% | 7.01 ? 37% |
| Load (h) | 2.1 | 1.4 -33% | 0.7 -67% | 1.6 -24% | 1.8 -14% | 1.47 ? -30% |
| H.264 (h) | 5.1 | 6.8 | 8.26 ? | |||
| Witcher 3 ultra (h) | 0.9 |
Pro
Contra
Veredicto: Uma impressionante potência de jogo
Jogadores apaixonados que querem jogar exigindo títulos modernos com o máximo de detalhes e não se importam de gastar o moolah encontrarão a Lenovo Legion 7 Pro 16IRX8H para ser a escolha certa.
A combinação de um Core i9-13900HX e GeForce RTX 4080 oferece um nível de desempenho impressionante que pode facilmente render 40 ou até 60 fps na maioria dos jogos modernos a 4K Ultra
O display 16:10 QHD 240 Hz, brilhante, nítido e de cores precisas, proporciona uma experiência de visualização imersiva. O hardware é alojado em um chassi elegante que se sente premium e tem uma boa pontuação em termos de acabamento e estabilidade. Outros aspectos, como qualidade sonora, dispositivos de entrada e conectividade também parecem ser quase perfeitos.
Entretanto, os potenciais compradores da Lenovo Legion 7 Pro 16IRX8H terão que ter em mente as altas emissões. O laptop de 16 polegadas fica bastante quente sob carga a menos que o perfil Silencioso seja selecionado - consideramos o perfil Equilibrado o melhor compromisso entre desempenho e emissões para uso diário. Também gostaríamos de ter visto tempos de funcionamento mais longos com a bateria de 99 WHr.
Um dos principais concorrentes para a nova Lenovo Legion 7 Pro é aLâmina Razer 16que, na verdade, é mais silencioso e mais frio, oferecendo níveis de desempenho semelhantes. Além disso, a lâmina 16 é um pouco mais ligeira e mais fina também em comparação.
Dito isto, a Lenovo Legion 7 Pro 16IRX8H impressiona em geral, e merece apropriadamente nossa classificação de "Muito Bom".
Preços e disponibilidade
A Lenovo testada Legion Pro 7 16IRX8H está disponível em campuspoint.depor 3.599 euros. (RRP: 3.999 EUROS).
Lenovo Legion Pro 7 16IRX8H
- 02/21/2023 v7 (old)
Florian Glaser
Transparência
A seleção dos dispositivos a serem analisados é feita pela nossa equipe editorial. A amostra de teste foi fornecida ao autor como empréstimo pelo fabricante ou varejista para fins desta revisão. O credor não teve influência nesta revisão, nem o fabricante recebeu uma cópia desta revisão antes da publicação. Não houve obrigação de publicar esta revisão. Como empresa de mídia independente, a Notebookcheck não está sujeita à autoridade de fabricantes, varejistas ou editores.
É assim que o Notebookcheck está testando
Todos os anos, o Notebookcheck analisa de forma independente centenas de laptops e smartphones usando procedimentos padronizados para garantir que todos os resultados sejam comparáveis. Desenvolvemos continuamente nossos métodos de teste há cerca de 20 anos e definimos padrões da indústria no processo. Em nossos laboratórios de teste, equipamentos de medição de alta qualidade são utilizados por técnicos e editores experientes. Esses testes envolvem um processo de validação em vários estágios. Nosso complexo sistema de classificação é baseado em centenas de medições e benchmarks bem fundamentados, o que mantém a objetividade.Price comparison

