Análise do laptop MSI Vector 16 HX: Desempenho de Titã sem o preço de Titã

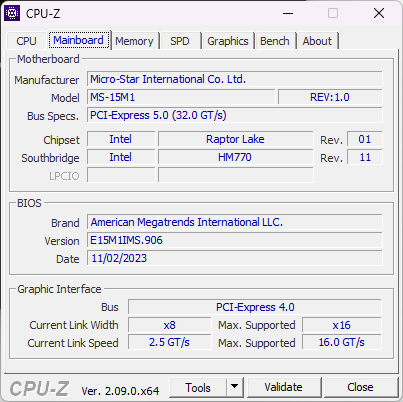
Não deve ser confundido com o falecido Maingear Vector, o MSI Vector 16 HX sucede o GP68 do ano passado, introduzindo novas opções de CPU Intel Raptor Lake-HX de 14ª geração e um design de chassi revisado em relação ao antigo GP66 de 15,6 polegadas. O modelo fez sua estreia no início deste ano na CES 2024, juntamente com uma série de outros anúncios, como o MSI Claw e o Titan 18 HX.
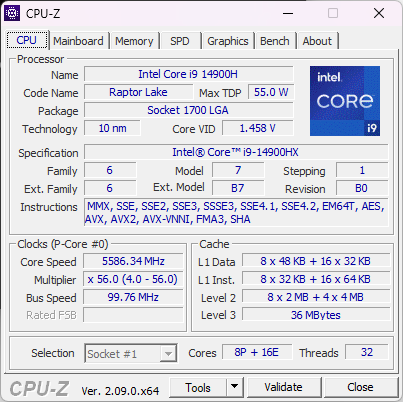
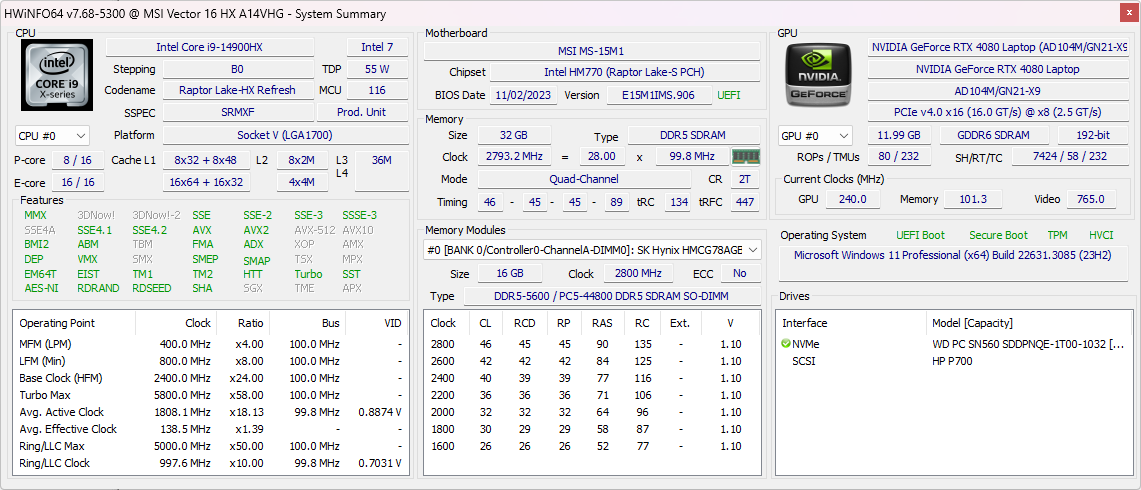
Nossa unidade de análise é uma configuração de ponta com CPU Core i9-14900HX, GPU RTX 4080 de 175
GeForce e tela IPS de 1600p 240 Hz por aproximadamente US$ 2.700 no varejo. Outras configurações podem ser encontradas com gráficos RTX 4090, 4070 ou 4060 e uma tela de 1200p 144 Hz, mas todas as opções no momento incluem a mesma CPU Core i9-14900HX.As alternativas ao Vector 16 HX incluem outros notebooks para jogos de 16 polegadas de médio a alto padrão, como o Lenovo Legion 5i 16,Asus TUF Gaming A16 , Alienware m16 R1ou HP Omen 16.
Mais análises da MSI:
Possíveis concorrentes em comparação
Avaliação | Data | Modelo | Peso | Altura | Size | Resolução | Preço |
|---|---|---|---|---|---|---|---|
| 88 % v7 (old) | 02/2024 | MSI Vector 16 HX A14V i9-14900HX, GeForce RTX 4080 Laptop GPU | 2.7 kg | 28.55 mm | 16.00" | 2560x1600 | |
| 86.9 % v7 (old) | 03/2022 | MSI Vector GP66 12UGS i9-12900H, GeForce RTX 3070 Ti Laptop GPU | 2.3 kg | 23.4 mm | 15.60" | 1920x1080 | |
| 89.1 % v7 (old) | 02/2024 | Lenovo Legion 5 16IRX G9 i7-14650HX, GeForce RTX 4060 Laptop GPU | 2.4 kg | 25.2 mm | 16.00" | 2560x1600 | |
| 85.1 % v7 (old) | 09/2023 | HP Victus 16-r0077ng i7-13700H, GeForce RTX 4070 Laptop GPU | 2.4 kg | 24 mm | 16.10" | 1920x1080 | |
| 86.9 % v7 (old) | 06/2023 | Asus TUF Gaming A16 FA617XS R9 7940HS, Radeon RX 7600S | 2.2 kg | 22.1 mm | 16.00" | 1920x1200 | |
| 86.1 % v7 (old) | 10/2022 | Dell G16 7620 i7-12700H, GeForce RTX 3060 Laptop GPU | 2.6 kg | 26.9 mm | 16.00" | 2560x1600 |
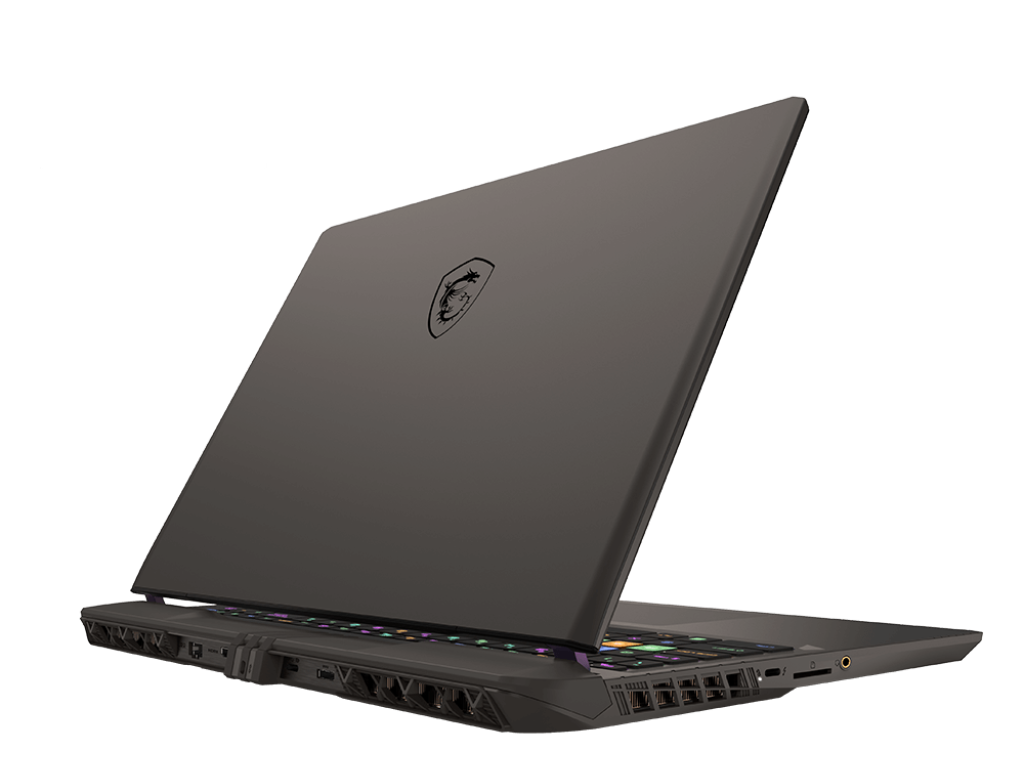
Case - Forte, mas nada de especial
Além da tampa externa de liga metálica, a maior parte da base é de plástico, proporcionando uma experiência menos luxuosa em comparação com o Titan HX, que é mais caro. A série Vector não deve ser a melhor da linha, mas esperávamos um pouco mais, considerando o preço pedido de aproximadamente US$ 2.000. O deck do teclado e o painel inferior não têm o toque premium de alternativas como o Razer Blade 16 ou o Alienware m16 R1.
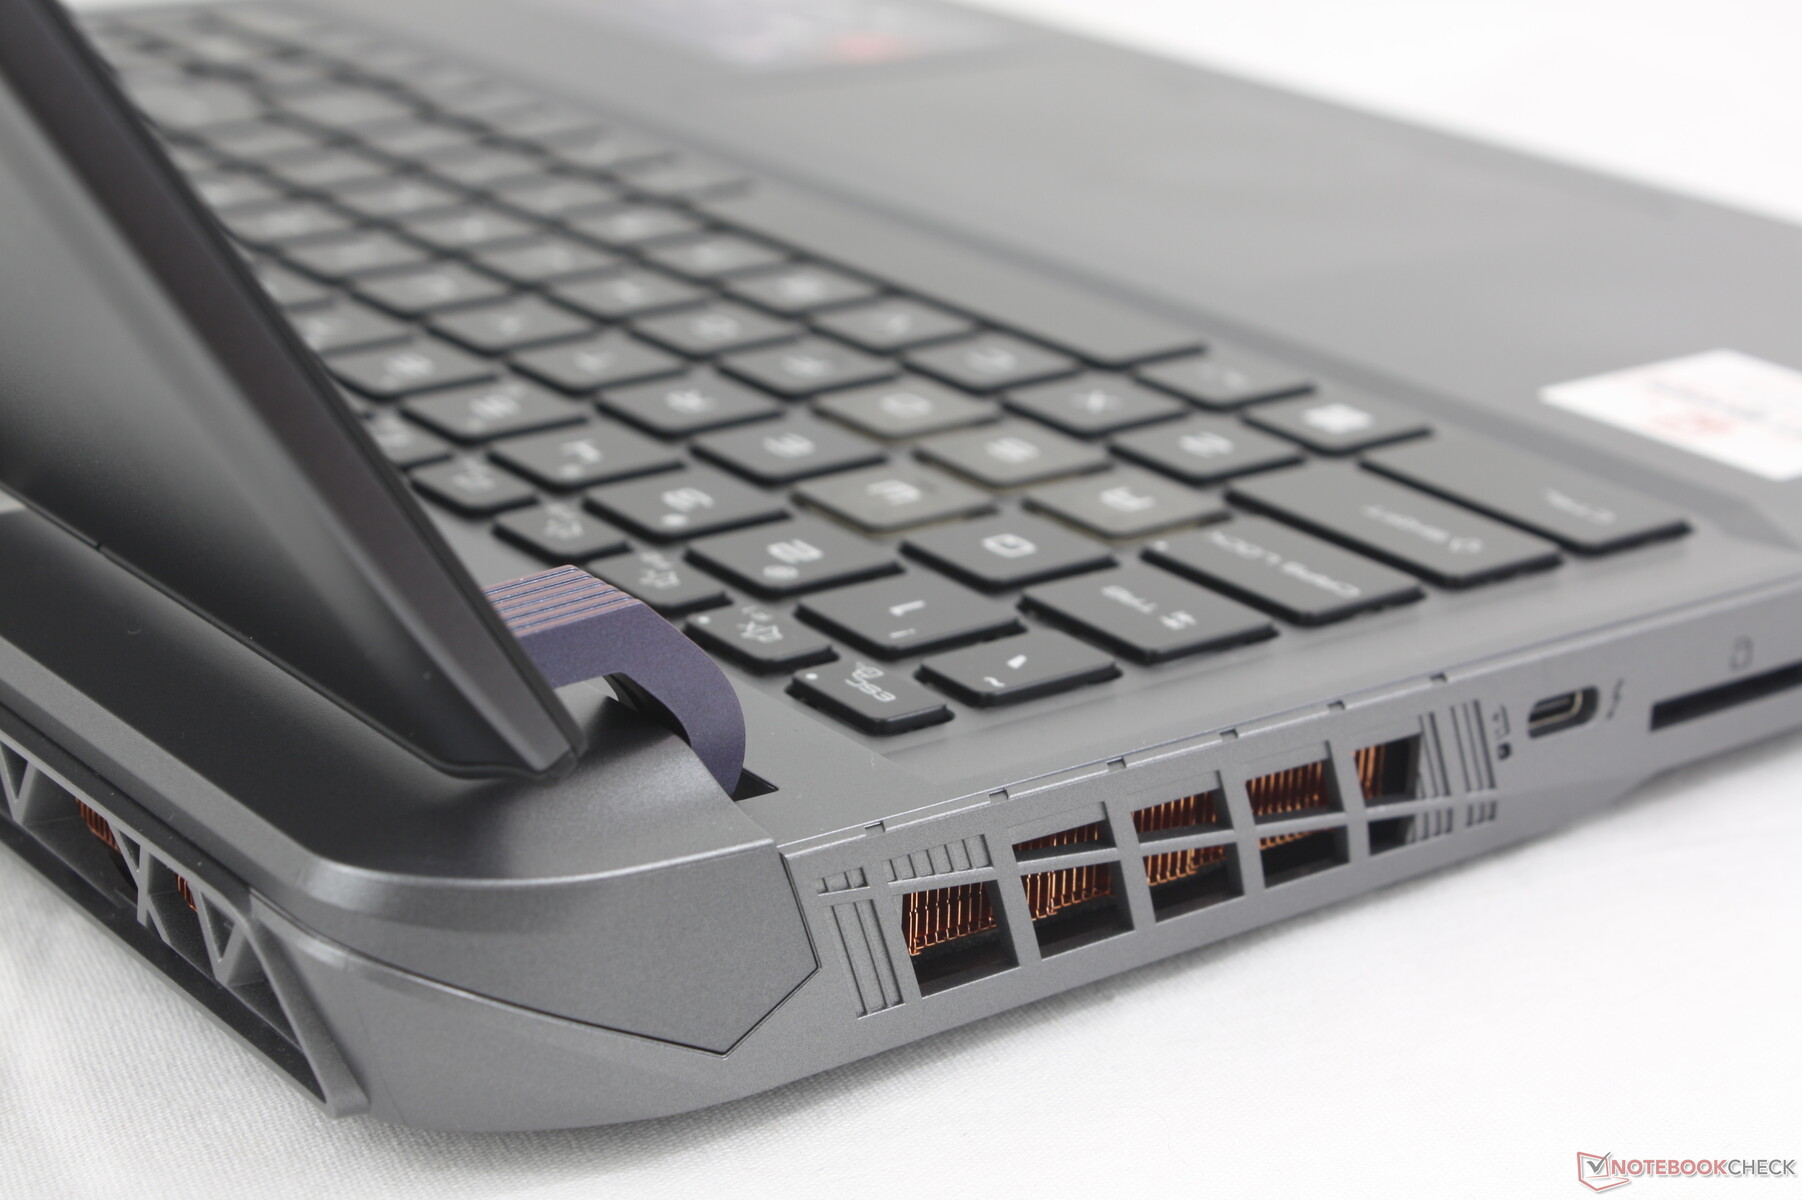
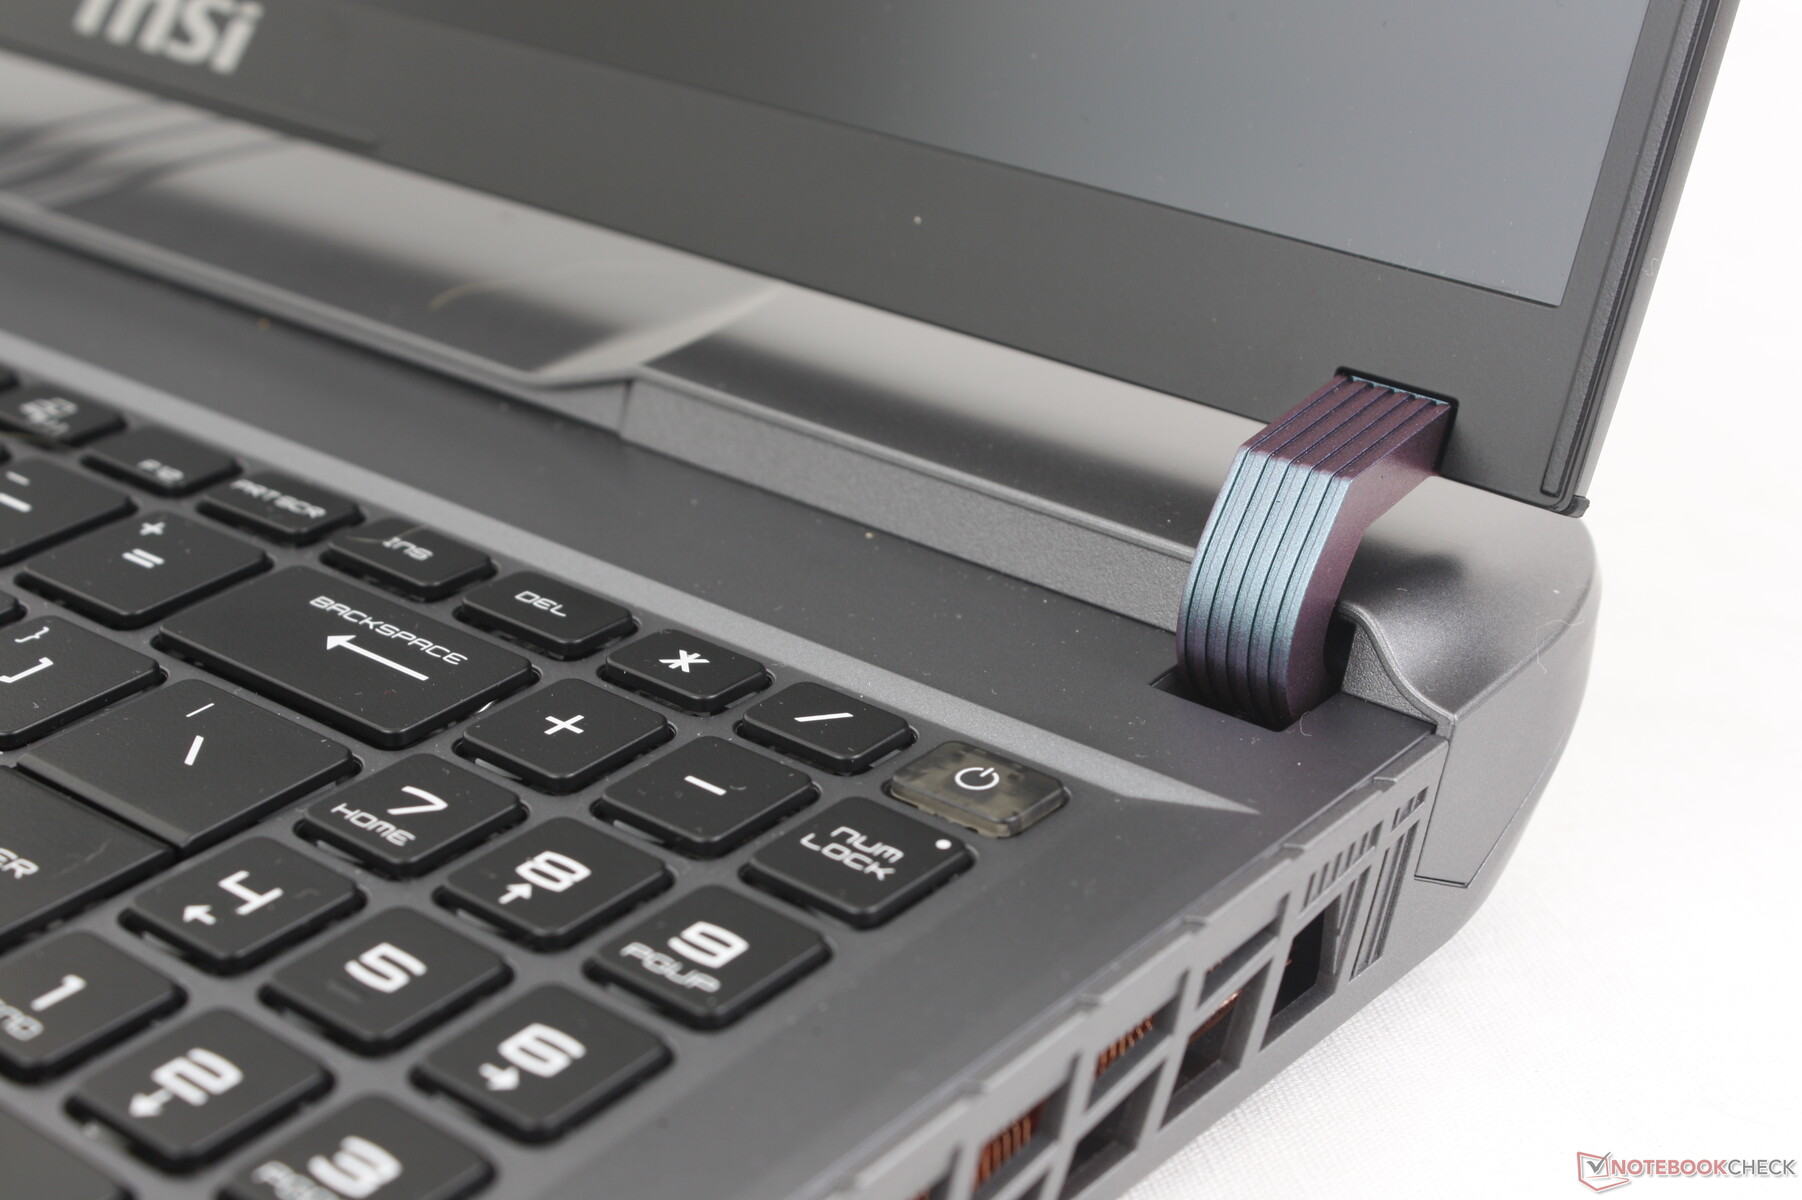
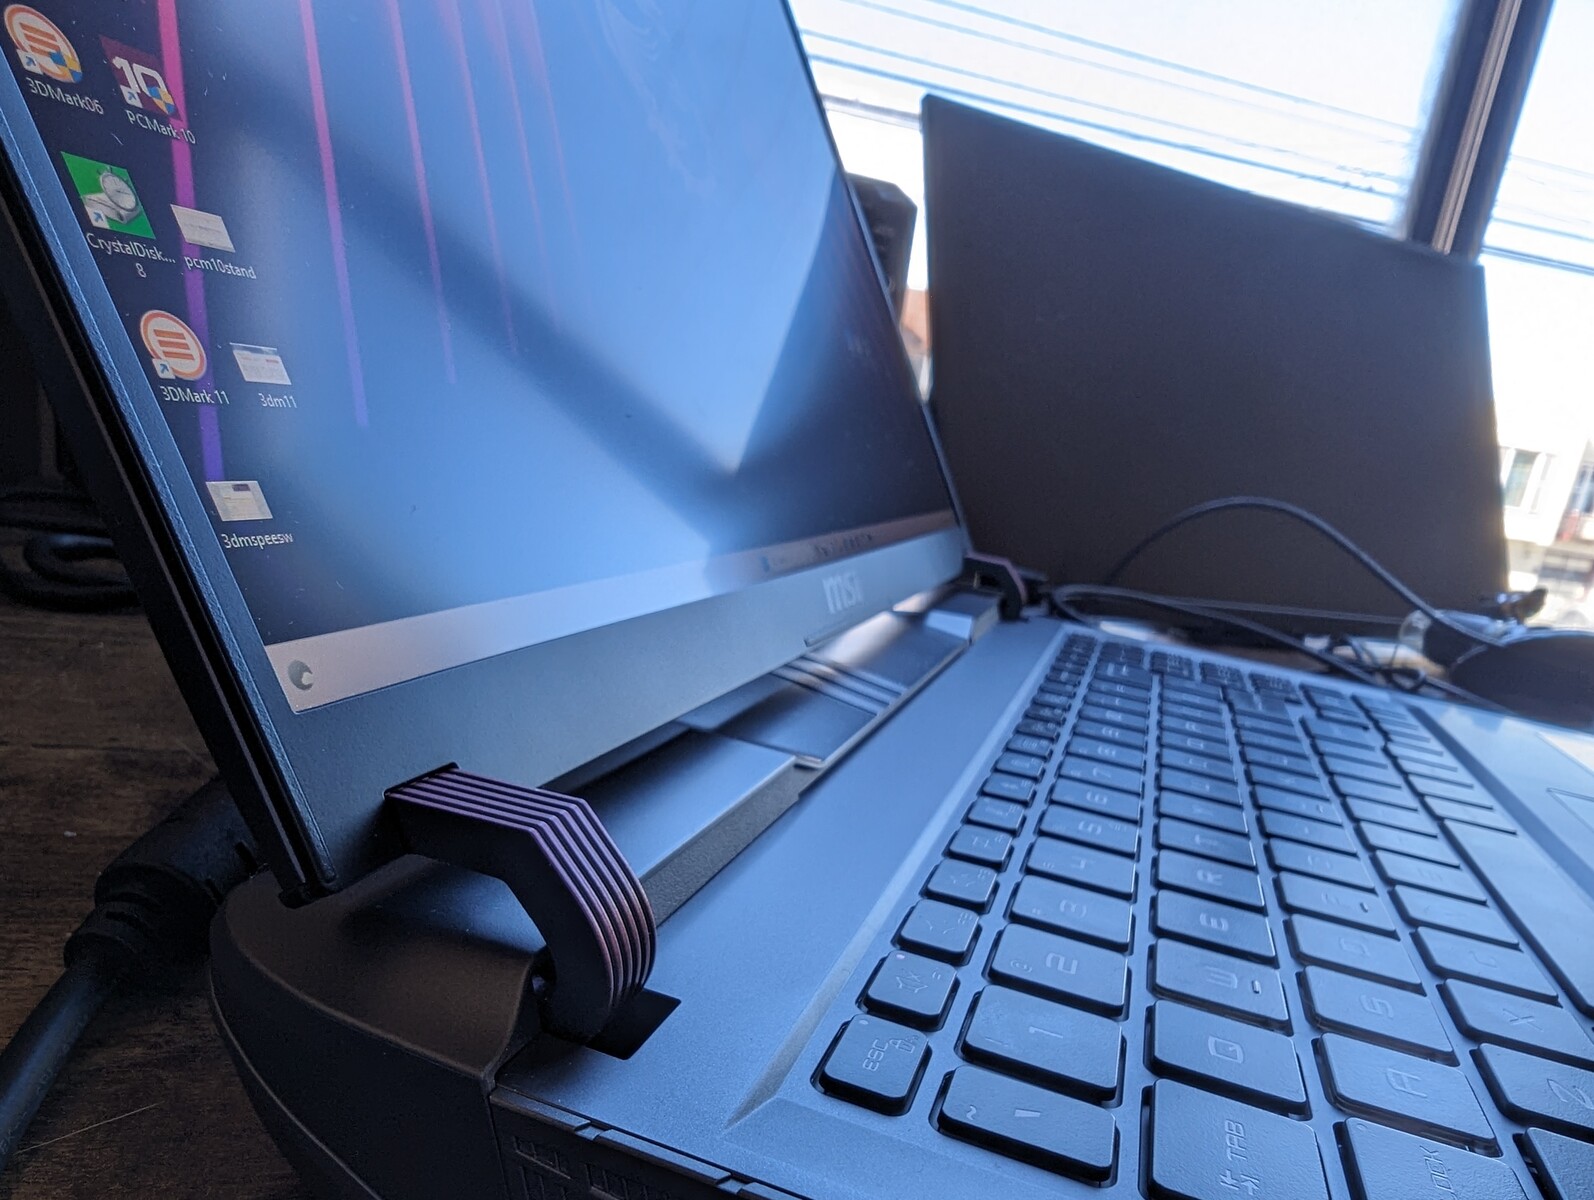
Felizmente, a rigidez do chassi é excelente de cima a baixo, inclusive na tampa, onde tende a ser visivelmente mais fraca em outros notebooks. As dobradiças redesenhadas, em particular, agora são muito maiores e mais firmes do que antes, lembrando as dobradiças do Asus Strix Scar 17. Entretanto, sua curvatura limita o ângulo máximo de abertura da tela a apenas 130 graus.
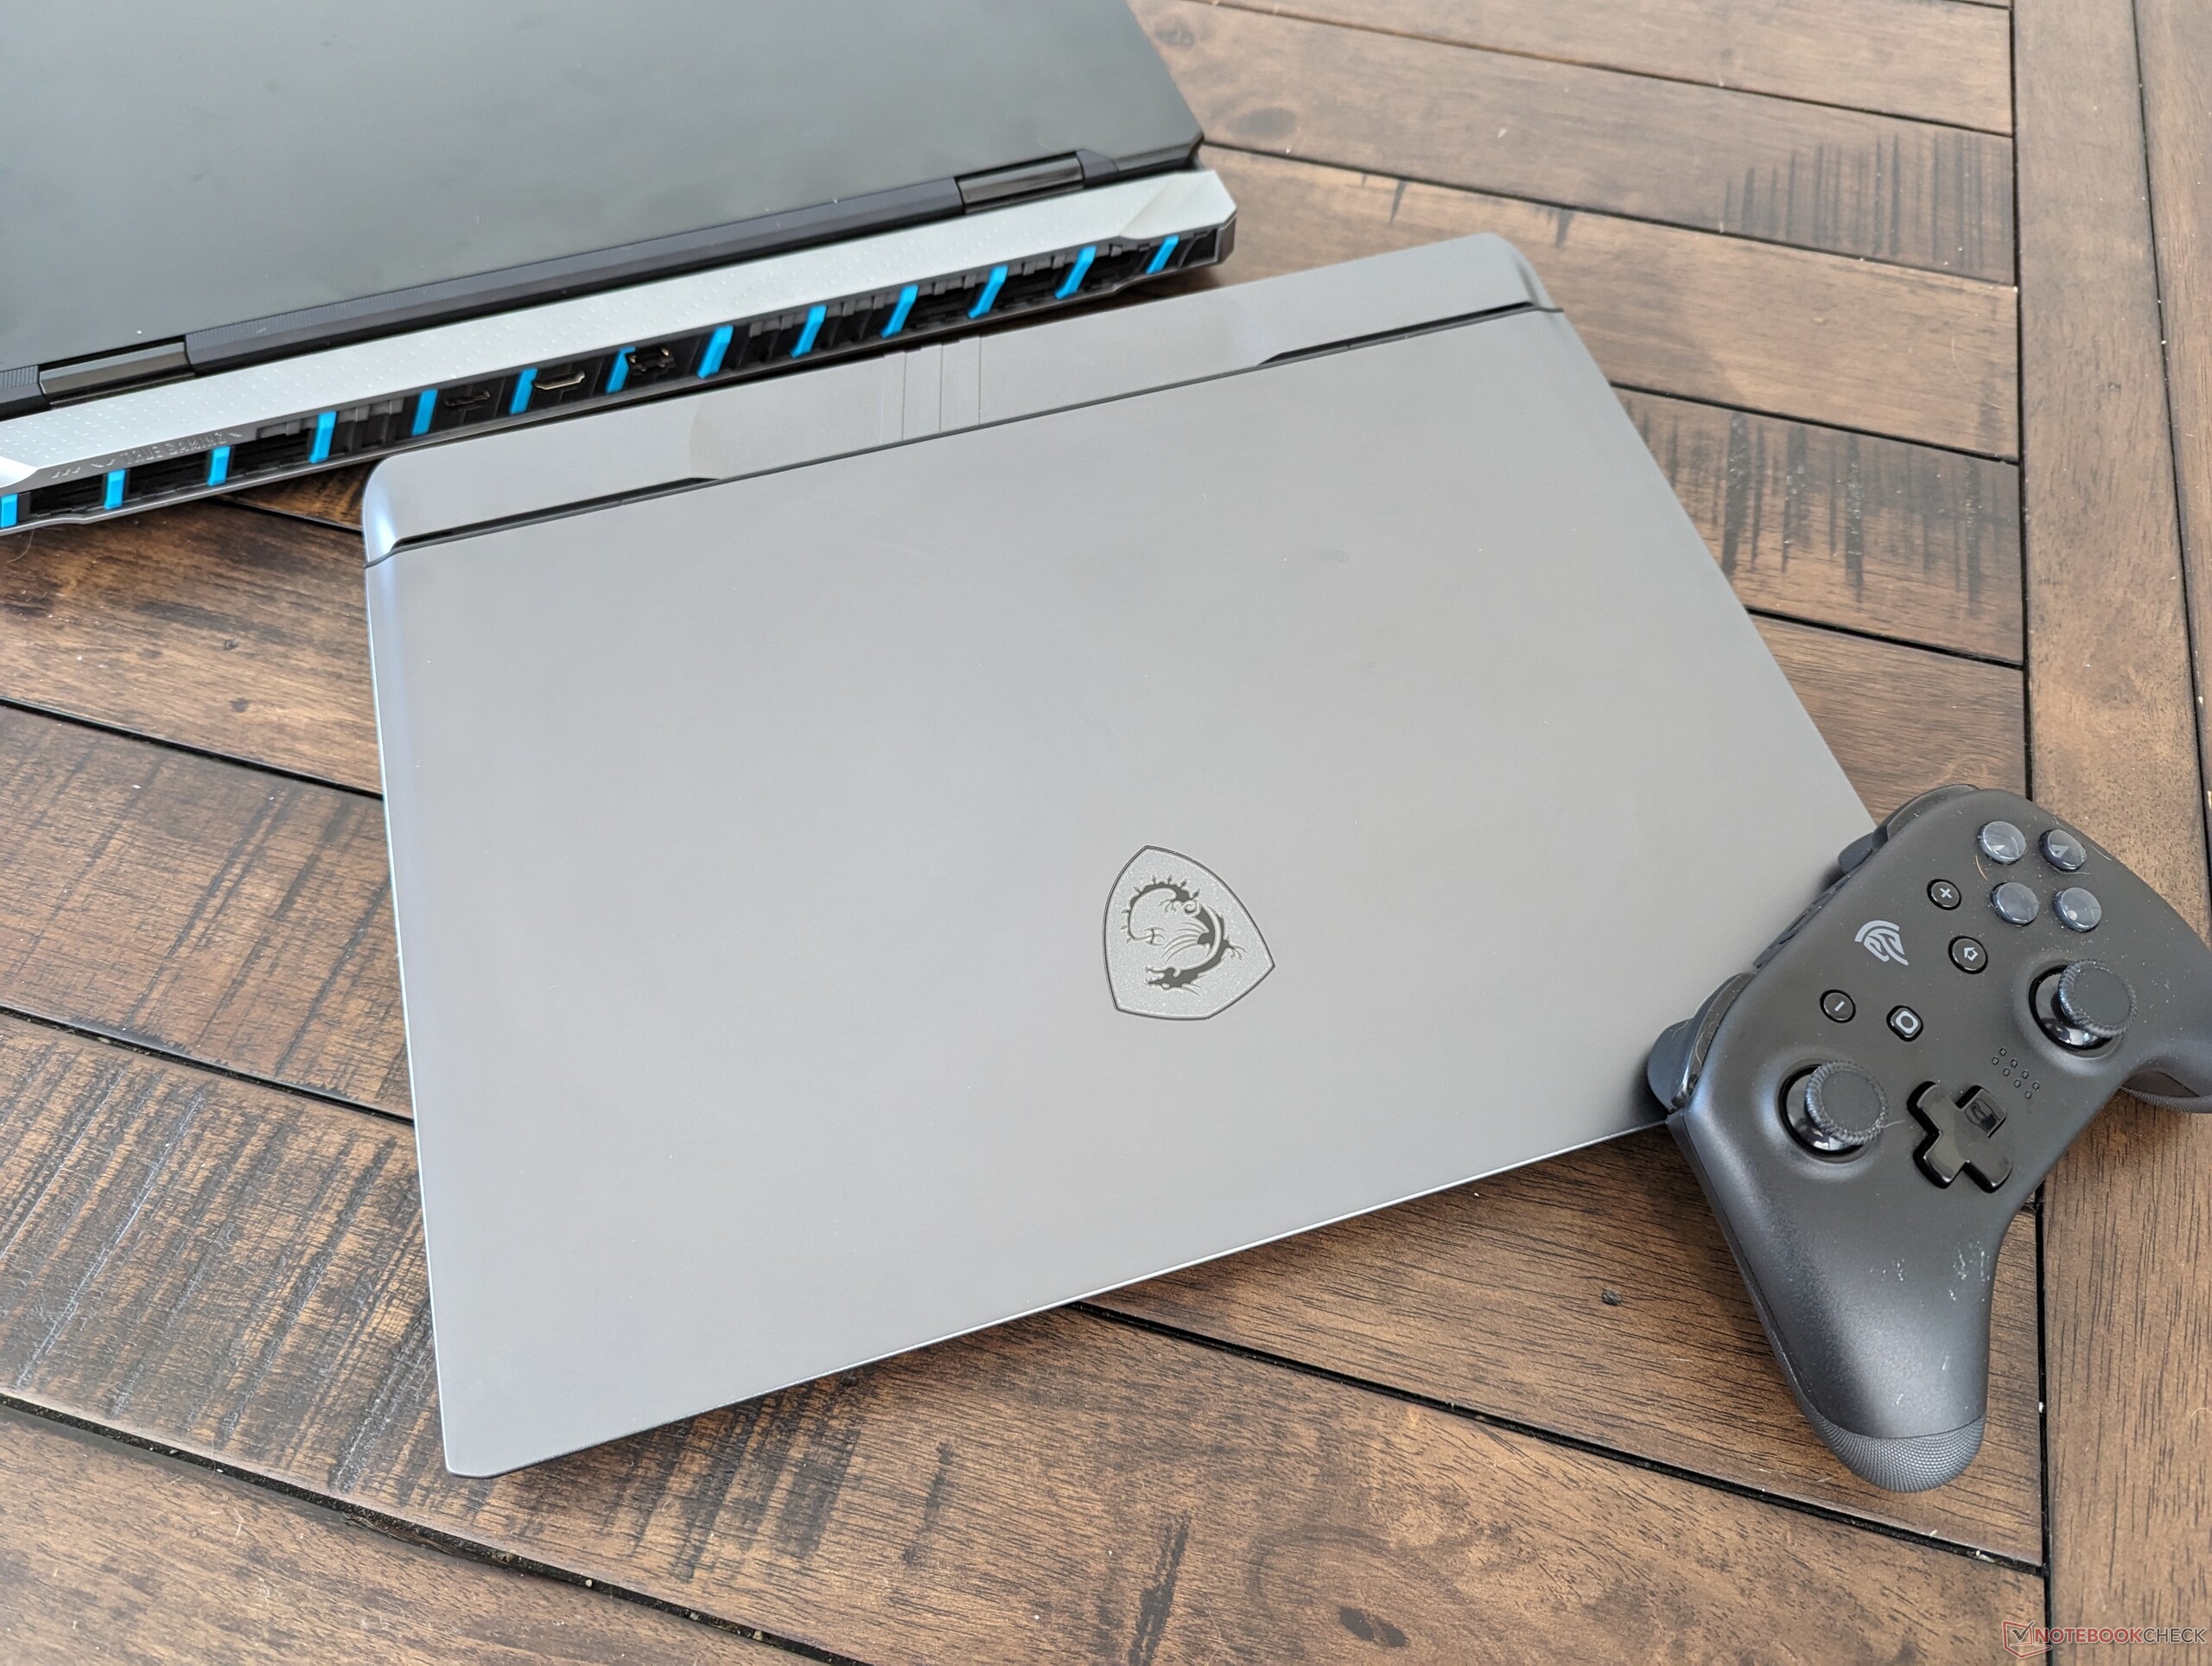
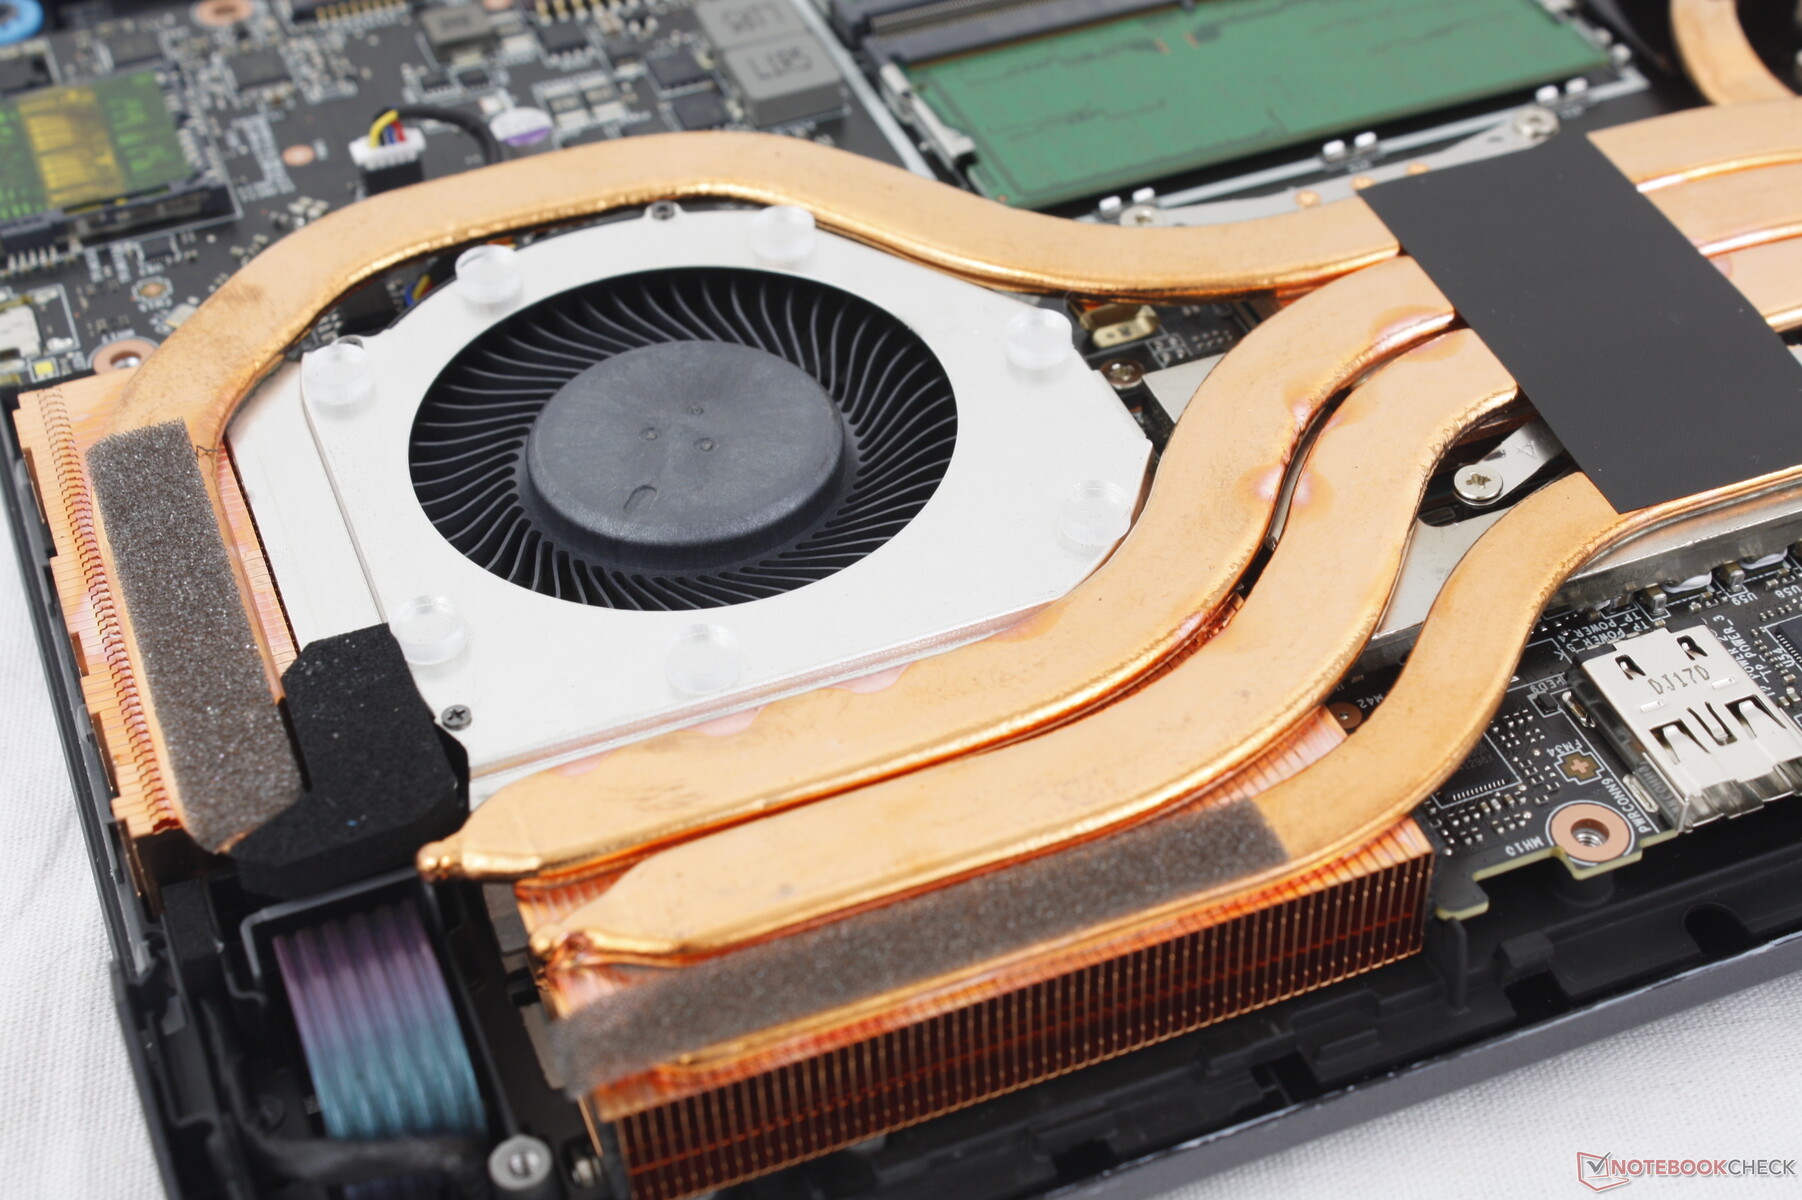
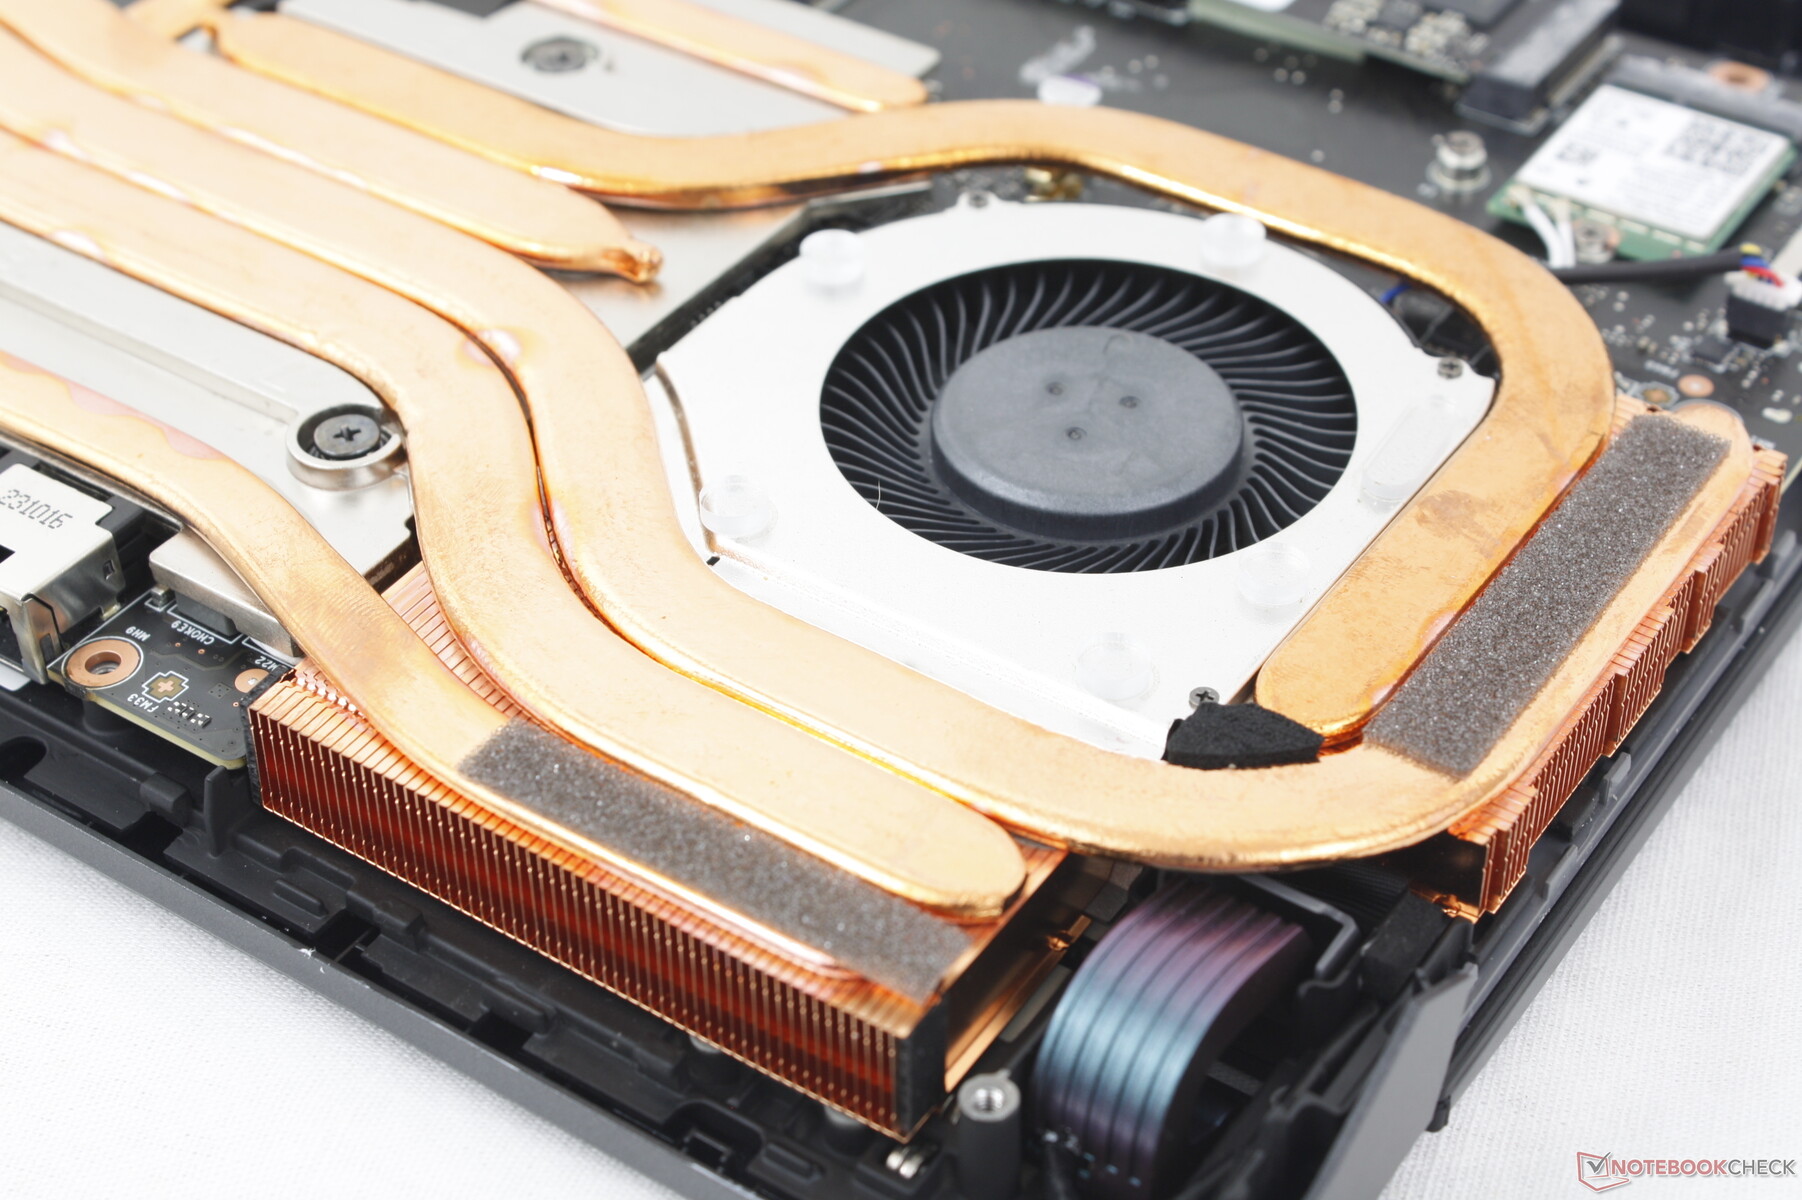
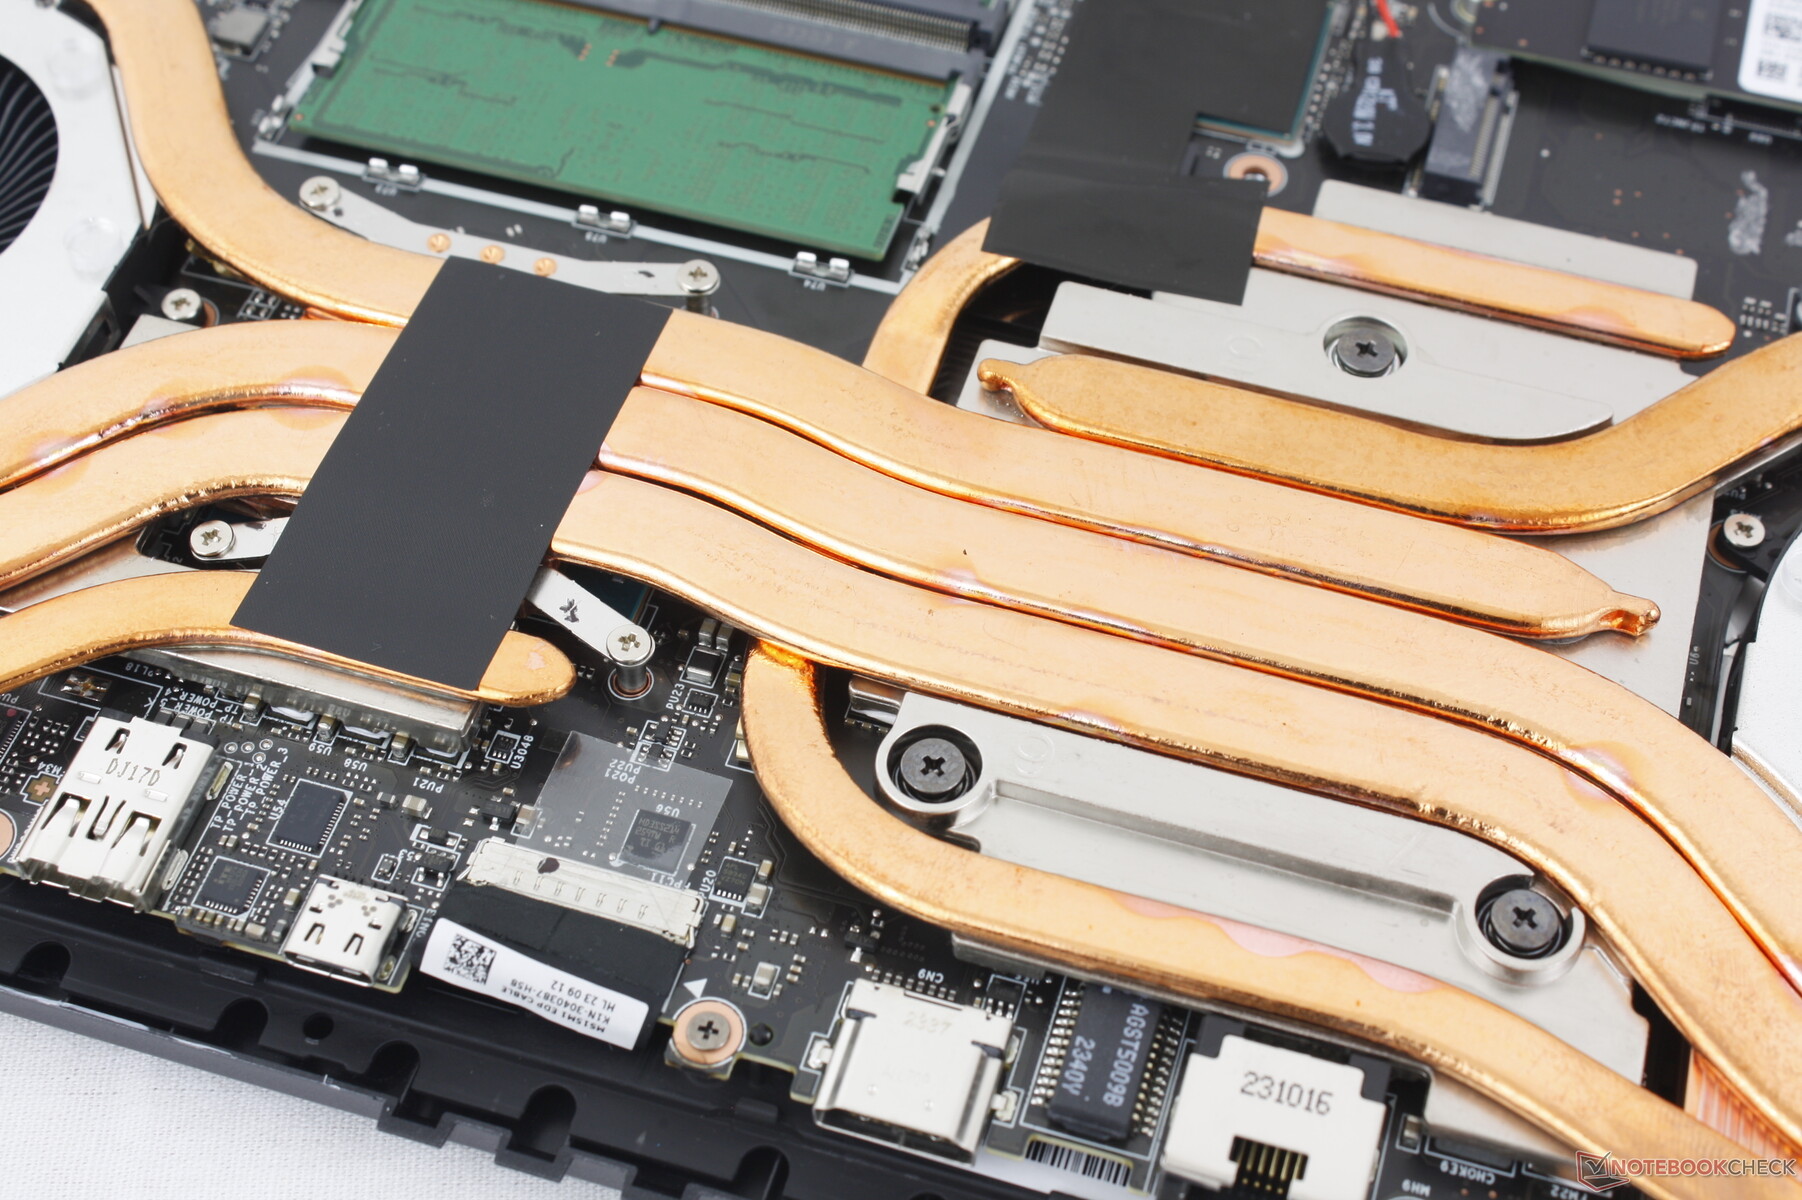
O Vector 16 HX é um laptop grande e não há como evitar isso. Sua ambiciosa meta de 175 W TGP (ou 240 W quando combinada com a CPU) exige uma solução de resfriamento mais robusta e um design de chassi maior do que a maioria dos outros modelos de 16 polegadas. O MSI é ainda maior e mais pesado do que o Dell G16 7620 do ano passado Dell G16 7620 do ano passado, que já era bastante grande. Felizmente, ele não é tão pesado quanto o Razer Blade 18 de 18 polegadas ou o Asus ROG Strix Scar 18de 18 polegadas, mas também não é exatamente portátil.
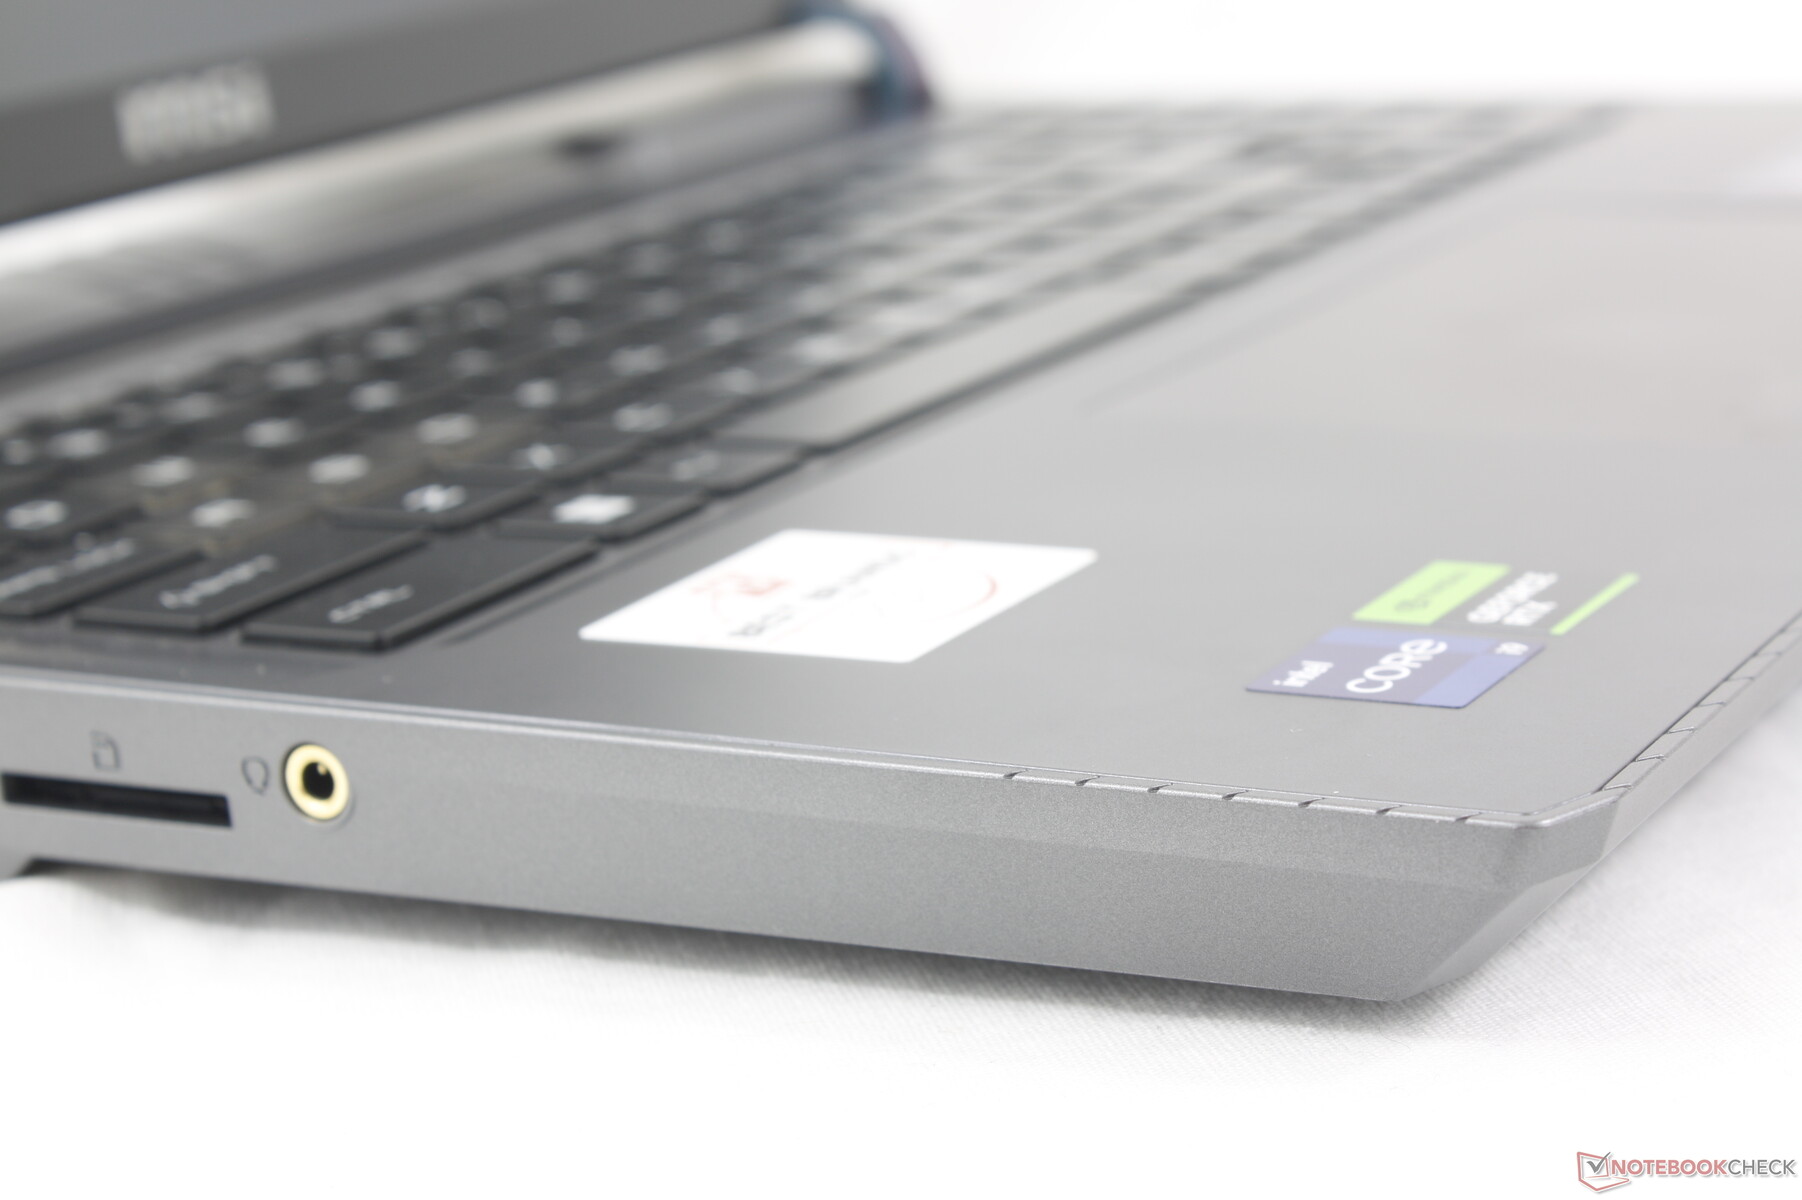
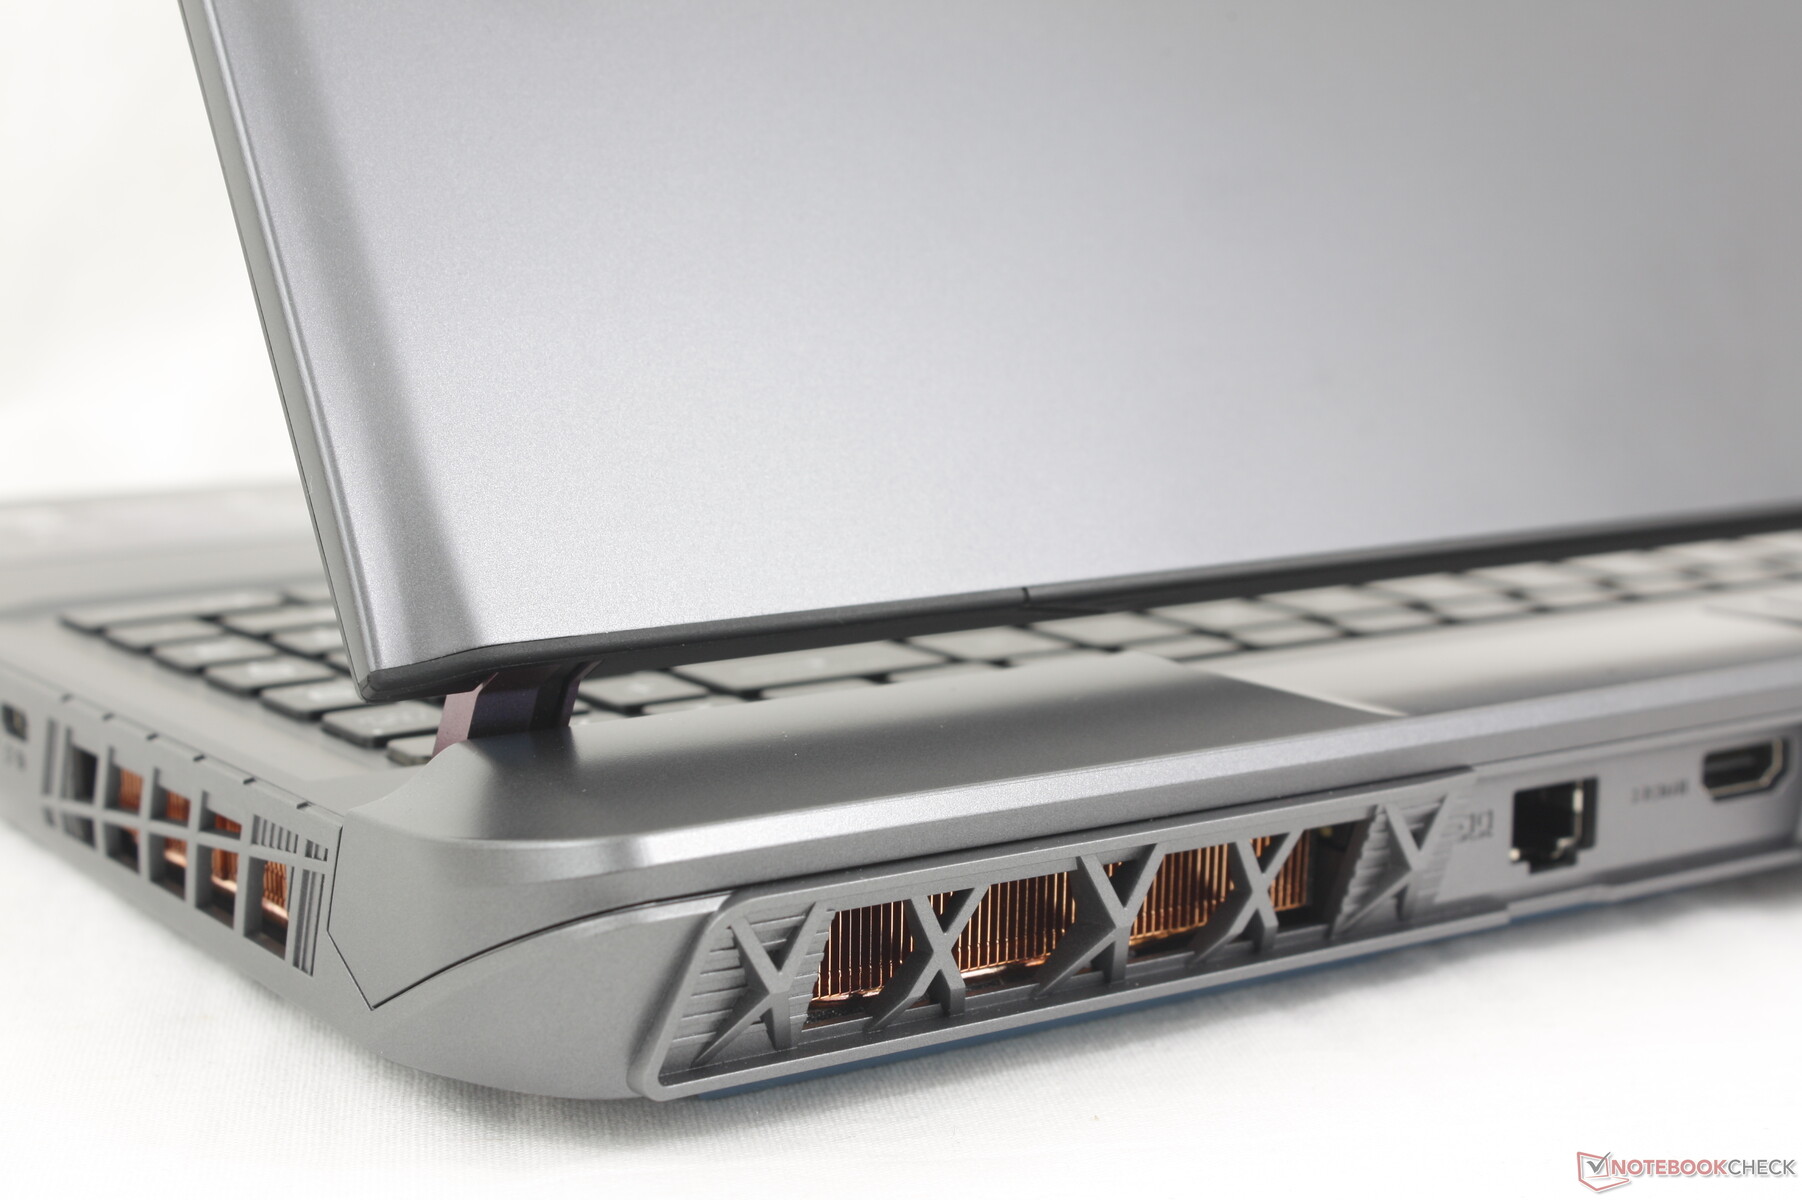
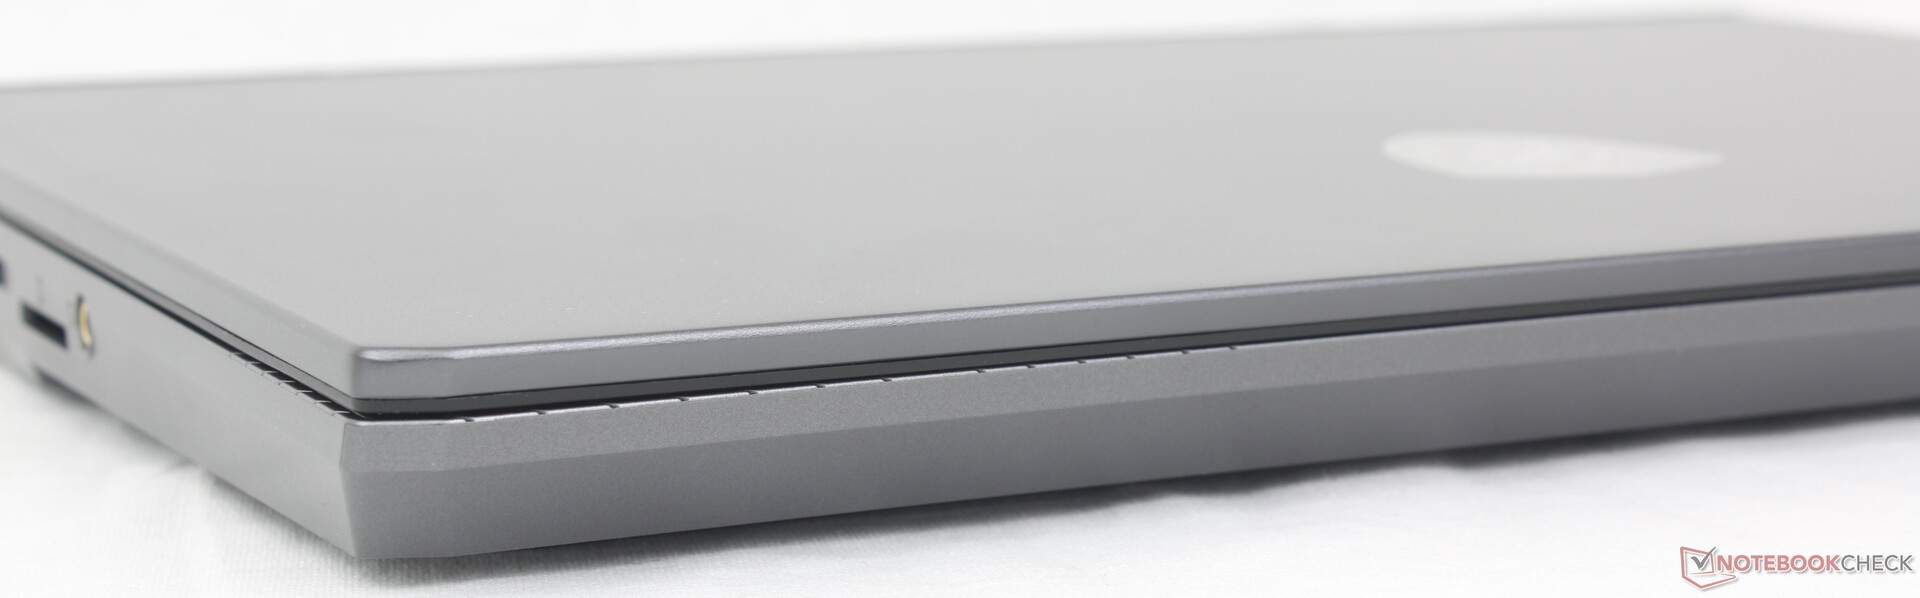
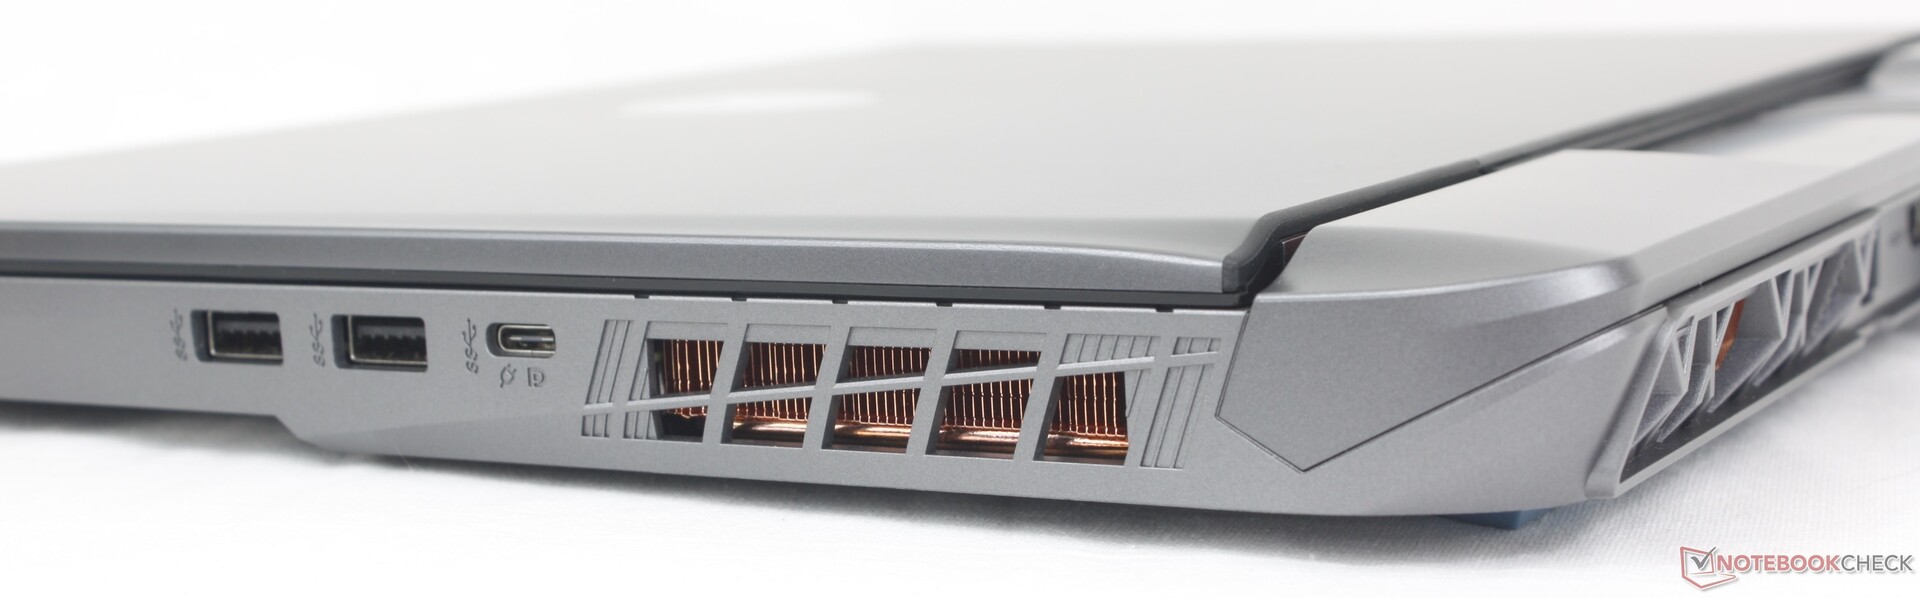
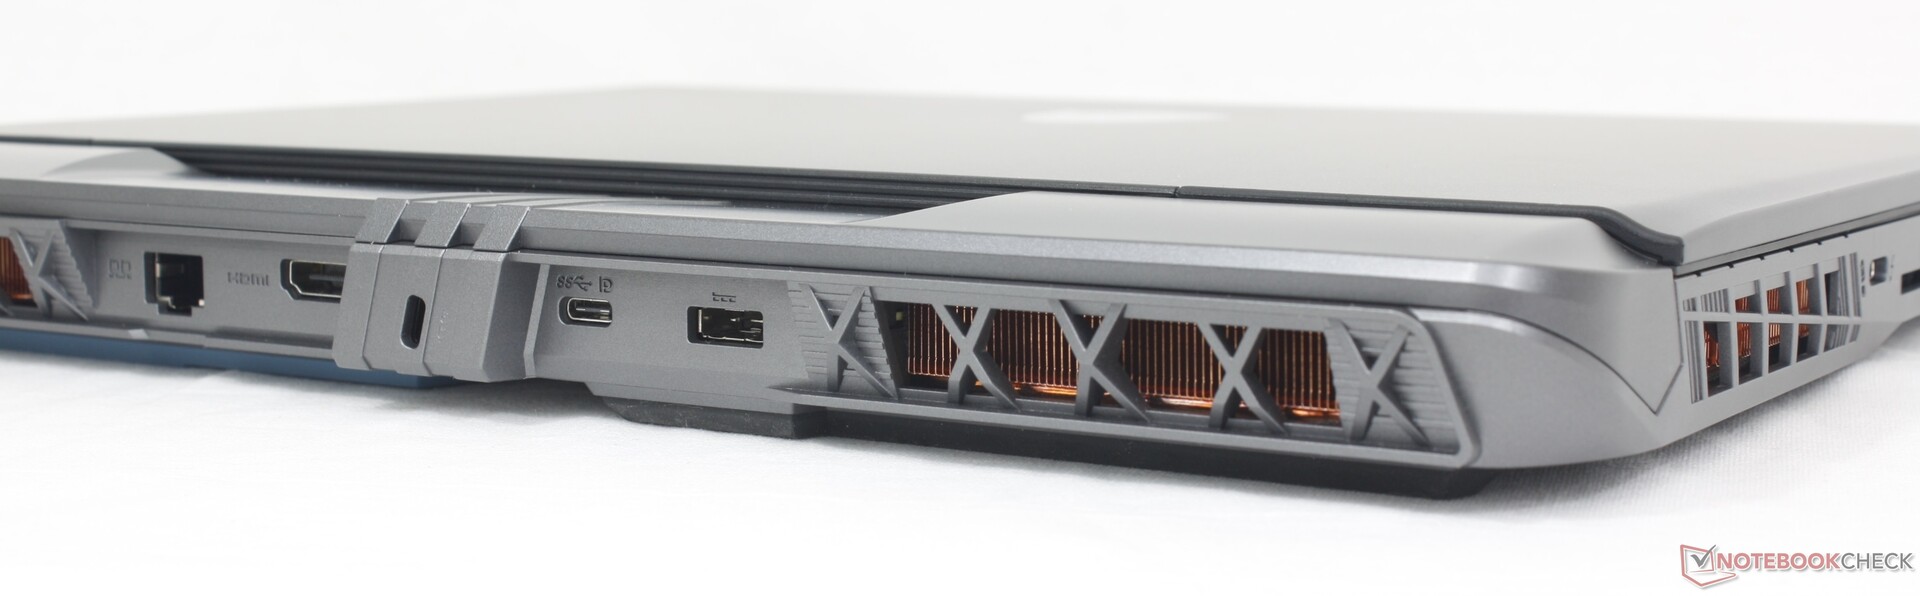
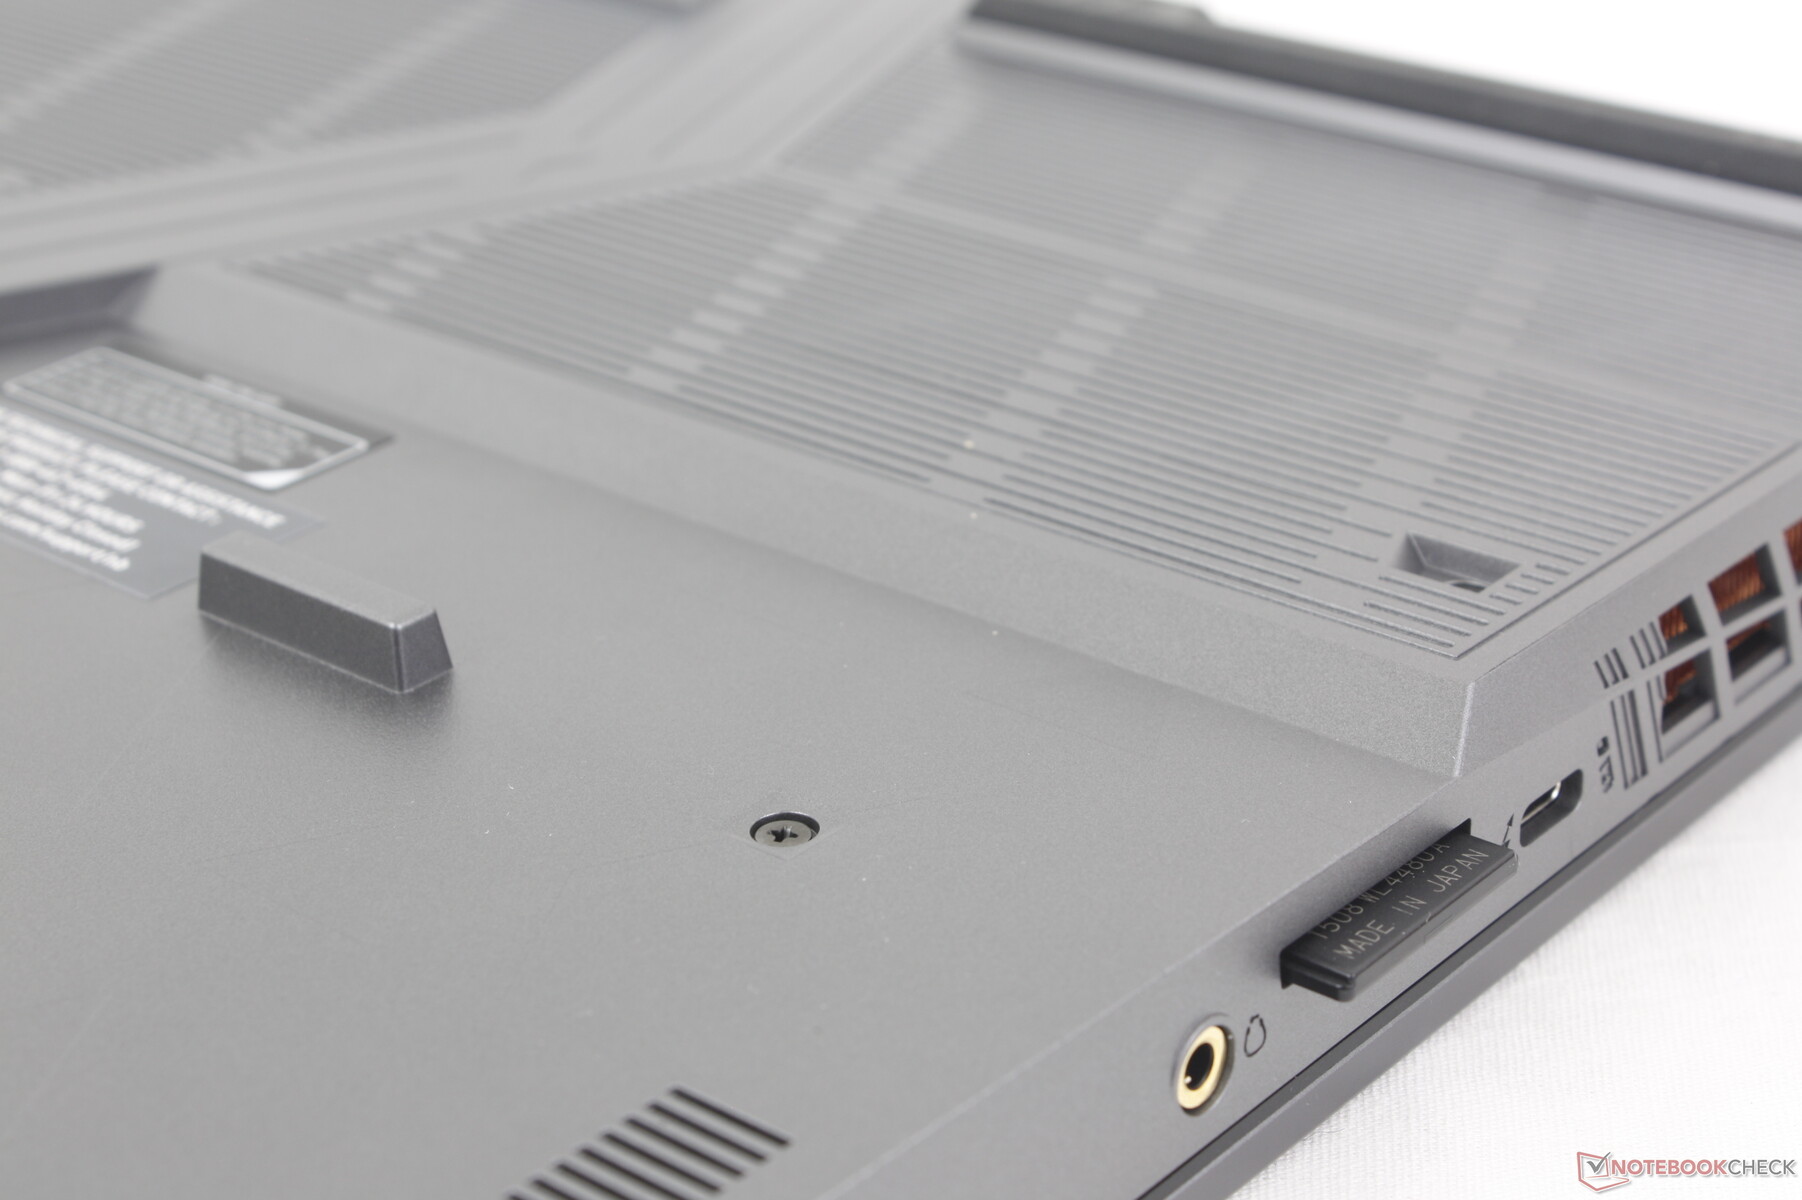
Conectividade
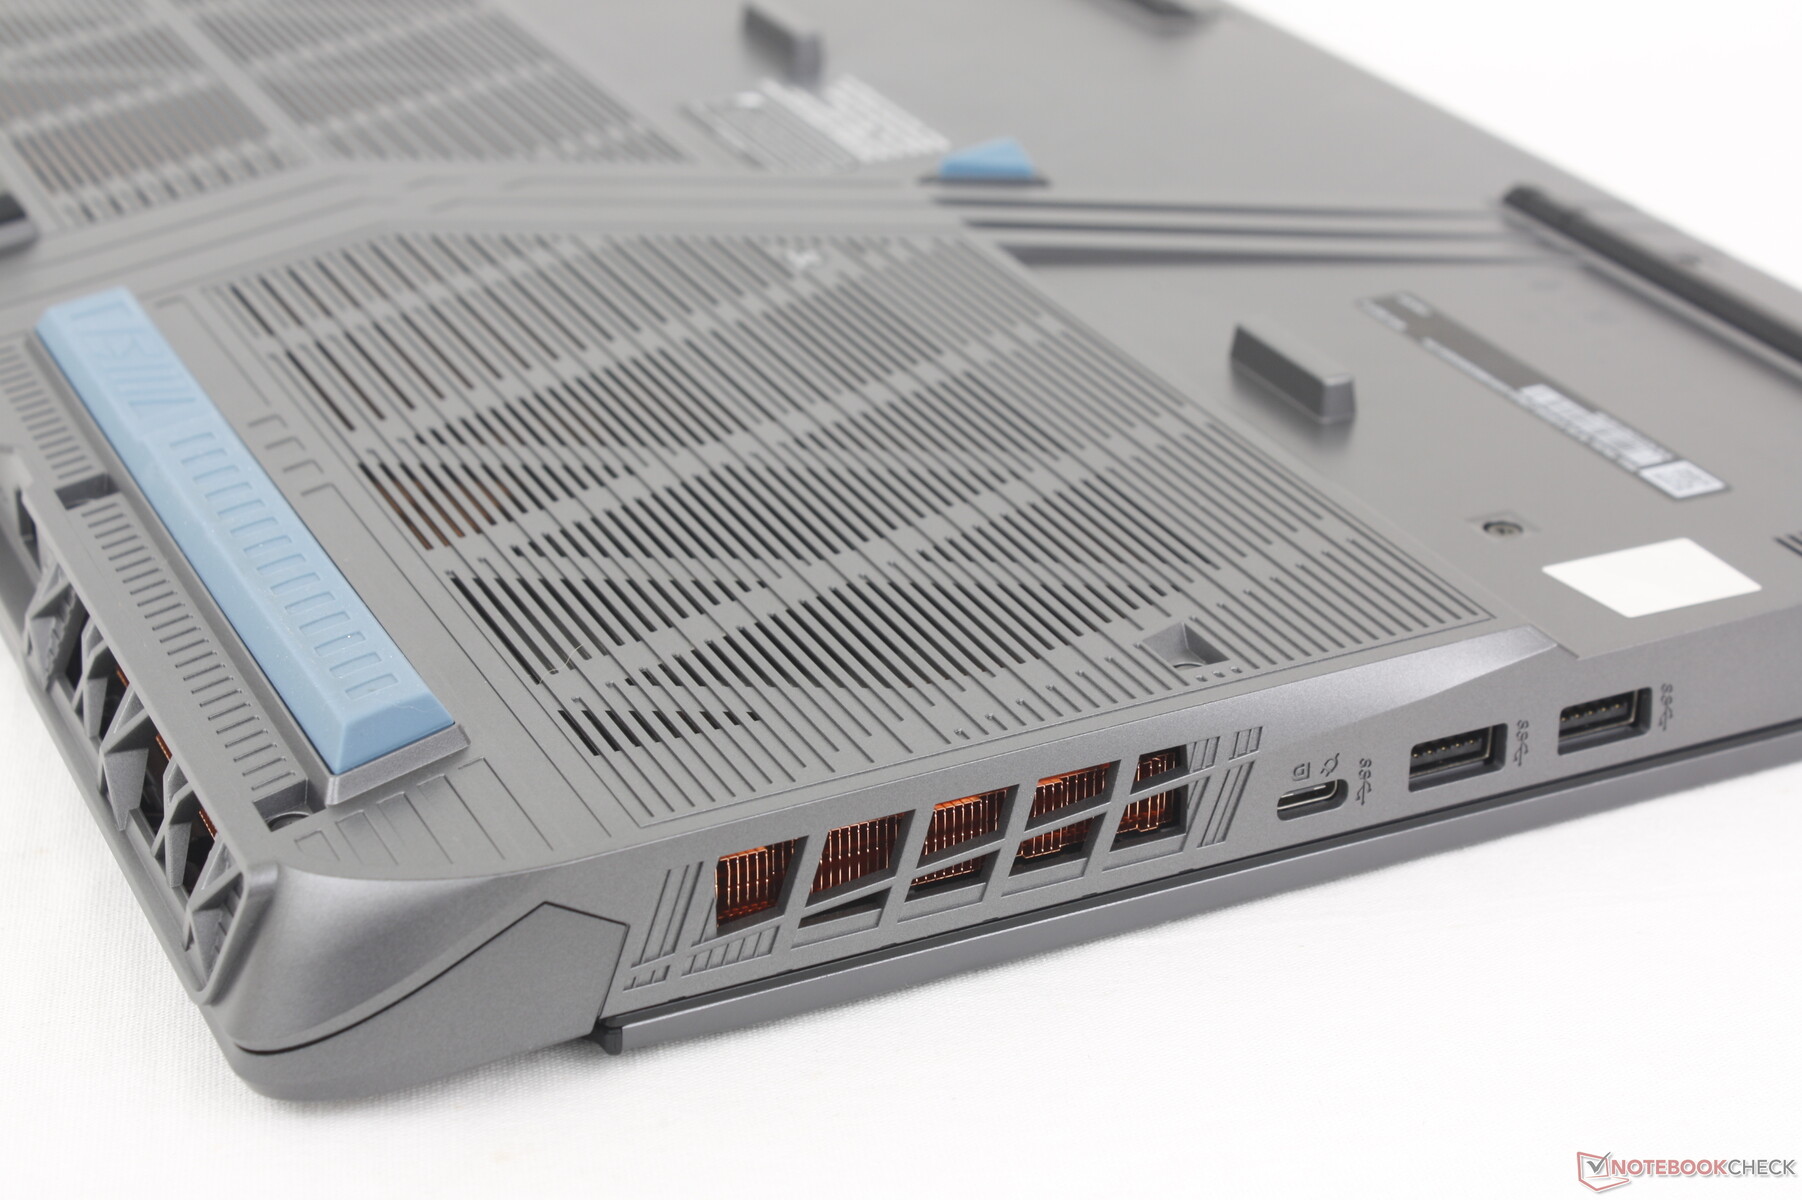
A MSI revisou as portas em comparação com o GP66. As novidades do Vector 16 HX são o leitor de cartão SD e as portas USB-C adicionais, agora com suporte adequado para Thunderbolt. Em compensação, no entanto, o modelo mais recente tem menos portas USB-A e deixou de lado a mini-DisplayPort dedicada. Isso ainda se compara favoravelmente com concorrentes como o Dell G16 ou o Asus TUF Gaming A16 que têm menos portas USB-C ou não têm leitor de cartão SD.
Observe que a porta do adaptador CA é idêntica à do Titan 18 HX, embora os tamanhos dos adaptadores CA possam ser diferentes.
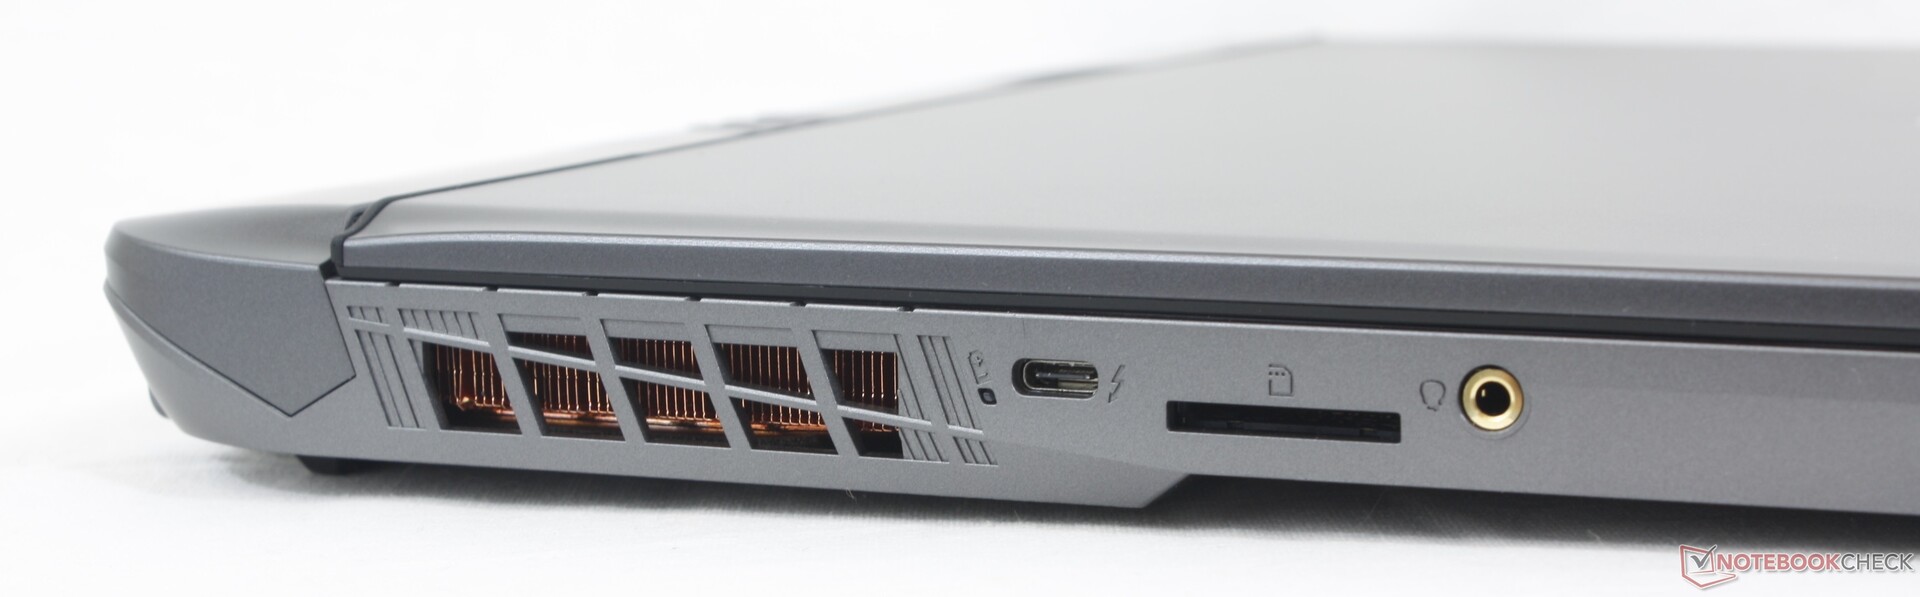
Leitor de cartão SD
As taxas de transferência do leitor de cartão SD integrado são decentes, em torno de 90 MB/s, sendo de 2x a 3x mais rápidas do que o leitor de cartão encontrado no novo Lenovo Legion 5 16. Entretanto, o leitor do MSI não é acionado por mola e, portanto, pode ser difícil remover um cartão SD inserido com dedos maiores.
| SD Card Reader | |
| average JPG Copy Test (av. of 3 runs) | |
| MSI Vector 16 HX A14V (Toshiba Exceria Pro SDXC 64 GB UHS-II) | |
| Lenovo Legion 5 16IRX G9 | |
| maximum AS SSD Seq Read Test (1GB) | |
| MSI Vector 16 HX A14V (Toshiba Exceria Pro SDXC 64 GB UHS-II) | |
| Lenovo Legion 5 16IRX G9 | |
Comunicação
O Killer BE1750x é compatível com o Wi-Fi 7 e o Bluetooth 5.4, embora os roteadores Wi-Fi 7 ainda não sejam comuns. Portanto, sua inclusão é mais uma questão de preparação para o futuro, já que a maioria dos usuários atuais não tem roteadores Wi-Fi 7. No entanto, as taxas de transferência são estáveis e confiáveis quando emparelhadas com o nosso roteador de teste Asus AXE11000 Wi-Fi 6E.
| Networking | |
| iperf3 transmit AX12 | |
| MSI Vector GP66 12UGS | |
| iperf3 receive AX12 | |
| MSI Vector GP66 12UGS | |
| iperf3 transmit AXE11000 | |
| Lenovo Legion 5 16IRX G9 | |
| MSI Vector 16 HX A14V | |
| Dell G16 7620 | |
| Asus TUF Gaming A16 FA617XS | |
| HP Victus 16-r0077ng | |
| iperf3 receive AXE11000 | |
| Lenovo Legion 5 16IRX G9 | |
| MSI Vector 16 HX A14V | |
| Dell G16 7620 | |
| Asus TUF Gaming A16 FA617XS | |
| HP Victus 16-r0077ng | |
| iperf3 transmit AXE11000 6GHz | |
| MSI Vector 16 HX A14V | |
| iperf3 receive AXE11000 6GHz | |
| MSI Vector 16 HX A14V | |
Webcam
A webcam integrada é de apenas 1 MP, pois o Vector não foi projetado para videoconferências frequentes. O IR também não é suportado, mas pelo menos inclui um obturador físico para fins de privacidade.


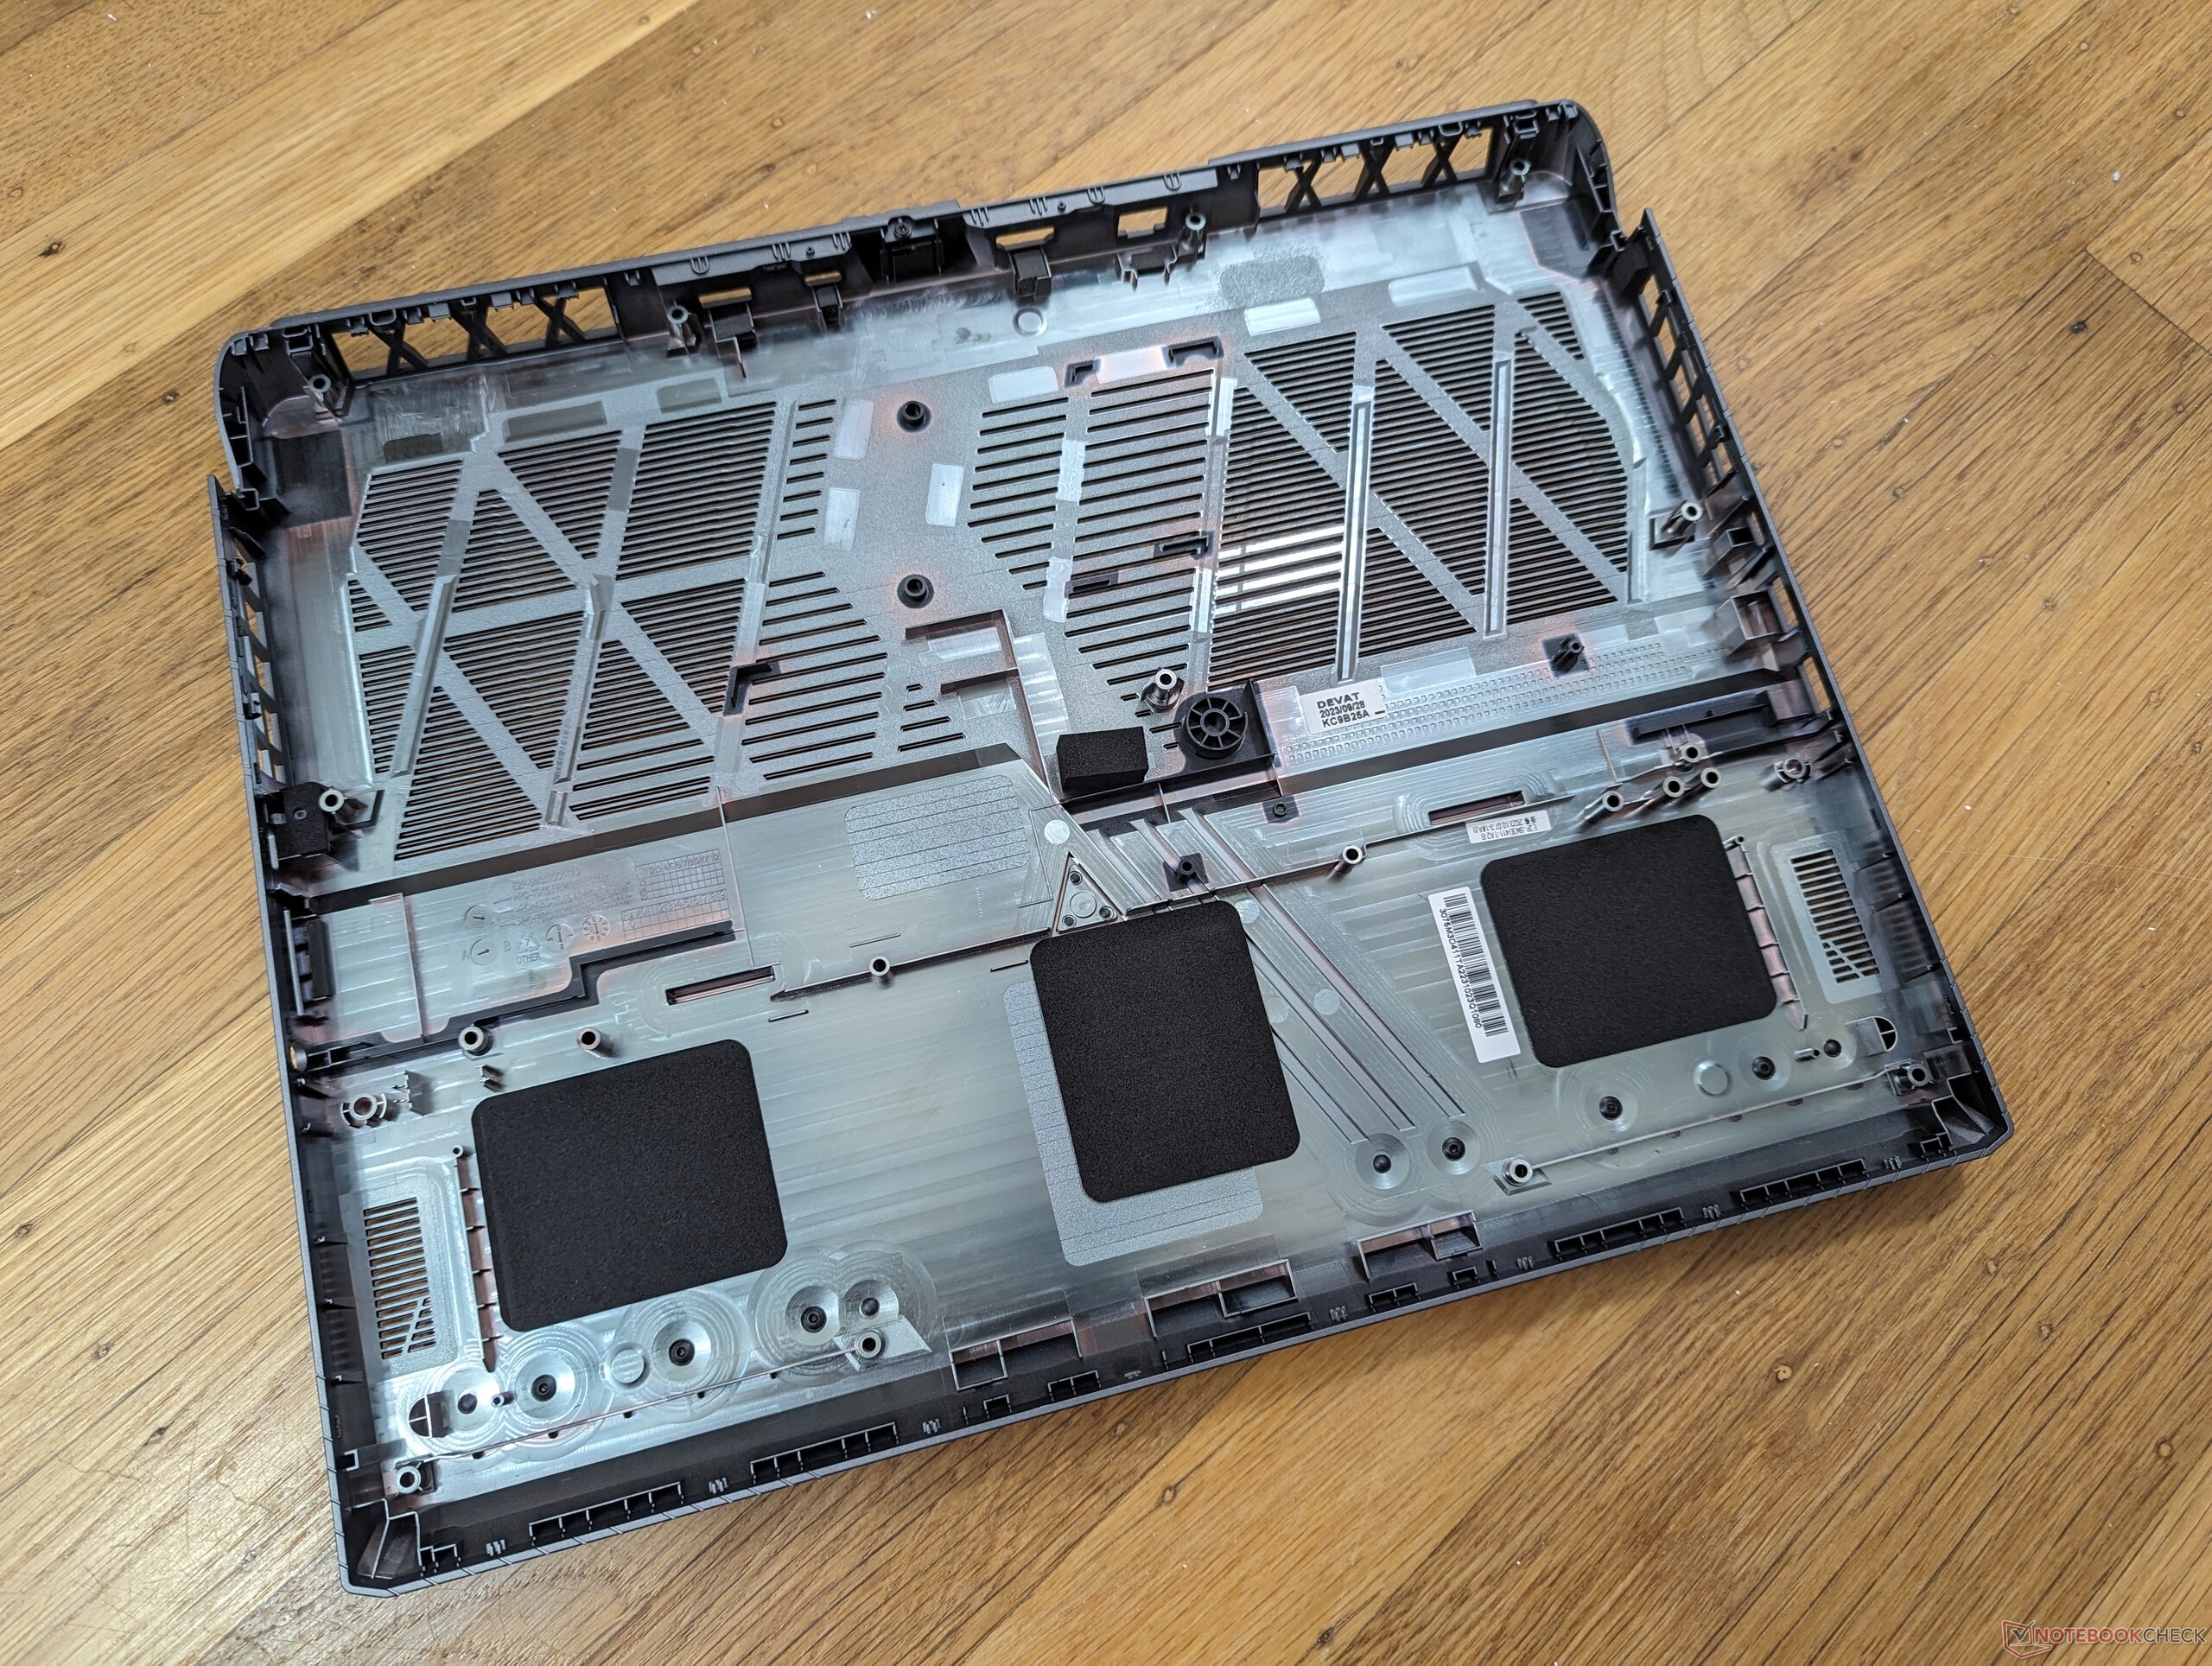
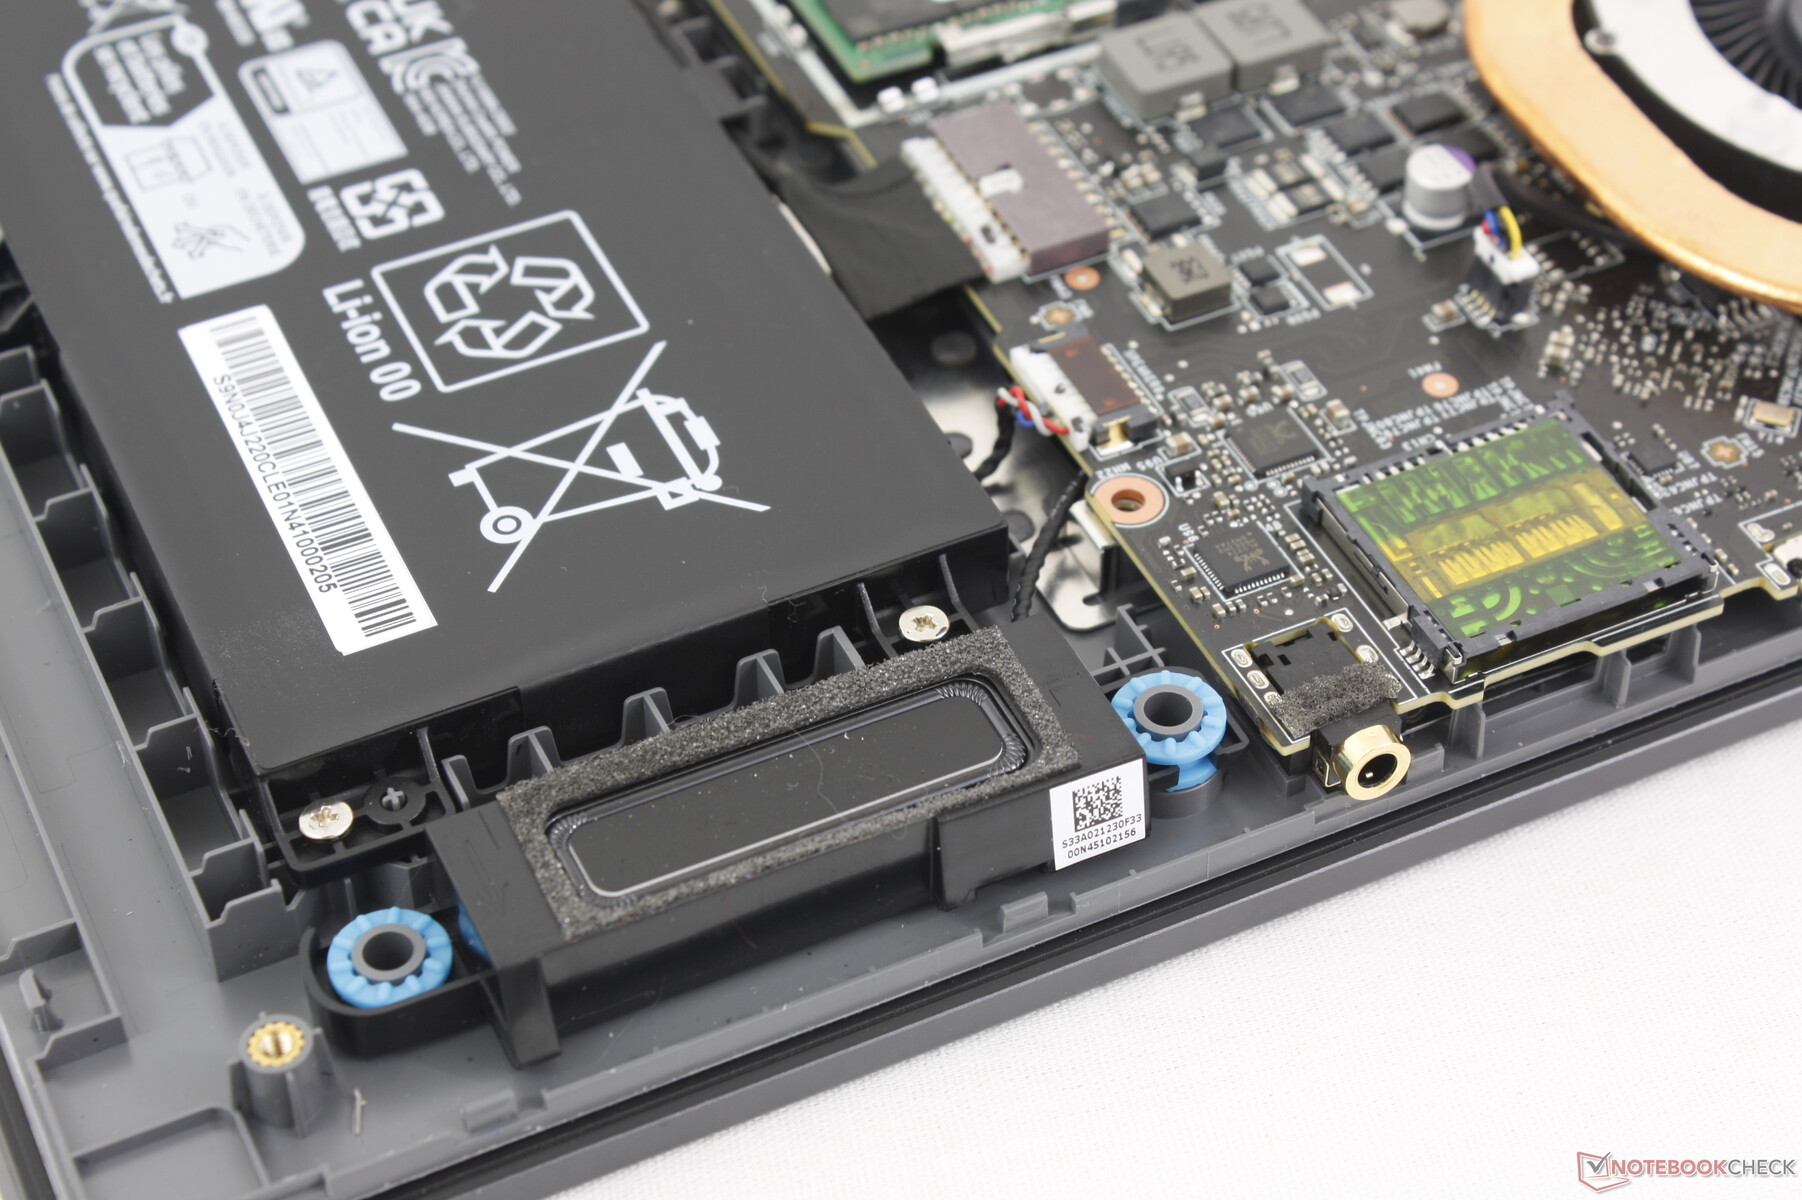
Manutenção
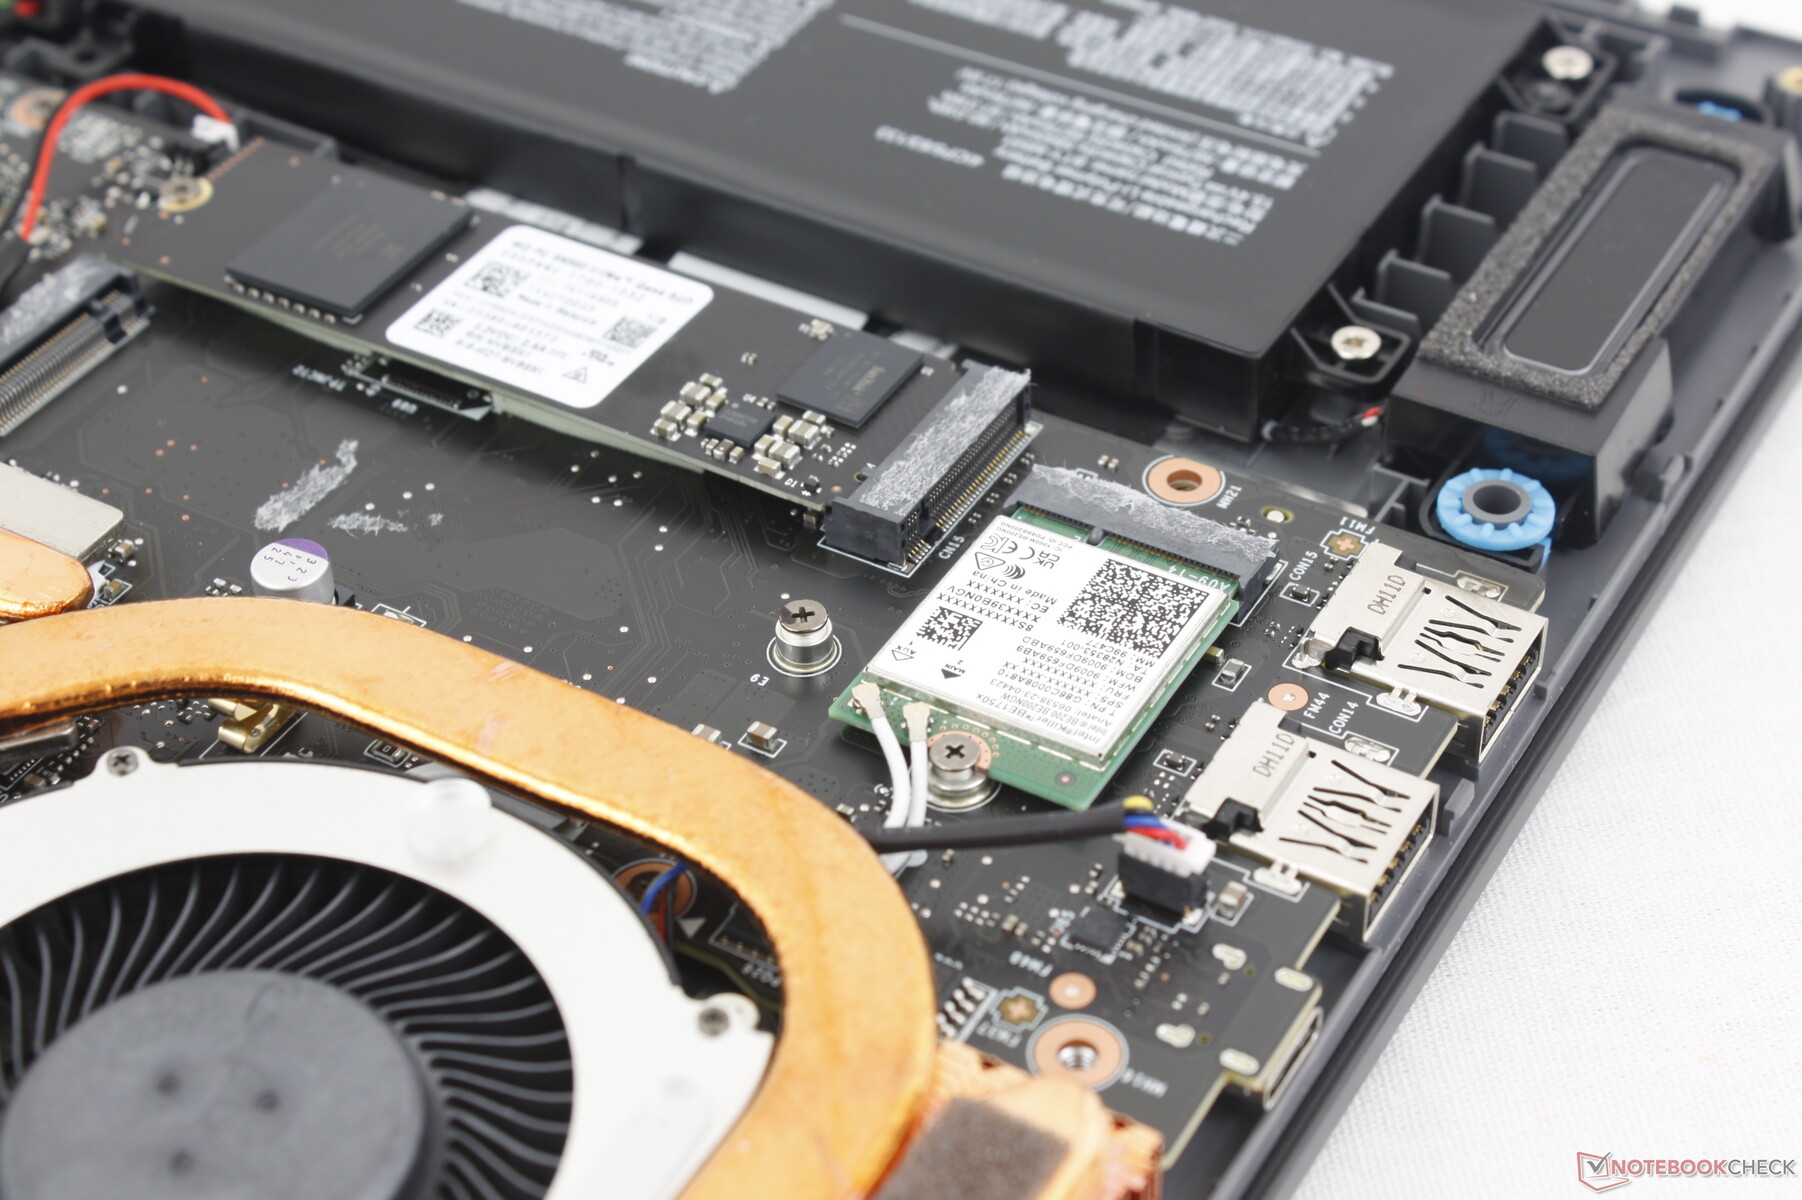
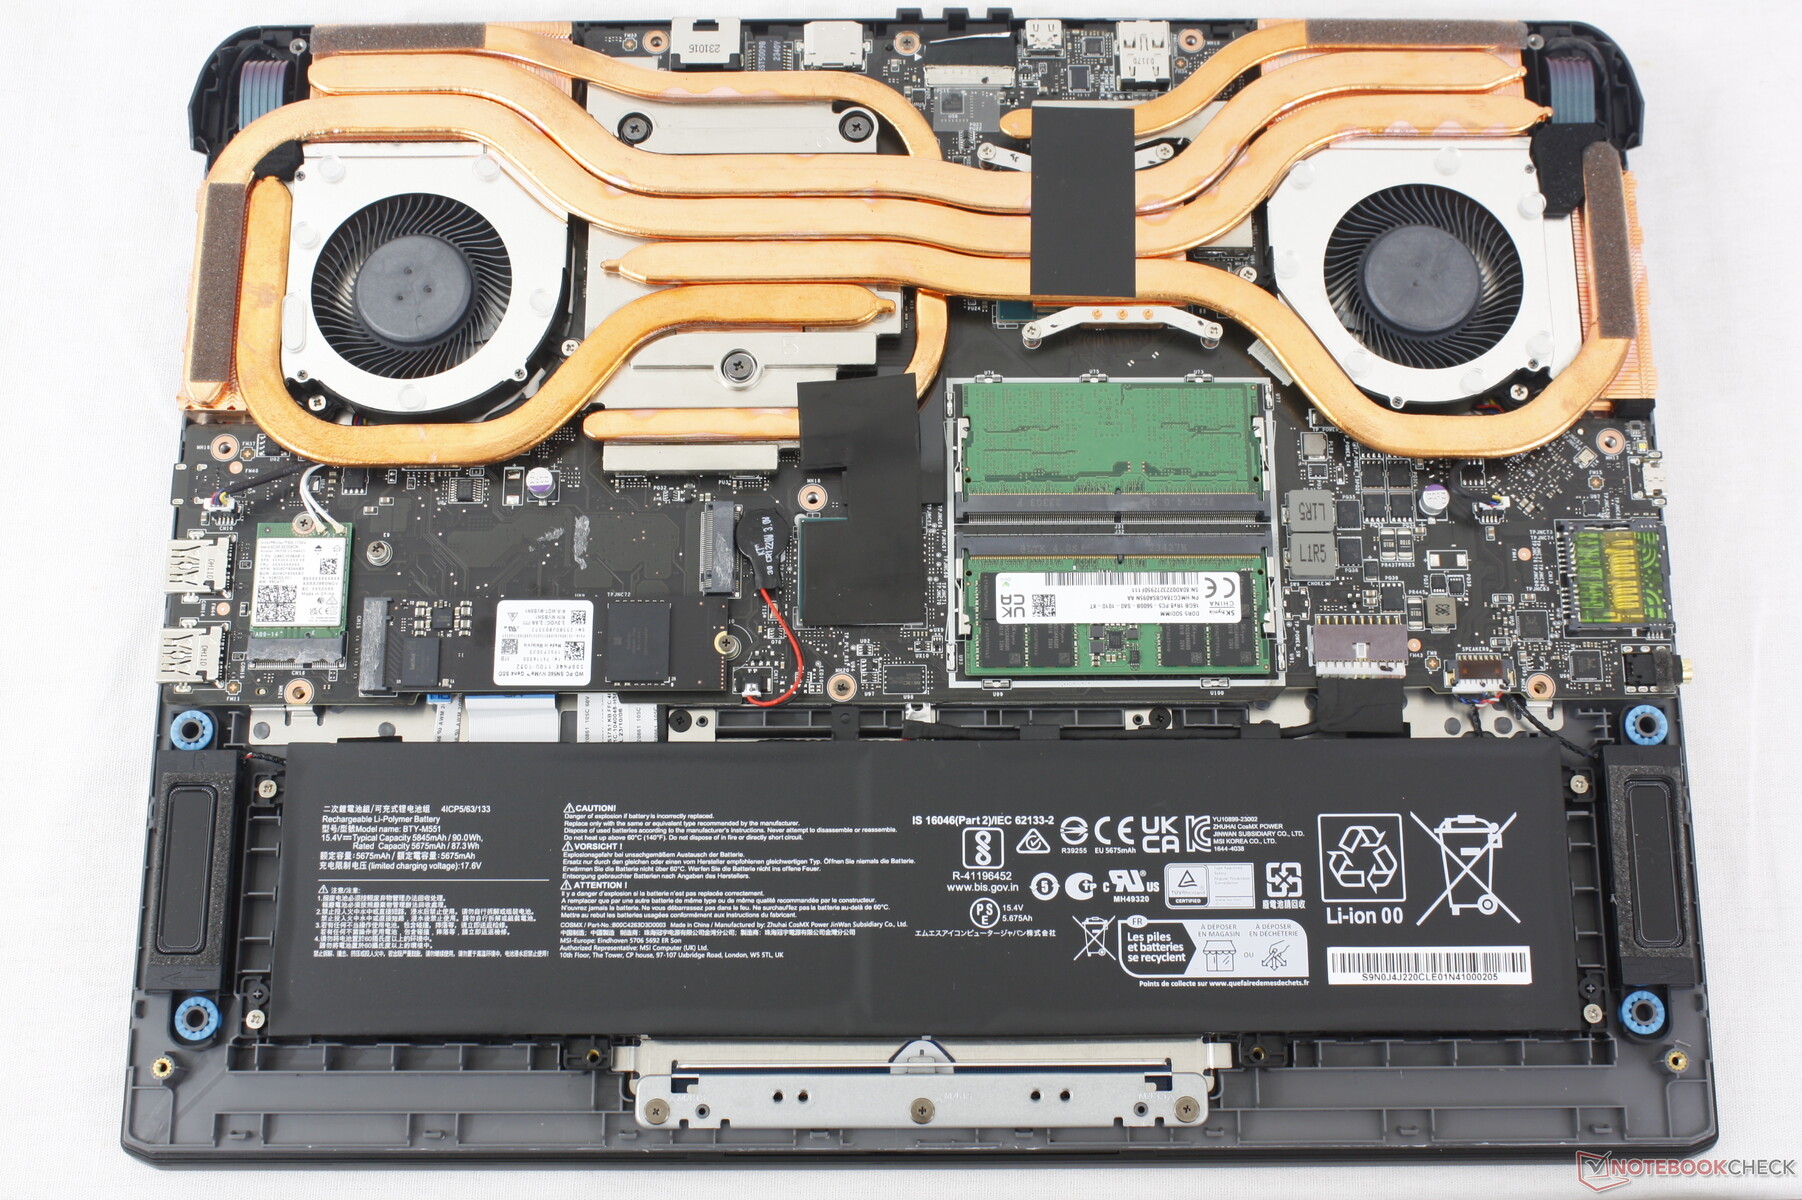
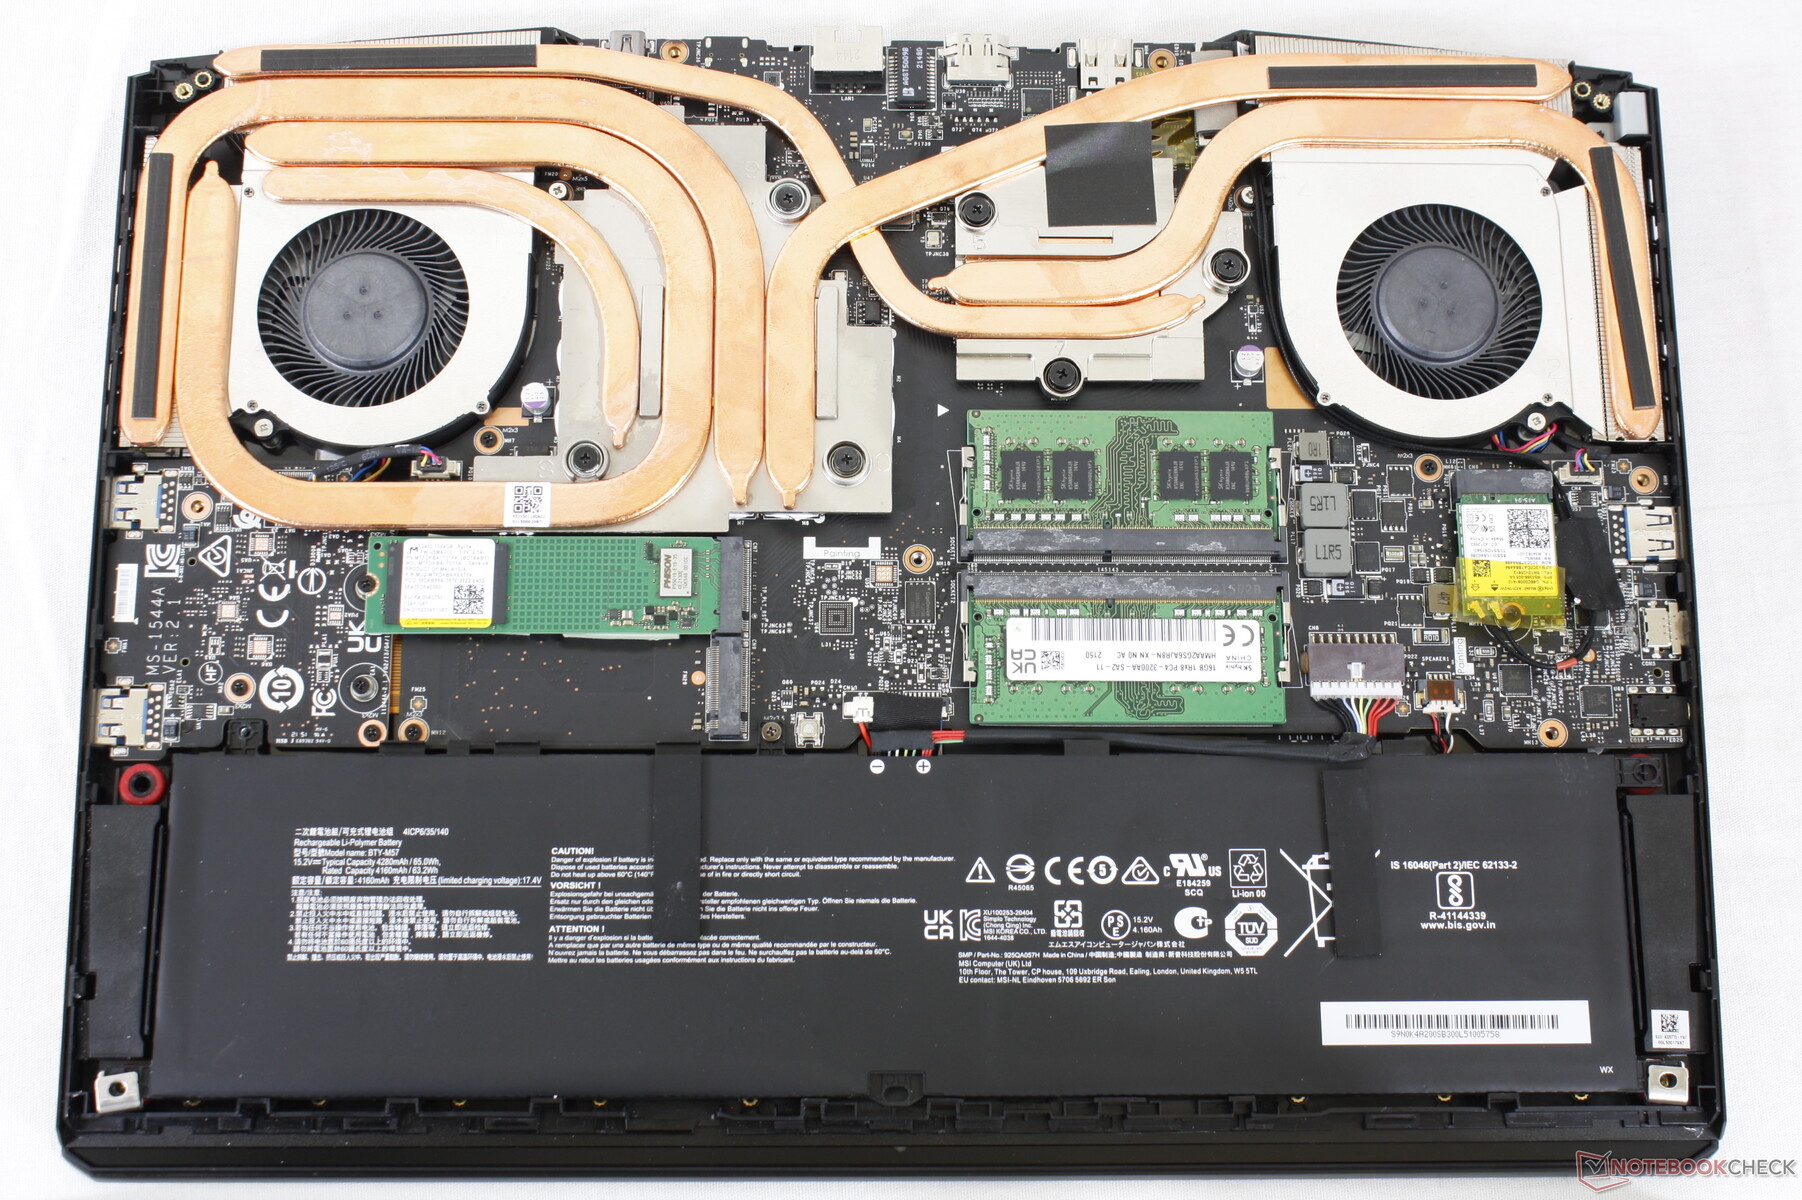
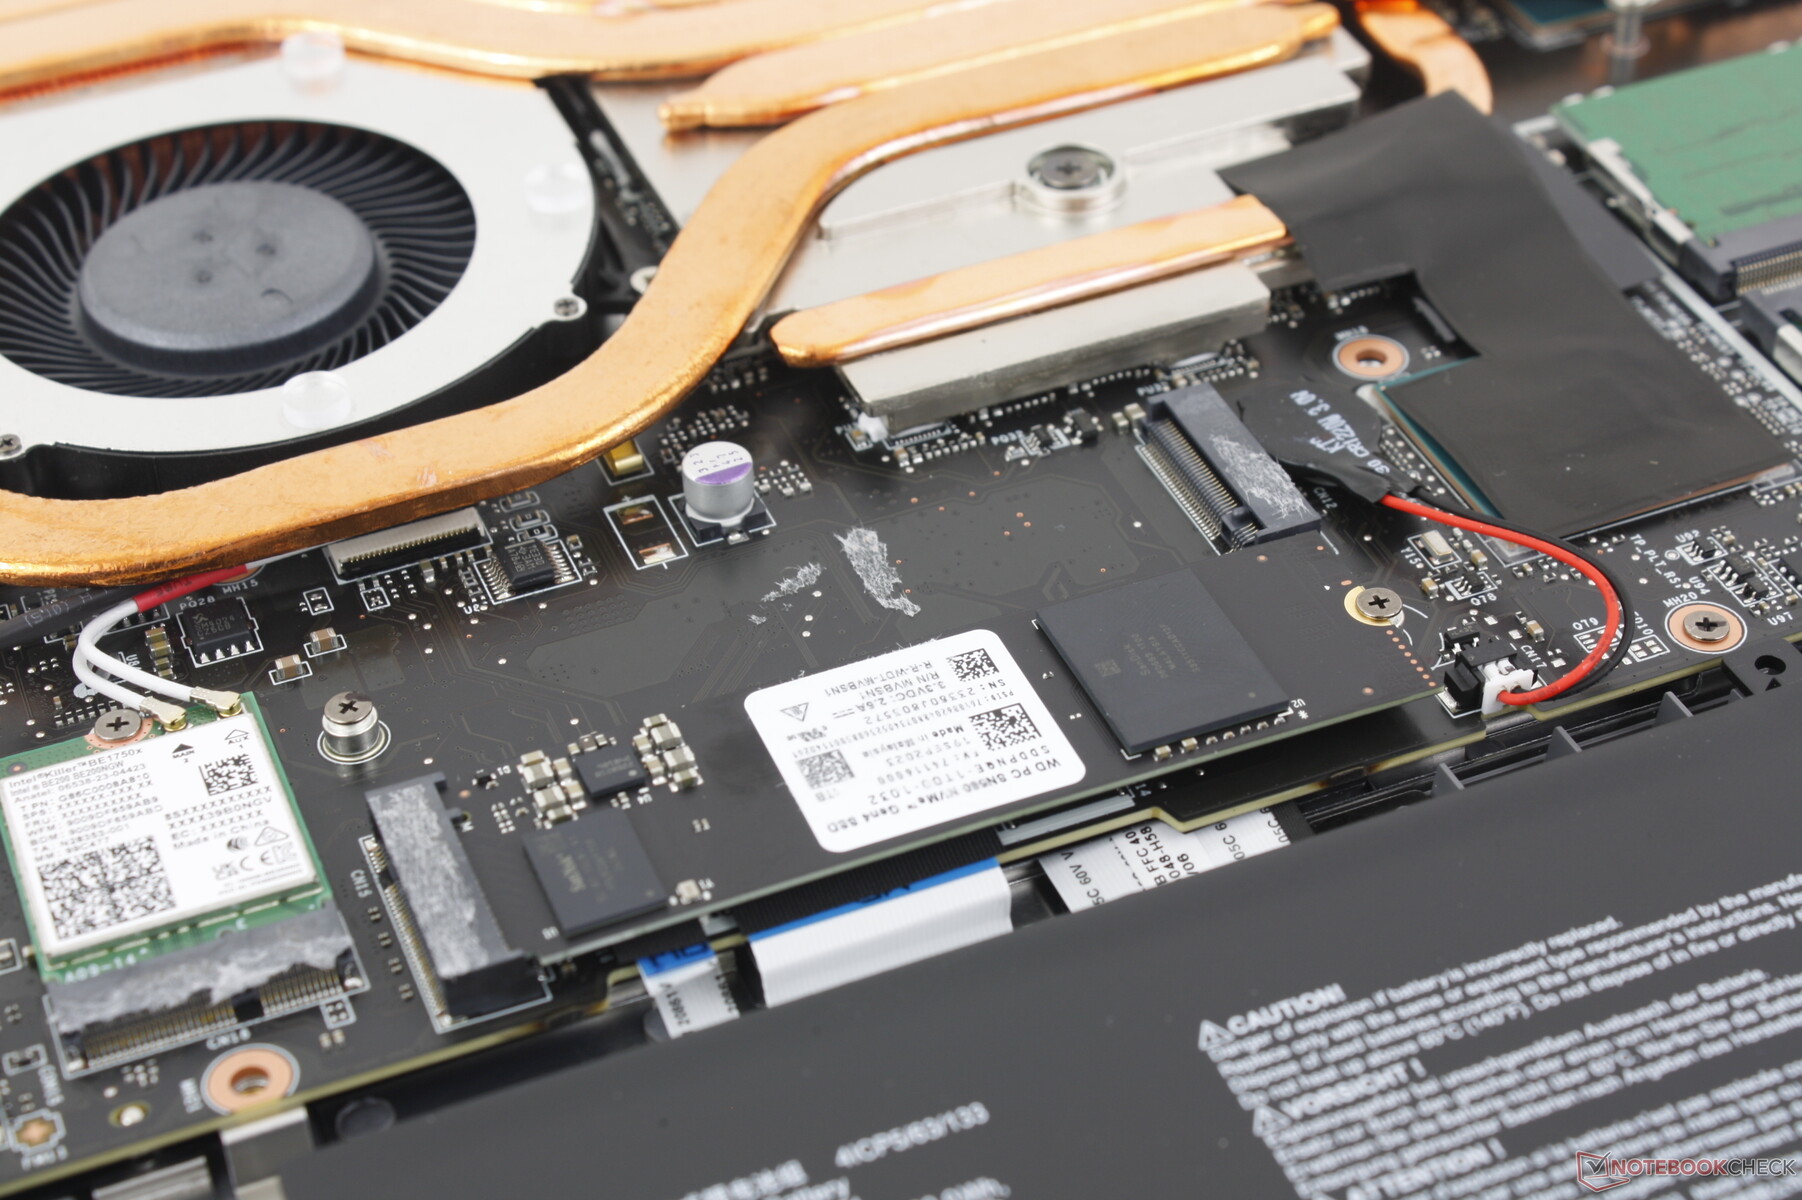
O painel inferior é fixado por 13 parafusos Phillips. Infelizmente, a remoção do painel pode ser difícil, pois as bordas e os cantos têm curvas significativas que tornam o processo mais problemático do que o necessário. Em comparação, o painel inferior do Razer Blade 16 é muito mais plano e tem menos travas para facilitar a remoção. Recomenda-se o uso de uma borda plana ao fazer a manutenção do Vector 16 HX.
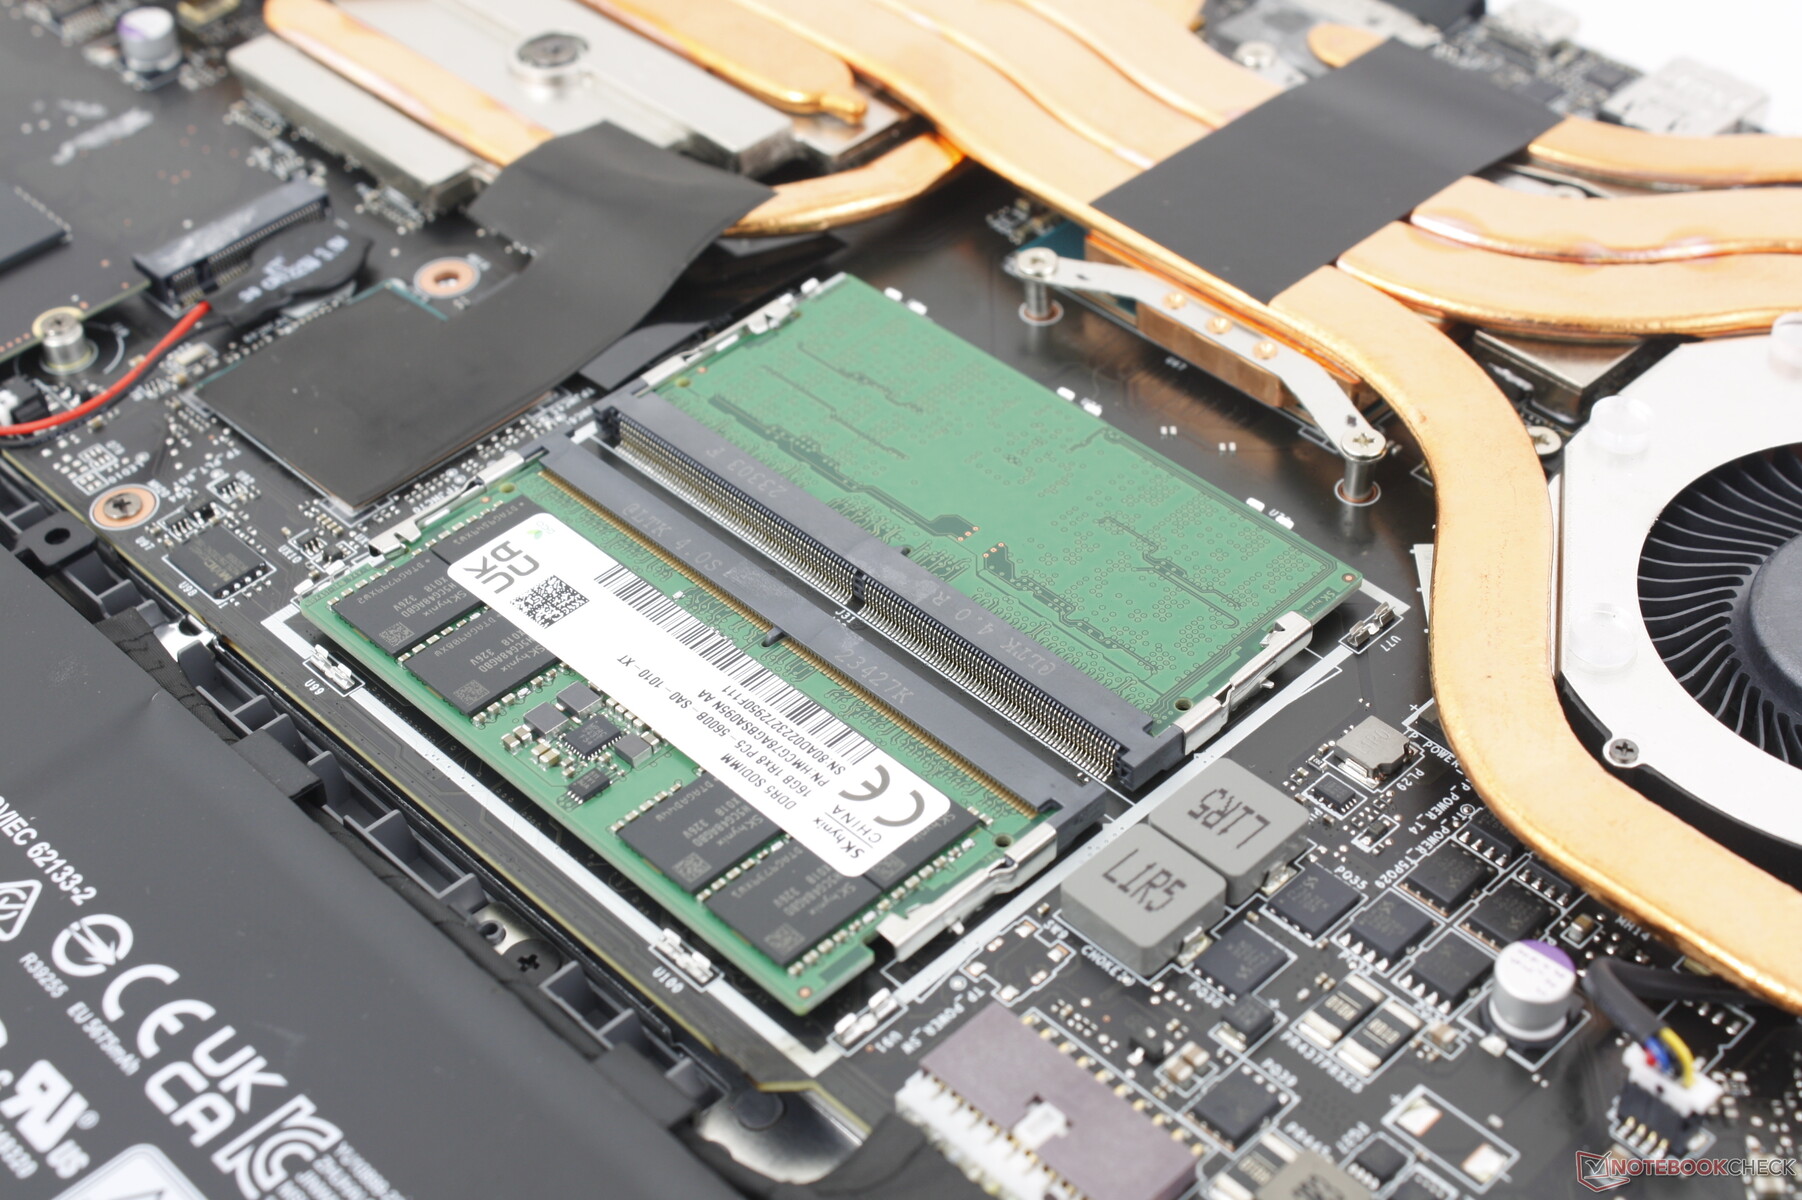
Na parte interna, os usuários terão acesso a dois compartimentos de armazenamento M.2, dois slots SODIMM, bateria e módulo WLAN, exatamente como no design antigo do Vector GP66.
Acessórios e garantia
Não há extras incluídos na caixa além do adaptador CA e da documentação. A garantia limitada de um ano do fabricante se aplica se o produto for comprado nos EUA.
Dispositivos de entrada - simples e funcionais
Teclado
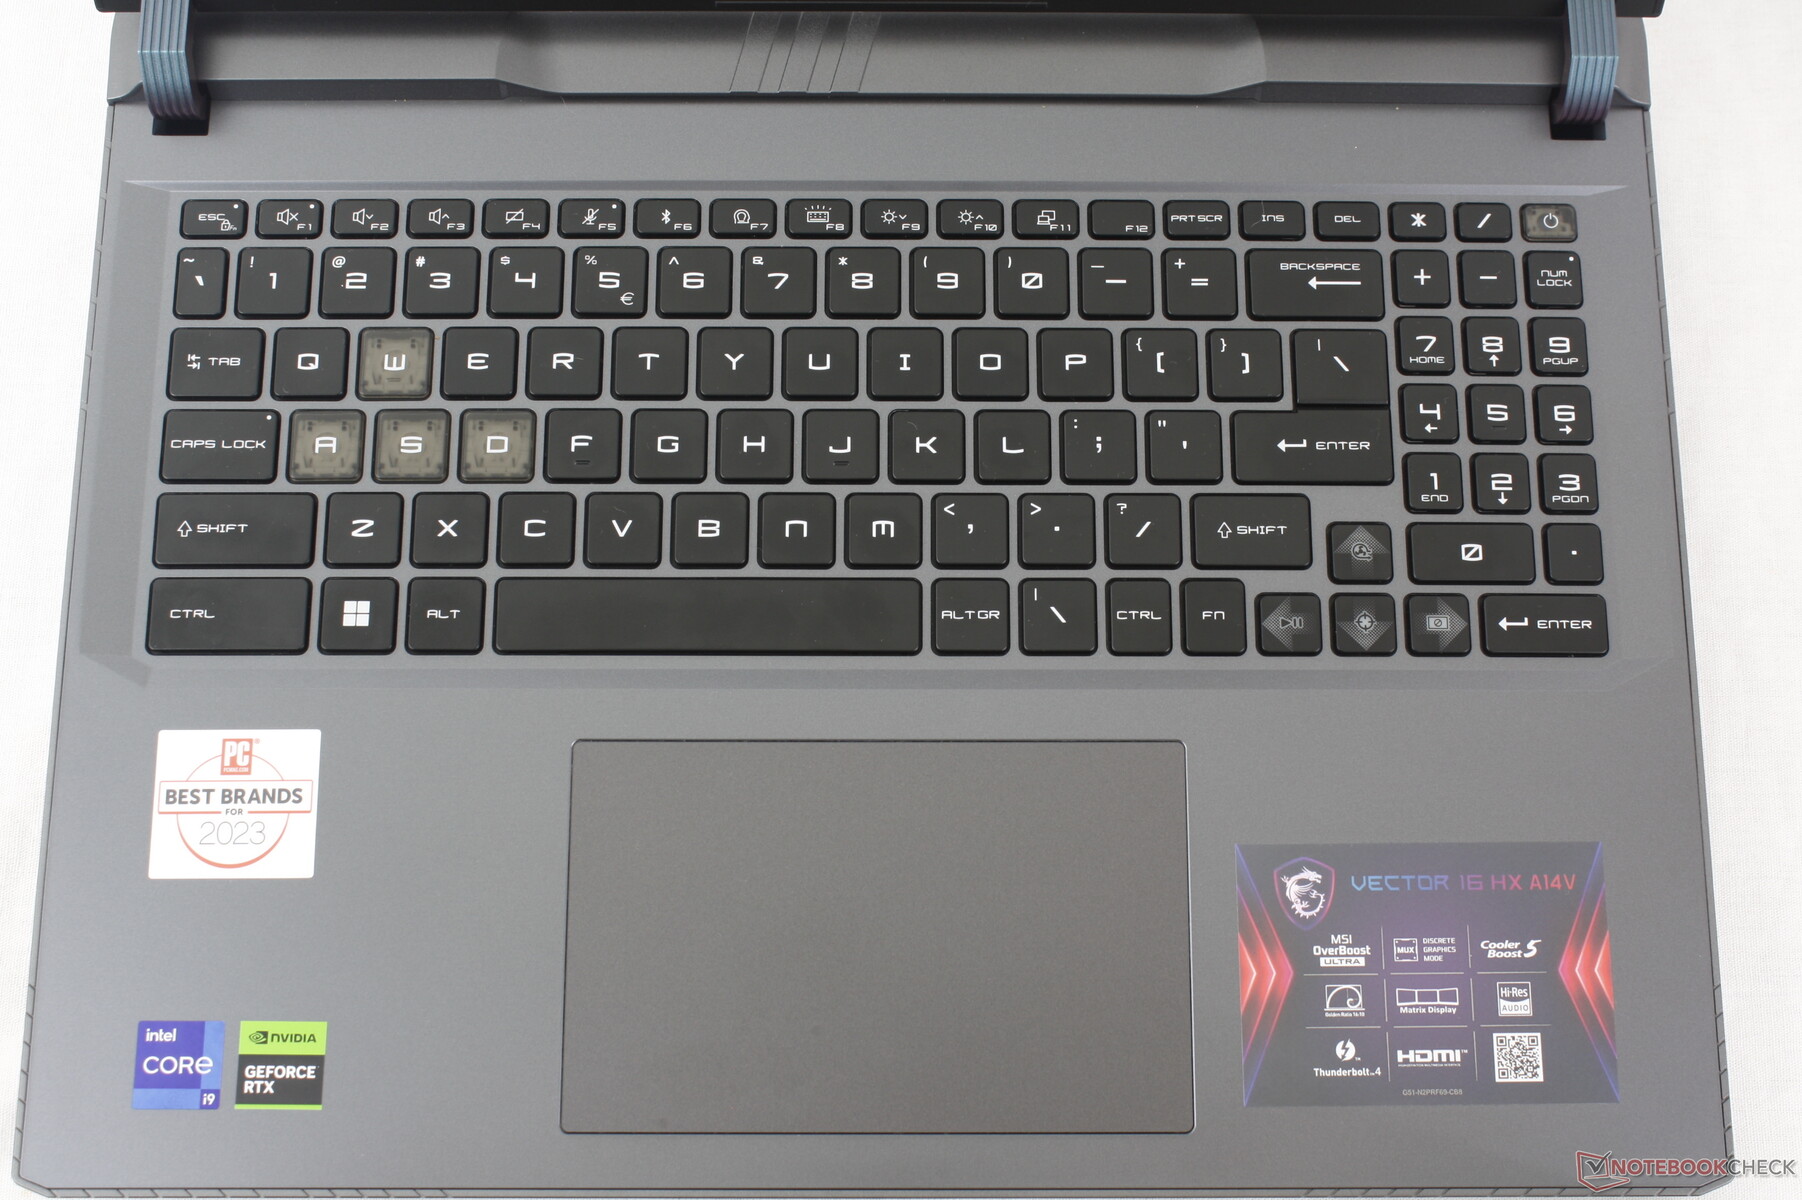
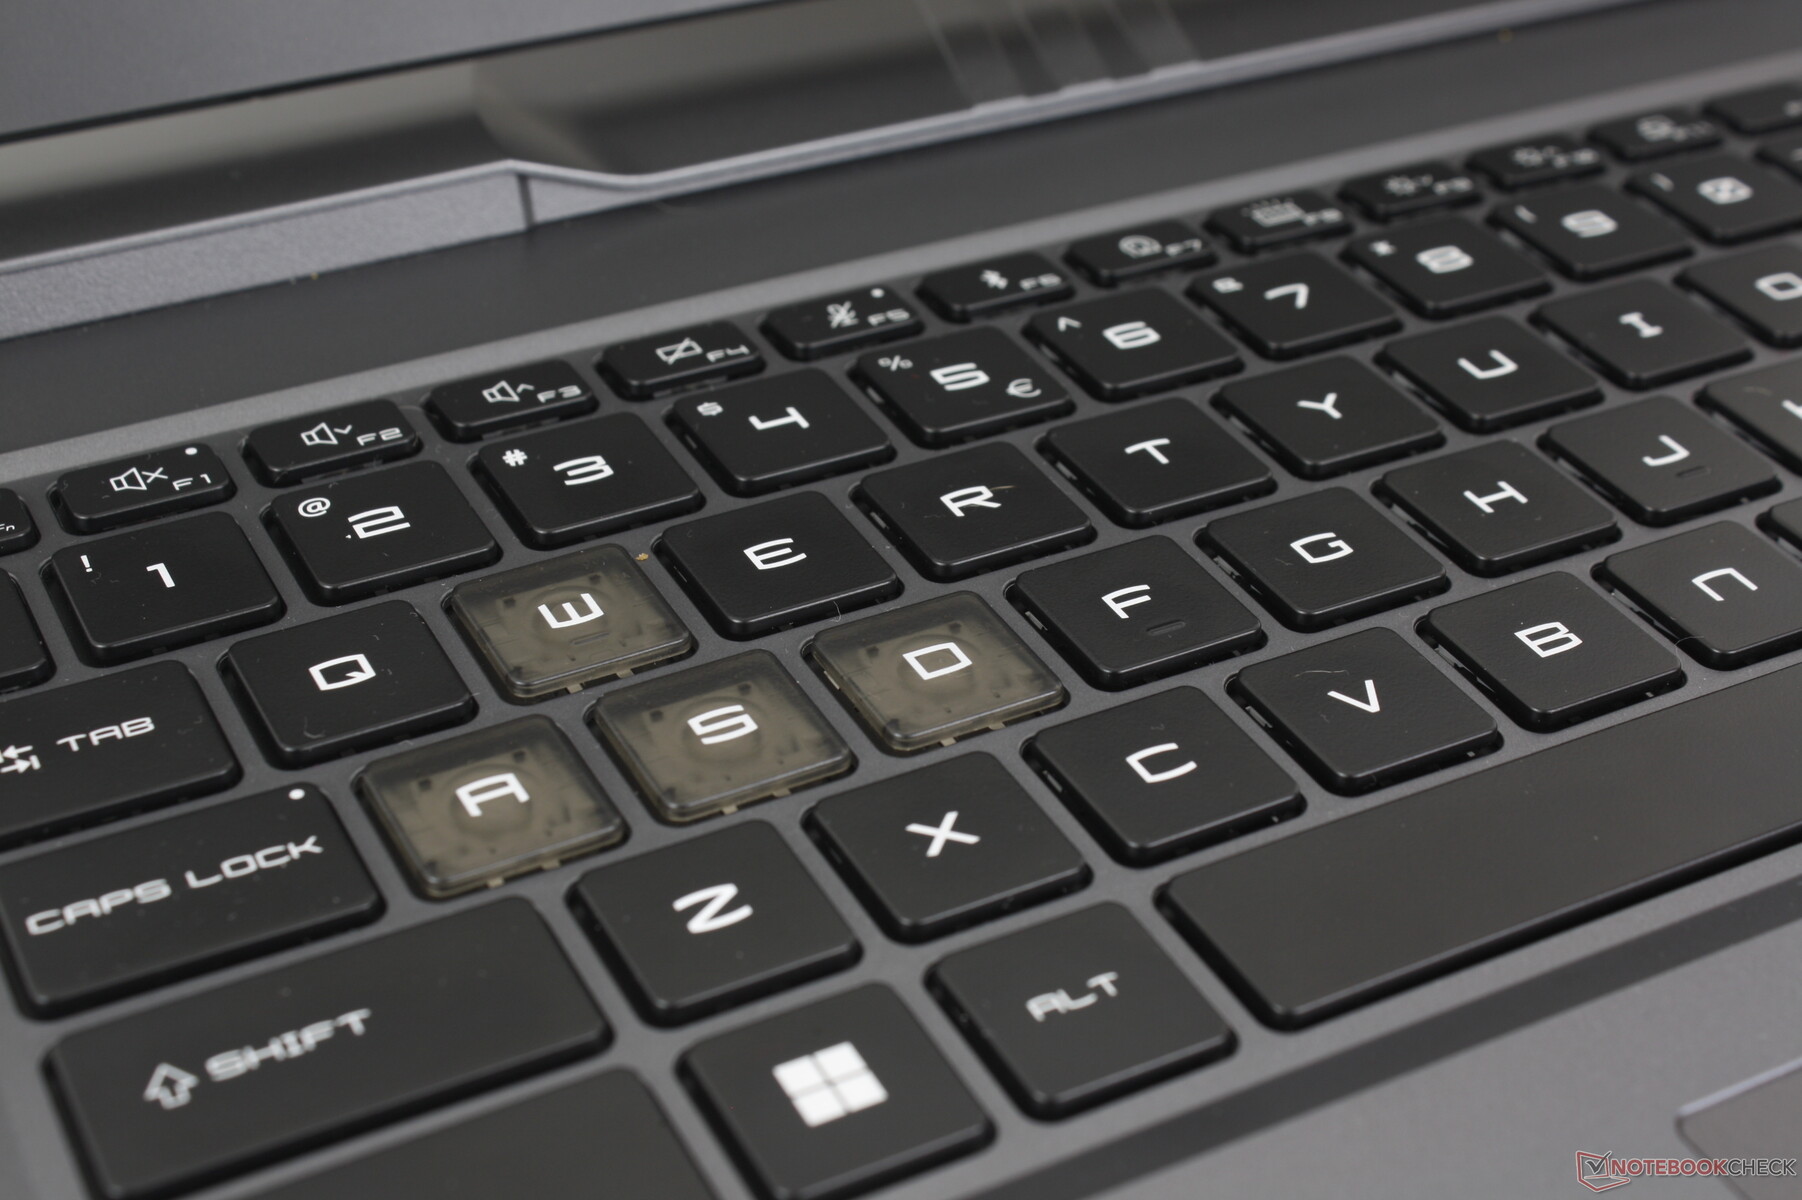
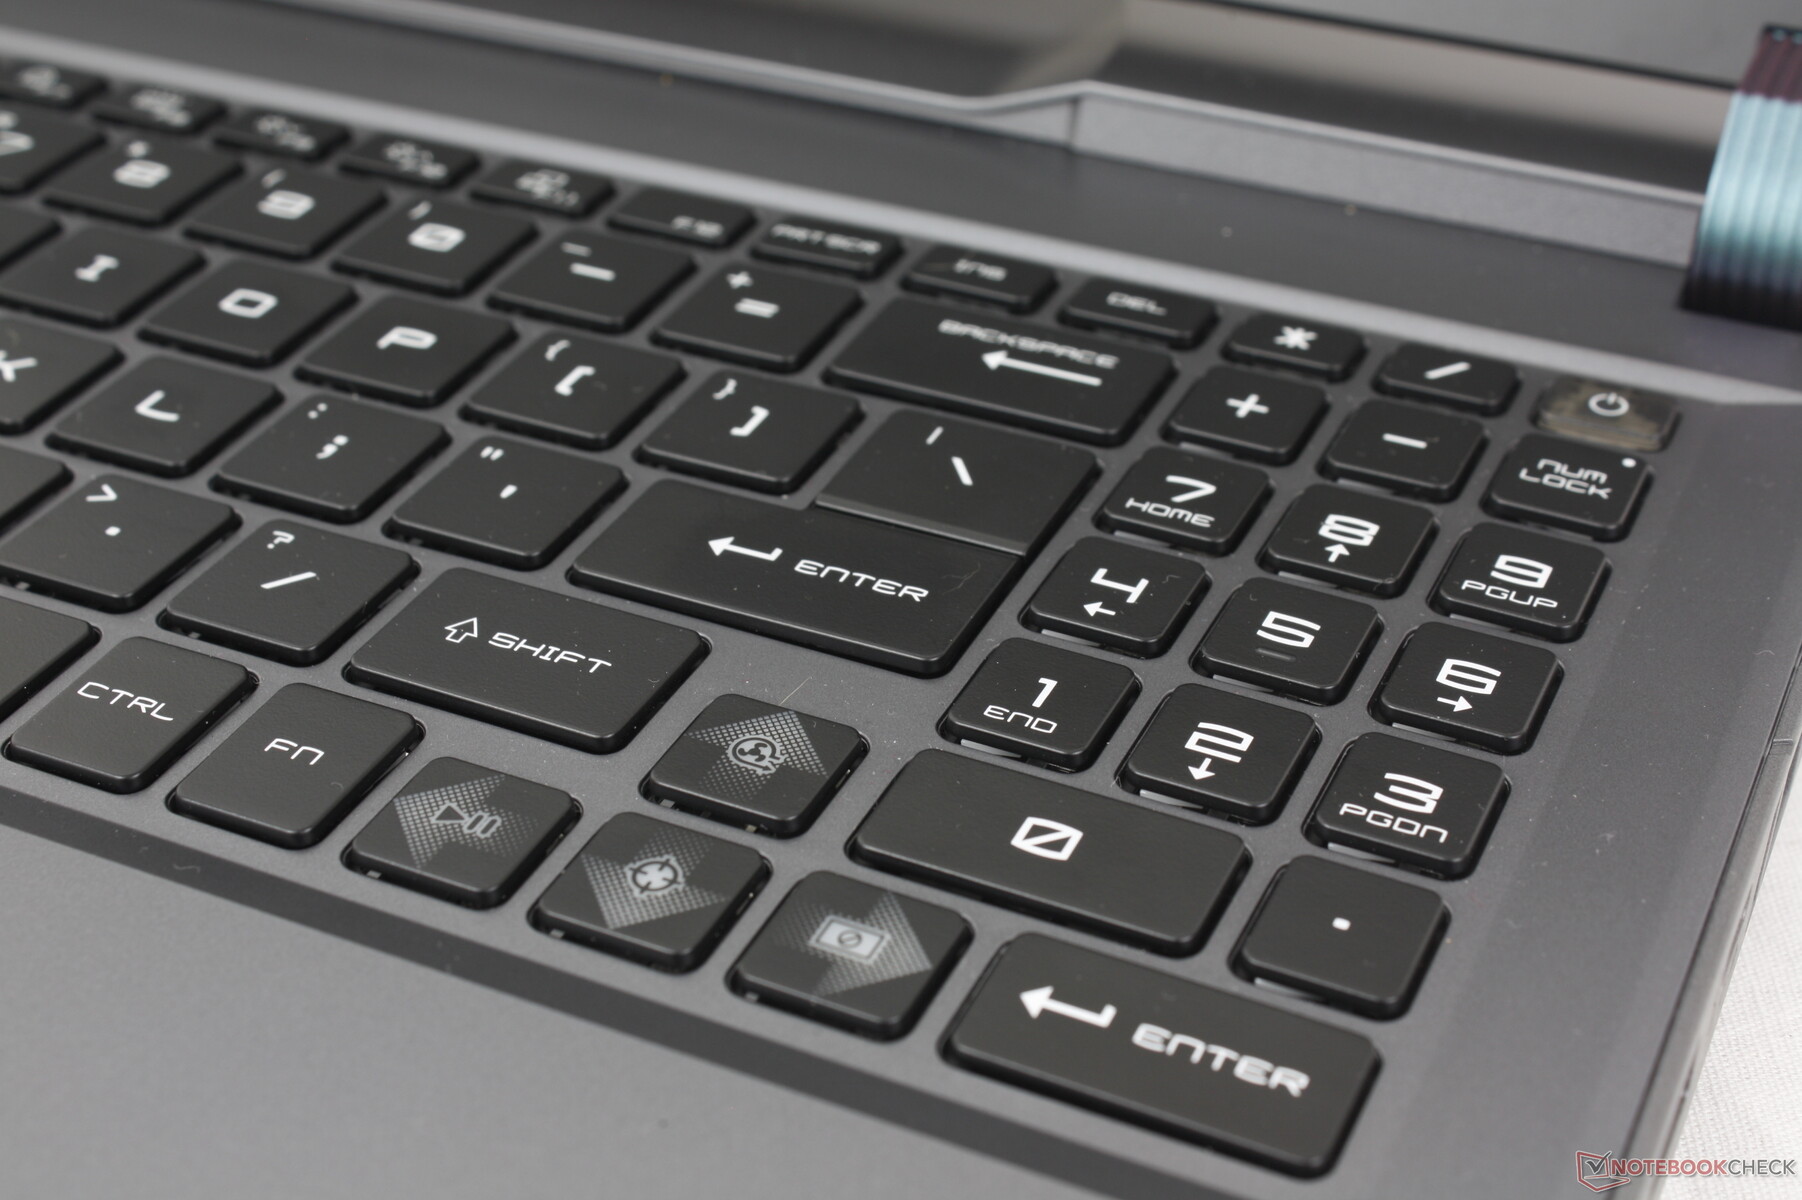
A MSI reformulou o layout do teclado em comparação com o antigo Vector GP66 mais antigo. As incômodas teclas Fn/Ctrl do GP66 agora estão devidamente separadas e há também um novo teclado numérico, enquanto muitos outros laptops para jogos normalmente omitem o teclado numérico por completo. Infelizmente, as teclas de seta são menores do que antes e as teclas estreitas do teclado numérico não são muito confortáveis de usar. Sua implementação, portanto, parece uma reflexão tardia quando comparada com as teclas QWERTY, que são maiores e mais confortáveis.
A iluminação RGB por tecla é padrão para iluminar todas as teclas e símbolos.
Touchpad
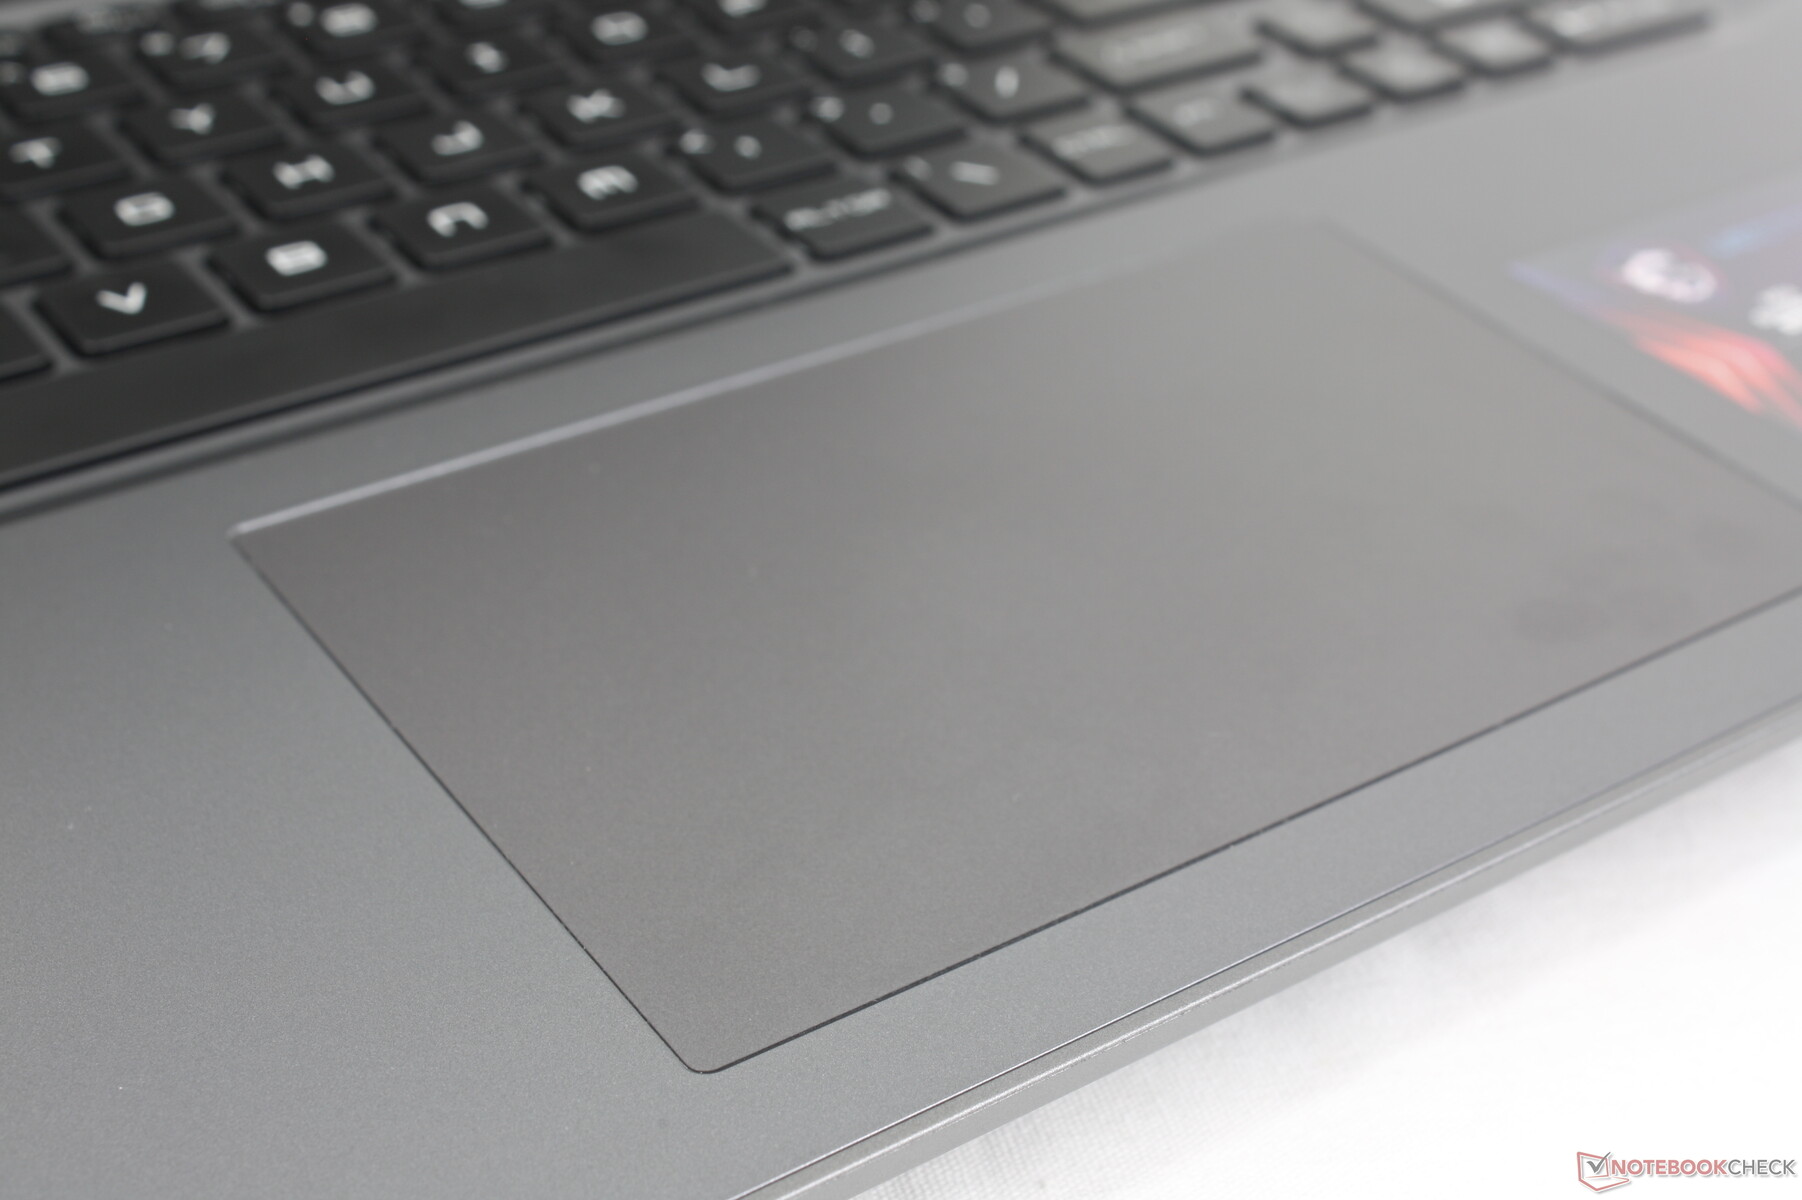
Com aproximadamente 13,2 x 8,2 cm, o clickpad é mais espaçoso do que no Dell G16 7620 (10,5 x 6 cm) e no antigo Vector GP66 (10,5 x 6,5 cm). A tração é muito suave, com apenas uma leve aderência ao deslizar em velocidades mais lentas. O feedback ao pressionar para baixo também é bastante firme, apesar do barulho relativamente silencioso. Os Clickpads geralmente são inferiores em laptops para jogos, mas estamos felizes em ver um considerável e meio decente no Vector 16 HX.
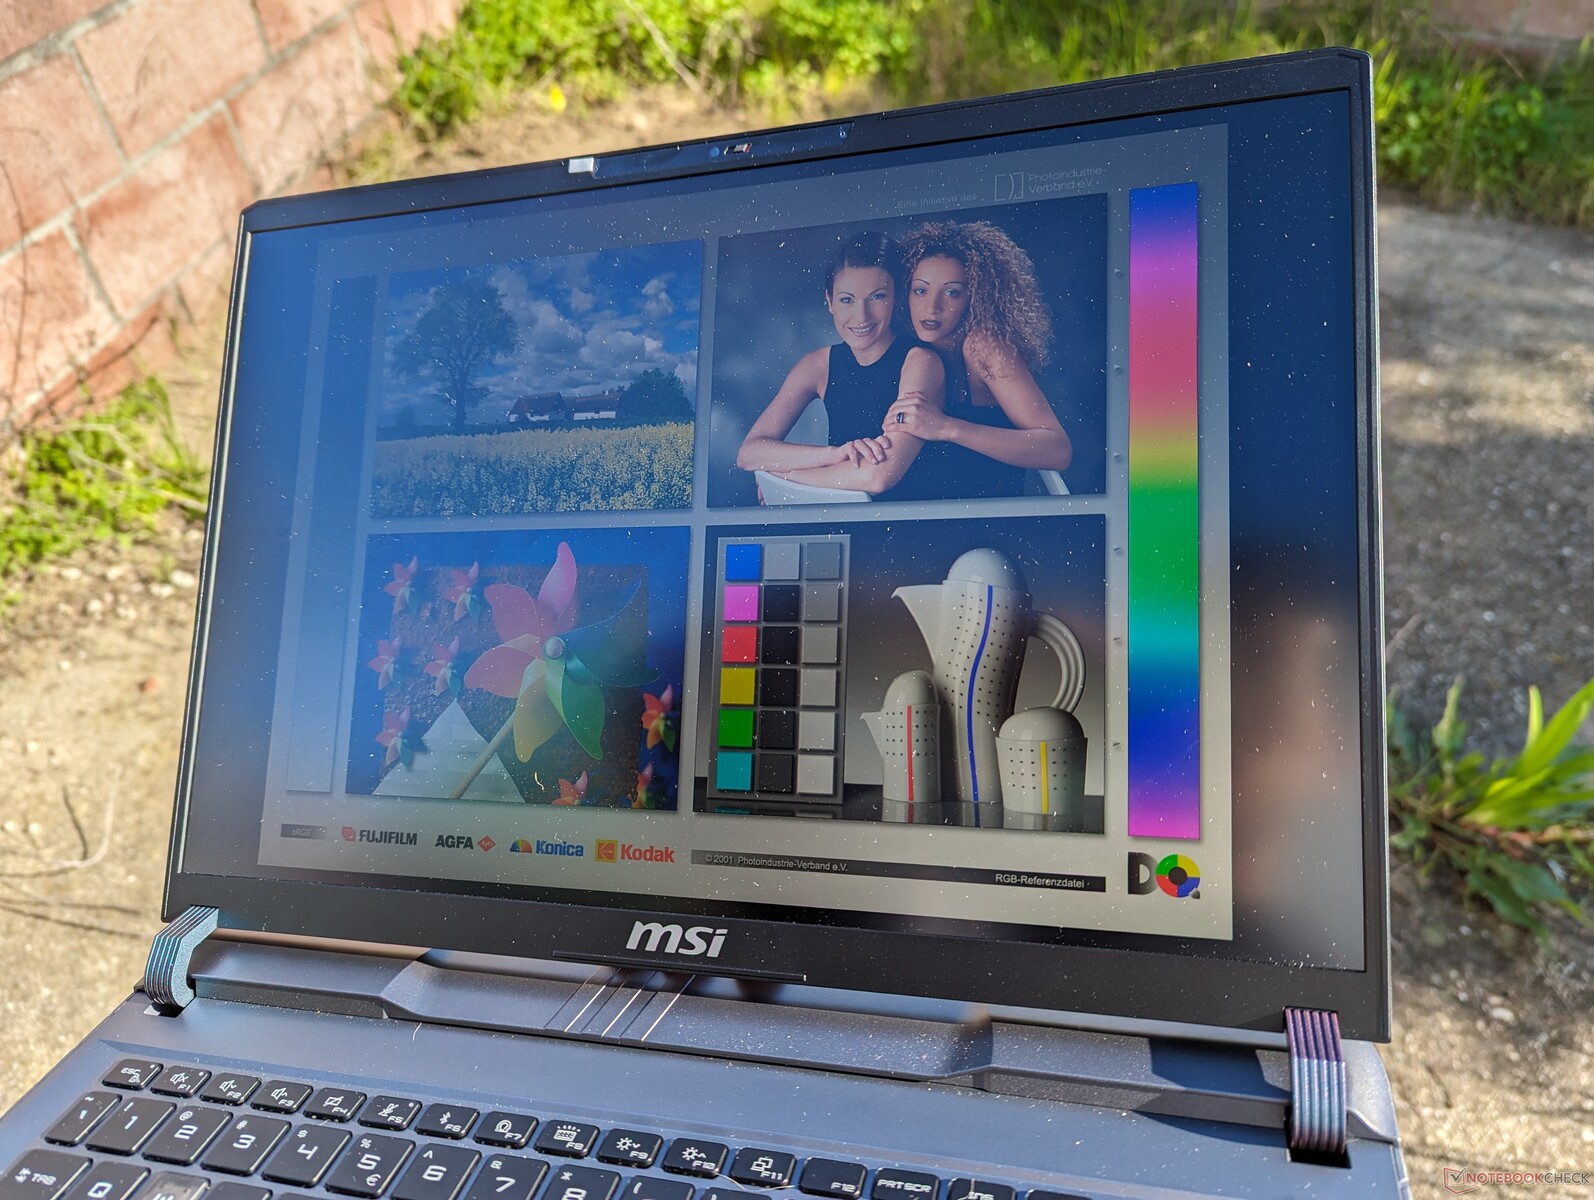
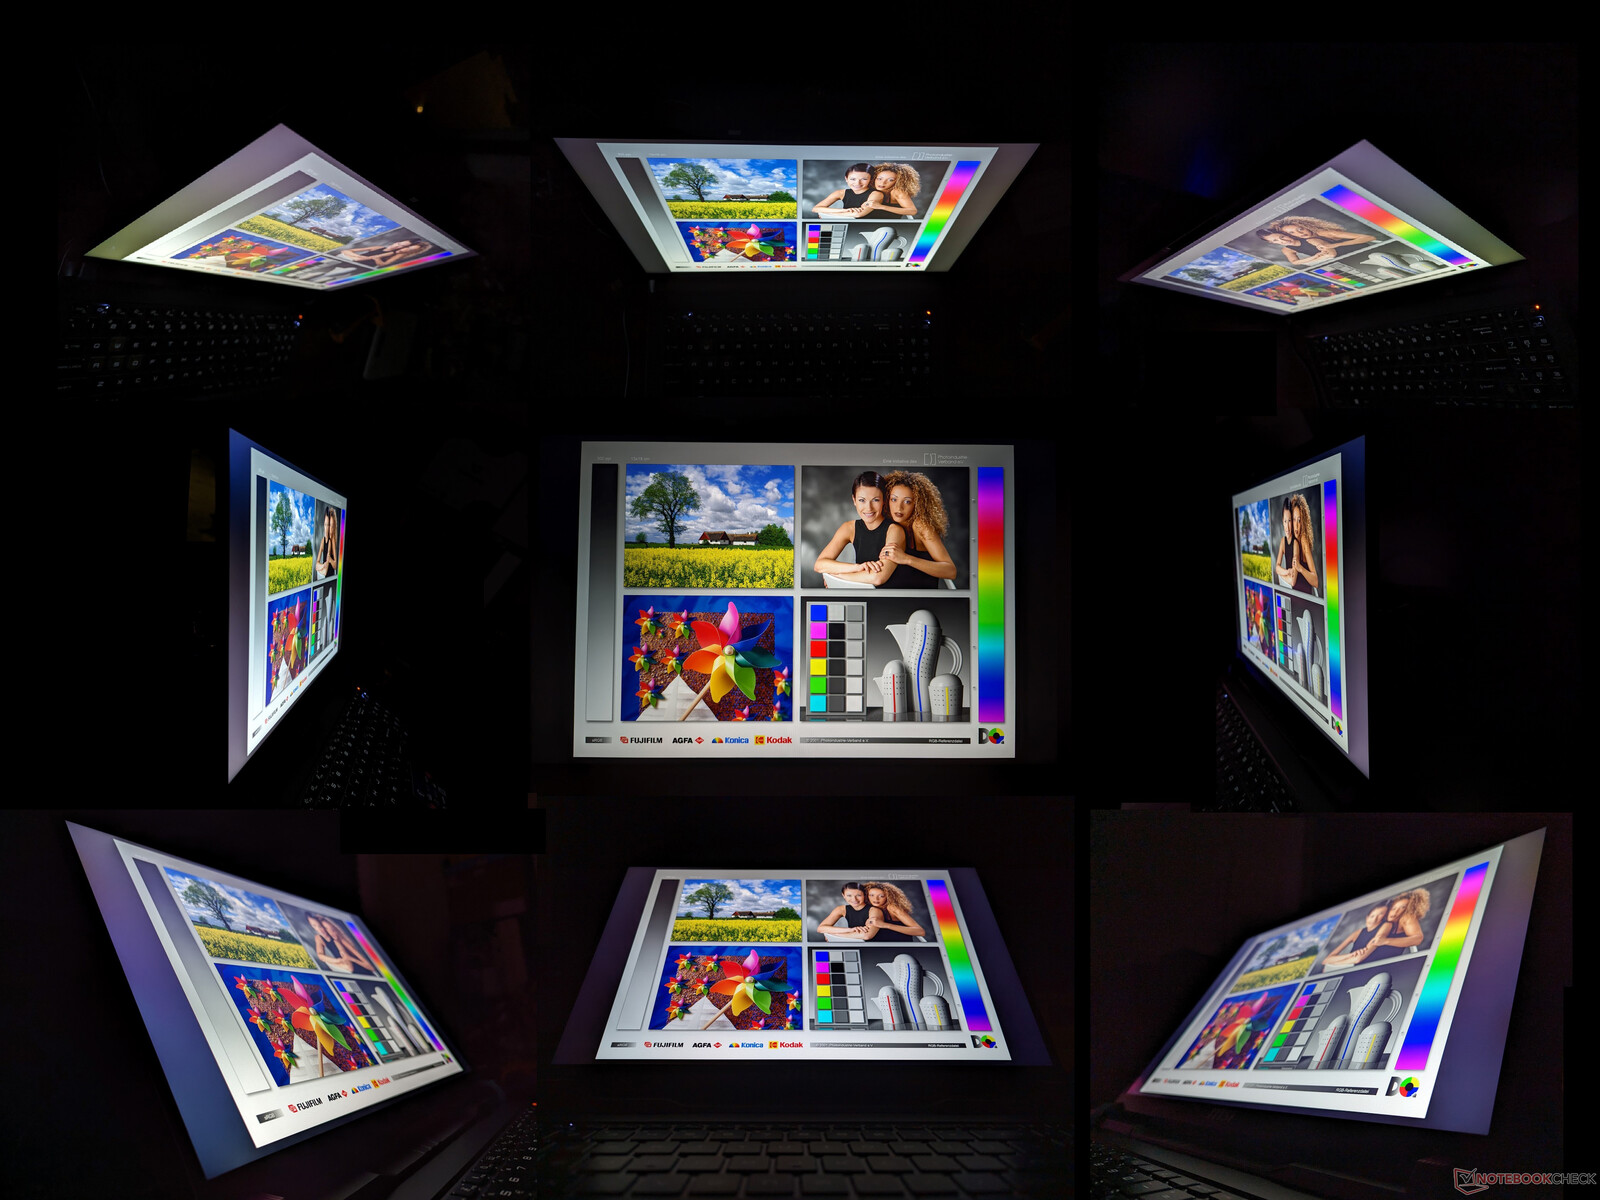
Tela - Toda IPS sem G-Sync
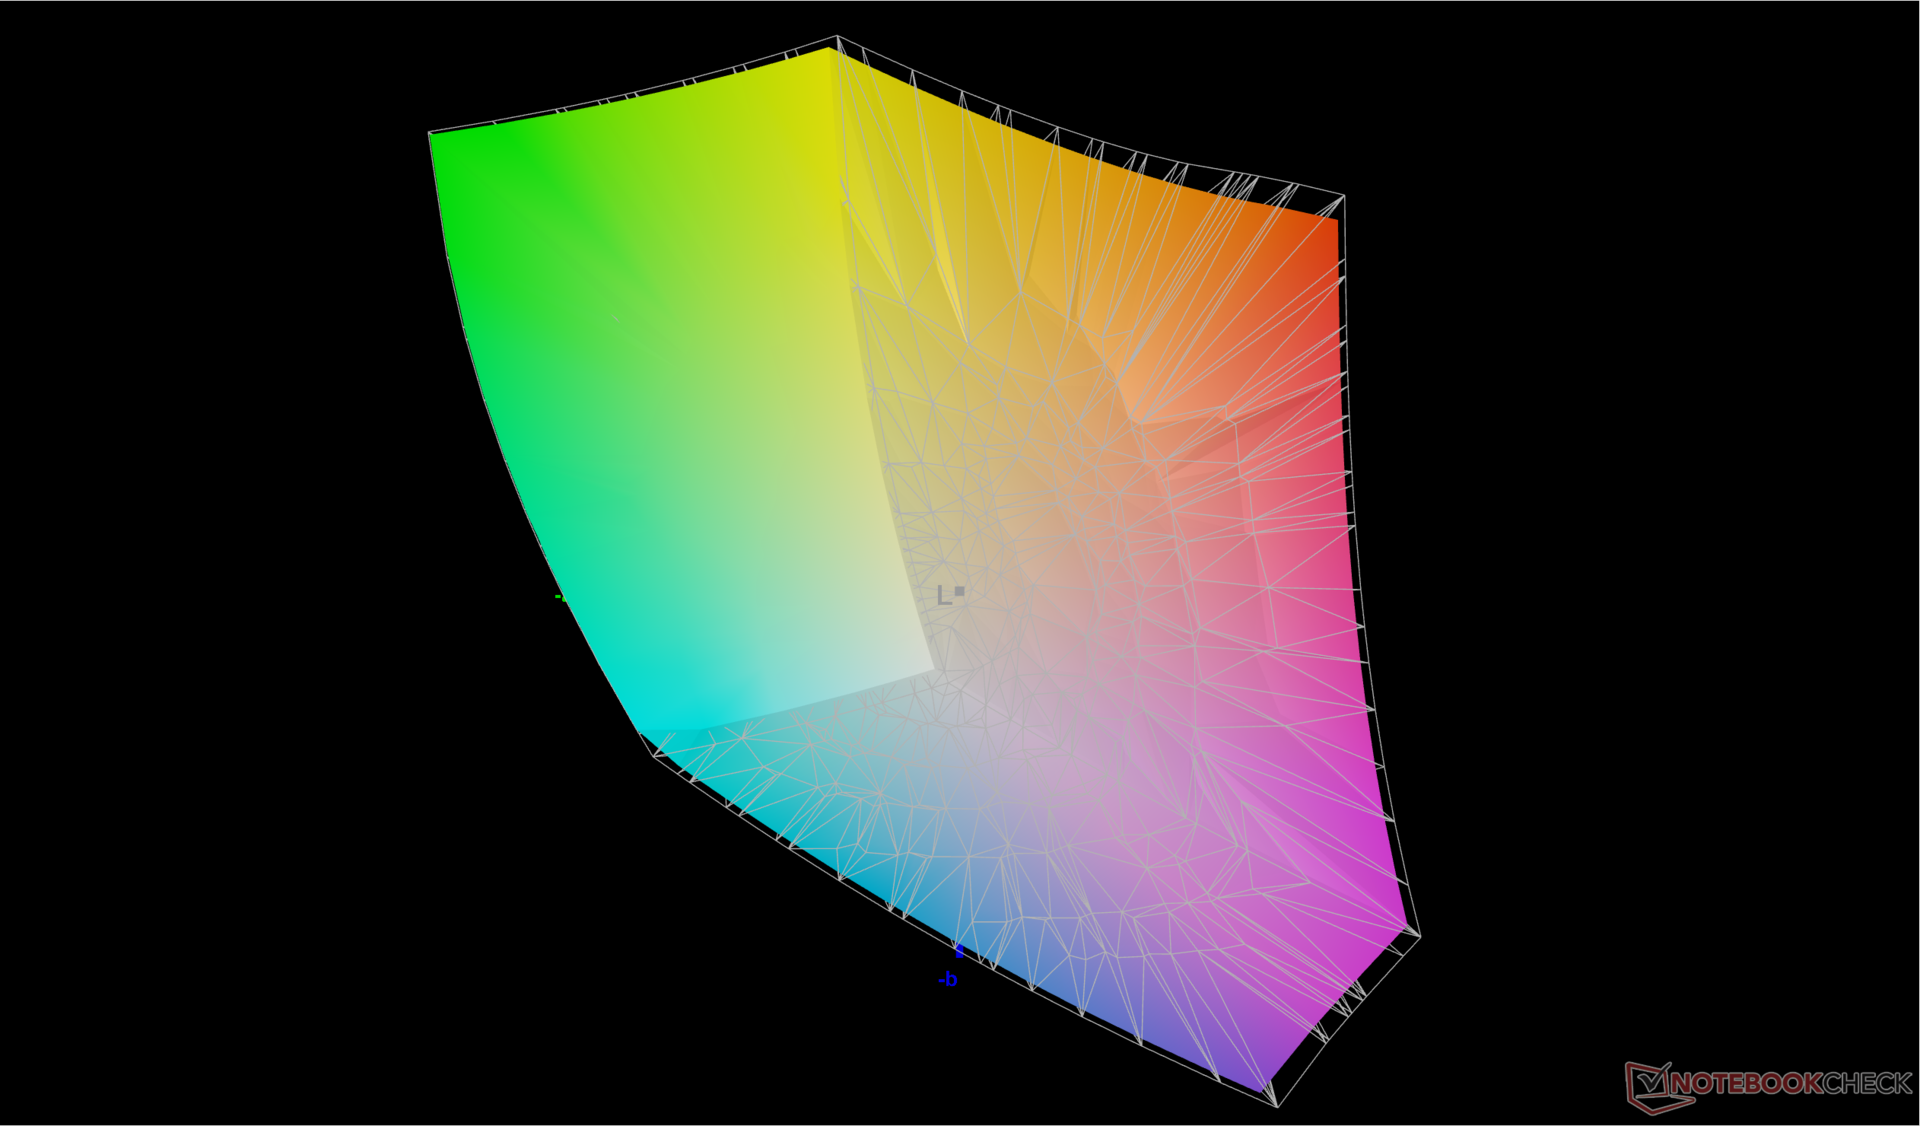
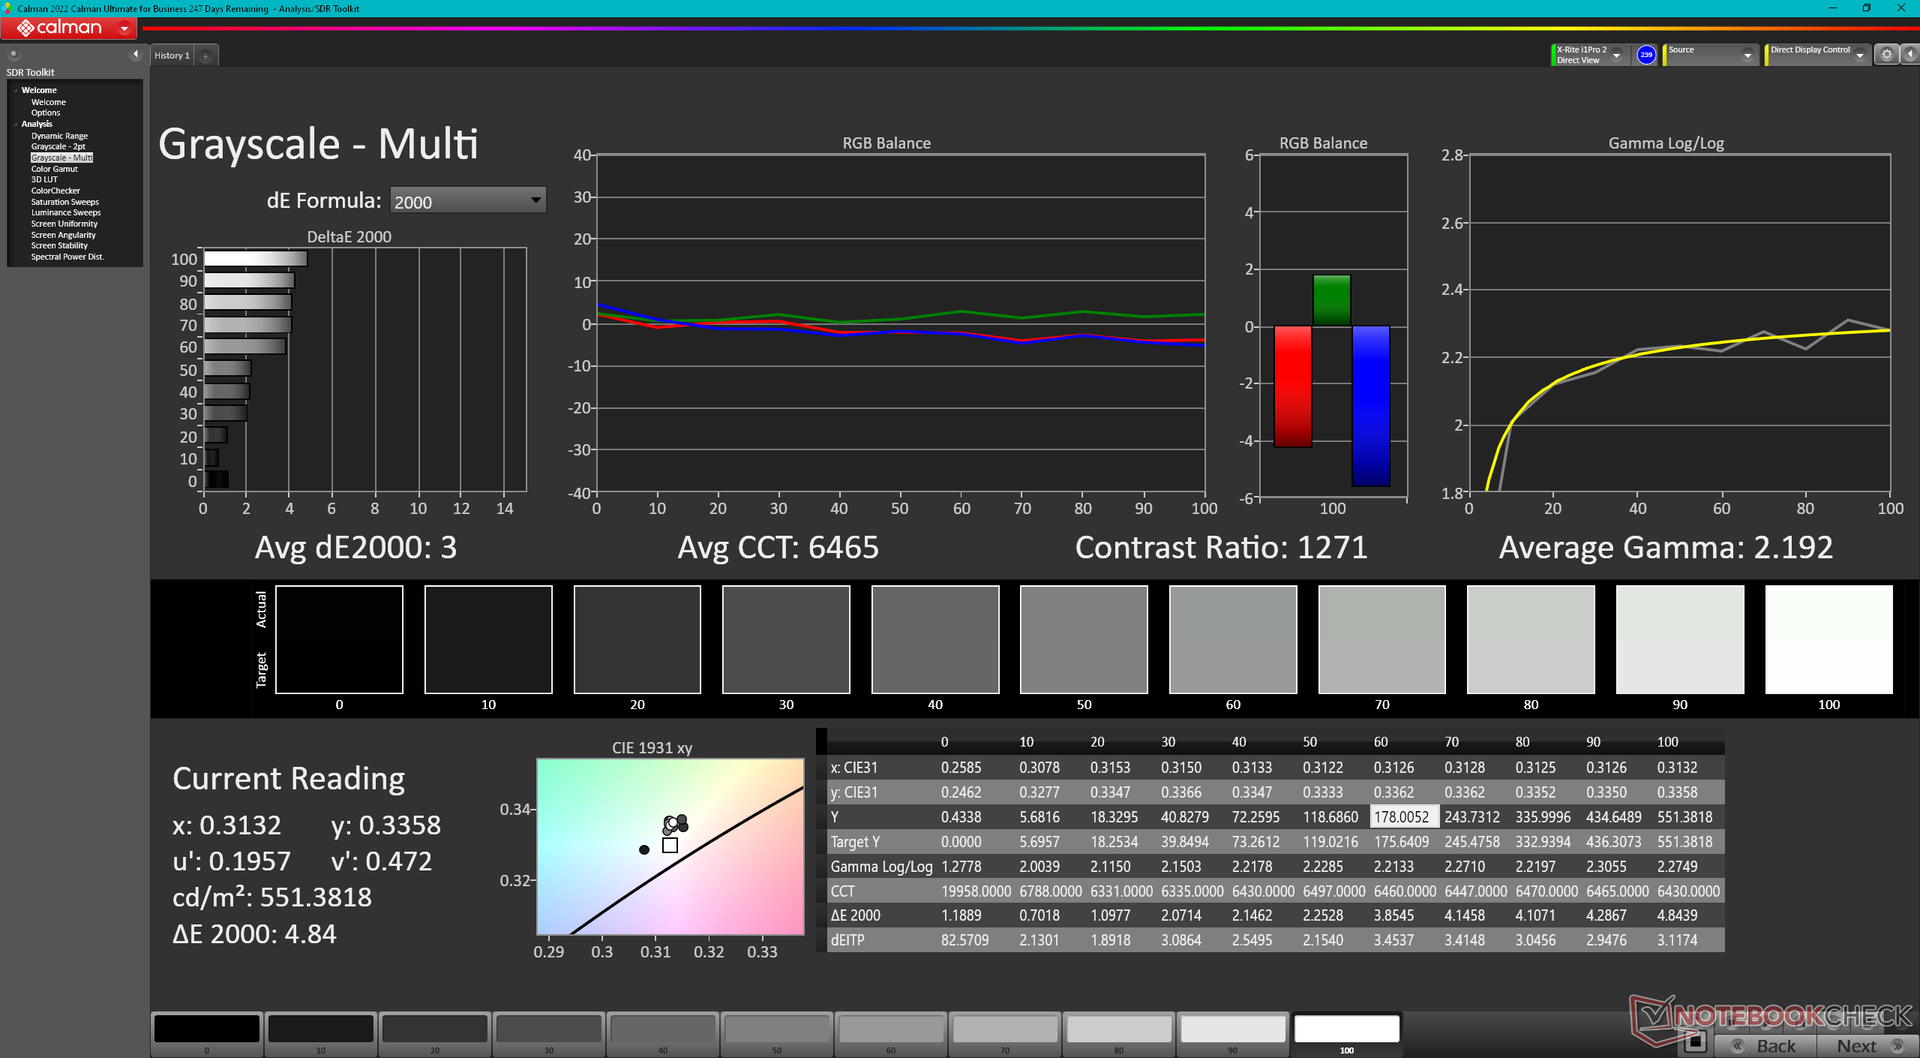
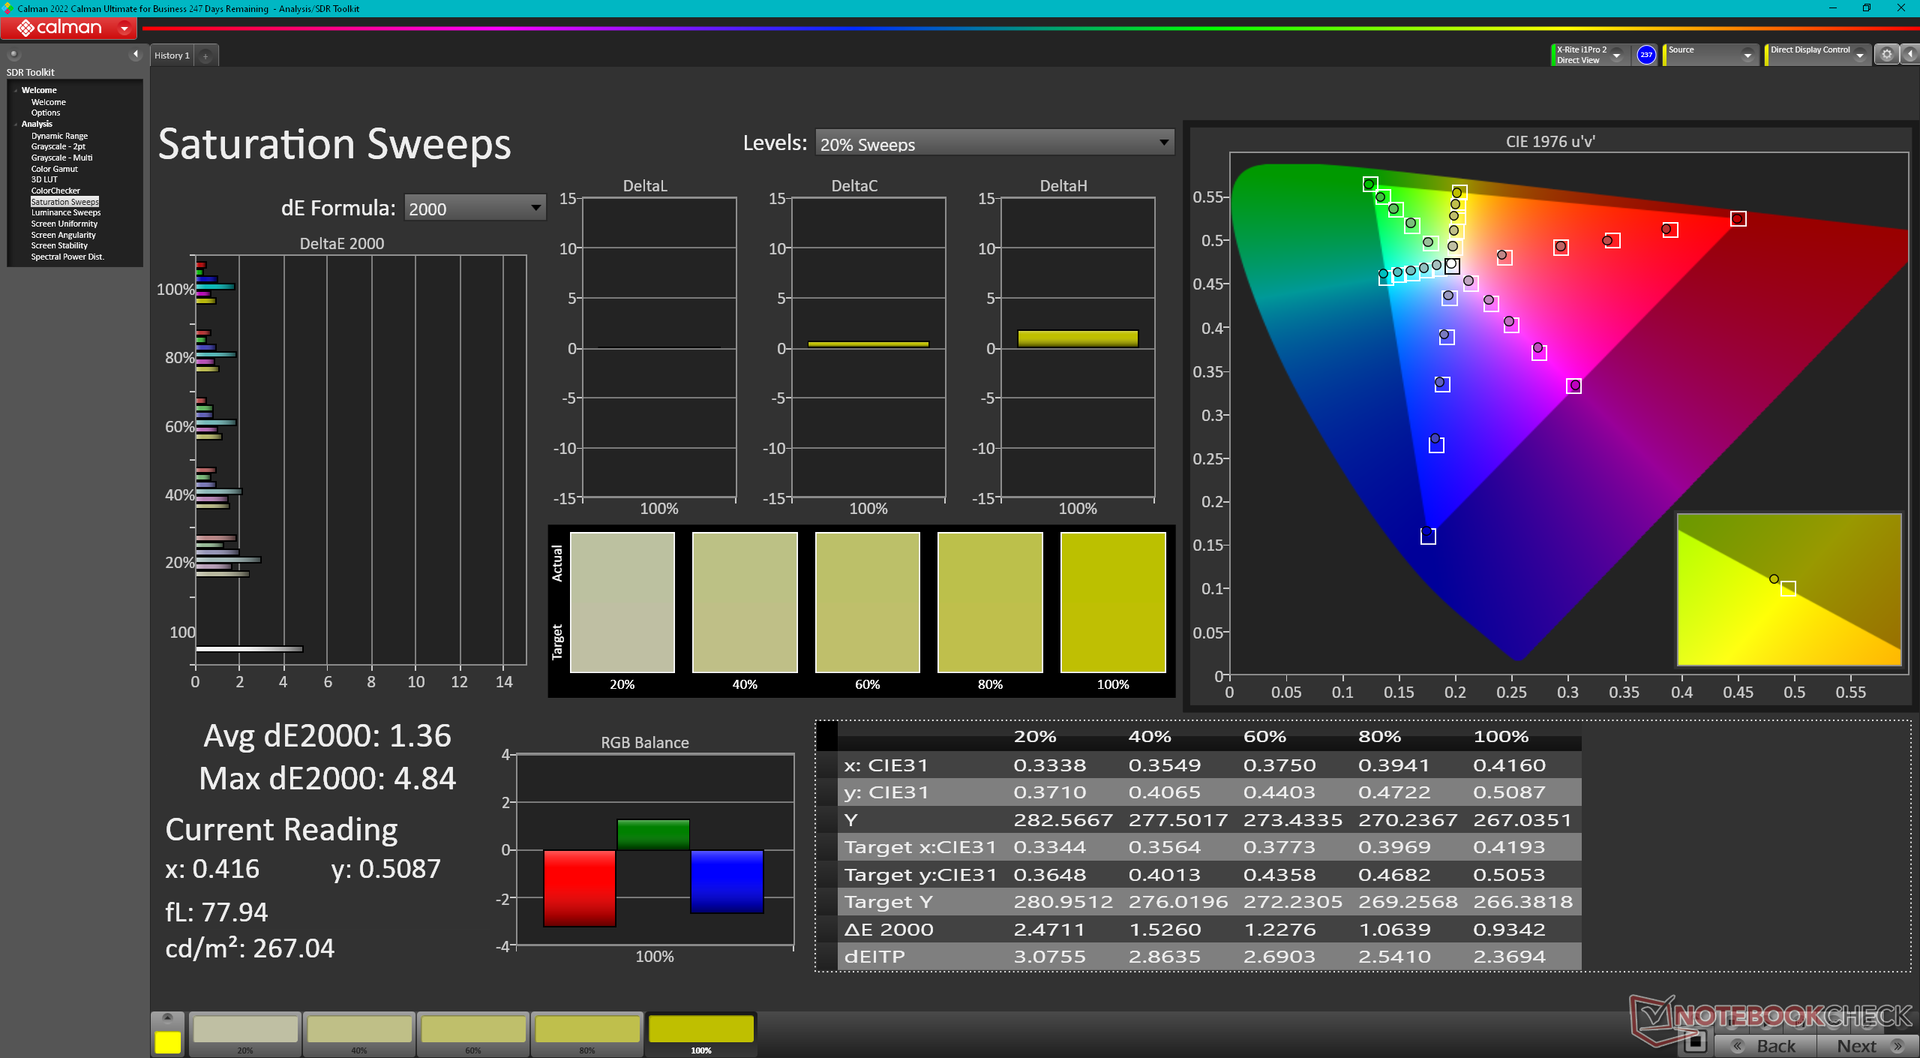
Esse é o primeiro sistema em nosso banco de dados a ser fornecido com o painel Chi Mei N160GME-GTB de alta qualidade. Suas propriedades são muito semelhantes às do NE160QDM-NZ3, conforme encontrado na recente Lenovo Legion 5 16 mas com uma melhoria notável: cobertura completa de DCI-P3 em vez de apenas sRGB. Fora isso, os usuários podem esperar a mesma taxa de atualização nativa de 240 Hz, taxa de contraste de ~1300:1 e tempos de resposta rápidos da máquina da Lenovo.
O G-Sync está notavelmente ausente em todas as configurações atuais do Vector 16 HX. A taxa de atualização também é fixa em 60 Hz ou 240 Hz, enquanto os painéis com taxa de atualização variável estão se tornando comuns.
Lembre-se de que a configuração mais barata de 1200p 144 Hz provavelmente terá atributos diferentes da nossa configuração de 1600p 240 Hz em termos de brilho, cores e muito mais.

| |||||||||||||||||||||||||
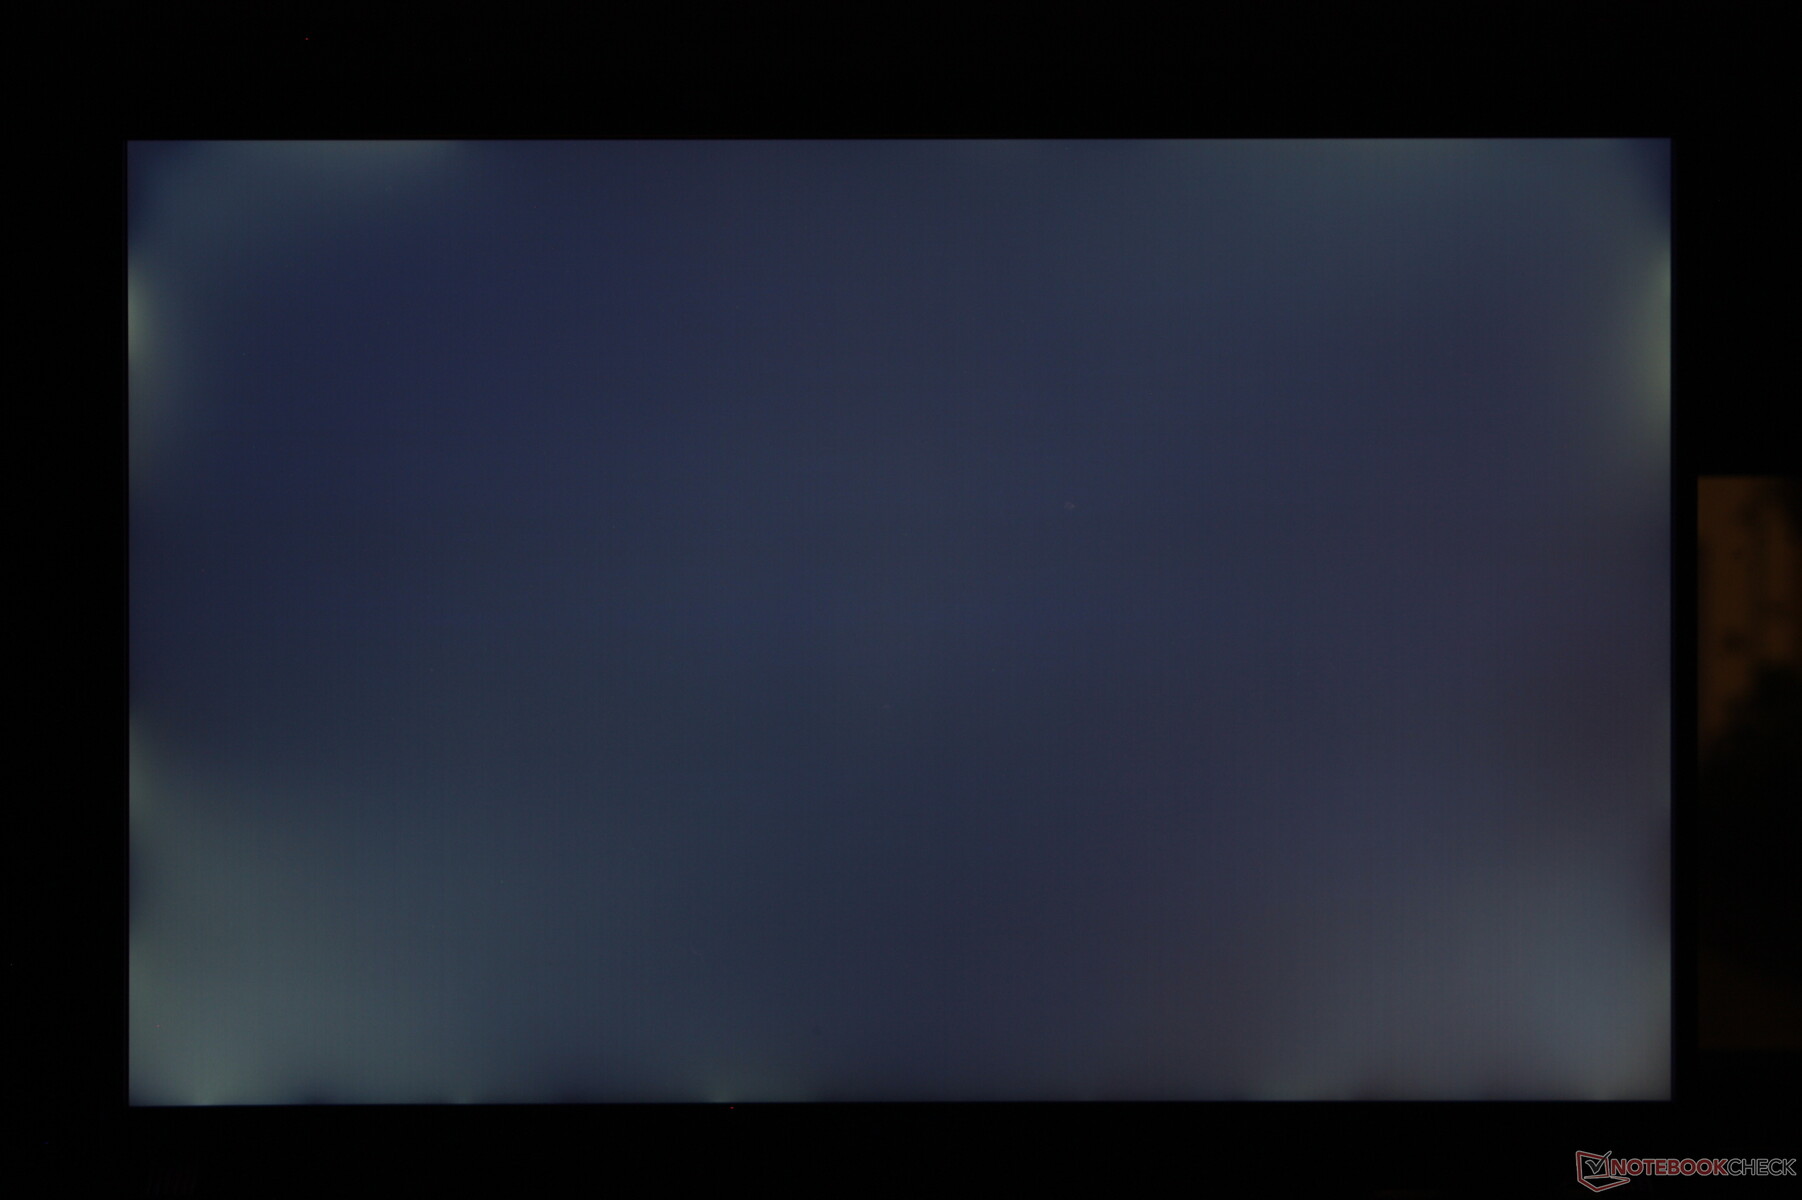
iluminação: 83 %
iluminação com acumulador: 557.2 cd/m²
Contraste: 1359:1 (Preto: 0.41 cd/m²)
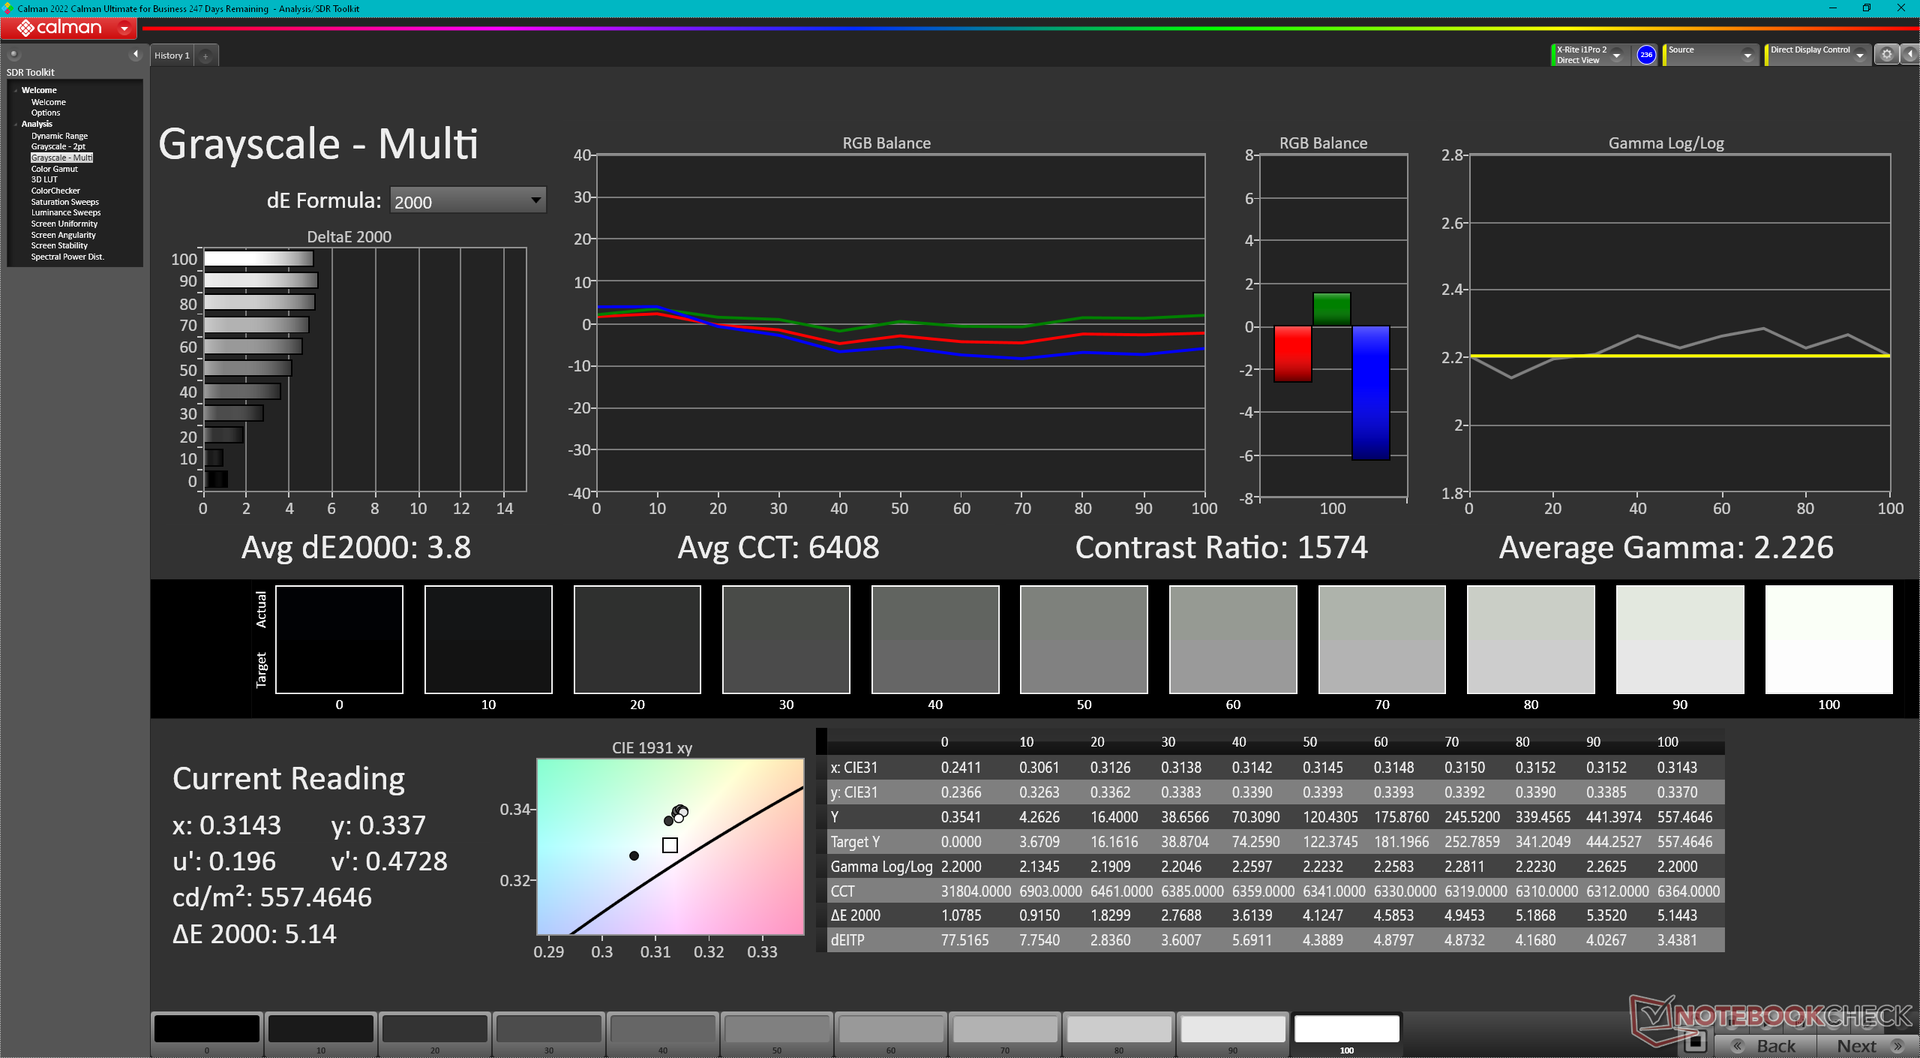
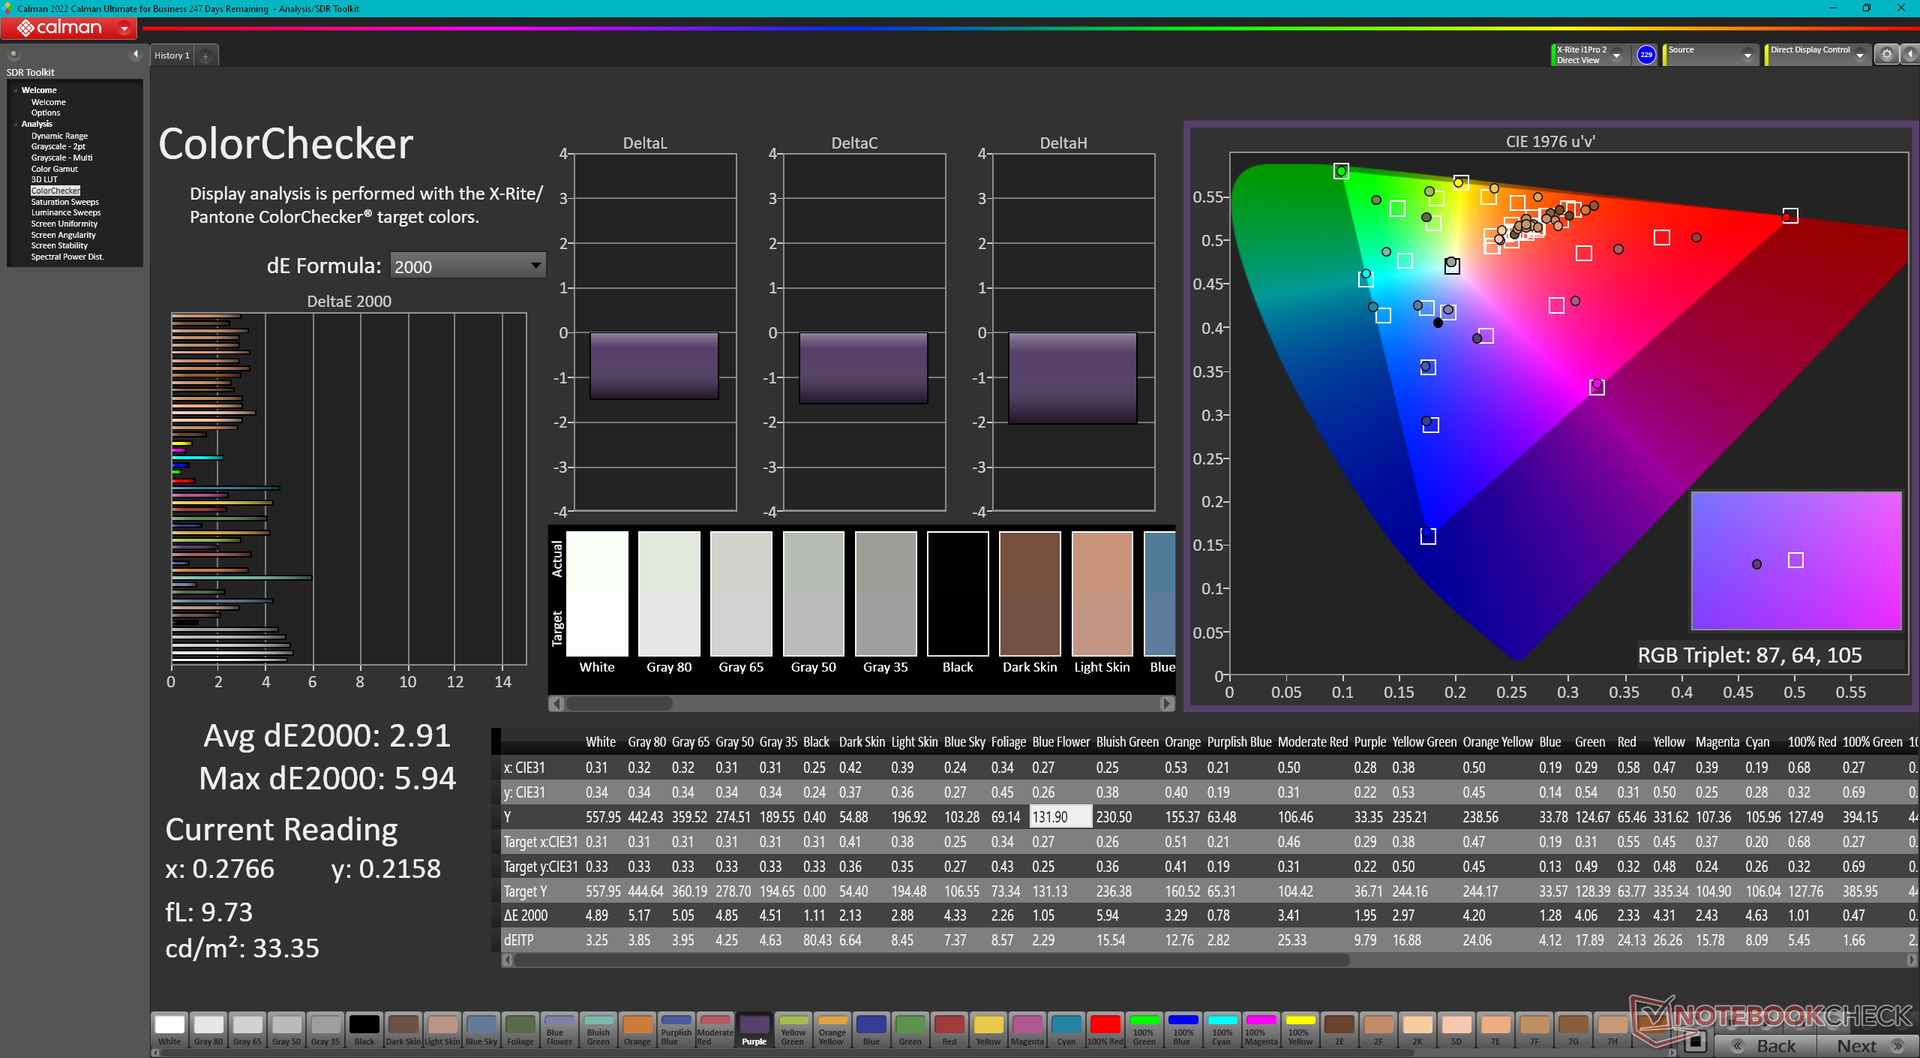
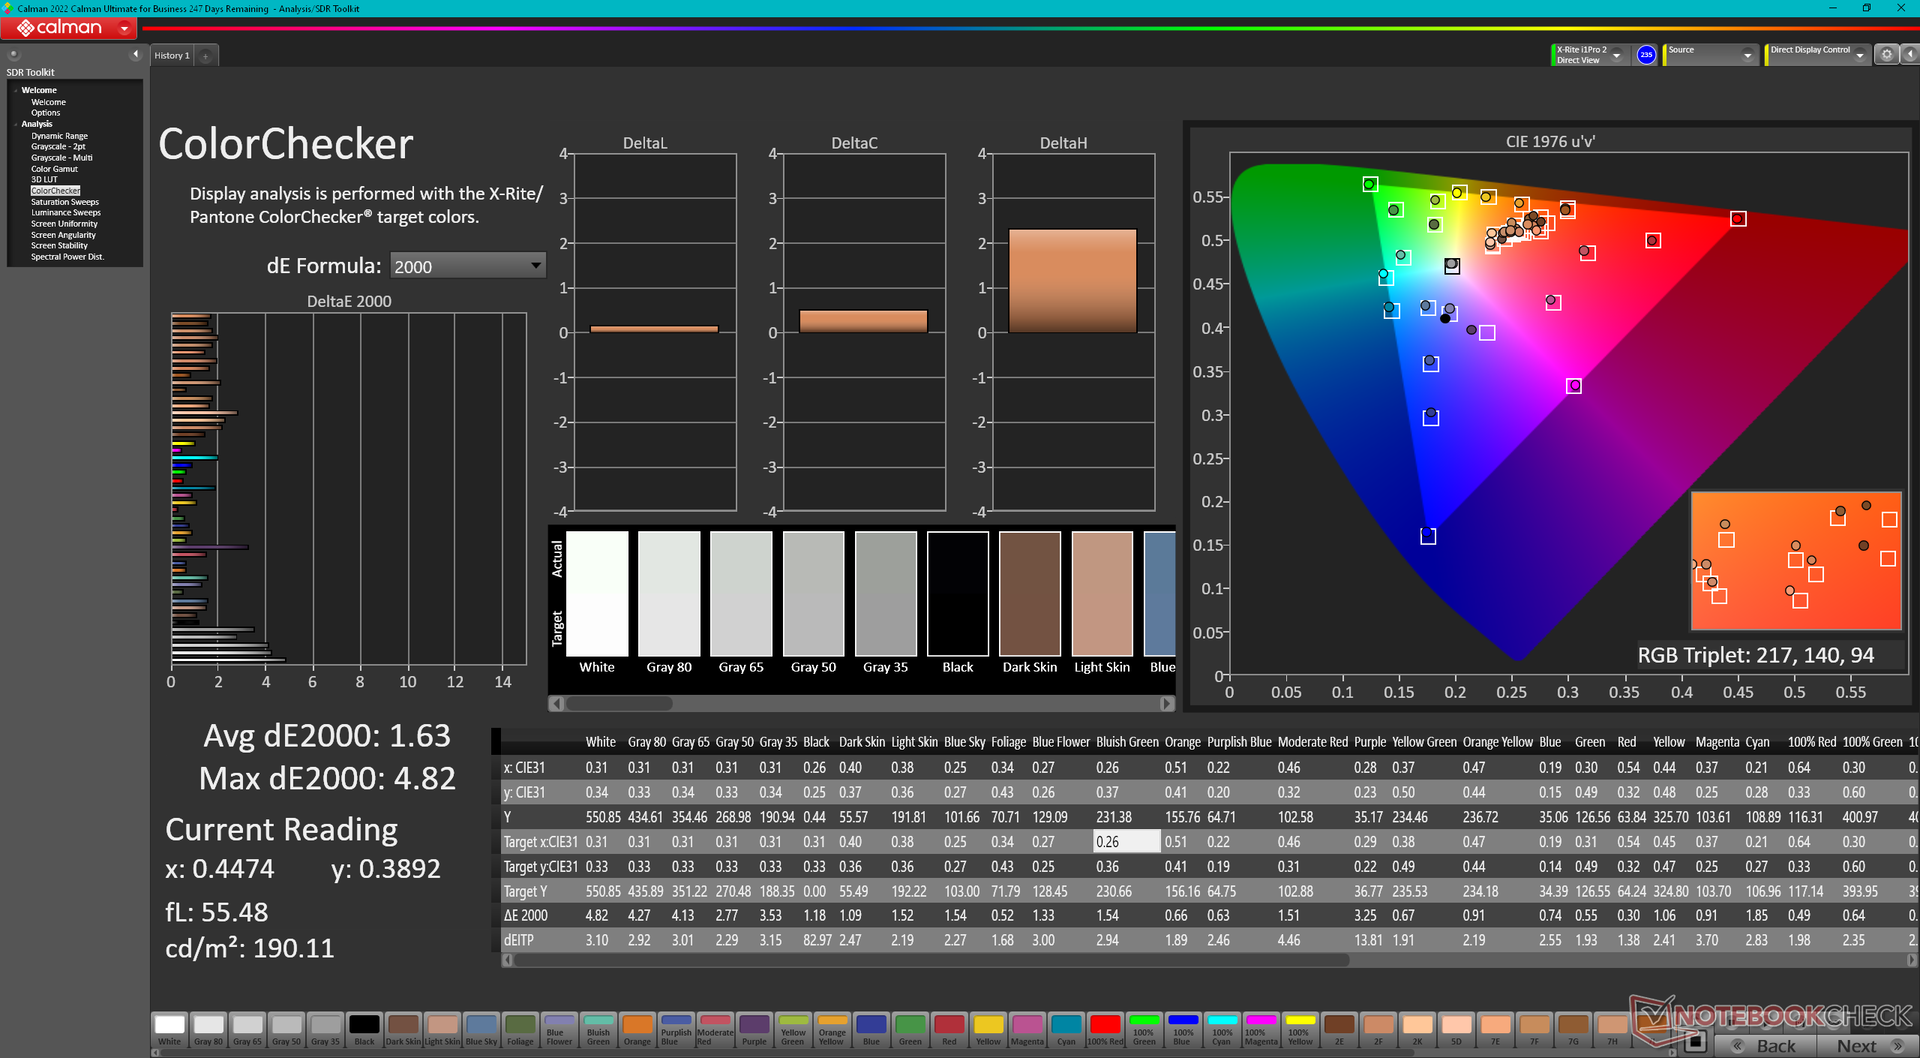
ΔE ColorChecker Calman: 2.91 | ∀{0.5-29.43 Ø4.71}
calibrated: 1.63
ΔE Greyscale Calman: 3.8 | ∀{0.09-98 Ø4.96}
85.4% AdobeRGB 1998 (Argyll 3D)
99.7% sRGB (Argyll 3D)
95.4% Display P3 (Argyll 3D)
Gamma: 2.23
CCT: 6408 K
| MSI Vector 16 HX A14V Chi Mei N160GME-GTB, IPS, 2560x1600, 16" | MSI Vector GP66 12UGS BOE NE156FHM-NZ3, IPS, 1920x1080, 15.6" | Lenovo Legion 5 16IRX G9 NE160QDM-NZ3, IPS, 2560x1600, 16" | HP Victus 16-r0077ng CMN162D, IPS, 1920x1080, 16.1" | Asus TUF Gaming A16 FA617XS BOE NE160WUM-NX2, IPS, 1920x1200, 16" | Dell G16 7620 BOE NE16QDM, IPS, 2560x1600, 16" | |
|---|---|---|---|---|---|---|
| Display | -14% | -12% | -17% | -15% | -16% | |
| Display P3 Coverage (%) | 95.4 | 70.1 -27% | 72.4 -24% | 66.7 -30% | 69.3 -27% | 68.3 -28% |
| sRGB Coverage (%) | 99.7 | 99.5 0% | 100 0% | 98 -2% | 97.3 -2% | 98 -2% |
| AdobeRGB 1998 Coverage (%) | 85.4 | 72.1 -16% | 74.1 -13% | 69 -19% | 70.7 -17% | 70.5 -17% |
| Response Times | 7% | -48% | -53% | -81% | -21% | |
| Response Time Grey 50% / Grey 80% * (ms) | 5.7 ? | 5.8 ? -2% | 12.5 ? -119% | 13.3 ? -133% | 15.6 ? -174% | 8.6 ? -51% |
| Response Time Black / White * (ms) | 11.4 ? | 9.6 ? 16% | 8.7 ? 24% | 8.2 ? 28% | 10 ? 12% | 10.4 ? 9% |
| PWM Frequency (Hz) | ||||||
| Screen | -3% | 29% | 17% | 13% | 5% | |
| Brightness middle (cd/m²) | 557.2 | 353.1 -37% | 526 -6% | 308 -45% | 301 -46% | 369.4 -34% |
| Brightness (cd/m²) | 506 | 325 -36% | 500 -1% | 285 -44% | 294 -42% | 348 -31% |
| Brightness Distribution (%) | 83 | 85 2% | 87 5% | 85 2% | 94 13% | 83 0% |
| Black Level * (cd/m²) | 0.41 | 0.38 7% | 0.33 20% | 0.25 39% | 0.21 49% | 0.32 22% |
| Contrast (:1) | 1359 | 929 -32% | 1594 17% | 1232 -9% | 1433 5% | 1154 -15% |
| Colorchecker dE 2000 * | 2.91 | 2.24 23% | 1.2 59% | 1.3 55% | 1.79 38% | 1.78 39% |
| Colorchecker dE 2000 max. * | 5.94 | 5 16% | 2.1 65% | 2.76 54% | 3.48 41% | 4.41 26% |
| Colorchecker dE 2000 calibrated * | 1.63 | 1.02 37% | 1 39% | 0.92 44% | 1.2 26% | 1.22 25% |
| Greyscale dE 2000 * | 3.8 | 4 -5% | 1.3 66% | 1.7 55% | 2.5 34% | 3.2 16% |
| Gamma | 2.23 99% | 2.24 98% | 2.23 99% | 2.167 102% | 2.265 97% | 2.2 100% |
| CCT | 6408 101% | 6864 95% | 6391 102% | 6767 96% | 6157 106% | 6750 96% |
| Média Total (Programa/Configurações) | -3% /
-4% | -10% /
9% | -18% /
-0% | -28% /
-6% | -11% /
-3% |
* ... menor é melhor
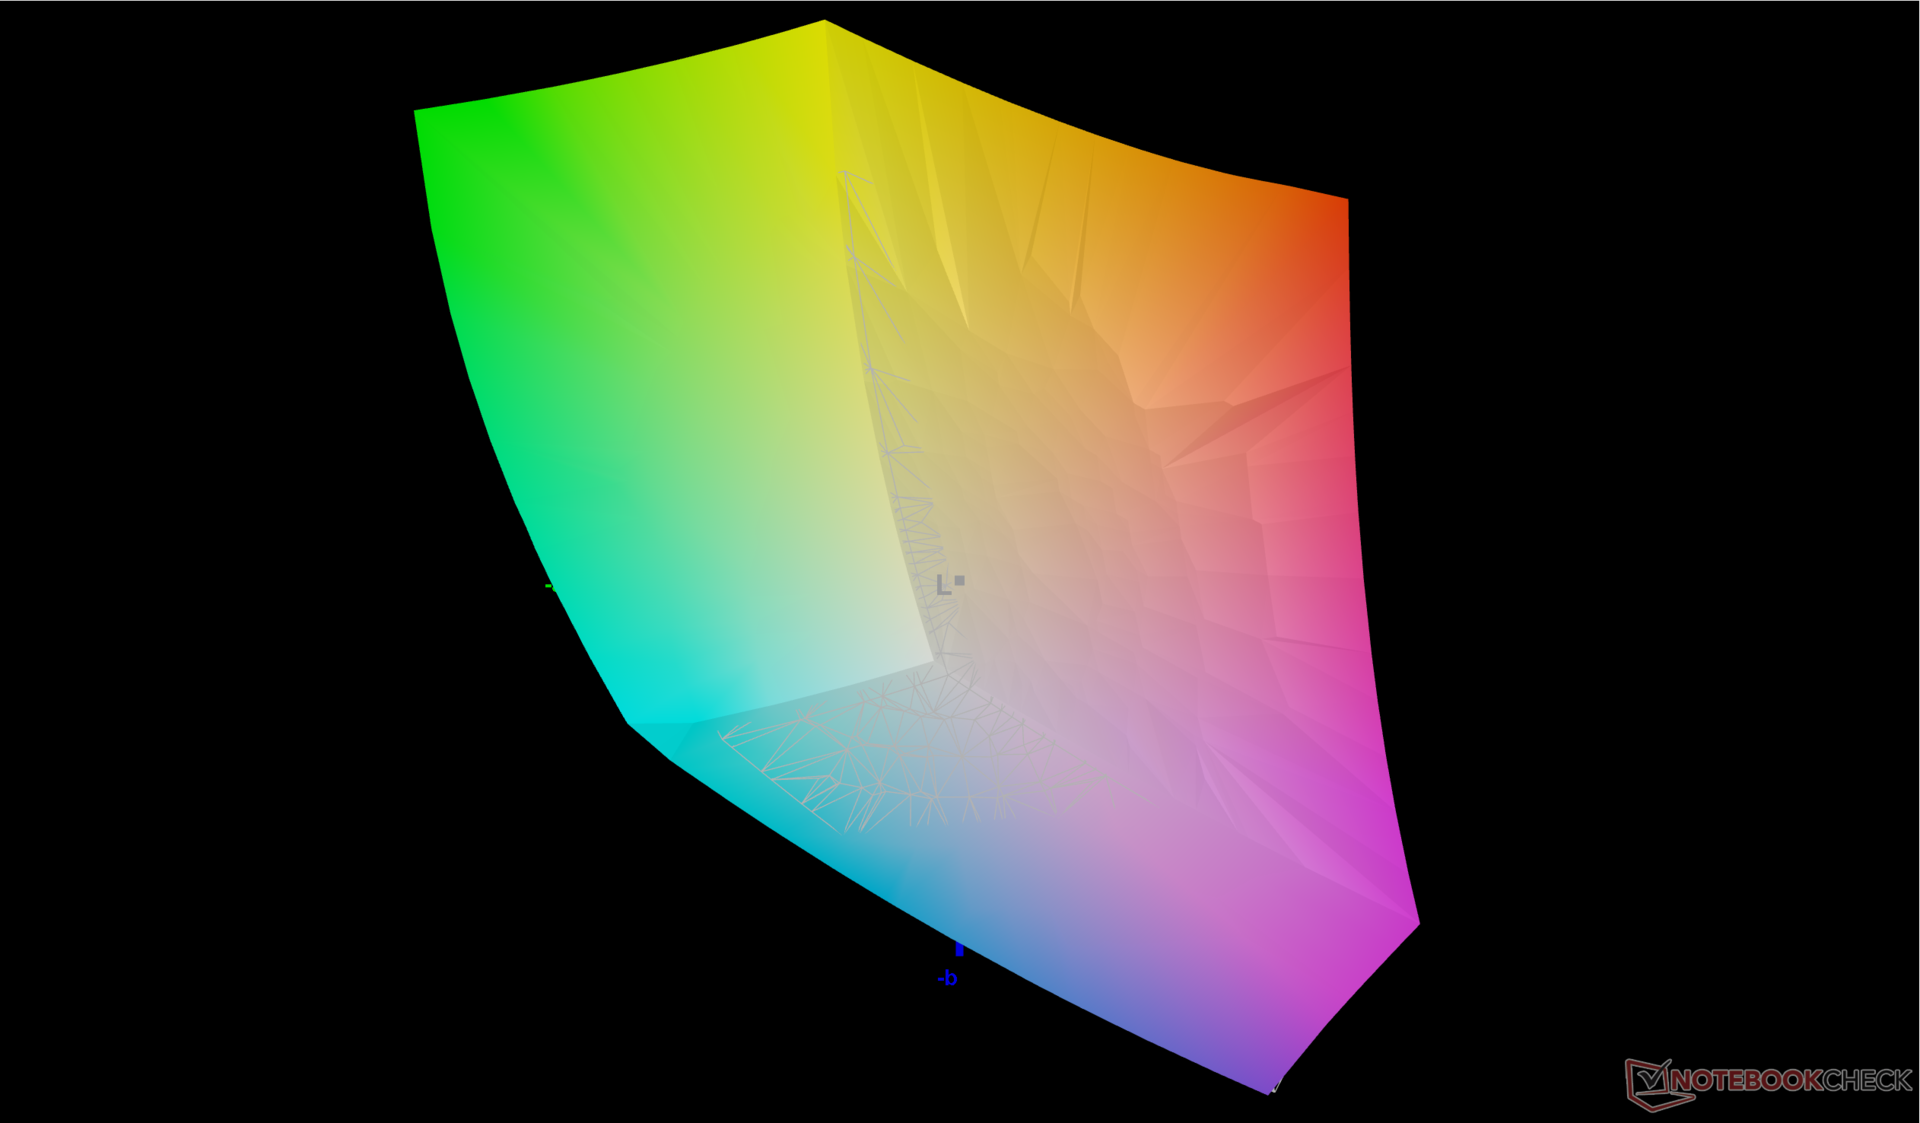
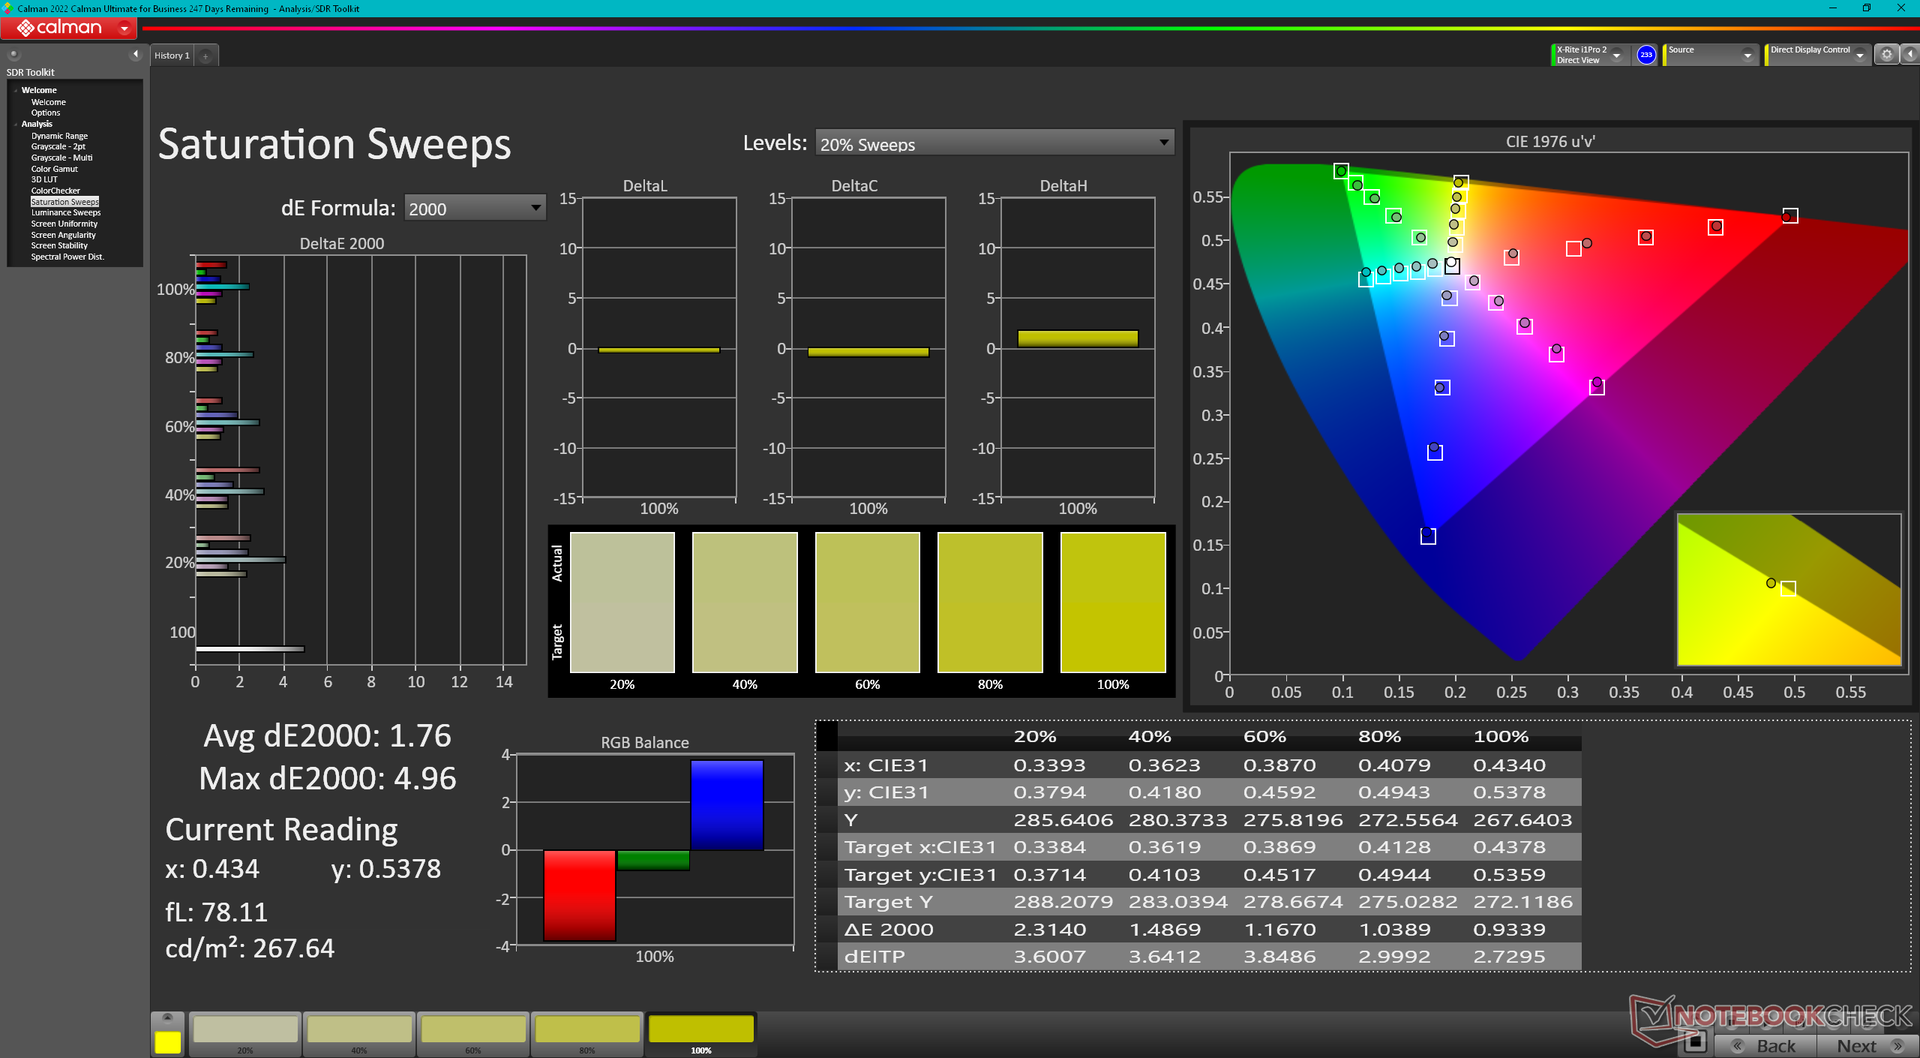
Embora a tela não venha pré-calibrada, suas cores já são relativamente precisas. Os valores médios de deltaE de escala de cinza e cor são de apenas 3,8 e 2,91, respectivamente, em relação ao padrão P3. Nosso perfil ICM calibrado está disponível gratuitamente acima para melhorar a precisão mais próxima do padrão deltaE <2.
Exibir tempos de resposta
| ↔ Tempo de resposta preto para branco | ||
|---|---|---|
| 11.4 ms ... ascensão ↗ e queda ↘ combinadas | ↗ 6.5 ms ascensão | 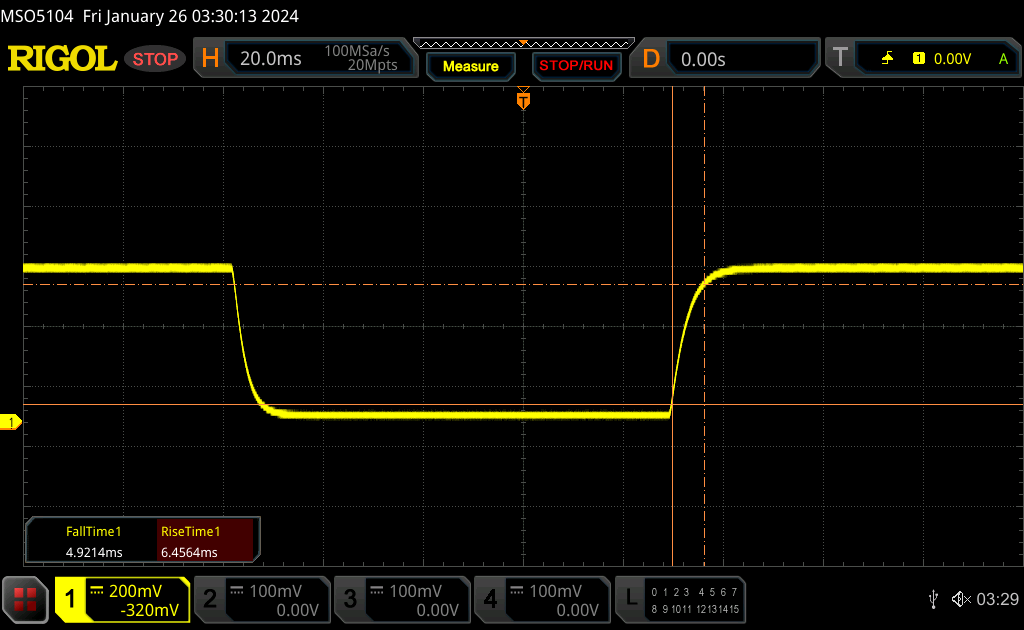 |
| ↘ 4.9 ms queda | ||
| A tela mostra boas taxas de resposta em nossos testes, mas pode ser muito lenta para jogadores competitivos. Em comparação, todos os dispositivos testados variam de 0.1 (mínimo) a 240 (máximo) ms. » 31 % de todos os dispositivos são melhores. Isso significa que o tempo de resposta medido é melhor que a média de todos os dispositivos testados (19.8 ms). | ||
| ↔ Tempo de resposta 50% cinza a 80% cinza | ||
| 5.7 ms ... ascensão ↗ e queda ↘ combinadas | ↗ 2.8 ms ascensão | 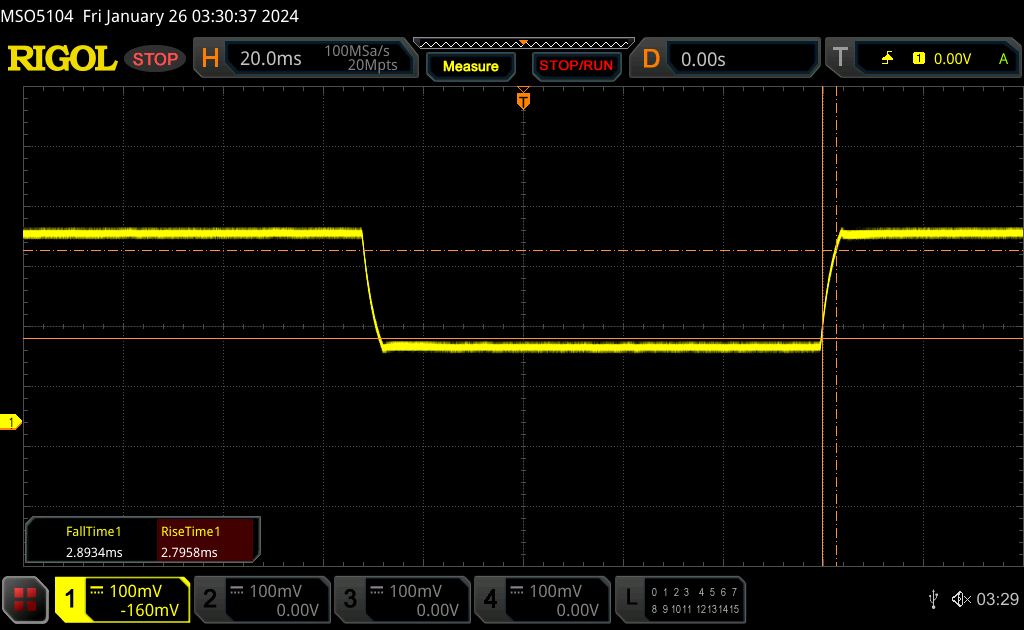 |
| ↘ 2.9 ms queda | ||
| A tela mostra taxas de resposta muito rápidas em nossos testes e deve ser muito adequada para jogos em ritmo acelerado. Em comparação, todos os dispositivos testados variam de 0.165 (mínimo) a 636 (máximo) ms. » 18 % de todos os dispositivos são melhores. Isso significa que o tempo de resposta medido é melhor que a média de todos os dispositivos testados (31 ms). | ||
Cintilação da tela / PWM (modulação por largura de pulso)
| Tela tremeluzindo / PWM não detectado | 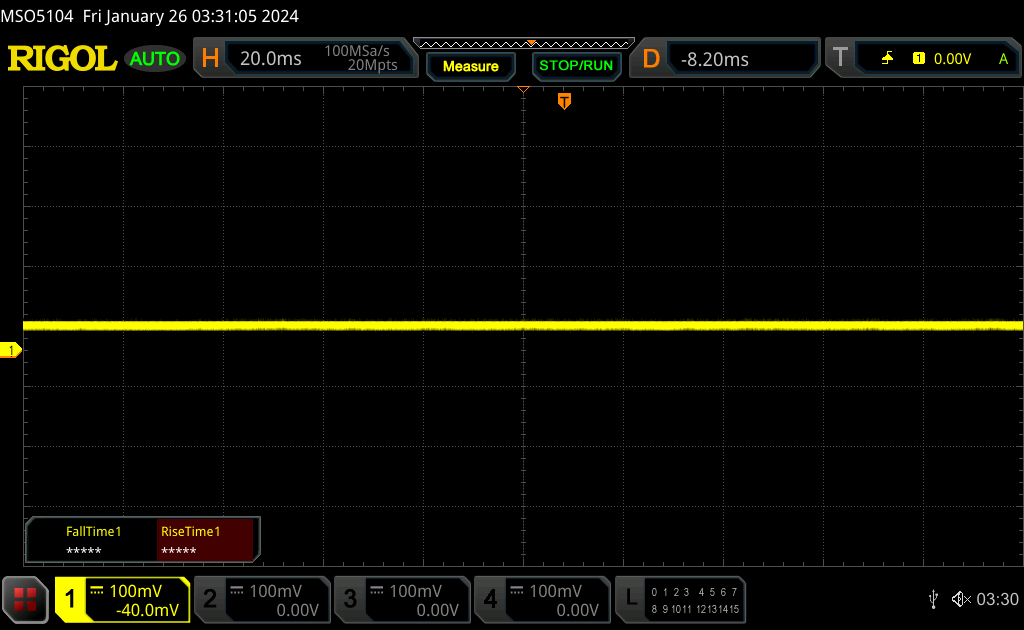 | ||
[pwm_comparison] Em comparação: 52 % de todos os dispositivos testados não usam PWM para escurecer a tela. Se PWM foi detectado, uma média de 7757 (mínimo: 5 - máximo: 343500) Hz foi medida. | |||
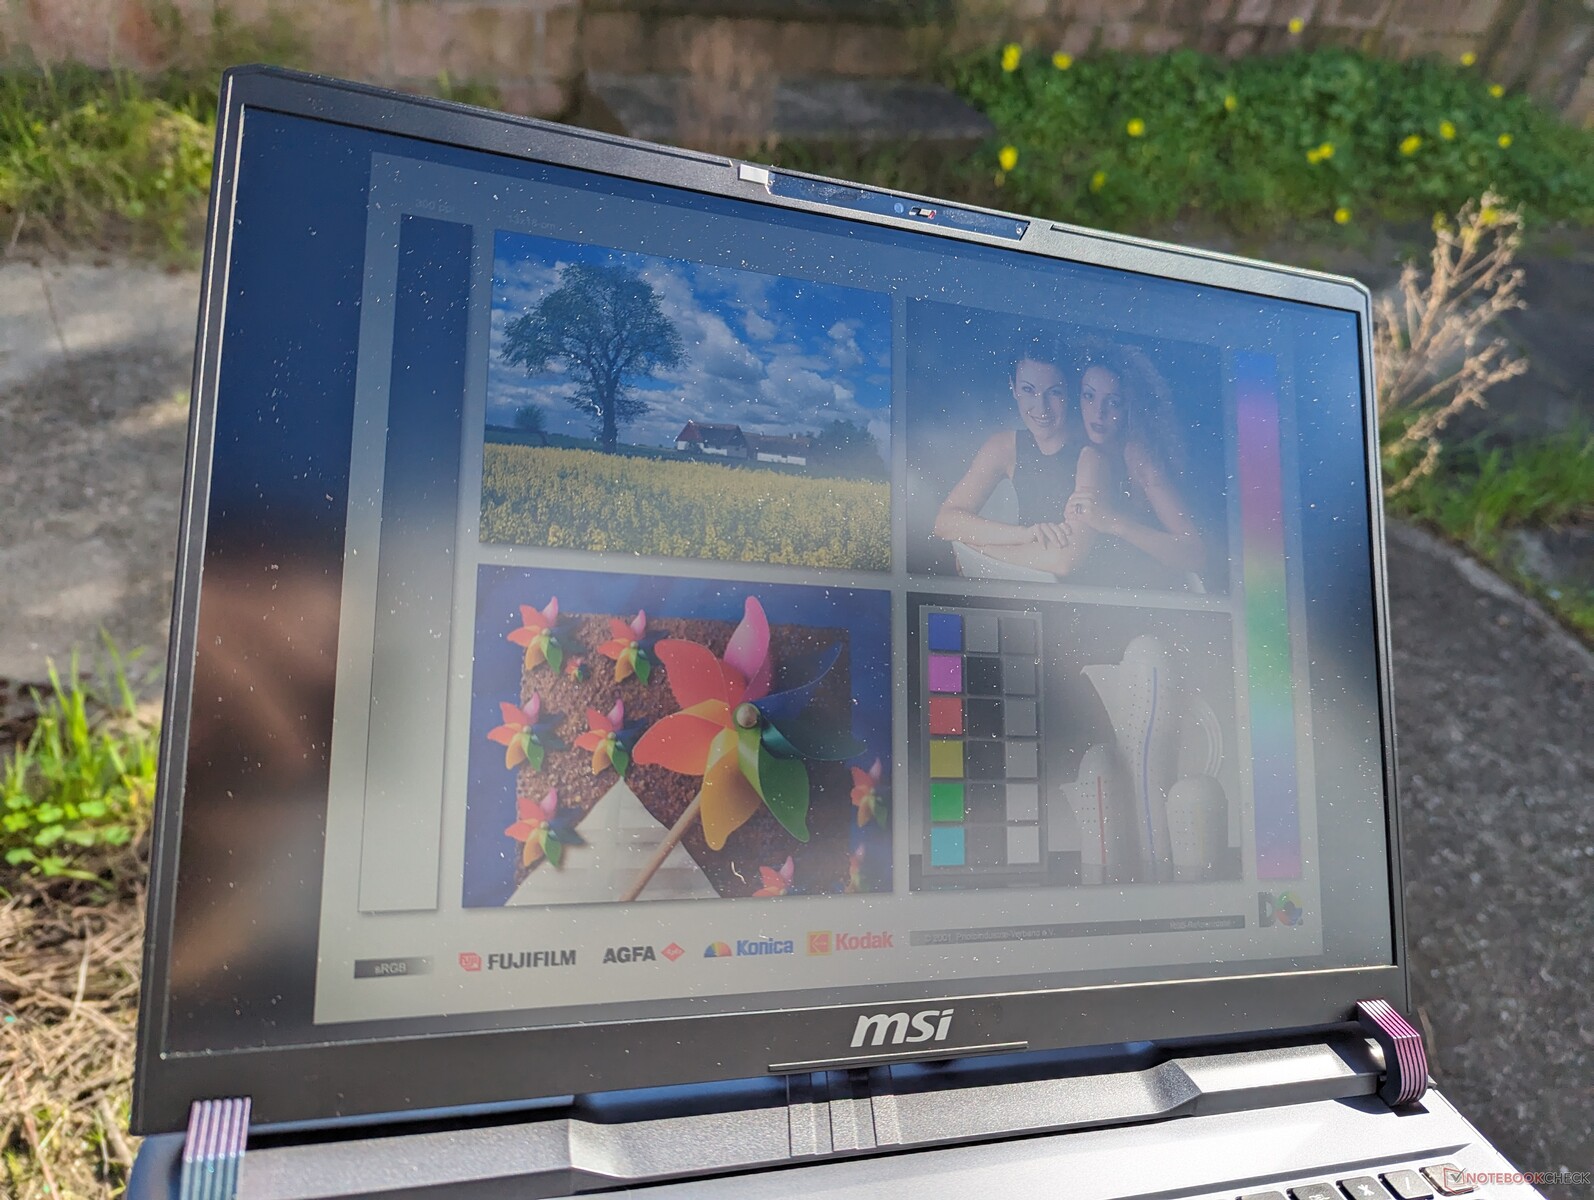
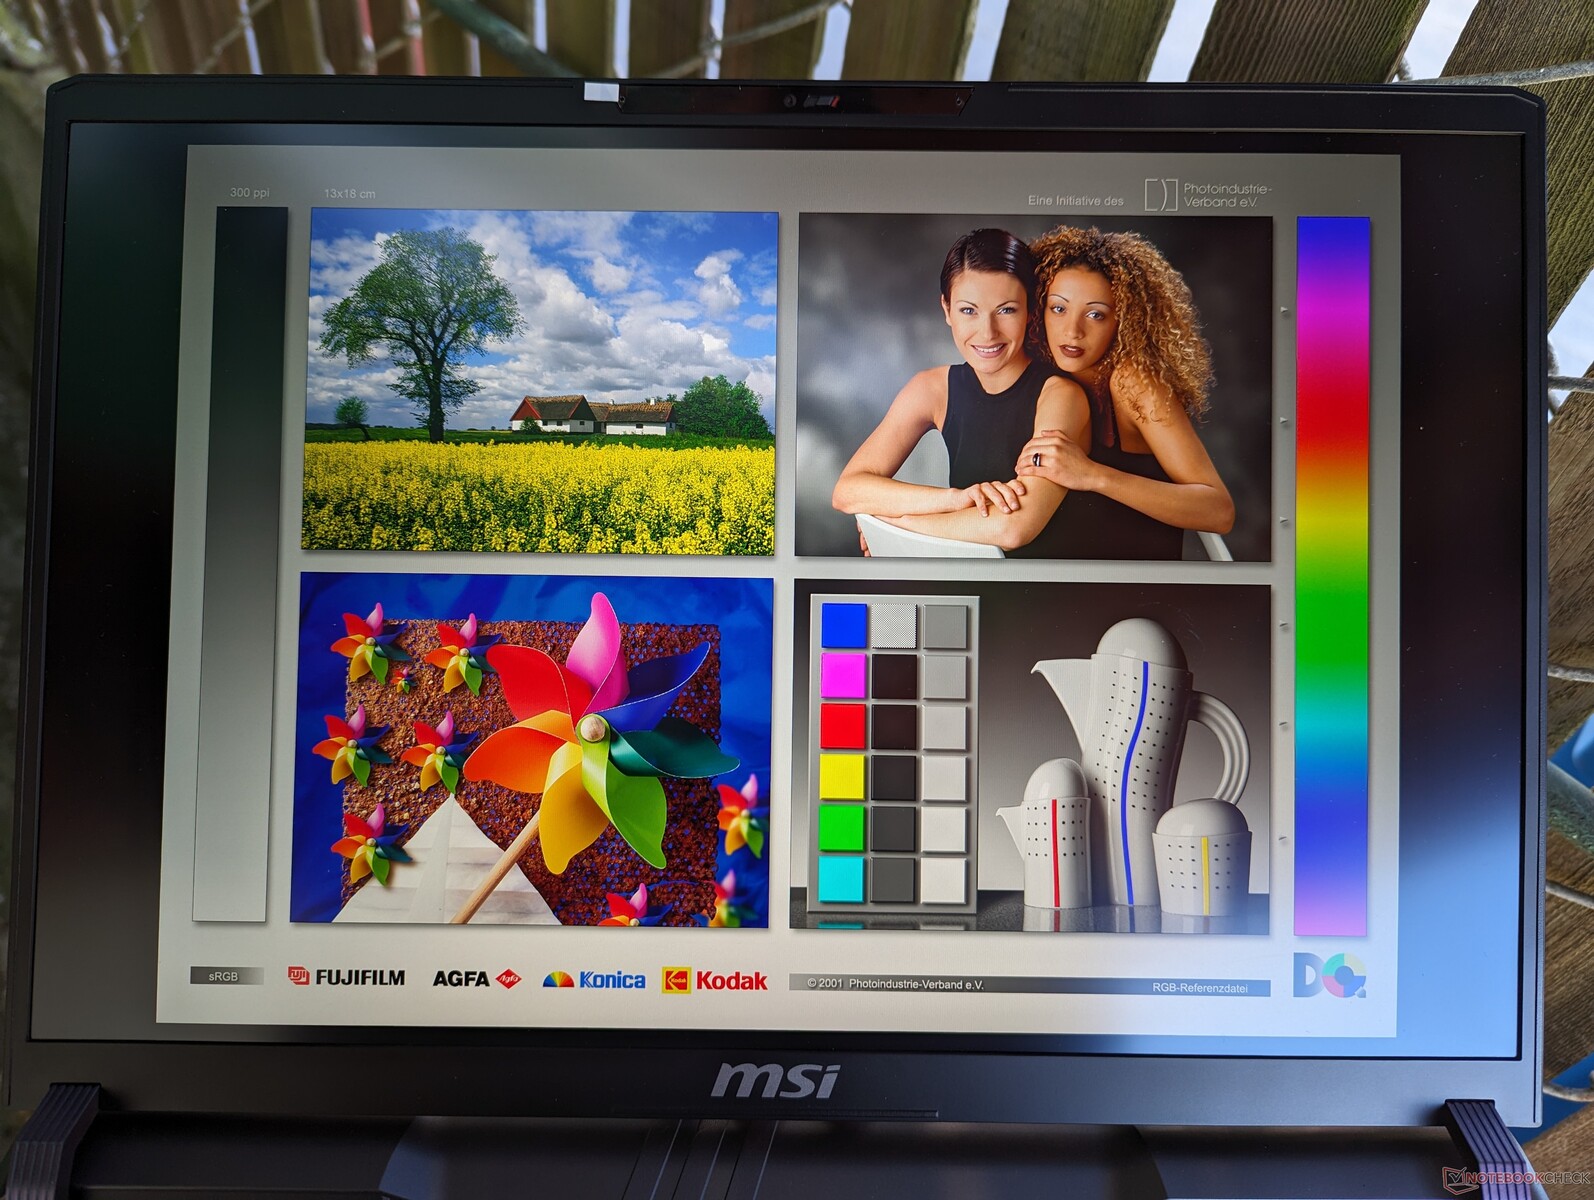
A tela fosca é relativamente brilhante para um painel IPS, com cerca de 550 nits, em comparação com apenas 300 nits no HP Victus 16 ou no Asus TUF Gaming A16. A visibilidade é tolerável quando está sob a sombra, mas a tela ainda é muito fraca em condições externas mais claras.
Desempenho
Condições de teste
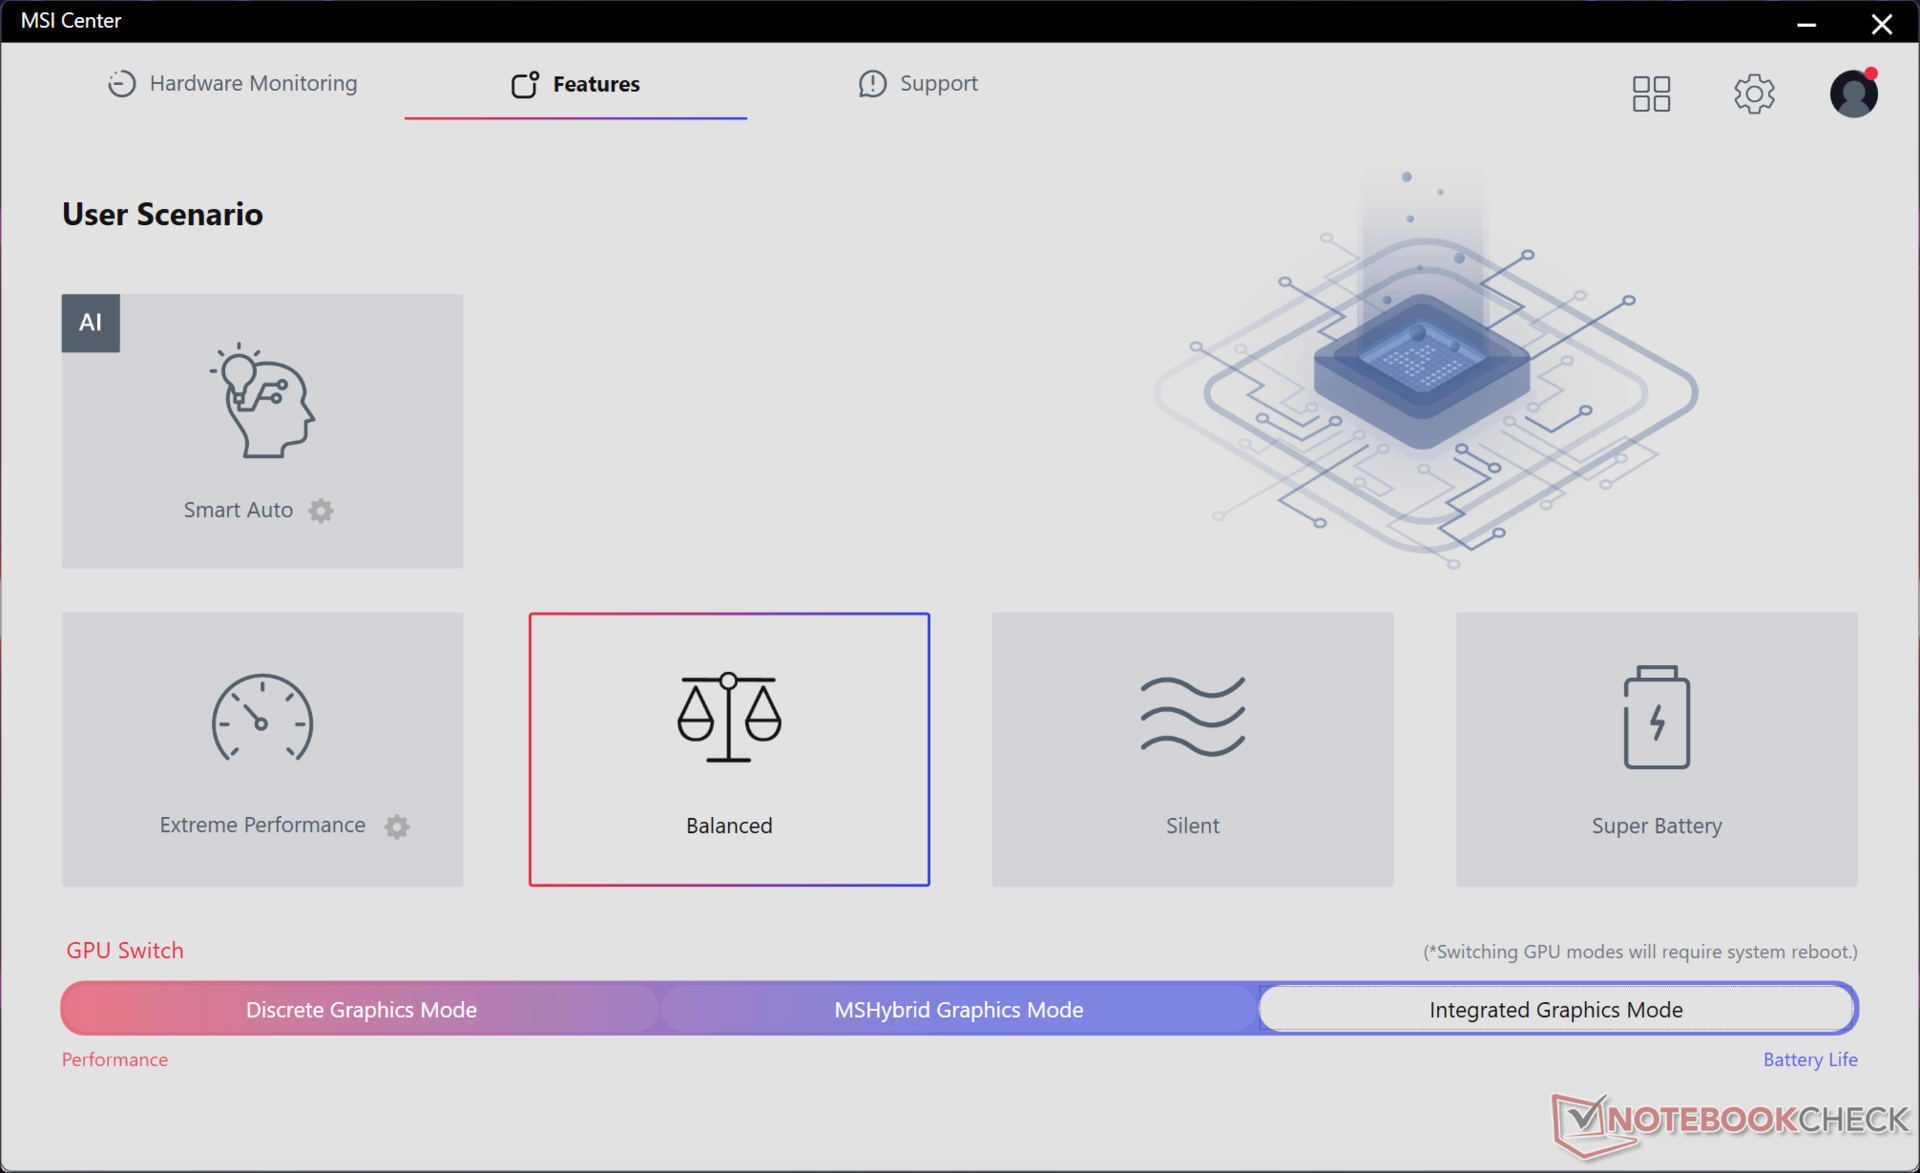
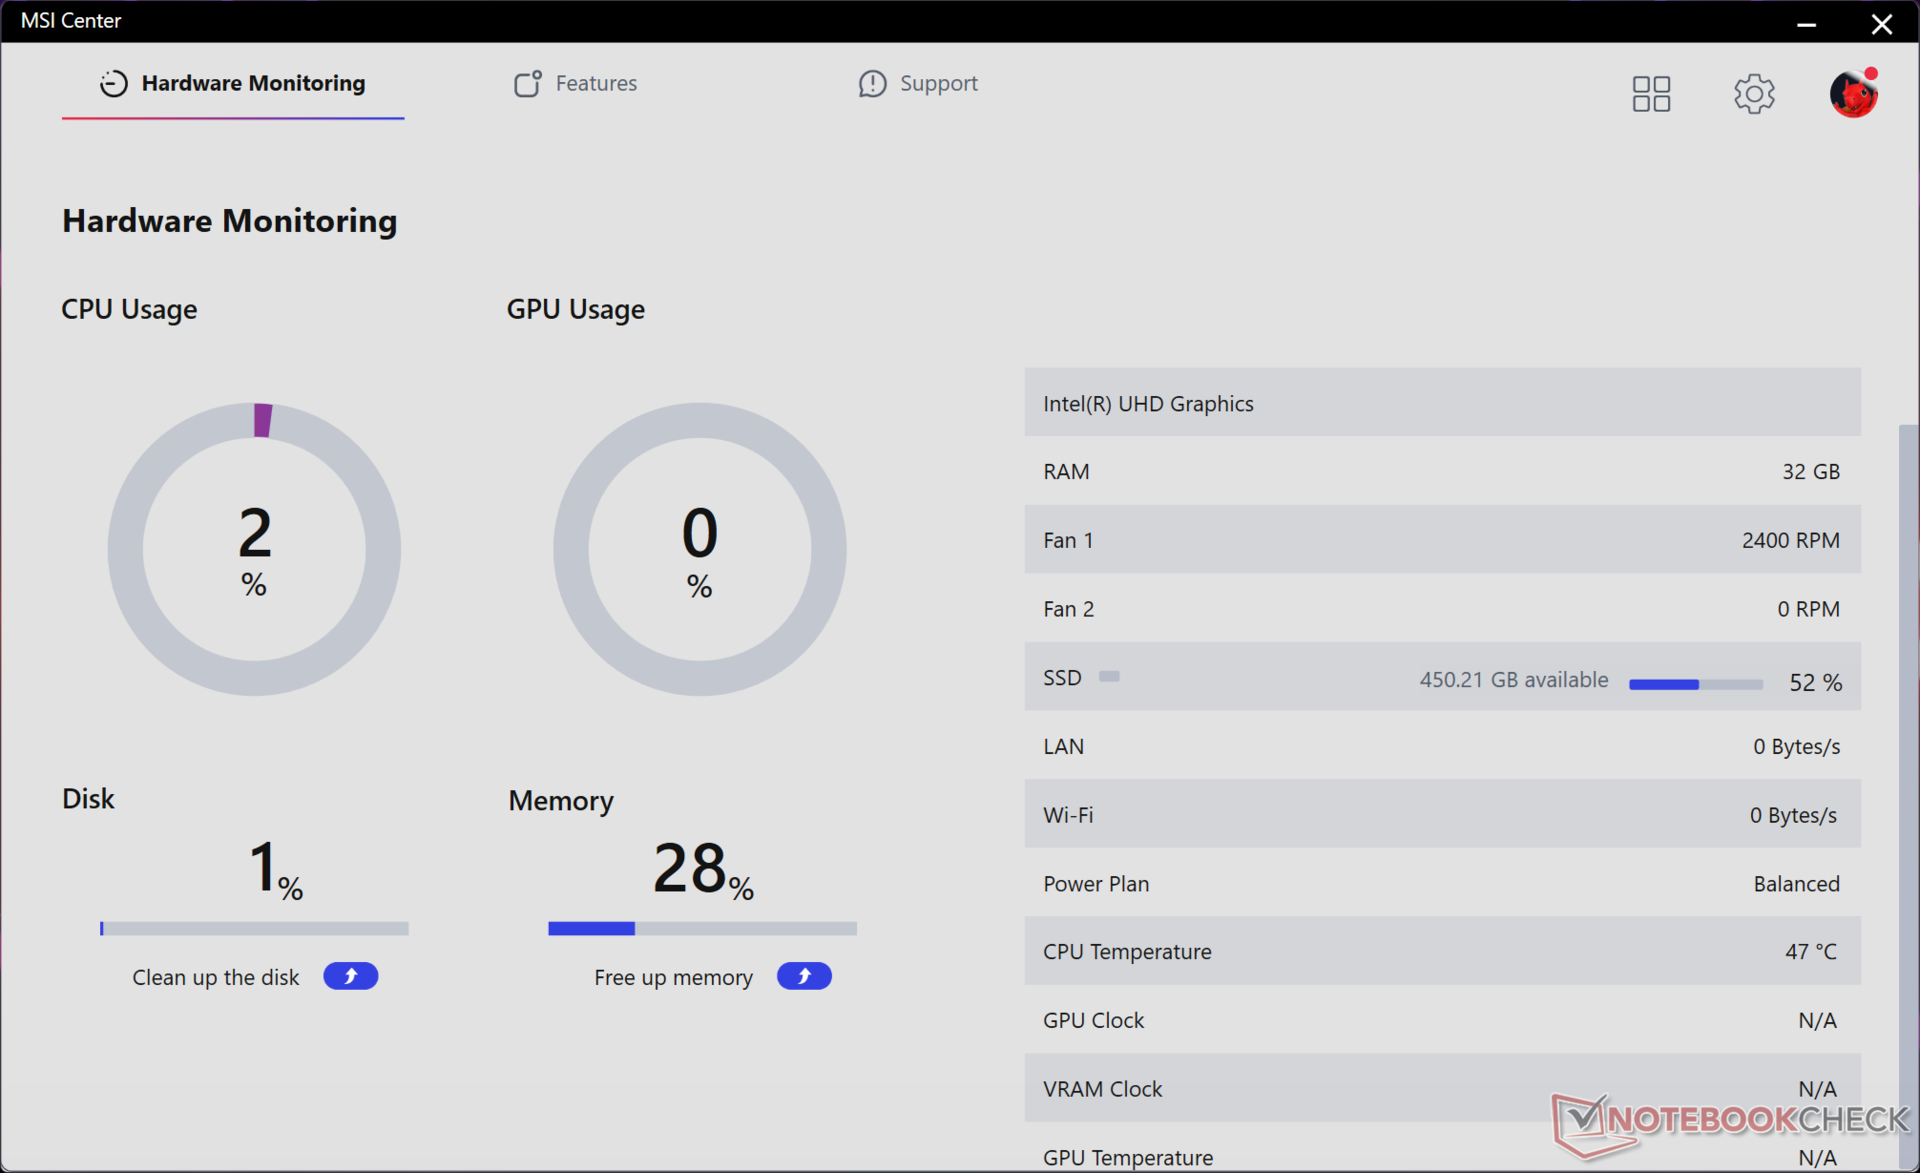
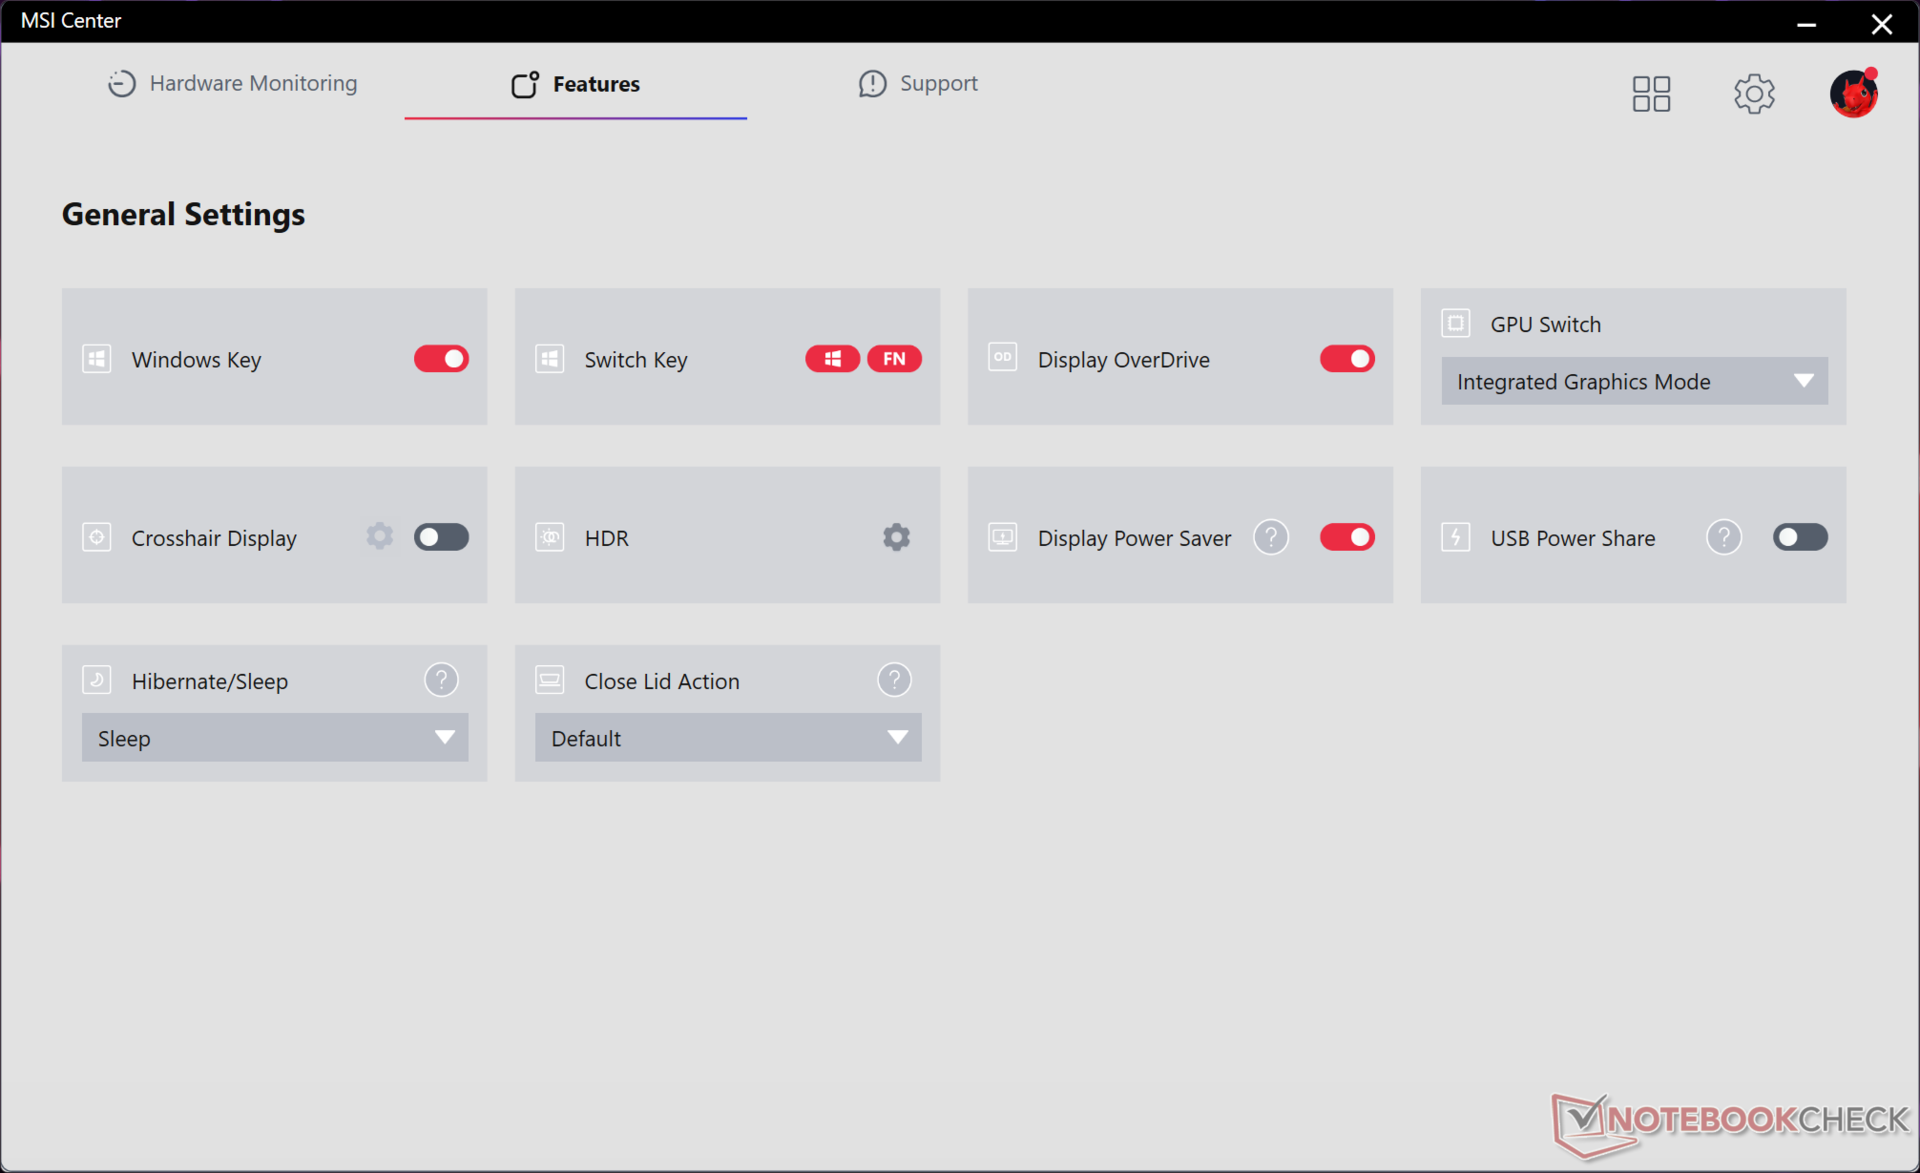
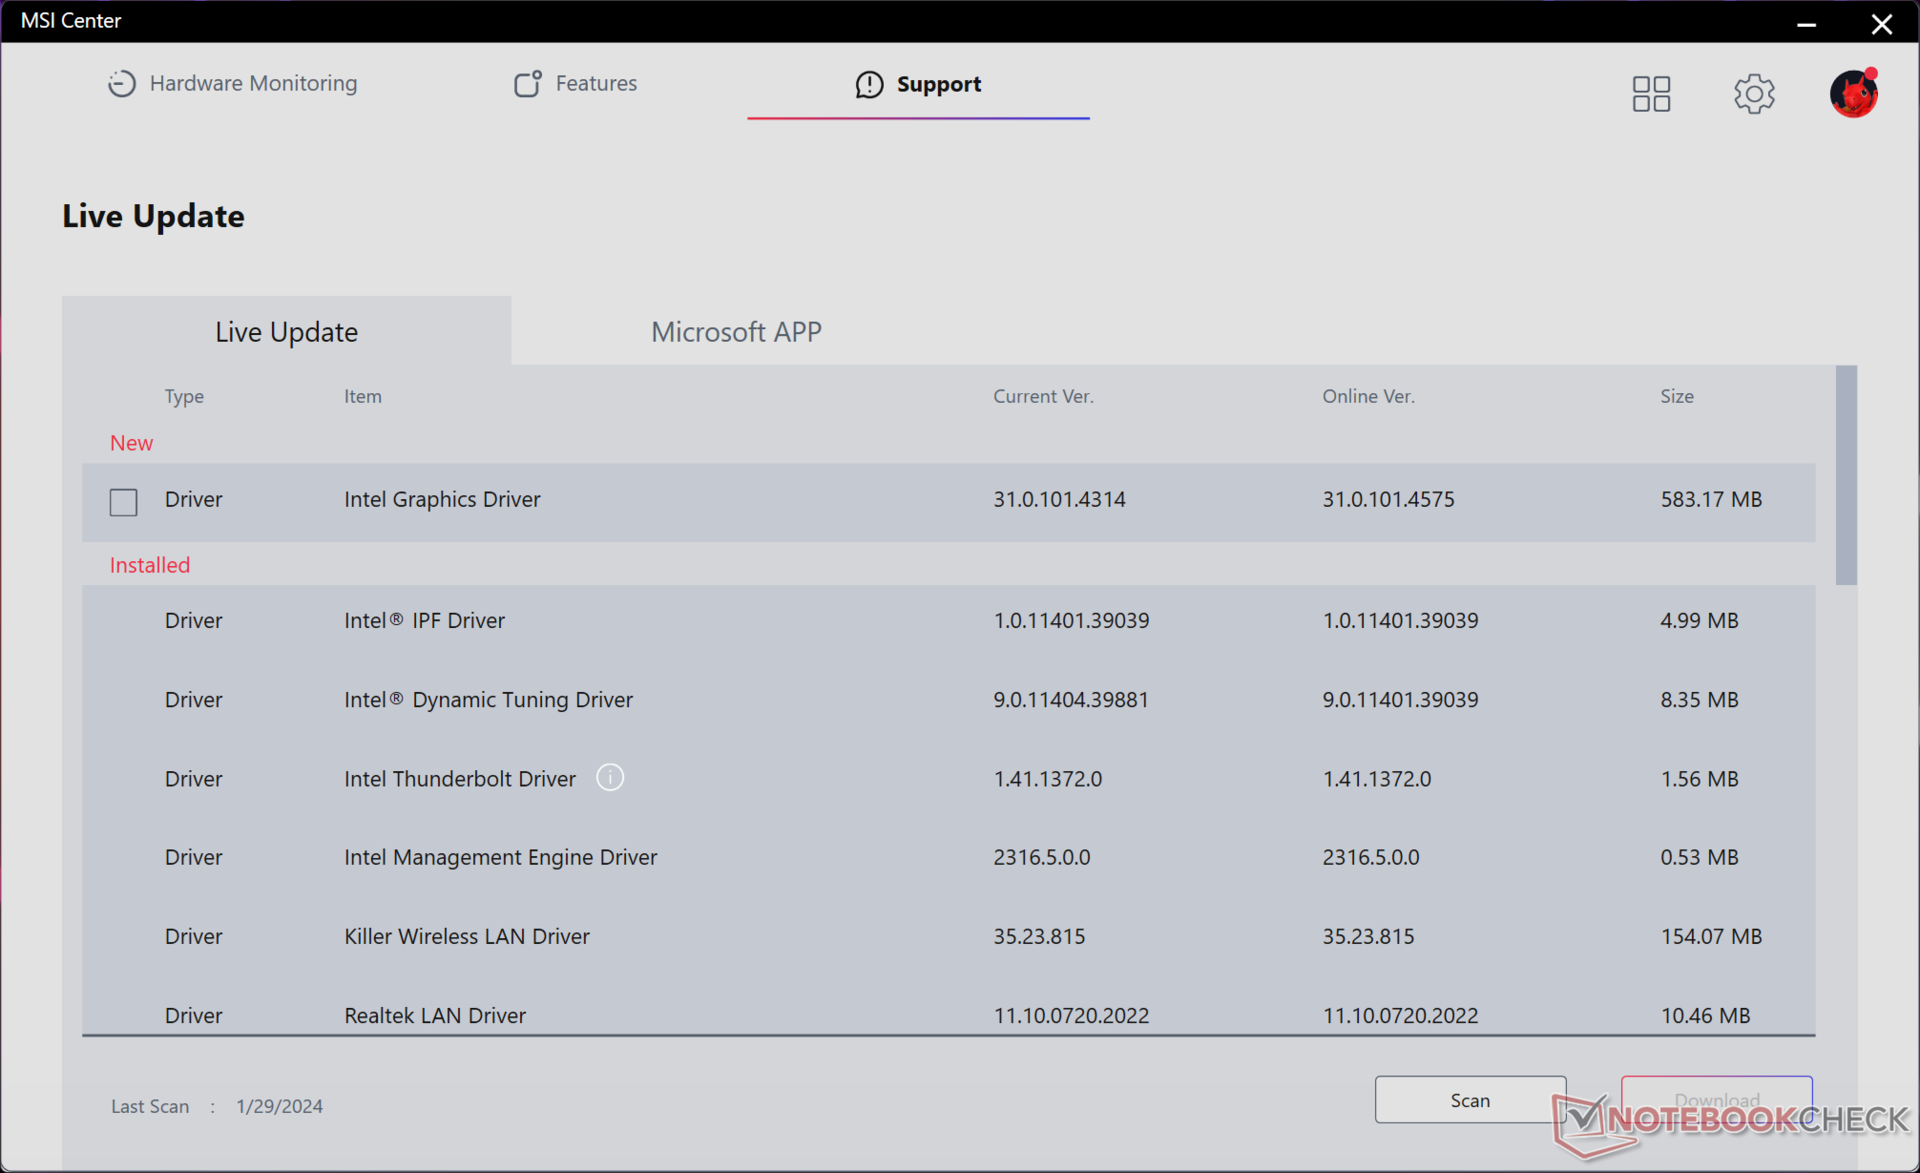
Colocamos nossa unidade no modo dGPU e no modo Extreme Performance com o Cooler Boost ativo antes de executar os benchmarks abaixo. Os proprietários devem se familiarizar com o software MSI Center pré-instalado, pois ele é o centro das atualizações do sistema, dos sinais vitais do sistema, da alternância de recursos e do ajuste das configurações MUX e dos perfis de energia. Alternar entre os modos dGPU e iGPU requer reinicialização, o que pode demorar ainda mais do que uma inicialização a frio normal.
Processador
Muito parecido com o que descobrimos na Titan 18 HX, o Core i9-14900HX é apenas um pequeno aumento em relação à última geração do Core i9-13980HX da última geração em até 10%. Portanto, os benefícios ano a ano são apenas marginais, especialmente porque a série de atualização Raptor Lake-HX de 14ª geração não possui a nova NPU dedicada encontrada na série Meteor Lake de 14ª geração. É claro que o Core i9-13980HX foi uma das CPUs móveis mais rápidas de 2023 e, portanto, o Core i9-14900HX não é nada desprezível. Os usuários que fizerem o upgrade de laptops para jogos da Intel de 12ª geração ou mais antigos ainda deverão observar aumentos significativos no desempenho.
Cinebench R15 Multi Loop
Cinebench R23: Multi Core | Single Core
Cinebench R20: CPU (Multi Core) | CPU (Single Core)
Cinebench R15: CPU Multi 64Bit | CPU Single 64Bit
Blender: v2.79 BMW27 CPU
7-Zip 18.03: 7z b 4 | 7z b 4 -mmt1
Geekbench 6.7: Multi-Core | Single-Core
Geekbench 5.5: Multi-Core | Single-Core
HWBOT x265 Benchmark v2.2: 4k Preset
LibreOffice : 20 Documents To PDF
R Benchmark 2.5: Overall mean
| CPU Performance rating | |
| MSI Vector 16 HX A14V | |
| Asus Zephyrus Duo 16 GX650PY-NM006W -2! | |
| Média Intel Core i9-14900HX | |
| Alienware m16 R1 AMD | |
| Lenovo Legion 5 16IRX G9 | |
| Alienware m16 R1 Intel | |
| Lenovo Legion Pro 5 16ARX8 -2! | |
| Asus TUF Gaming A16 FA617XS -2! | |
| MSI Vector GP66 12UGS -2! | |
| Lenovo Legion Slim 7 16APH8 | |
| Lenovo LOQ 16IRH8 | |
| Dell G16 7620 -2! | |
| HP Victus 16-r0077ng | |
| Geekbench 6.7 / Multi-Core | |
| MSI Vector 16 HX A14V | |
| Média Intel Core i9-14900HX (13158 - 19665, n=37) | |
| Lenovo Legion 5 16IRX G9 | |
| Alienware m16 R1 Intel | |
| Lenovo LOQ 16IRH8 | |
| Lenovo Legion Slim 7 16APH8 | |
| Alienware m16 R1 AMD | |
| HP Victus 16-r0077ng | |
| Geekbench 6.7 / Single-Core | |
| MSI Vector 16 HX A14V | |
| Média Intel Core i9-14900HX (2419 - 3129, n=37) | |
| Lenovo Legion 5 16IRX G9 | |
| Alienware m16 R1 AMD | |
| Alienware m16 R1 Intel | |
| Lenovo Legion Slim 7 16APH8 | |
| Lenovo LOQ 16IRH8 | |
| HP Victus 16-r0077ng | |
Cinebench R23: Multi Core | Single Core
Cinebench R20: CPU (Multi Core) | CPU (Single Core)
Cinebench R15: CPU Multi 64Bit | CPU Single 64Bit
Blender: v2.79 BMW27 CPU
7-Zip 18.03: 7z b 4 | 7z b 4 -mmt1
Geekbench 6.7: Multi-Core | Single-Core
Geekbench 5.5: Multi-Core | Single-Core
HWBOT x265 Benchmark v2.2: 4k Preset
LibreOffice : 20 Documents To PDF
R Benchmark 2.5: Overall mean
* ... menor é melhor
AIDA64: FP32 Ray-Trace | FPU Julia | CPU SHA3 | CPU Queen | FPU SinJulia | FPU Mandel | CPU AES | CPU ZLib | FP64 Ray-Trace | CPU PhotoWorxx
| Performance rating | |
| MSI Vector 16 HX A14V | |
| Média Intel Core i9-14900HX | |
| Asus TUF Gaming A16 FA617XS | |
| Lenovo Legion 5 16IRX G9 | |
| Dell G16 7620 | |
| HP Victus 16-r0077ng | |
| MSI Vector GP66 12UGS | |
| AIDA64 / FP32 Ray-Trace | |
| MSI Vector 16 HX A14V | |
| Asus TUF Gaming A16 FA617XS | |
| Média Intel Core i9-14900HX (13098 - 33474, n=36) | |
| Lenovo Legion 5 16IRX G9 | |
| Dell G16 7620 | |
| HP Victus 16-r0077ng | |
| MSI Vector GP66 12UGS | |
| AIDA64 / FPU Julia | |
| MSI Vector 16 HX A14V | |
| Média Intel Core i9-14900HX (67573 - 166040, n=36) | |
| Asus TUF Gaming A16 FA617XS | |
| Lenovo Legion 5 16IRX G9 | |
| Dell G16 7620 | |
| HP Victus 16-r0077ng | |
| MSI Vector GP66 12UGS | |
| AIDA64 / CPU SHA3 | |
| MSI Vector 16 HX A14V | |
| Média Intel Core i9-14900HX (3589 - 7979, n=36) | |
| Asus TUF Gaming A16 FA617XS | |
| Lenovo Legion 5 16IRX G9 | |
| Dell G16 7620 | |
| HP Victus 16-r0077ng | |
| MSI Vector GP66 12UGS | |
| AIDA64 / CPU Queen | |
| MSI Vector 16 HX A14V | |
| Média Intel Core i9-14900HX (118405 - 148966, n=36) | |
| Asus TUF Gaming A16 FA617XS | |
| MSI Vector GP66 12UGS | |
| Dell G16 7620 | |
| Lenovo Legion 5 16IRX G9 | |
| HP Victus 16-r0077ng | |
| AIDA64 / FPU SinJulia | |
| MSI Vector 16 HX A14V | |
| Asus TUF Gaming A16 FA617XS | |
| Média Intel Core i9-14900HX (10475 - 18517, n=36) | |
| Lenovo Legion 5 16IRX G9 | |
| Dell G16 7620 | |
| MSI Vector GP66 12UGS | |
| HP Victus 16-r0077ng | |
| AIDA64 / FPU Mandel | |
| MSI Vector 16 HX A14V | |
| Asus TUF Gaming A16 FA617XS | |
| Média Intel Core i9-14900HX (32543 - 83662, n=36) | |
| Lenovo Legion 5 16IRX G9 | |
| HP Victus 16-r0077ng | |
| Dell G16 7620 | |
| MSI Vector GP66 12UGS | |
| AIDA64 / CPU AES | |
| Média Intel Core i9-14900HX (86964 - 241777, n=36) | |
| MSI Vector 16 HX A14V | |
| MSI Vector GP66 12UGS | |
| Lenovo Legion 5 16IRX G9 | |
| Asus TUF Gaming A16 FA617XS | |
| Dell G16 7620 | |
| HP Victus 16-r0077ng | |
| AIDA64 / CPU ZLib | |
| MSI Vector 16 HX A14V | |
| Média Intel Core i9-14900HX (1054 - 2292, n=36) | |
| Lenovo Legion 5 16IRX G9 | |
| Asus TUF Gaming A16 FA617XS | |
| MSI Vector GP66 12UGS | |
| Dell G16 7620 | |
| HP Victus 16-r0077ng | |
| AIDA64 / FP64 Ray-Trace | |
| MSI Vector 16 HX A14V | |
| Asus TUF Gaming A16 FA617XS | |
| Média Intel Core i9-14900HX (6809 - 18349, n=36) | |
| Lenovo Legion 5 16IRX G9 | |
| Dell G16 7620 | |
| HP Victus 16-r0077ng | |
| MSI Vector GP66 12UGS | |
| AIDA64 / CPU PhotoWorxx | |
| MSI Vector 16 HX A14V | |
| Média Intel Core i9-14900HX (23903 - 54702, n=36) | |
| HP Victus 16-r0077ng | |
| Dell G16 7620 | |
| Lenovo Legion 5 16IRX G9 | |
| Asus TUF Gaming A16 FA617XS | |
| MSI Vector GP66 12UGS | |
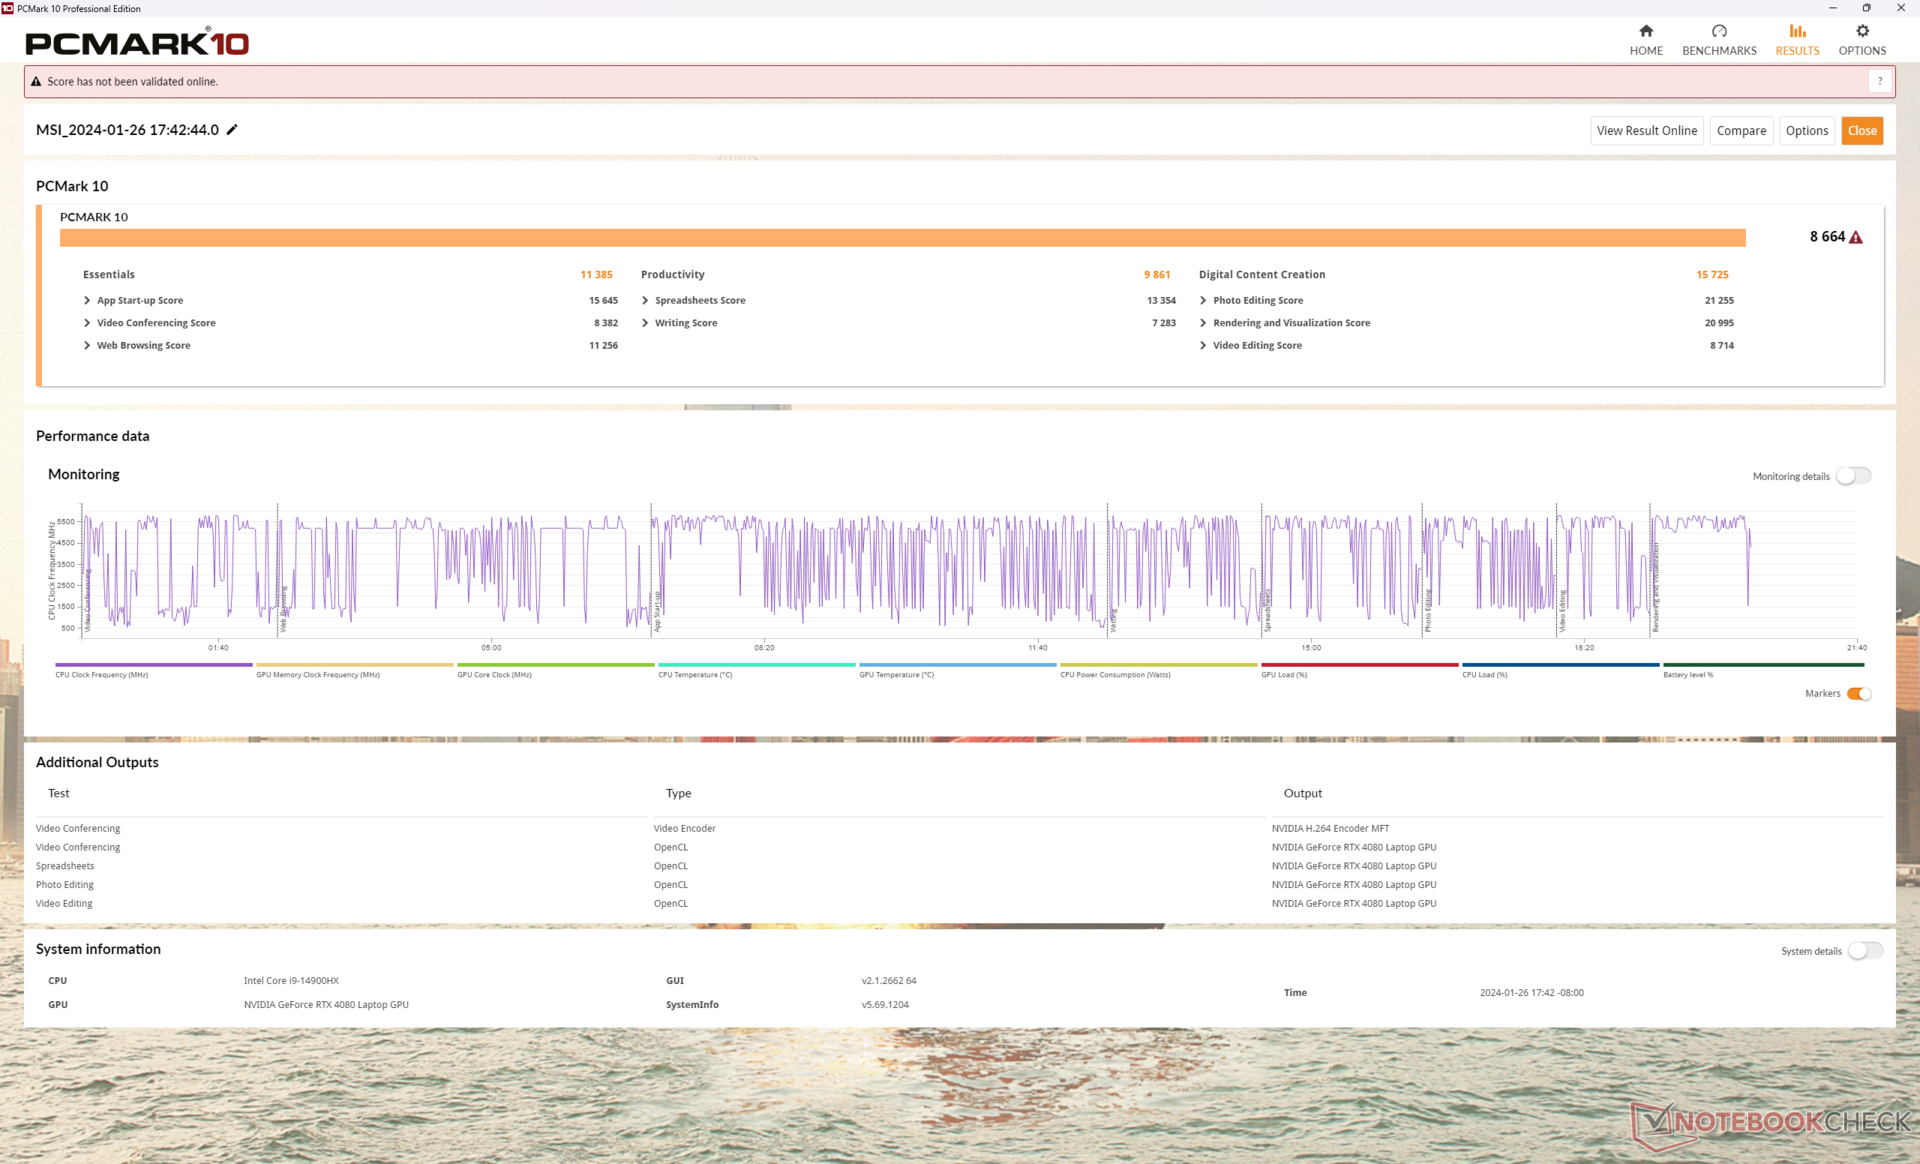
Desempenho do sistema
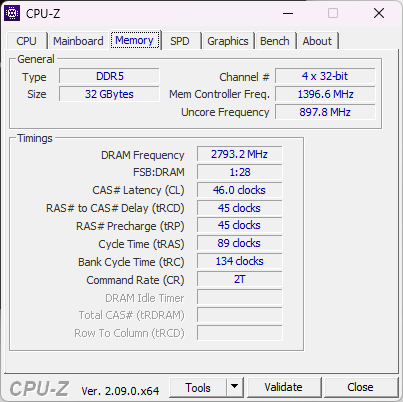
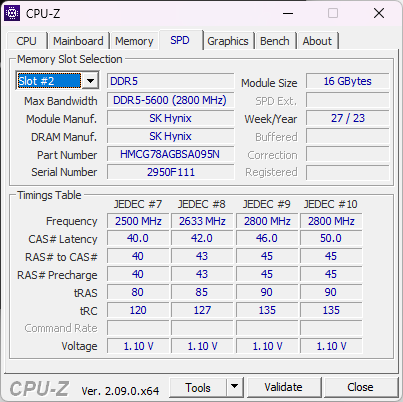
Os resultados do PCMark são alguns dos mais altos de qualquer laptop para jogos de médio porte devido à nova CPU de 14ª geração e à GPU GeForce RTX 4080 de 175 W com potência total. O desempenho da RAM também é mais rápido do que o esperado, com velocidades de leitura e gravação cerca de 70% mais rápidas do que no antigo design Vector GP66.
CrossMark: Overall | Productivity | Creativity | Responsiveness
WebXPRT 3: Overall
WebXPRT 4: Overall
Mozilla Kraken 1.1: Total
| PCMark 10 / Score | |
| Média Intel Core i9-14900HX, NVIDIA GeForce RTX 4080 Laptop GPU (7703 - 9223, n=7) | |
| MSI Vector 16 HX A14V | |
| MSI Vector GP66 12UGS | |
| Asus TUF Gaming A16 FA617XS | |
| Lenovo Legion 5 16IRX G9 | |
| Dell G16 7620 | |
| HP Victus 16-r0077ng | |
| PCMark 10 / Essentials | |
| Média Intel Core i9-14900HX, NVIDIA GeForce RTX 4080 Laptop GPU (11255 - 12600, n=7) | |
| MSI Vector 16 HX A14V | |
| MSI Vector GP66 12UGS | |
| Asus TUF Gaming A16 FA617XS | |
| Lenovo Legion 5 16IRX G9 | |
| HP Victus 16-r0077ng | |
| Dell G16 7620 | |
| PCMark 10 / Productivity | |
| Asus TUF Gaming A16 FA617XS | |
| Média Intel Core i9-14900HX, NVIDIA GeForce RTX 4080 Laptop GPU (6662 - 11410, n=7) | |
| MSI Vector GP66 12UGS | |
| MSI Vector 16 HX A14V | |
| Lenovo Legion 5 16IRX G9 | |
| HP Victus 16-r0077ng | |
| Dell G16 7620 | |
| PCMark 10 / Digital Content Creation | |
| MSI Vector 16 HX A14V | |
| Média Intel Core i9-14900HX, NVIDIA GeForce RTX 4080 Laptop GPU (14211 - 16246, n=7) | |
| MSI Vector GP66 12UGS | |
| Lenovo Legion 5 16IRX G9 | |
| Asus TUF Gaming A16 FA617XS | |
| Dell G16 7620 | |
| HP Victus 16-r0077ng | |
| CrossMark / Overall | |
| MSI Vector 16 HX A14V | |
| Média Intel Core i9-14900HX, NVIDIA GeForce RTX 4080 Laptop GPU (1992 - 2334, n=7) | |
| Lenovo Legion 5 16IRX G9 | |
| Dell G16 7620 | |
| Asus TUF Gaming A16 FA617XS | |
| CrossMark / Productivity | |
| MSI Vector 16 HX A14V | |
| Média Intel Core i9-14900HX, NVIDIA GeForce RTX 4080 Laptop GPU (1812 - 2204, n=7) | |
| Lenovo Legion 5 16IRX G9 | |
| Asus TUF Gaming A16 FA617XS | |
| Dell G16 7620 | |
| CrossMark / Creativity | |
| MSI Vector 16 HX A14V | |
| Média Intel Core i9-14900HX, NVIDIA GeForce RTX 4080 Laptop GPU (2327 - 2500, n=7) | |
| Lenovo Legion 5 16IRX G9 | |
| Asus TUF Gaming A16 FA617XS | |
| Dell G16 7620 | |
| CrossMark / Responsiveness | |
| MSI Vector 16 HX A14V | |
| Média Intel Core i9-14900HX, NVIDIA GeForce RTX 4080 Laptop GPU (1520 - 2254, n=7) | |
| Lenovo Legion 5 16IRX G9 | |
| Dell G16 7620 | |
| Asus TUF Gaming A16 FA617XS | |
| WebXPRT 3 / Overall | |
| Média Intel Core i9-14900HX, NVIDIA GeForce RTX 4080 Laptop GPU (310 - 345, n=7) | |
| MSI Vector 16 HX A14V | |
| Lenovo Legion 5 16IRX G9 | |
| MSI Vector GP66 12UGS | |
| HP Victus 16-r0077ng | |
| HP Victus 16-r0077ng | |
| Dell G16 7620 | |
| WebXPRT 4 / Overall | |
| Média Intel Core i9-14900HX, NVIDIA GeForce RTX 4080 Laptop GPU (300 - 321, n=7) | |
| MSI Vector 16 HX A14V | |
| Lenovo Legion 5 16IRX G9 | |
| Asus TUF Gaming A16 FA617XS | |
| Dell G16 7620 | |
| HP Victus 16-r0077ng | |
| HP Victus 16-r0077ng | |
| Mozilla Kraken 1.1 / Total | |
| Dell G16 7620 | |
| HP Victus 16-r0077ng | |
| HP Victus 16-r0077ng | |
| MSI Vector GP66 12UGS | |
| Asus TUF Gaming A16 FA617XS | |
| Lenovo Legion 5 16IRX G9 | |
| MSI Vector 16 HX A14V | |
| Média Intel Core i9-14900HX, NVIDIA GeForce RTX 4080 Laptop GPU (437 - 446, n=7) | |
* ... menor é melhor
| PCMark 10 Score | 8664 pontos | |
Ajuda | ||
| AIDA64 / Memory Copy | |
| MSI Vector 16 HX A14V | |
| Média Intel Core i9-14900HX (38028 - 83392, n=36) | |
| HP Victus 16-r0077ng | |
| Lenovo Legion 5 16IRX G9 | |
| Asus TUF Gaming A16 FA617XS | |
| Dell G16 7620 | |
| MSI Vector GP66 12UGS | |
| AIDA64 / Memory Read | |
| MSI Vector 16 HX A14V | |
| Média Intel Core i9-14900HX (43306 - 87568, n=36) | |
| Lenovo Legion 5 16IRX G9 | |
| HP Victus 16-r0077ng | |
| Dell G16 7620 | |
| Asus TUF Gaming A16 FA617XS | |
| MSI Vector GP66 12UGS | |
| AIDA64 / Memory Write | |
| MSI Vector 16 HX A14V | |
| Asus TUF Gaming A16 FA617XS | |
| Média Intel Core i9-14900HX (37146 - 80589, n=36) | |
| HP Victus 16-r0077ng | |
| Dell G16 7620 | |
| Lenovo Legion 5 16IRX G9 | |
| MSI Vector GP66 12UGS | |
| AIDA64 / Memory Latency | |
| Dell G16 7620 | |
| HP Victus 16-r0077ng | |
| MSI Vector GP66 12UGS | |
| Asus TUF Gaming A16 FA617XS | |
| Lenovo Legion 5 16IRX G9 | |
| Média Intel Core i9-14900HX (76.1 - 105, n=36) | |
| MSI Vector 16 HX A14V | |
* ... menor é melhor
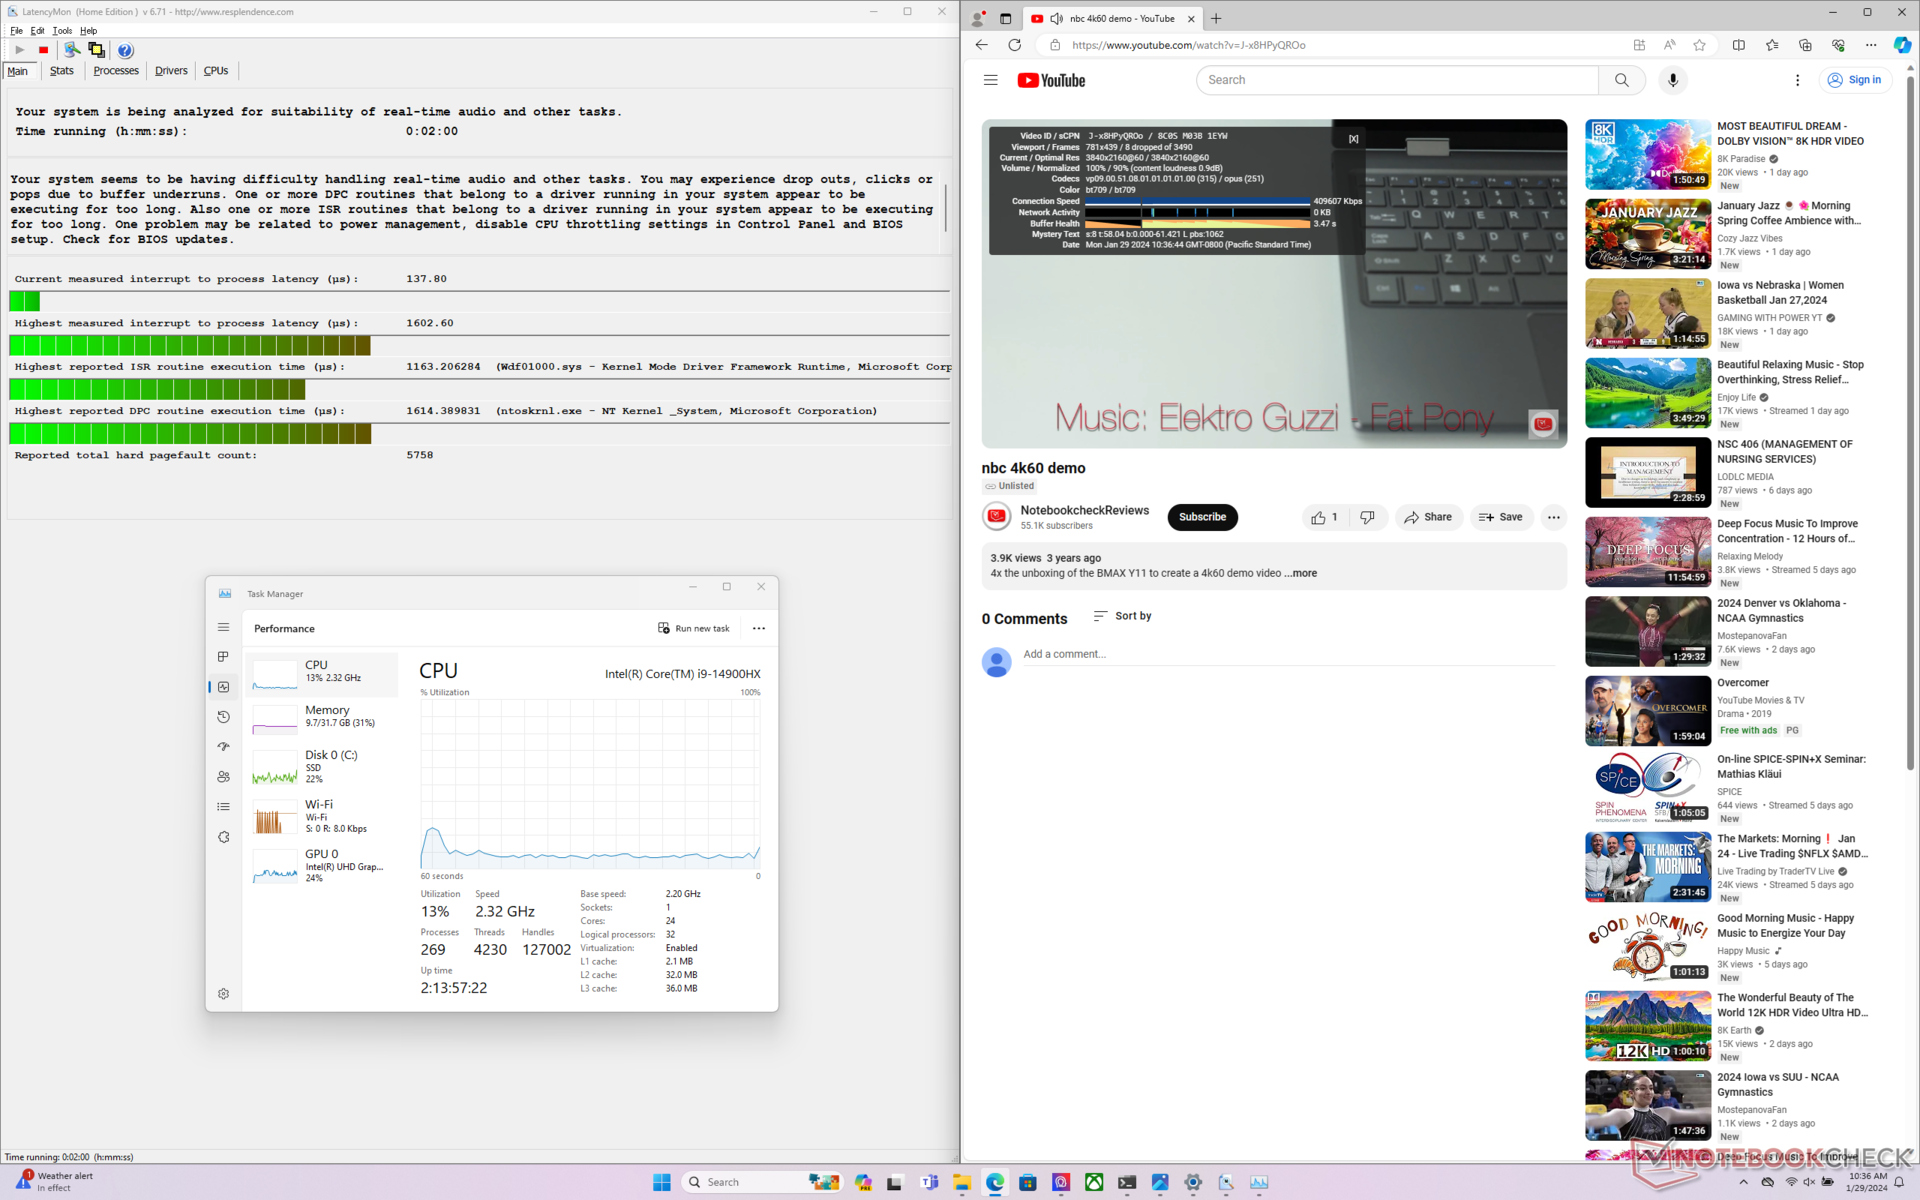
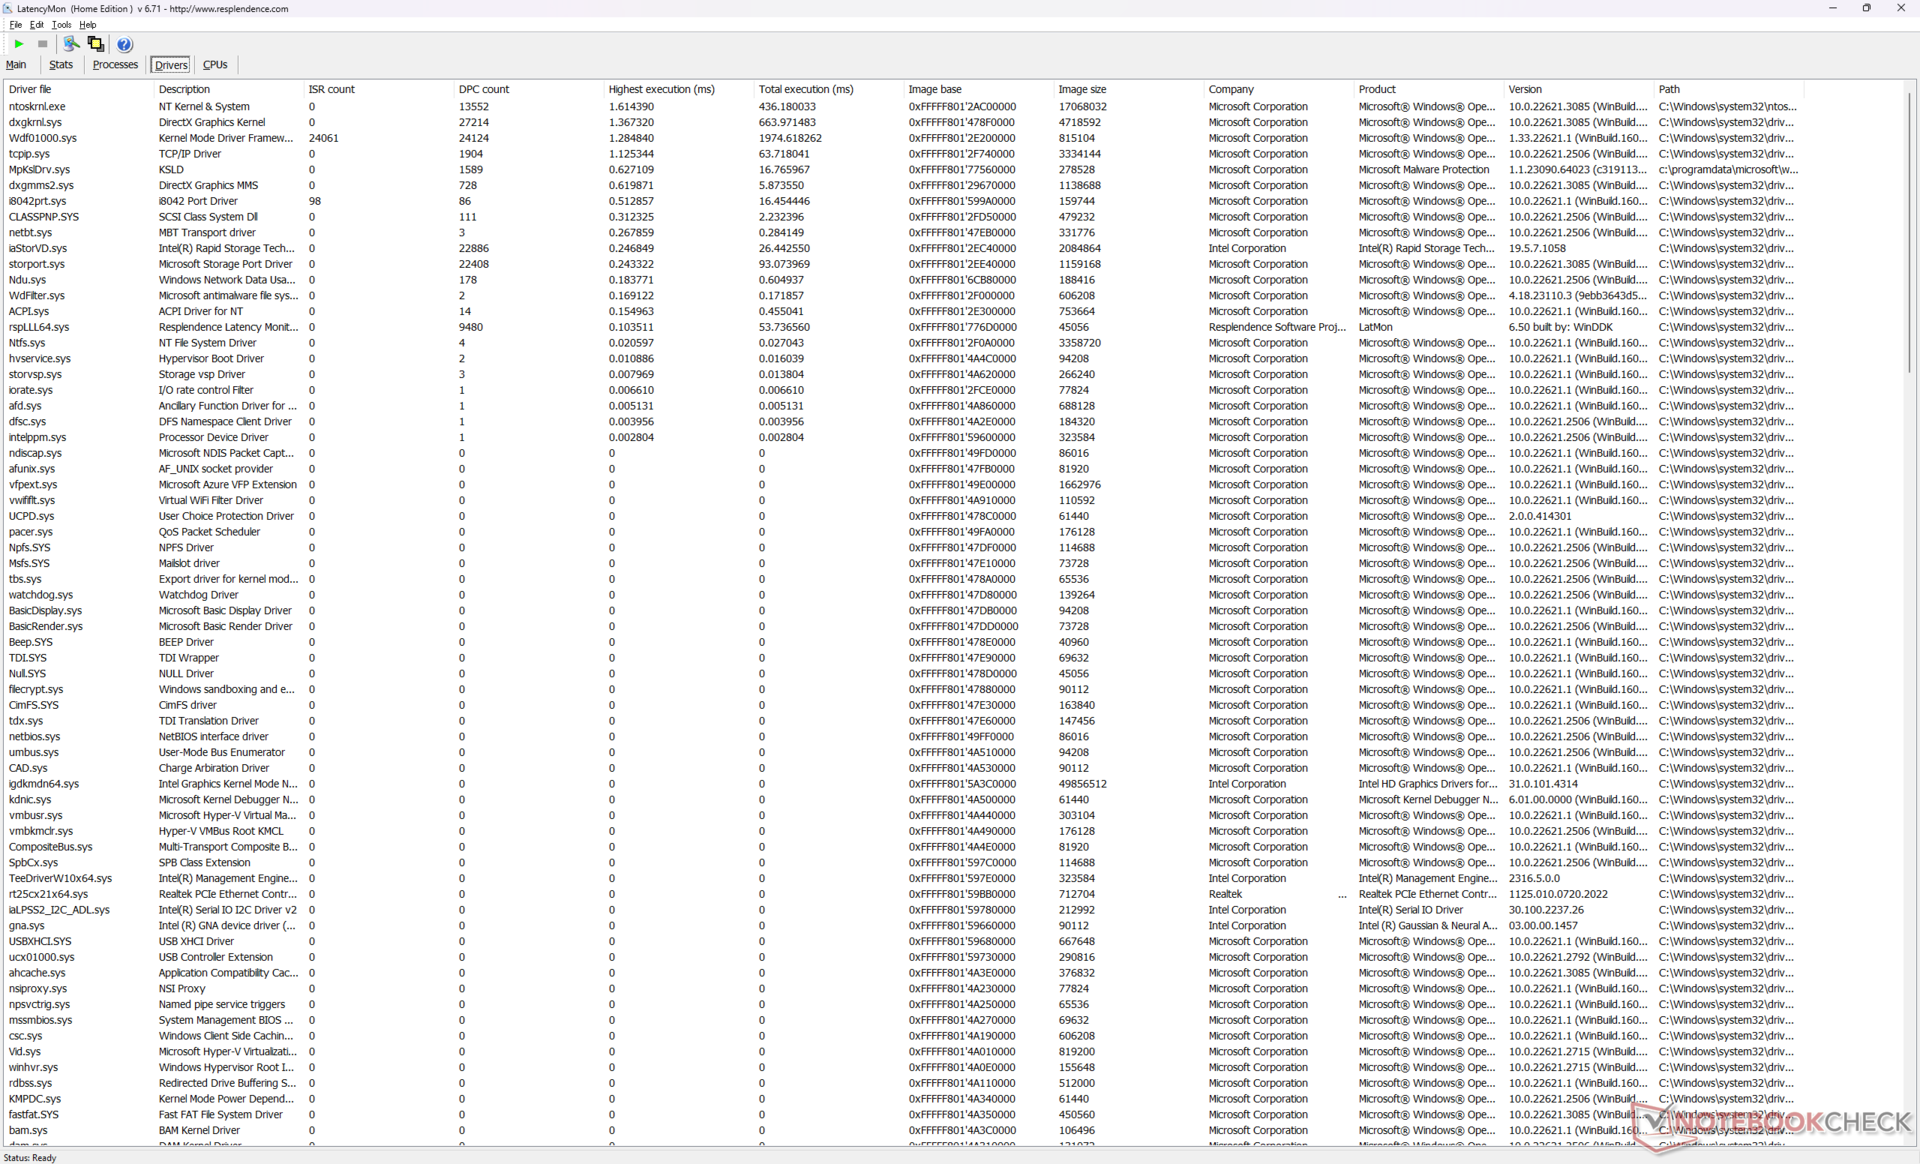
Latência DPC
O LatencyMon revela problemas de DPC ao abrir várias guias de nossa página inicial, bem como 8 quadros perdidos durante um vídeo de teste de 4K60 com um minuto de duração. A queda de quadros ocorre em intervalos quase regulares, o que sugere um problema relacionado à atividade em segundo plano ou a um driver subjacente.
| DPC Latencies / LatencyMon - interrupt to process latency (max), Web, Youtube, Prime95 | |
| MSI Vector GP66 12UGS | |
| Lenovo Legion 5 16IRX G9 | |
| HP Victus 16-r0077ng | |
| MSI Vector 16 HX A14V | |
| Asus TUF Gaming A16 FA617XS | |
| Dell G16 7620 | |
* ... menor é melhor
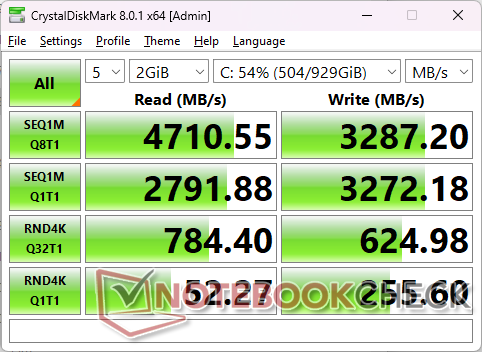
Dispositivos de armazenamento
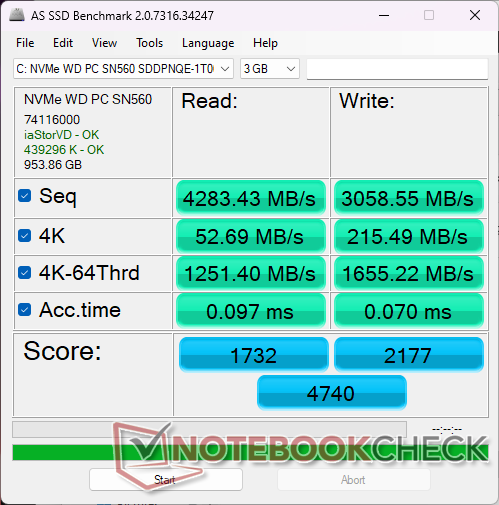
Nossa unidade de teste vem configurada com o PC SN560 de 1 TB de médio porte Western Digital PC SN560 PCIe4 x4 NVMe de médio porte para taxas de transferência estáveis de cerca de 4900 MB/s, mesmo quando sob estresse. O modelo também é compatível com SSDs PCIe5 x4, como no Titan 18 HX maior, mas a baixa disponibilidade de SSDs PCIe5 significa que a grande maioria das configurações disponíveis no momento está sendo fornecida apenas com unidades PCIe4.

| Drive Performance rating - Percent | |
| Lenovo Legion 5 16IRX G9 | |
| Dell G16 7620 | |
| MSI Vector GP66 12UGS | |
| HP Victus 16-r0077ng | |
| MSI Vector 16 HX A14V | |
| Asus TUF Gaming A16 FA617XS | |
* ... menor é melhor
Disk Throttling: DiskSpd Read Loop, Queue Depth 8
Desempenho da GPU - Onde o Vector se destaca
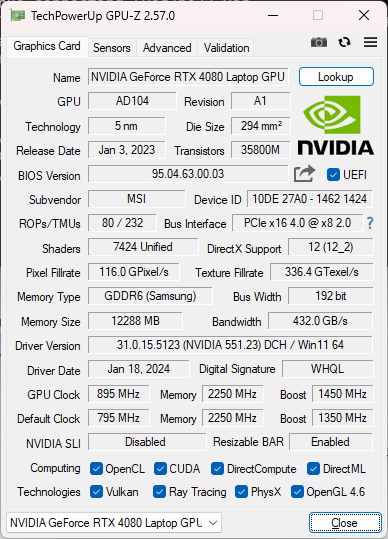
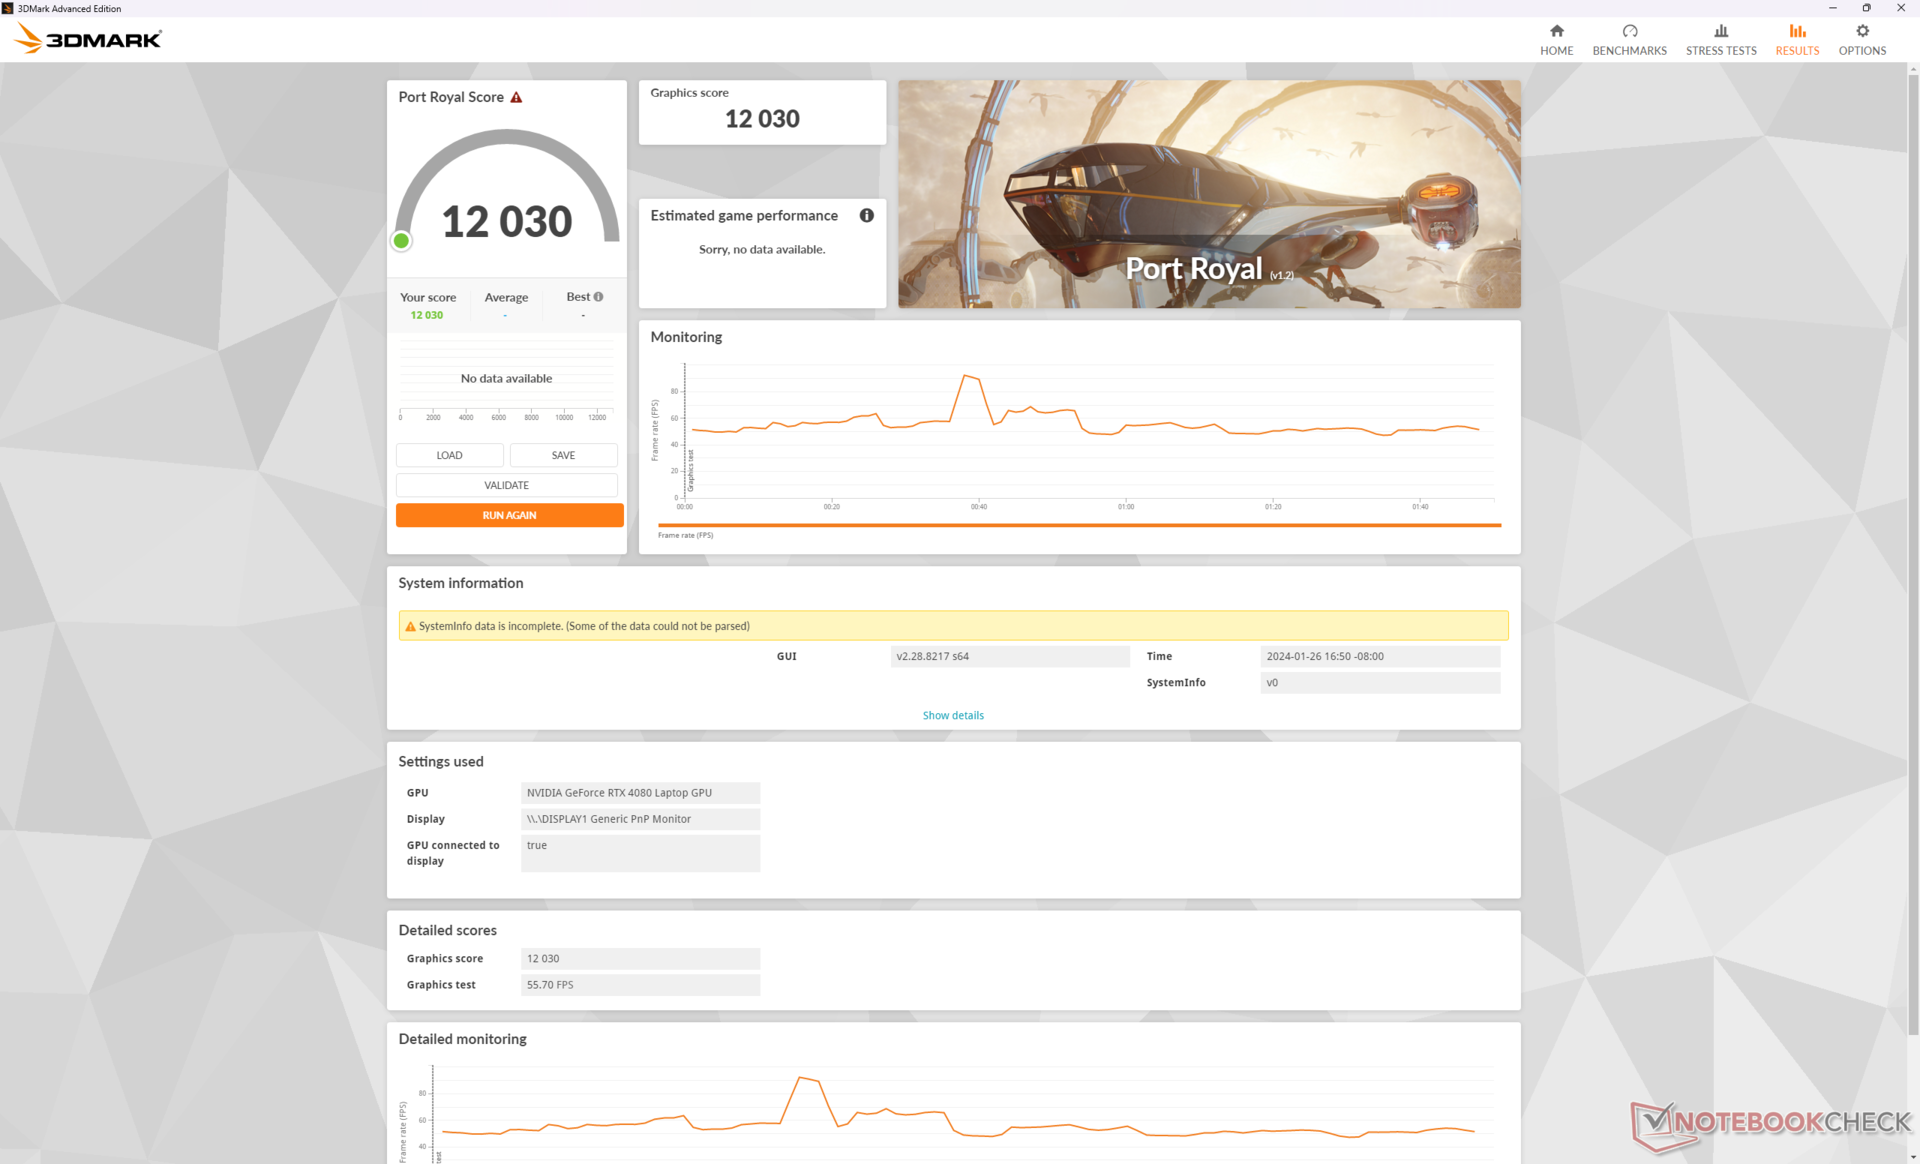
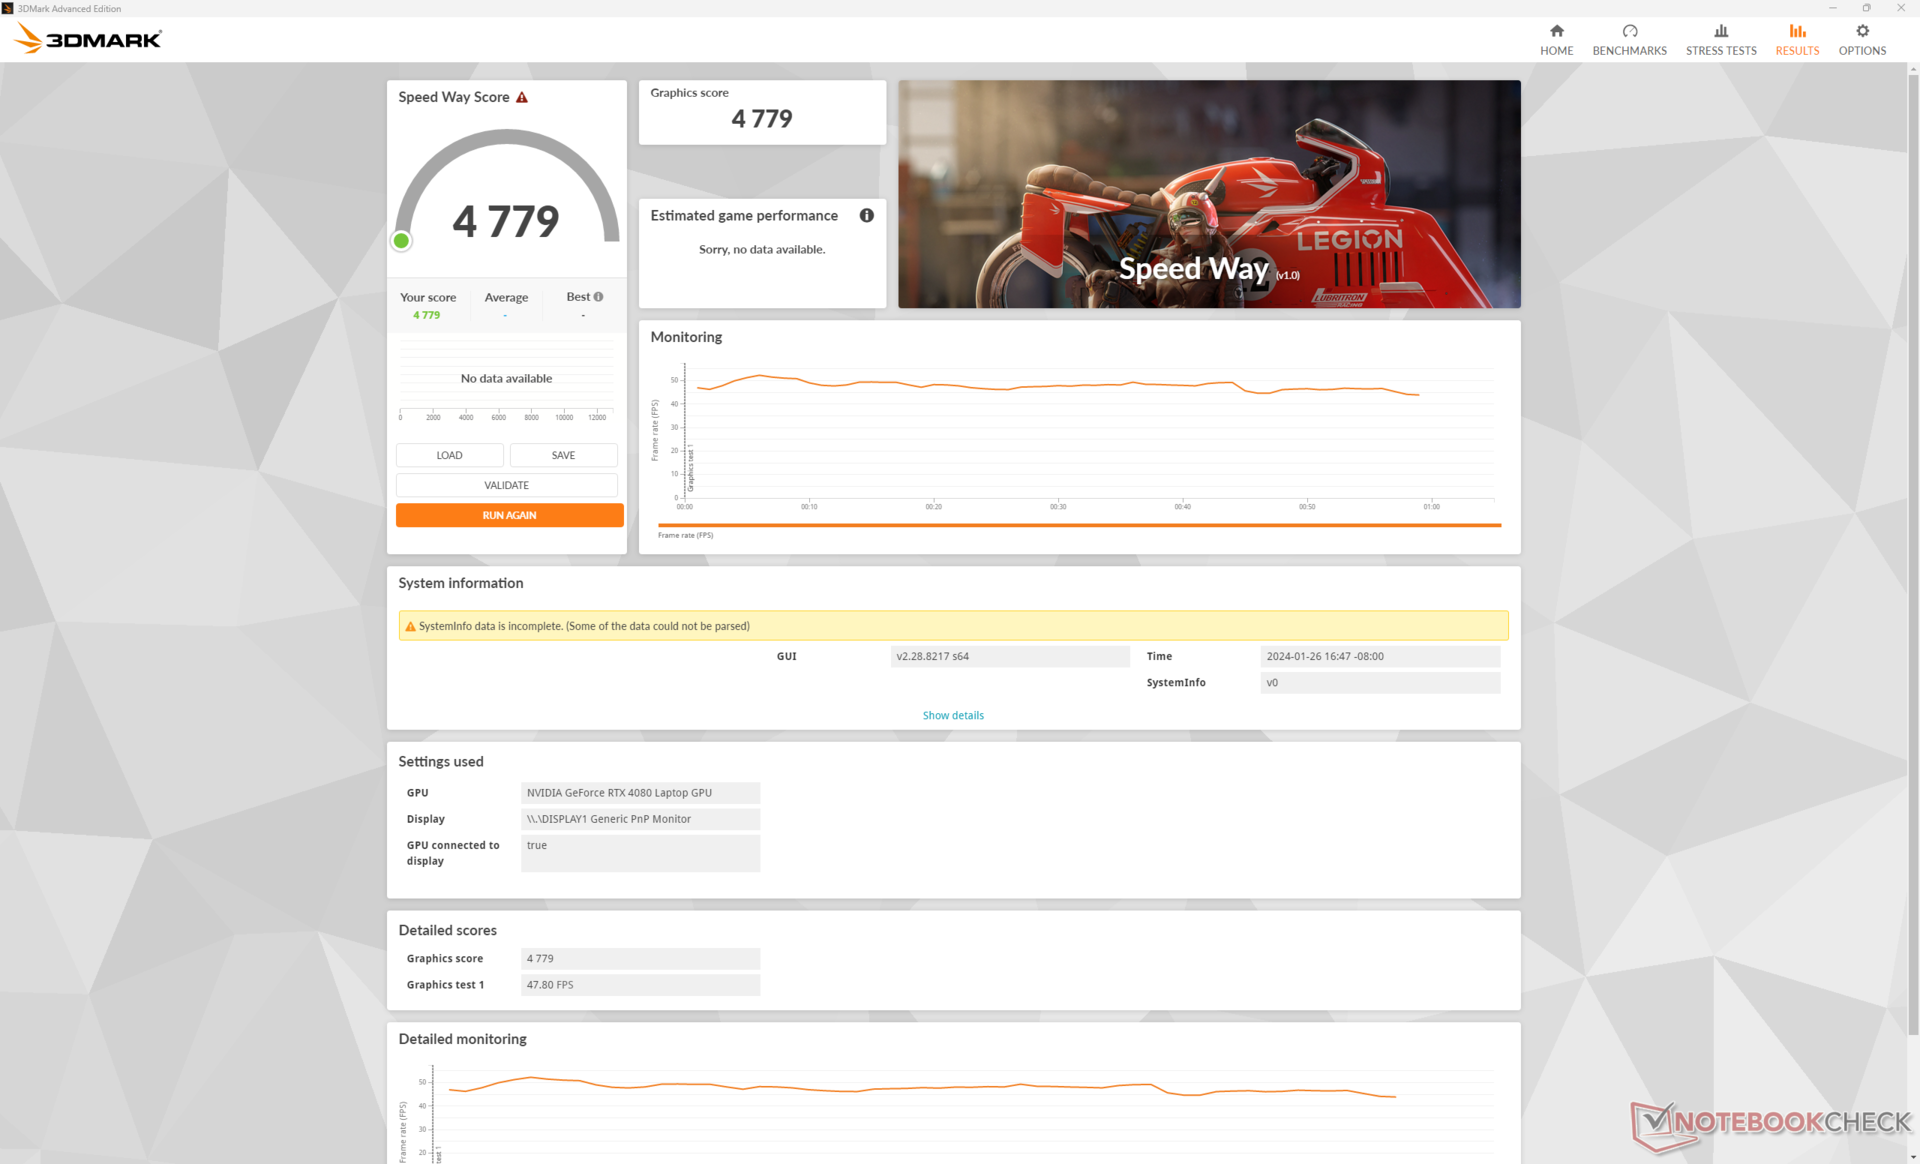
Enquanto a maioria dos outros notebooks para jogos visa valores mais baixos de TGP, incluindo o GP66, o Vector 16 HX visa o máximo de 175 W para obter um desempenho mais rápido. Consequentemente, nosso sistema MSI é cerca de 8 a 10 por cento mais rápido do que o laptop médio em nosso banco de dados equipado com a mesma mesma GPU móvel GeForce RTX 4080 GPU MÓVEL. Não é uma margem tão grande, mas os usuários avançados e os jogadores que desejam extrair o máximo possível de desempenho da GPU de suas máquinas vão querer considerar o Vector 16 HX em vez de alternativas com as mesmas opções gráficas, como o HP Omen 16.
A atualização para a RTX 4090 deverá aumentar o desempenho gráfico em cerca de 10%, enquanto a redução para RTX 4070 e RTX 4060 deverá diminuir o desempenho em cerca de 30 a 35% e 40 a 45%, respectivamente.
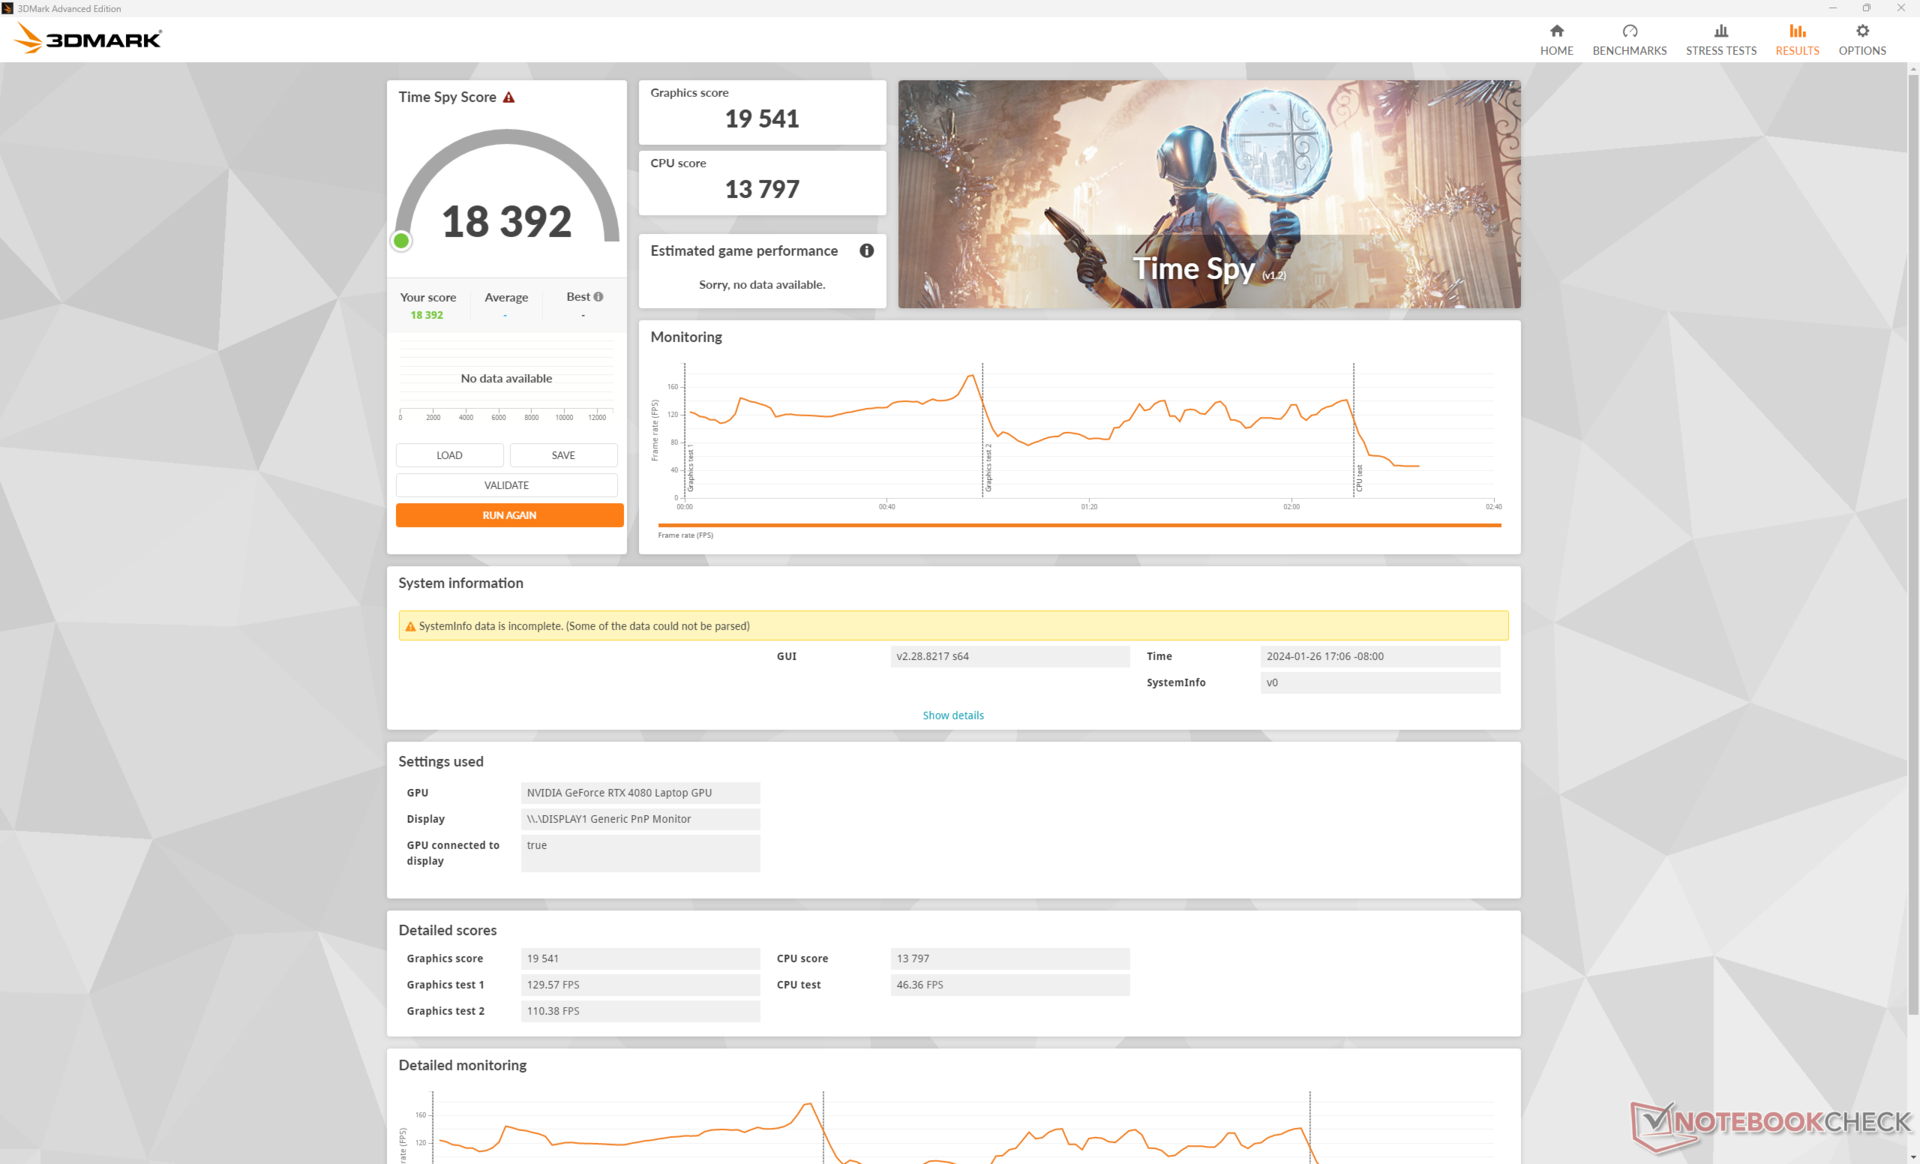
| Perfil de potência | Pontuação física | Pontuação de gráficos | Pontuação combinada |
| Desempenho extremo (com Cooler Boost ativado) | 13797 | 19541 | 18392 |
| Desempenho extremo (com o Cooler Boost desligado) | 14118 (-0%) | 19471 (-0%) | 18423 (-0%) |
| Modo balanceado | 13858 (-0%) | 16466 (-16%) | 16013 (-13%) |
| Energia da bateria | 8307 (-40%) | 8955 (-54%) | 8851 (-52%) |
Assim como em outros notebooks para jogos da MSI com Cooler Boost, o desempenho parece não ser afetado pelo recurso, desde que o usuário esteja no modo Extreme Performance, com base em nossas pontuações em Time Spy na tabela acima. No entanto, ao passar para o modo Balanced, o desempenho gráfico será reduzido em cerca de 16%.
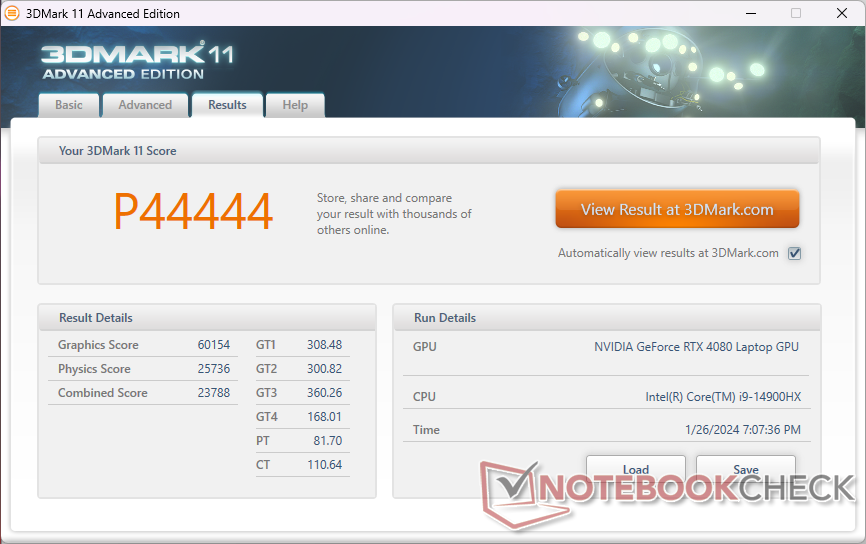
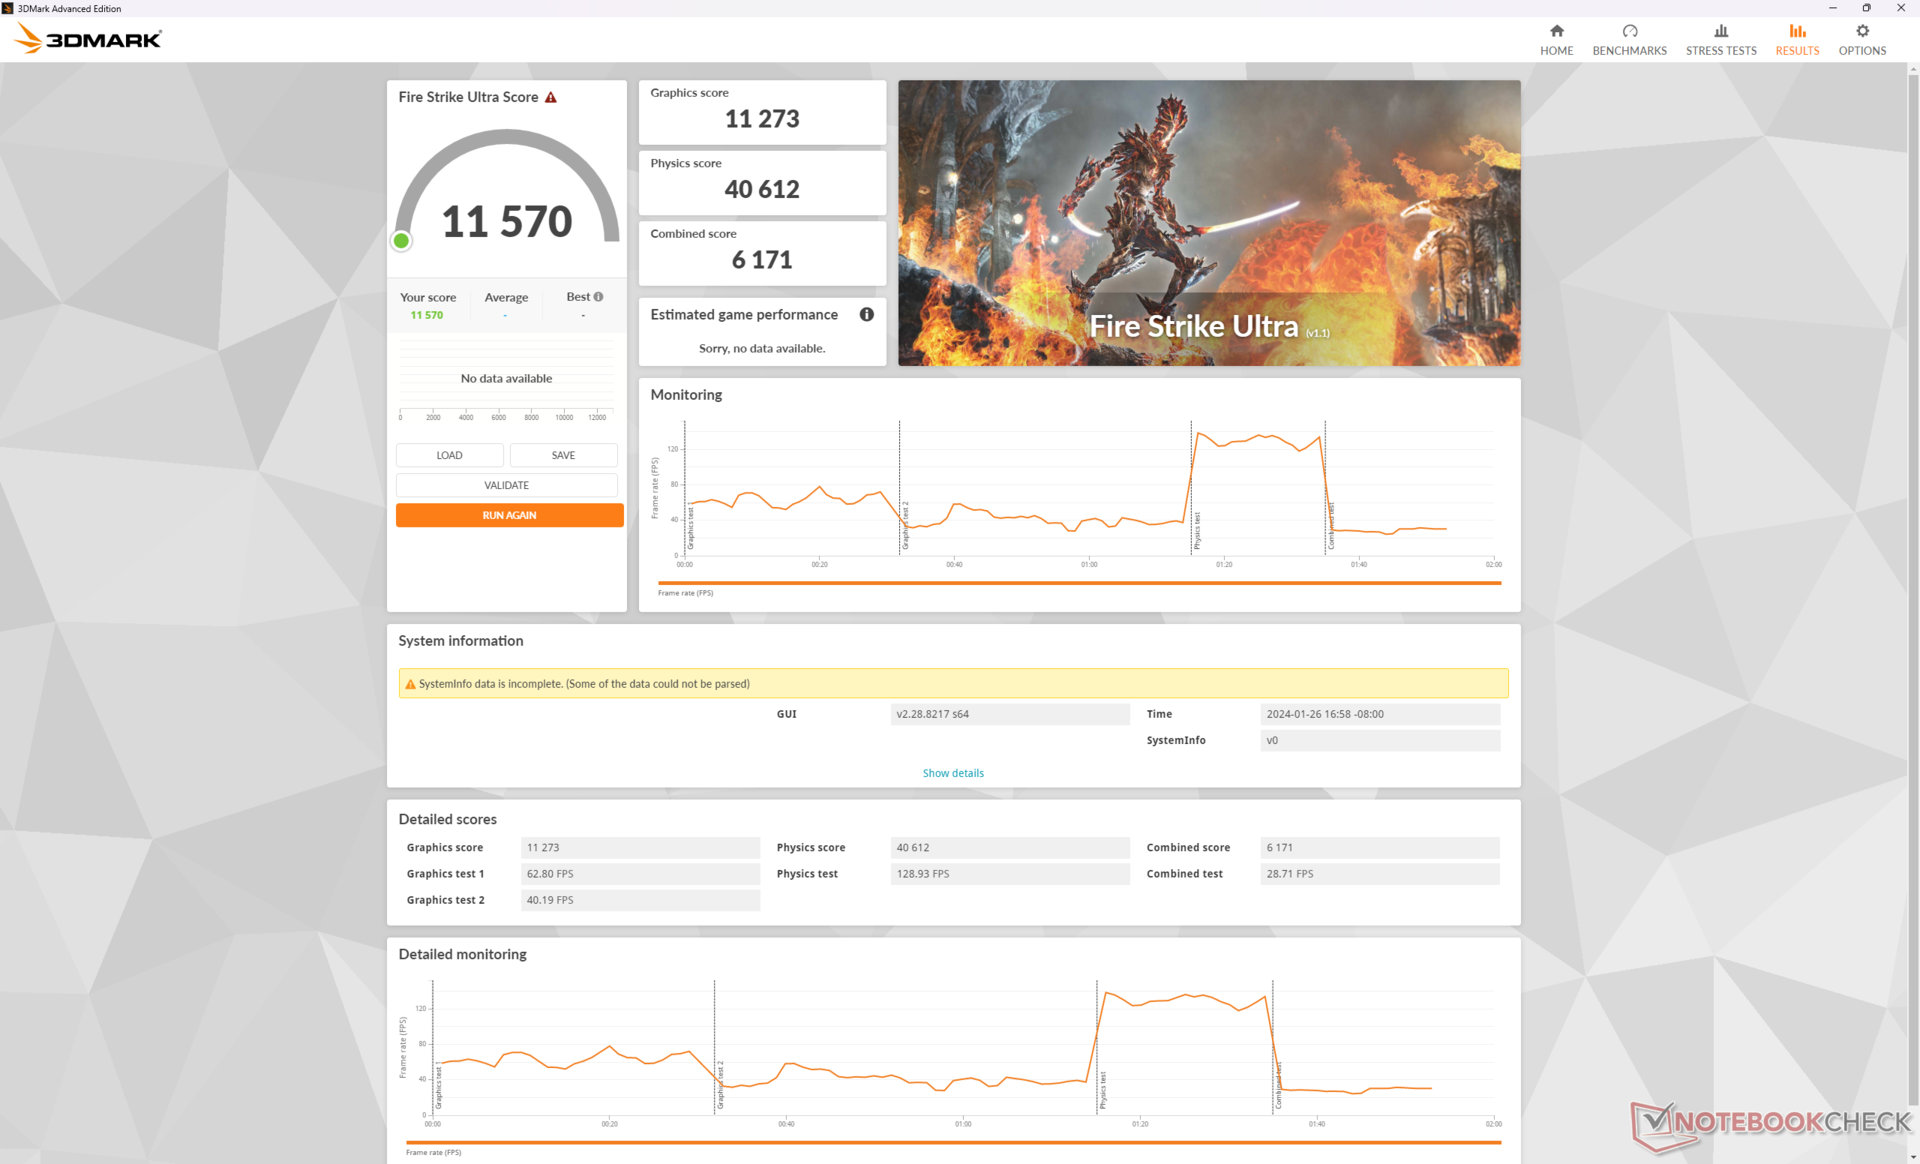
| 3DMark 11 Performance | 44444 pontos | |
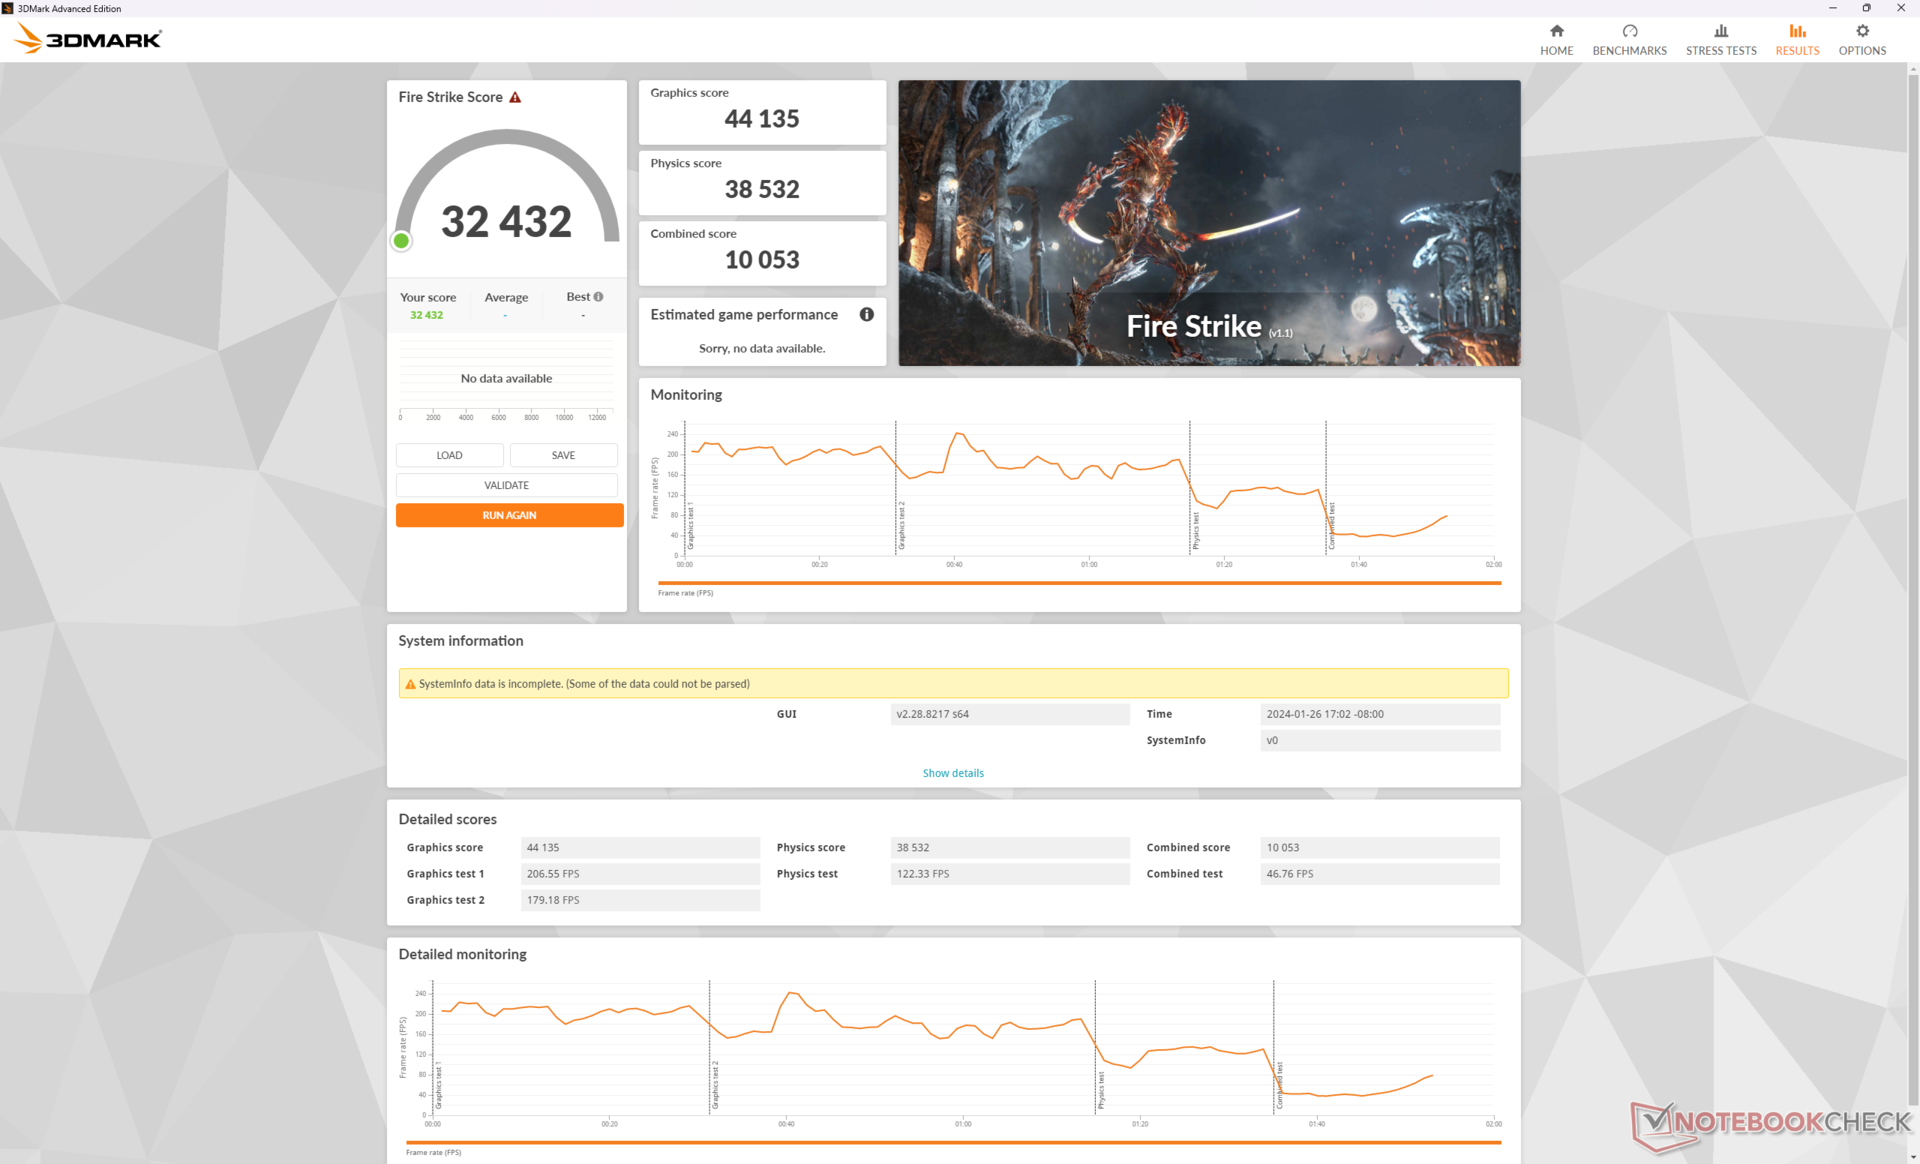
| 3DMark Fire Strike Score | 32432 pontos | |
| 3DMark Time Spy Score | 18392 pontos | |
Ajuda | ||
* ... menor é melhor
Desempenho em jogos
Todos os títulos atuais são executados sem problemas na resolução de tela nativa de 1600p com a maioria das configurações no máximo. No entanto, o senhor pode considerar a possibilidade de ativar o v-sync ou limitar a taxa de quadros a 120 devido à falta do G-Sync. O Baldur's Gate, por exemplo, tem uma média de 129 FPS a 1440p, o que pode resultar em rasgo de tela na tela de 240 Hz se as taxas de quadros forem desbloqueadas.
O DLSS é recomendado para jogos em 4K, pois a RTX 4080 móvel é significativamente mais fraca do que sua para desktop. O Cyberpunk 2077 teria uma média de apenas 18,5 FPS em configurações 4K Ultra RT nativas, mas a ativação do DLSS Auto e da geração de quadros aumentaria a média para 75,8 FPS.
| Performance rating - Percent | |
| MSI Vector 16 HX A14V | |
| Lenovo Legion 5 16IRX G9 | |
| MSI Vector GP66 12UGS | |
| HP Victus 16-r0077ng | |
| Dell G16 7620 | |
| Asus TUF Gaming A16 FA617XS | |
| The Witcher 3 - 1920x1080 Ultra Graphics & Postprocessing (HBAO+) | |
| MSI Vector 16 HX A14V | |
| MSI Vector GP66 12UGS | |
| HP Victus 16-r0077ng | |
| Asus TUF Gaming A16 FA617XS | |
| Lenovo Legion 5 16IRX G9 | |
| Dell G16 7620 | |
| GTA V - 1920x1080 Highest AA:4xMSAA + FX AF:16x | |
| MSI Vector 16 HX A14V | |
| MSI Vector GP66 12UGS | |
| Lenovo Legion 5 16IRX G9 | |
| HP Victus 16-r0077ng | |
| Dell G16 7620 | |
| Asus TUF Gaming A16 FA617XS | |
| Final Fantasy XV Benchmark - 1920x1080 High Quality | |
| MSI Vector 16 HX A14V | |
| MSI Vector GP66 12UGS | |
| HP Victus 16-r0077ng | |
| Lenovo Legion 5 16IRX G9 | |
| Dell G16 7620 | |
| Asus TUF Gaming A16 FA617XS | |
| Strange Brigade - 1920x1080 ultra AA:ultra AF:16 | |
| MSI Vector 16 HX A14V | |
| MSI Vector GP66 12UGS | |
| Lenovo Legion 5 16IRX G9 | |
| HP Victus 16-r0077ng | |
| Asus TUF Gaming A16 FA617XS | |
| Dell G16 7620 | |
| Dota 2 Reborn - 1920x1080 ultra (3/3) best looking | |
| MSI Vector 16 HX A14V | |
| Lenovo Legion 5 16IRX G9 | |
| MSI Vector GP66 12UGS | |
| Dell G16 7620 | |
| HP Victus 16-r0077ng | |
| Asus TUF Gaming A16 FA617XS | |
| X-Plane 11.11 - 1920x1080 high (fps_test=3) | |
| MSI Vector 16 HX A14V | |
| Lenovo Legion 5 16IRX G9 | |
| MSI Vector GP66 12UGS | |
| Dell G16 7620 | |
| HP Victus 16-r0077ng | |
| Asus TUF Gaming A16 FA617XS | |
| Baldur's Gate 3 | |
| 1920x1080 High Preset AA:T | |
| MSI Vector 16 HX A14V | |
| Média NVIDIA GeForce RTX 4080 Laptop GPU (122.2 - 183.5, n=4) | |
| Framework Laptop 16 | |
| Lenovo ThinkPad Z16 Gen 2 | |
| 1920x1080 Ultra Preset AA:T | |
| MSI Vector 16 HX A14V | |
| Média NVIDIA GeForce RTX 4080 Laptop GPU (111.8 - 181.2, n=7) | |
| Framework Laptop 16 | |
| Lenovo ThinkPad Z16 Gen 2 | |
| 2560x1440 Ultra Preset AA:T | |
| MSI Vector 16 HX A14V | |
| Média NVIDIA GeForce RTX 4080 Laptop GPU (88.3 - 129.3, n=7) | |
| Framework Laptop 16 | |
| Lenovo ThinkPad Z16 Gen 2 | |
| 3840x2160 Ultra Preset AA:T | |
| MSI Vector 16 HX A14V | |
| Média NVIDIA GeForce RTX 4080 Laptop GPU (48.8 - 68.4, n=5) | |
| Framework Laptop 16 | |
| Cyberpunk 2077 | |
| 1920x1080 High Preset (FSR off) | |
| MSI Vector 16 HX A14V | |
| Média NVIDIA GeForce RTX 4080 Laptop GPU (94.1 - 141.3, n=9) | |
| Lenovo Legion 5 16IRX G9 | |
| Framework Laptop 16 | |
| Lenovo ThinkPad Z16 Gen 2 | |
| 1920x1080 Ultra Preset (FSR off) | |
| MSI Vector 16 HX A14V | |
| Média NVIDIA GeForce RTX 4080 Laptop GPU (83.9 - 127.1, n=15) | |
| Lenovo Legion 5 16IRX G9 | |
| Framework Laptop 16 | |
| Lenovo ThinkPad Z16 Gen 2 | |
| 2560x1440 Ultra Preset (FSR off) | |
| MSI Vector 16 HX A14V | |
| Média NVIDIA GeForce RTX 4080 Laptop GPU (56.2 - 86.3, n=15) | |
| Lenovo Legion 5 16IRX G9 | |
| Framework Laptop 16 | |
| Lenovo ThinkPad Z16 Gen 2 | |
| 3840x2160 Ultra Preset (FSR off) | |
| MSI Vector 16 HX A14V | |
| Média NVIDIA GeForce RTX 4080 Laptop GPU (25.8 - 39.8, n=8) | |
| Framework Laptop 16 | |
| 1920x1080 Ray Tracing Ultra Preset (DLSS off) | |
| MSI Vector 16 HX A14V | |
| Média NVIDIA GeForce RTX 4080 Laptop GPU (43.8 - 67.2, n=12) | |
| Framework Laptop 16 | |
| Lenovo ThinkPad Z16 Gen 2 | |
| 3840x2160 Ray Tracing Ultra Preset (DLSS off, no Path Tracing) | |
| MSI Vector 16 HX A14V | |
| Média NVIDIA GeForce RTX 4080 Laptop GPU (16 - 20, n=5) | |
Witcher 3 FPS Chart
| baixo | média | alto | ultra | QHD | 4K | |
|---|---|---|---|---|---|---|
| GTA V (2015) | 187.1 | 185.7 | 181.9 | 136.5 | 128.8 | 158.6 |
| The Witcher 3 (2015) | 640 | 513.3 | 384.6 | 183.3 | 121.2 | |
| Dota 2 Reborn (2015) | 217 | 194.8 | 186.7 | 175 | 168.4 | |
| Final Fantasy XV Benchmark (2018) | 232 | 219 | 178.8 | 142 | 79.5 | |
| X-Plane 11.11 (2018) | 204 | 177.4 | 137.7 | 118.1 | ||
| Far Cry 5 (2018) | 180 | 167 | 161 | 154 | 97 | |
| Strange Brigade (2018) | 505 | 405 | 378 | 349 | 248 | 123.2 |
| Tiny Tina's Wonderlands (2022) | 344 | 297.1 | 212.8 | 167.1 | 114.8 | 60.3 |
| F1 22 (2022) | 339 | 324 | 297 | 81.2 | 76.9 | 39.6 |
| Baldur's Gate 3 (2023) | 228.5 | 204.3 | 183.5 | 181.2 | 129.3 | 68.4 |
| Cyberpunk 2077 (2023) | 143.4 | 135.3 | 127.1 | 118.6 | 79.4 | 36.6 |
Emissions - Loud And Proud
Ruído do sistema
O sistema é bastante barulhento, mesmo quando está simplesmente em repouso na área de trabalho nos perfis de energia Balanced ou Silent. O ruído da ventoinha durante a execução Witcher 3 no modo Extreme Performance, fica em 62 dB(A), independentemente da configuração do Cooler Boost. A faixa de mais de 60 dB(A) abriga alguns dos notebooks mais barulhentos do nosso banco de dados, a ponto de recomendar o uso de fones de ouvido para uma melhor experiência de jogo.
Os jogos no modo Balanced reduzirão significativamente o teto de ruído da ventoinha para a faixa de 54 dB(A). Embora ainda seja alto, não é nem de longe tão ruim quanto no modo Extreme Performance. Portanto, os usuários podem preferir jogar no modo balanceado em vez do modo de desempenho extremo, embora isso implique uma queda de 16% no desempenho da GPU, conforme mencionado acima.
Barulho
| Ocioso |
| 33.5 / 33.5 / 33.5 dB |
| Carga |
| 52.1 / 62 dB |
 | ||
30 dB silencioso 40 dB(A) audível 50 dB(A) ruidosamente alto |
||
min: | ||
| MSI Vector 16 HX A14V GeForce RTX 4080 Laptop GPU, i9-14900HX, WD PC SN560 SDDPNQE-1T00 | MSI Vector GP66 12UGS GeForce RTX 3070 Ti Laptop GPU, i9-12900H | Lenovo Legion 5 16IRX G9 GeForce RTX 4060 Laptop GPU, i7-14650HX, Samsung PM9A1 MZVL21T0HCLR | HP Victus 16-r0077ng GeForce RTX 4070 Laptop GPU, i7-13700H, Kioxia XG8 KXG80ZNV1T02 | Asus TUF Gaming A16 FA617XS Radeon RX 7600S, R9 7940HS, Micron 2400 MTFDKBA512QFM | Dell G16 7620 GeForce RTX 3060 Laptop GPU, i7-12700H, WDC PC SN810 512GB | |
|---|---|---|---|---|---|---|
| Noise | 17% | 11% | 14% | 15% | 18% | |
| desligado / ambiente * (dB) | 23.2 | 22.9 1% | 24 -3% | 25 -8% | 25 -8% | 23.2 -0% |
| Idle Minimum * (dB) | 33.5 | 23.4 30% | 24 28% | 28 16% | 25 25% | 28.3 16% |
| Idle Average * (dB) | 33.5 | 23.4 30% | 28.8 14% | 29 13% | 26 22% | 28.8 14% |
| Idle Maximum * (dB) | 33.5 | 27.4 18% | 32 4% | 30 10% | 28 16% | 28.9 14% |
| Load Average * (dB) | 52.1 | 36 31% | 45.5 13% | 43 17% | 43 17% | 32.4 38% |
| Witcher 3 ultra * (dB) | 62 | 58.2 6% | 53.1 14% | 46 26% | 51 18% | 48.3 22% |
| Load Maximum * (dB) | 62 | 58 6% | 55.7 10% | 48 23% | 53 15% | 48.1 22% |
* ... menor é melhor
Temperatura
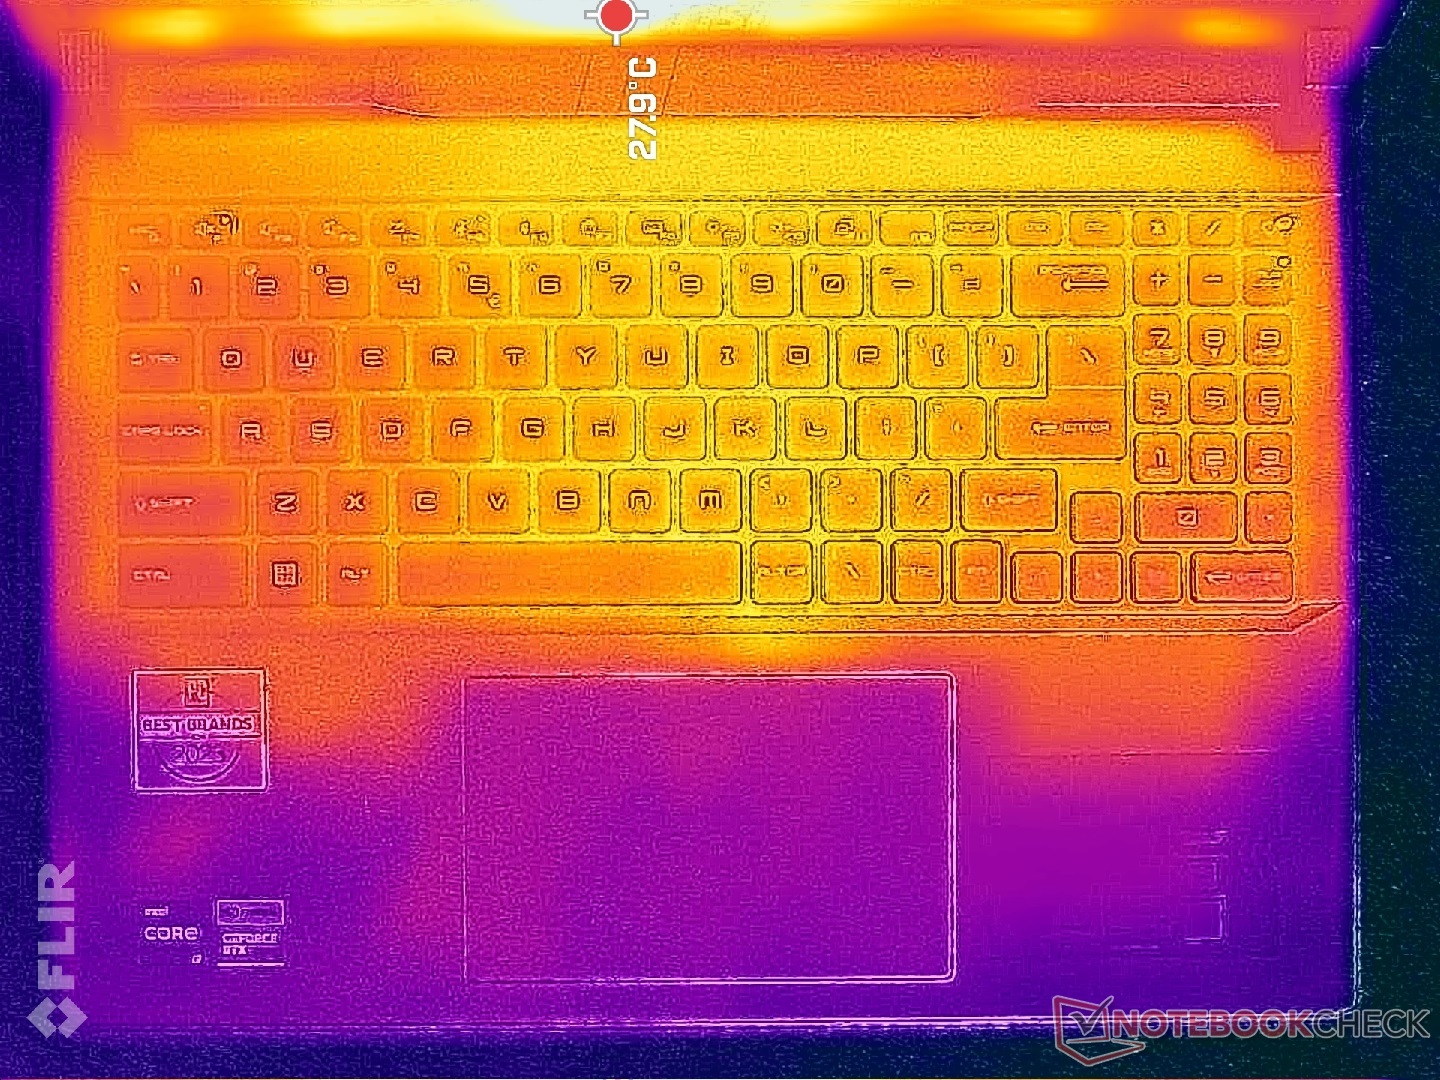
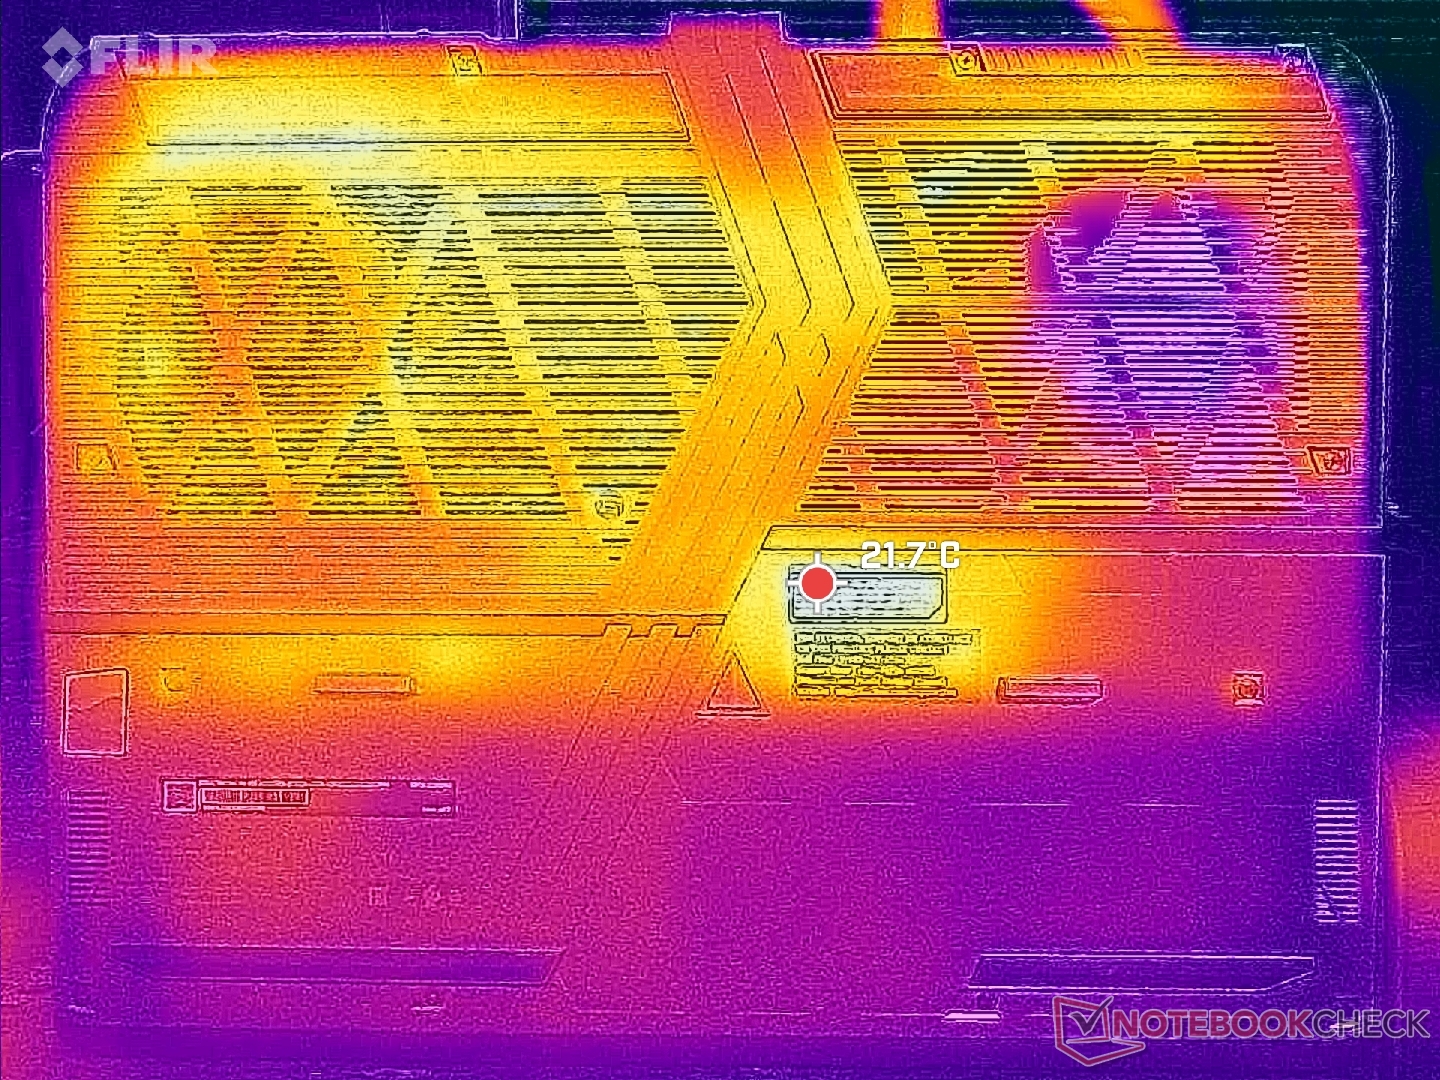
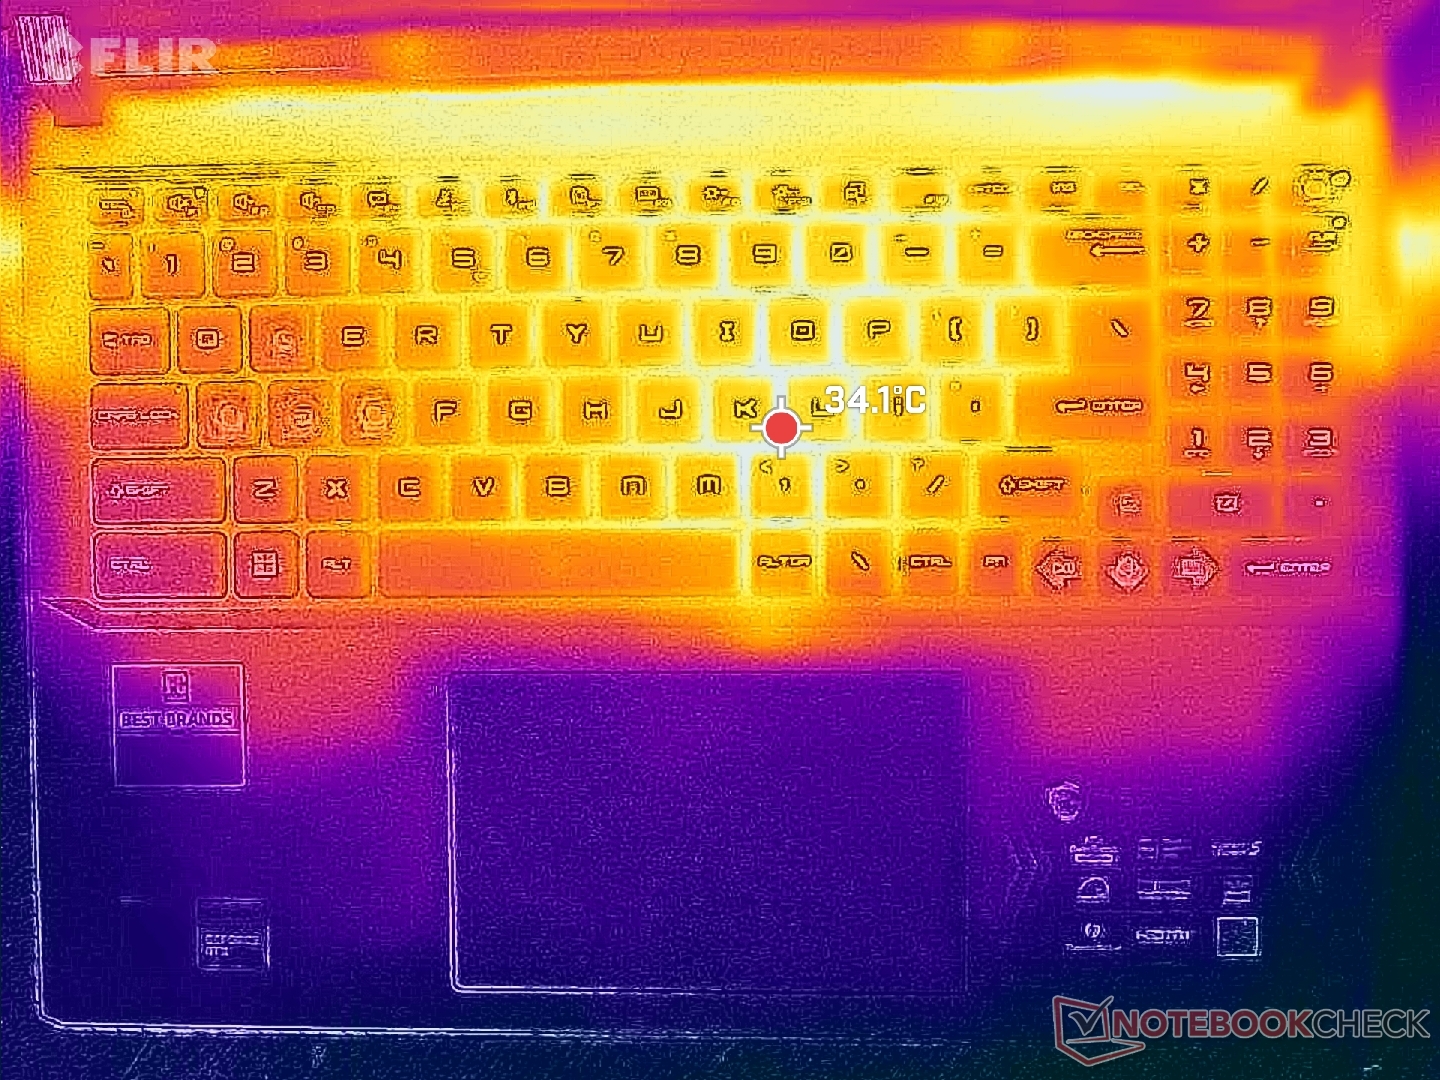
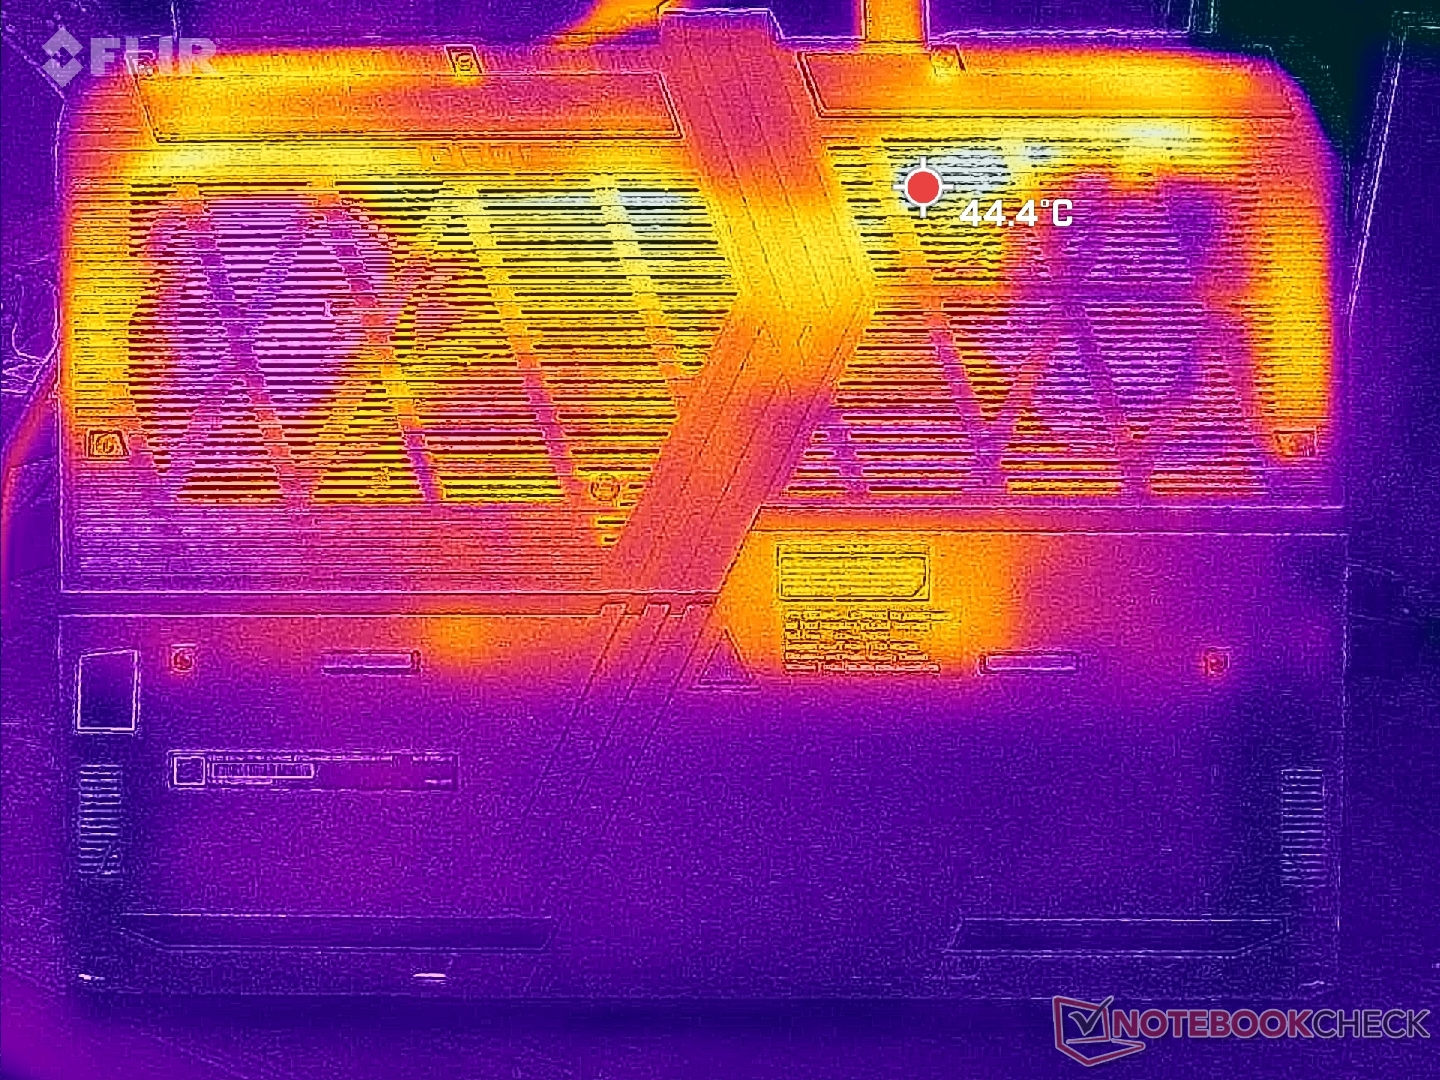
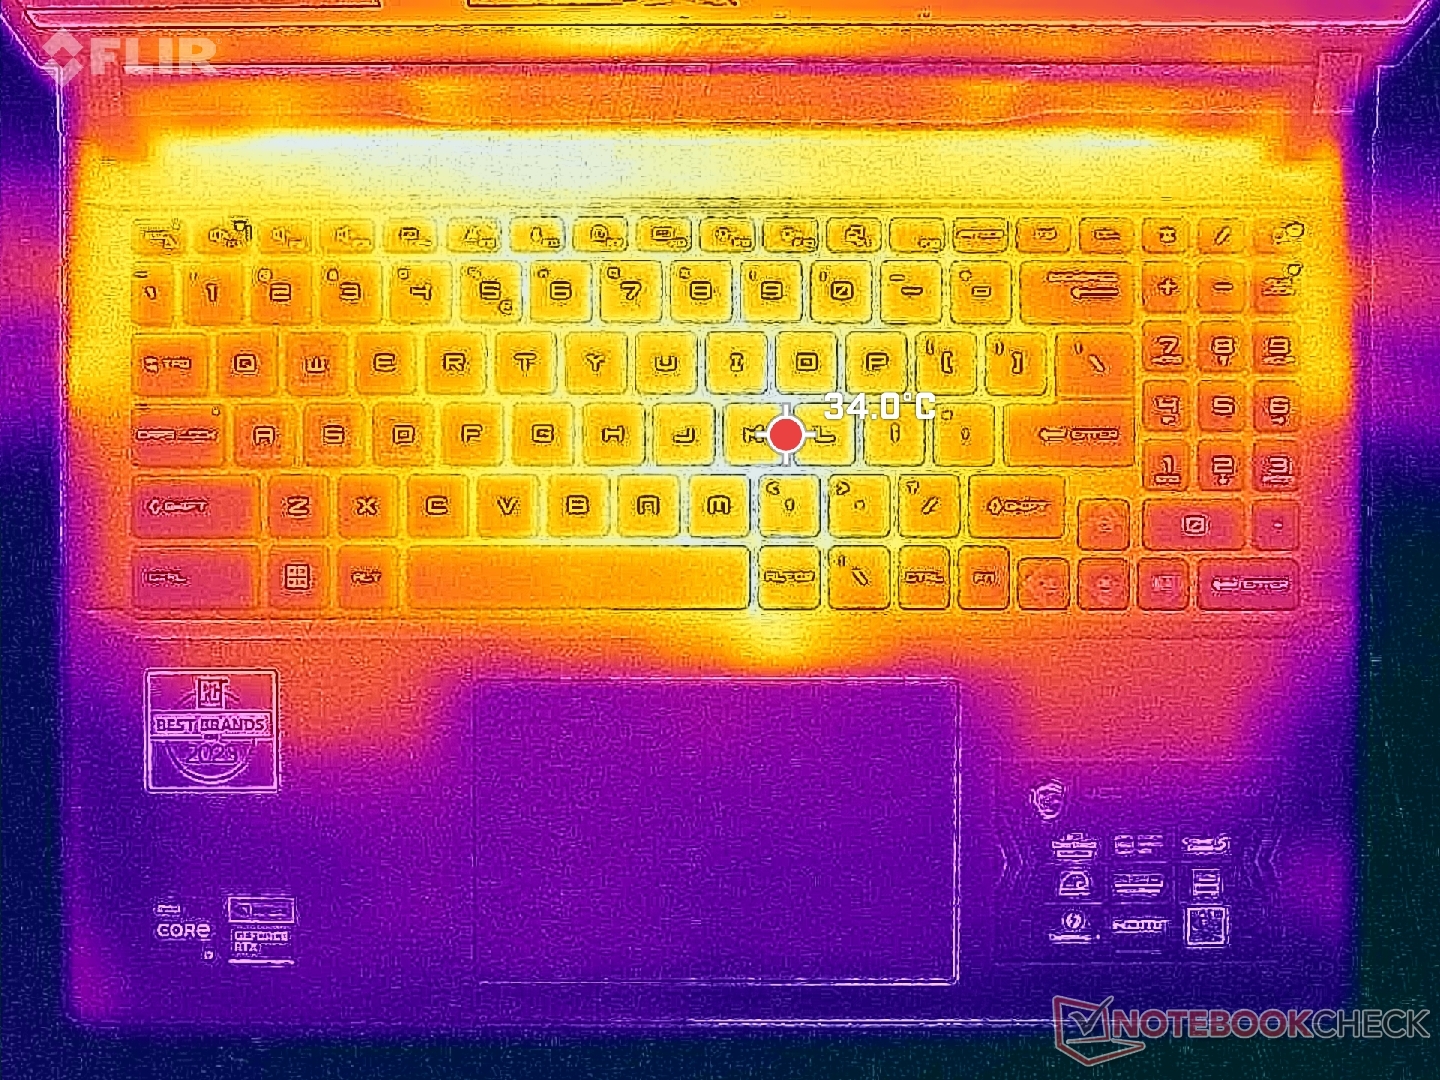
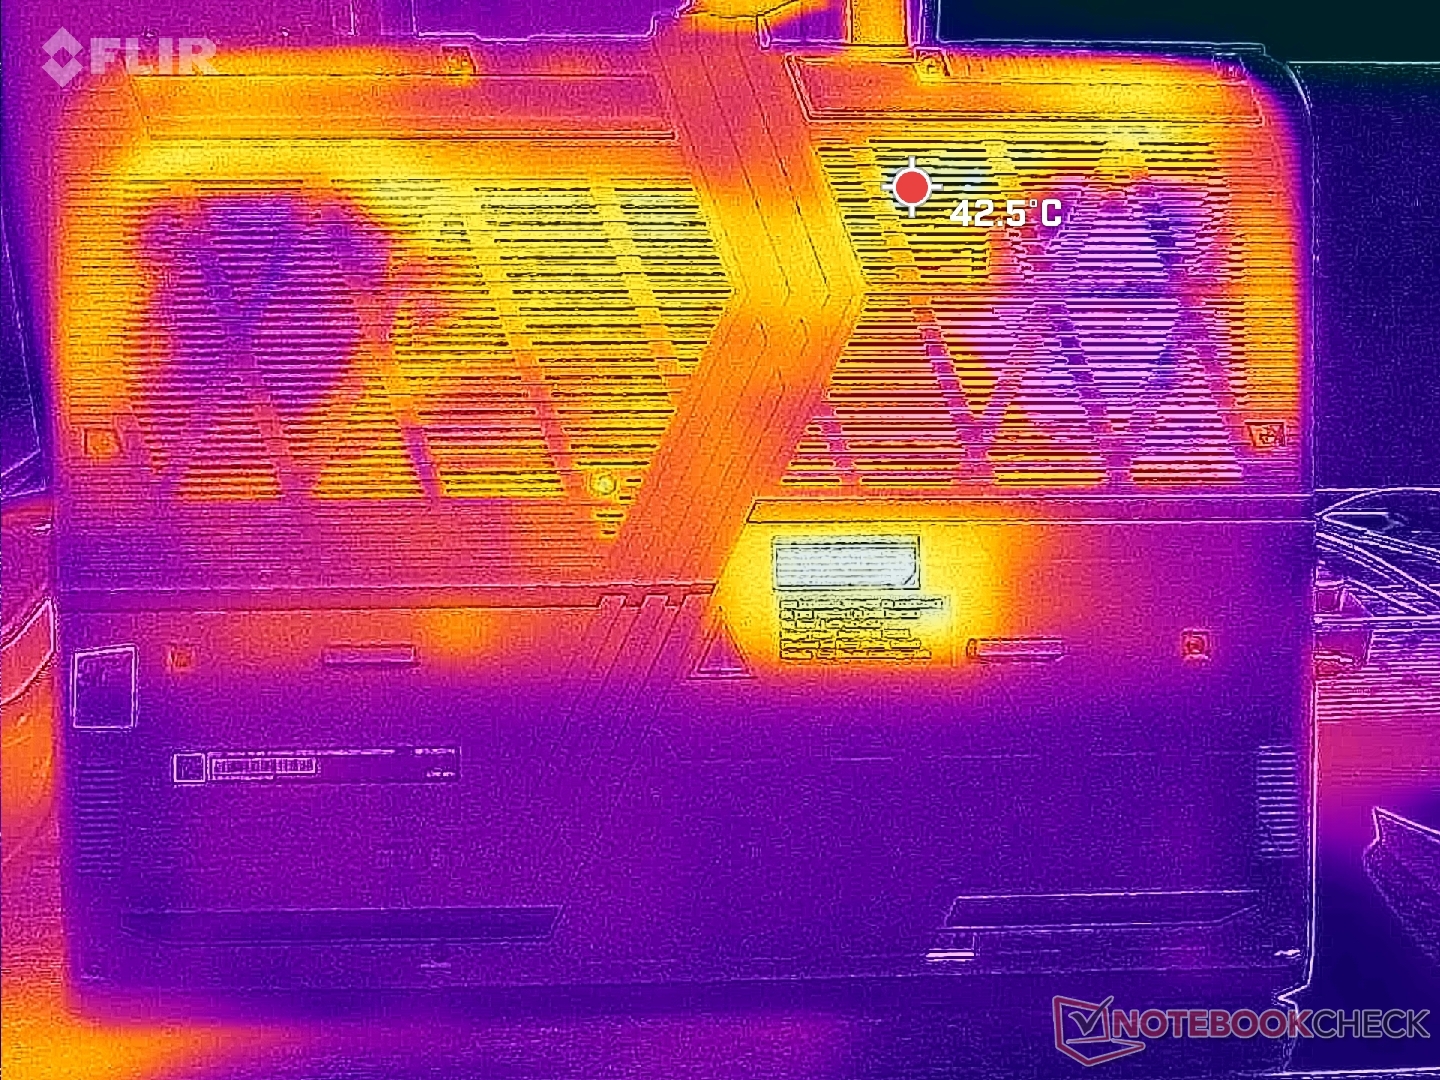
As temperaturas da superfície são mais baixas do que a maioria dos outros notebooks para jogos devido à base de plástico, às amplas grades de ventilação e ao design espesso do chassi. Na verdade, esse é um dos laptops para jogos mais frios que testamos com uma RTX 4080. Ao executar Witcher 3o ponto quente no centro do teclado atingia apenas 34 °C, em comparação com 39 °C no Legion 5i 16 G9 ou no antigo Vector GP66.
(+) A temperatura máxima no lado superior é 36.4 °C / 98 F, em comparação com a média de 40.4 °C / 105 F , variando de 21.2 a 68.8 °C para a classe Gaming.
(+) A parte inferior aquece até um máximo de 35.6 °C / 96 F, em comparação com a média de 43.2 °C / 110 F
(+) Em uso inativo, a temperatura média para o lado superior é 24.5 °C / 76 F, em comparação com a média do dispositivo de 33.9 °C / ### class_avg_f### F.
(+) Jogando The Witcher 3, a temperatura média para o lado superior é 30.4 °C / 87 F, em comparação com a média do dispositivo de 33.9 °C / ## #class_avg_f### F.
(+) Os apoios para as mãos e o touchpad são mais frios que a temperatura da pele, com um máximo de 24 °C / 75.2 F e, portanto, são frios ao toque.
(+) A temperatura média da área do apoio para as mãos de dispositivos semelhantes foi 28.8 °C / 83.8 F (+4.8 °C / 8.6 F).
| MSI Vector 16 HX A14V Intel Core i9-14900HX, NVIDIA GeForce RTX 4080 Laptop GPU | MSI Vector GP66 12UGS Intel Core i9-12900H, NVIDIA GeForce RTX 3070 Ti Laptop GPU | Lenovo Legion 5 16IRX G9 Intel Core i7-14650HX, NVIDIA GeForce RTX 4060 Laptop GPU | HP Victus 16-r0077ng Intel Core i7-13700H, NVIDIA GeForce RTX 4070 Laptop GPU | Asus TUF Gaming A16 FA617XS AMD Ryzen 9 7940HS, AMD Radeon RX 7600S | Dell G16 7620 Intel Core i7-12700H, NVIDIA GeForce RTX 3060 Laptop GPU | |
|---|---|---|---|---|---|---|
| Heat | -25% | -20% | -35% | -26% | -15% | |
| Maximum Upper Side * (°C) | 36.4 | 40.2 -10% | 40.4 -11% | 51 -40% | 53 -46% | 47.6 -31% |
| Maximum Bottom * (°C) | 35.6 | 43.8 -23% | 43.8 -23% | 54 -52% | 48 -35% | 54 -52% |
| Idle Upper Side * (°C) | 26.6 | 34.8 -31% | 30.3 -14% | 37 -39% | 30 -13% | 23 14% |
| Idle Bottom * (°C) | 27 | 37 -37% | 35.3 -31% | 29 -7% | 30 -11% | 24.6 9% |
* ... menor é melhor
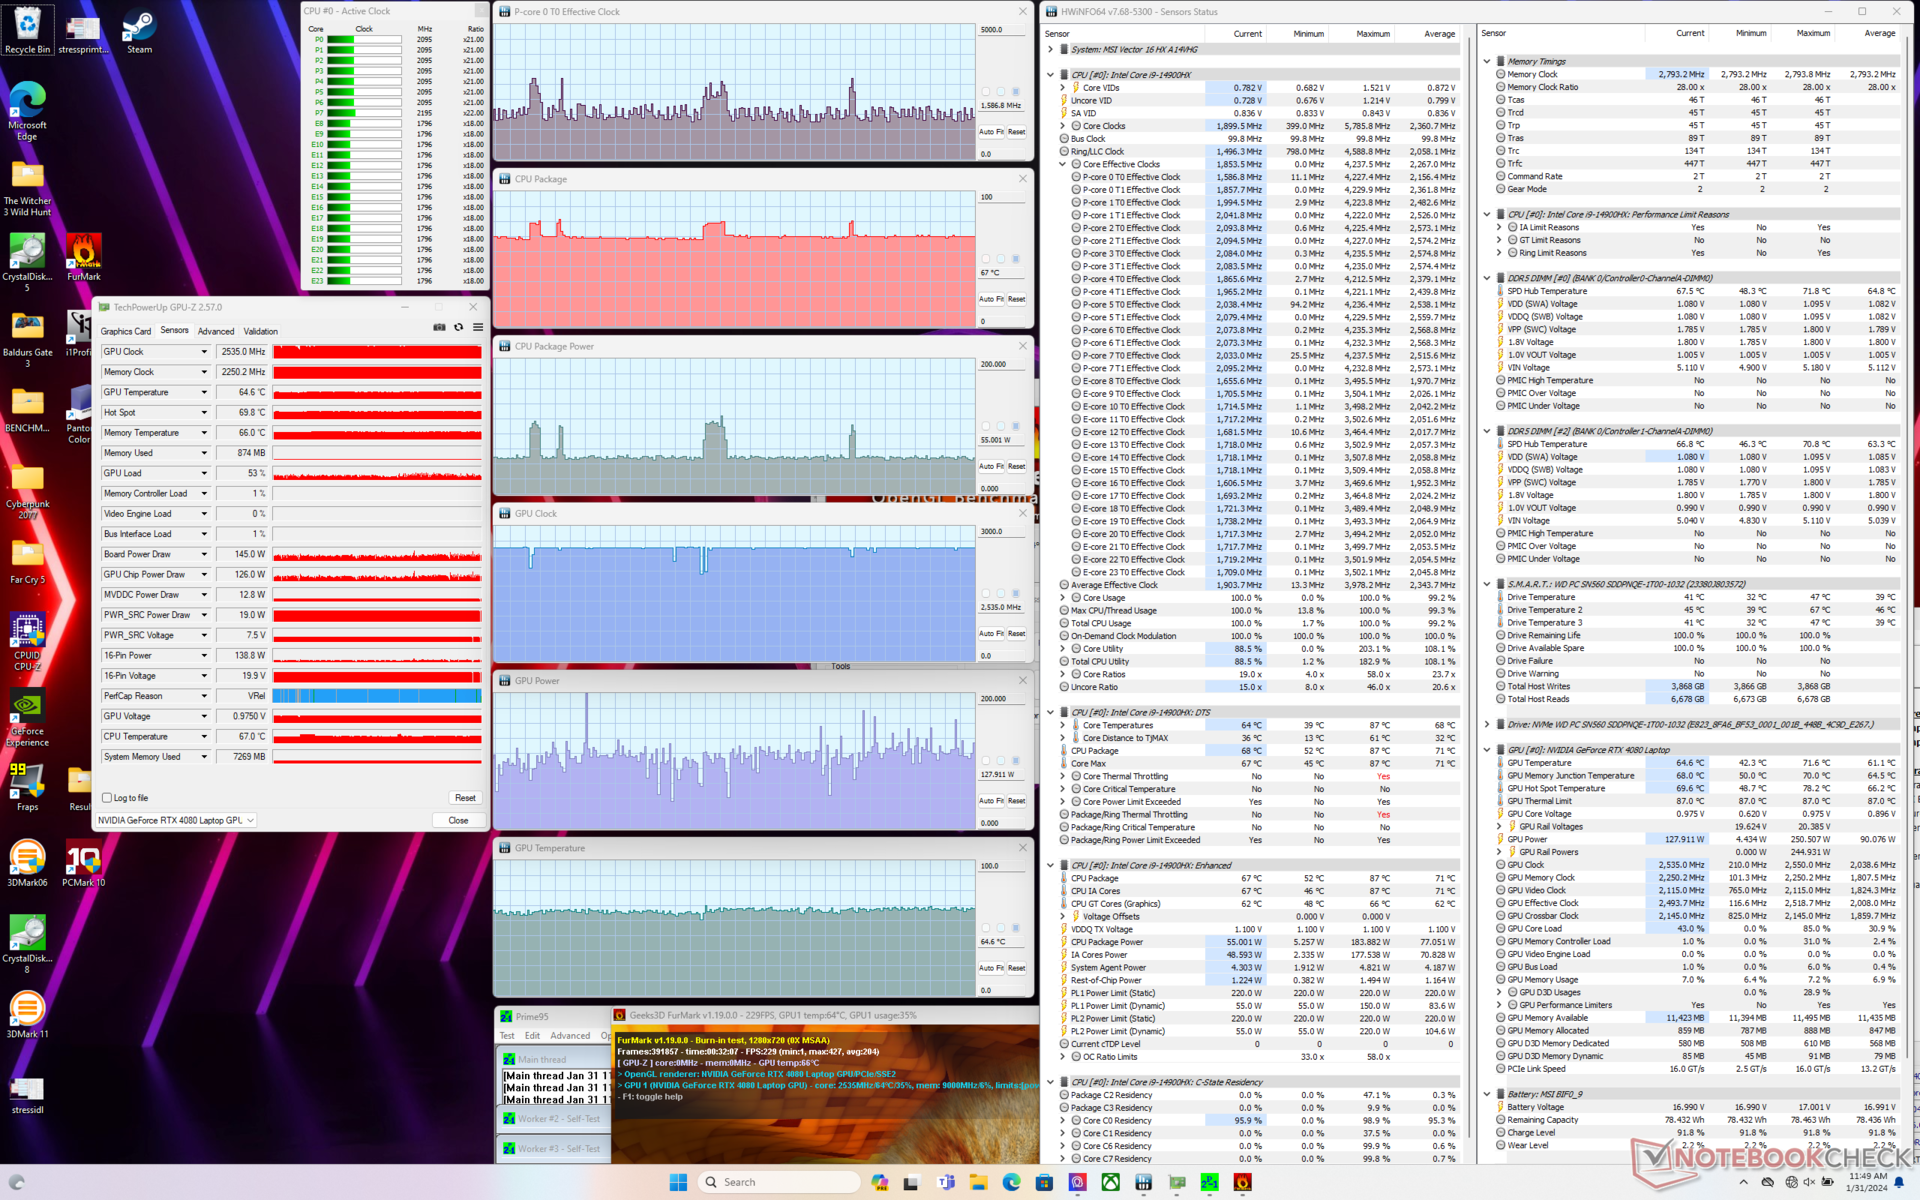
Teste de estresse
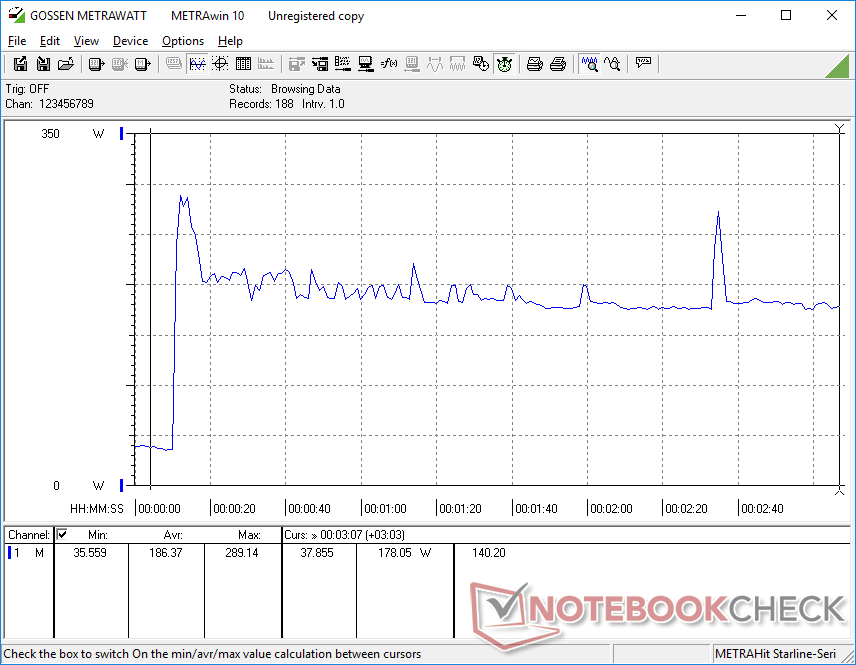
Ao iniciar o estresse do Prime95, a CPU aumentaria para 4,2 GHz e 180 W até que a temperatura do núcleo atingisse 87 C cerca de um minuto depois. Depois disso, ela cairia para ~3,3 GHz, 140 W e 82 C. Os resultados permaneceriam os mesmos mesmo se o Cooler Boost estivesse ativado.
A execução do site Witcher 3 no modo Extreme Performance para representar cargas típicas de jogos resultaria em valores estáveis de clock da GPU de 2535 MHz, temperatura central de 77 °C e consumo de energia da placa de 165 W, de acordo com o HWiNFO. Os resultados permaneceriam praticamente os mesmos, independentemente da configuração do Cooler Boost. No entanto, a redução para o modo Balanced, mais silencioso, reduziria o clock da GPU e o consumo de energia da placa para apenas 2055 MHz e 120 W, respectivamente, o que reflete a notável queda de desempenho mencionada na seção Desempenho da GPU acima.
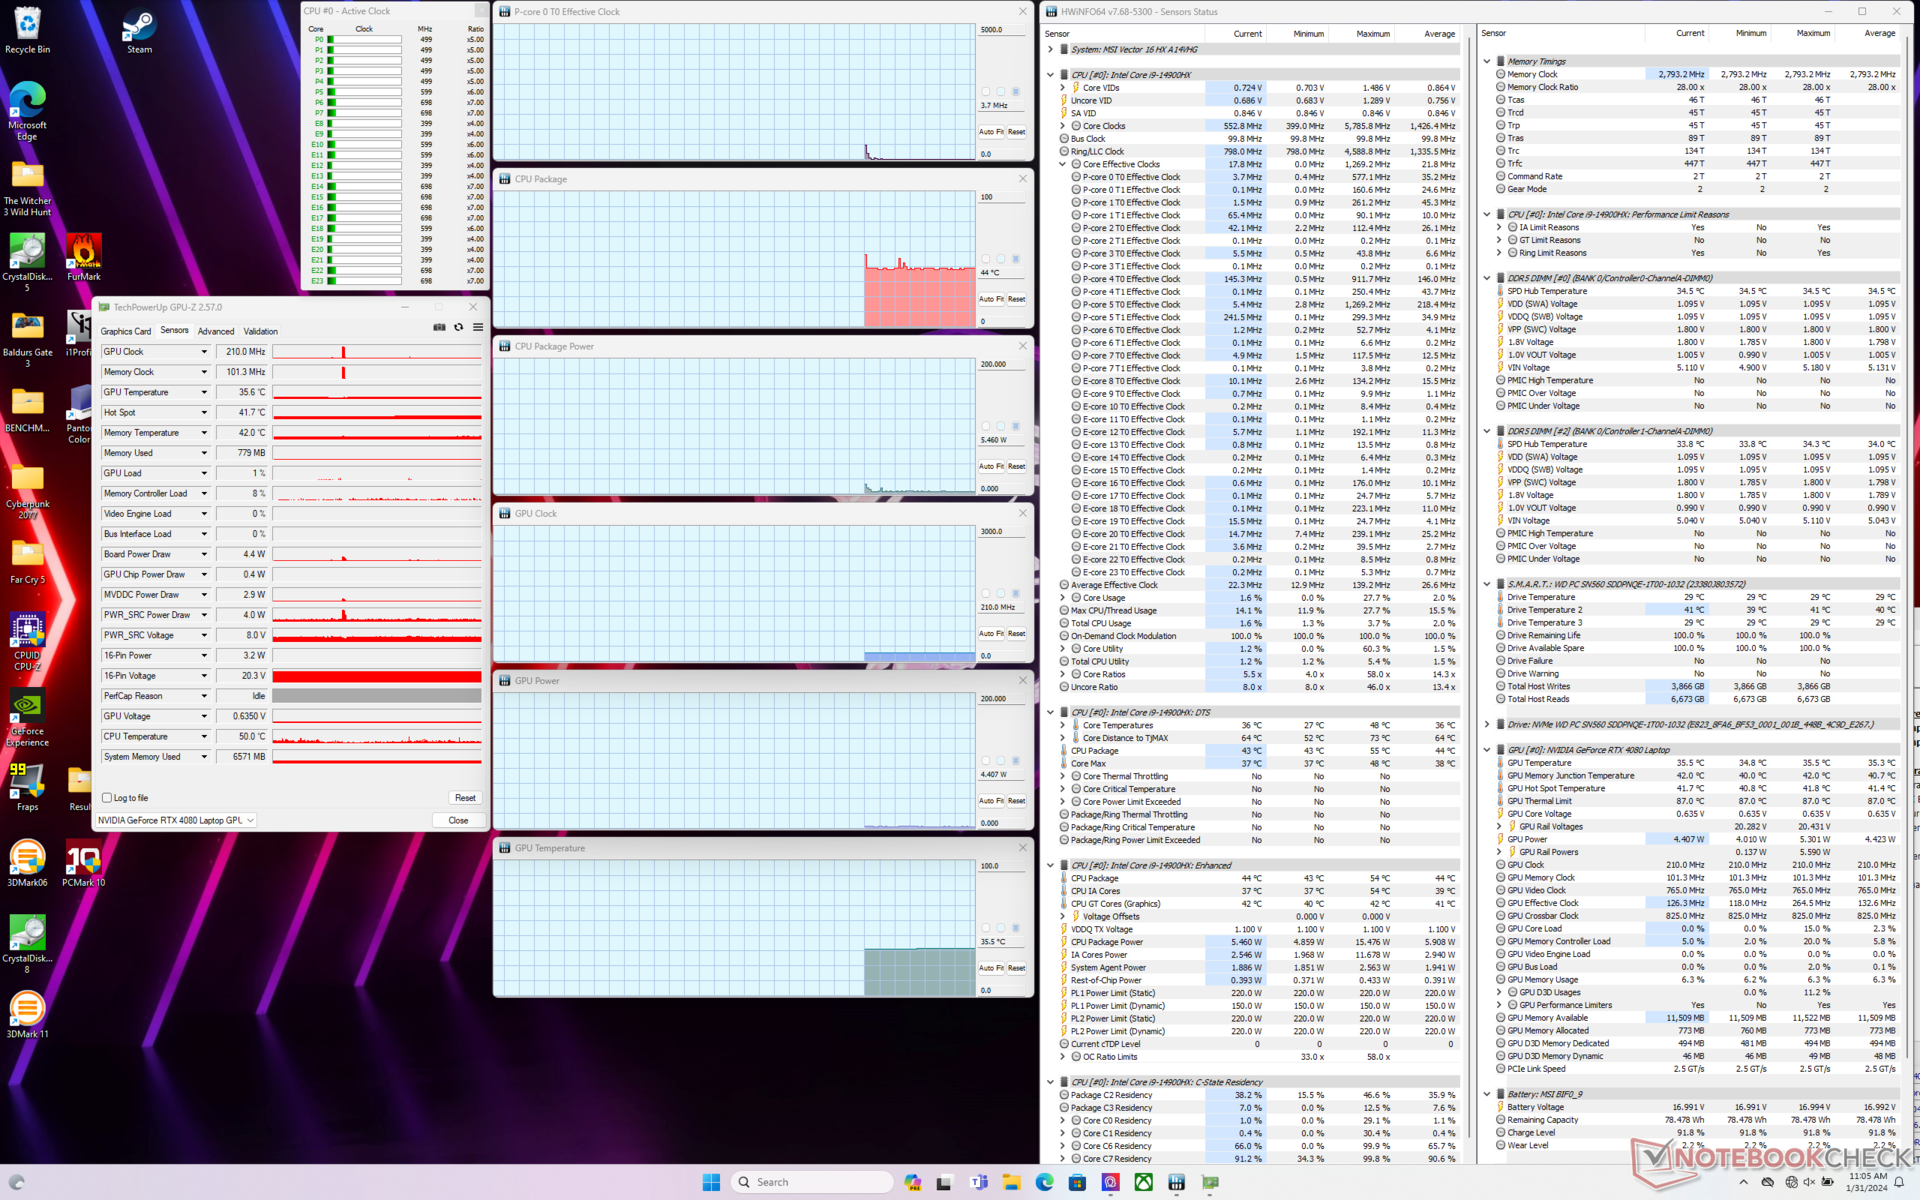
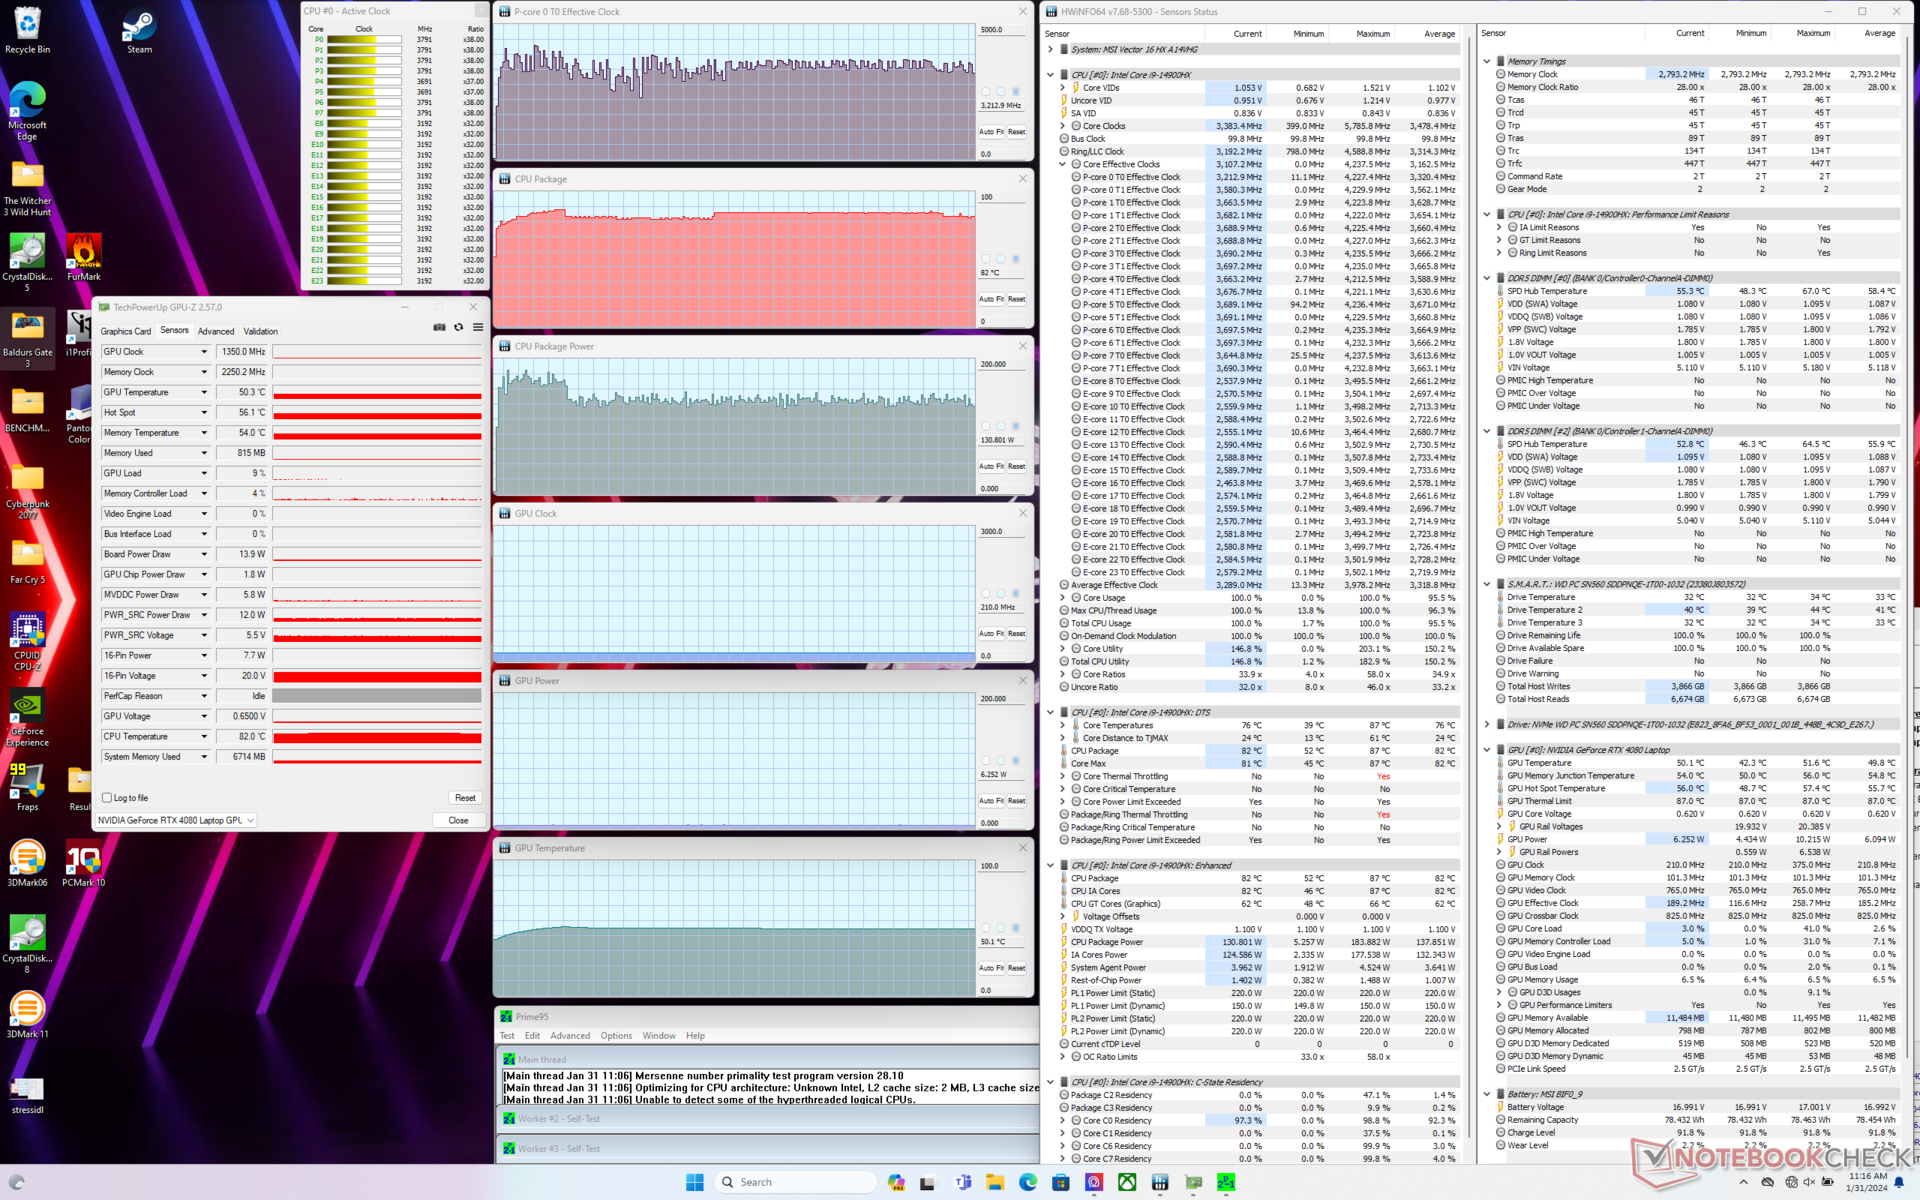
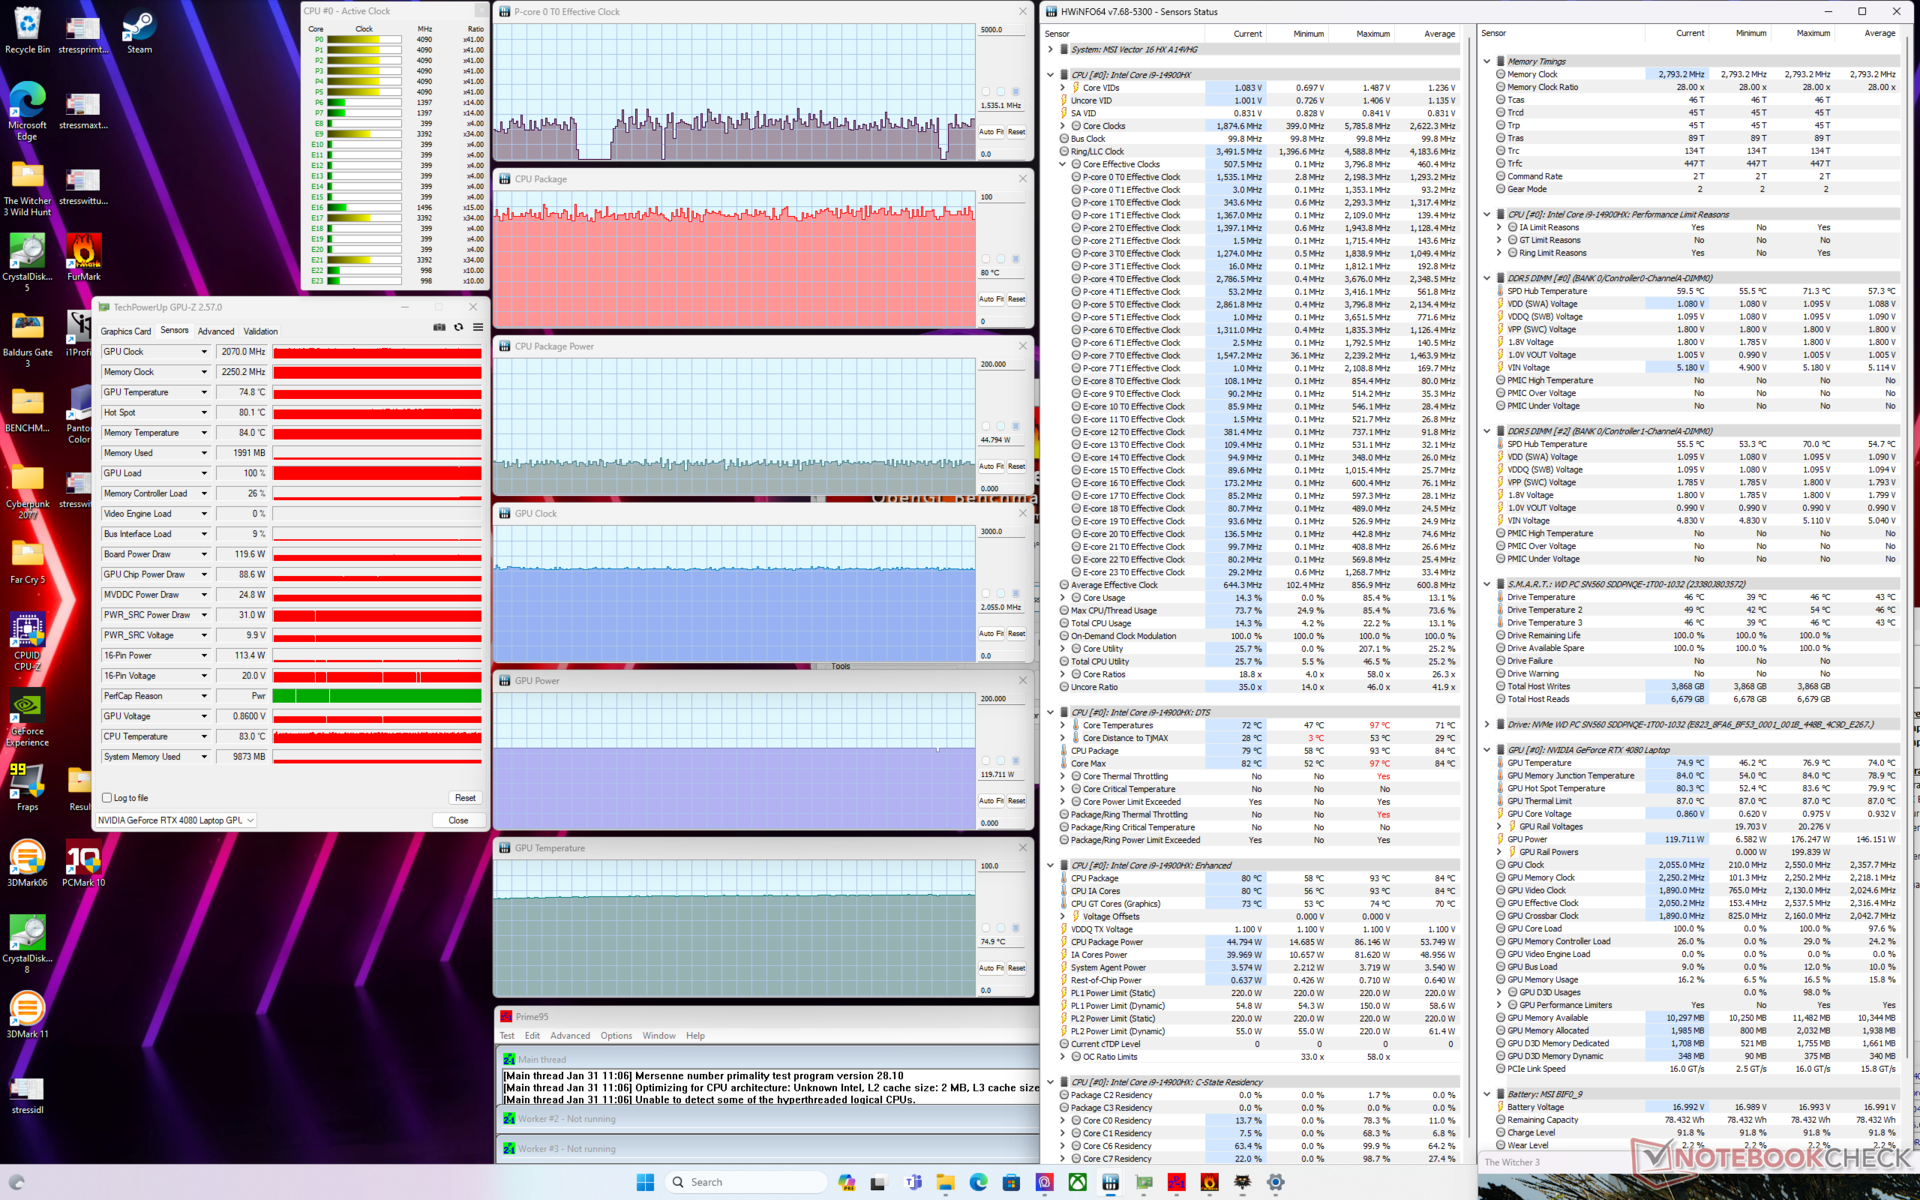
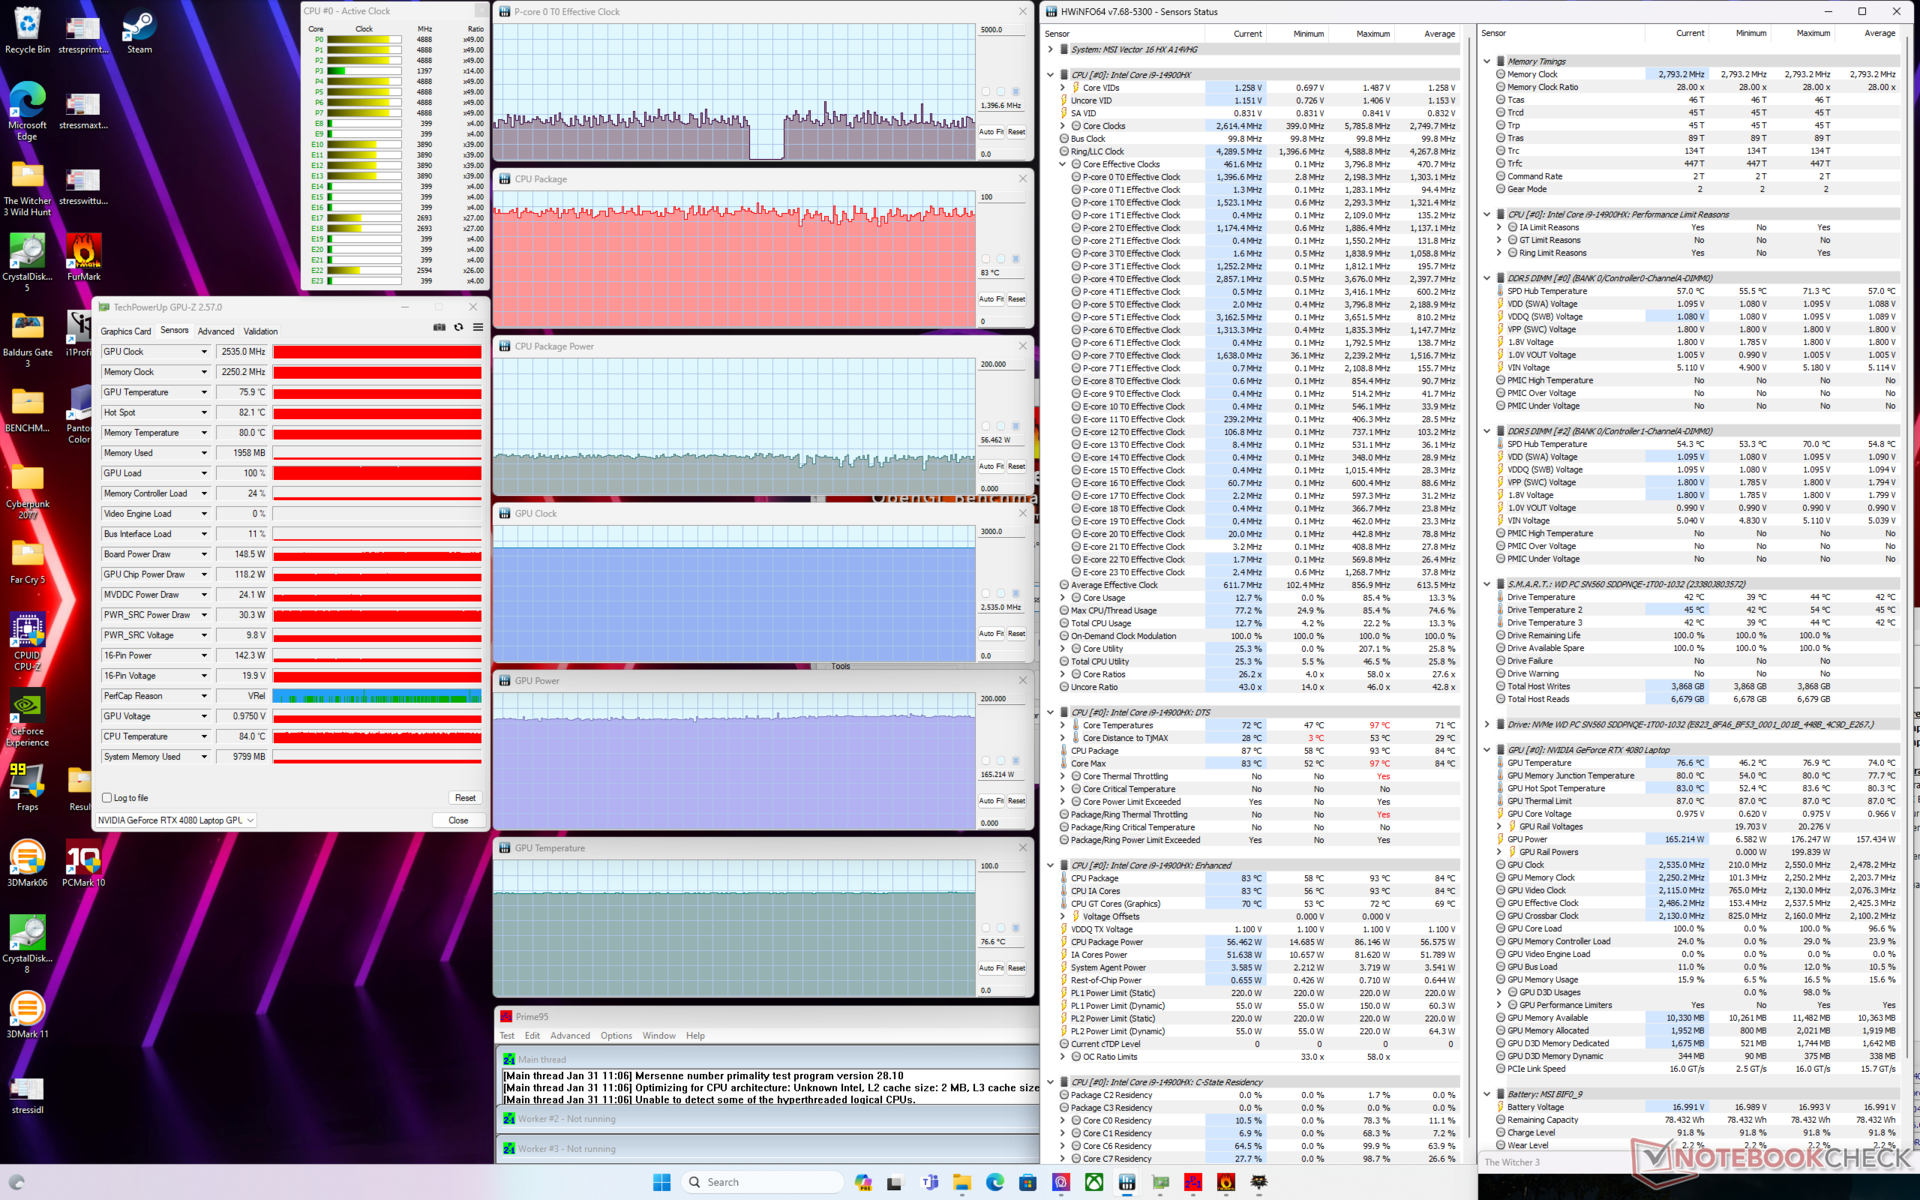
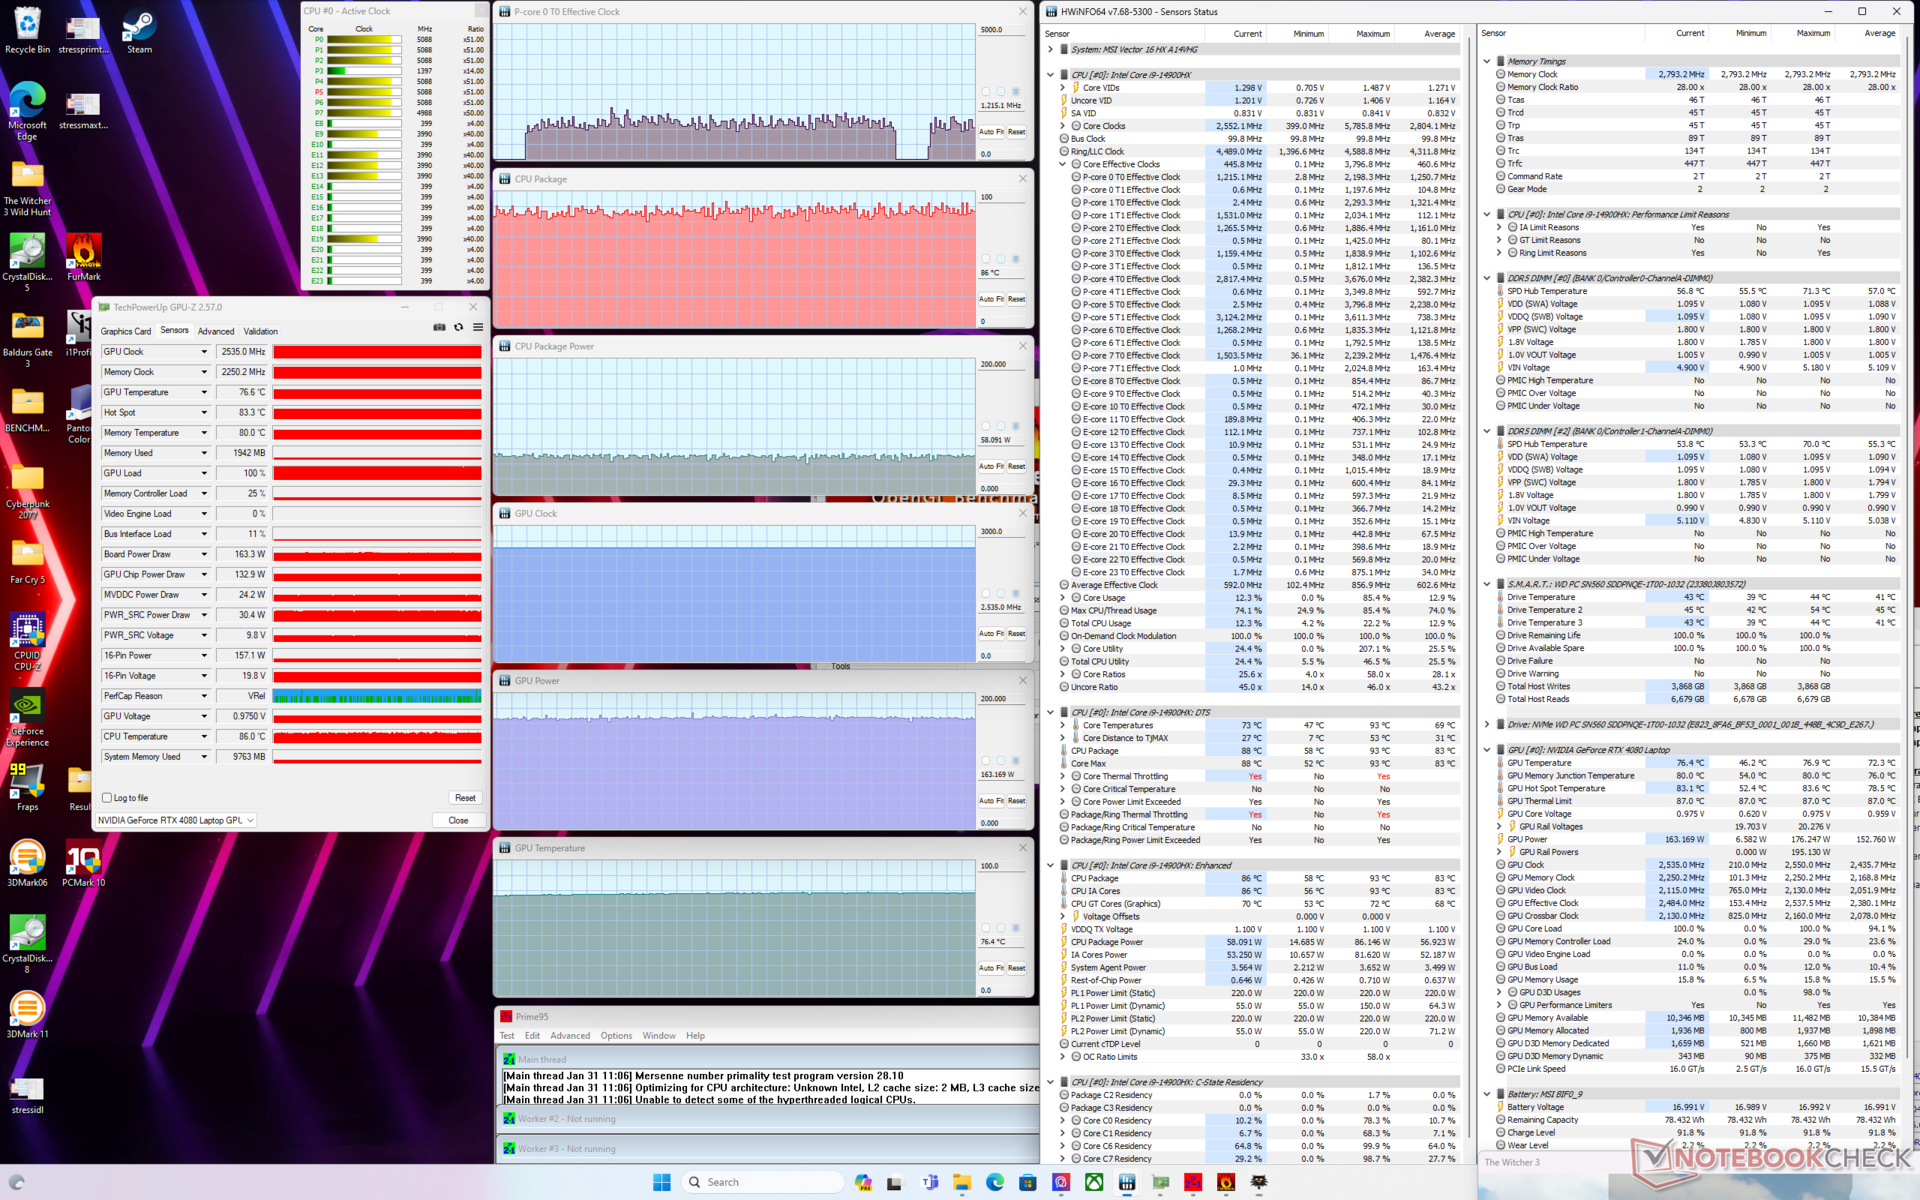
| CPU Clock (GHz) | GPU Clock (MHz) | Temperatura média da CPU (°C) | Temperatura média da GPU (°C) | |
| Sistema ocioso | -- | -- | 44 | 36 |
| Estresse doPrime95 | 3.3 | -- | 82 | 50 |
| Prime95 + FurMark Stress (Extreme Performance w/ Cooler Boost on) | ~1.7 | 2535 | 67 | 65 |
| Witcher 3 Estresse(modo balanceado) | ~1,5 | 2055 | 81 | 75 |
| Witcher 3 Stress(Extreme Performance w/ Cooler Boost off) | ~1.5 | 2535 | 83 | 77 |
| Witcher 3 Stress (ExtremePerformance w/ Cooler Boost on) | ~1.5 | 2535 | 85 | 77 |
Alto-falantes
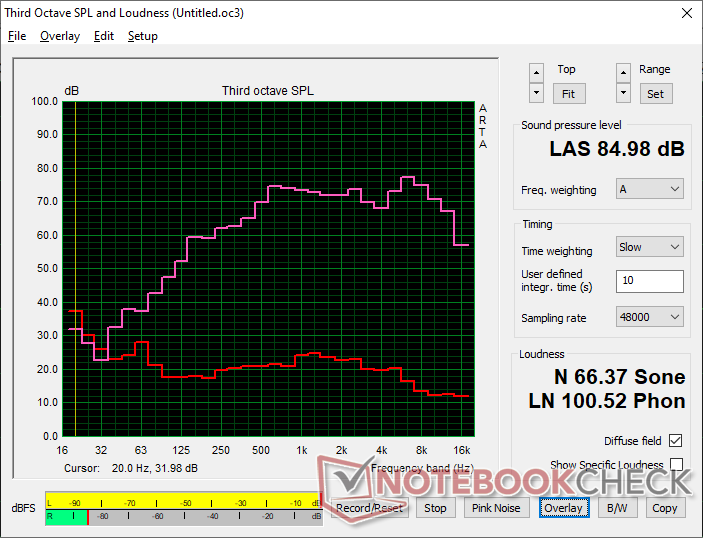
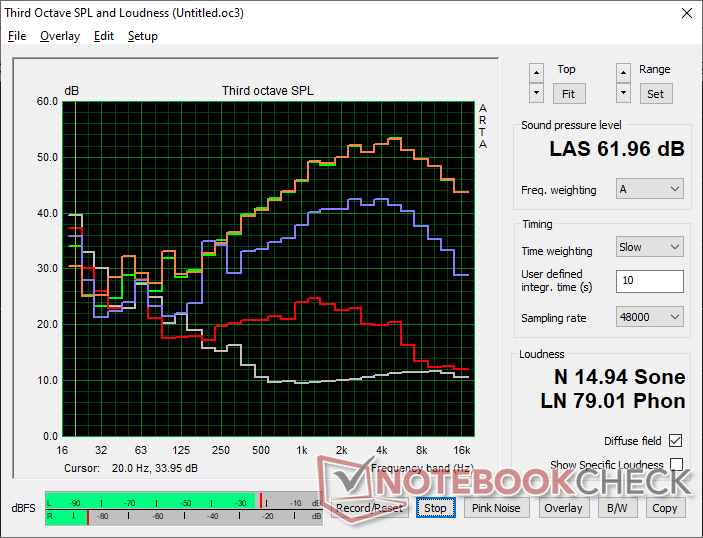
MSI Vector 16 HX A14V análise de áudio
(+) | os alto-falantes podem tocar relativamente alto (###valor### dB)
Graves 100 - 315Hz
(±) | graves reduzidos - em média 12.7% menor que a mediana
(+) | o baixo é linear (6.8% delta para a frequência anterior)
Médios 400 - 2.000 Hz
(+) | médios equilibrados - apenas 3% longe da mediana
(+) | médios são lineares (3.6% delta para frequência anterior)
Altos 2 - 16 kHz
(+) | agudos equilibrados - apenas 3.1% longe da mediana
(+) | os máximos são lineares (6.7% delta da frequência anterior)
Geral 100 - 16.000 Hz
(+) | o som geral é linear (12.6% diferença em relação à mediana)
Comparado com a mesma classe
» 16% de todos os dispositivos testados nesta classe foram melhores, 4% semelhantes, 81% piores
» O melhor teve um delta de 6%, a média foi 18%, o pior foi 132%
Comparado com todos os dispositivos testados
» 11% de todos os dispositivos testados foram melhores, 3% semelhantes, 86% piores
» O melhor teve um delta de 4%, a média foi 23%, o pior foi 134%
Apple MacBook Pro 16 2021 M1 Pro análise de áudio
(+) | os alto-falantes podem tocar relativamente alto (###valor### dB)
Graves 100 - 315Hz
(+) | bons graves - apenas 3.8% longe da mediana
(+) | o baixo é linear (5.2% delta para a frequência anterior)
Médios 400 - 2.000 Hz
(+) | médios equilibrados - apenas 1.3% longe da mediana
(+) | médios são lineares (2.1% delta para frequência anterior)
Altos 2 - 16 kHz
(+) | agudos equilibrados - apenas 1.9% longe da mediana
(+) | os máximos são lineares (2.7% delta da frequência anterior)
Geral 100 - 16.000 Hz
(+) | o som geral é linear (4.6% diferença em relação à mediana)
Comparado com a mesma classe
» 0% de todos os dispositivos testados nesta classe foram melhores, 0% semelhantes, 100% piores
» O melhor teve um delta de 5%, a média foi 17%, o pior foi 45%
Comparado com todos os dispositivos testados
» 0% de todos os dispositivos testados foram melhores, 0% semelhantes, 100% piores
» O melhor teve um delta de 4%, a média foi 23%, o pior foi 134%
Gerenciamento de energia
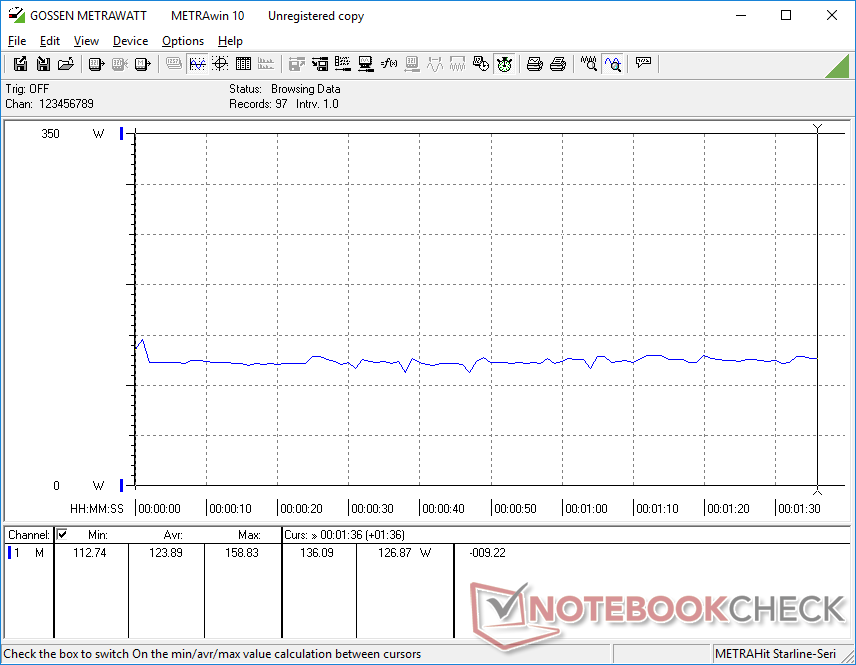
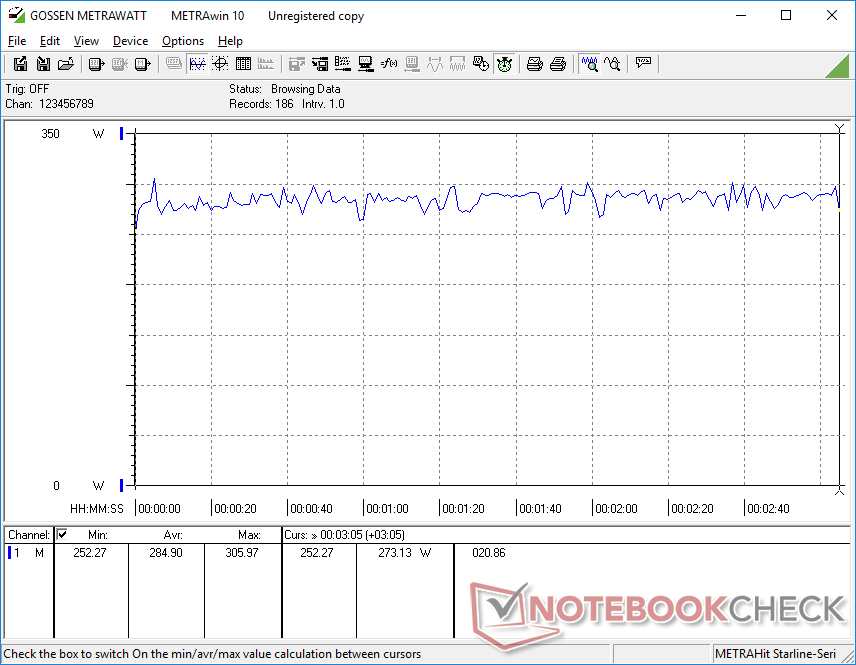
Consumo de energia
O Vector 16 HX pode ser mais rápido do que o Vector GP66, mas também consome muito mais energia. A execução do Witcher 3 e o Prime95 exigem 27% e 58% mais energia, respectivamente, em comparação com o modelo mais antigo. Mesmo assim, os ganhos de desempenho são muito maiores do que os ganhos de energia para um maior desempenho por watt.
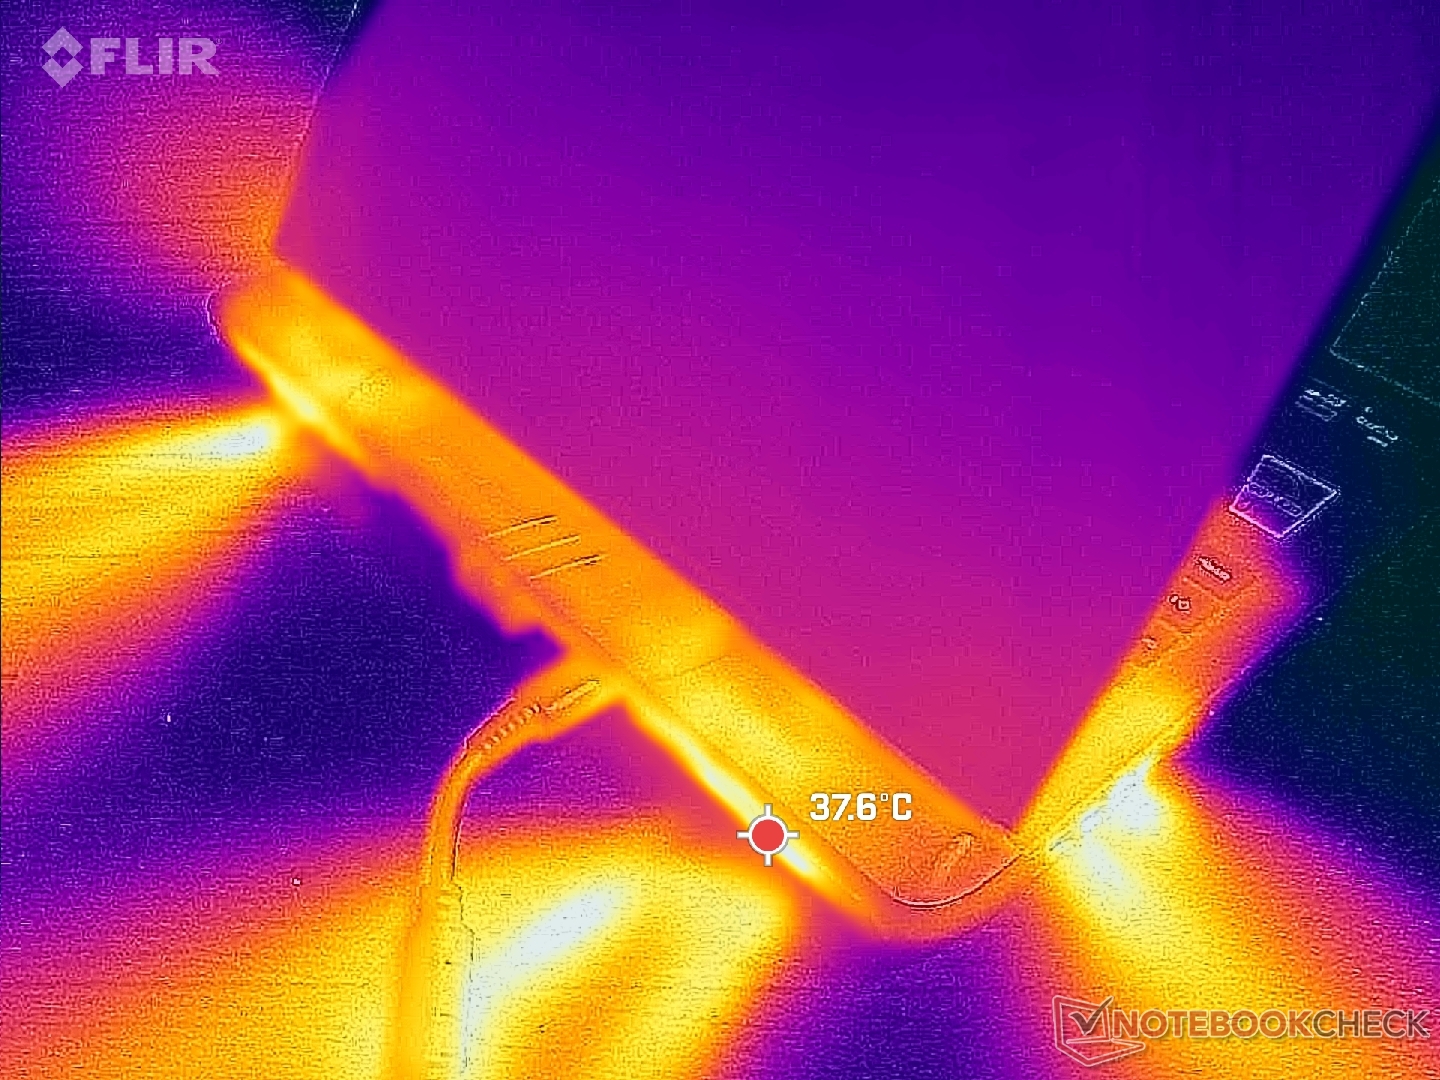
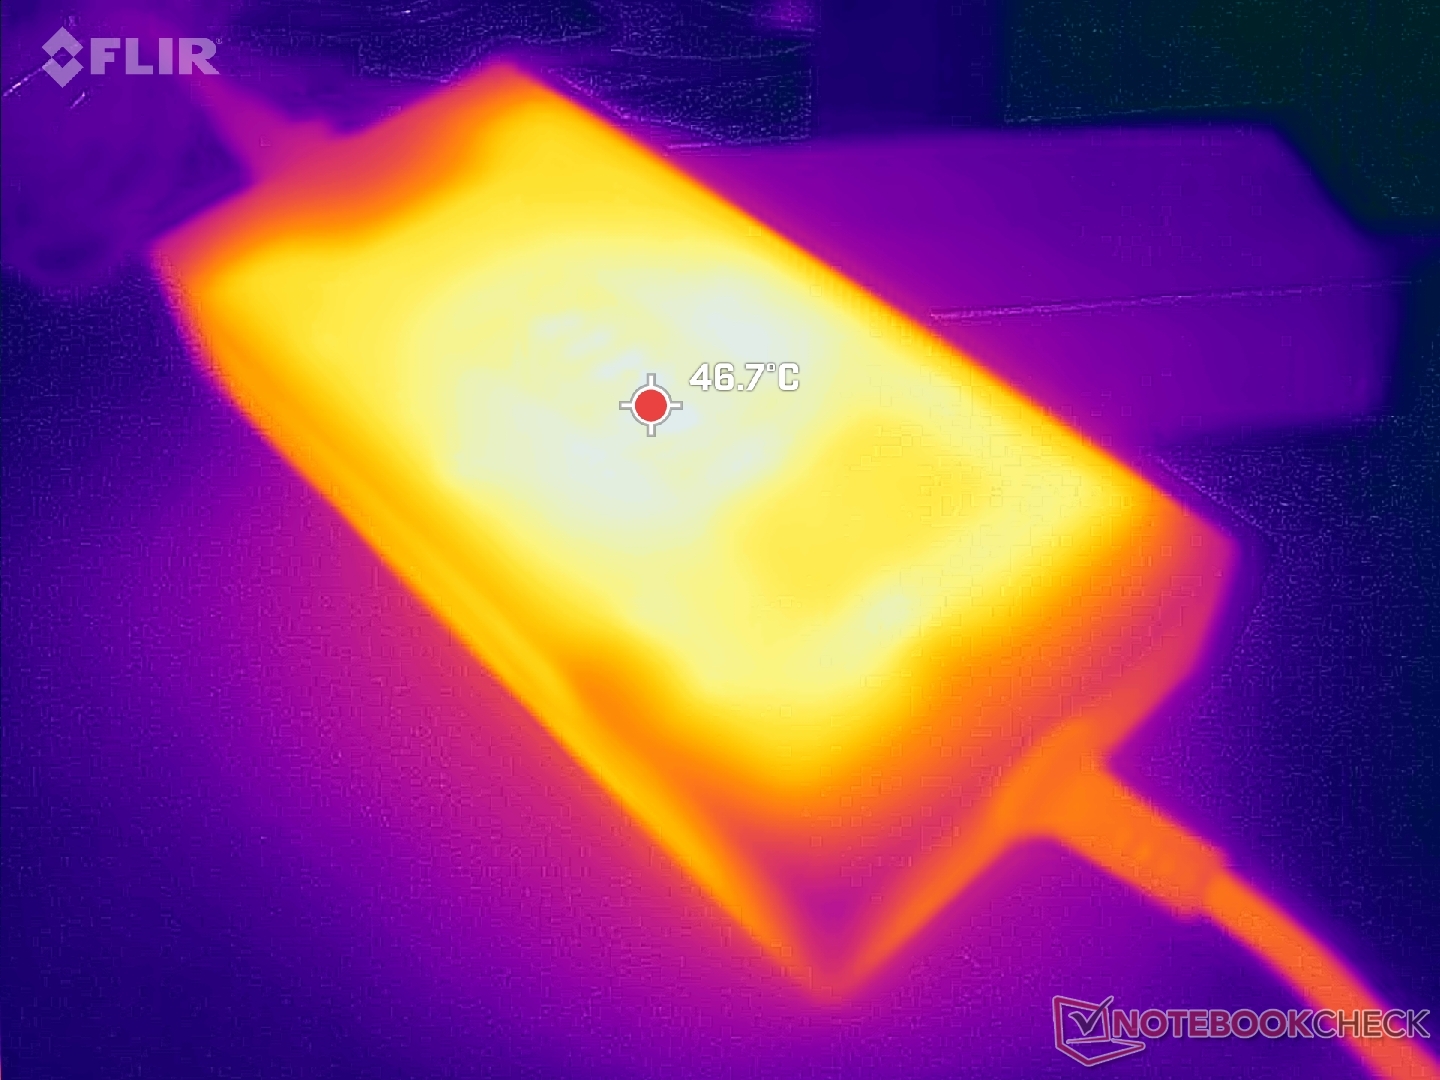
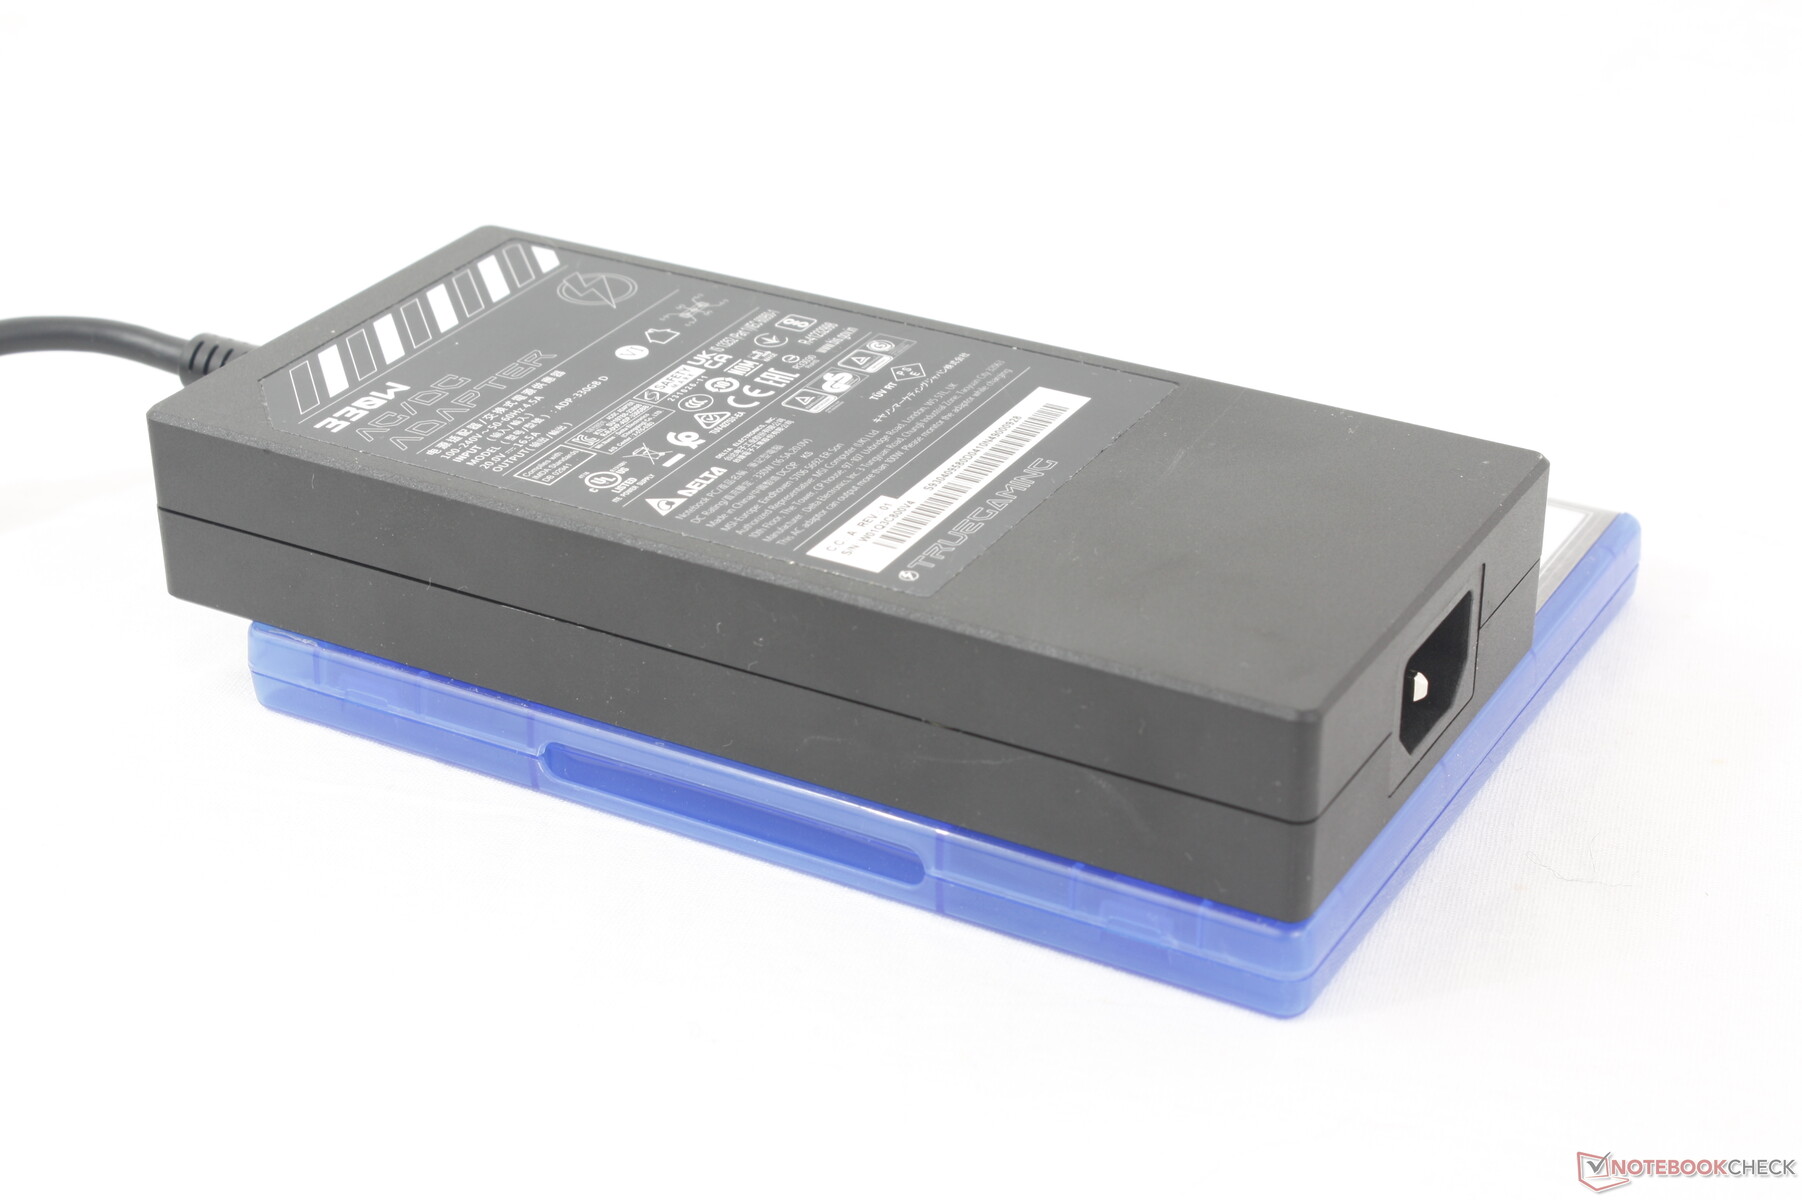
O sistema é fornecido com um adaptador CA de 280 W ou 330 W, dependendo da configuração. O novo adaptador CA de 330 W é relativamente fino, com aproximadamente 18,5 x 8,5 x 3,2 cm, que é quase do mesmo tamanho que o adaptador CA de 280 W de aproximadamente 18 x 8,5 x 3,5 cm do antigo GP66.
| desligado | |
| Ocioso | |
| Carga |
|
Key:
min: | |
| MSI Vector 16 HX A14V i9-14900HX, GeForce RTX 4080 Laptop GPU, WD PC SN560 SDDPNQE-1T00, IPS, 2560x1600, 16" | MSI Vector GP66 12UGS i9-12900H, GeForce RTX 3070 Ti Laptop GPU, , IPS, 1920x1080, 15.6" | Lenovo Legion 5 16IRX G9 i7-14650HX, GeForce RTX 4060 Laptop GPU, Samsung PM9A1 MZVL21T0HCLR, IPS, 2560x1600, 16" | HP Victus 16-r0077ng i7-13700H, GeForce RTX 4070 Laptop GPU, Kioxia XG8 KXG80ZNV1T02, IPS, 1920x1080, 16.1" | Asus TUF Gaming A16 FA617XS R9 7940HS, Radeon RX 7600S, Micron 2400 MTFDKBA512QFM, IPS, 1920x1200, 16" | Dell G16 7620 i7-12700H, GeForce RTX 3060 Laptop GPU, WDC PC SN810 512GB, IPS, 2560x1600, 16" | |
|---|---|---|---|---|---|---|
| Power Consumption | -2% | 20% | 38% | 47% | 18% | |
| Idle Minimum * (Watt) | 15.8 | 17.5 -11% | 15.4 3% | 8 49% | 7 56% | 14.4 9% |
| Idle Average * (Watt) | 23.3 | 20.1 14% | 19.7 15% | 13 44% | 10 57% | 17.8 24% |
| Idle Maximum * (Watt) | 30 | 47.3 -58% | 20.7 31% | 22 27% | 15 50% | 31.5 -5% |
| Load Average * (Watt) | 123.9 | 107.3 13% | 102.6 17% | 86 31% | 86 31% | 101.2 18% |
| Witcher 3 ultra * (Watt) | 285 | 225 21% | 191.3 33% | 141.8 50% | 160.6 44% | 176.9 38% |
| Load Maximum * (Watt) | 306 | 277.7 9% | 246.6 19% | 233 24% | 172 44% | 242.9 21% |
* ... menor é melhor
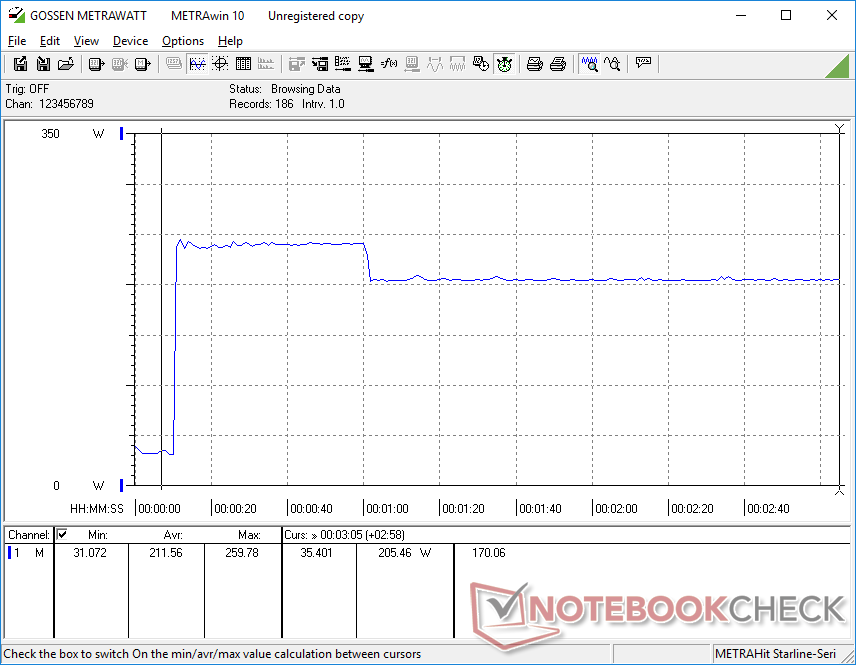
Power Consumption Witcher 3 / Stresstest
Power Consumption external Monitor
Duração da bateria
Embora a capacidade da bateria tenha aumentado significativamente de 65 Wh para 90 Wh em relação ao design antigo do Vector GP66, o tempo de execução real não aumentou. A navegação WLAN no perfil de energia balanceada com a iGPU ativa ainda dura cerca de 5,5 horas antes do desligamento automático. Outros sistemas de 16 polegadas, como o Lenovo Legion 5 16 ou o HP Victus 16 são capazes de durar quatro horas a mais cada um, em comparação.
O carregamento da capacidade vazia até a capacidade total leva quase 2,5 horas com o adaptador CA incluído. O sistema pode ser recarregado via USB-C por meio da porta ao longo da borda direita.
| MSI Vector 16 HX A14V i9-14900HX, GeForce RTX 4080 Laptop GPU, 90 Wh | MSI Vector GP66 12UGS i9-12900H, GeForce RTX 3070 Ti Laptop GPU, 65 Wh | Lenovo Legion 5 16IRX G9 i7-14650HX, GeForce RTX 4060 Laptop GPU, 80 Wh | HP Victus 16-r0077ng i7-13700H, GeForce RTX 4070 Laptop GPU, 83 Wh | Asus TUF Gaming A16 FA617XS R9 7940HS, Radeon RX 7600S, 90 Wh | Dell G16 7620 i7-12700H, GeForce RTX 3060 Laptop GPU, 84 Wh | |
|---|---|---|---|---|---|---|
| Duração da bateria | -17% | -4% | 29% | 60% | -31% | |
| Reader / Idle (h) | 10.7 | 7.9 -26% | 20.3 90% | 7.1 -34% | ||
| WiFi v1.3 (h) | 5.5 | 5.7 4% | 7.4 35% | 7.1 29% | 12.4 125% | 5 -9% |
| Load (h) | 1.4 | 1 -29% | 0.8 -43% | 0.9 -36% | 0.7 -50% | |
| H.264 (h) | 9.6 | 12.4 |
Pro
Contra
Veredicto - Rápido e Chonky
Os notebooks para jogos caminham em uma linha tênue entre portabilidade e desempenho, sendo que a tendência atual tende a favorecer a portabilidade. O MSI Vector 16 HX favorece descaradamente o desempenho, mesmo que isso signifique um sistema mais espesso, maior e mais barulhento. De fato, ele é um dos maiores e mais barulhentos notebooks para jogos de 16 polegadas atualmente no mercado.
O MSI Vector 16 HX não é tímido quando se trata do ruído da ventoinha ou do tamanho. Por sua vez, ele supera outros notebooks para jogos com a mesma GPU GeForce RTX 4080 ou 4090 em termos de desempenho.
O tamanho grande e as ventoinhas barulhentas não são em vão, pois o modelo se destaca quando se trata de desempenho. A GPU de 175 W GeForce GPU RTX 4080 DE 175 W de 175 W é cerca de 10% mais rápida do que a média para estar no mesmo nível de alguns notebooks com a RTX 4090. Esse fato, por si só, provavelmente atrairá os caçadores de desempenho que não se importam em sacrificar um pouco a portabilidade por essa potência extra. O chassi robusto também é rígido e tem uma tampa forte, o que não é algo que podemos dizer de muitas alternativas mais finas.
Alguns aspectos certamente poderiam ser melhores. Se a MSI quer manter um design grande, então a manutenção deve ser facilitada e o resfriamento líquido ou a câmara de vapor devem ser considerados em um esforço para reduzir o ruído do ventilador. O teclado numérico ou, pelo menos, as teclas de seta deveriam ser maiores, assim como as teclas de seta do Lenovo Legion 5 16.
Preço e disponibilidade
A Amazon e a Best Buy estão agora enviando o MSI Vector 16 HX, conforme analisado, por US$ 2.700 cada. Configurações menores com GPUs mais lentas também estão disponíveis.
MSI Vector 16 HX A14V
- 02/03/2024 v7 (old)
Allen Ngo
Transparência
A seleção dos dispositivos a serem analisados é feita pela nossa equipe editorial. A amostra de teste foi fornecida ao autor como empréstimo pelo fabricante ou varejista para fins desta revisão. O credor não teve influência nesta revisão, nem o fabricante recebeu uma cópia desta revisão antes da publicação. Não houve obrigação de publicar esta revisão. Como empresa de mídia independente, a Notebookcheck não está sujeita à autoridade de fabricantes, varejistas ou editores.
É assim que o Notebookcheck está testando
Todos os anos, o Notebookcheck analisa de forma independente centenas de laptops e smartphones usando procedimentos padronizados para garantir que todos os resultados sejam comparáveis. Desenvolvemos continuamente nossos métodos de teste há cerca de 20 anos e definimos padrões da indústria no processo. Em nossos laboratórios de teste, equipamentos de medição de alta qualidade são utilizados por técnicos e editores experientes. Esses testes envolvem um processo de validação em vários estágios. Nosso complexo sistema de classificação é baseado em centenas de medições e benchmarks bem fundamentados, o que mantém a objetividade.Price comparison

