Análise do laptop Lenovo Legion Pro 7 16: Potência total para jogos graças à RTX 4090

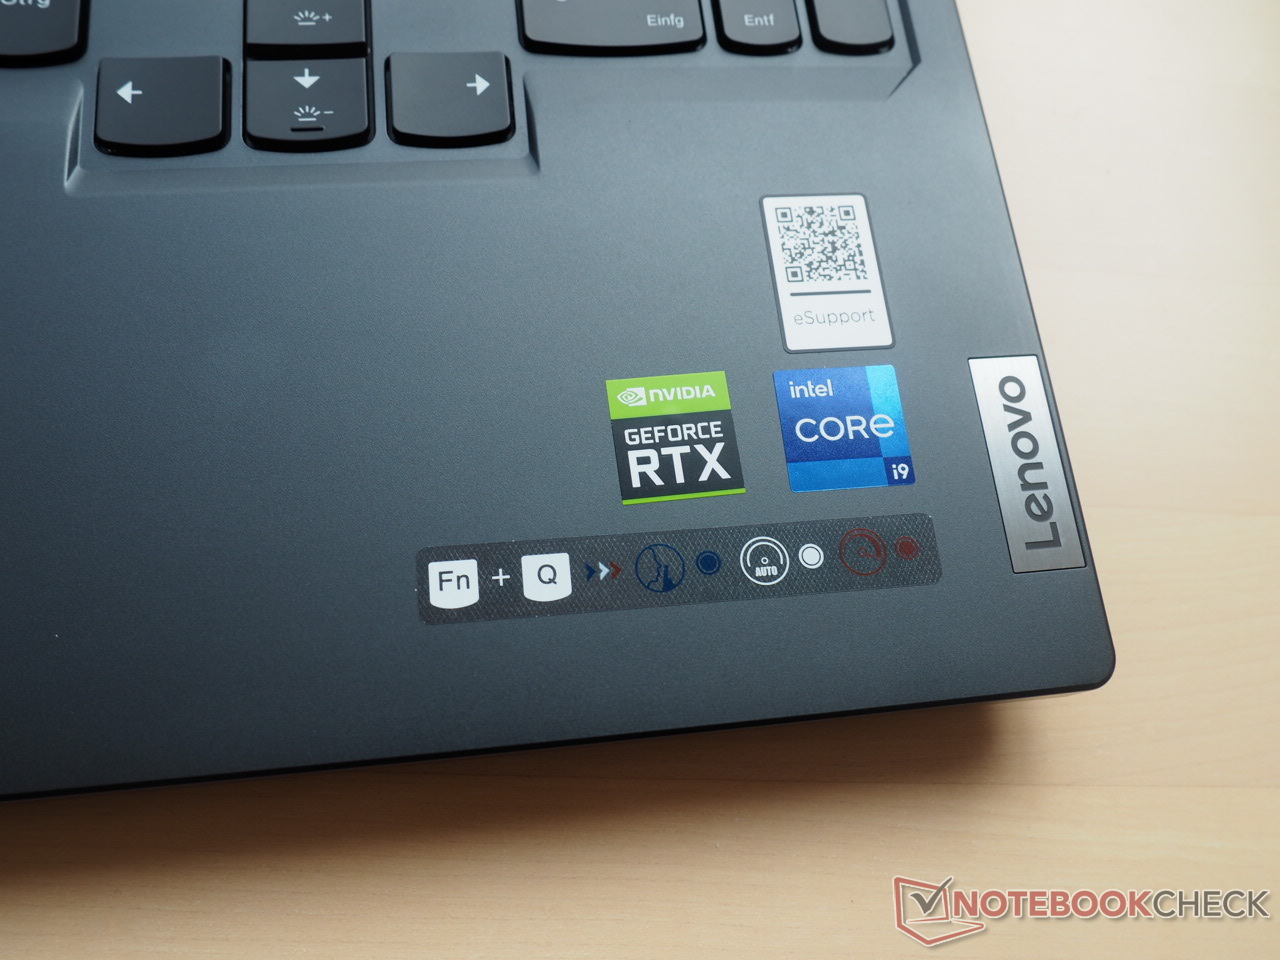
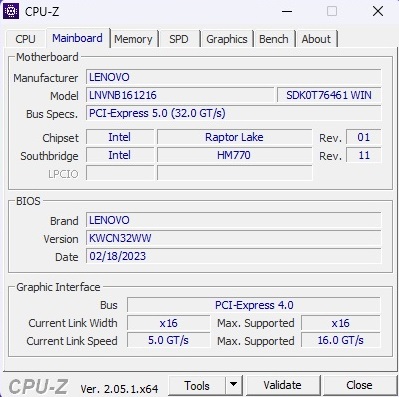
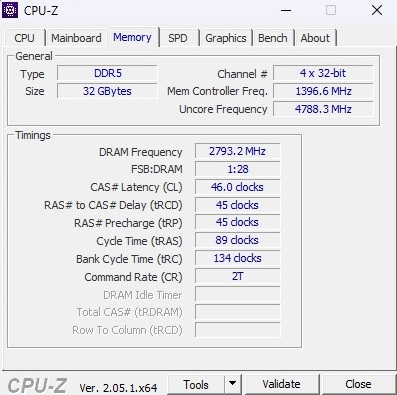
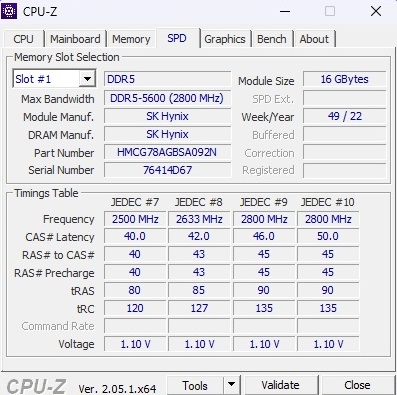
Esse Legion Pro 7 16IRX8H não é apenas um dos notebooks para jogos mais potentes, mas também um dos mais caros. Atualmente, você precisa pagar pelo menos 4.500 euros pela combinação do processador Core i9-13900HX, GeForce RTX 409032 GB de RAM (2x 16 GB DDR5-5600), 2 TB de armazenamento em massa (2x 1 TB NVMe SSD) e tela de 240 Hz (2660 x 1600 pixels). Cada jogador deve decidir se quer ou não apoiar a atual política de preços do fabricante, que parece não estar relacionada a nenhuma inflação.
Os concorrentes do Legion Pro 7 incluem outros dispositivos gamers de ponta com RTX 4090 da linha de 16 e 17 polegadas, como o Razer Blade 16, o XMG Neo 16, o Asus Strix Scar 17 e a MSI Titan GT77. O modelo irmão mais barato com RTX 4080 também aparece nas tabelas como um dispositivo de comparação.
Possíveis concorrentes em comparação
Avaliação | Data | Modelo | Peso | Altura | Size | Resolução | Preço |
|---|---|---|---|---|---|---|---|
| 88.8 % v7 (old) | 06/2023 | Lenovo Legion Pro 7 RTX4090 i9-13900HX, GeForce RTX 4090 Laptop GPU | 2.7 kg | 26 mm | 16.00" | 2560x1600 | |
| 89.8 % v7 (old) | 03/2023 | Razer Blade 16 Early 2023 RTX 4090 i9-13950HX, GeForce RTX 4090 Laptop GPU | 2.5 kg | 21.99 mm | 16.00" | 3840x2400 | |
| 88.3 % v7 (old) | 04/2023 | Asus ROG Strix Scar 17 G733PY-XS96 R9 7945HX, GeForce RTX 4090 Laptop GPU | 2.9 kg | 28.3 mm | 17.30" | 2560x1440 | |
| 87.7 % v7 (old) | 04/2023 | Schenker XMG Neo 16 E23 i9-13900HX, GeForce RTX 4090 Laptop GPU | 2.5 kg | 29.9 mm | 16.00" | 2560x1600 | |
| 89 % v7 (old) | 02/2023 | MSI Titan GT77 HX 13VI i9-13950HX, GeForce RTX 4090 Laptop GPU | 3.5 kg | 23 mm | 17.30" | 3840x2160 | |
| 89.4 % v7 (old) | 02/2023 | Lenovo Legion Pro 7 16IRX8H i9-13900HX, GeForce RTX 4080 Laptop GPU | 2.7 kg | 26 mm | 16.00" | 2560x1600 |
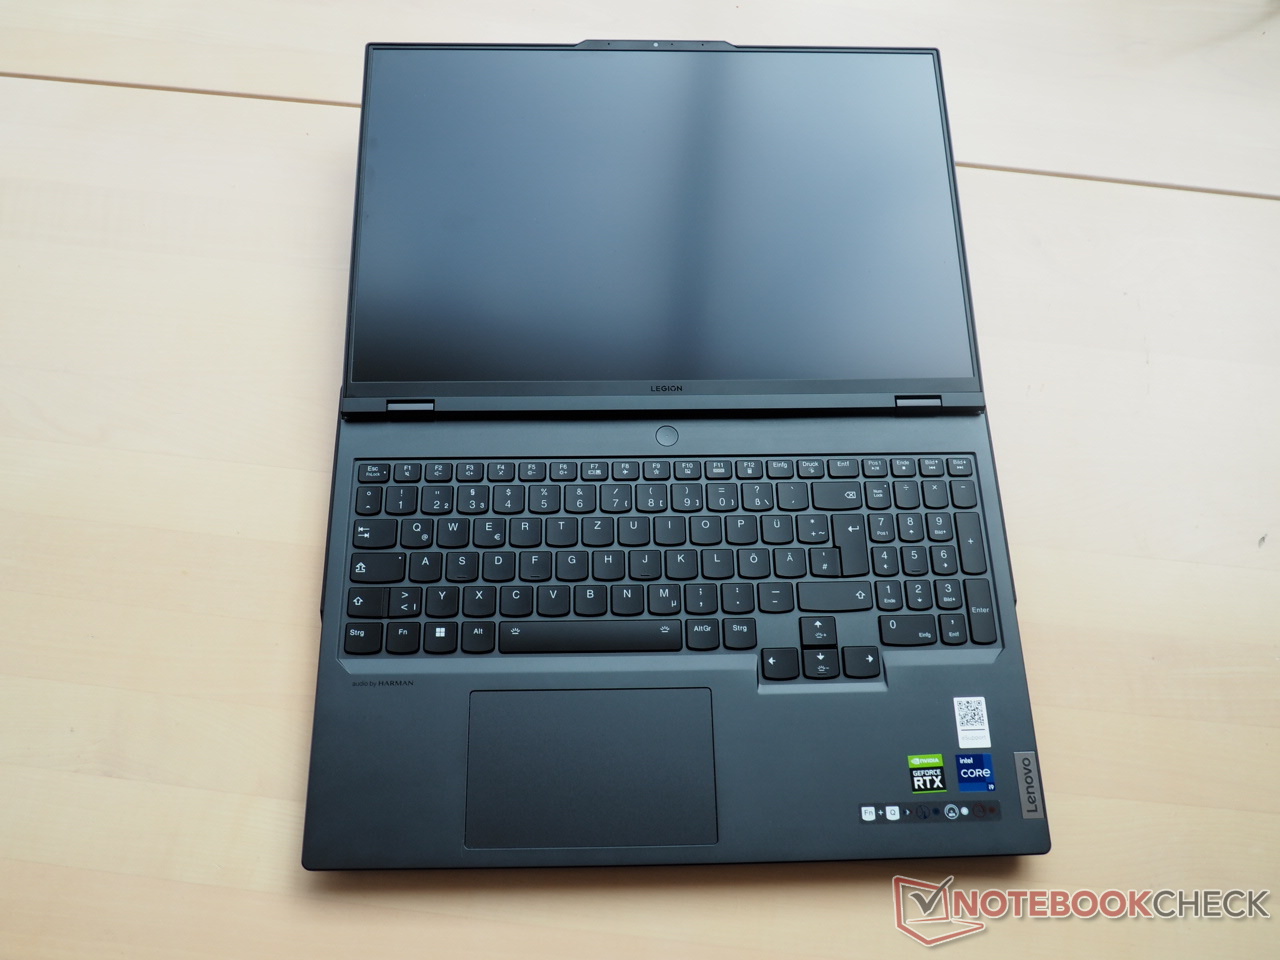
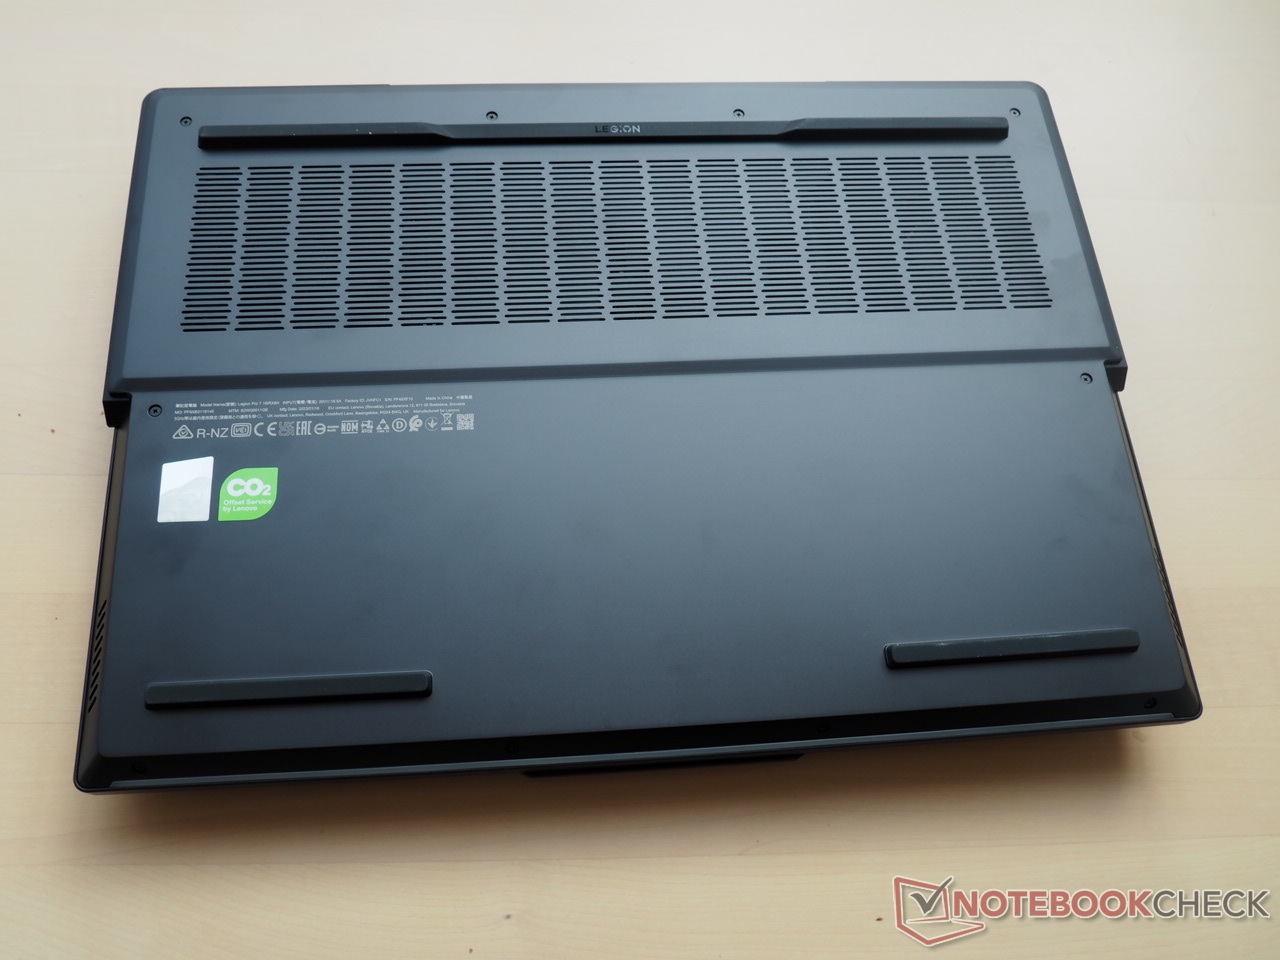
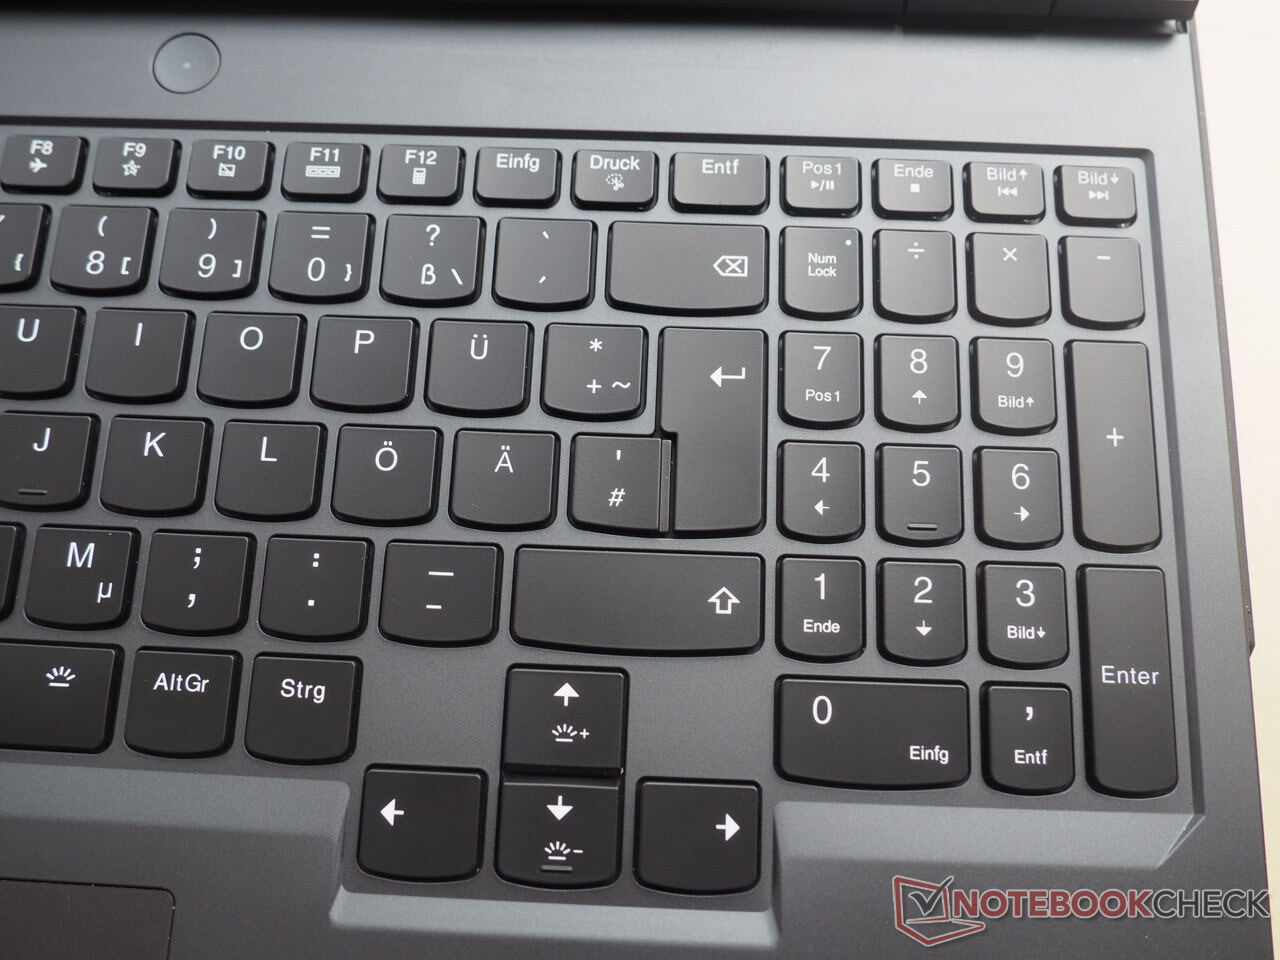
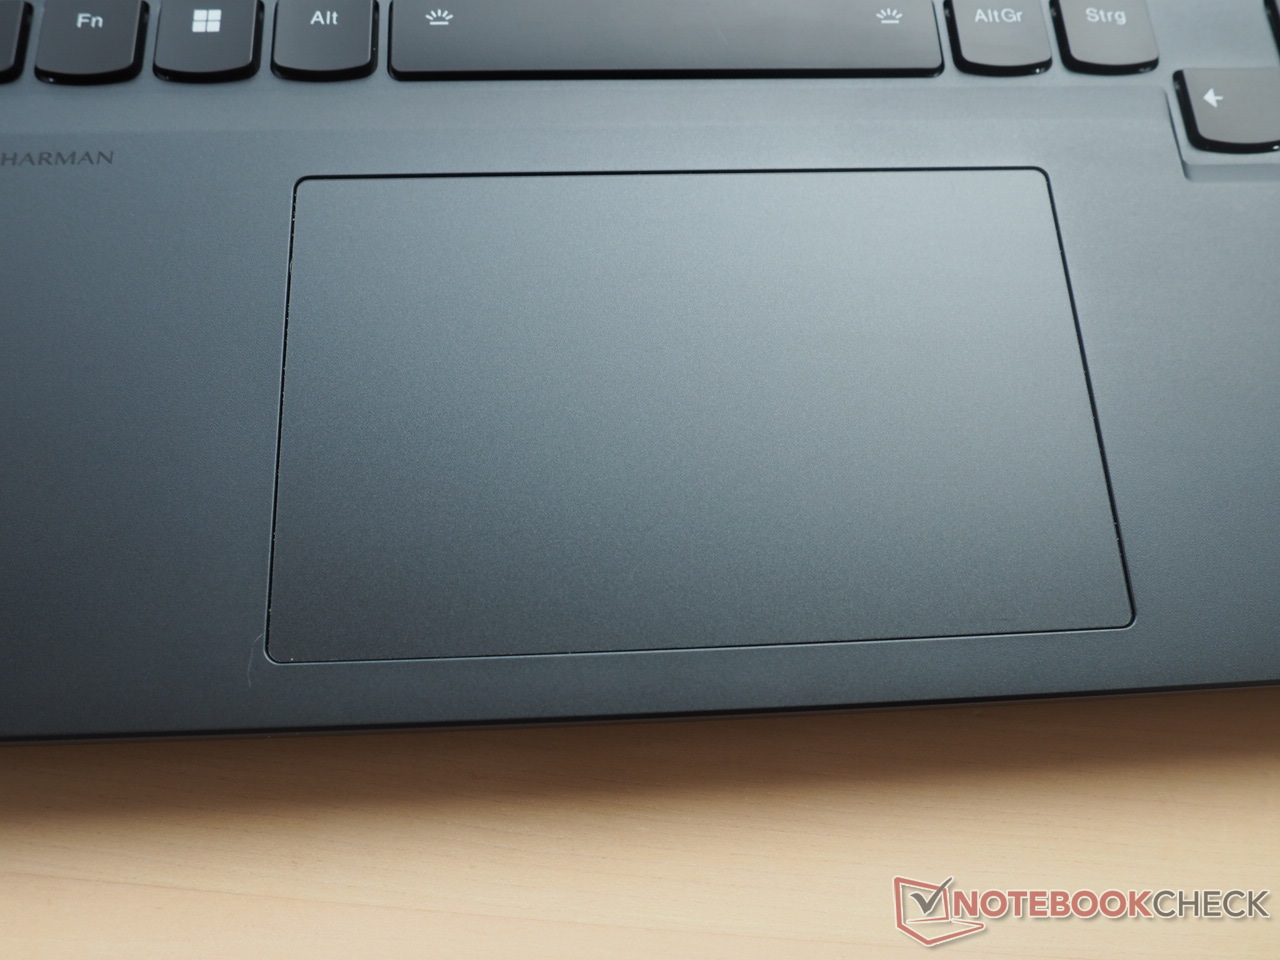
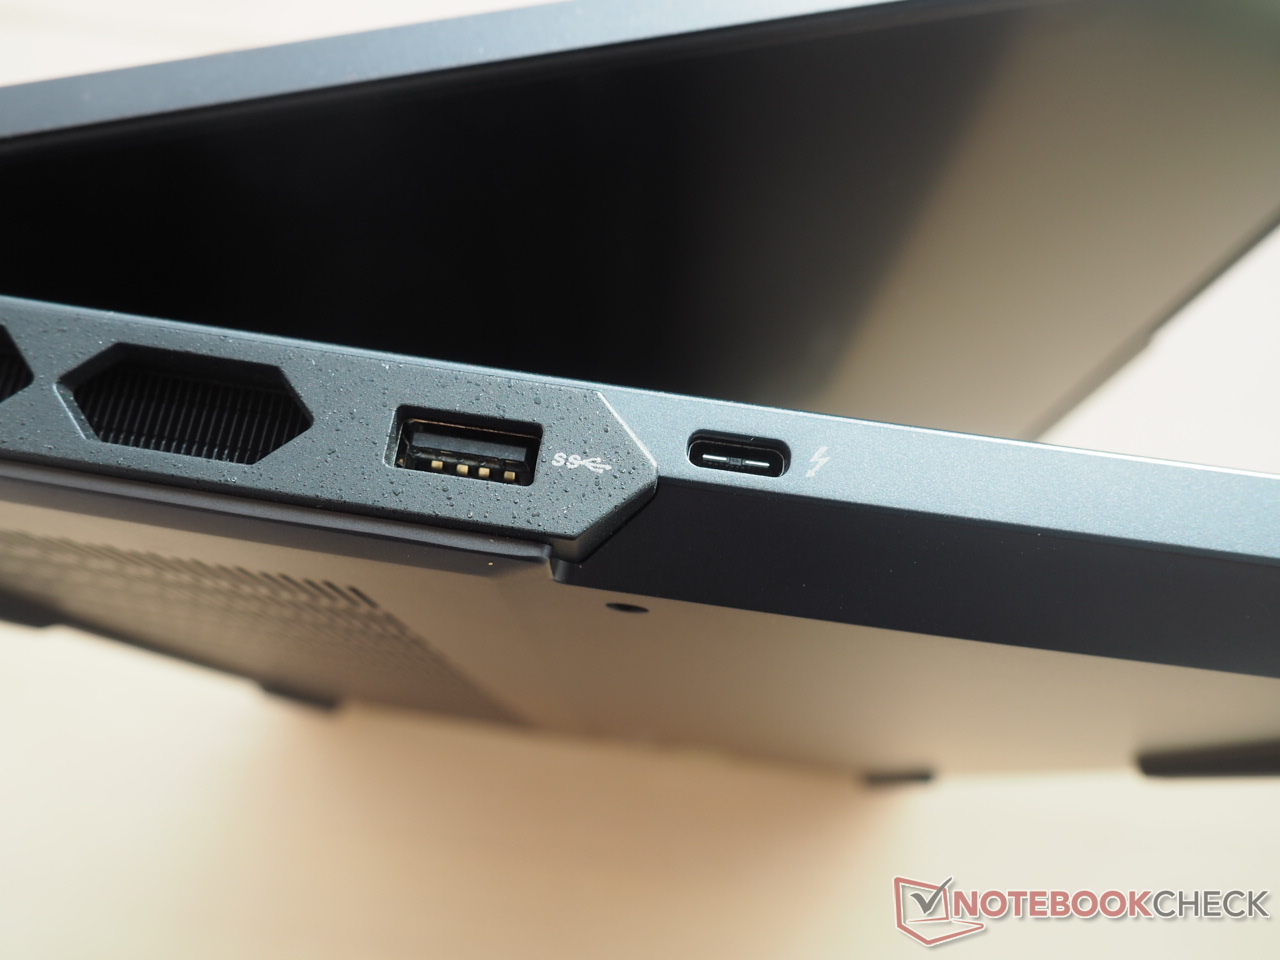
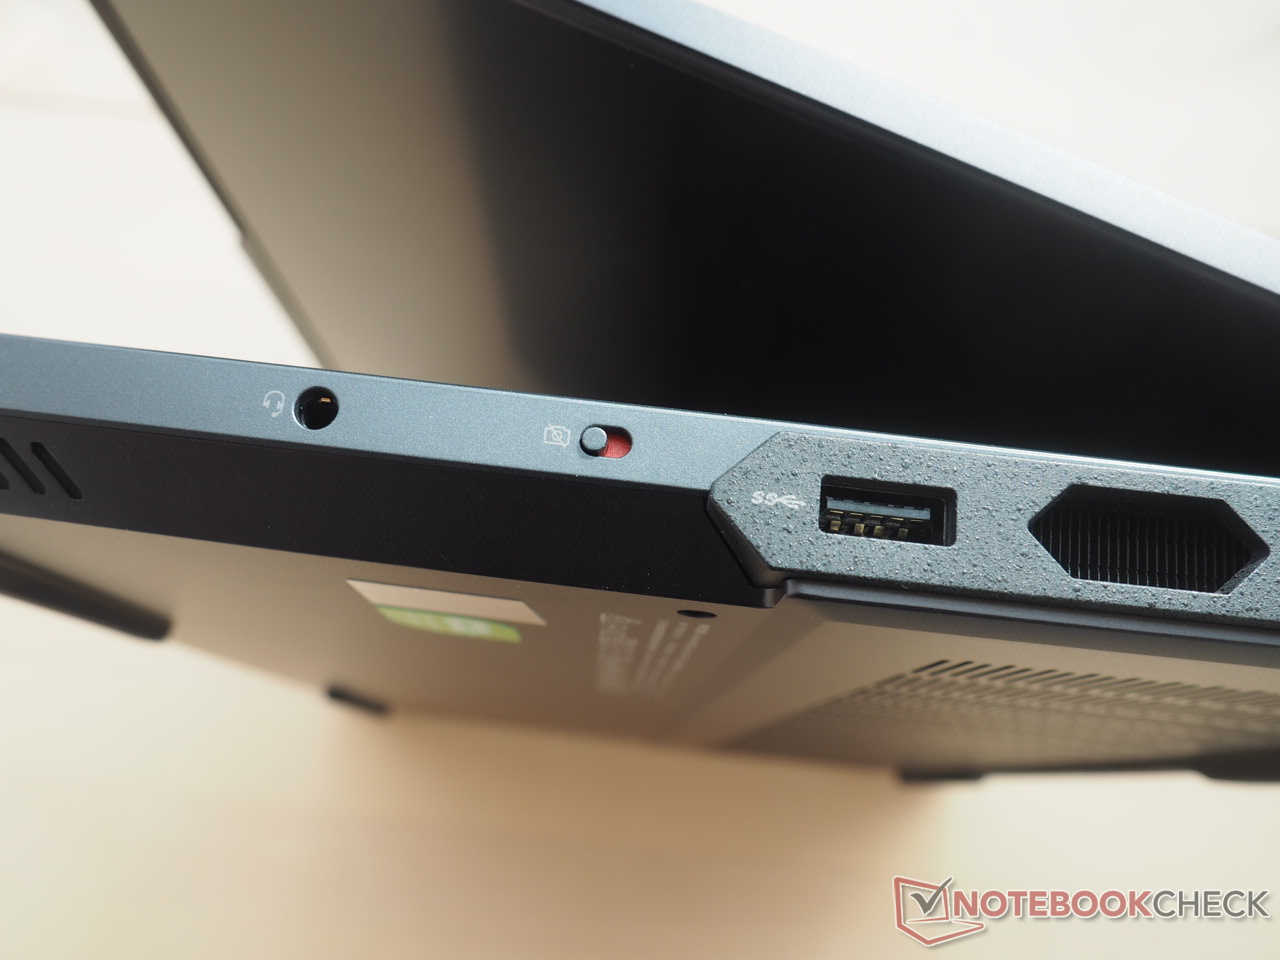
Como a construção do gabinete é idêntica à da variante já testada, não entraremos em detalhes sobre o chassi, as portas e os dispositivos de entrada novamente neste artigo. Você pode encontrar as informações correspondentes na análise vinculada.

Comunicação
Webcam


Tela
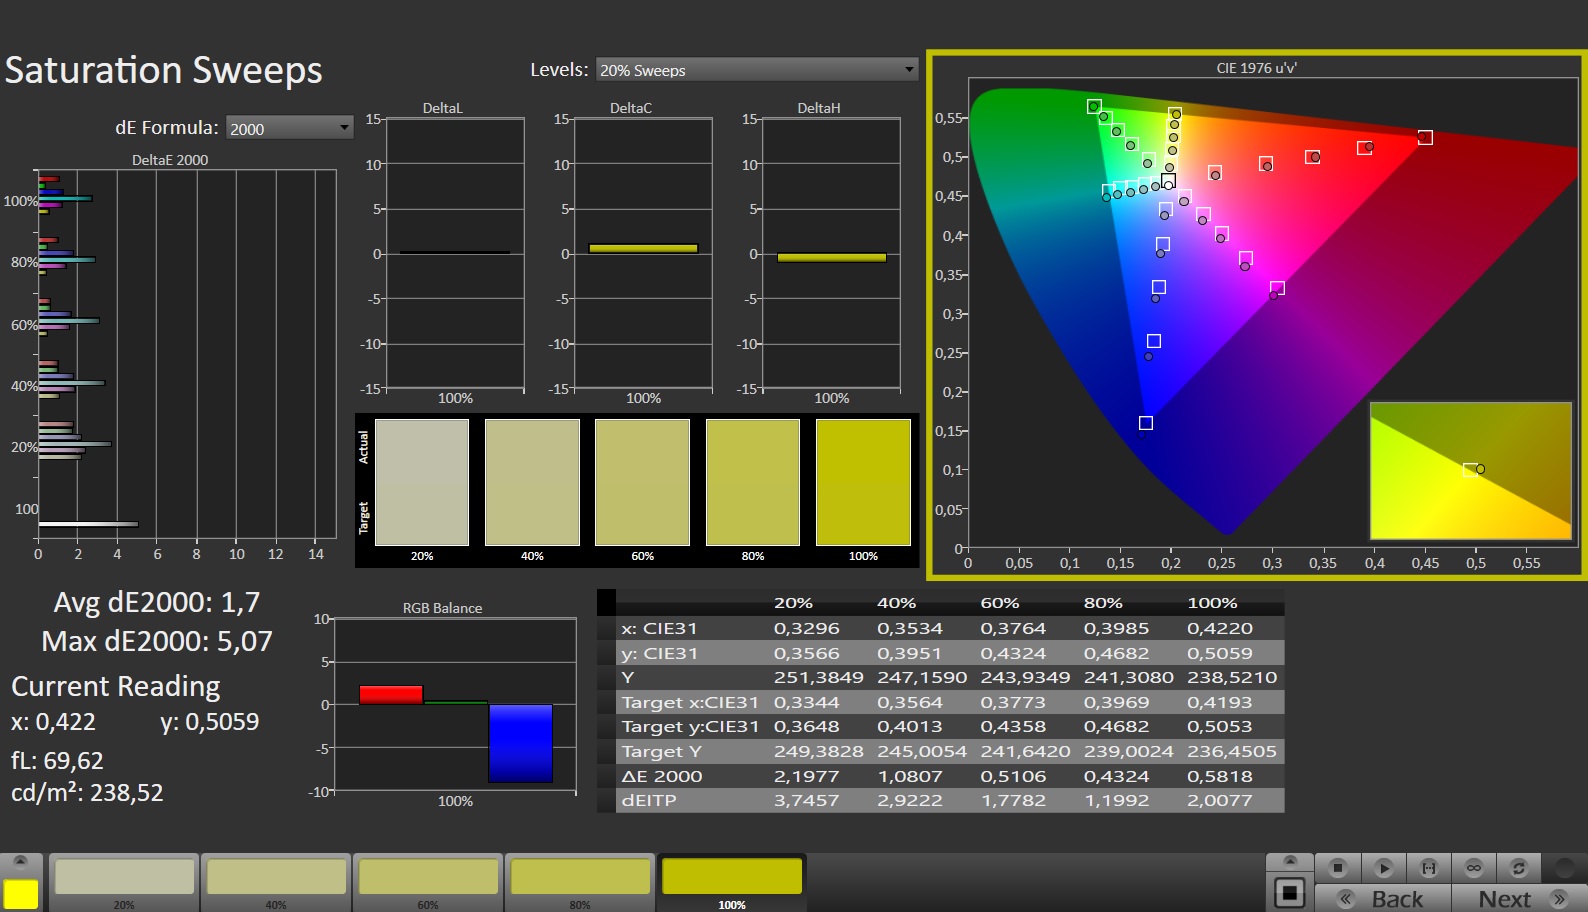
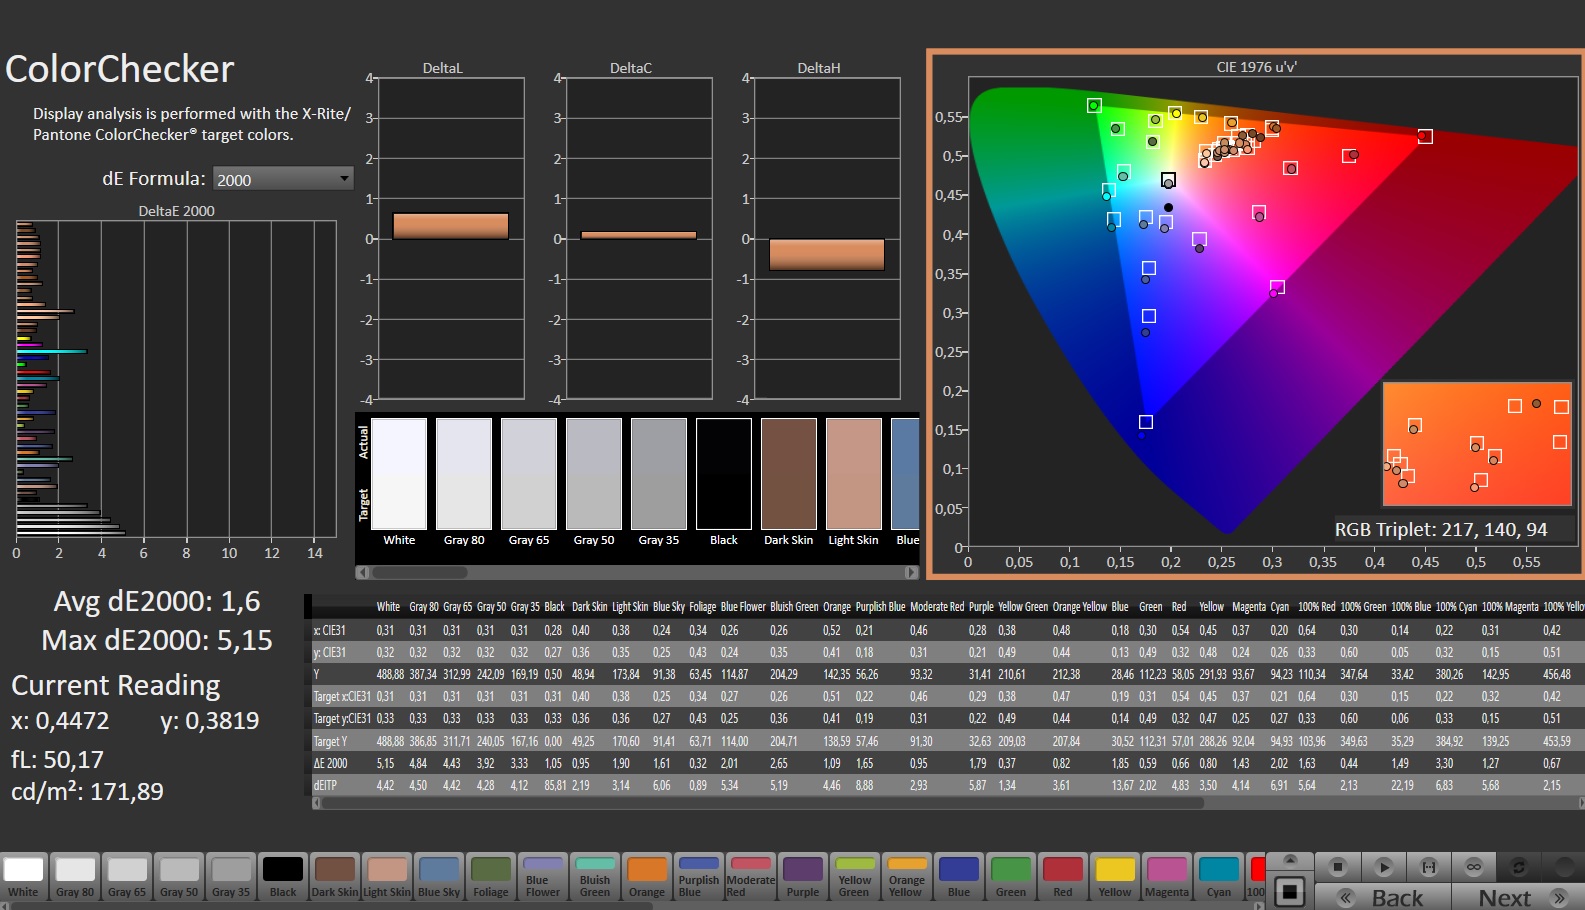
Além da caixa, a tela também é idêntica à versão 4080, o que é uma ótima notícia, pois nosso último teste confirmou que a tela WQXGA é impressionante em quase todos os aspectos.
| |||||||||||||||||||||||||
iluminação: 91 %
iluminação com acumulador: 491 cd/m²
Contraste: 1228:1 (Preto: 0.4 cd/m²)
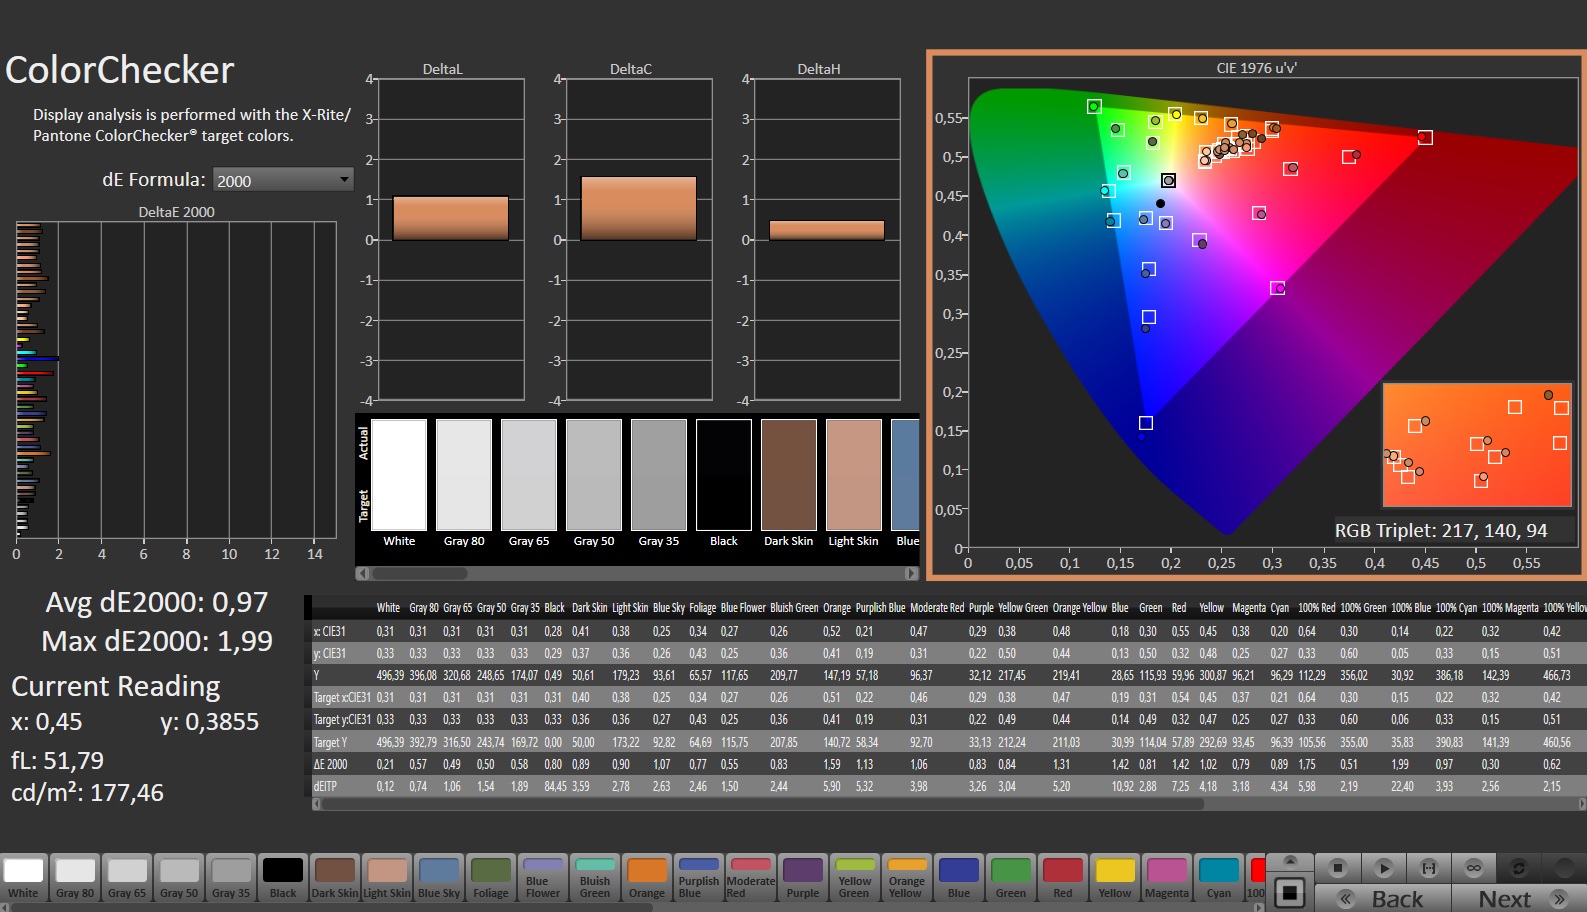
ΔE ColorChecker Calman: 1.6 | ∀{0.5-29.43 Ø4.71}
calibrated: 0.97
ΔE Greyscale Calman: 3 | ∀{0.09-98 Ø4.96}
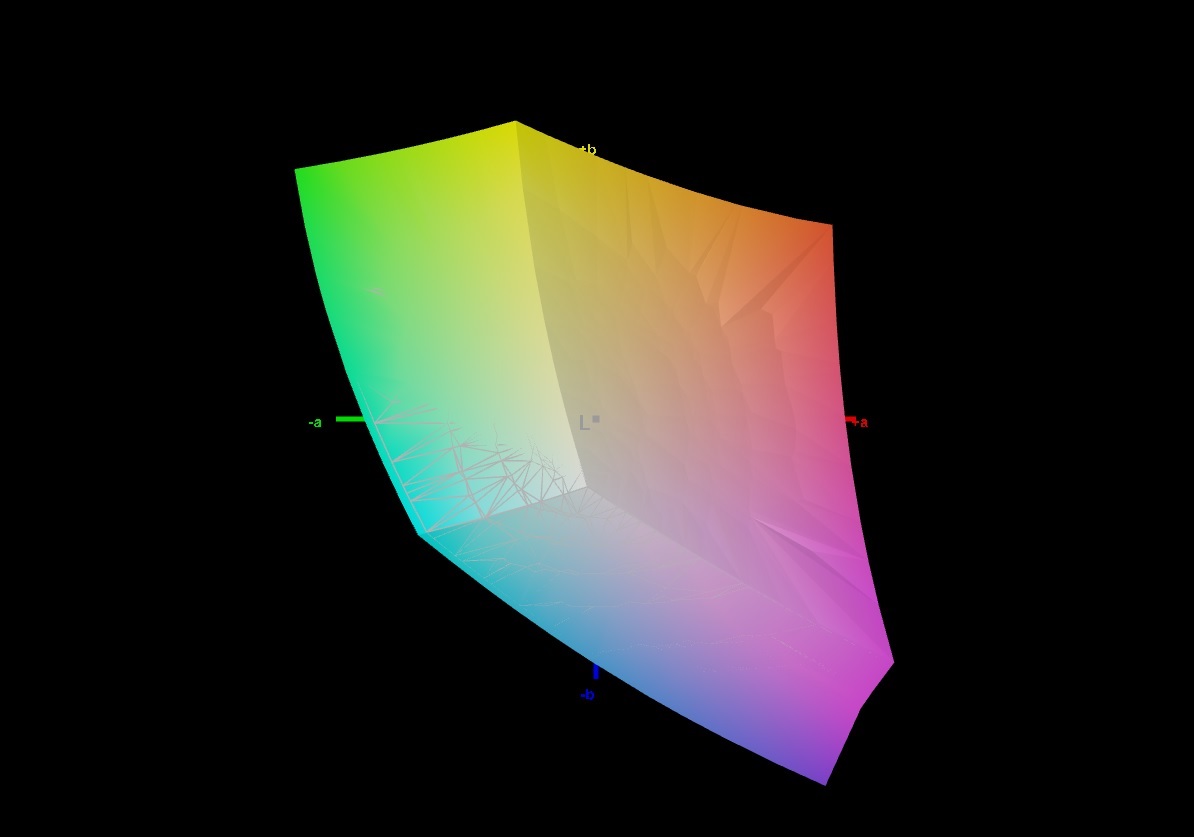
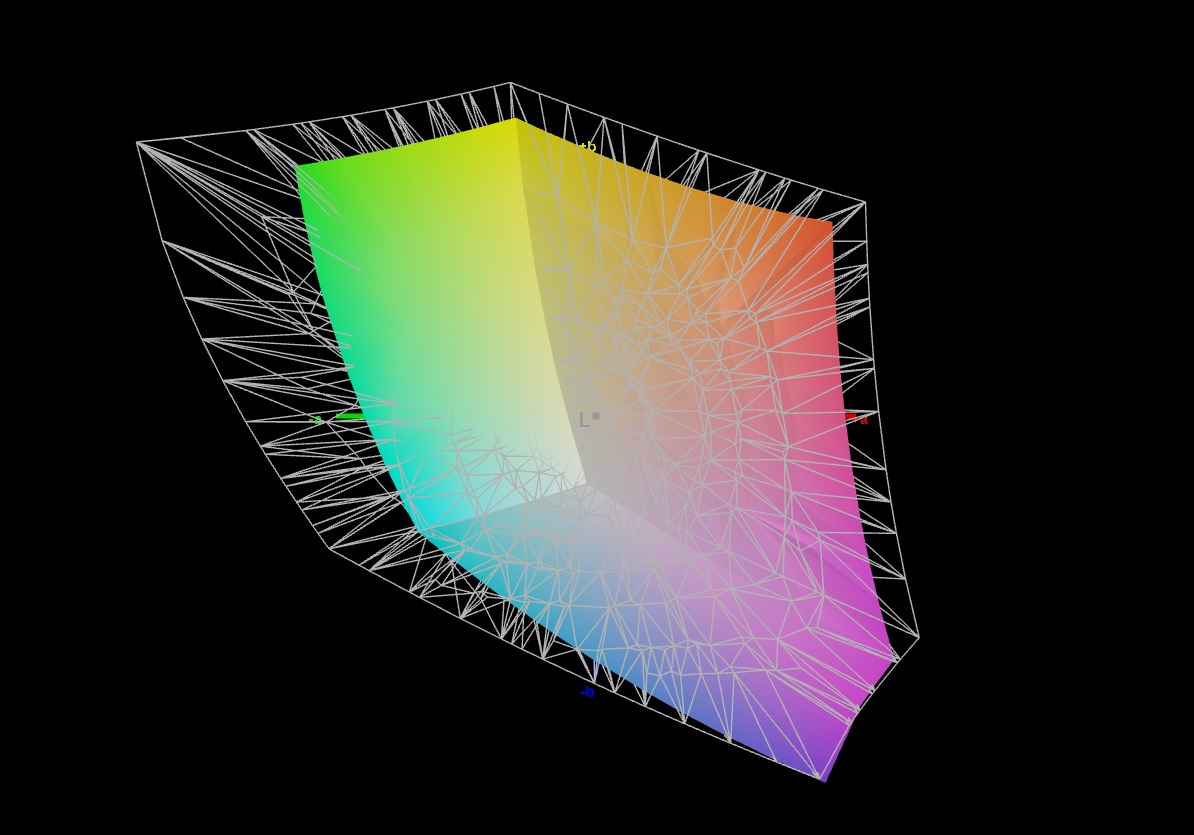
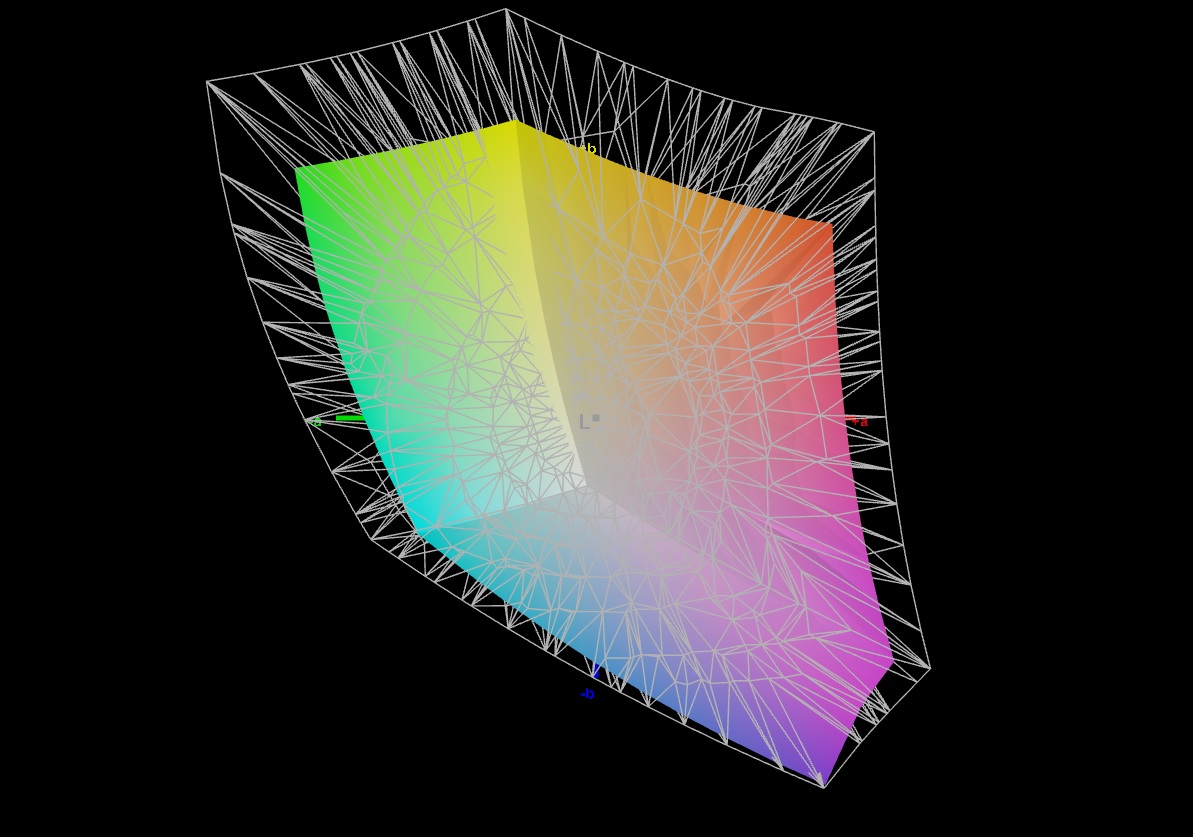
71.6% AdobeRGB 1998 (Argyll 3D)
99.8% sRGB (Argyll 3D)
69.5% Display P3 (Argyll 3D)
Gamma: 2.211
CCT: 6979 K
| Lenovo Legion Pro 7 RTX4090 MNG007DA2-3 (CSO1628), IPS, 2560x1600, 16" | Razer Blade 16 Early 2023 RTX 4090 AUO B160ZAN01.U, mini-LED, 3840x2400, 16" | Asus ROG Strix Scar 17 G733PY-XS96 NE173QHM-NZ2, IPS, 2560x1440, 17.3" | Schenker XMG Neo 16 E23 BOE0AF0 NE160QDM-NZ1, IPS, 2560x1600, 16" | MSI Titan GT77 HX 13VI B173ZAN06.C, Mini-LED, 3840x2160, 17.3" | Lenovo Legion Pro 7 16IRX8H MNG007DA2-3 (CSO1628), IPS, 2560x1600, 16" | |
|---|---|---|---|---|---|---|
| Display | 24% | 20% | -3% | 22% | -1% | |
| Display P3 Coverage (%) | 69.5 | 99.9 44% | 98 41% | 67.3 -3% | 94.9 37% | 69.1 -1% |
| sRGB Coverage (%) | 99.8 | 100 0% | 100 0% | 96.7 -3% | 99.9 0% | 99.7 0% |
| AdobeRGB 1998 Coverage (%) | 71.6 | 90.9 27% | 85.6 20% | 68.9 -4% | 92.4 29% | 71.2 -1% |
| Response Times | -622% | -53% | -60% | -365% | -21% | |
| Response Time Grey 50% / Grey 80% * (ms) | 10.9 ? | 10.2 ? 6% | 6.2 ? 43% | 14.5 ? -33% | 38.4 ? -252% | 12.3 ? -13% |
| Response Time Black / White * (ms) | 4.6 ? | 62.04 ? -1249% | 11.4 ? -148% | 8.6 ? -87% | 26.6 ? -478% | 5.9 ? -28% |
| PWM Frequency (Hz) | 2420 ? | 2380 ? | ||||
| Screen | 1412% | 11% | -5% | 54786% | 21% | |
| Brightness middle (cd/m²) | 491 | 730 49% | 322.5 -34% | 372 -24% | 606 23% | 511 4% |
| Brightness (cd/m²) | 472 | 729 54% | 317 -33% | 349 -26% | 602 28% | 469 -1% |
| Brightness Distribution (%) | 91 | 94 3% | 86 -5% | 88 -3% | 93 2% | 86 -5% |
| Black Level * (cd/m²) | 0.4 | 0.0045 99% | 0.29 28% | 0.32 20% | 0.0001 100% | 0.4 -0% |
| Contrast (:1) | 1228 | 162222 13110% | 1112 -9% | 1163 -5% | 6060000 493385% | 1278 4% |
| Colorchecker dE 2000 * | 1.6 | 5.65 -253% | 1.15 28% | 2.06 -29% | 4.8 -200% | 0.95 41% |
| Colorchecker dE 2000 max. * | 5.15 | 10.11 -96% | 3.03 41% | 3 42% | 8.2 -59% | 2.07 60% |
| Colorchecker dE 2000 calibrated * | 0.97 | 1.85 -91% | 0.56 42% | 1.5 -55% | 1.8 -86% | 0.91 6% |
| Greyscale dE 2000 * | 3 | 8.1 -170% | 1.7 43% | 1.9 37% | 6.5 -117% | 0.6 80% |
| Gamma | 2.211 100% | 1.98 111% | 2.27 97% | 2.312 95% | 2.63 84% | 2.176 101% |
| CCT | 6979 93% | 5874 111% | 6299 103% | 6747 96% | 6596 99% | 6545 99% |
| Média Total (Programa/Configurações) | 271% /
824% | -7% /
4% | -23% /
-12% | 18148% /
35172% | -0% /
10% |
* ... menor é melhor
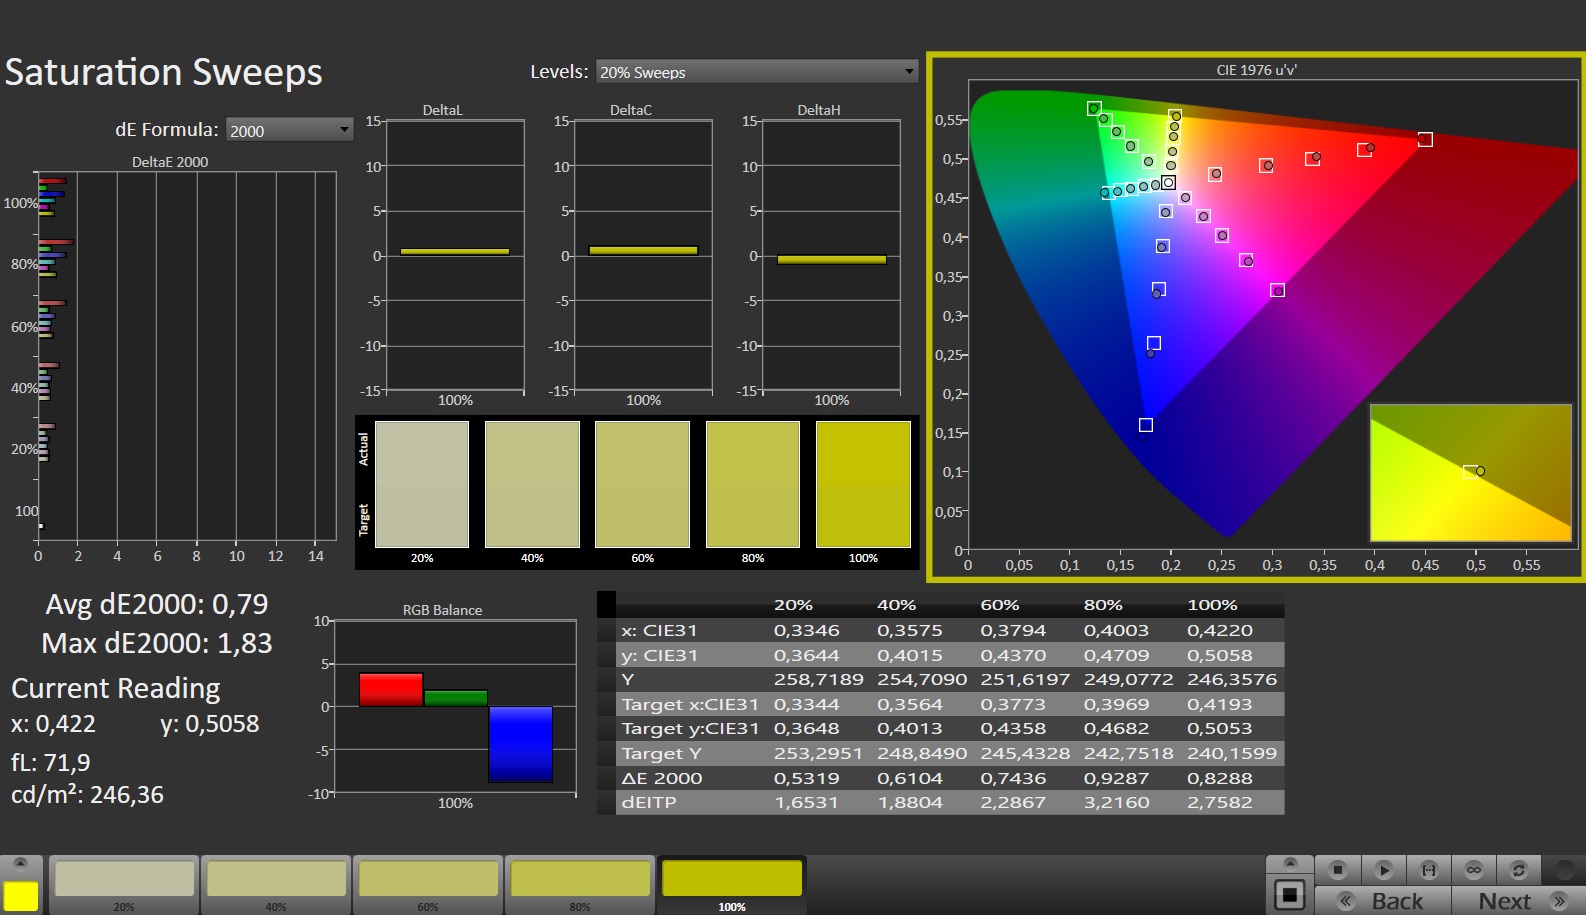
Não importa se o brilho (~470 cd/m²), o contraste (~1.230:1) ou a precisão das cores (DeltaE médio de 1,6): Os valores medidos fazem mais do que justiça a um painel IPS. O tempo de resposta também é agradável, principalmente graças à taxa de atualização de 240 Hz. Há espaço para melhorias no espaço de cores. Embora 100% sRGB seja suficiente para um notebook para jogos, cerca de 72% de cobertura AdobeRGB e 70% DCI-P3 são um pouco ruins para usuários profissionais. Outros concorrentes oferecem mais aqui (veja a tabela).
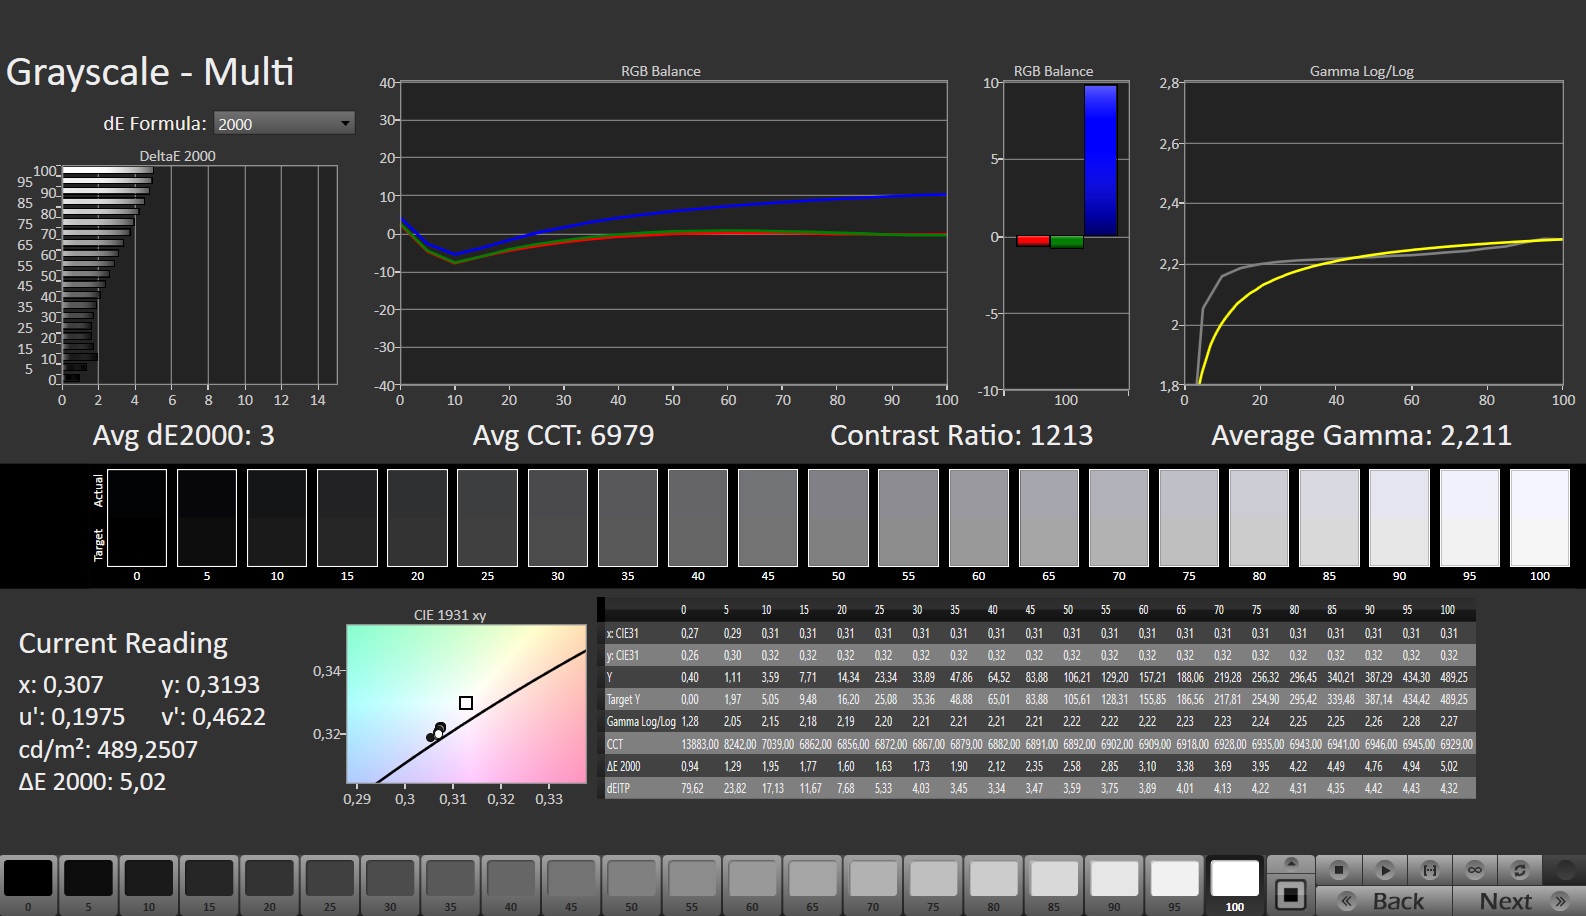
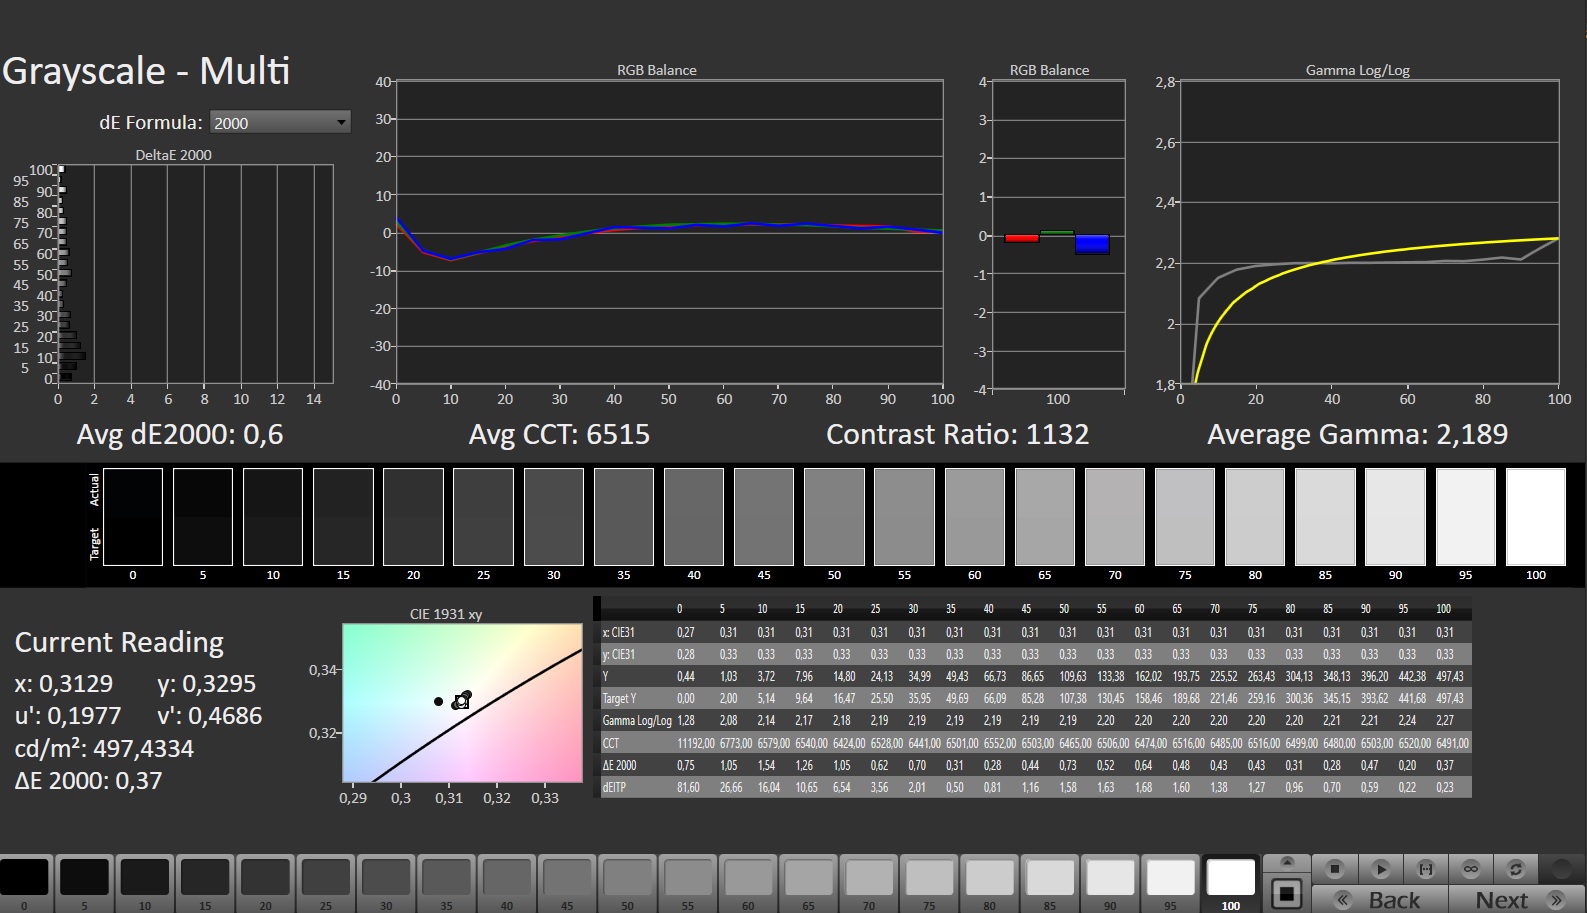
No geral, a tela causa uma impressão de boa a muito boa, embora não esteja tecnicamente no nível de um painel mini-LED como o do Razer Blade 16 e do MSI Titan GT 77.
Exibir tempos de resposta
| ↔ Tempo de resposta preto para branco | ||
|---|---|---|
| 4.6 ms ... ascensão ↗ e queda ↘ combinadas | ↗ 1.6 ms ascensão | 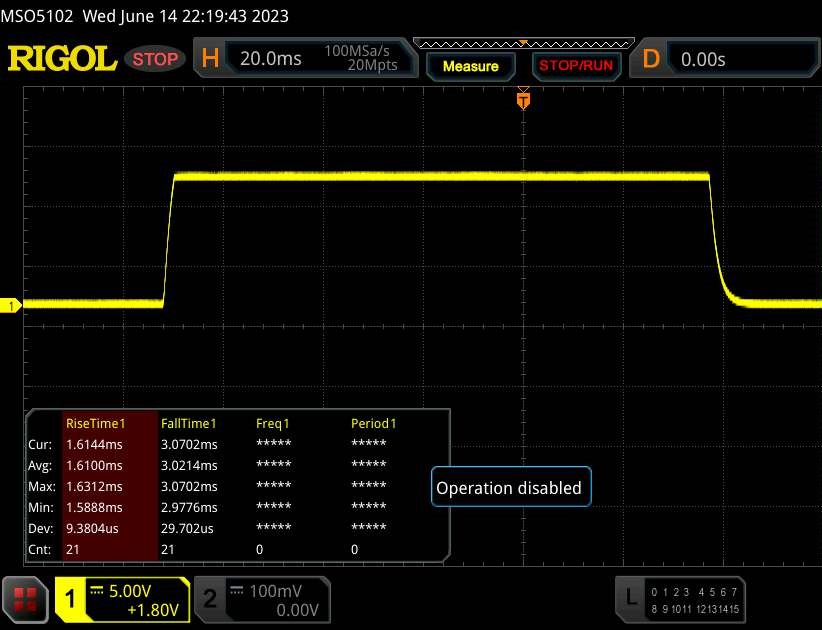 |
| ↘ 3 ms queda | ||
| A tela mostra taxas de resposta muito rápidas em nossos testes e deve ser muito adequada para jogos em ritmo acelerado. Em comparação, todos os dispositivos testados variam de 0.1 (mínimo) a 240 (máximo) ms. » 17 % de todos os dispositivos são melhores. Isso significa que o tempo de resposta medido é melhor que a média de todos os dispositivos testados (19.8 ms). | ||
| ↔ Tempo de resposta 50% cinza a 80% cinza | ||
| 10.9 ms ... ascensão ↗ e queda ↘ combinadas | ↗ 5.1 ms ascensão | 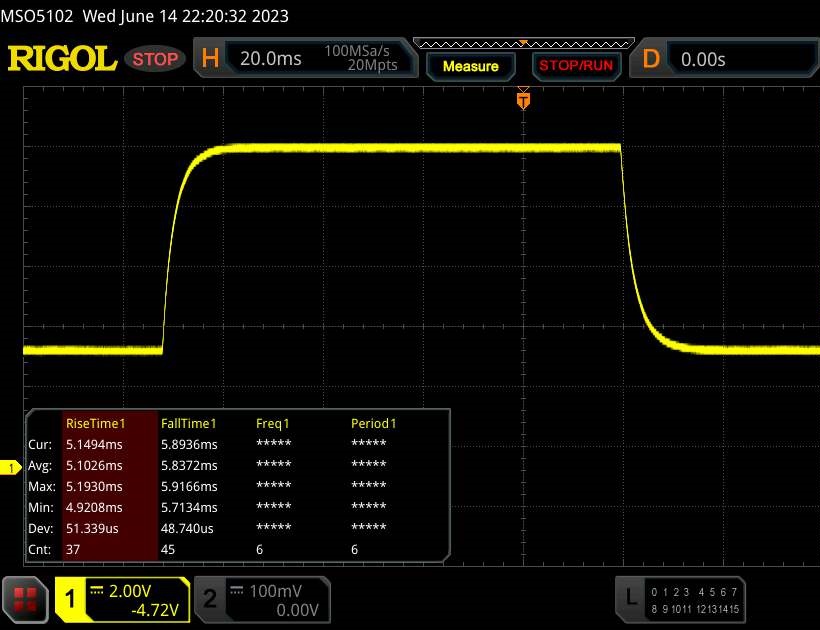 |
| ↘ 5.8 ms queda | ||
| A tela mostra boas taxas de resposta em nossos testes, mas pode ser muito lenta para jogadores competitivos. Em comparação, todos os dispositivos testados variam de 0.165 (mínimo) a 636 (máximo) ms. » 25 % de todos os dispositivos são melhores. Isso significa que o tempo de resposta medido é melhor que a média de todos os dispositivos testados (31 ms). | ||
Cintilação da tela / PWM (modulação por largura de pulso)
| Tela tremeluzindo / PWM não detectado | 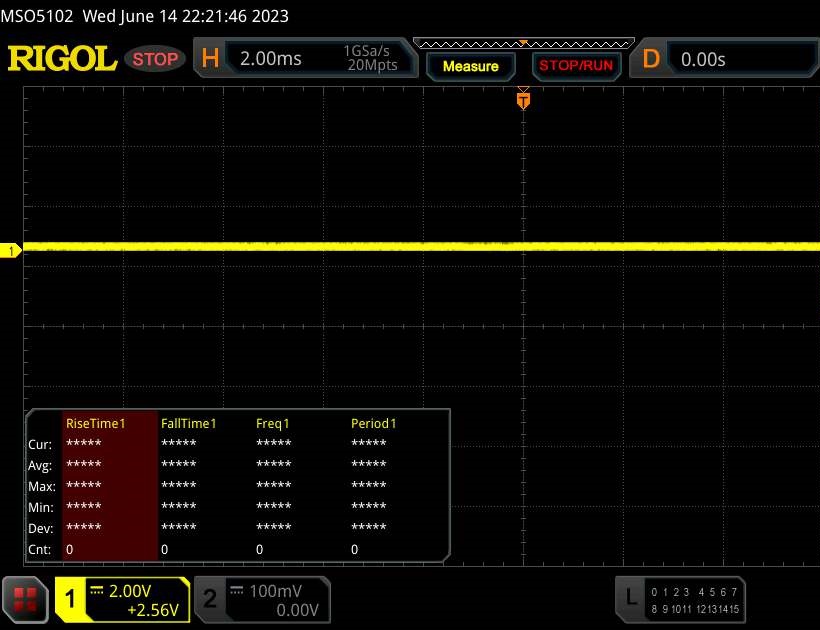 | ||
[pwm_comparison] Em comparação: 52 % de todos os dispositivos testados não usam PWM para escurecer a tela. Se PWM foi detectado, uma média de 7754 (mínimo: 5 - máximo: 343500) Hz foi medida. | |||
Desempenho
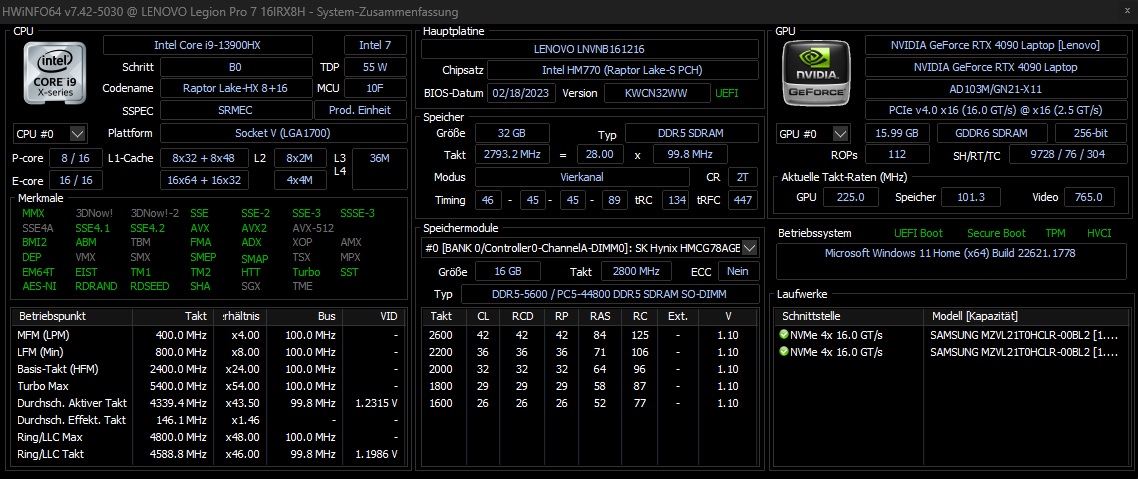
O Legion Pro 7 16IRX8H está na liga superior absoluta em termos de preço e desempenho. O computador de 16 polegadas oferece reservas suficientes para estar bem preparado para novos jogos nos próximos anos. Embora a CPU e a GPU sejam soldadas (o que é comum em laptops modernos), a memória de trabalho e o armazenamento em massa podem ser substituídos, se necessário.
Condições de teste
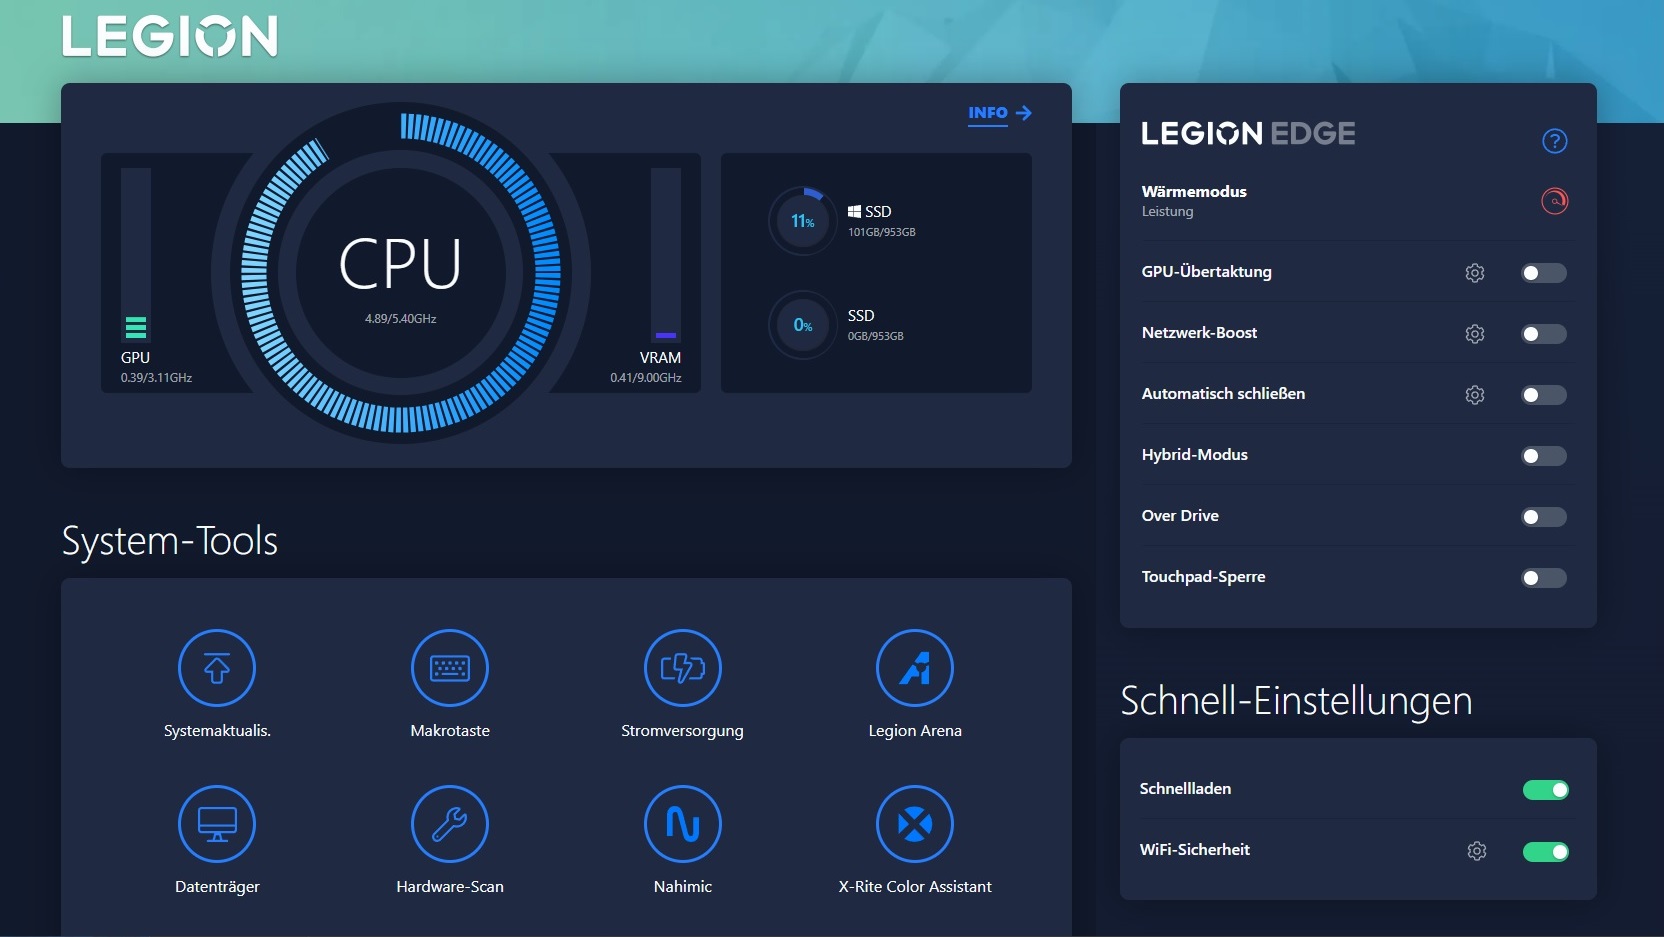
O software Lenovo Vantage pré-carregado contém muitas opções para personalizar o sistema. O modo Heat e o modo Hybrid opcional são particularmente relevantes. Com exceção das medições da bateria (balanceada com alternância de gráficos), todos os nossos testes foram realizados no modo Desempenho com uma dGPU permanentemente ativa.
| Modo silencioso | Modo balanceado | Modo de desempenho | |
| CPU PL1 (HWiNFO) | 55 W | 80 W | 130 W |
| CPU PL2 (HWiNFO) | 65 W | 119 W | 185 W |
| Ruído (Witcher 3 @FHD/Ultra) | ~37 dB(A) | ~47 dB(A) | ~53 dB(A) |
| Desempenho (Witcher 3 @FHD/Ultra) | 40 FPS (bloqueado) | ~160 FPS | ~200 FPS |
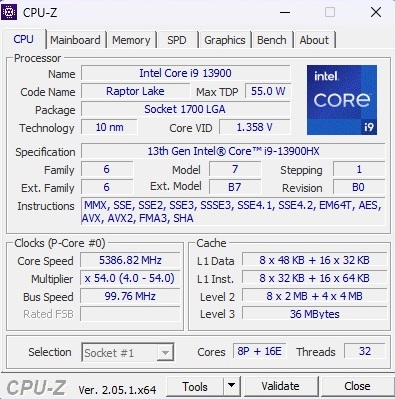
Processador
Como esperado, o Core i9-13900HX oferece desempenho muito semelhante ao do modelo RTX 4080. O desempenho do chip Raptor Lake também é bastante constante em períodos mais longos (consulte o loop do Cinebench). Em geral, a CPU tem um desempenho ligeiramente acima da média do 13900HX determinada até agora. A Intel combina 8 núcleos de desempenho com Hyper-Threading e 16 núcleos de eficiência sem HT, o que significa 32 threads paralelos no total.
Cinebench R15 Multi Loop
* ... menor é melhor
AIDA64: FP32 Ray-Trace | FPU Julia | CPU SHA3 | CPU Queen | FPU SinJulia | FPU Mandel | CPU AES | CPU ZLib | FP64 Ray-Trace | CPU PhotoWorxx
| Performance rating | |
| Asus ROG Strix Scar 17 G733PY-XS96 | |
| MSI Titan GT77 HX 13VI | |
| Lenovo Legion Pro 7 RTX4090 | |
| Lenovo Legion Pro 7 16IRX8H | |
| Schenker XMG Neo 16 E23 | |
| Média da turma Gaming | |
| Média Intel Core i9-13900HX | |
| Razer Blade 16 Early 2023 RTX 4090 | |
| AIDA64 / FP32 Ray-Trace | |
| Asus ROG Strix Scar 17 G733PY-XS96 | |
| Média da turma Gaming (10227 - 85542, n=105, últimos 2 anos) | |
| MSI Titan GT77 HX 13VI | |
| Lenovo Legion Pro 7 RTX4090 | |
| Lenovo Legion Pro 7 16IRX8H | |
| Média Intel Core i9-13900HX (17589 - 27615, n=22) | |
| Schenker XMG Neo 16 E23 | |
| Razer Blade 16 Early 2023 RTX 4090 | |
| AIDA64 / FPU Julia | |
| Asus ROG Strix Scar 17 G733PY-XS96 | |
| MSI Titan GT77 HX 13VI | |
| Média da turma Gaming (51376 - 238426, n=105, últimos 2 anos) | |
| Lenovo Legion Pro 7 RTX4090 | |
| Lenovo Legion Pro 7 16IRX8H | |
| Média Intel Core i9-13900HX (88686 - 137015, n=22) | |
| Schenker XMG Neo 16 E23 | |
| Razer Blade 16 Early 2023 RTX 4090 | |
| AIDA64 / CPU SHA3 | |
| Asus ROG Strix Scar 17 G733PY-XS96 | |
| MSI Titan GT77 HX 13VI | |
| Lenovo Legion Pro 7 16IRX8H | |
| Lenovo Legion Pro 7 RTX4090 | |
| Média da turma Gaming (2180 - 10115, n=105, últimos 2 anos) | |
| Schenker XMG Neo 16 E23 | |
| Média Intel Core i9-13900HX (4362 - 7029, n=22) | |
| Razer Blade 16 Early 2023 RTX 4090 | |
| AIDA64 / CPU Queen | |
| Asus ROG Strix Scar 17 G733PY-XS96 | |
| MSI Titan GT77 HX 13VI | |
| Razer Blade 16 Early 2023 RTX 4090 | |
| Schenker XMG Neo 16 E23 | |
| Lenovo Legion Pro 7 RTX4090 | |
| Lenovo Legion Pro 7 16IRX8H | |
| Média Intel Core i9-13900HX (125644 - 141385, n=22) | |
| Média da turma Gaming (49785 - 173351, n=90, últimos 2 anos) | |
| AIDA64 / FPU SinJulia | |
| Asus ROG Strix Scar 17 G733PY-XS96 | |
| MSI Titan GT77 HX 13VI | |
| Lenovo Legion Pro 7 16IRX8H | |
| Lenovo Legion Pro 7 RTX4090 | |
| Média Intel Core i9-13900HX (12334 - 17179, n=22) | |
| Schenker XMG Neo 16 E23 | |
| Média da turma Gaming (4424 - 33636, n=105, últimos 2 anos) | |
| Razer Blade 16 Early 2023 RTX 4090 | |
| AIDA64 / FPU Mandel | |
| Asus ROG Strix Scar 17 G733PY-XS96 | |
| Média da turma Gaming (25115 - 128721, n=105, últimos 2 anos) | |
| MSI Titan GT77 HX 13VI | |
| Lenovo Legion Pro 7 RTX4090 | |
| Lenovo Legion Pro 7 16IRX8H | |
| Média Intel Core i9-13900HX (43850 - 69202, n=22) | |
| Schenker XMG Neo 16 E23 | |
| Razer Blade 16 Early 2023 RTX 4090 | |
| AIDA64 / CPU AES | |
| Schenker XMG Neo 16 E23 | |
| Razer Blade 16 Early 2023 RTX 4090 | |
| Asus ROG Strix Scar 17 G733PY-XS96 | |
| Média Intel Core i9-13900HX (89413 - 237881, n=22) | |
| MSI Titan GT77 HX 13VI | |
| Lenovo Legion Pro 7 RTX4090 | |
| Lenovo Legion Pro 7 16IRX8H | |
| Média da turma Gaming (39258 - 247074, n=105, últimos 2 anos) | |
| AIDA64 / CPU ZLib | |
| Asus ROG Strix Scar 17 G733PY-XS96 | |
| MSI Titan GT77 HX 13VI | |
| Lenovo Legion Pro 7 16IRX8H | |
| Lenovo Legion Pro 7 RTX4090 | |
| Schenker XMG Neo 16 E23 | |
| Média Intel Core i9-13900HX (1284 - 1958, n=22) | |
| Razer Blade 16 Early 2023 RTX 4090 | |
| Média da turma Gaming (574 - 2531, n=105, últimos 2 anos) | |
| AIDA64 / FP64 Ray-Trace | |
| Asus ROG Strix Scar 17 G733PY-XS96 | |
| Média da turma Gaming (5509 - 45446, n=105, últimos 2 anos) | |
| MSI Titan GT77 HX 13VI | |
| Lenovo Legion Pro 7 16IRX8H | |
| Lenovo Legion Pro 7 RTX4090 | |
| Média Intel Core i9-13900HX (9481 - 15279, n=22) | |
| Schenker XMG Neo 16 E23 | |
| Razer Blade 16 Early 2023 RTX 4090 | |
| AIDA64 / CPU PhotoWorxx | |
| Razer Blade 16 Early 2023 RTX 4090 | |
| Lenovo Legion Pro 7 RTX4090 | |
| Schenker XMG Neo 16 E23 | |
| Lenovo Legion Pro 7 16IRX8H | |
| Média Intel Core i9-13900HX (42994 - 51994, n=22) | |
| Média da turma Gaming (12271 - 89891, n=105, últimos 2 anos) | |
| MSI Titan GT77 HX 13VI | |
| Asus ROG Strix Scar 17 G733PY-XS96 | |
Desempenho do sistema
A potência do sistema também está em um nível muito alto: 8.158 pontos no PCMark 10 são alguns pontos percentuais mais altos do que o resultado do modelo RTX 4080. Os resultados de benchmark da memória de trabalho DDR5 também são impressionantes em comparação.
CrossMark: Overall | Productivity | Creativity | Responsiveness
| PCMark 10 / Score | |
| MSI Titan GT77 HX 13VI | |
| Asus ROG Strix Scar 17 G733PY-XS96 | |
| Média Intel Core i9-13900HX, NVIDIA GeForce RTX 4090 Laptop GPU (7690 - 9331, n=8) | |
| Média da turma Gaming (5828 - 12414, n=93, últimos 2 anos) | |
| Schenker XMG Neo 16 E23 | |
| Lenovo Legion Pro 7 RTX4090 | |
| Lenovo Legion Pro 7 16IRX8H | |
| Razer Blade 16 Early 2023 RTX 4090 | |
| PCMark 10 / Essentials | |
| MSI Titan GT77 HX 13VI | |
| Lenovo Legion Pro 7 16IRX8H | |
| Média Intel Core i9-13900HX, NVIDIA GeForce RTX 4090 Laptop GPU (10972 - 11983, n=8) | |
| Asus ROG Strix Scar 17 G733PY-XS96 | |
| Lenovo Legion Pro 7 RTX4090 | |
| Schenker XMG Neo 16 E23 | |
| Razer Blade 16 Early 2023 RTX 4090 | |
| Média da turma Gaming (8810 - 11935, n=97, últimos 2 anos) | |
| PCMark 10 / Productivity | |
| Média da turma Gaming (6845 - 25323, n=95, últimos 2 anos) | |
| Lenovo Legion Pro 7 16IRX8H | |
| Média Intel Core i9-13900HX, NVIDIA GeForce RTX 4090 Laptop GPU (9038 - 11680, n=8) | |
| Asus ROG Strix Scar 17 G733PY-XS96 | |
| MSI Titan GT77 HX 13VI | |
| Schenker XMG Neo 16 E23 | |
| Lenovo Legion Pro 7 RTX4090 | |
| Razer Blade 16 Early 2023 RTX 4090 | |
| PCMark 10 / Digital Content Creation | |
| MSI Titan GT77 HX 13VI | |
| Asus ROG Strix Scar 17 G733PY-XS96 | |
| Schenker XMG Neo 16 E23 | |
| Lenovo Legion Pro 7 RTX4090 | |
| Média da turma Gaming (7602 - 19954, n=95, últimos 2 anos) | |
| Média Intel Core i9-13900HX, NVIDIA GeForce RTX 4090 Laptop GPU (10605 - 16395, n=8) | |
| Razer Blade 16 Early 2023 RTX 4090 | |
| Lenovo Legion Pro 7 16IRX8H | |
| CrossMark / Overall | |
| MSI Titan GT77 HX 13VI | |
| Schenker XMG Neo 16 E23 | |
| Média Intel Core i9-13900HX, NVIDIA GeForce RTX 4090 Laptop GPU (1825 - 2295, n=8) | |
| Razer Blade 16 Early 2023 RTX 4090 | |
| Asus ROG Strix Scar 17 G733PY-XS96 | |
| Média da turma Gaming (1366 - 2409, n=94, últimos 2 anos) | |
| CrossMark / Productivity | |
| MSI Titan GT77 HX 13VI | |
| Média Intel Core i9-13900HX, NVIDIA GeForce RTX 4090 Laptop GPU (1666 - 2166, n=8) | |
| Schenker XMG Neo 16 E23 | |
| Razer Blade 16 Early 2023 RTX 4090 | |
| Média da turma Gaming (1386 - 2254, n=94, últimos 2 anos) | |
| Asus ROG Strix Scar 17 G733PY-XS96 | |
| CrossMark / Creativity | |
| Schenker XMG Neo 16 E23 | |
| MSI Titan GT77 HX 13VI | |
| Média Intel Core i9-13900HX, NVIDIA GeForce RTX 4090 Laptop GPU (2162 - 2514, n=8) | |
| Asus ROG Strix Scar 17 G733PY-XS96 | |
| Média da turma Gaming (1343 - 2786, n=94, últimos 2 anos) | |
| Razer Blade 16 Early 2023 RTX 4090 | |
| CrossMark / Responsiveness | |
| MSI Titan GT77 HX 13VI | |
| Média Intel Core i9-13900HX, NVIDIA GeForce RTX 4090 Laptop GPU (1441 - 2275, n=8) | |
| Razer Blade 16 Early 2023 RTX 4090 | |
| Schenker XMG Neo 16 E23 | |
| Média da turma Gaming (1226 - 2334, n=94, últimos 2 anos) | |
| Asus ROG Strix Scar 17 G733PY-XS96 | |
| PCMark 10 Score | 8158 pontos | |
Ajuda | ||
| AIDA64 / Memory Copy | |
| Razer Blade 16 Early 2023 RTX 4090 | |
| Lenovo Legion Pro 7 RTX4090 | |
| Lenovo Legion Pro 7 16IRX8H | |
| Schenker XMG Neo 16 E23 | |
| Média Intel Core i9-13900HX (67716 - 79193, n=22) | |
| Média da turma Gaming (21750 - 129946, n=105, últimos 2 anos) | |
| MSI Titan GT77 HX 13VI | |
| Asus ROG Strix Scar 17 G733PY-XS96 | |
| AIDA64 / Memory Read | |
| Lenovo Legion Pro 7 RTX4090 | |
| Razer Blade 16 Early 2023 RTX 4090 | |
| Lenovo Legion Pro 7 16IRX8H | |
| Schenker XMG Neo 16 E23 | |
| Média Intel Core i9-13900HX (73998 - 88462, n=22) | |
| Média da turma Gaming (22956 - 118858, n=105, últimos 2 anos) | |
| MSI Titan GT77 HX 13VI | |
| Asus ROG Strix Scar 17 G733PY-XS96 | |
| AIDA64 / Memory Write | |
| Lenovo Legion Pro 7 RTX4090 | |
| Razer Blade 16 Early 2023 RTX 4090 | |
| Média da turma Gaming (22297 - 135096, n=105, últimos 2 anos) | |
| Média Intel Core i9-13900HX (65472 - 77045, n=22) | |
| Schenker XMG Neo 16 E23 | |
| Lenovo Legion Pro 7 16IRX8H | |
| MSI Titan GT77 HX 13VI | |
| Asus ROG Strix Scar 17 G733PY-XS96 | |
| AIDA64 / Memory Latency | |
| Média da turma Gaming (75.3 - 259, n=105, últimos 2 anos) | |
| MSI Titan GT77 HX 13VI | |
| Razer Blade 16 Early 2023 RTX 4090 | |
| Schenker XMG Neo 16 E23 | |
| Média Intel Core i9-13900HX (75.3 - 91.1, n=22) | |
| Lenovo Legion Pro 7 RTX4090 | |
| Lenovo Legion Pro 7 16IRX8H | |
| Asus ROG Strix Scar 17 G733PY-XS96 | |
* ... menor é melhor
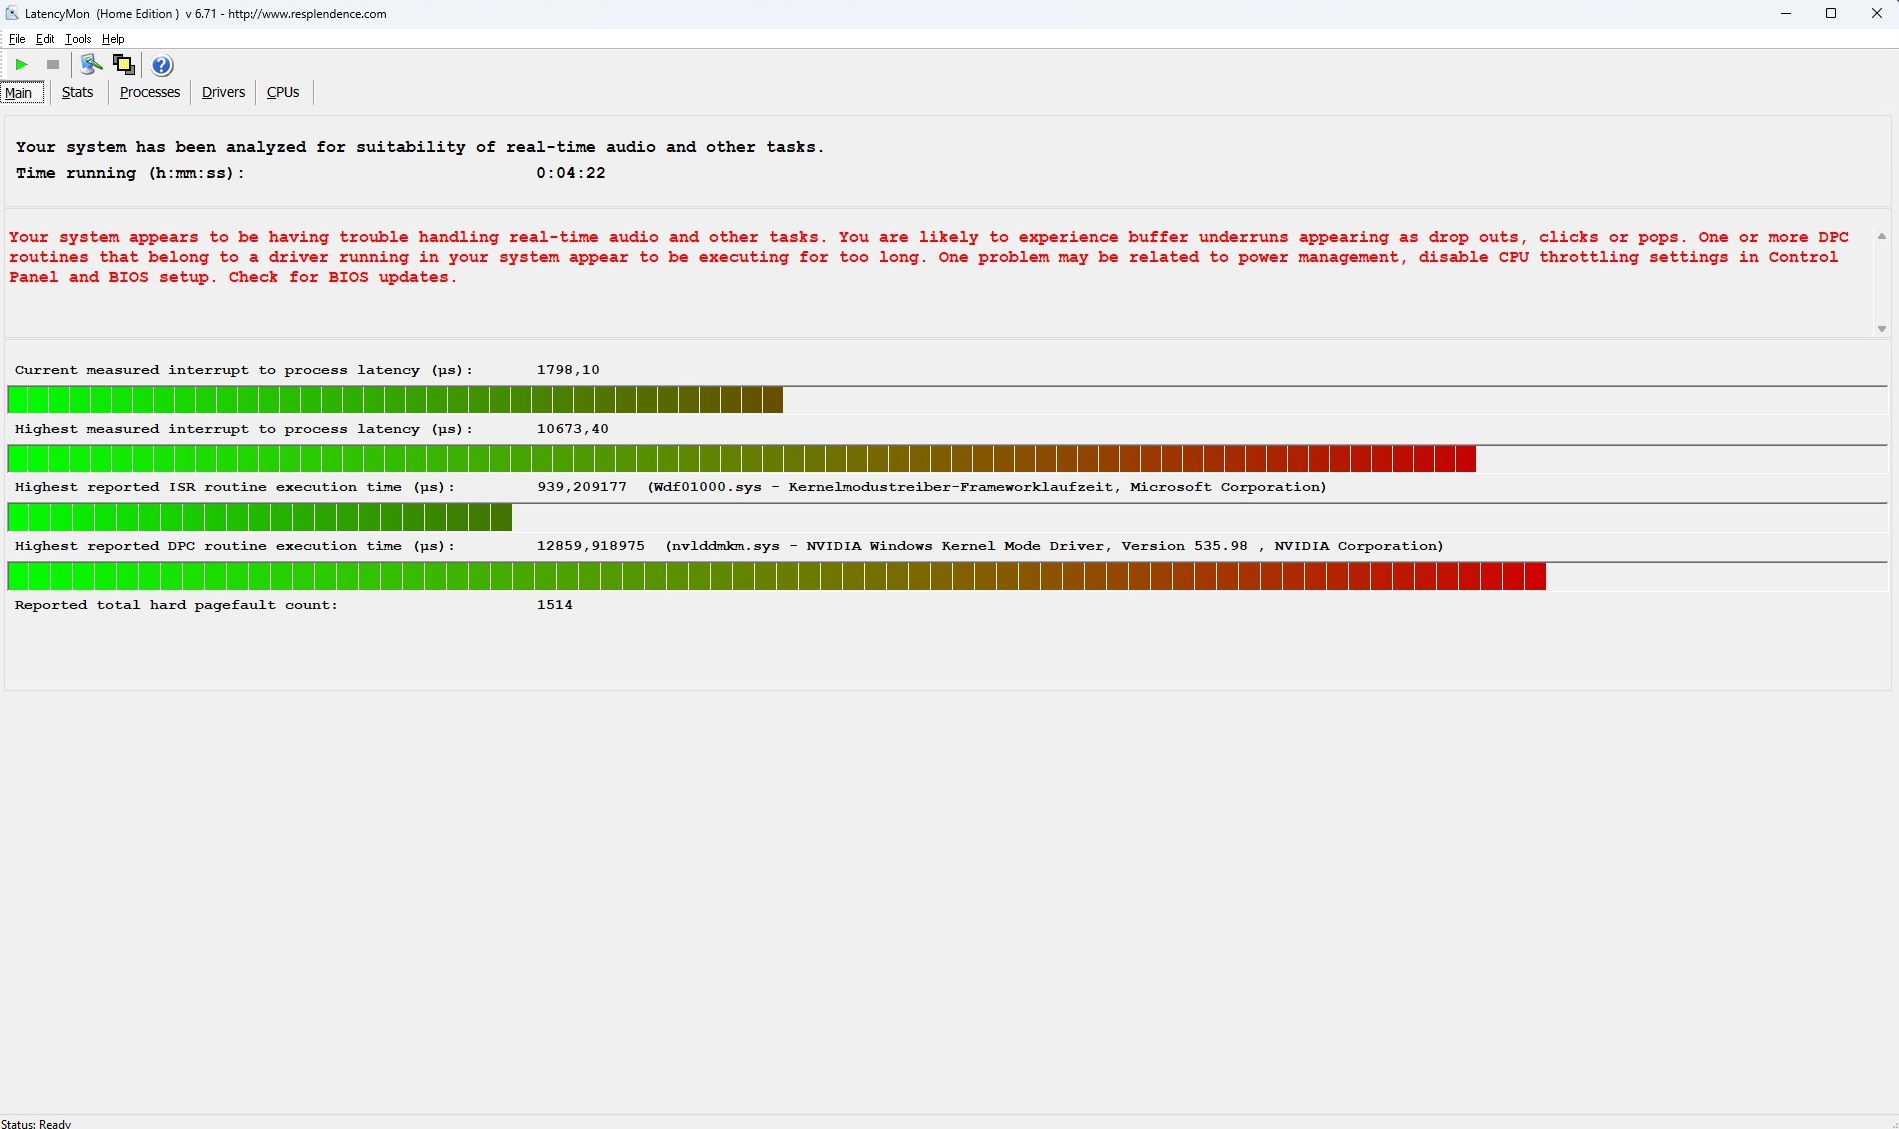
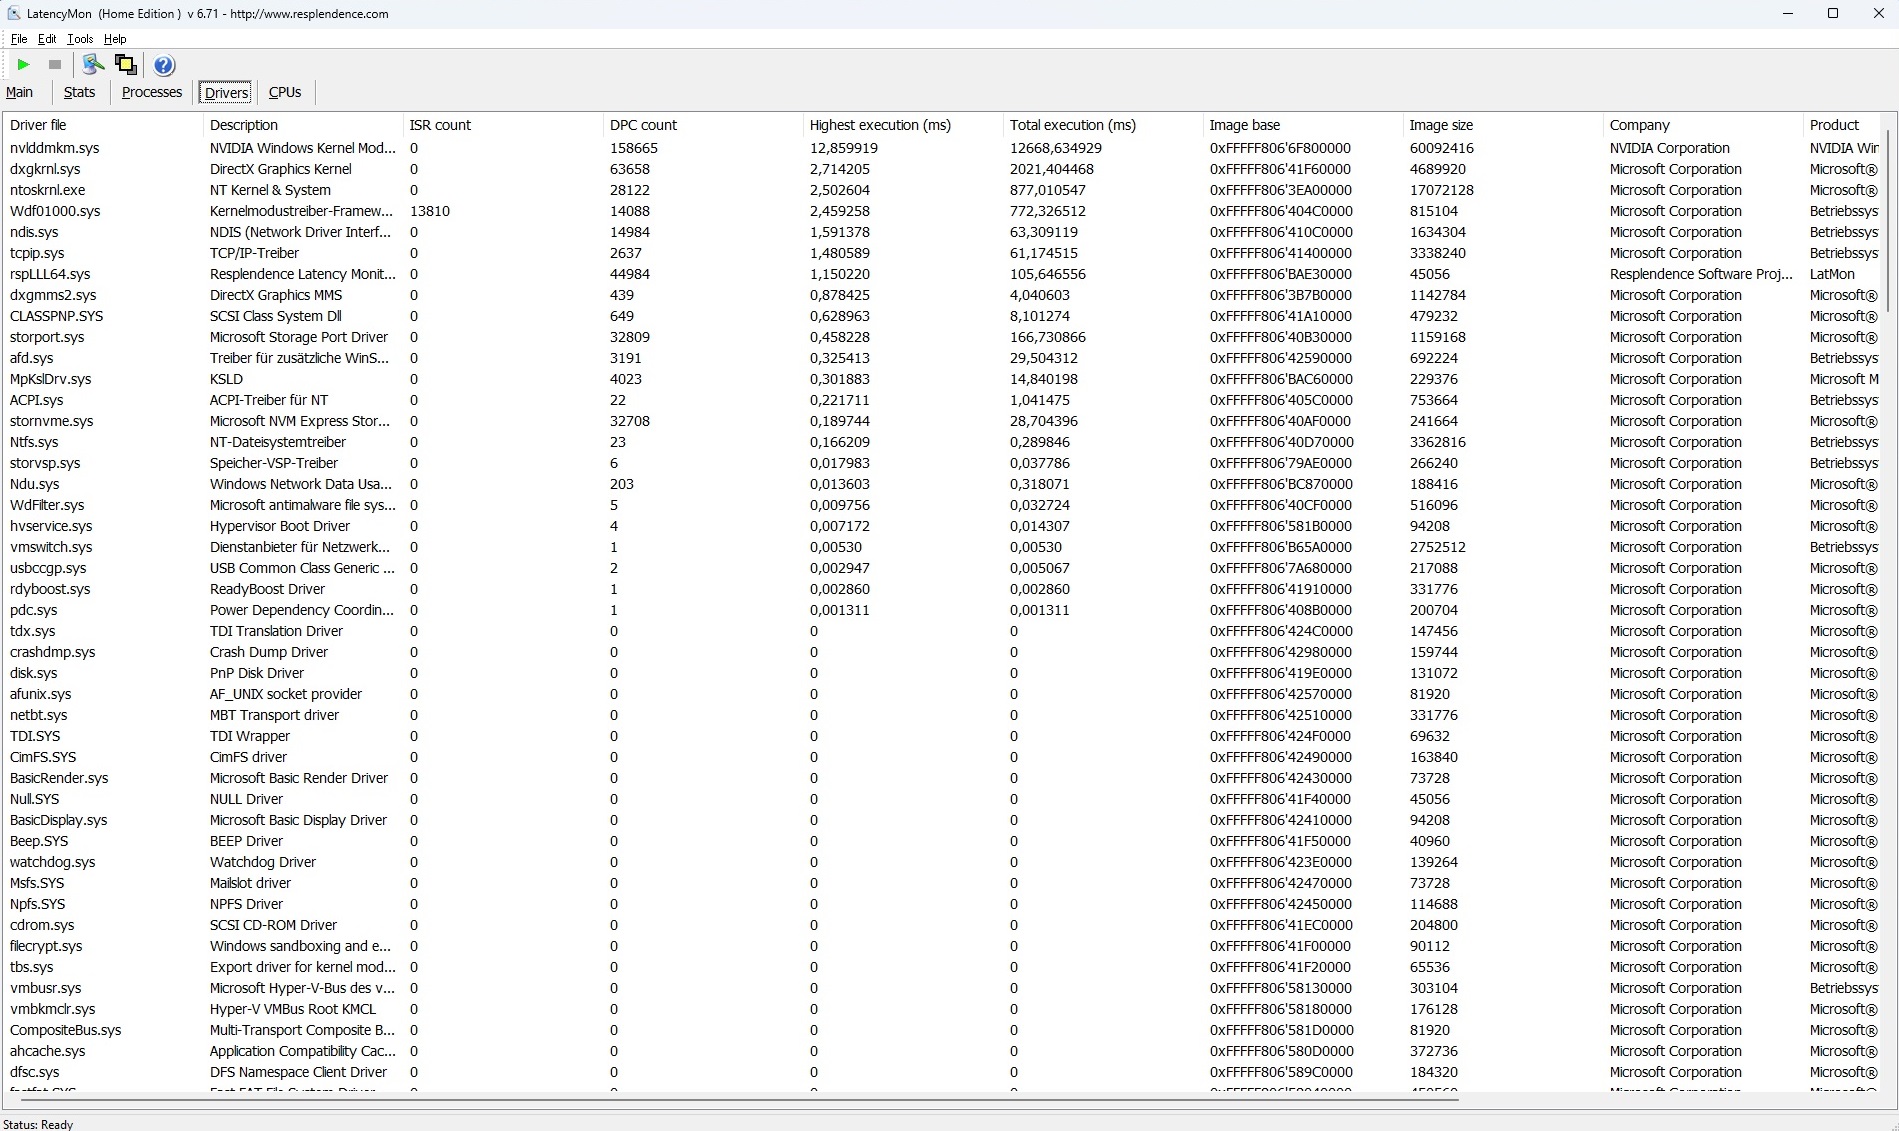
Latências de DPC
A configuração de teste não tem um desempenho tão bom em termos de latências. De acordo com a ferramenta LatencyMon, o dispositivo de 16 polegadas não é adequado para edição de áudio e vídeo em tempo real em seu estado de entrega devido aos valores extremamente altos. É interessante notar que as latências foram significativamente menores na versão RTX 4080.
| DPC Latencies / LatencyMon - interrupt to process latency (max), Web, Youtube, Prime95 | |
| Lenovo Legion Pro 7 RTX4090 | |
| Schenker XMG Neo 16 E23 | |
| MSI Titan GT77 HX 13VI | |
| Asus ROG Strix Scar 17 G733PY-XS96 | |
| Lenovo Legion Pro 7 16IRX8H | |
* ... menor é melhor
Armazenamento em massa
Em vez de instalar um SSD maior, a Lenovo simplesmente usa dois SSDs de 1 TB do modelo mais barato Legion, que ocupa completamente os slots M.2. O popular Samsung PM9A1 alcança resultados muito bons, mas frequentemente precisa lidar com flutuações ou quedas mais fortes durante períodos mais longos de carga, como no caso do Pro 7. No entanto, esse fenômeno também afeta os SSDs NVMe de outros fabricantes (consulte o gráfico).

* ... menor é melhor
Continuous read: DiskSpd Read Loop, Queue Depth 8
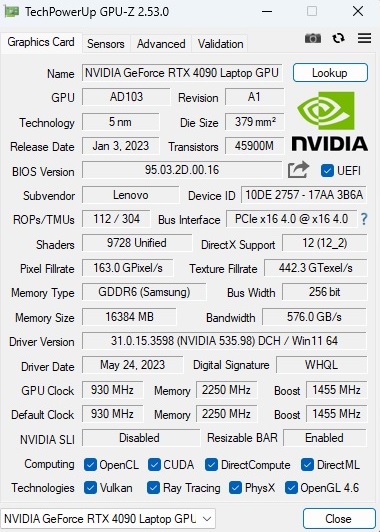
Placa de vídeo
A GeForce RTX 4090 é atualmente a placa de vídeo móvel mais rápida para jogos. O modelo superior da geração Ada-Lovelace da Nvidia vem com 9.728 shaders e 16 GB de memória GDDR6. Quando se trata de benchmarks sintéticos, a Legion Pro 7 fica no meio do caminho entre a concorrência da RTX 4090, que também conta com o TGP máximo de 175 watts (incluindo o Dynamic Boost).
| 3DMark 11 Performance | 44779 pontos | |
| 3DMark Fire Strike Score | 34742 pontos | |
| 3DMark Time Spy Score | 20039 pontos | |
Ajuda | ||
* ... menor é melhor
Desempenho em jogos
O dispositivo de 16 polegadas mostra seus músculos especialmente nos testes de jogos. Os títulos atuais são executados sem problemas na resolução nativa (nossos benchmarks QHD foram criados com 2.560 x 1.440 em vez de 2.560 x 1.600 pixels), mesmo com o máximo de detalhes, e mais de 60 FPS são quase sempre alcançados. Mesmo em telas 4K, as configurações completas normalmente não seriam um problema, mesmo sem a ajuda do DLSS ou do Frame Generation.
| The Witcher 3 - 1920x1080 Ultra Graphics & Postprocessing (HBAO+) | |
| Schenker XMG Neo 16 E23 | |
| Asus ROG Strix Scar 17 G733PY-XS96 | |
| Lenovo Legion Pro 7 RTX4090 | |
| MSI Titan GT77 HX 13VI | |
| Média NVIDIA GeForce RTX 4090 Laptop GPU (139.2 - 216, n=35) | |
| Média da turma Gaming (104.7 - 240, n=7, últimos 2 anos) | |
| Lenovo Legion Pro 7 16IRX8H | |
| Razer Blade 16 Early 2023 RTX 4090 | |
| Call of Duty Modern Warfare 2 2022 | |
| 3840x2160 Extreme Quality Preset AA:T2X Filmic SM | |
| MSI Titan GT77 HX 13VI | |
| Asus ROG Strix Scar 17 G733PY-XS96 | |
| Lenovo Legion Pro 7 RTX4090 | |
| Média NVIDIA GeForce RTX 4090 Laptop GPU (63 - 86, n=12) | |
| Razer Blade 16 Early 2023 RTX 4090 | |
| Lenovo Legion Pro 7 16IRX8H | |
| 2560x1440 Extreme Quality Preset AA:T2X Filmic SM | |
| MSI Titan GT77 HX 13VI | |
| Asus ROG Strix Scar 17 G733PY-XS96 | |
| Lenovo Legion Pro 7 RTX4090 | |
| Média NVIDIA GeForce RTX 4090 Laptop GPU (104 - 137, n=14) | |
| Razer Blade 16 Early 2023 RTX 4090 | |
| Lenovo Legion Pro 7 16IRX8H | |
| A Plague Tale Requiem | |
| 3840x2160 Ultra Preset | |
| Lenovo Legion Pro 7 RTX4090 | |
| Média NVIDIA GeForce RTX 4090 Laptop GPU (33.1 - 43.8, n=3) | |
| Lenovo Legion Pro 7 16IRX8H | |
| 2560x1440 Ultra Preset | |
| Lenovo Legion Pro 7 RTX4090 | |
| Média NVIDIA GeForce RTX 4090 Laptop GPU (58.9 - 77.2, n=3) | |
| Lenovo Legion Pro 7 16IRX8H | |
| Spider-Man Miles Morales | |
| 3840x2160 Very High Preset AA:T | |
| MSI Titan GT77 HX 13VI | |
| Lenovo Legion Pro 7 RTX4090 | |
| Média NVIDIA GeForce RTX 4090 Laptop GPU (65.7 - 84.3, n=7) | |
| Lenovo Legion Pro 7 16IRX8H | |
| 2560x1440 Very High Preset AA:T | |
| MSI Titan GT77 HX 13VI | |
| Lenovo Legion Pro 7 RTX4090 | |
| Média NVIDIA GeForce RTX 4090 Laptop GPU (93.3 - 119.8, n=7) | |
| Lenovo Legion Pro 7 16IRX8H | |
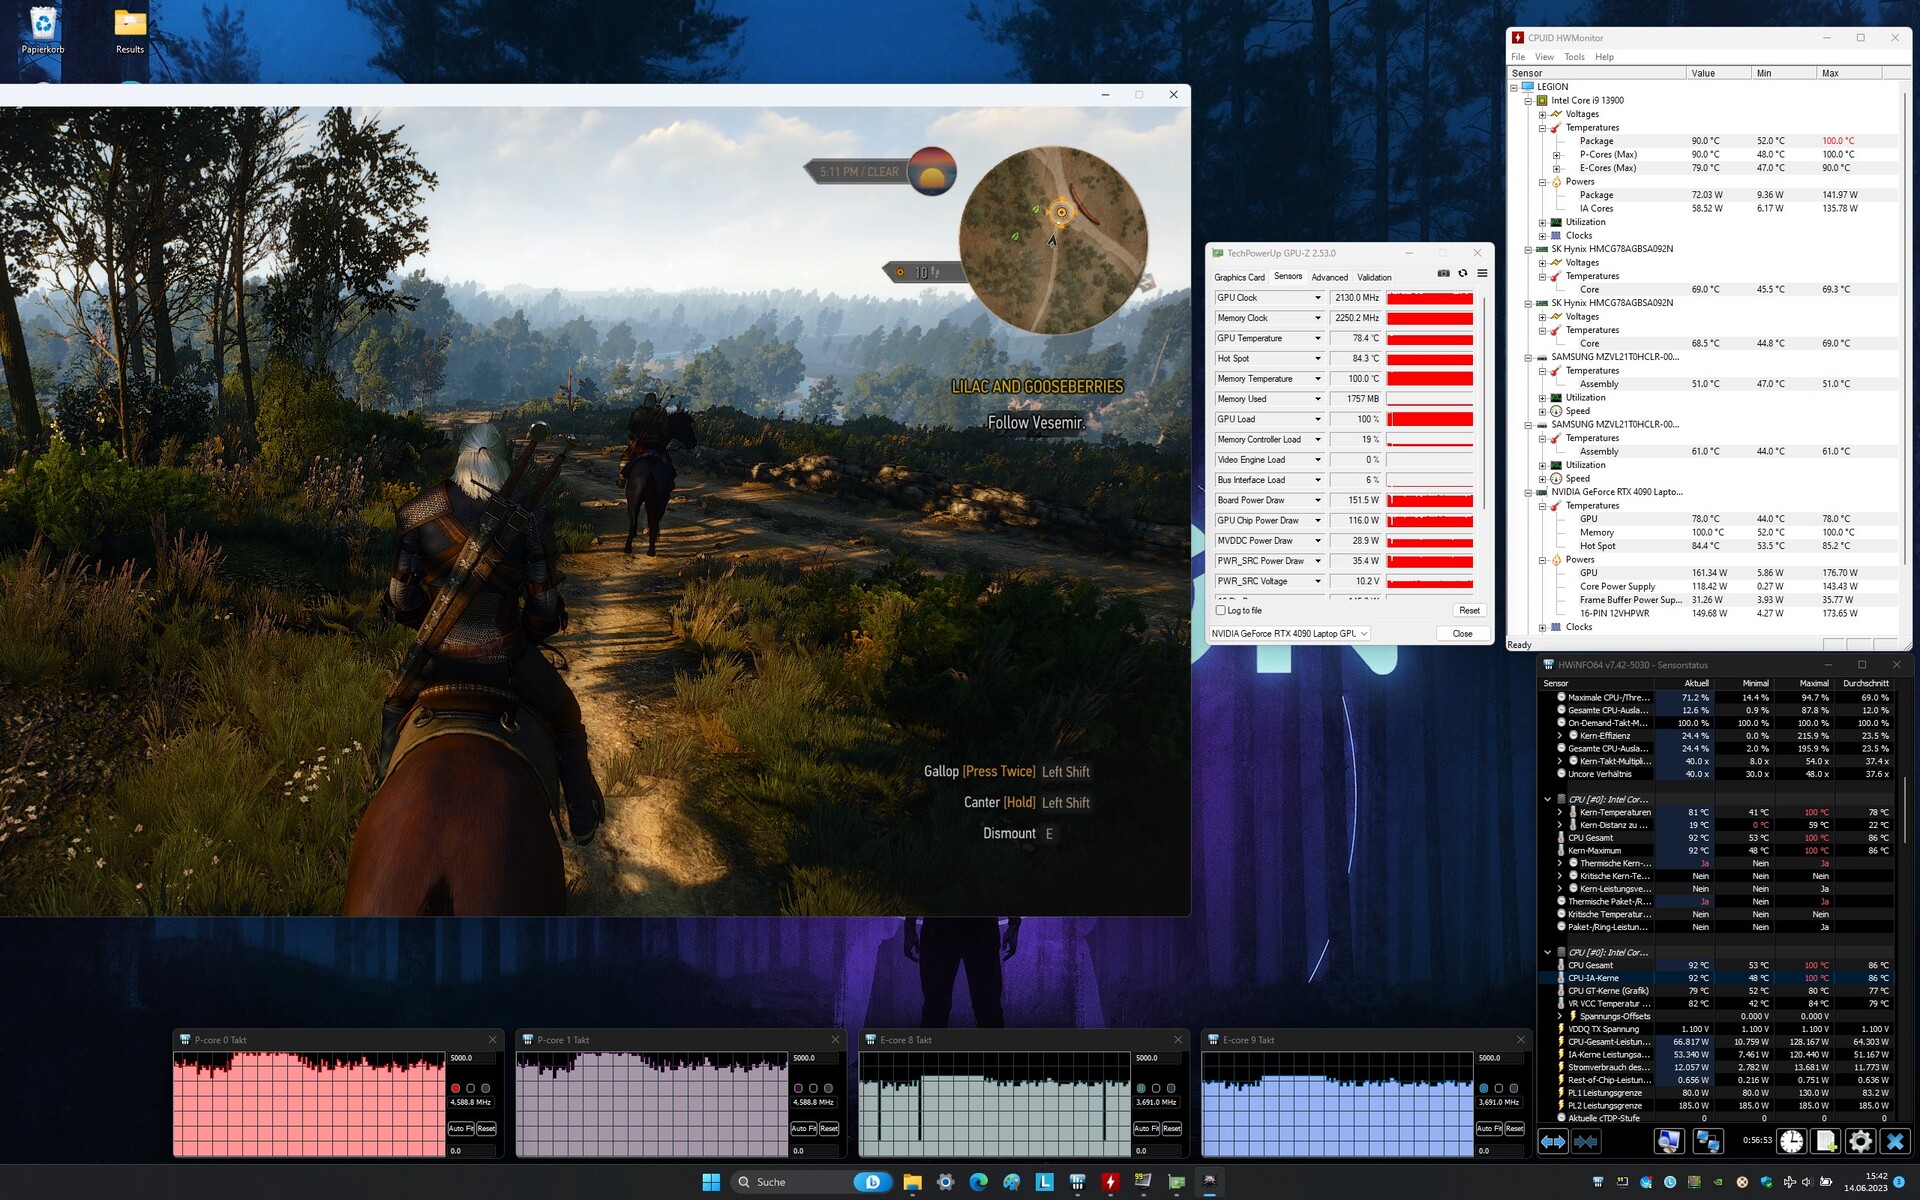
Como de costume, testamos se o desempenho da GPU permanece constante sob uma carga mais longa com O Witcher 3. Semelhante à concorrência, não notamos nenhuma queda de desempenho ou algo semelhante, além de pequenas flutuações.
Witcher 3 FPS-Diagramm
| baixo | média | alto | ultra | QHD | 4K | |
|---|---|---|---|---|---|---|
| GTA V (2015) | 186.3 | 186.9 | 184.9 | 143.6 | 137.7 | 173.6 |
| The Witcher 3 (2015) | 200 | |||||
| Dota 2 Reborn (2015) | 230 | 204 | 193.9 | 182.1 | 175.1 | |
| Final Fantasy XV Benchmark (2018) | 223 | 212 | 181.2 | 154 | 91.7 | |
| X-Plane 11.11 (2018) | 201 | 177.7 | 136.4 | 111.7 | ||
| Strange Brigade (2018) | 439 | 369 | 359 | 347 | 302 | 158.4 |
| Shadow of the Tomb Raider (2018) | 185 | 120 | ||||
| Cyberpunk 2077 1.6 (2022) | 100.93 | 50.05 | ||||
| F1 22 (2022) | 301 | 303 | 279 | 129.2 | 85.2 | 45.9 |
| A Plague Tale Requiem (2022) | 77.2 | 43.8 | ||||
| Call of Duty Modern Warfare 2 2022 (2022) | 132 | 82 | ||||
| Spider-Man Miles Morales (2022) | 108.1 | 80 | ||||
| The Witcher 3 v4 (2023) | 101.2 | 48.7 | ||||
| The Last of Us (2023) | 85.8 | 45.7 |
Emissões
Emissões de ruído
A grande desvantagem de componentes de ponta tão potentes é, sem surpresa, o desenvolvimento de ruído. No modo Desempenho, o dispositivo de 16 polegadas fica alto em aplicativos 3D entre 48 dB(A) (média do 3DMark 06) e 55 dB(A) (teste de estresse máximo). Nos jogos, você pode esperar cerca de 53 dB(A), o que também é muito desagradável sem um fone de ouvido. A situação é muito mais tranquila no modo inativo. Embora os ventiladores ocasionalmente fiquem um pouco altos (por exemplo, durante a inicialização), uma média de 28 a 30 dB(A) é aceitável, especialmente porque o modo Silencioso ou Balanceado pode ser usado, se desejado.
Barulho
| Ocioso |
| 28 / 30 / 38 dB |
| Carga |
| 48 / 55 dB |
 | ||
30 dB silencioso 40 dB(A) audível 50 dB(A) ruidosamente alto |
||
min: | ||
| Lenovo Legion Pro 7 RTX4090 i9-13900HX, GeForce RTX 4090 Laptop GPU | Razer Blade 16 Early 2023 RTX 4090 i9-13950HX, GeForce RTX 4090 Laptop GPU | Asus ROG Strix Scar 17 G733PY-XS96 R9 7945HX, GeForce RTX 4090 Laptop GPU | Schenker XMG Neo 16 E23 i9-13900HX, GeForce RTX 4090 Laptop GPU | MSI Titan GT77 HX 13VI i9-13950HX, GeForce RTX 4090 Laptop GPU | Lenovo Legion Pro 7 16IRX8H i9-13900HX, GeForce RTX 4080 Laptop GPU | |
|---|---|---|---|---|---|---|
| Noise | 18% | 14% | -10% | 1% | 4% | |
| desligado / ambiente * (dB) | 25 | 20.84 17% | 22.7 9% | 25 -0% | 24.6 2% | 24 4% |
| Idle Minimum * (dB) | 28 | 23.65 16% | 23.5 16% | 31 -11% | 29.2 -4% | 26 7% |
| Idle Average * (dB) | 30 | 23.65 21% | 27.7 8% | 33 -10% | 29.2 3% | 28 7% |
| Idle Maximum * (dB) | 38 | 23.65 38% | 27.7 27% | 42 -11% | 29.2 23% | 34 11% |
| Load Average * (dB) | 48 | 43.35 10% | 30.5 36% | 58 -21% | 50.7 -6% | 47 2% |
| Witcher 3 ultra * (dB) | 53 | 46.7 12% | 51.4 3% | 57 -8% | 53.3 -1% | 55 -4% |
| Load Maximum * (dB) | 55 | 46.72 15% | 54.1 2% | 59 -7% | 61 -11% | 56 -2% |
* ... menor é melhor
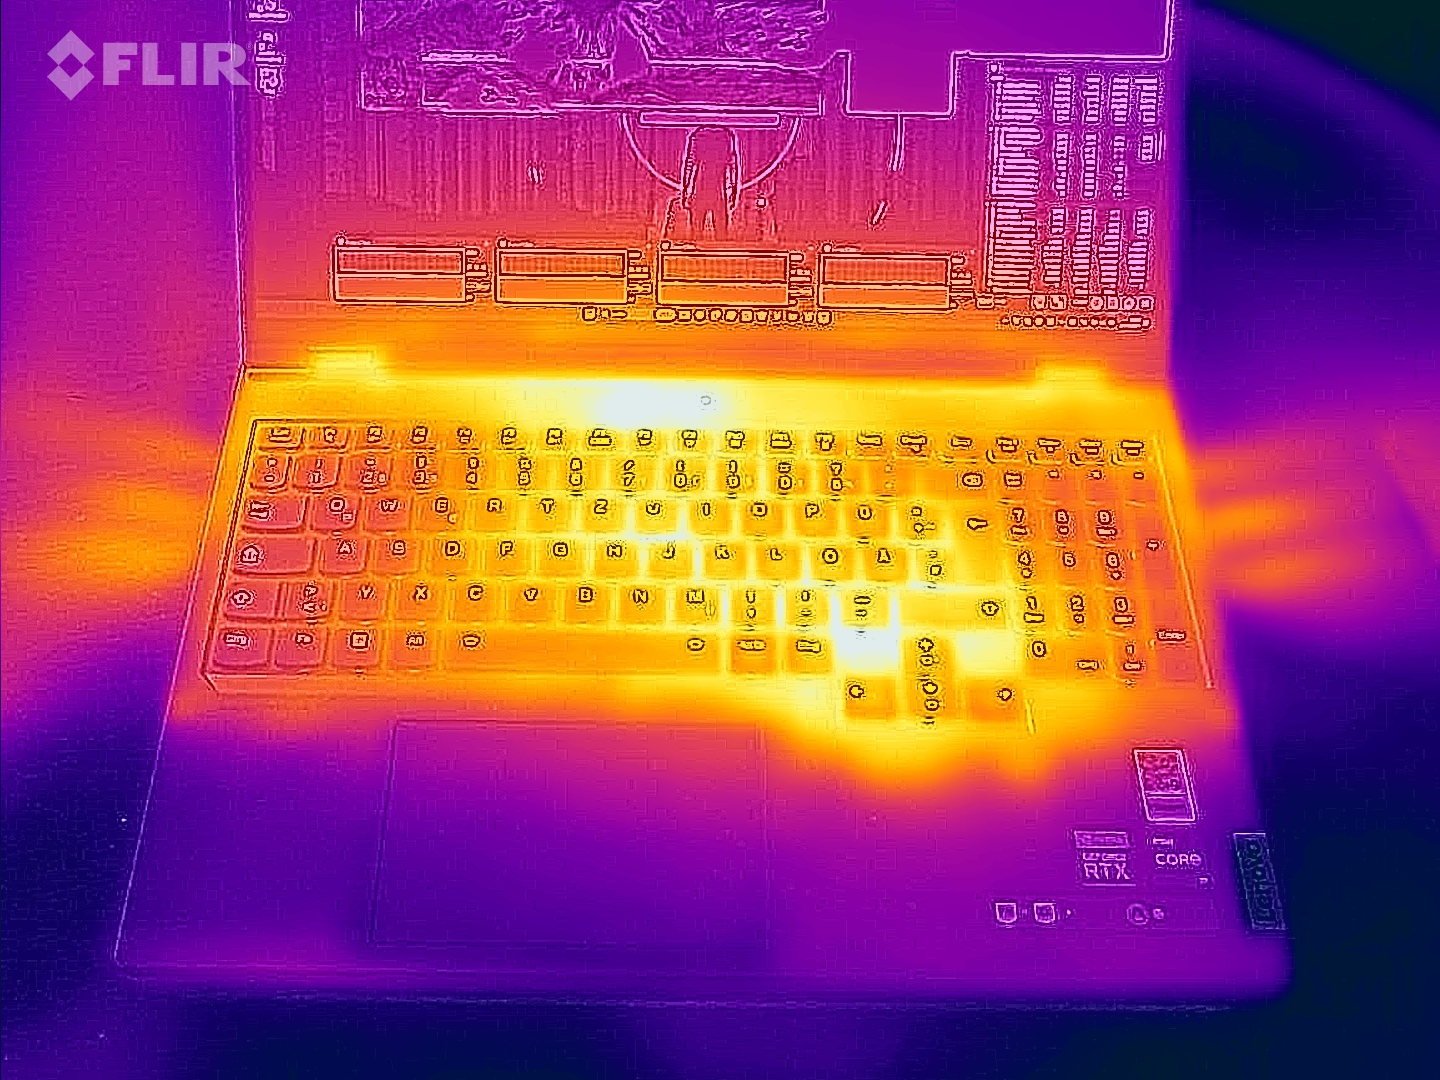
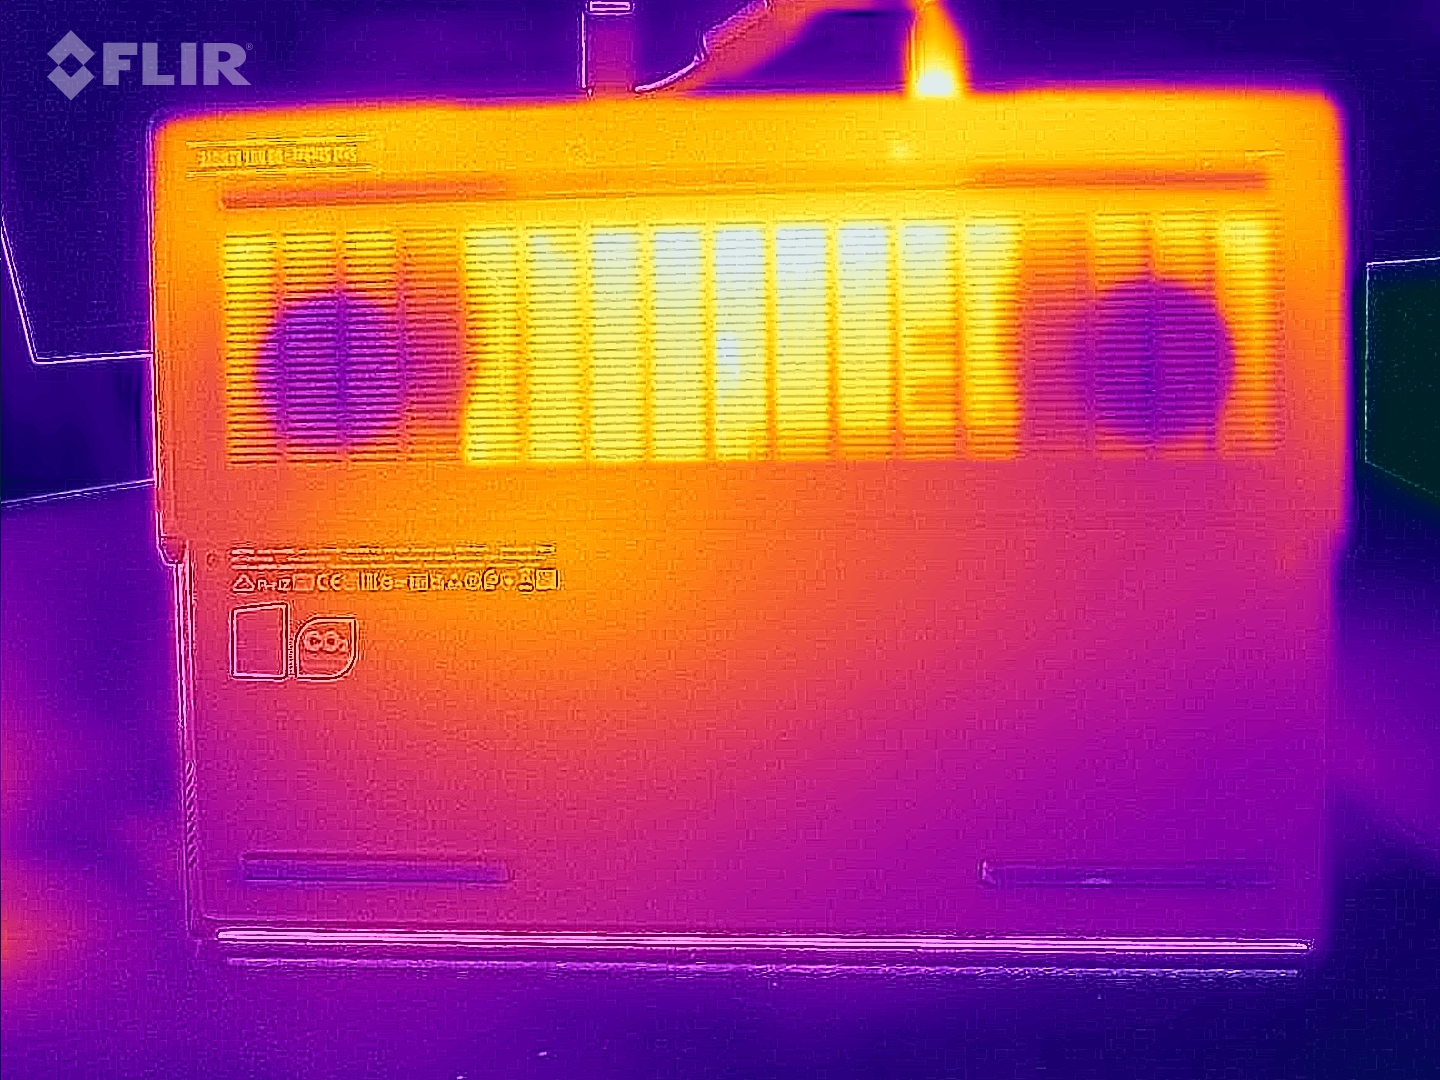
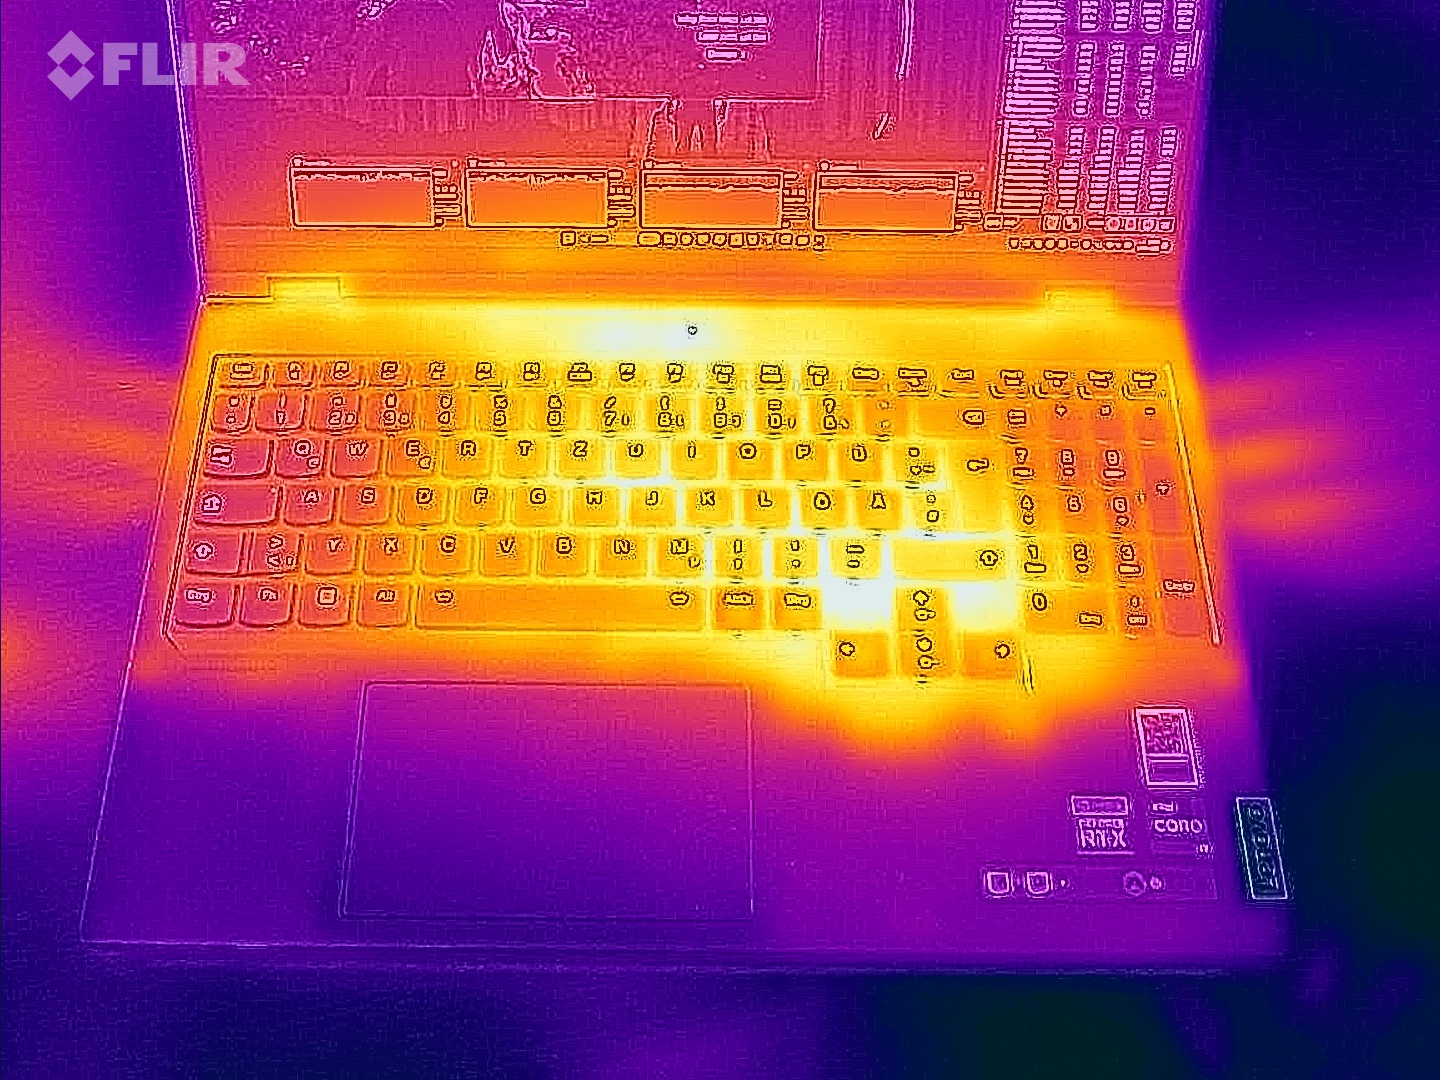
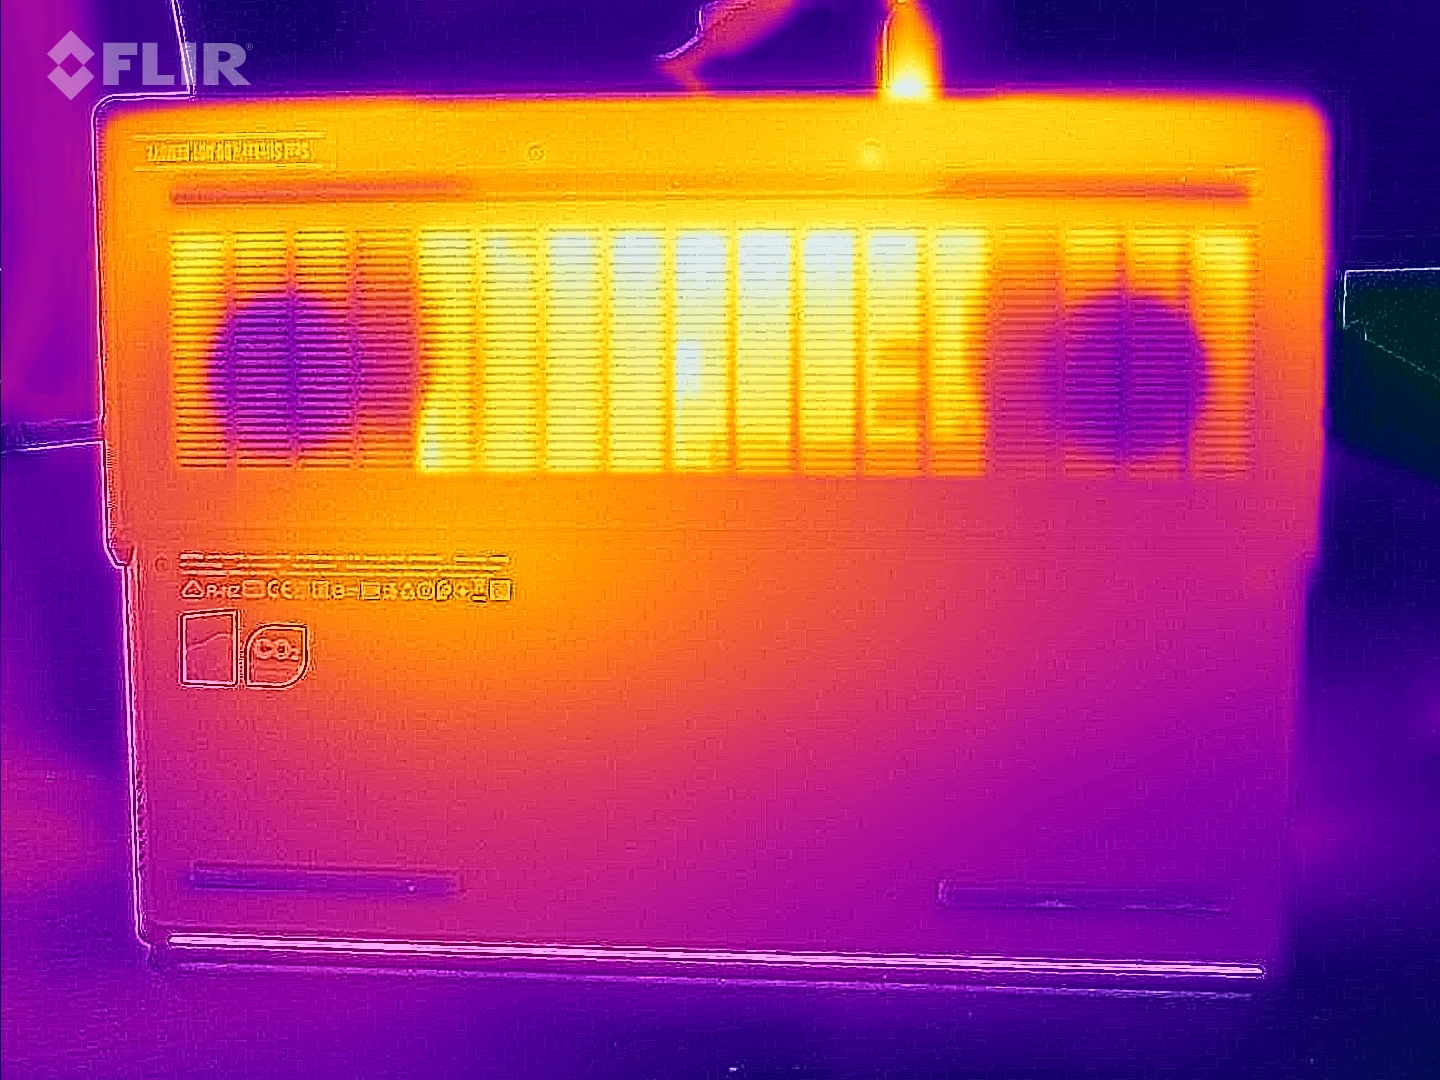
Temperatura
O gabinete fica mais quente do que os concorrentes, com um máximo de 53 °C na parte superior e até 59 °C na parte inferior. A evolução da temperatura permanece dentro dos limites no modo inativo. O apoio para as mãos, por exemplo, atinge cerca de 29 °C - uma taxa moderada.
(-) A temperatura máxima no lado superior é 53 °C / 127 F, em comparação com a média de 40.4 °C / 105 F , variando de 21.2 a 68.8 °C para a classe Gaming.
(-) A parte inferior aquece até um máximo de 59 °C / 138 F, em comparação com a média de 43.2 °C / 110 F
(+) Em uso inativo, a temperatura média para o lado superior é 31 °C / 88 F, em comparação com a média do dispositivo de 33.9 °C / ### class_avg_f### F.
(-) Jogando The Witcher 3, a temperatura média para o lado superior é 45.4 °C / 114 F, em comparação com a média do dispositivo de 33.9 °C / ## #class_avg_f### F.
(-) Os apoios para as mãos e o touchpad podem ficar muito quentes ao toque, com um máximo de 45 °C / 113 F.
(-) A temperatura média da área do apoio para as mãos de dispositivos semelhantes foi 28.8 °C / 83.8 F (-16.2 °C / -29.2 F).
| Lenovo Legion Pro 7 RTX4090 Intel Core i9-13900HX, NVIDIA GeForce RTX 4090 Laptop GPU | Razer Blade 16 Early 2023 RTX 4090 Intel Core i9-13950HX, NVIDIA GeForce RTX 4090 Laptop GPU | Asus ROG Strix Scar 17 G733PY-XS96 AMD Ryzen 9 7945HX, NVIDIA GeForce RTX 4090 Laptop GPU | Schenker XMG Neo 16 E23 Intel Core i9-13900HX, NVIDIA GeForce RTX 4090 Laptop GPU | MSI Titan GT77 HX 13VI Intel Core i9-13950HX, NVIDIA GeForce RTX 4090 Laptop GPU | Lenovo Legion Pro 7 16IRX8H Intel Core i9-13900HX, NVIDIA GeForce RTX 4080 Laptop GPU | |
|---|---|---|---|---|---|---|
| Heat | 7% | 25% | 14% | 20% | 1% | |
| Maximum Upper Side * (°C) | 53 | 52 2% | 34.6 35% | 50 6% | 40.6 23% | 48 9% |
| Maximum Bottom * (°C) | 59 | 47.6 19% | 35.6 40% | 51 14% | 41.1 30% | 49 17% |
| Idle Upper Side * (°C) | 34 | 33 3% | 27.2 20% | 28 18% | 26.2 23% | 40 -18% |
| Idle Bottom * (°C) | 32 | 30.6 4% | 30 6% | 26 19% | 30.3 5% | 33 -3% |
* ... menor é melhor
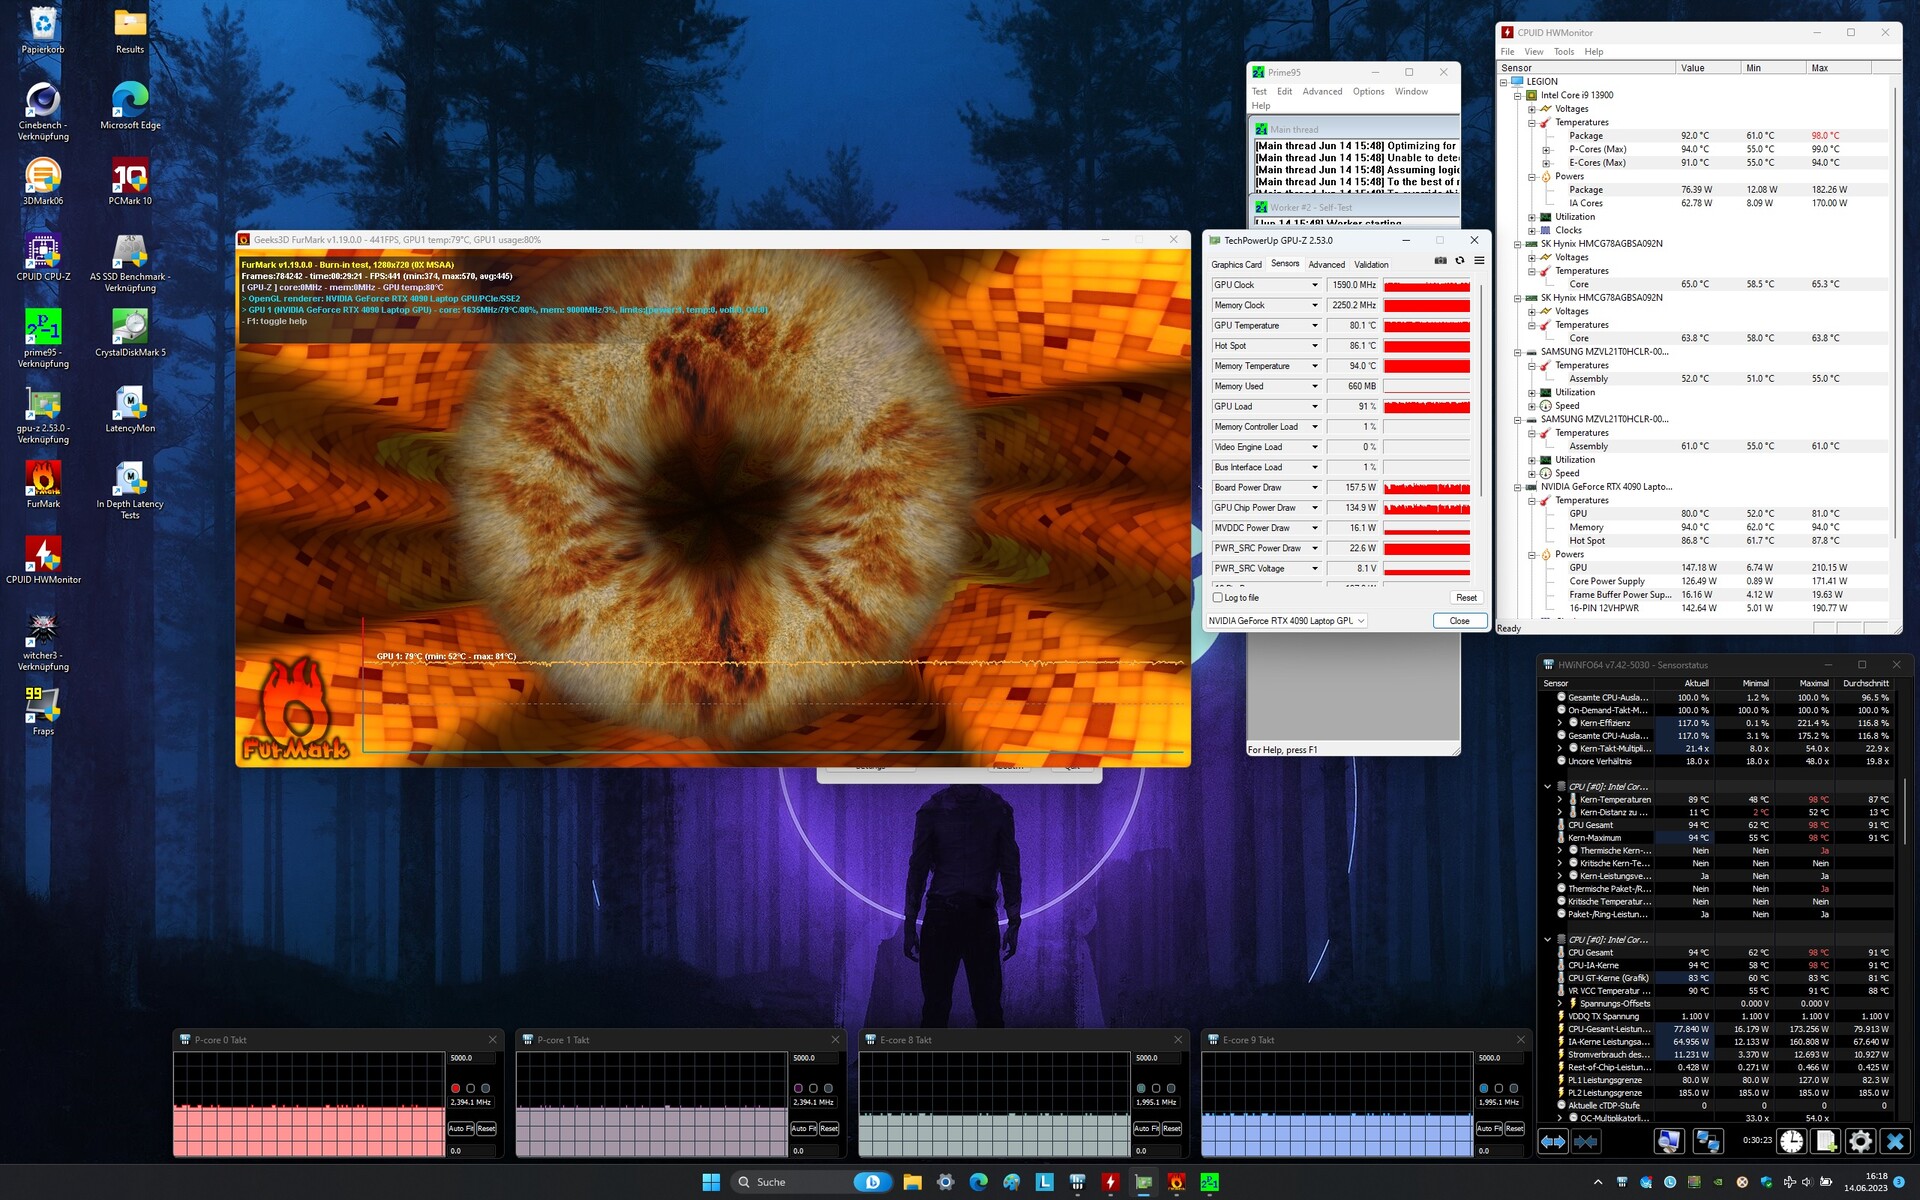
Teste de estresse
Não houve problemas no teste de estresse com as ferramentas FurMark e Prime95. Embora a CPU tenha ficado relativamente quente, com mais de 90 °C, ela não se acelerou abaixo do clock base. A GPU (~80 °C) teve um comportamento semelhante.
Alto-falante
Lenovo Legion Pro 7 RTX4090 análise de áudio
(+) | os alto-falantes podem tocar relativamente alto (###valor### dB)
Graves 100 - 315Hz
(±) | graves reduzidos - em média 5.6% menor que a mediana
(+) | o baixo é linear (6.8% delta para a frequência anterior)
Médios 400 - 2.000 Hz
(+) | médios equilibrados - apenas 4.8% longe da mediana
(+) | médios são lineares (5.1% delta para frequência anterior)
Altos 2 - 16 kHz
(+) | agudos equilibrados - apenas 1.7% longe da mediana
(+) | os máximos são lineares (4% delta da frequência anterior)
Geral 100 - 16.000 Hz
(+) | o som geral é linear (8.7% diferença em relação à mediana)
Comparado com a mesma classe
» 3% de todos os dispositivos testados nesta classe foram melhores, 1% semelhantes, 97% piores
» O melhor teve um delta de 6%, a média foi 18%, o pior foi 132%
Comparado com todos os dispositivos testados
» 3% de todos os dispositivos testados foram melhores, 1% semelhantes, 97% piores
» O melhor teve um delta de 4%, a média foi 23%, o pior foi 134%
Razer Blade 16 Early 2023 RTX 4090 análise de áudio
(±) | o volume do alto-falante é médio, mas bom (###valor### dB)
Graves 100 - 315Hz
(±) | graves reduzidos - em média 13.4% menor que a mediana
(±) | a linearidade dos graves é média (14.8% delta para a frequência anterior)
Médios 400 - 2.000 Hz
(±) | médios mais altos - em média 5.3% maior que a mediana
(+) | médios são lineares (3.8% delta para frequência anterior)
Altos 2 - 16 kHz
(+) | agudos equilibrados - apenas 3.4% longe da mediana
(+) | os máximos são lineares (4.2% delta da frequência anterior)
Geral 100 - 16.000 Hz
(±) | a linearidade do som geral é média (15.6% diferença em relação à mediana)
Comparado com a mesma classe
» 36% de todos os dispositivos testados nesta classe foram melhores, 6% semelhantes, 58% piores
» O melhor teve um delta de 6%, a média foi 18%, o pior foi 132%
Comparado com todos os dispositivos testados
» 23% de todos os dispositivos testados foram melhores, 5% semelhantes, 72% piores
» O melhor teve um delta de 4%, a média foi 23%, o pior foi 134%
Gerenciamento de energia
Consumo de energia
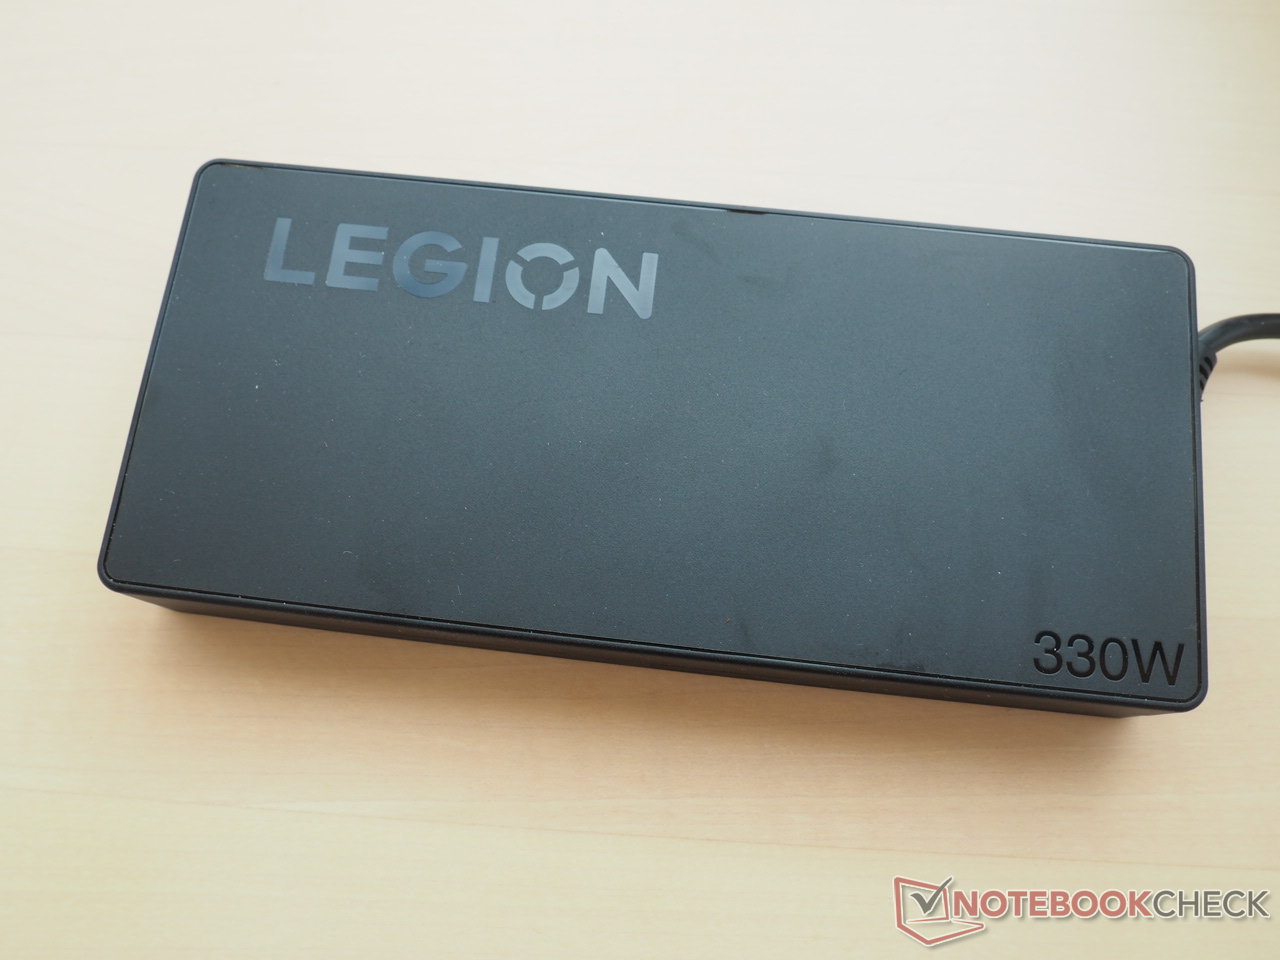
Embora alguns rivais consumam menos, o consumo de energia é típico de um dispositivo RTX 4090. Embora tenhamos medido de 20 a 35 watts no modo inativo, o consumo ficou entre 136 e 320 watts sob carga. Portanto, a fonte de alimentação de 330 watts incluída é de tamanho suficiente.
| desligado | |
| Ocioso | |
| Carga |
|
Key:
min: | |
| Lenovo Legion Pro 7 RTX4090 i9-13900HX, GeForce RTX 4090 Laptop GPU | Razer Blade 16 Early 2023 RTX 4090 i9-13950HX, GeForce RTX 4090 Laptop GPU | Asus ROG Strix Scar 17 G733PY-XS96 R9 7945HX, GeForce RTX 4090 Laptop GPU | Schenker XMG Neo 16 E23 i9-13900HX, GeForce RTX 4090 Laptop GPU | MSI Titan GT77 HX 13VI i9-13950HX, GeForce RTX 4090 Laptop GPU | Lenovo Legion Pro 7 16IRX8H i9-13900HX, GeForce RTX 4080 Laptop GPU | Média da turma Gaming | |
|---|---|---|---|---|---|---|---|
| Power Consumption | -11% | 8% | 14% | 10% | 6% | 25% | |
| Idle Minimum * (Watt) | 20 | 27.5 -38% | 14.5 27% | 8 60% | 14 30% | 18 10% | 13 ? 35% |
| Idle Average * (Watt) | 25 | 34.4 -38% | 21.1 16% | 18 28% | 21.6 14% | 24 4% | 19 ? 24% |
| Idle Maximum * (Watt) | 35 | 35.4 -1% | 42.8 -22% | 28 20% | 24.8 29% | 32 9% | 24.6 ? 30% |
| Load Average * (Watt) | 136 | 147.8 -9% | 116.7 14% | 133 2% | 122.5 10% | 130 4% | 110.7 ? 19% |
| Witcher 3 ultra * (Watt) | 282 | 256 9% | 278 1% | 294 -4% | 265 6% | 260 8% | |
| Load Maximum * (Watt) | 320 | 286.7 10% | 279.6 13% | 399 -25% | 418 -31% | 320 -0% | 259 ? 19% |
* ... menor é melhor
Power consumption Witcher 3 / Stresstest
Power consumption external monitor
Duração da bateria
A duração da bateria do Legion Pro 7 não é nem ruim nem particularmente boa. O dispositivo de 16 polegadas conseguiu realizar nosso teste prático de WLAN com brilho de tela reduzido para 150 cd/m² por cerca de 5 horas.
| Lenovo Legion Pro 7 RTX4090 i9-13900HX, GeForce RTX 4090 Laptop GPU, 99.9 Wh | Razer Blade 16 Early 2023 RTX 4090 i9-13950HX, GeForce RTX 4090 Laptop GPU, 95.2 Wh | Asus ROG Strix Scar 17 G733PY-XS96 R9 7945HX, GeForce RTX 4090 Laptop GPU, 90 Wh | Schenker XMG Neo 16 E23 i9-13900HX, GeForce RTX 4090 Laptop GPU, 99 Wh | MSI Titan GT77 HX 13VI i9-13950HX, GeForce RTX 4090 Laptop GPU, 99.9 Wh | Lenovo Legion Pro 7 16IRX8H i9-13900HX, GeForce RTX 4080 Laptop GPU, 99.9 Wh | Média da turma Gaming | |
|---|---|---|---|---|---|---|---|
| Duração da bateria | 14% | -20% | 31% | 4% | 0% | 39% | |
| WiFi v1.3 (h) | 5.1 | 5.8 14% | 4.1 -20% | 6.7 31% | 5.3 4% | 5.1 0% | 7.11 ? 39% |
| H.264 (h) | 8.4 | 5.8 | 6 | 8.32 ? | |||
| Witcher 3 ultra (h) | 1.6 | 1.4 | |||||
| Load (h) | 1.4 | 1.4 | 2.1 | 1.502 ? | |||
| Reader / Idle (h) | 6.4 | 8.27 ? |
Pro
Contra
Veredicto
Aqueles que puderem aceitar o preço exorbitante de pelo menos 4.500 euros encontrarão no Legion Pro 7 um gamer high-end quase totalmente bem-sucedido no formato de 16 polegadas.
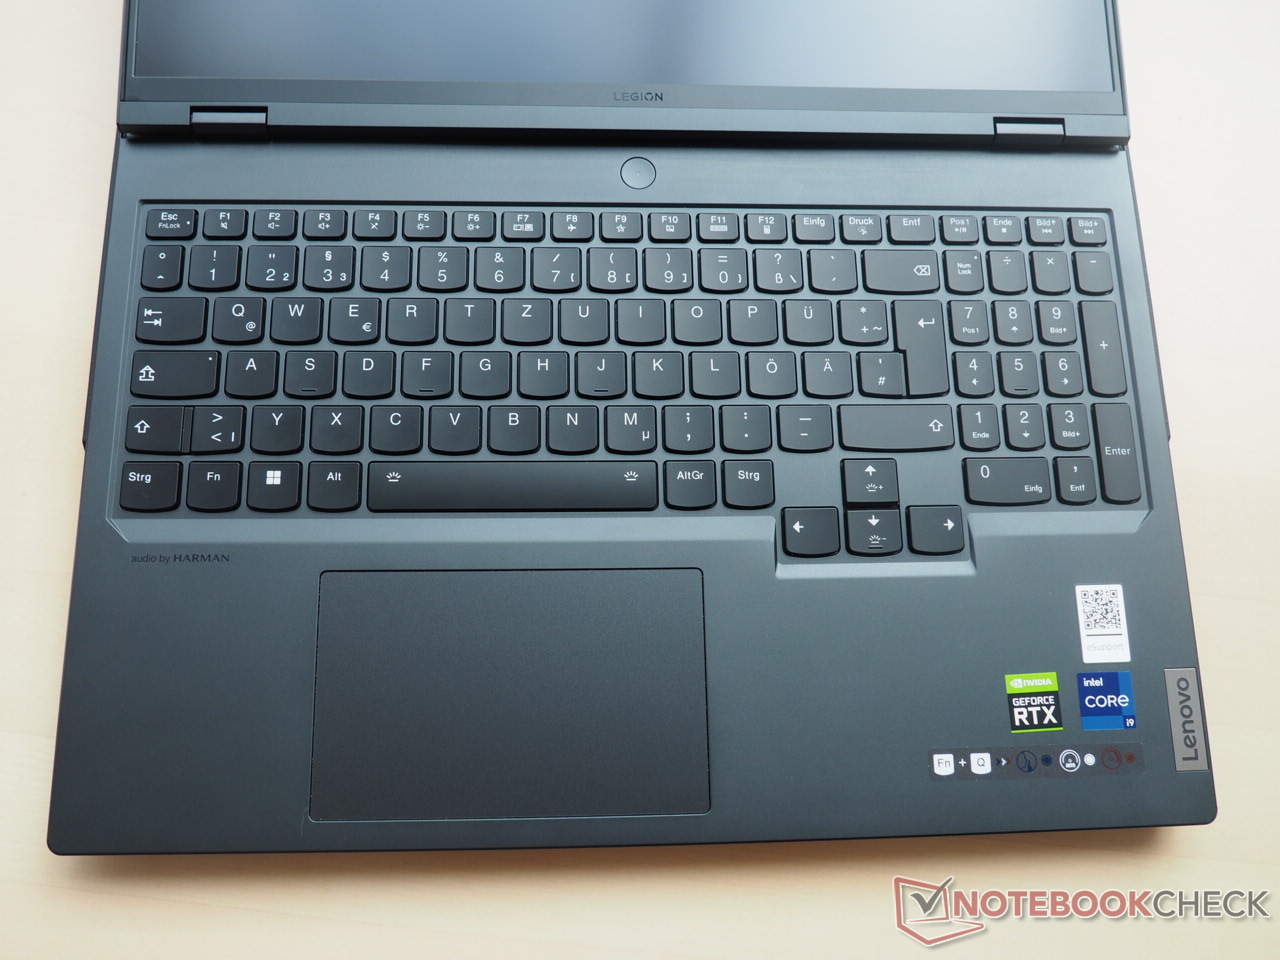
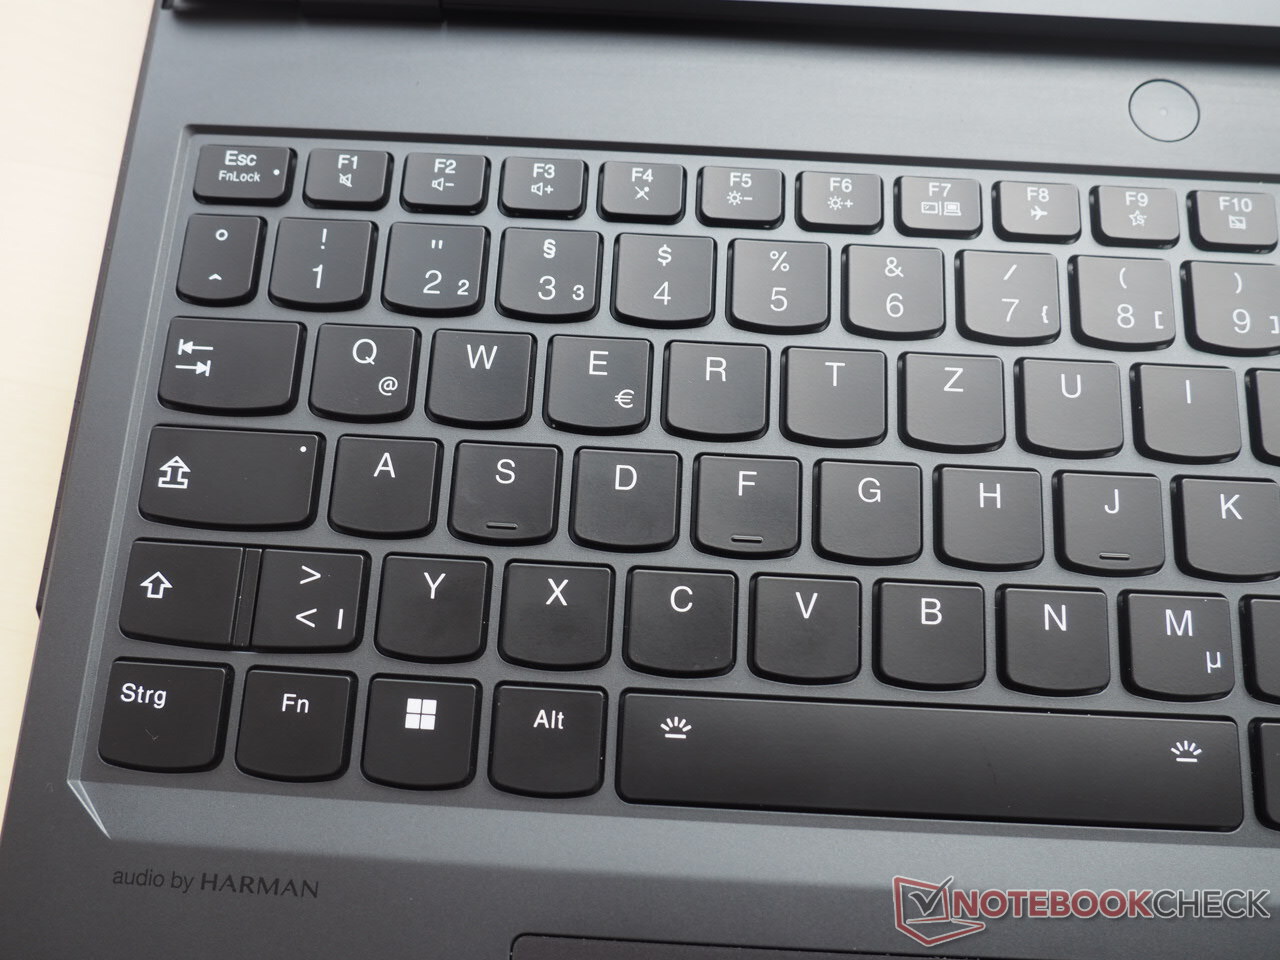
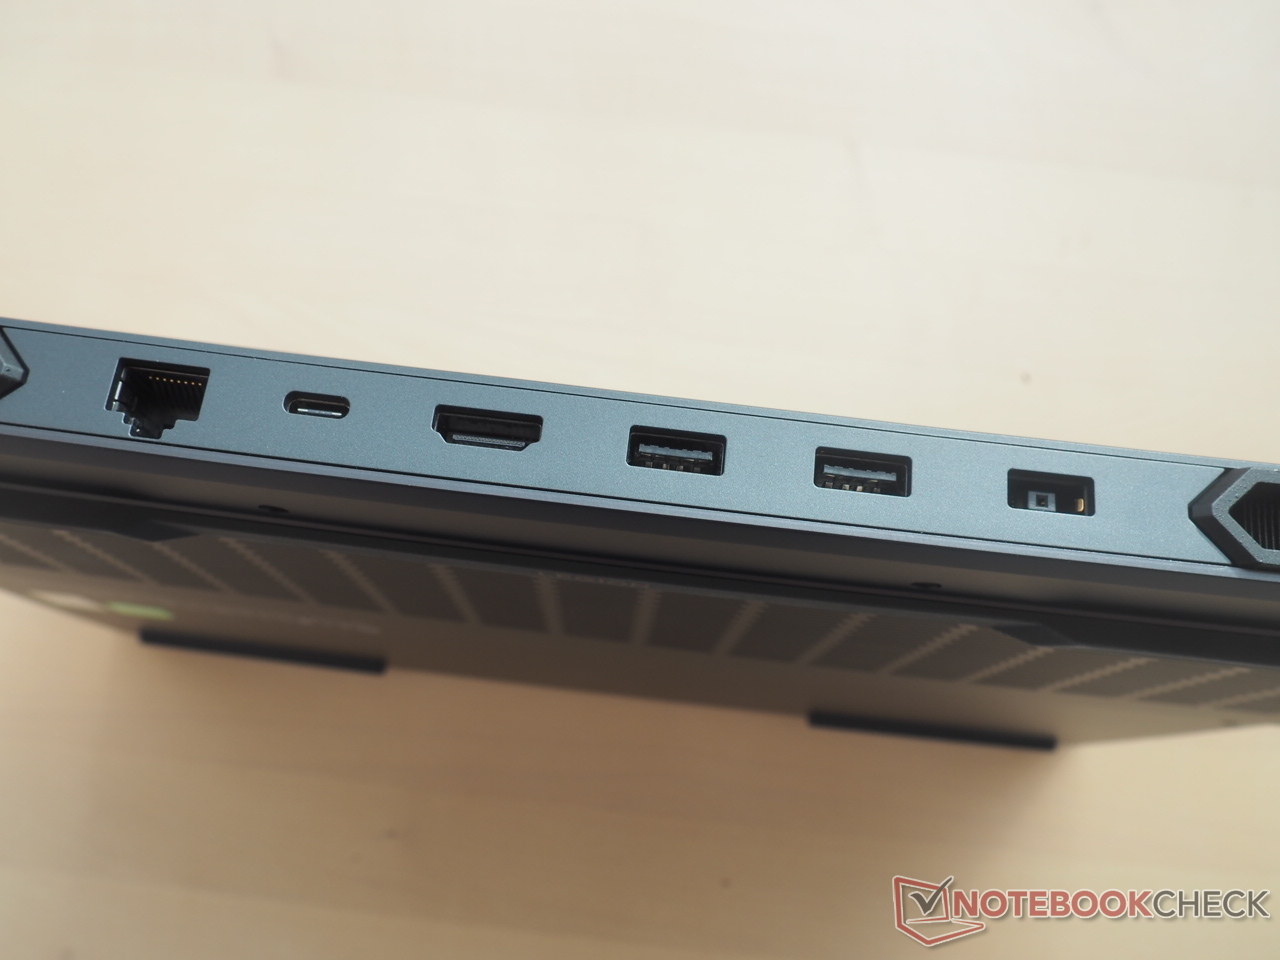
A Lenovo não se baseia apenas em um chassi estável e de alta qualidade, mas também em bons dispositivos de entrada. A conectividade (incluindo Thunderbolt 4) e a tela WQXGA também satisfarão a maioria dos compradores. A tela 16:10 (240 Hz) oferece, entre outras coisas, bom brilho, precisão de cores convincente e tempos de resposta curtos para os padrões IPS.
Do lado negativo, teríamos - como infelizmente é comum para notebooks de ponta - uma temperatura muito alta e desenvolvimento de ruído sob carga. Sem um fone de ouvido, o modo de desempenho não é agradável. Recomendamos usar o modo Silencioso ou Equilibrado aqui.
No geral, o Legion Pro 7 com RTX 4090 - como o modelo RTX 4080 - ainda recebe uma classificação muito boa e, portanto, pertence aos melhores notebooks de ponta do mercado.
Se você quiser um notebook mais silencioso e/ou mais leve, dê uma olhada no Blade 16. O concorrente da Razer obteve uma pontuação um pouco melhor no teste.
Preço e disponibilidade
Lenovo Legion Pro 7 RTX4090
- 06/16/2023 v7 (old)
Florian Glaser
Transparência
A seleção dos dispositivos a serem analisados é feita pela nossa equipe editorial. A amostra de teste foi fornecida ao autor como empréstimo pelo fabricante ou varejista para fins desta revisão. O credor não teve influência nesta revisão, nem o fabricante recebeu uma cópia desta revisão antes da publicação. Não houve obrigação de publicar esta revisão. Como empresa de mídia independente, a Notebookcheck não está sujeita à autoridade de fabricantes, varejistas ou editores.
É assim que o Notebookcheck está testando
Todos os anos, o Notebookcheck analisa de forma independente centenas de laptops e smartphones usando procedimentos padronizados para garantir que todos os resultados sejam comparáveis. Desenvolvemos continuamente nossos métodos de teste há cerca de 20 anos e definimos padrões da indústria no processo. Em nossos laboratórios de teste, equipamentos de medição de alta qualidade são utilizados por técnicos e editores experientes. Esses testes envolvem um processo de validação em vários estágios. Nosso complexo sistema de classificação é baseado em centenas de medições e benchmarks bem fundamentados, o que mantém a objetividade.Price comparison
