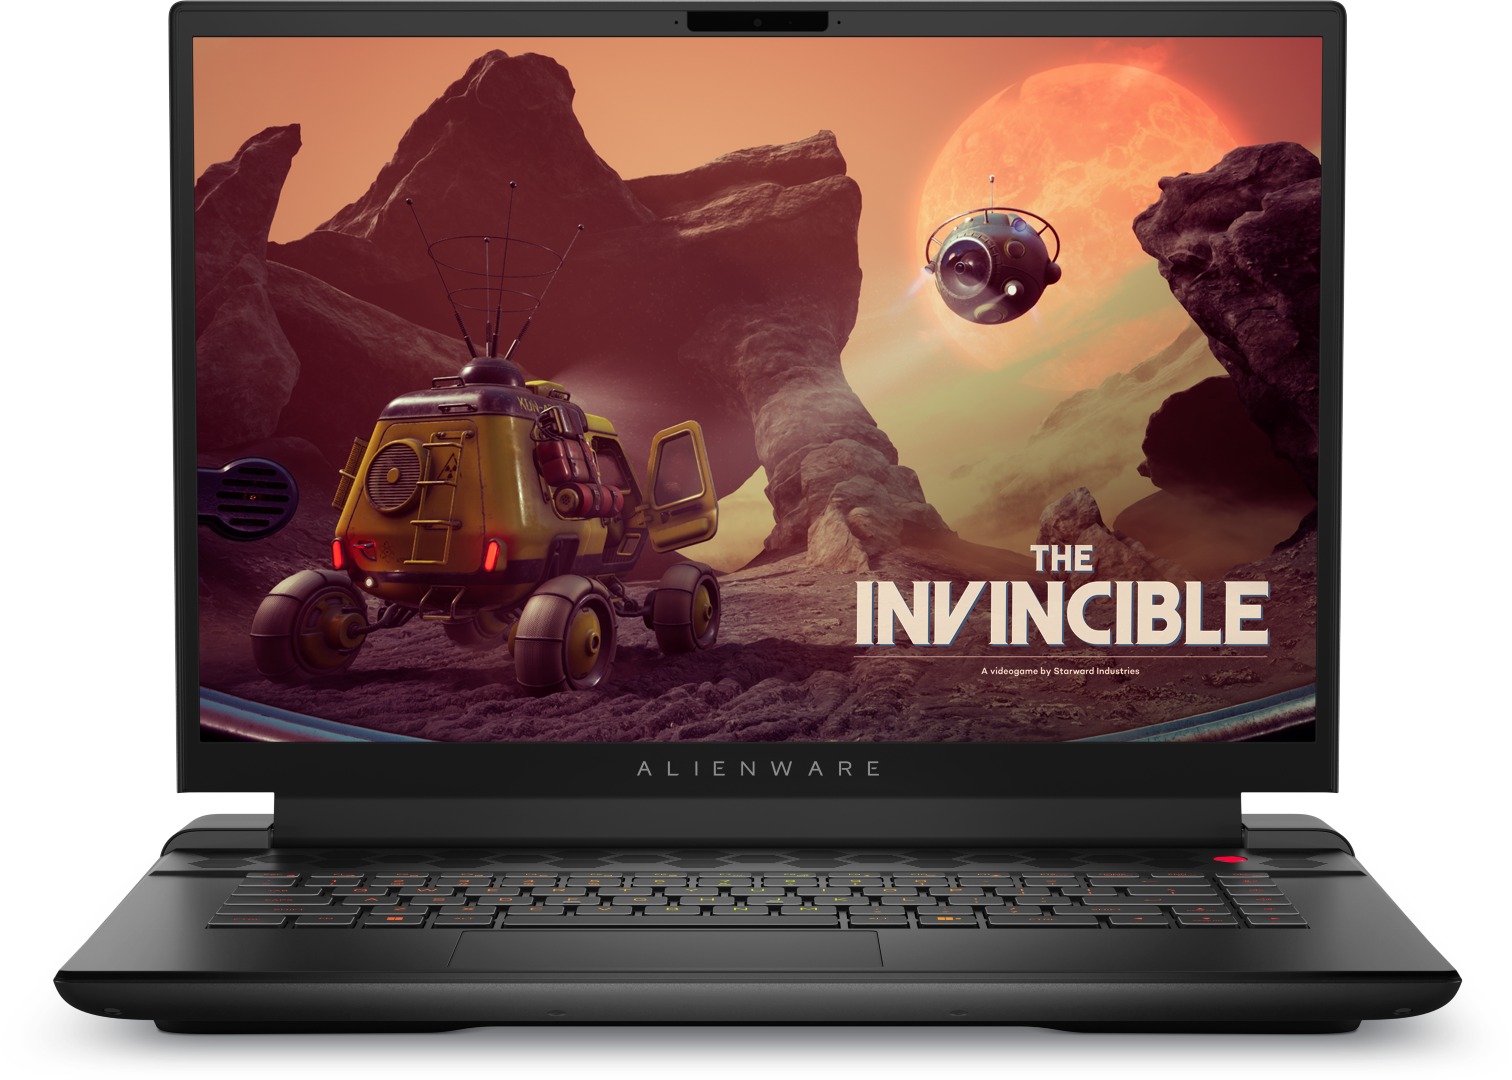
Estreia do desempenho do AMD Ryzen 9 7845HX: Análise do laptop Alienware m16 R1

Depois de lançar o Alienware m15 de 15,6 polegadas Alienware m15de 15,6 polegadas, e de 17 polegadas Alienware m17de 17 polegadas, e de 18 polegadas Alienware m18em um momento em que o Alienware m15, o Alienware m17 de 17 polegadas e o Alienware m18 de 18 polegadas estão sendo lançados, a Dell está pronta para enviar o Alienware m16 de 16 polegadas completo com as mais novas GPUs Nvidia Ada Lovelace e a opção de processadores Intel Raptor Lake de 13ª geração ou AMD Zen 4. O Alienware m16 é diferente do recente Alienware x16 que é um modelo ainda mais fino com especificações e recursos diferentes.
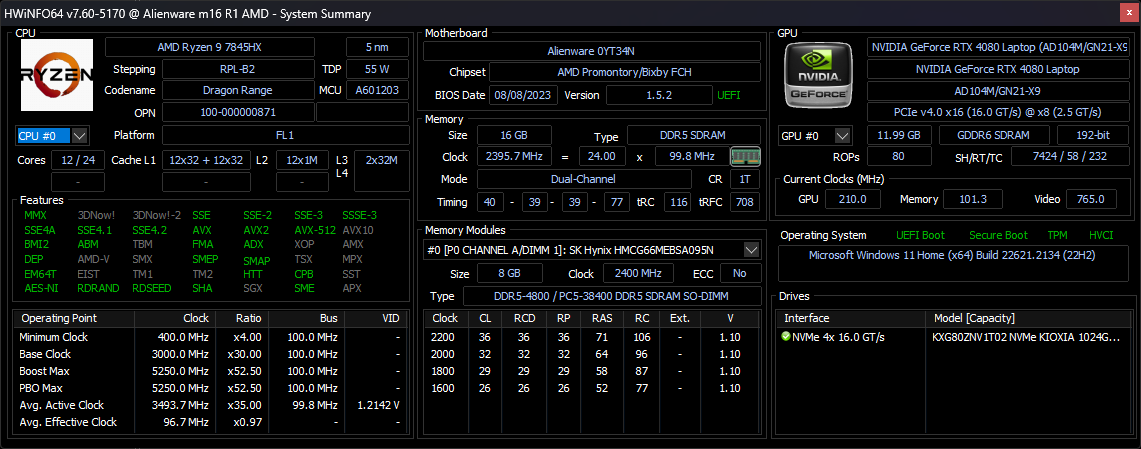
Nossa unidade de análise é uma configuração AMD de médio porte com o Ryzen 9 7845HX, GPU GeForce RTX 4080 de 175 W e tela IPS de 1600p240 por aproximadamente US$ 2350. As SKUs menores vêm equipadas com a CPU Ryzen 7 7745HX e a GPU Radeon RX 7600M por US$ 2150, enquanto as mais caras com o Ryzen 9 7945HX e a RTX 4090 podem ser vendidas por mais de US$ 3100, dependendo das preferências de RAM e SSD. Enquanto isso, as versões Intel vêm com as mesmas opções de tela e GPU Nvidia, mas com o Core i7-13700HX ou i9-13900HX.
Os concorrentes incluem outros notebooks para jogos de 16 polegadas, como o HP Omen 16, Lenovo Legion Pro 7 16, Asus ROG Strix G16ou o Razer Blade 16.
Mais análises da Dell:
Possíveis concorrentes em comparação
Avaliação | Data | Modelo | Peso | Altura | Size | Resolução | Preço |
|---|---|---|---|---|---|---|---|
| 89.2 % v7 (old) | 08/2023 | Alienware m16 R1 AMD R9 7845HX, GeForce RTX 4080 Laptop GPU | 3.1 kg | 25.4 mm | 16.00" | 2560x1600 | |
| 88.4 % v7 (old) | 06/2023 | Alienware x16 R1 i9-13900HK, GeForce RTX 4080 Laptop GPU | 2.6 kg | 18.57 mm | 16.00" | 2560x1600 | |
| 87.9 % v7 (old) | 08/2023 | HP Omen Transcend 16 i9-13900HX, GeForce RTX 4070 Laptop GPU | 2.3 kg | 19.8 mm | 16.00" | 2560x1600 | |
| 88.8 % v7 (old) | 06/2023 | Lenovo Legion Pro 7 RTX4090 i9-13900HX, GeForce RTX 4090 Laptop GPU | 2.7 kg | 26 mm | 16.00" | 2560x1600 | |
| 88.4 % v7 (old) | 03/2023 | Asus ROG Strix G16 G614JZ i9-13980HX, GeForce RTX 4080 Laptop GPU | 2.4 kg | 30.4 mm | 16.00" | 2560x1600 | |
| 91.2 % v7 (old) | 02/2023 | Razer Blade 16 Early 2023 i9-13950HX, GeForce RTX 4080 Laptop GPU | 2.4 kg | 21.99 mm | 16.00" | 2560x1600 |
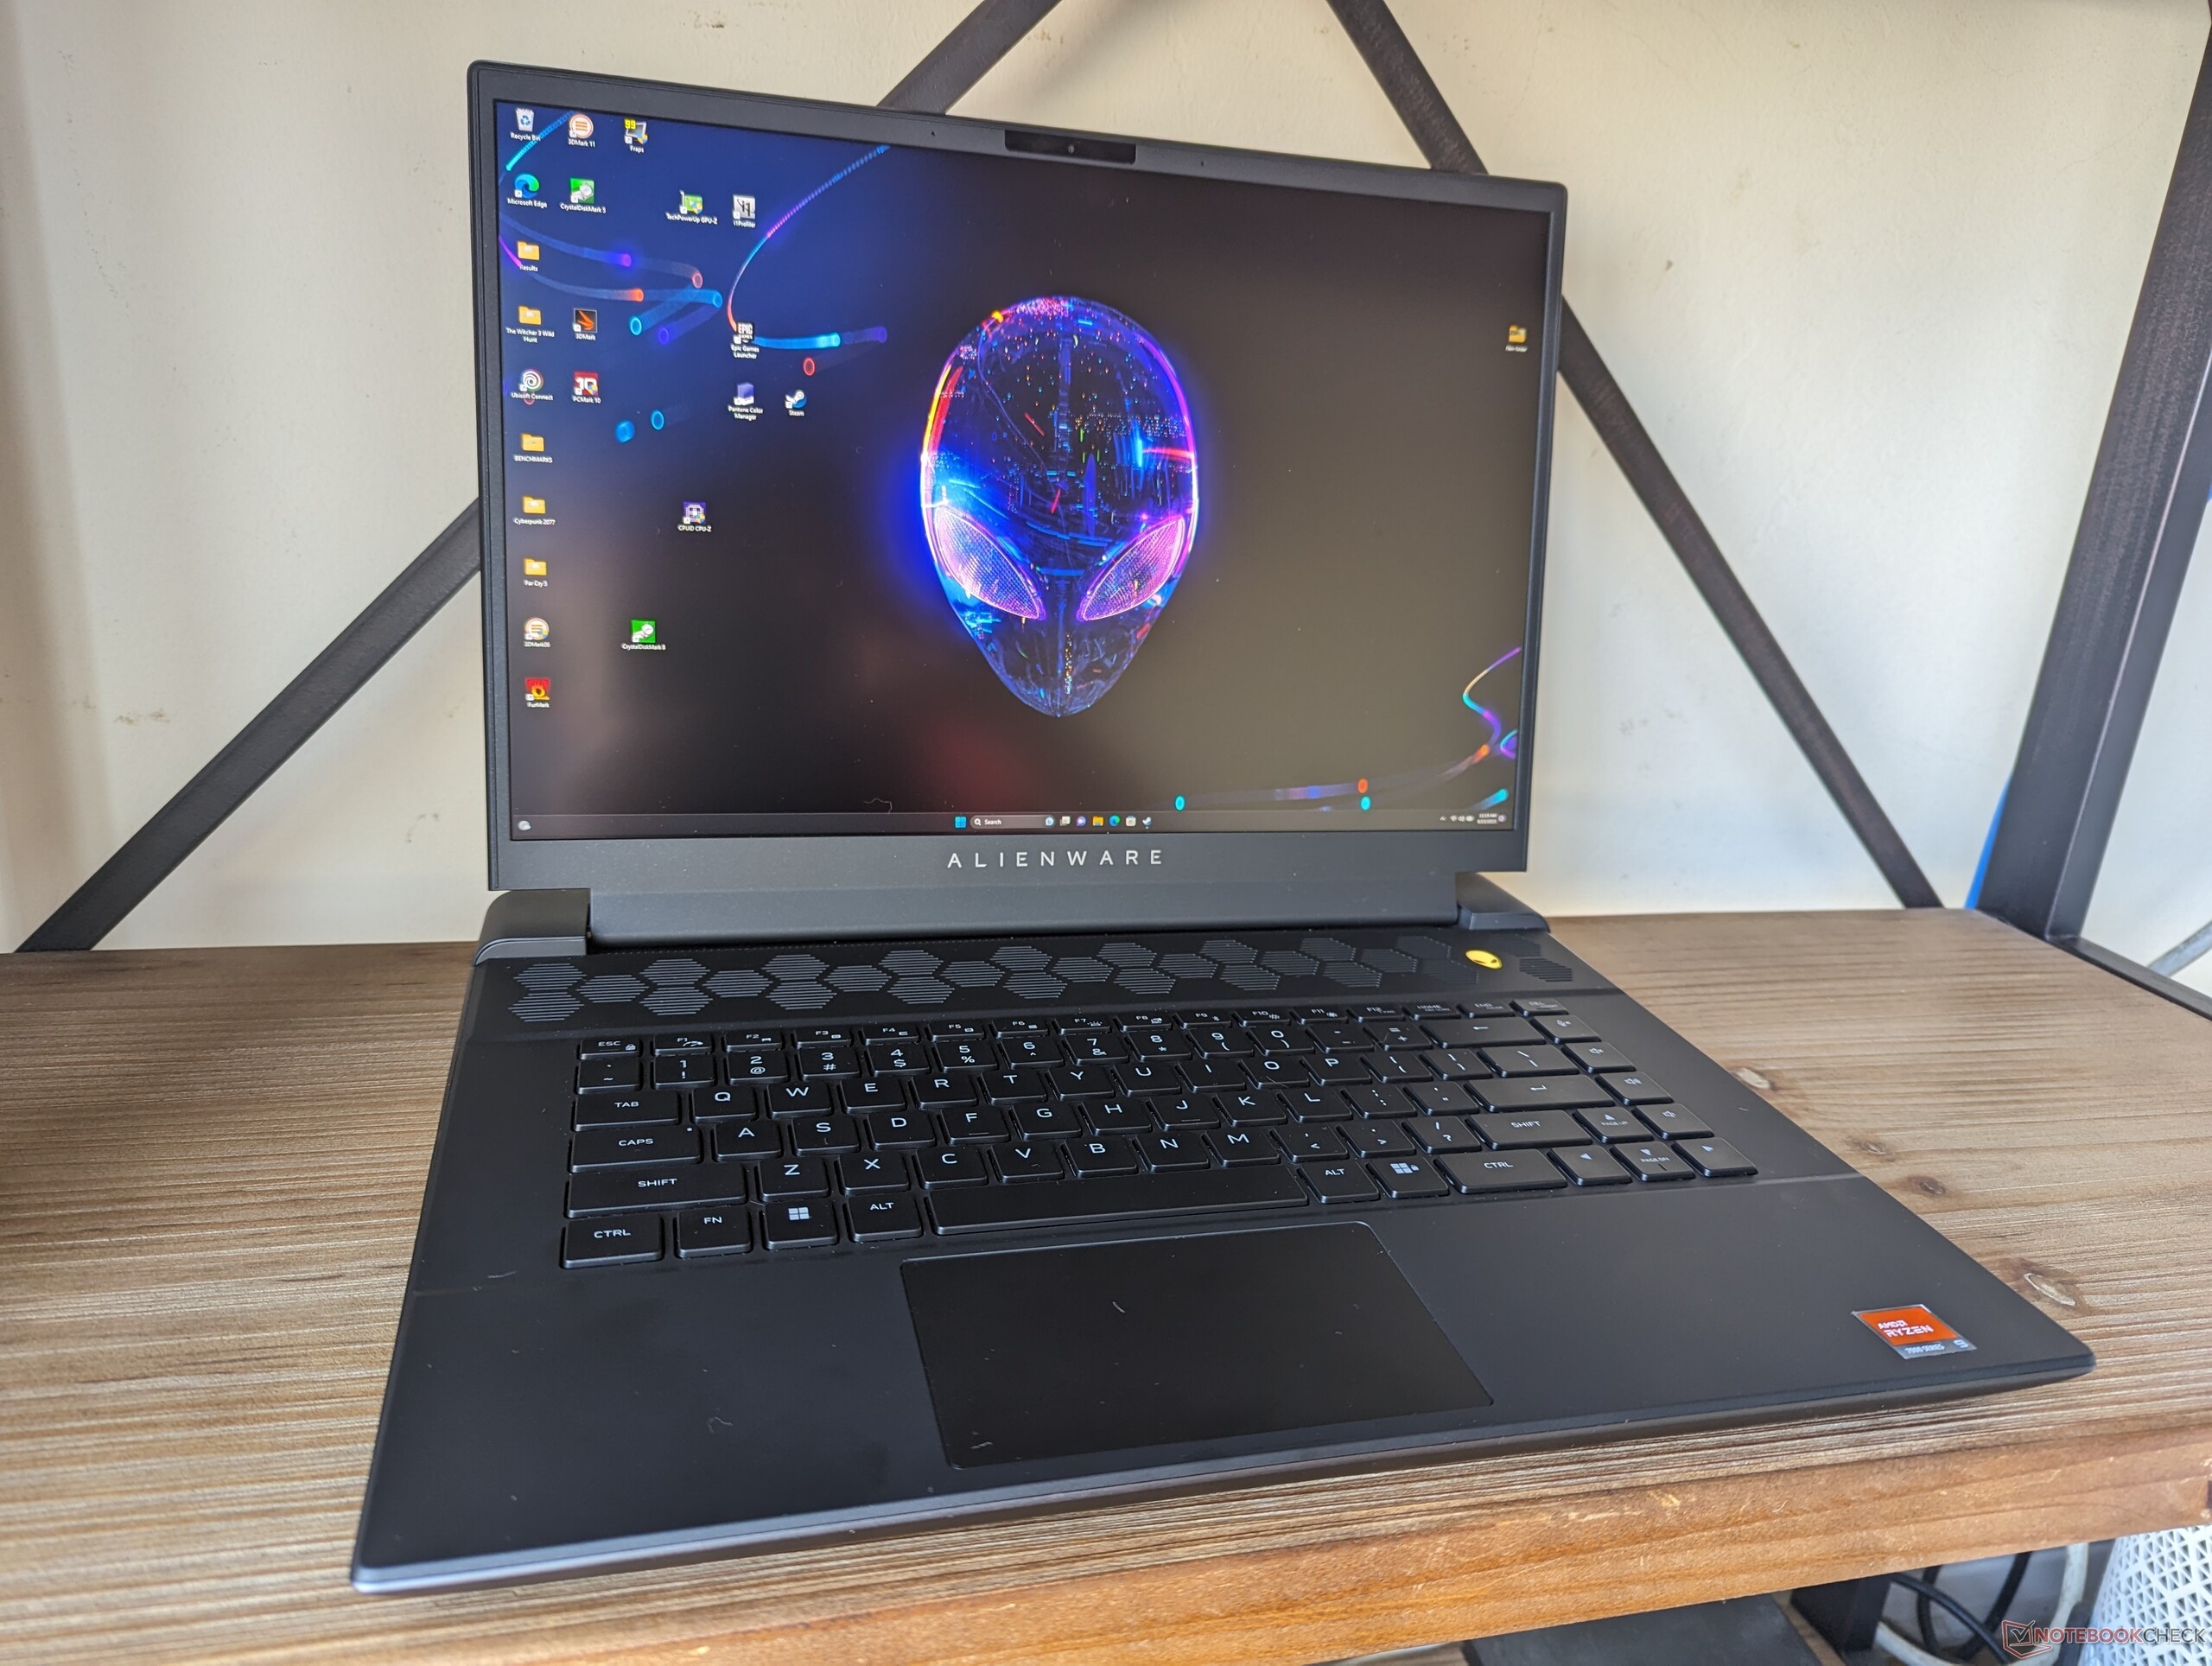
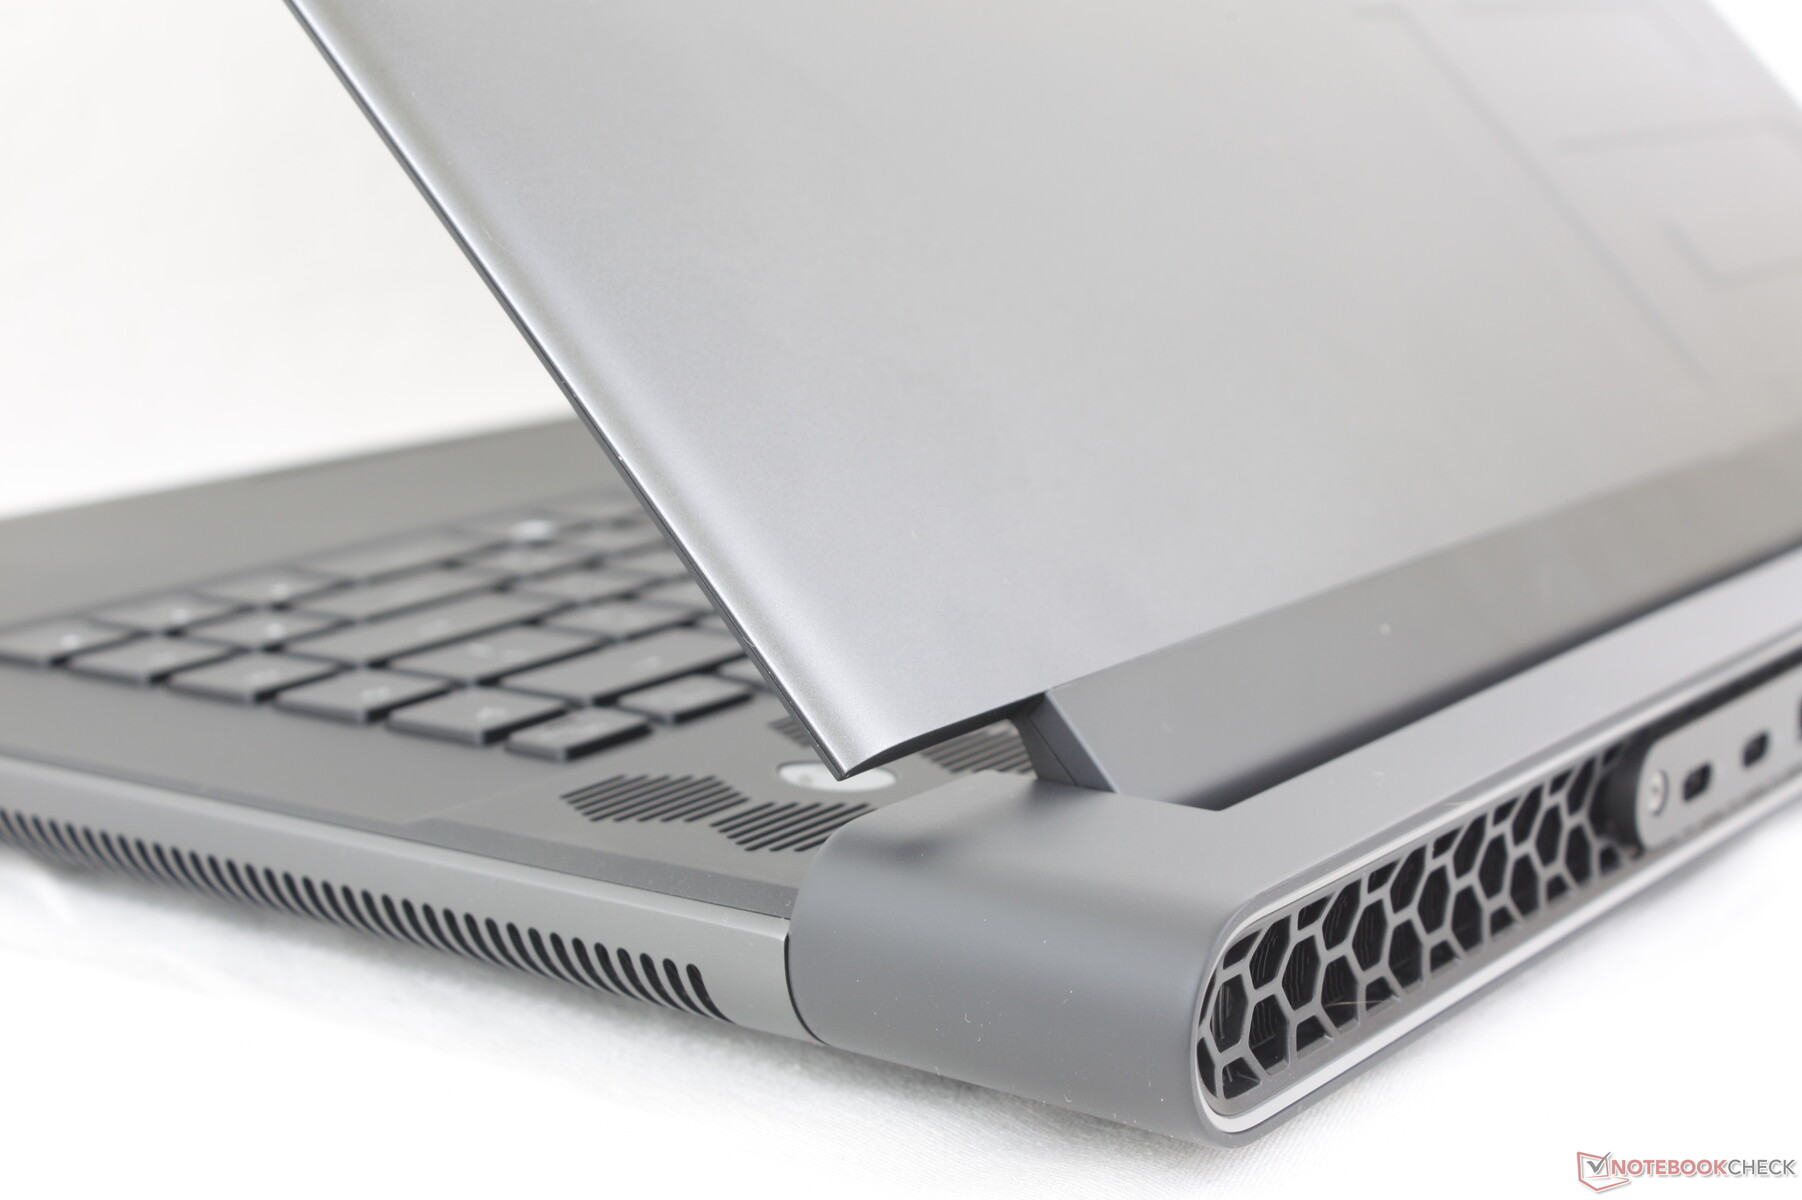
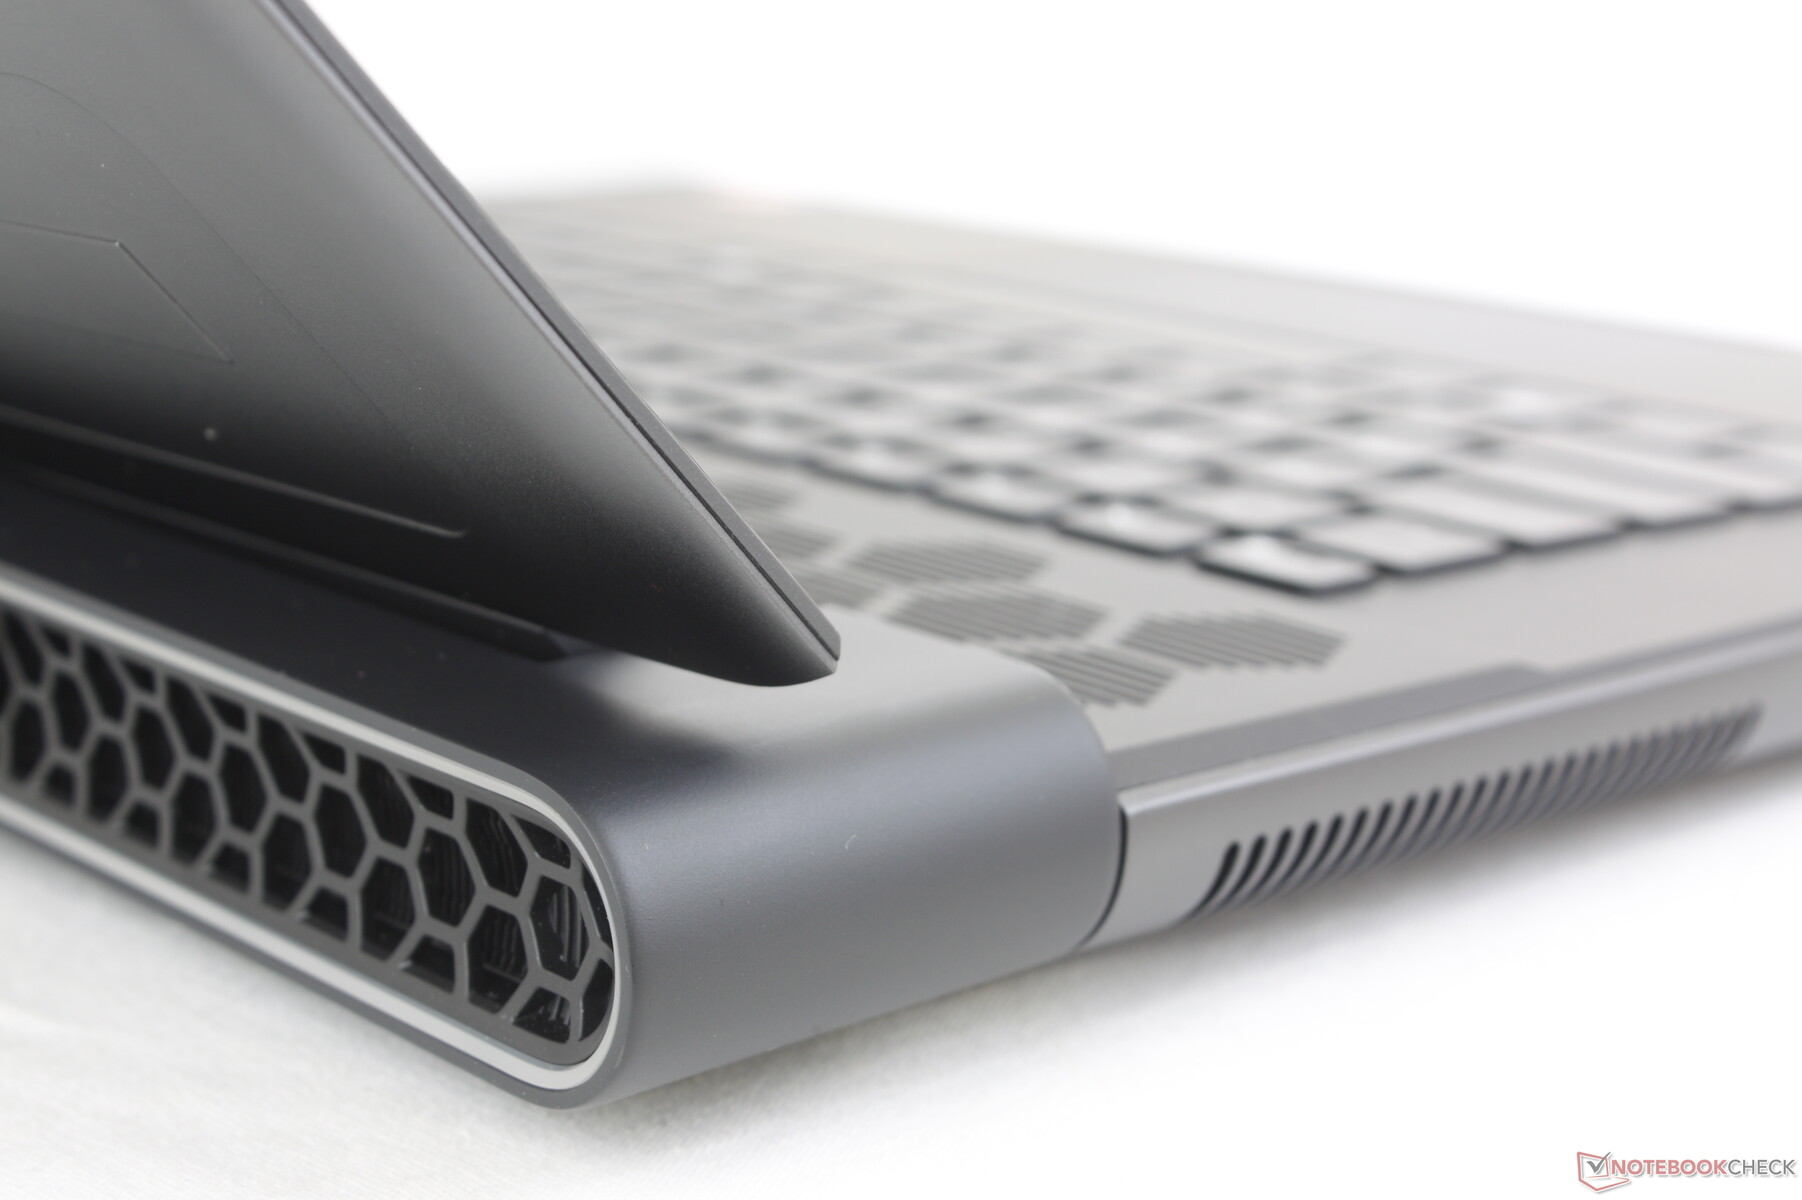
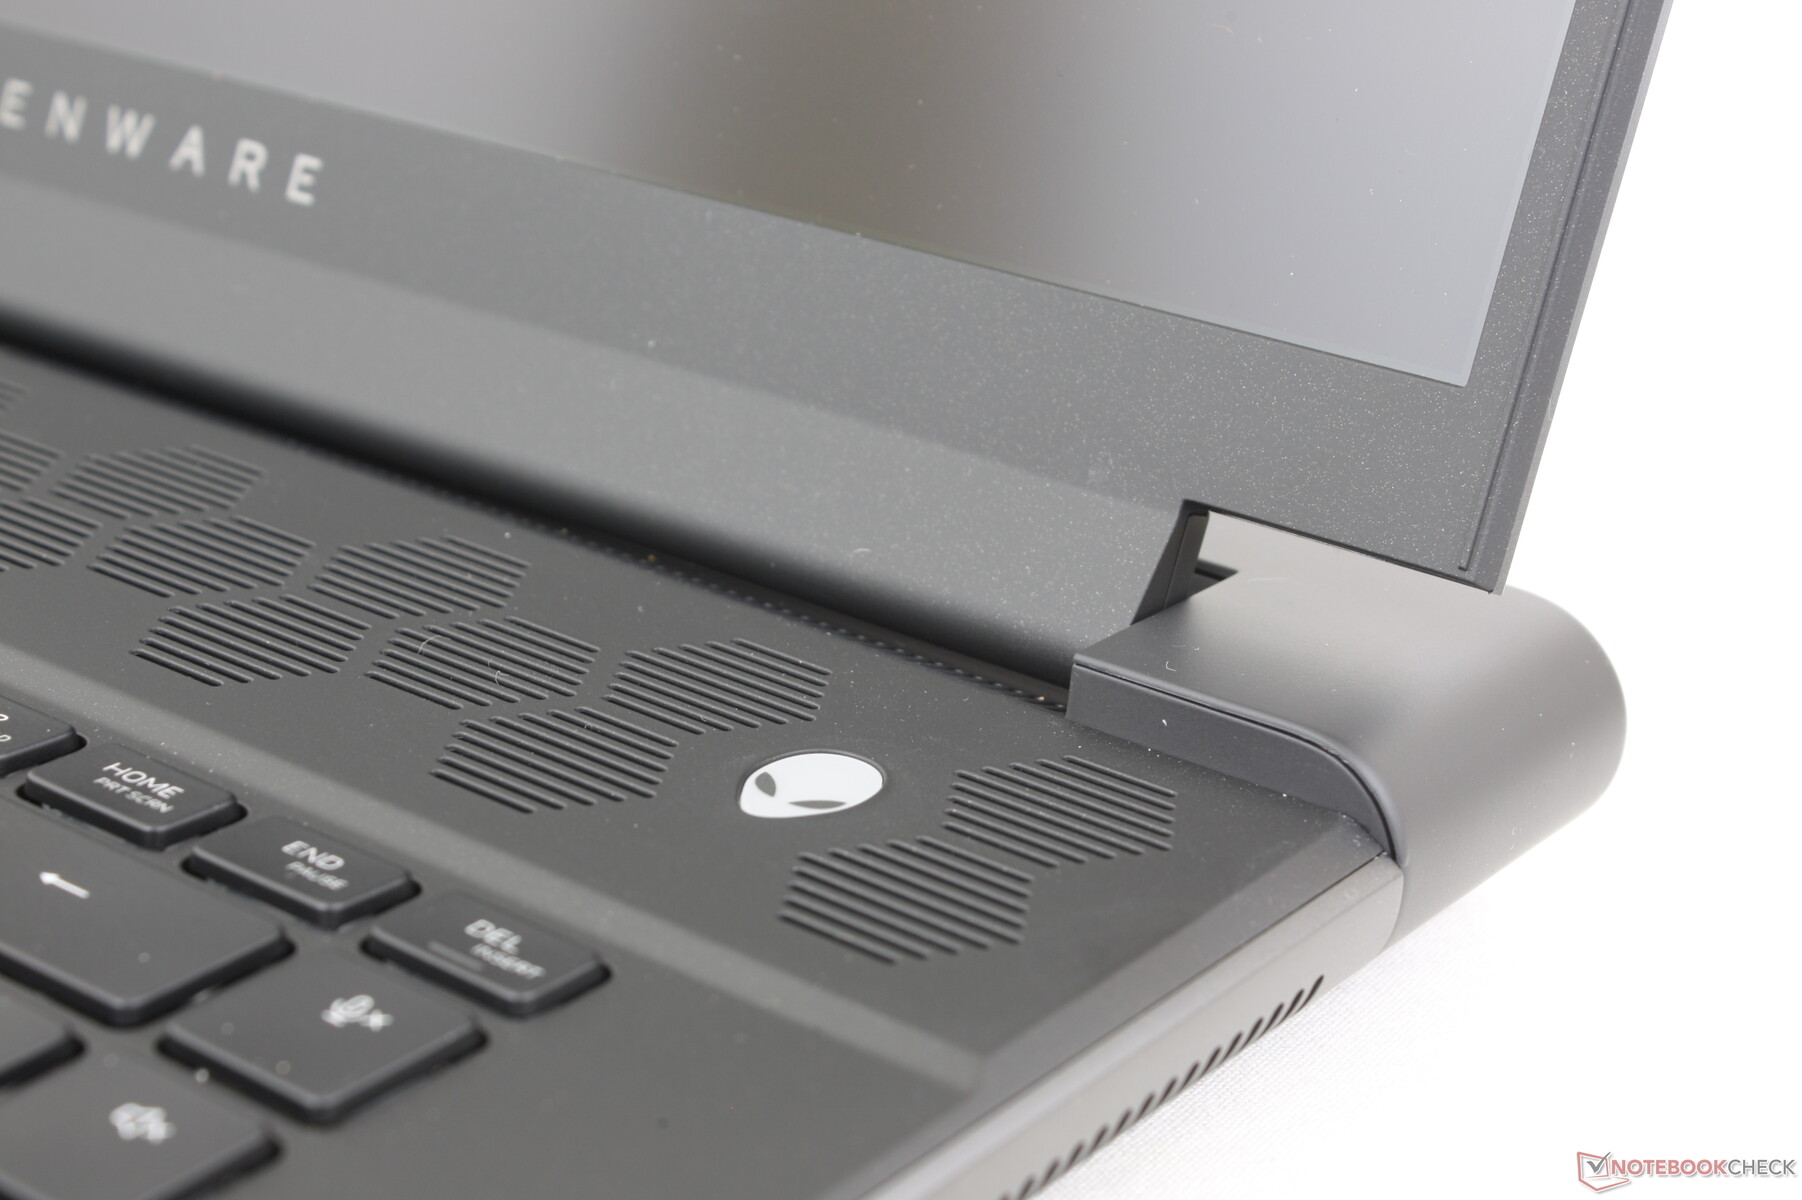
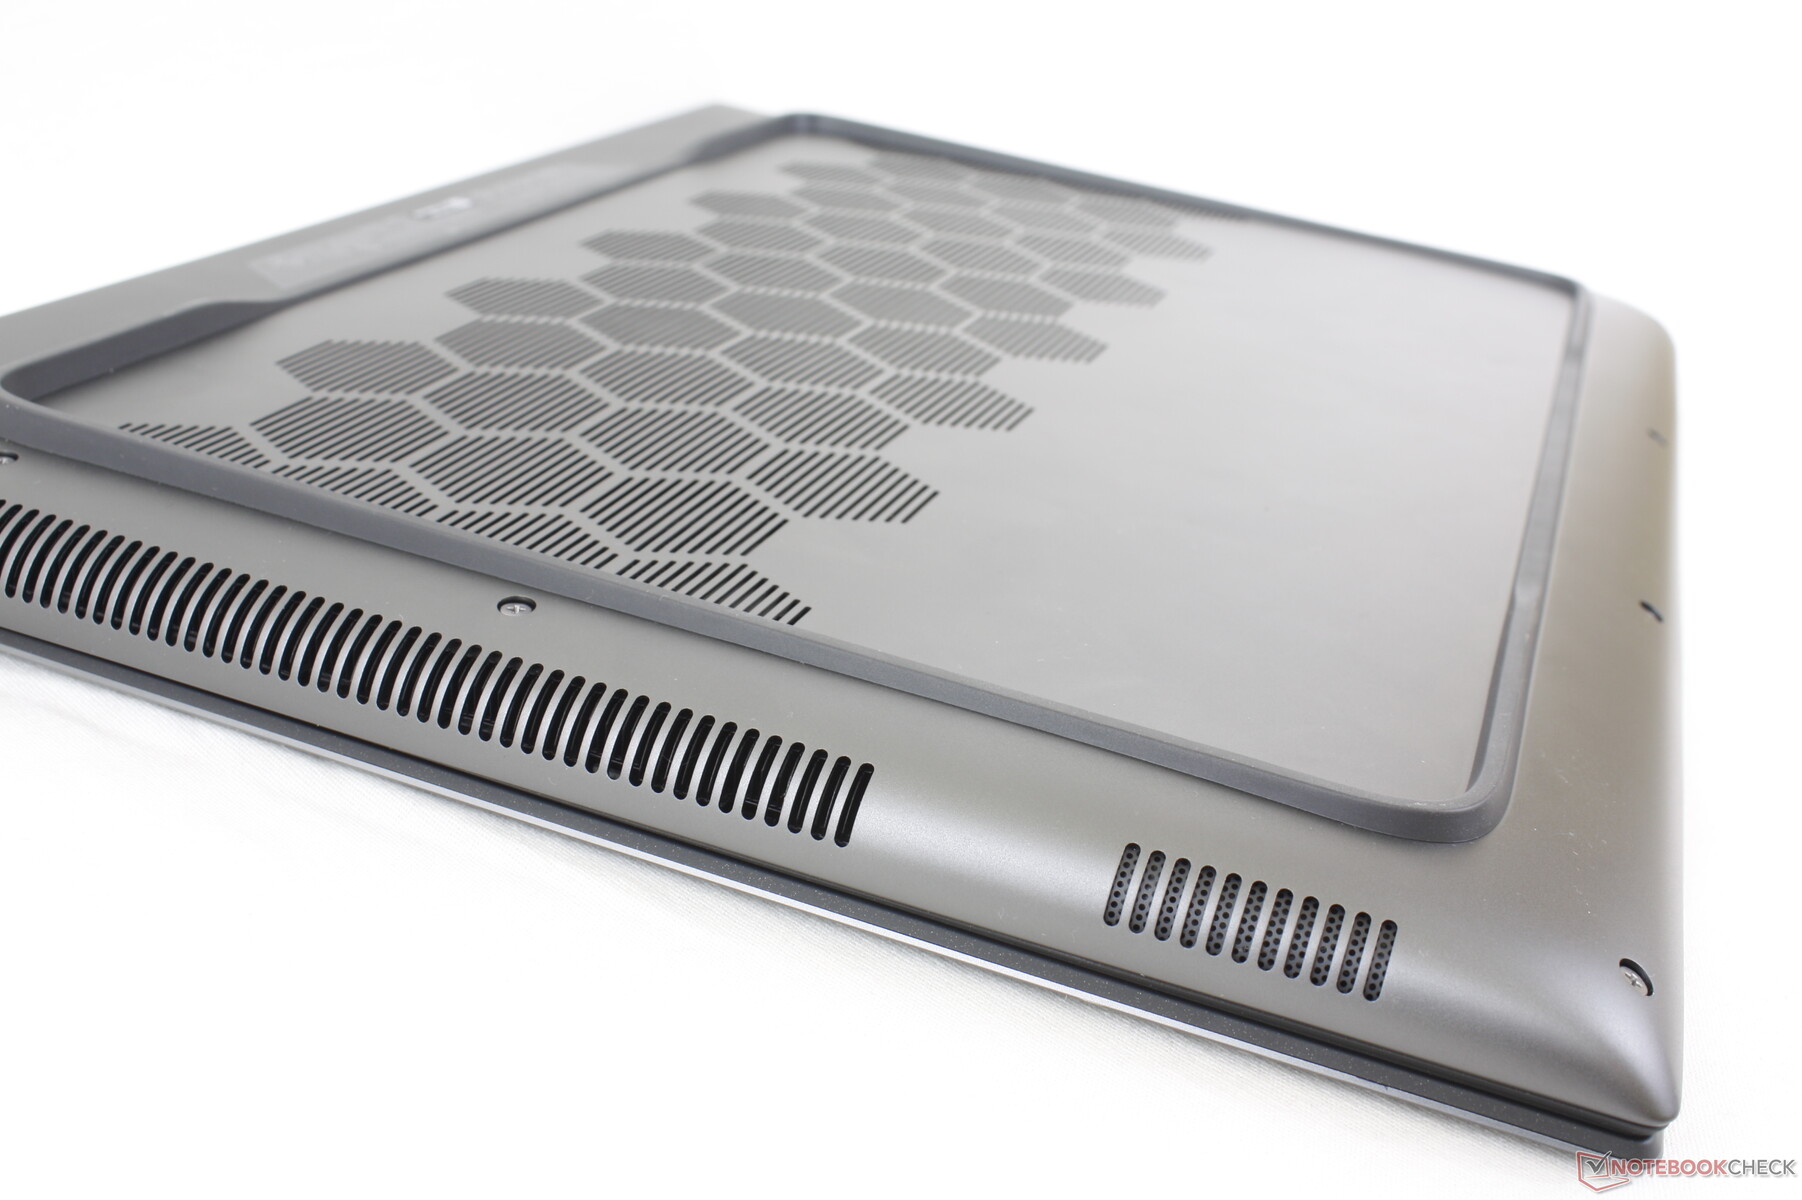
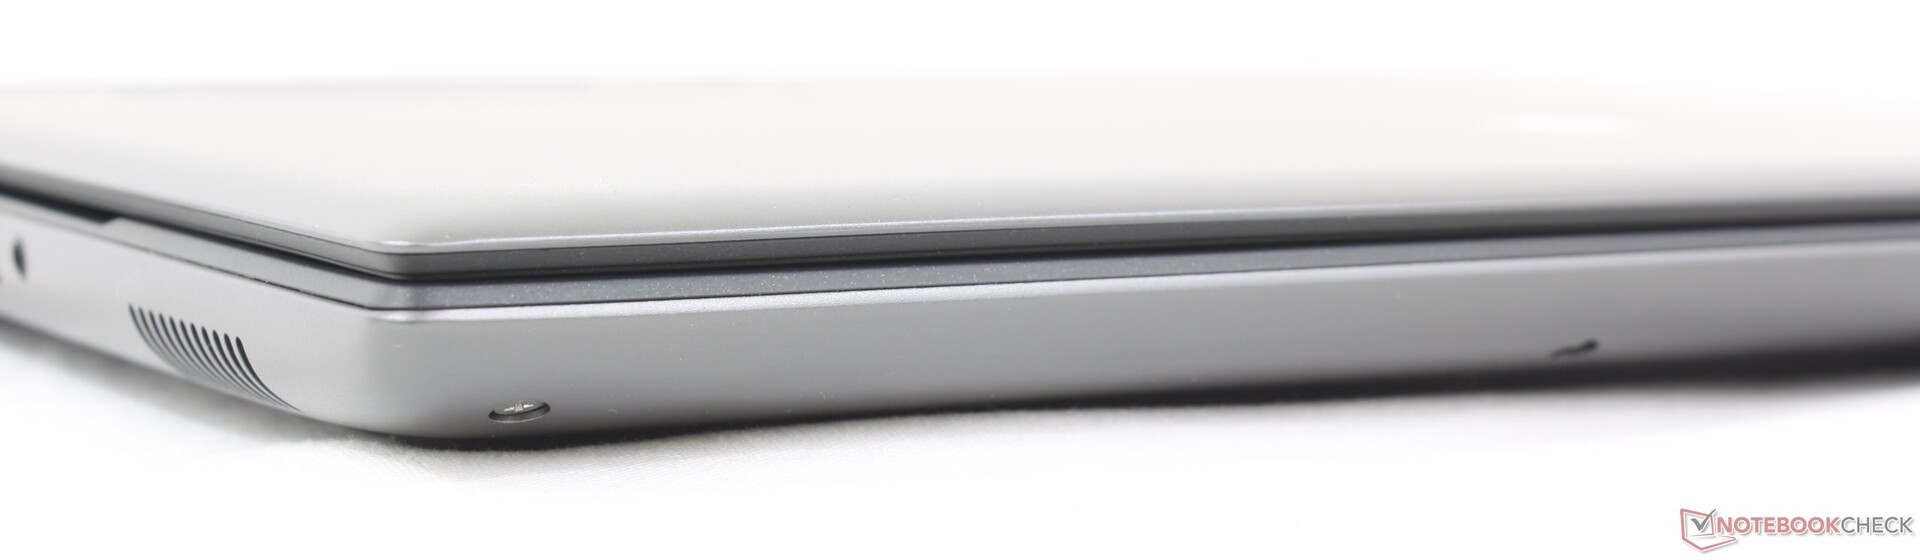
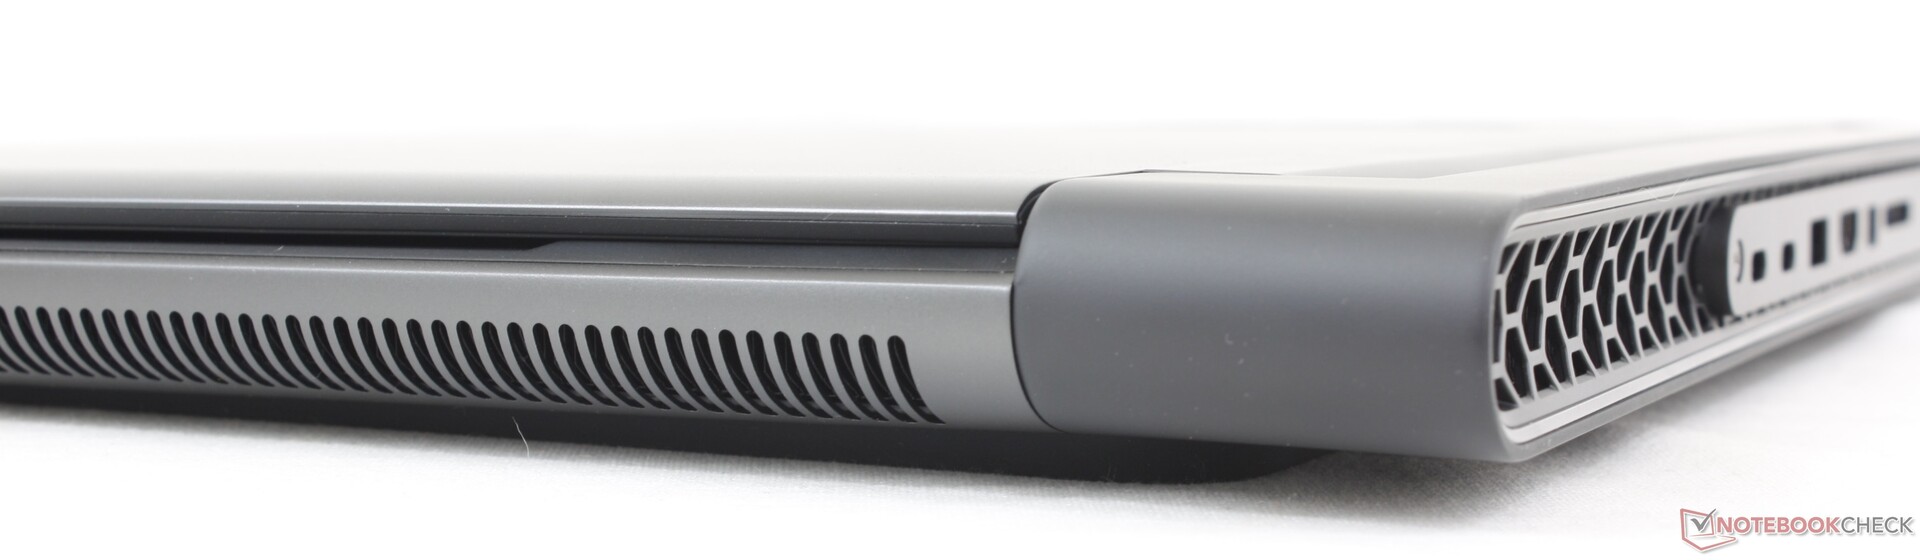
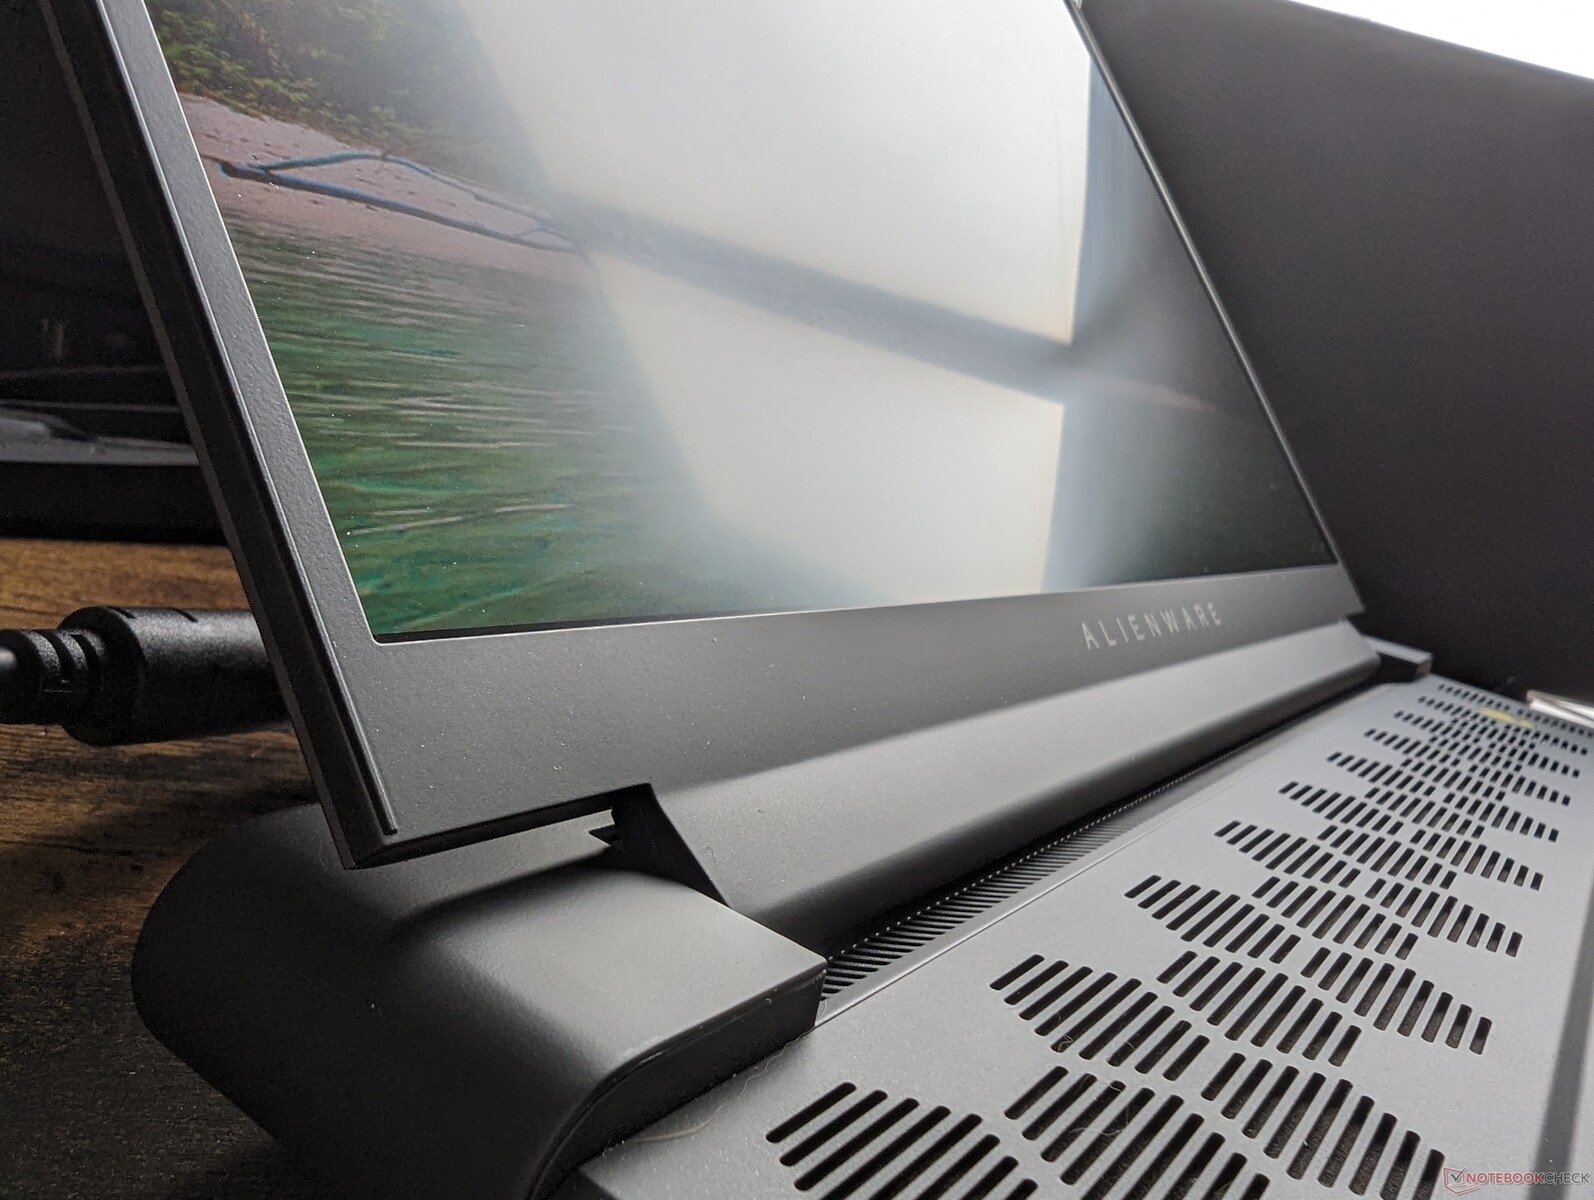
Gabinete - Inconfundivelmente Alienware
O chassi é essencialmente uma versão mais espessa do Alienware x16 R1, pois ambos os modelos são baseados no mesmo design industrial Legend 3.0. O pé de perímetro emborrachado, a tampa externa de alumínio, as grades de ventilação hexagonais, o anel de LED traseiro e o deck do teclado em preto fosco são uma combinação não vista em nenhum modelo da concorrência. A base, a tampa e as dobradiças são firmes, sem nenhum rangido audível quando se tenta torcê-las ou dobrá-las, o que proporciona uma primeira impressão mais forte do que a de um Asus TUF Gaming A16 ou do Lenovo Legion Pro 7 16.
Os apoios para as mãos, o clickpad e as teclas do teclado pretos continuam a ser ímãs de impressões digitais. No momento, a Dell não está oferecendo nenhuma outra opção de cor além da Dark Metallic Moon.
O Alienware m16 R1 é um dos laptops para jogos de 16 polegadas mais pesados e também um dos maiores em termos de comprimento e largura devido à sua traseira estendida. Seu design denso proporciona uma construção muito robusta, embora ao custo da portabilidade. O Legion Pro 7por exemplo, é 400 g mais leve e ocupa um espaço muito menor, mas oferece CPUs de classe HX e GPUs de ponta semelhantes.
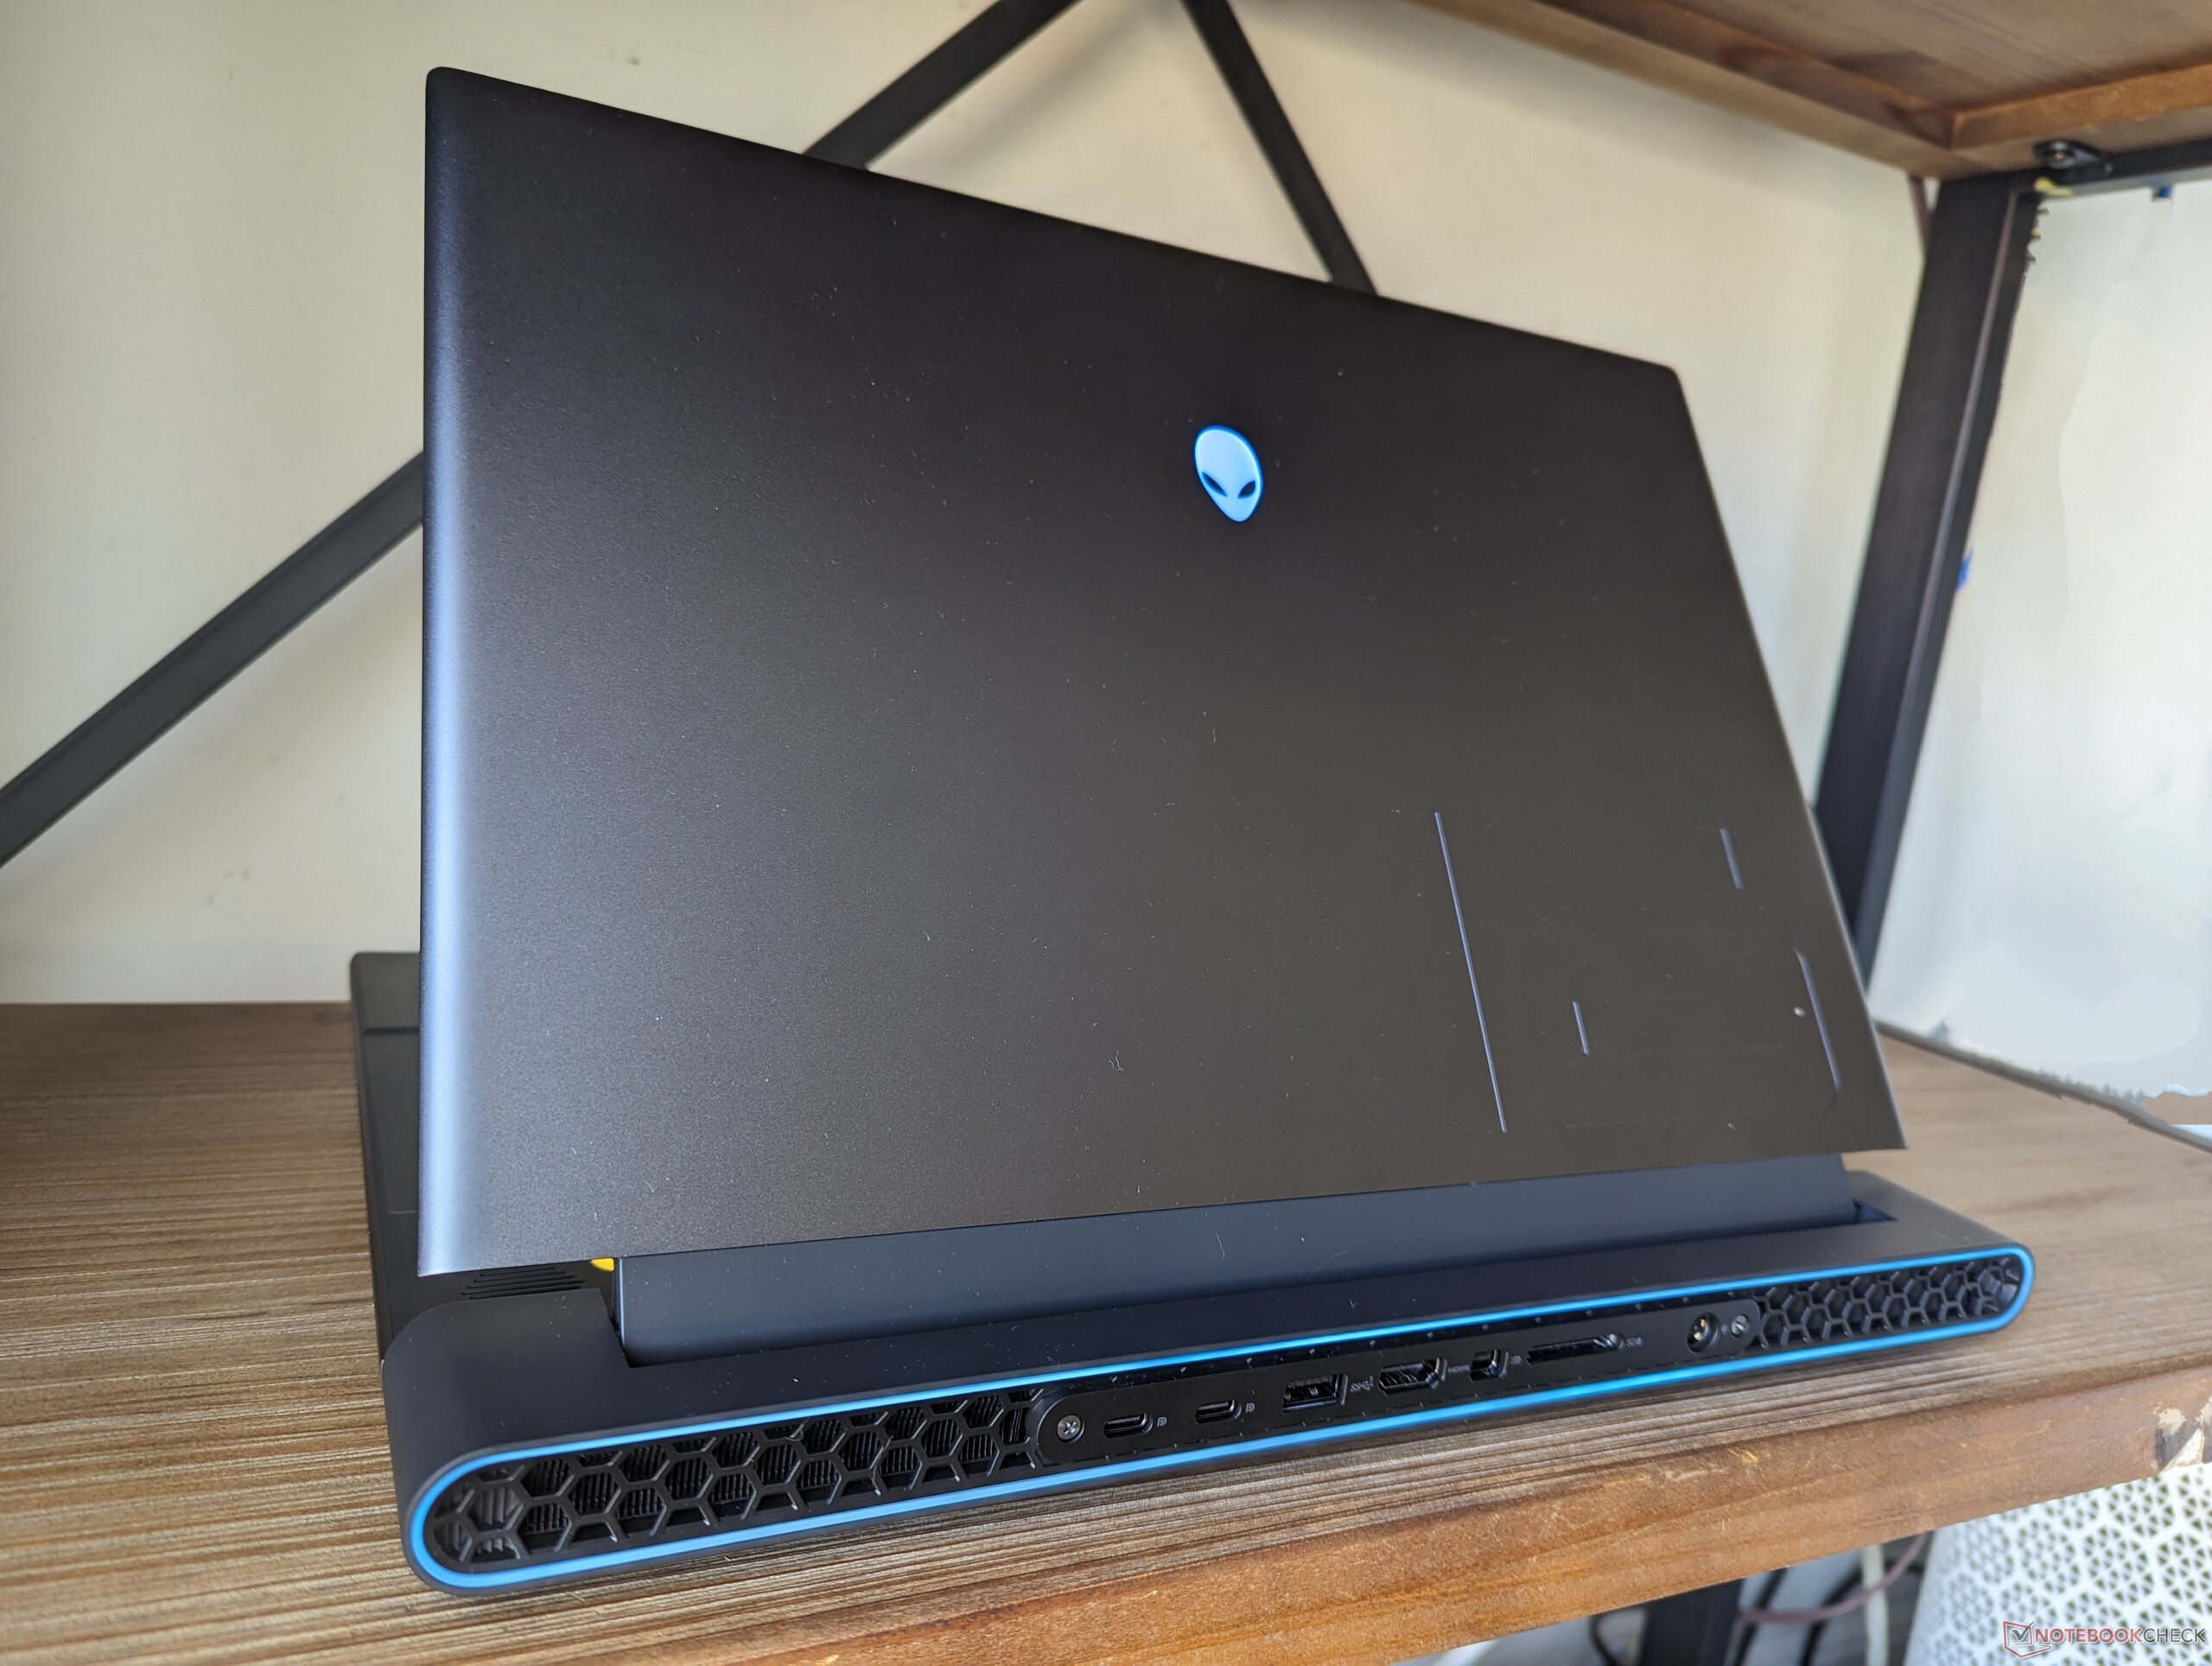
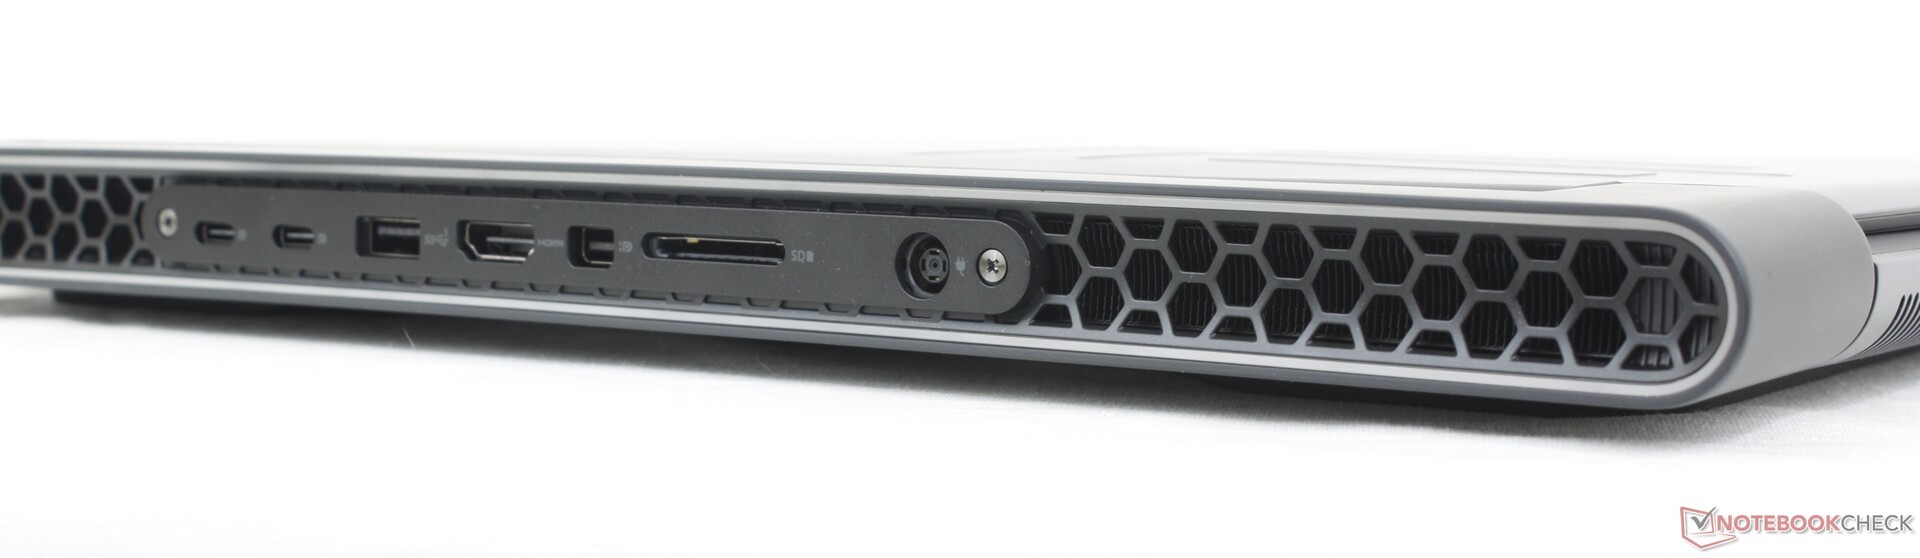
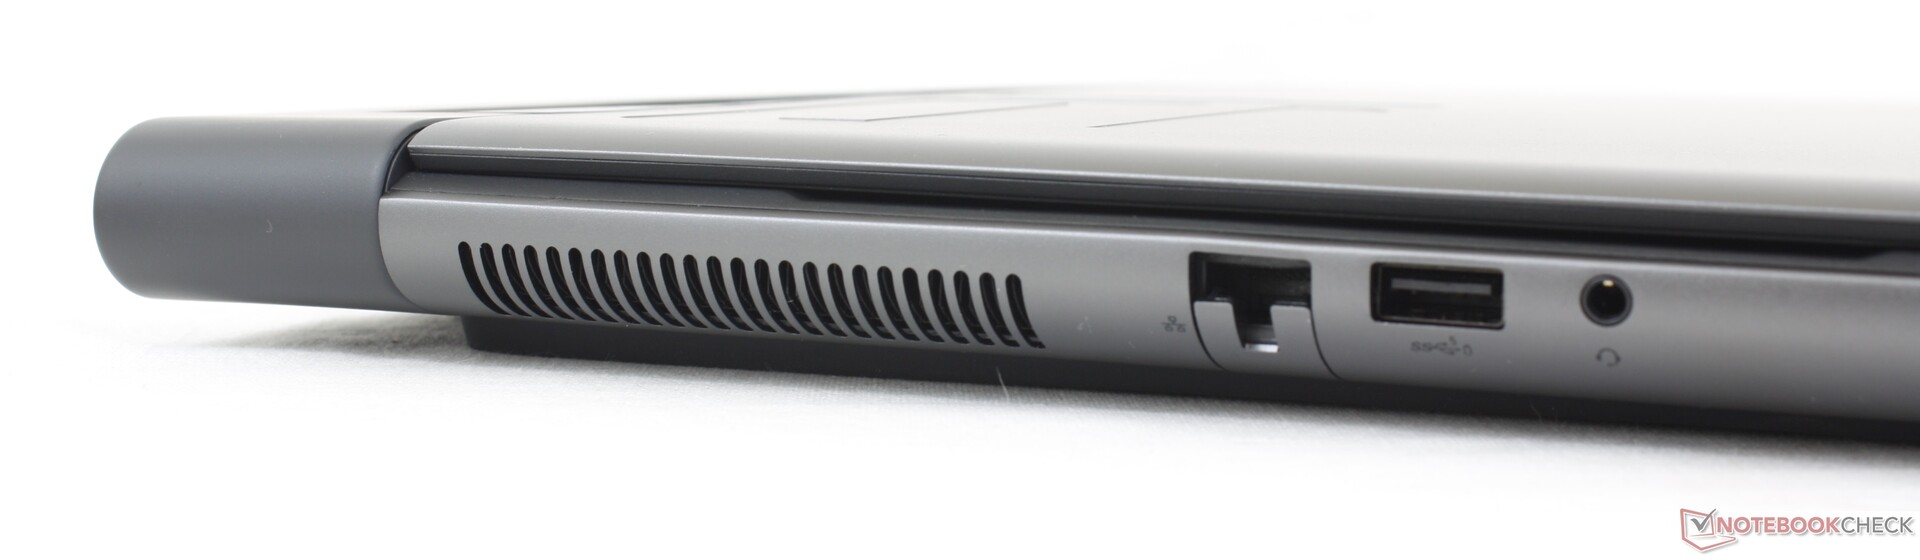
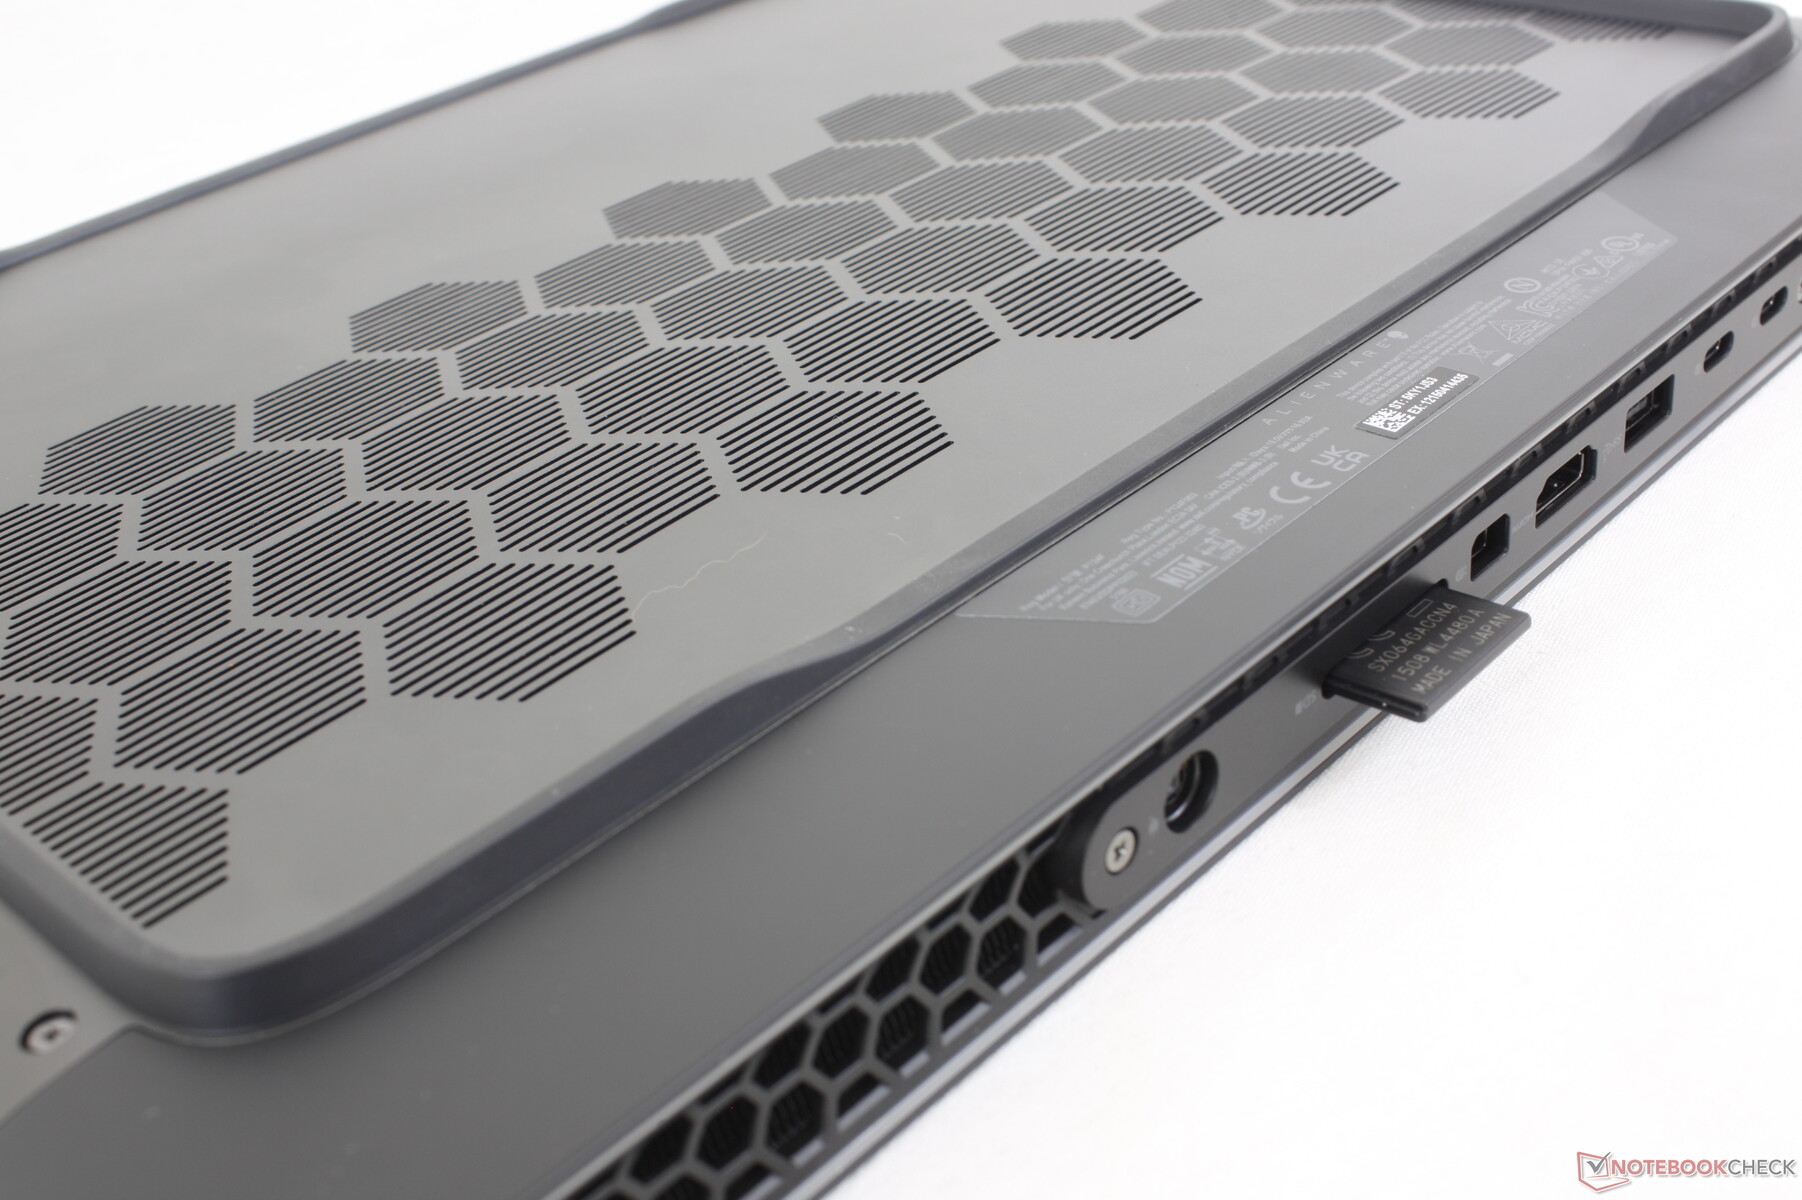
Conectividade - Thunderbolt somente para versões Intel
As opções de portas incluem tudo o que se encontra no Alienware x16 R1, além de RJ-45 e um leitor SD de tamanho normal em vez de MicroSD. Algumas portas também foram realocadas para a borda esquerda, enquanto no x16 estão todas amontoadas na parte traseira. A mini-DisplayPort também é notável, pois não é comum em laptops para jogos mais recentes.
O USB4 e o Thunderbolt não são compatíveis com o nosso modelo AMD.
Leitor de cartão SD
As taxas de transferência do leitor de cartão SD são mais rápidas do que na maioria dos outros laptops para jogos, o que deve satisfazer os criadores de conteúdo. A transferência de 1 GB de fotos do nosso cartão de teste UHS-II para o desktop leva pouco mais de 5 segundos.
| SD Card Reader | |
| average JPG Copy Test (av. of 3 runs) | |
| Alienware m16 R1 AMD (Toshiba Exceria Pro SDXC 64 GB UHS-II) | |
| Razer Blade 16 Early 2023 (AV PRO microSD 128 GB V60) | |
| Alienware x16 R1 (AV PRO microSD 128 GB V60) | |
| maximum AS SSD Seq Read Test (1GB) | |
| Alienware x16 R1 (AV PRO microSD 128 GB V60) | |
| Alienware m16 R1 AMD (Toshiba Exceria Pro SDXC 64 GB UHS-II) | |
| Razer Blade 16 Early 2023 (AV PRO microSD 128 GB V60) | |
Comunicação
As SKUs da AMD vêm com o Qualcomm WCN685x, enquanto as SKUs da Intel vêm com o Killer AX1675, cada uma com conectividade Wi-Fi 6E. O desempenho é estável e confiável quando emparelhado com nossa rede de 6 GHz.
| Networking | |
| iperf3 transmit AXE11000 | |
| Lenovo Legion Pro 7 RTX4090 | |
| Asus ROG Strix G16 G614JZ | |
| Alienware m16 R1 AMD | |
| HP Omen Transcend 16 | |
| Razer Blade 16 Early 2023 | |
| Alienware x16 R1 | |
| iperf3 receive AXE11000 | |
| Lenovo Legion Pro 7 RTX4090 | |
| Asus ROG Strix G16 G614JZ | |
| Alienware m16 R1 AMD | |
| HP Omen Transcend 16 | |
| Razer Blade 16 Early 2023 | |
| Alienware x16 R1 | |
| iperf3 transmit AXE11000 6GHz | |
| Alienware m16 R1 AMD | |
| HP Omen Transcend 16 | |
| Razer Blade 16 Early 2023 | |
| Alienware x16 R1 | |
| iperf3 receive AXE11000 6GHz | |
| Alienware m16 R1 AMD | |
| HP Omen Transcend 16 | |
| Razer Blade 16 Early 2023 | |
| Alienware x16 R1 | |
Webcam
Há uma webcam de 2 MP com IR e sem obturador de privacidade, como no Alienware x16.


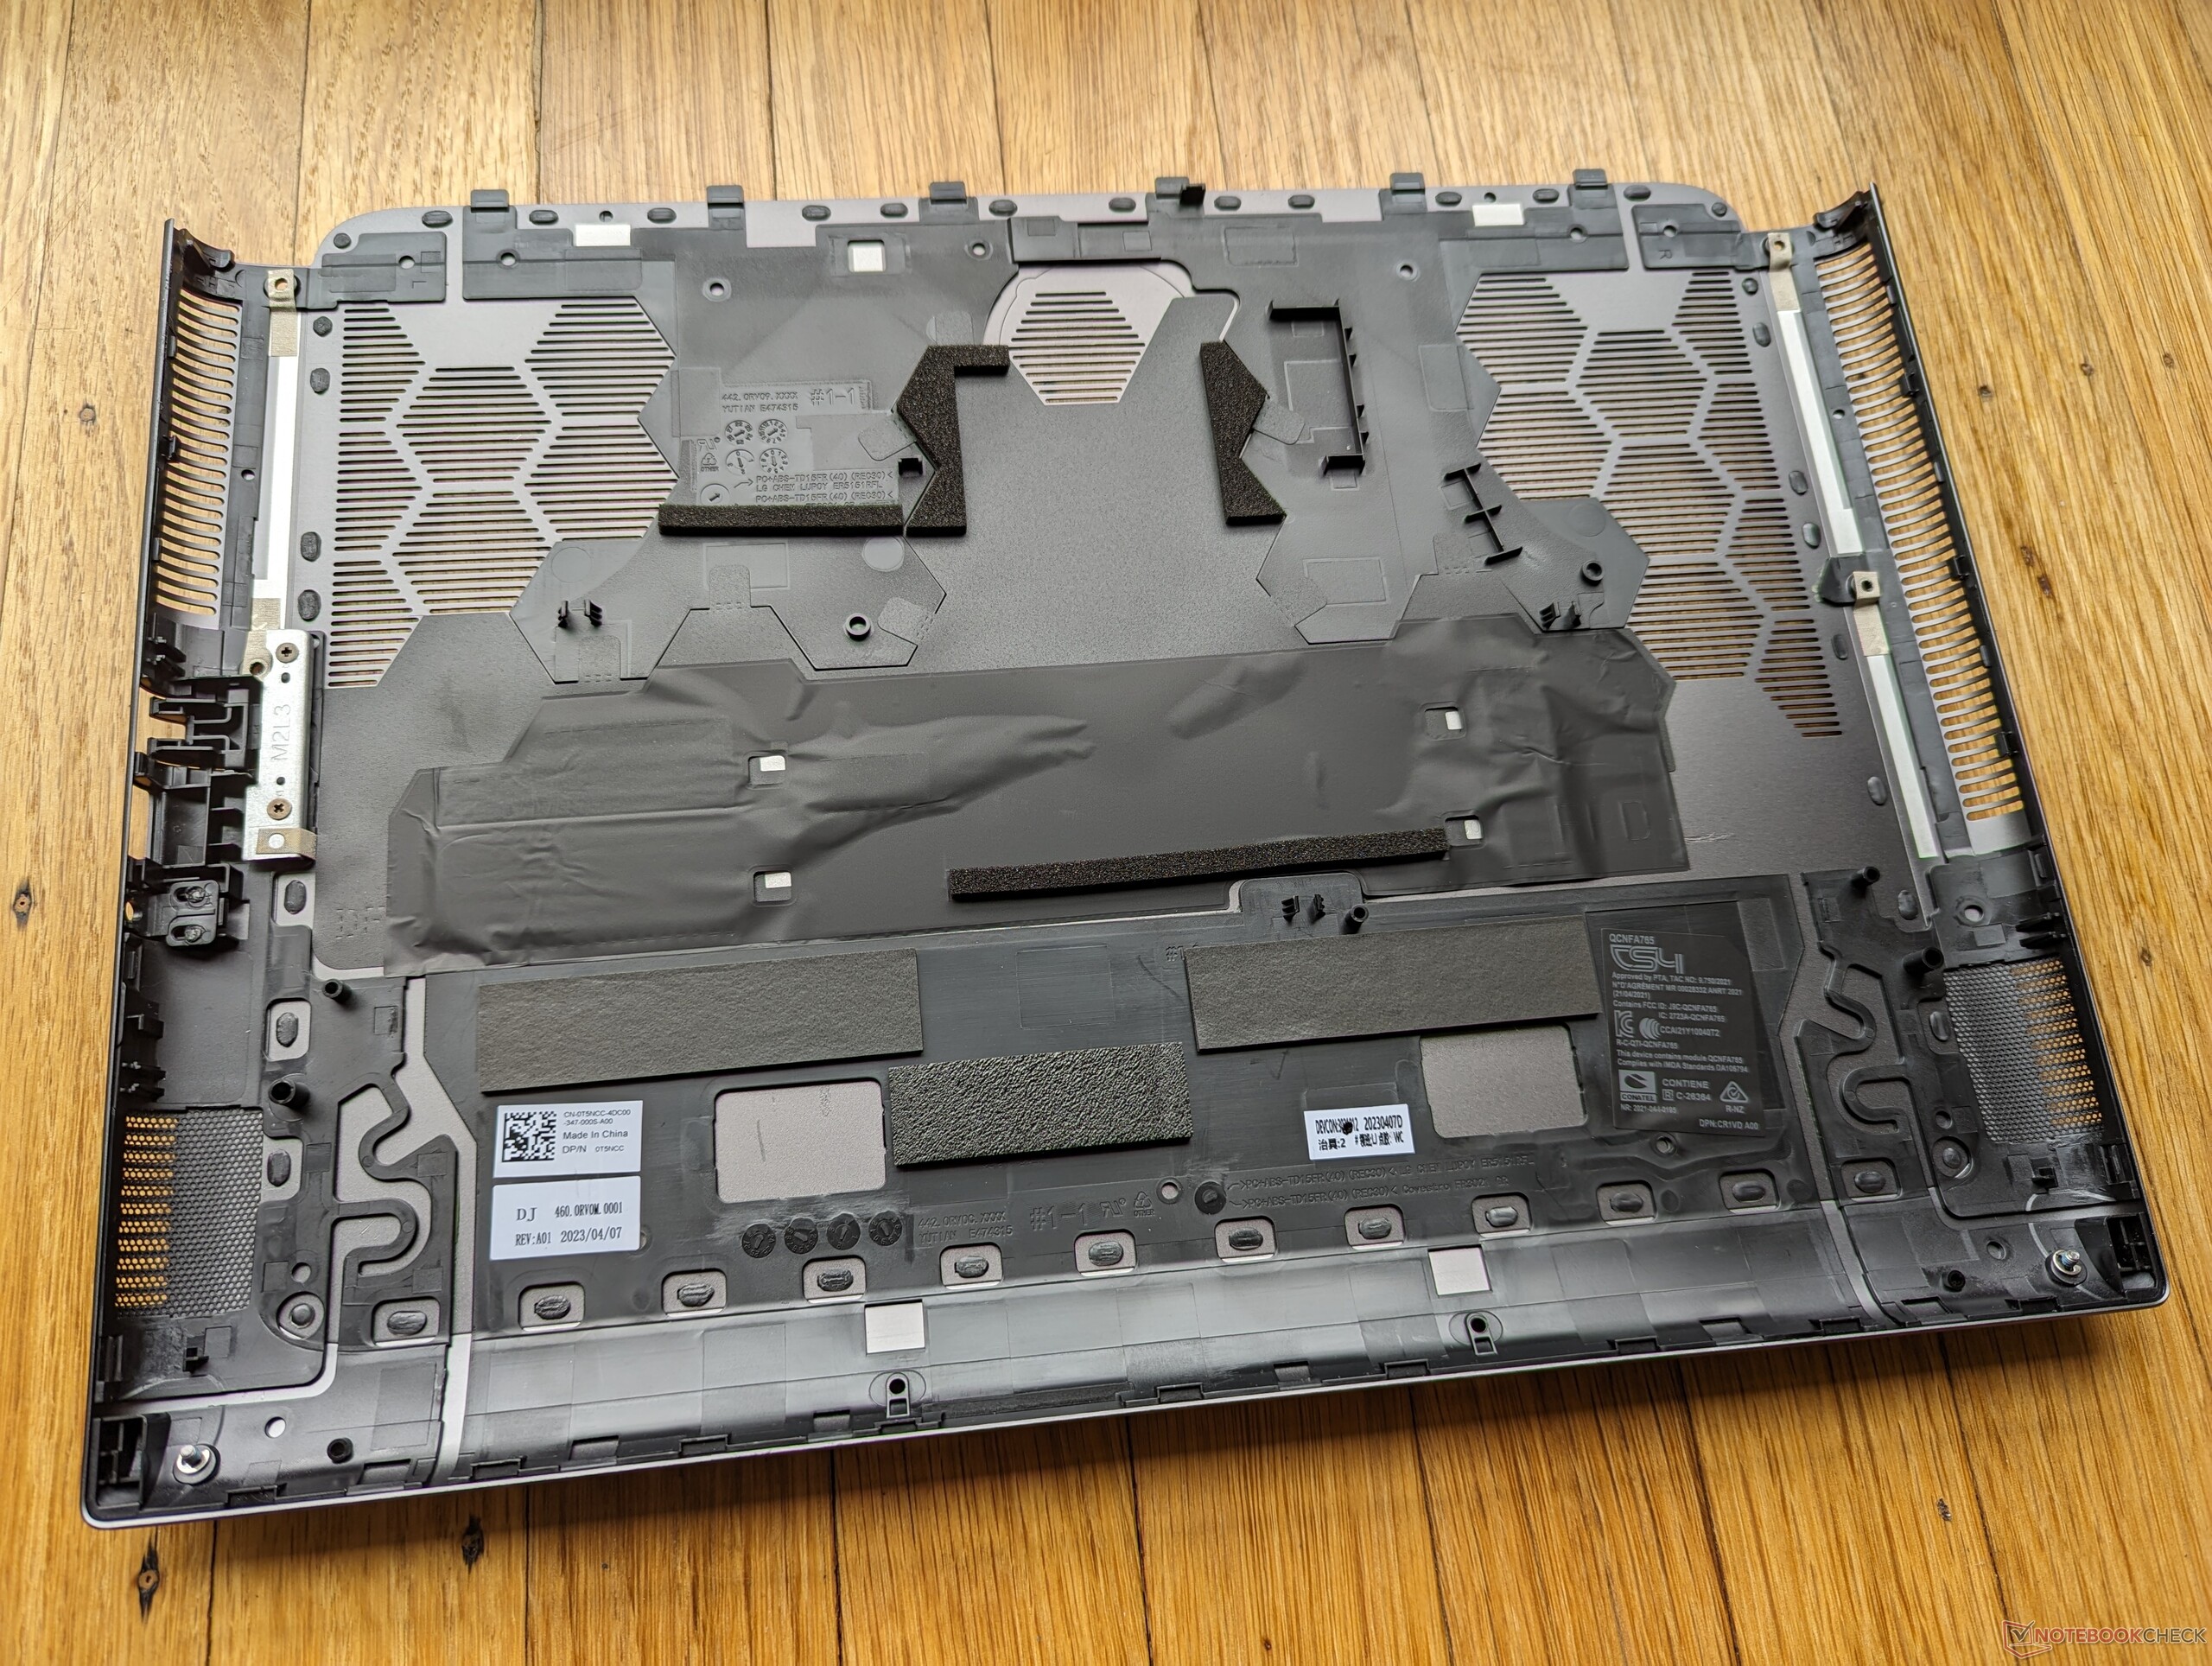
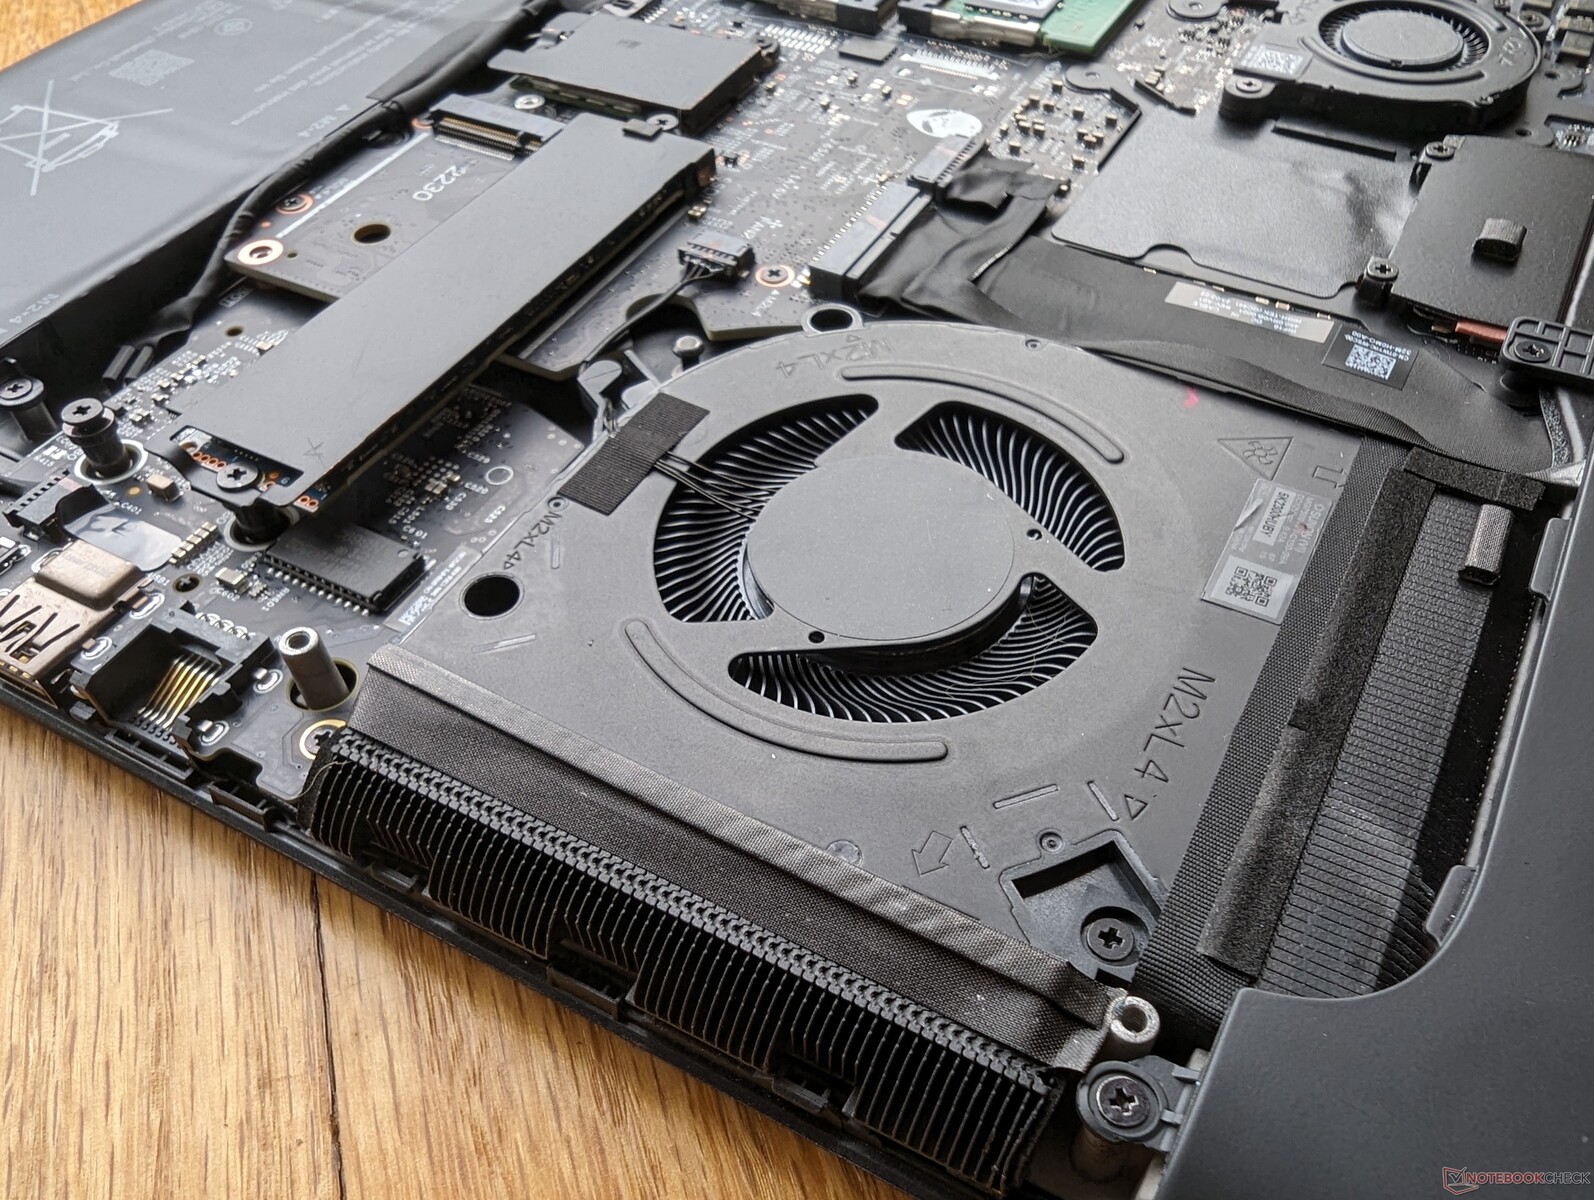
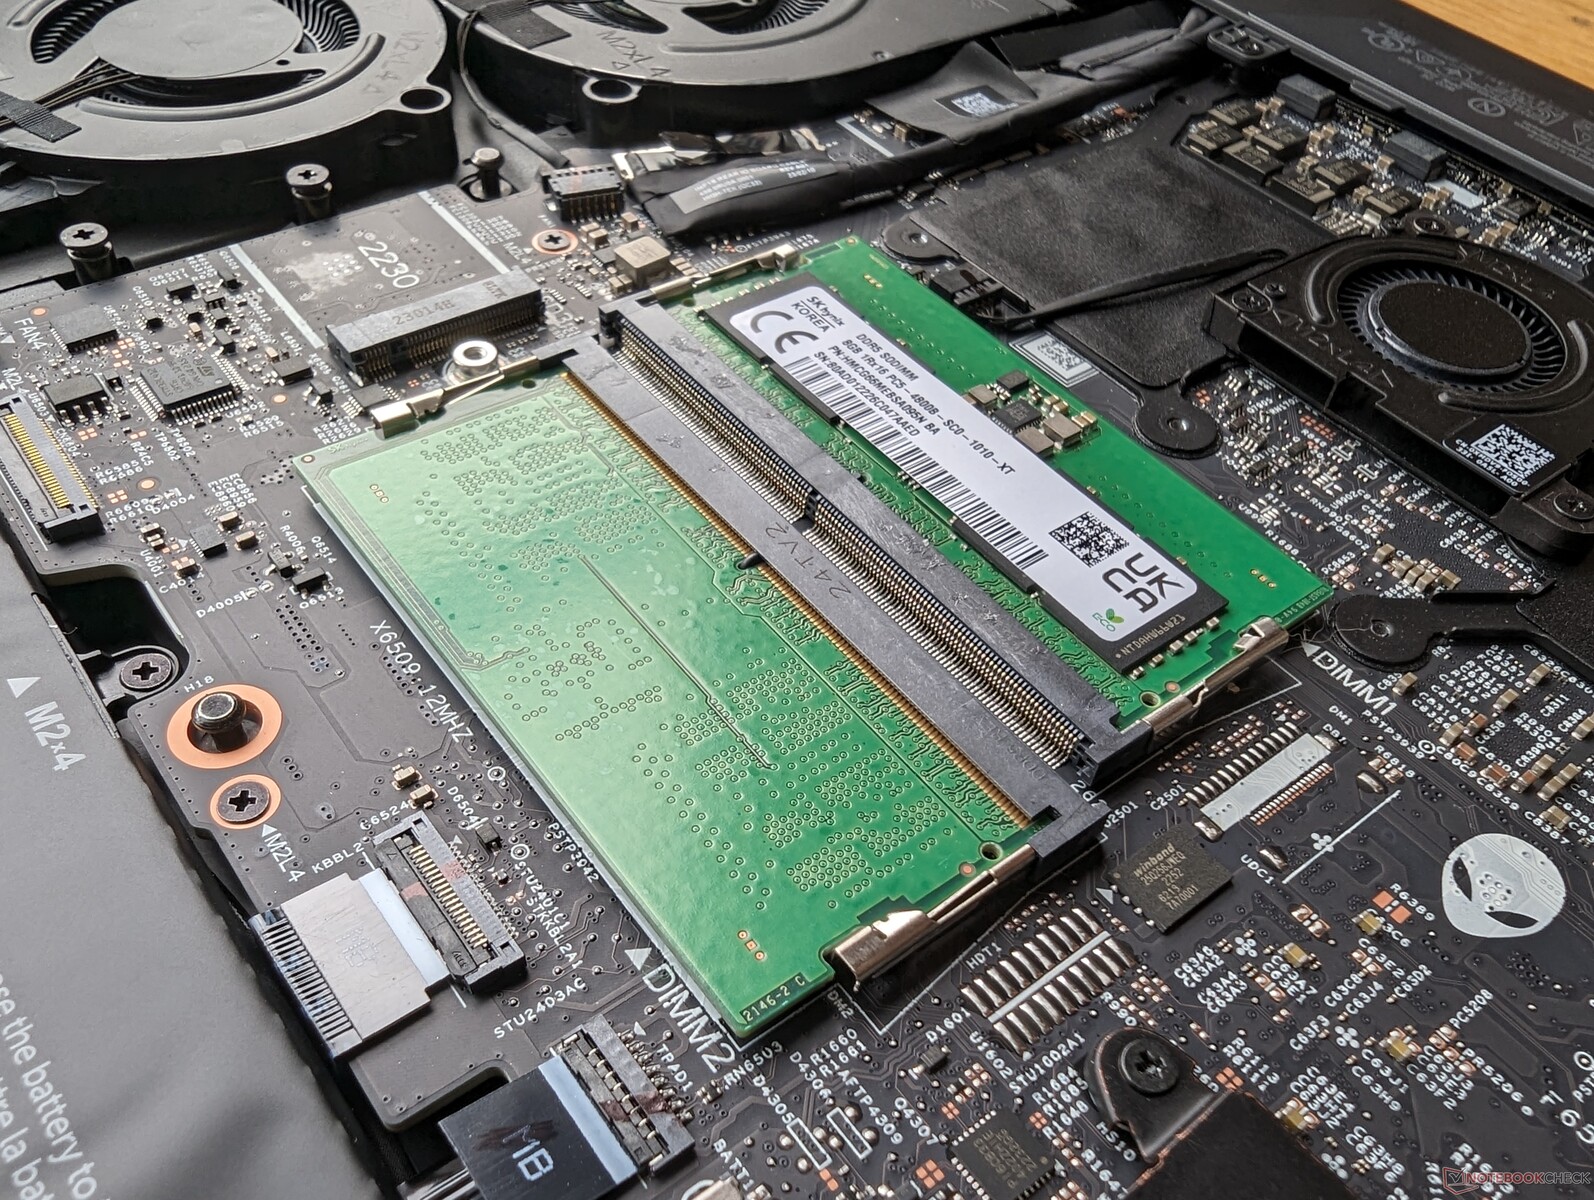
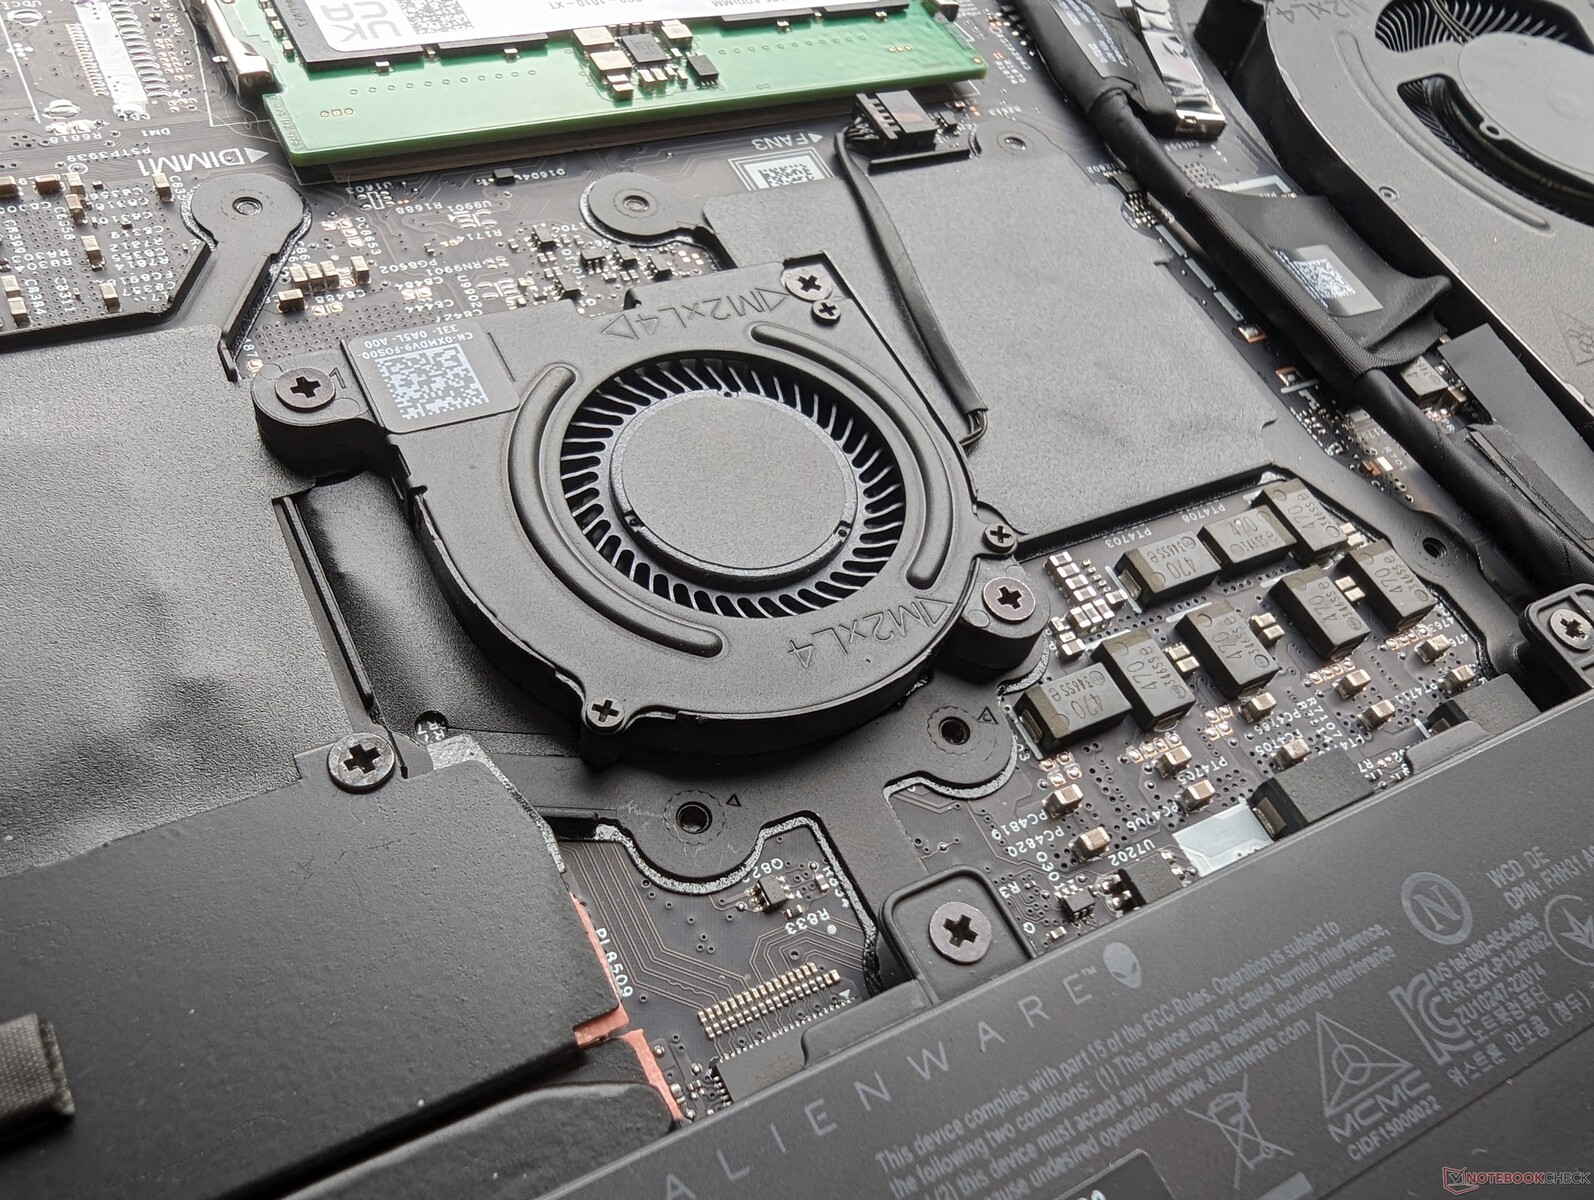
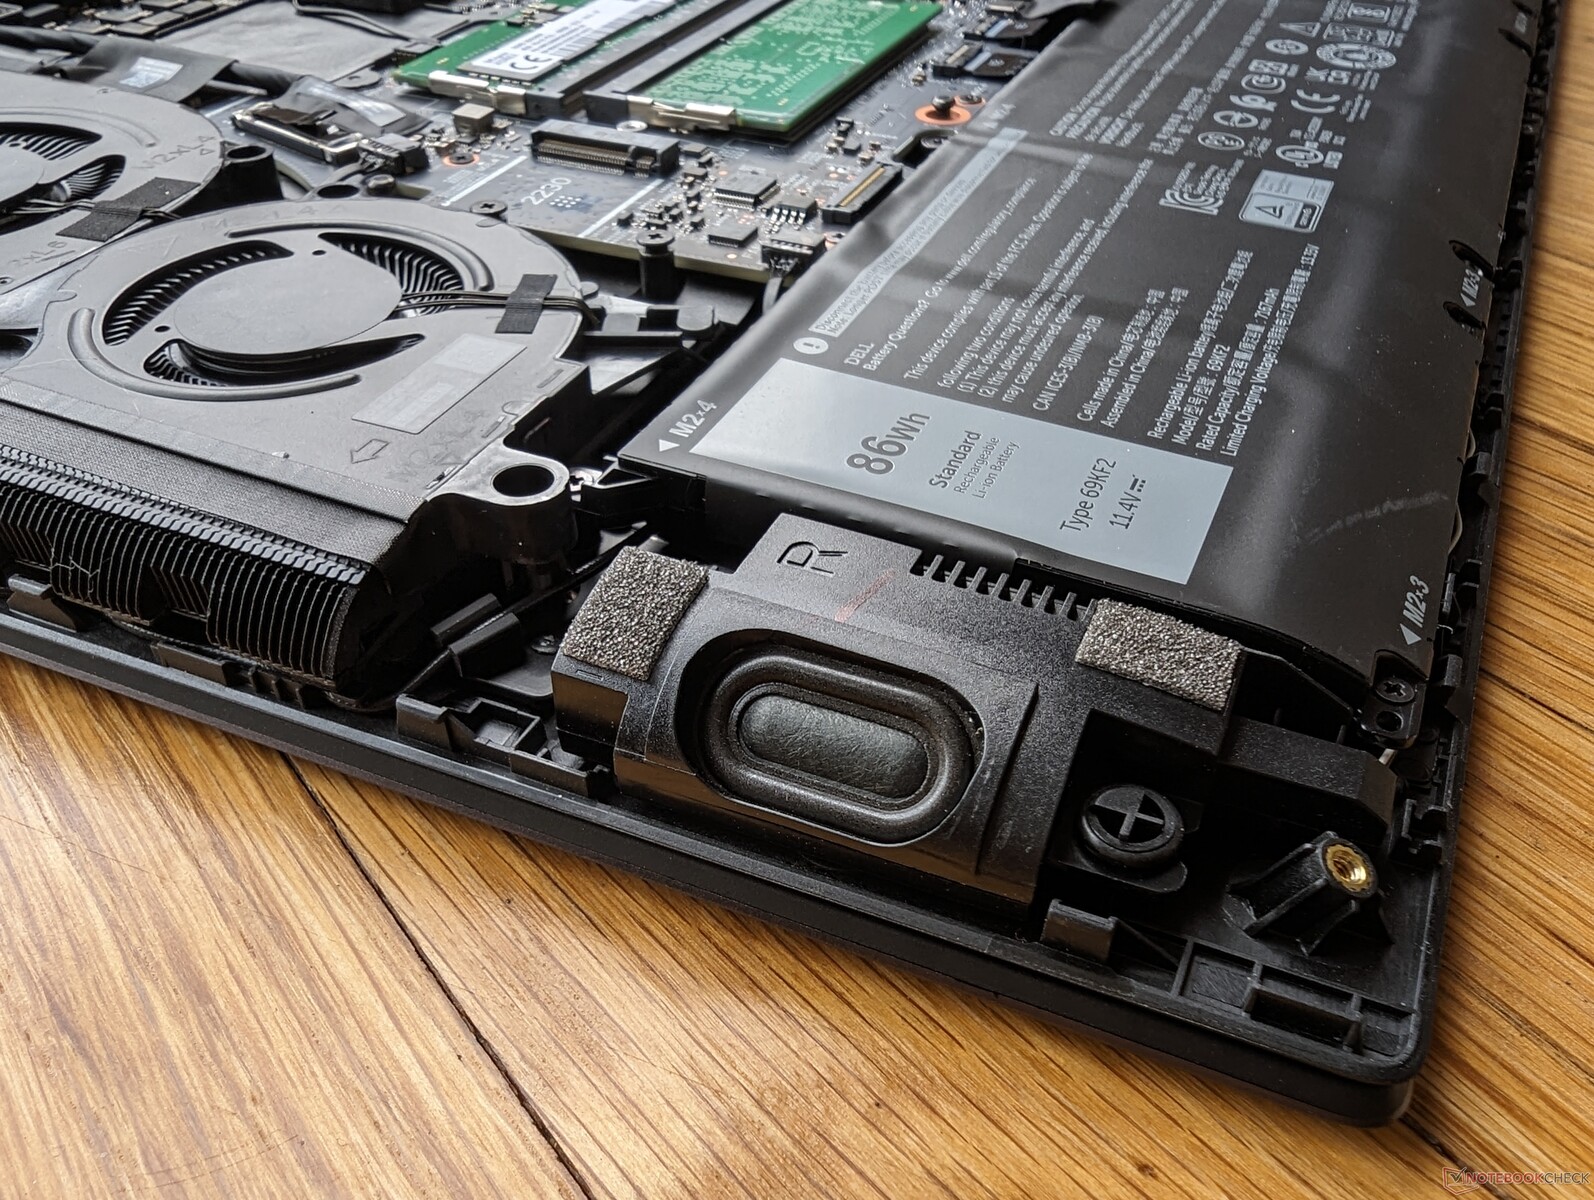
Manutenção
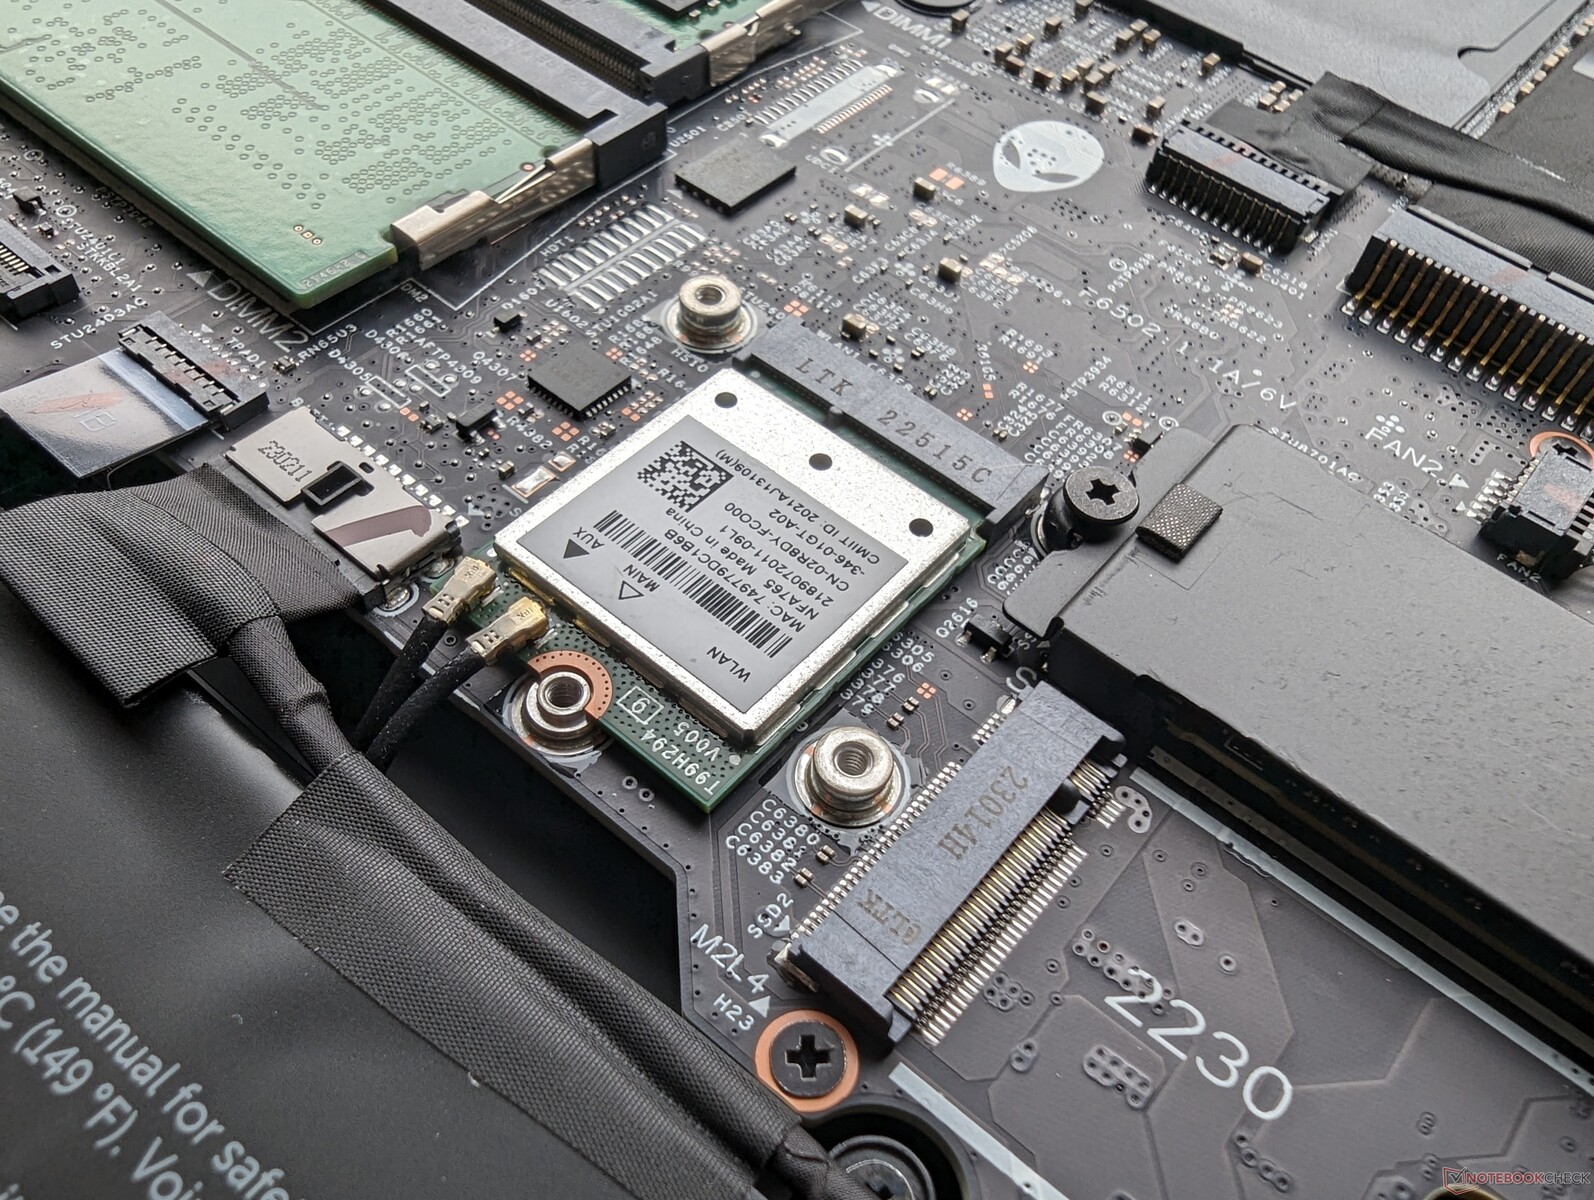
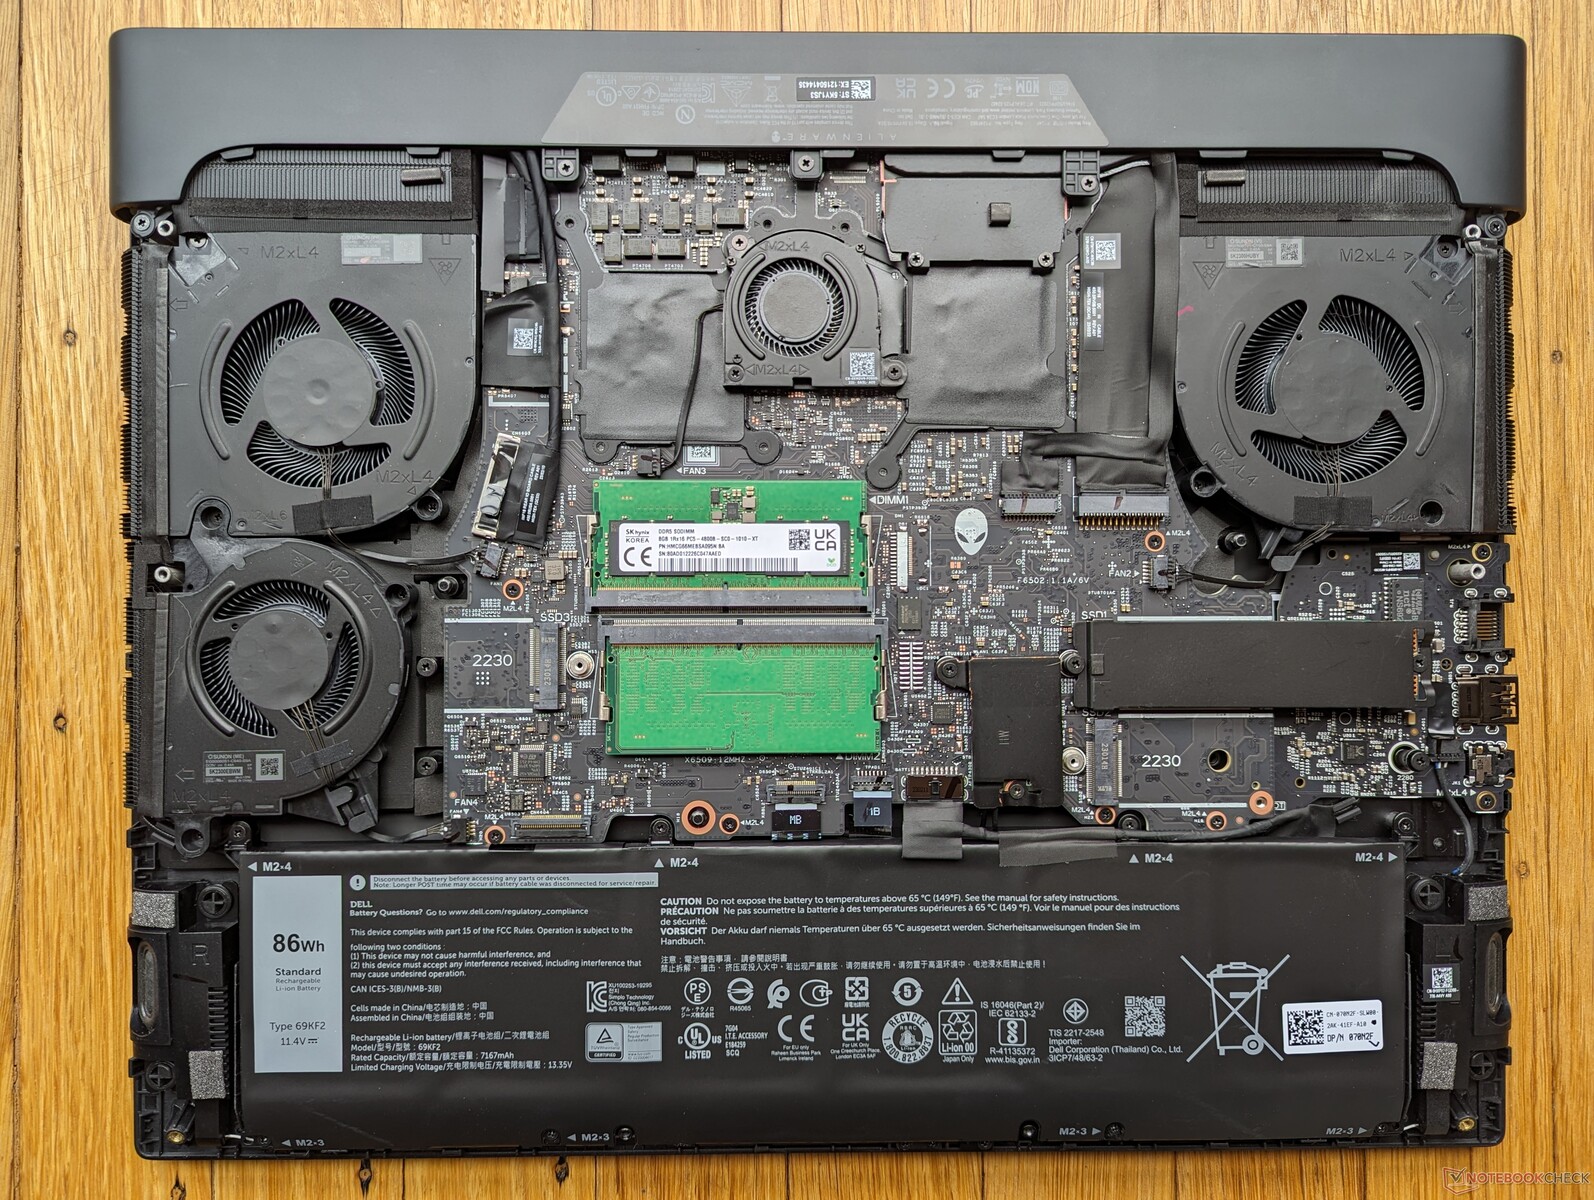
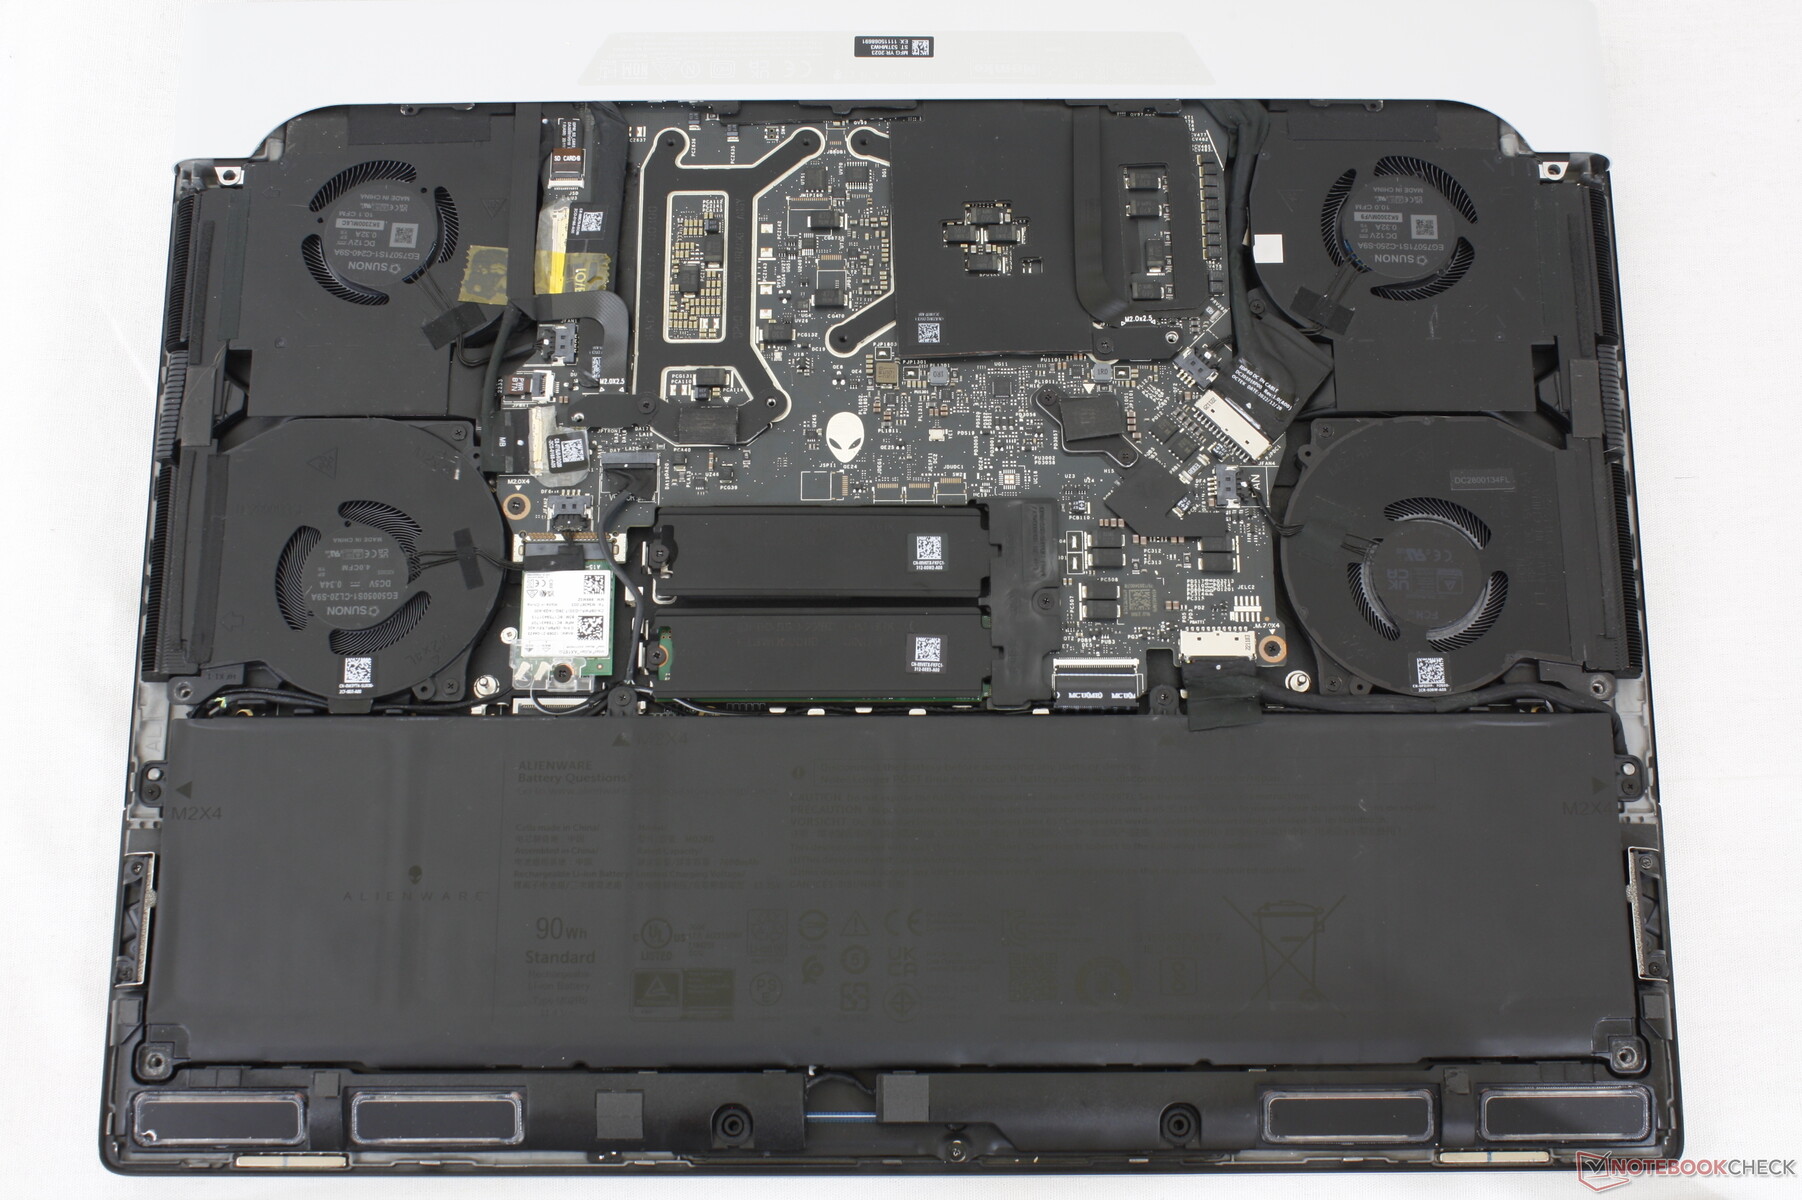
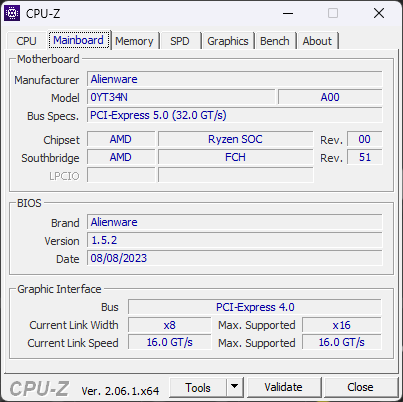
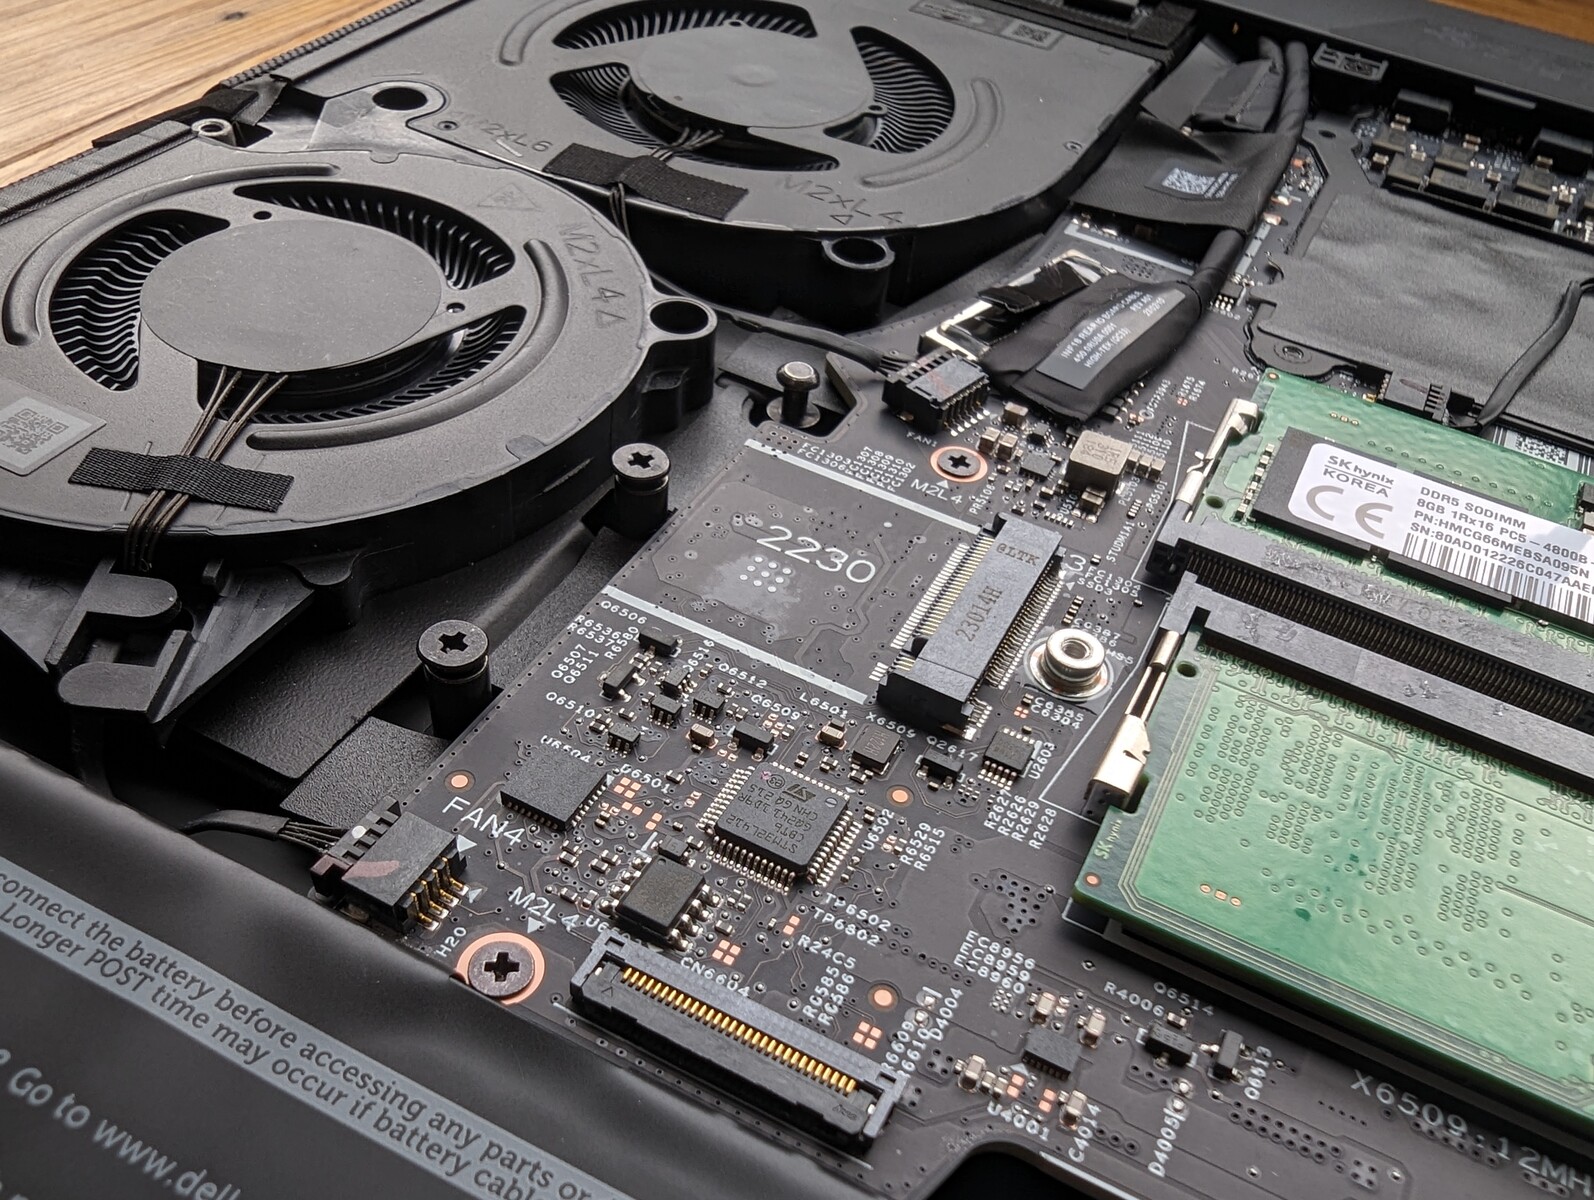
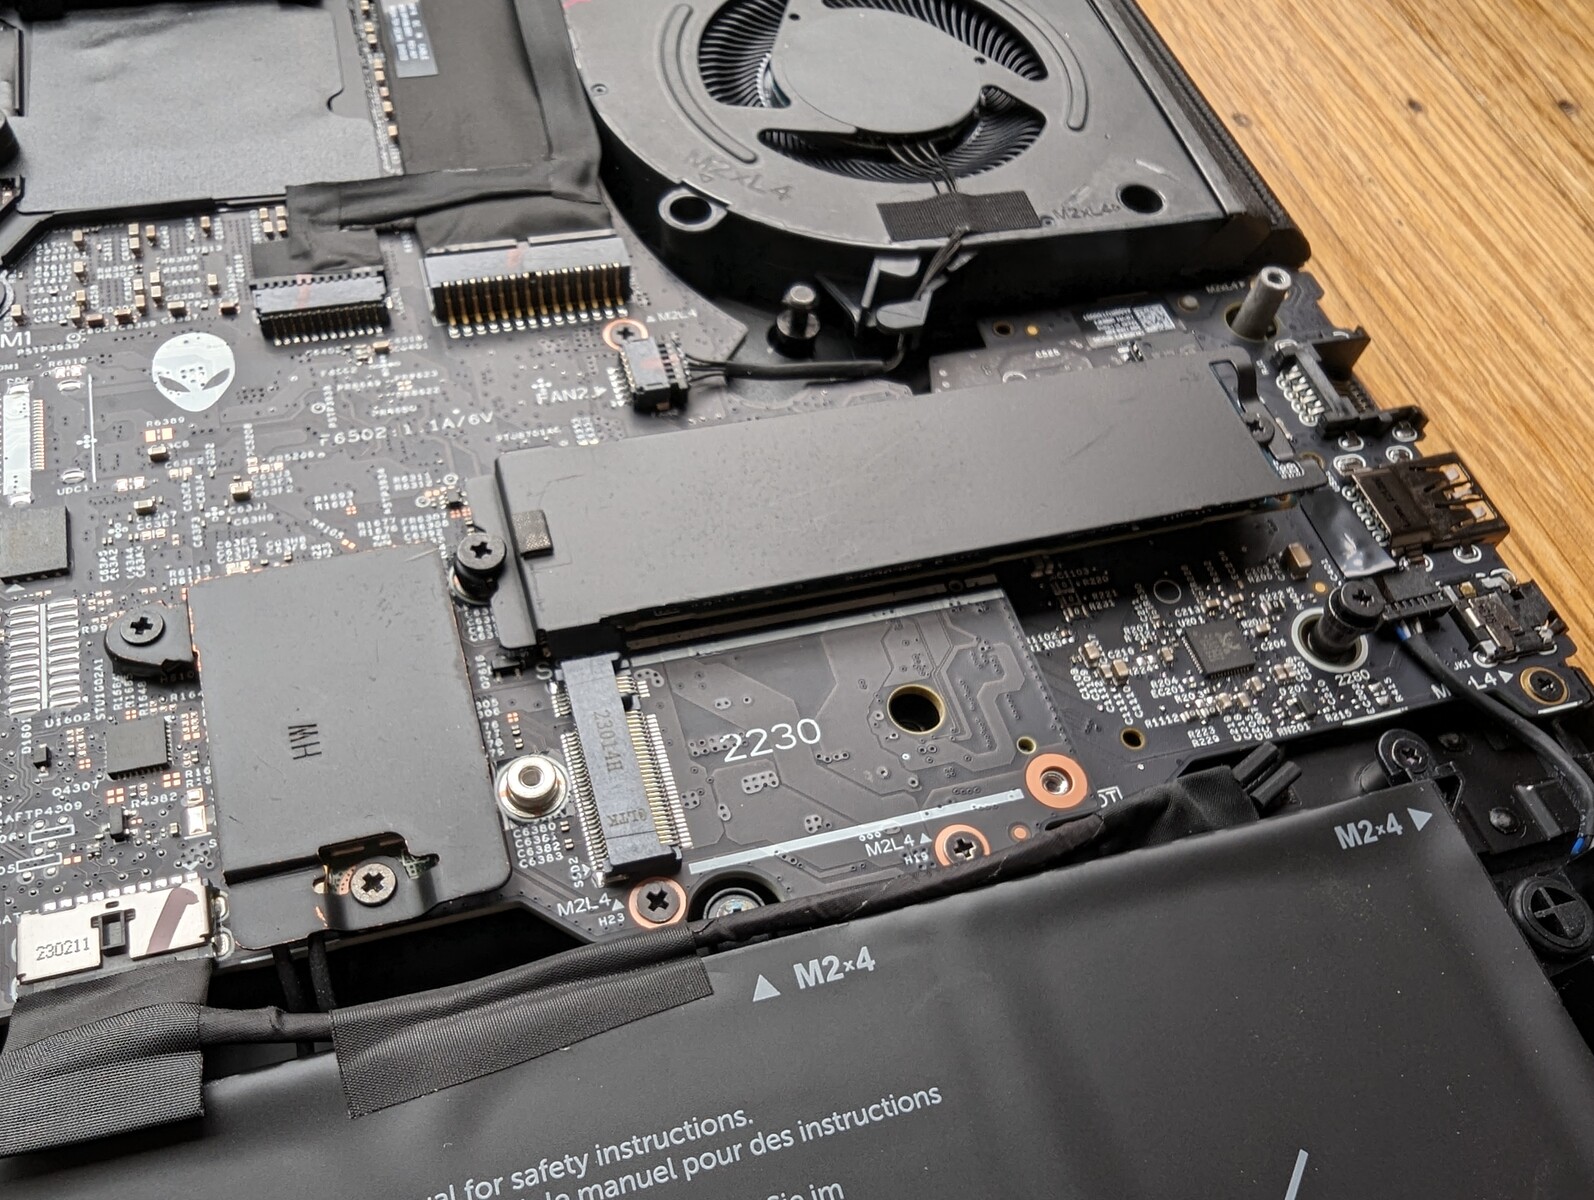
O painel inferior é fixado por 8 parafusos Phillips para facilitar a manutenção. Os usuários têm acesso direto a três baias de armazenamento, dois slots SODIMM e o módulo WLAN removível. Observe que a placa-mãe está de cabeça para baixo, o que significa que os processadores estão no lado oposto.
O design da placa-mãe é completamente diferente do Alienware x16, embora os dois modelos compartilhem muitos recursos externos. Em vez disso, ela é mais semelhante ao Alienware m18.
Acessórios e garantia
A caixa de varejo inclui dois adesivos com o logotipo da Alienware, juntamente com o adaptador CA e a documentação habituais. Uma garantia limitada de um ano do fabricante se aplica se for comprado nos EUA.
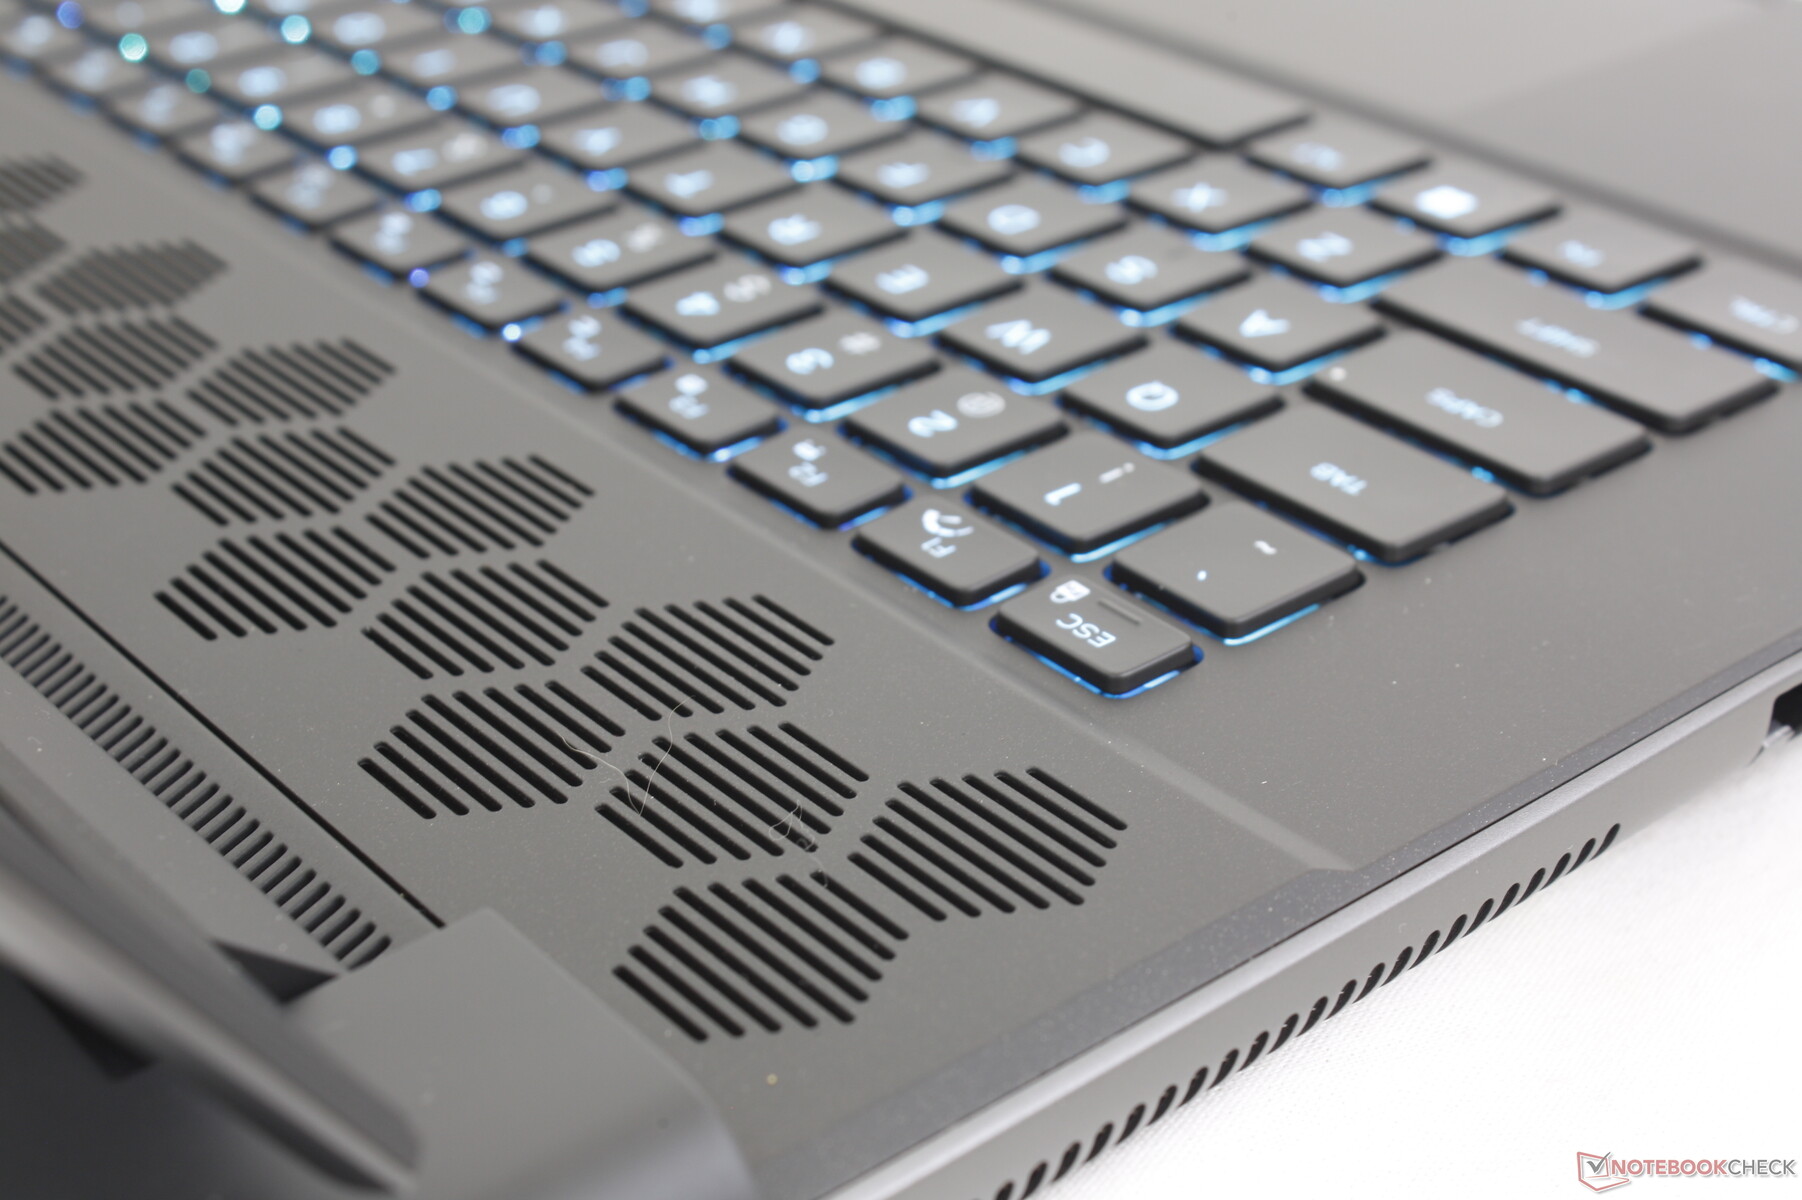
Dispositivos de entrada - mecânicos ou padrão disponíveis
Teclado
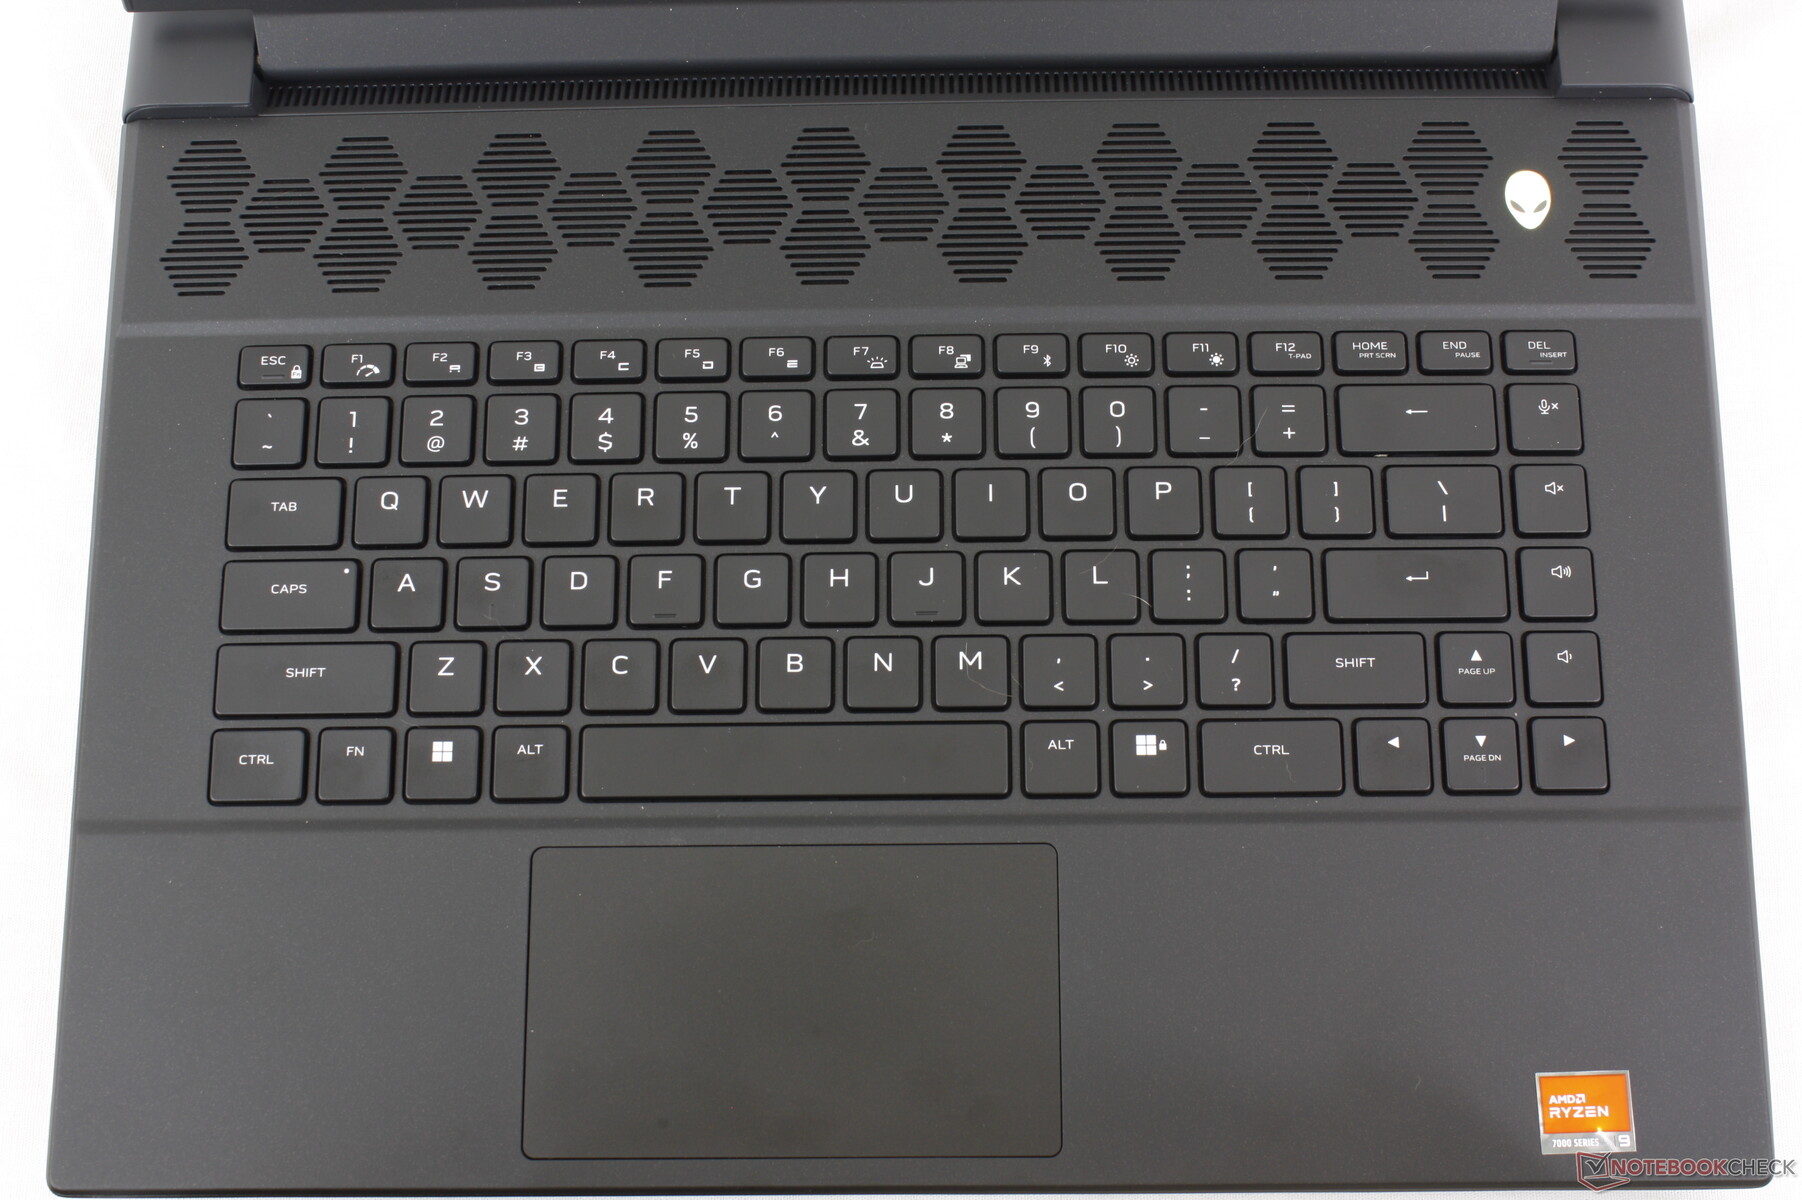
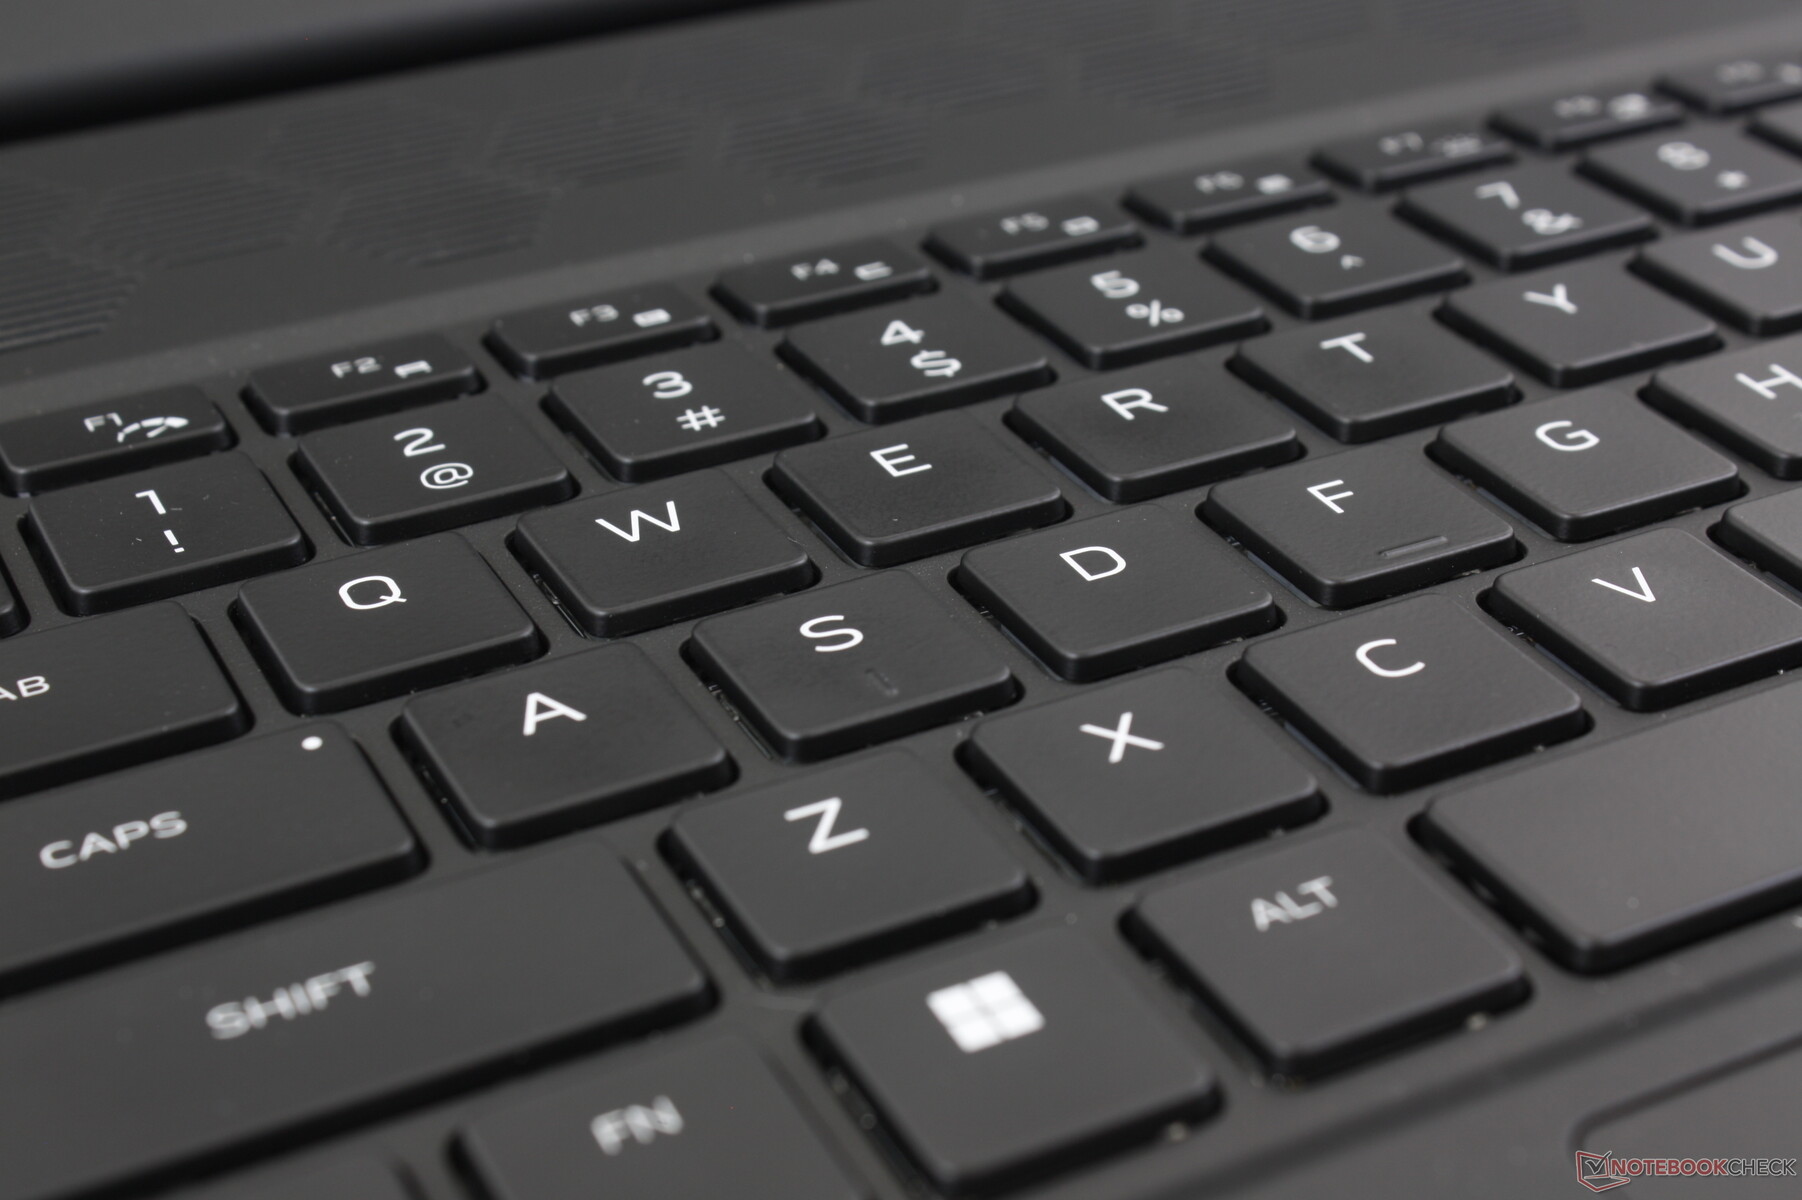
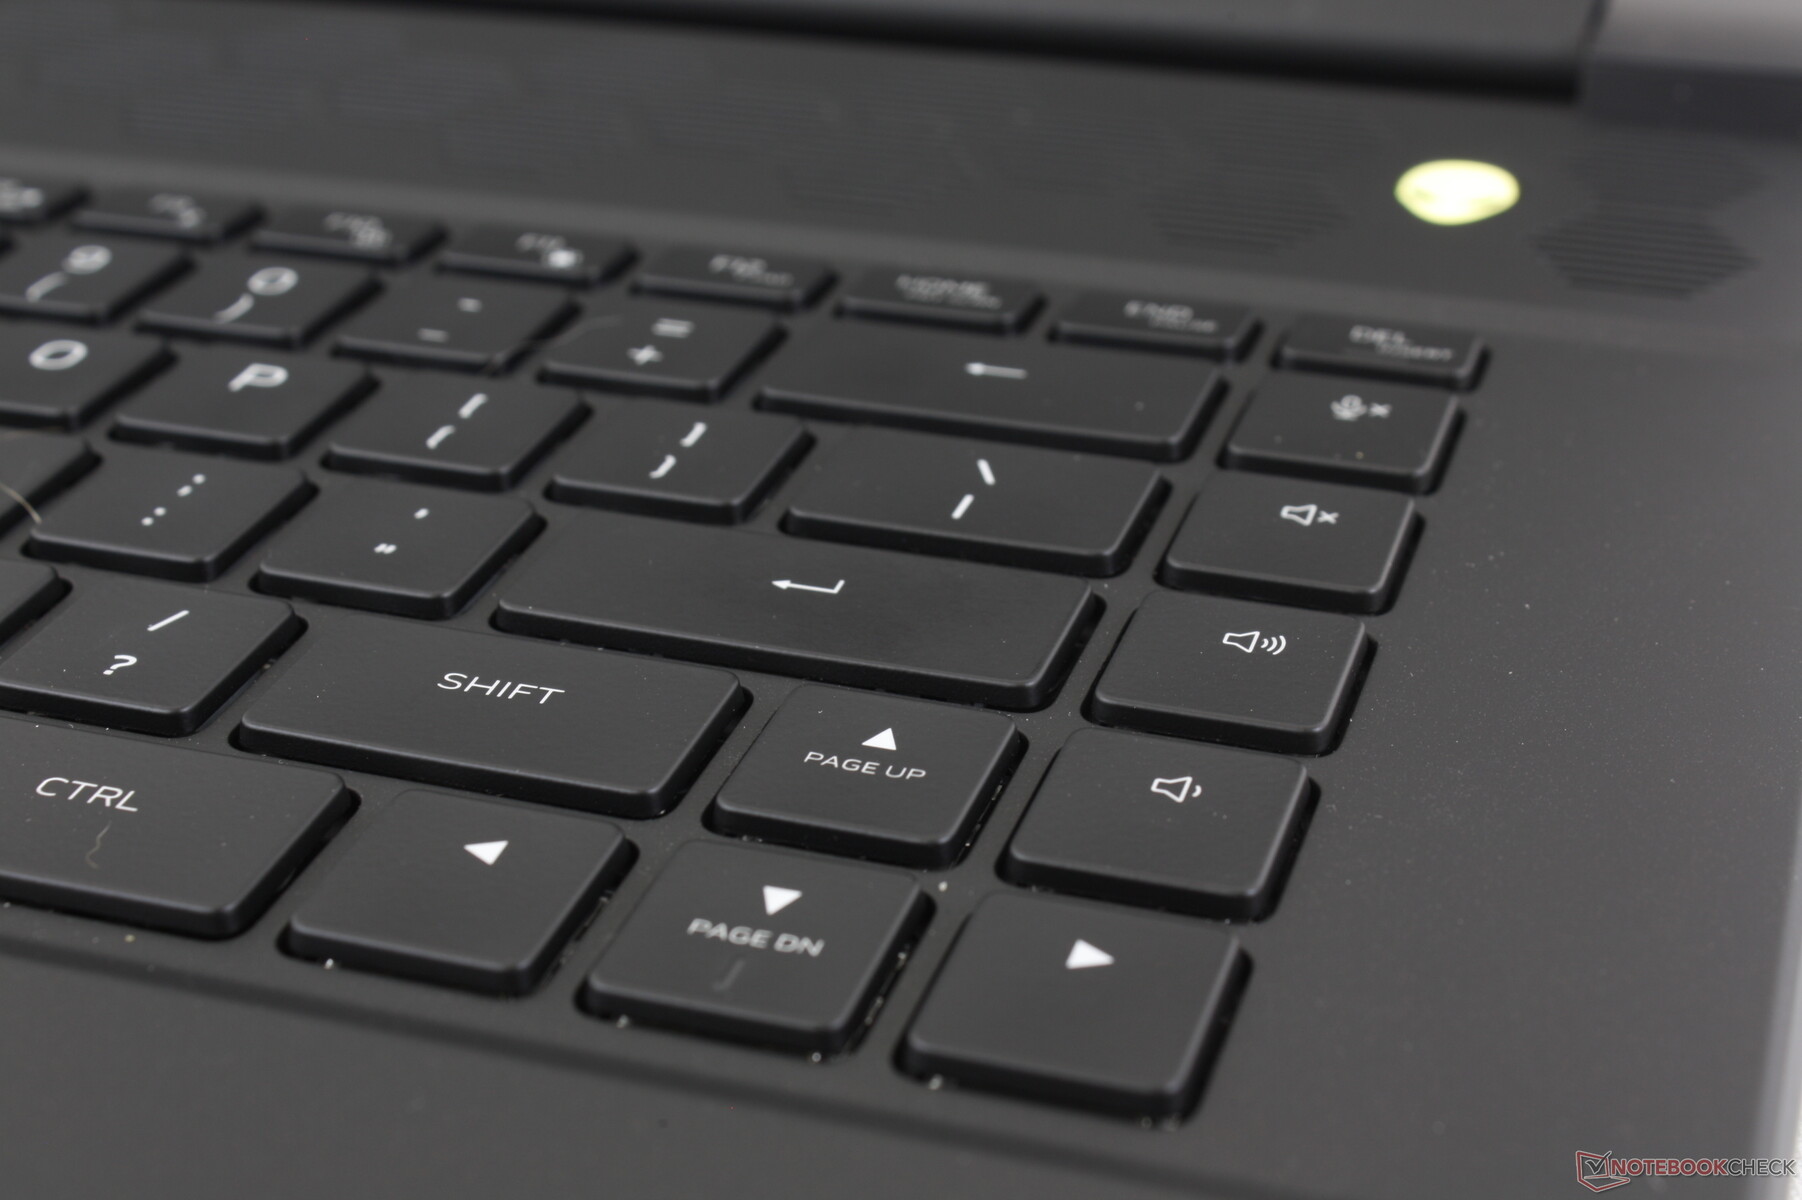
Os usuários podem configurar com um teclado padrão baseado em membrana ou com um teclado mecânico CherryMX de perfil ultrabaixo com iluminação RGB por tecla. O teclado CherryMX foi introduzido há alguns anos no Alienware x17 R1 e continua sendo um dos nossos teclados favoritos em qualquer laptop para jogos, devido ao seu feedback de clique e deslocamento profundo. A principal desvantagem, é claro, é o ruído agudo e muito alto. Talvez seja melhor considerar a opção de teclado padrão para ambientes sensíveis a ruídos, como bibliotecas, salas de aula ou dormitórios.
A luz de fundo ilumina todas as teclas e símbolos, o que não acontecia nos modelos mais antigos não acontecia nos modelos mais antigos.
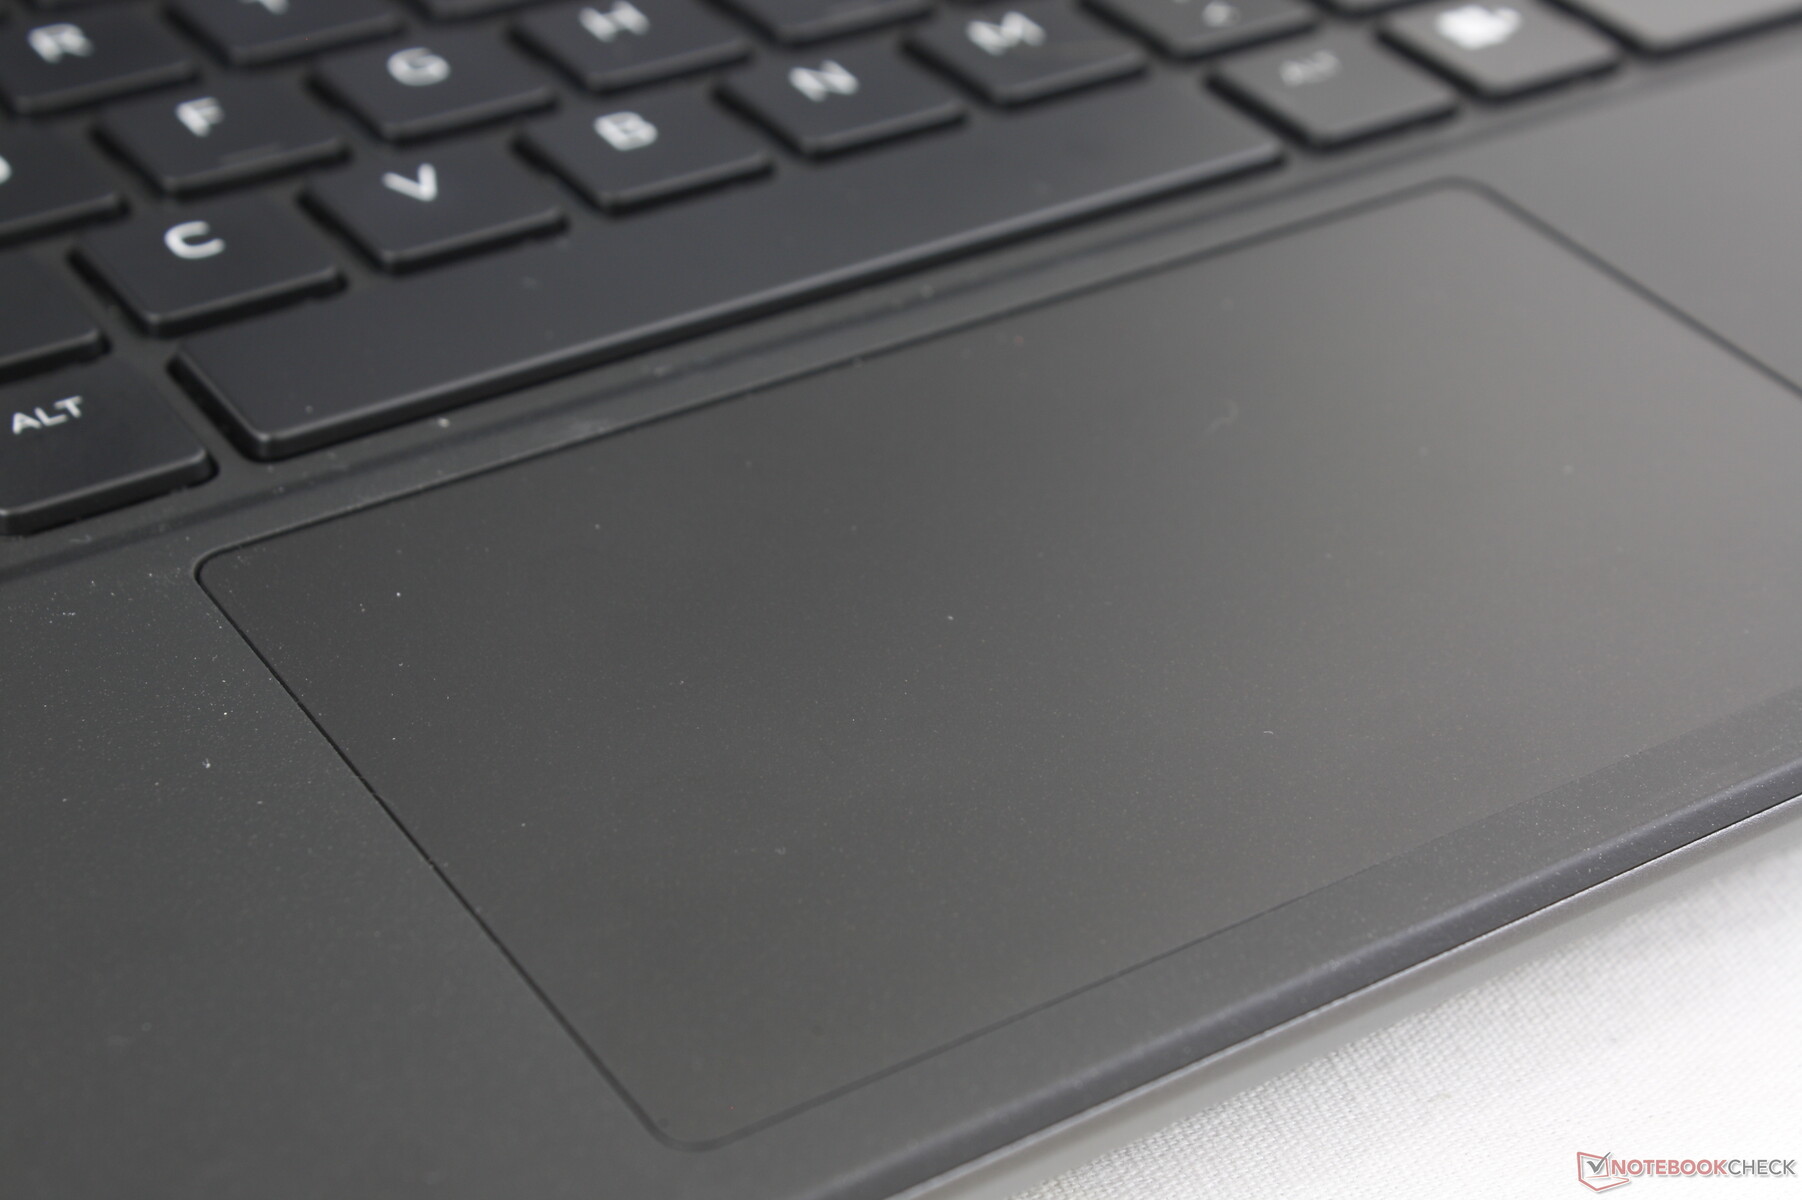
Touchpad
O clickpad é relativamente pequeno (11,3 x 6,6 cm), pois a maior parte da plataforma do teclado é ocupada pelas grandes grades de ventilação. Os teclados do HP Omen Transcend 16 e do Razer Blade 16, por exemplo, são mais espaçosos, com 12,5 x 8 cm e 17 x 9,7 cm, respectivamente. A tração é suave e o feedback é firme e com cliques quando pressionado, apesar da área de superfície apertada.
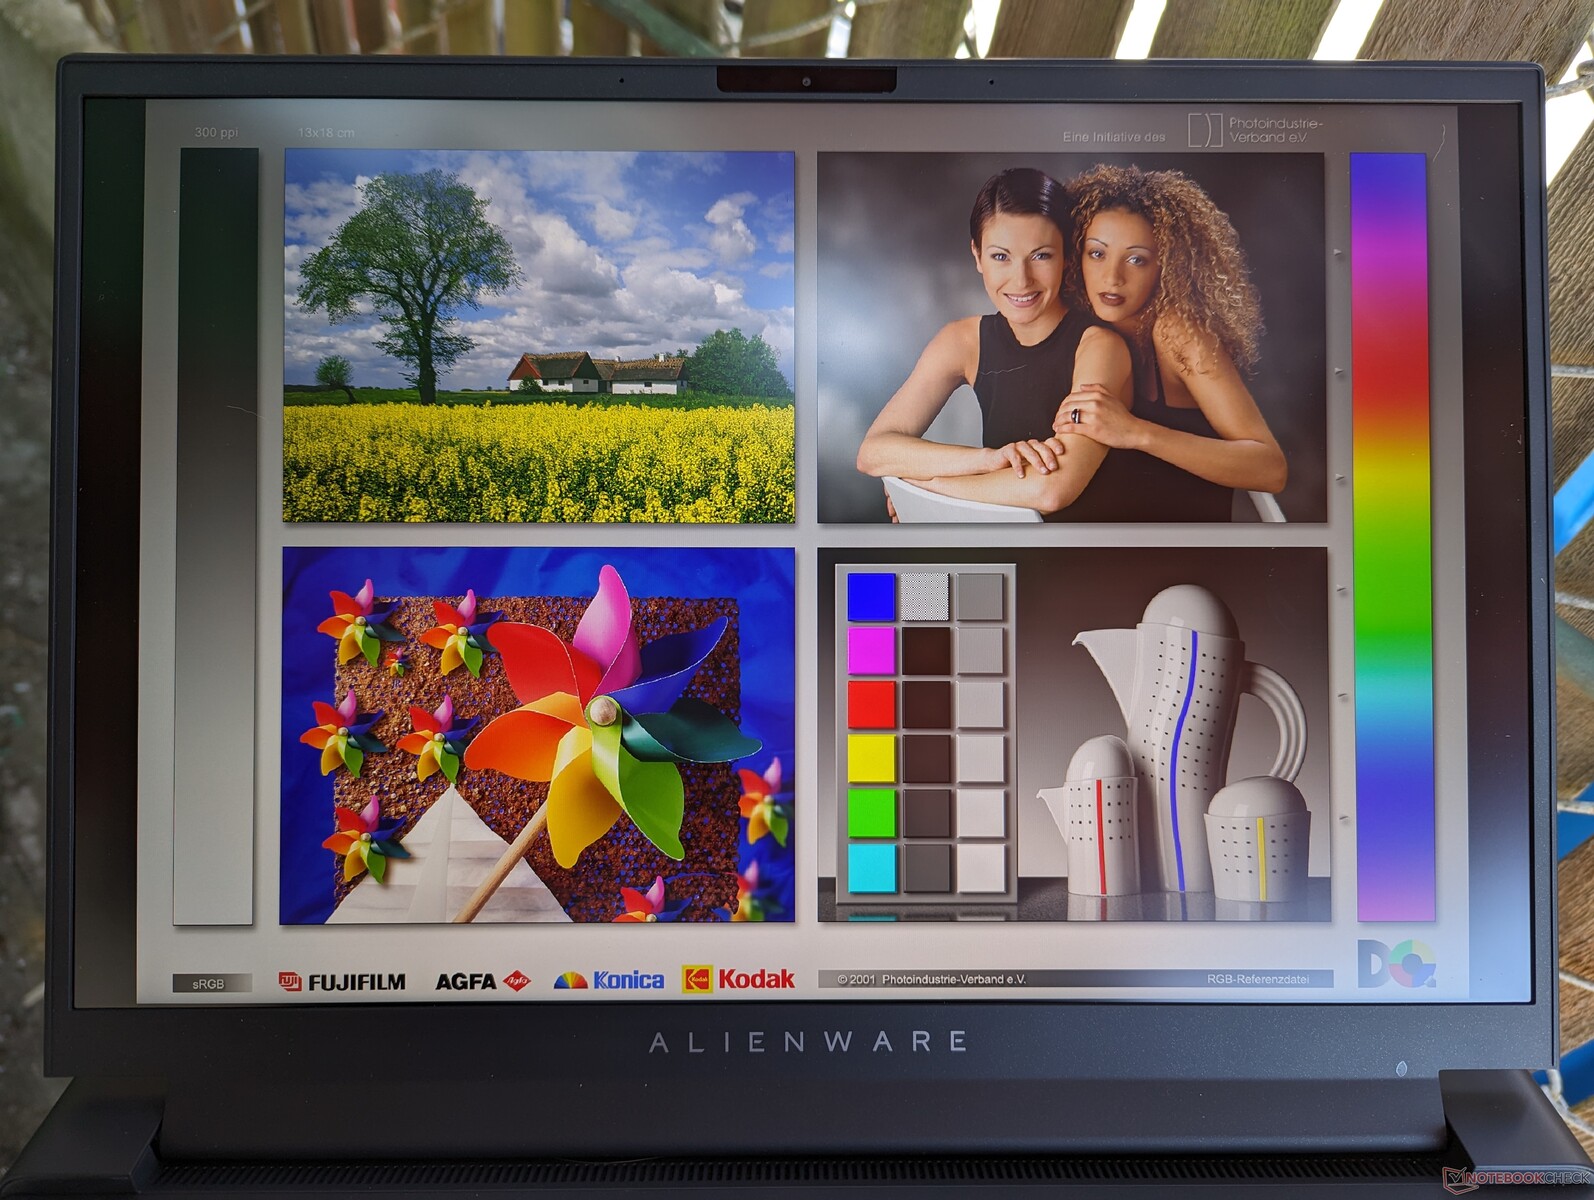
Tela
Há três opções de exibição disponíveis, como segue:
- 2560 x 1600, 165 Hz, 3 ms, IPS, 100% sRGB
- 2560 x 1600, 240 Hz, 3 ms, IPS, 100% DCI-P3
- 1920 x 1200, 480 Hz, 3 ms, IPS, 100% DCI-P3
Nossa unidade está configurada com a opção em negrito acima, que acreditamos ser o ponto ideal para o modelo, pois oferece cores P3 completas, taxas de atualização rápidas e uma alta resolução completa. A opção 1200p oferece taxas de atualização ainda mais rápidas, mas os benefícios se tornam cada vez mais marginais após 240 Hz.
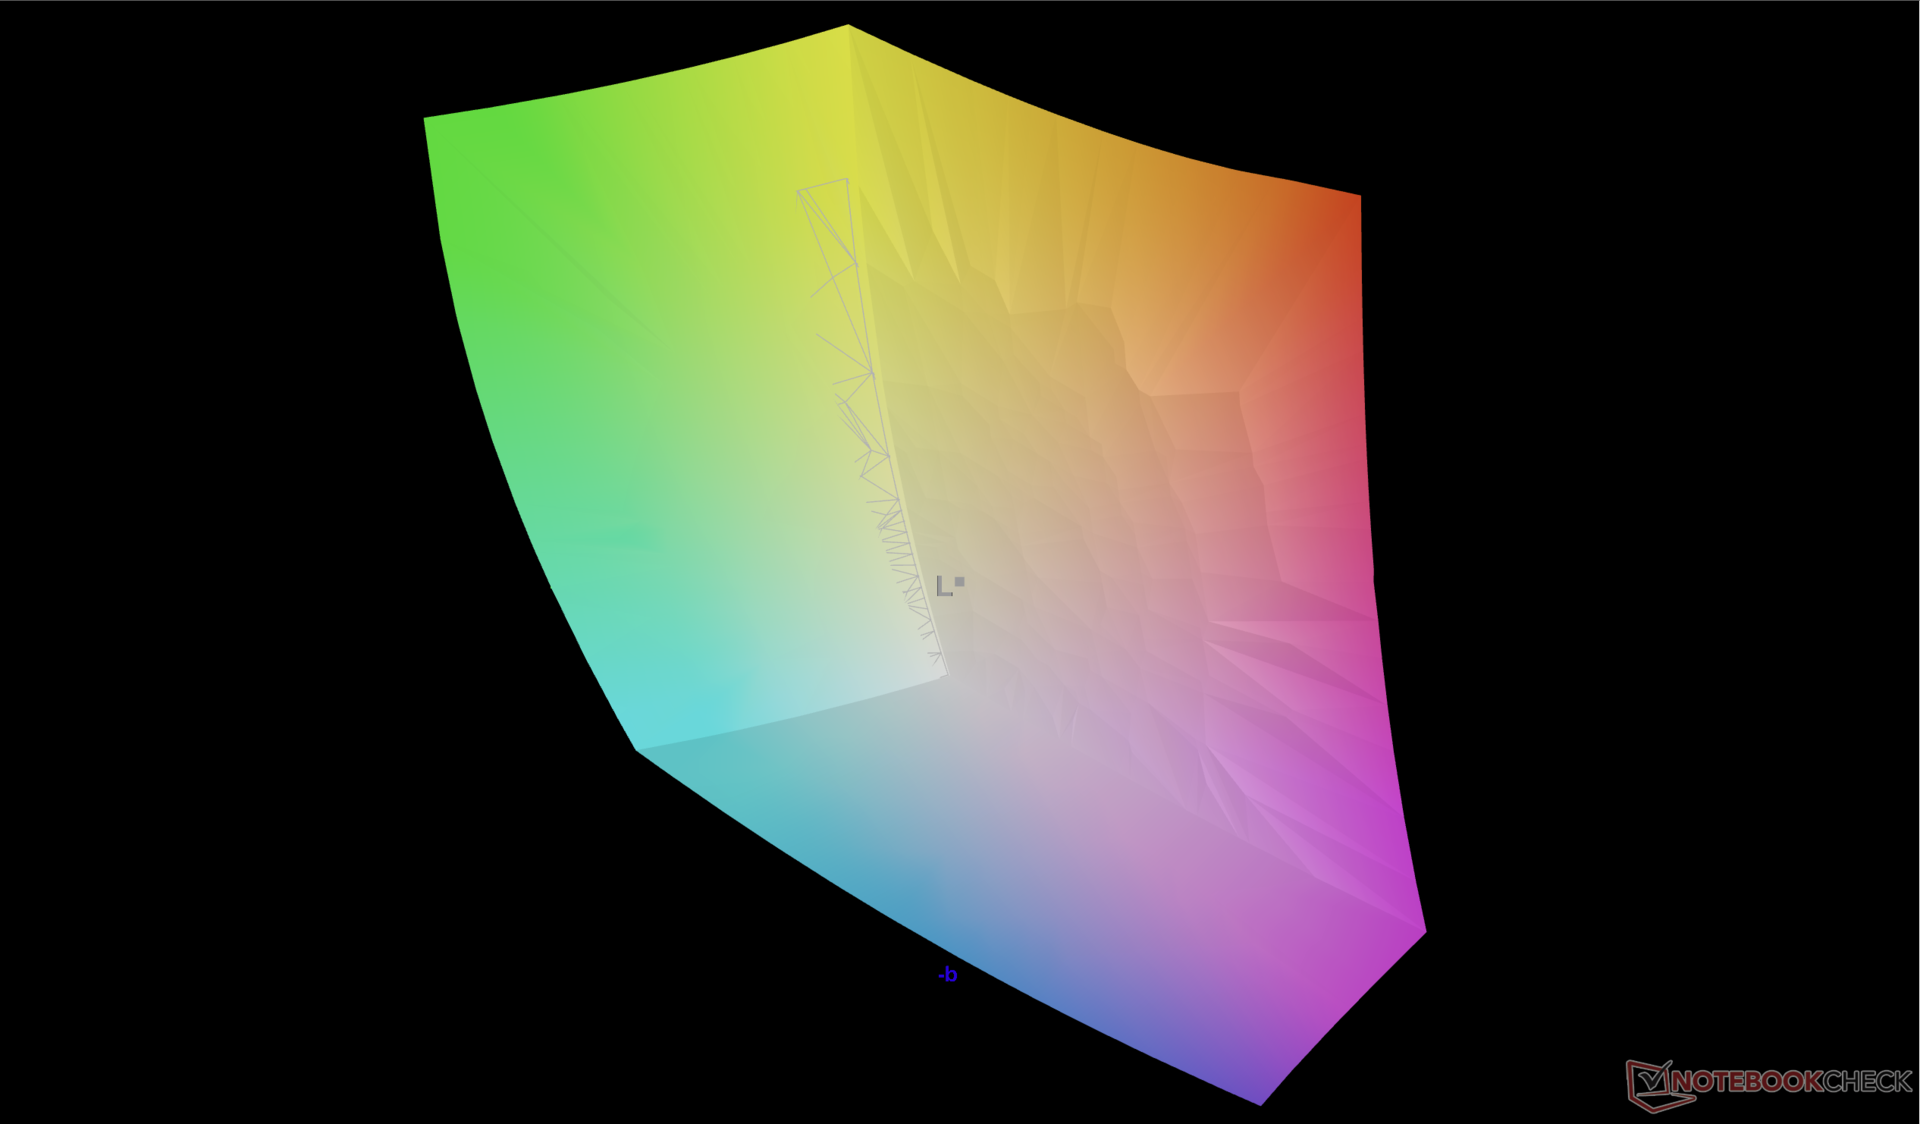
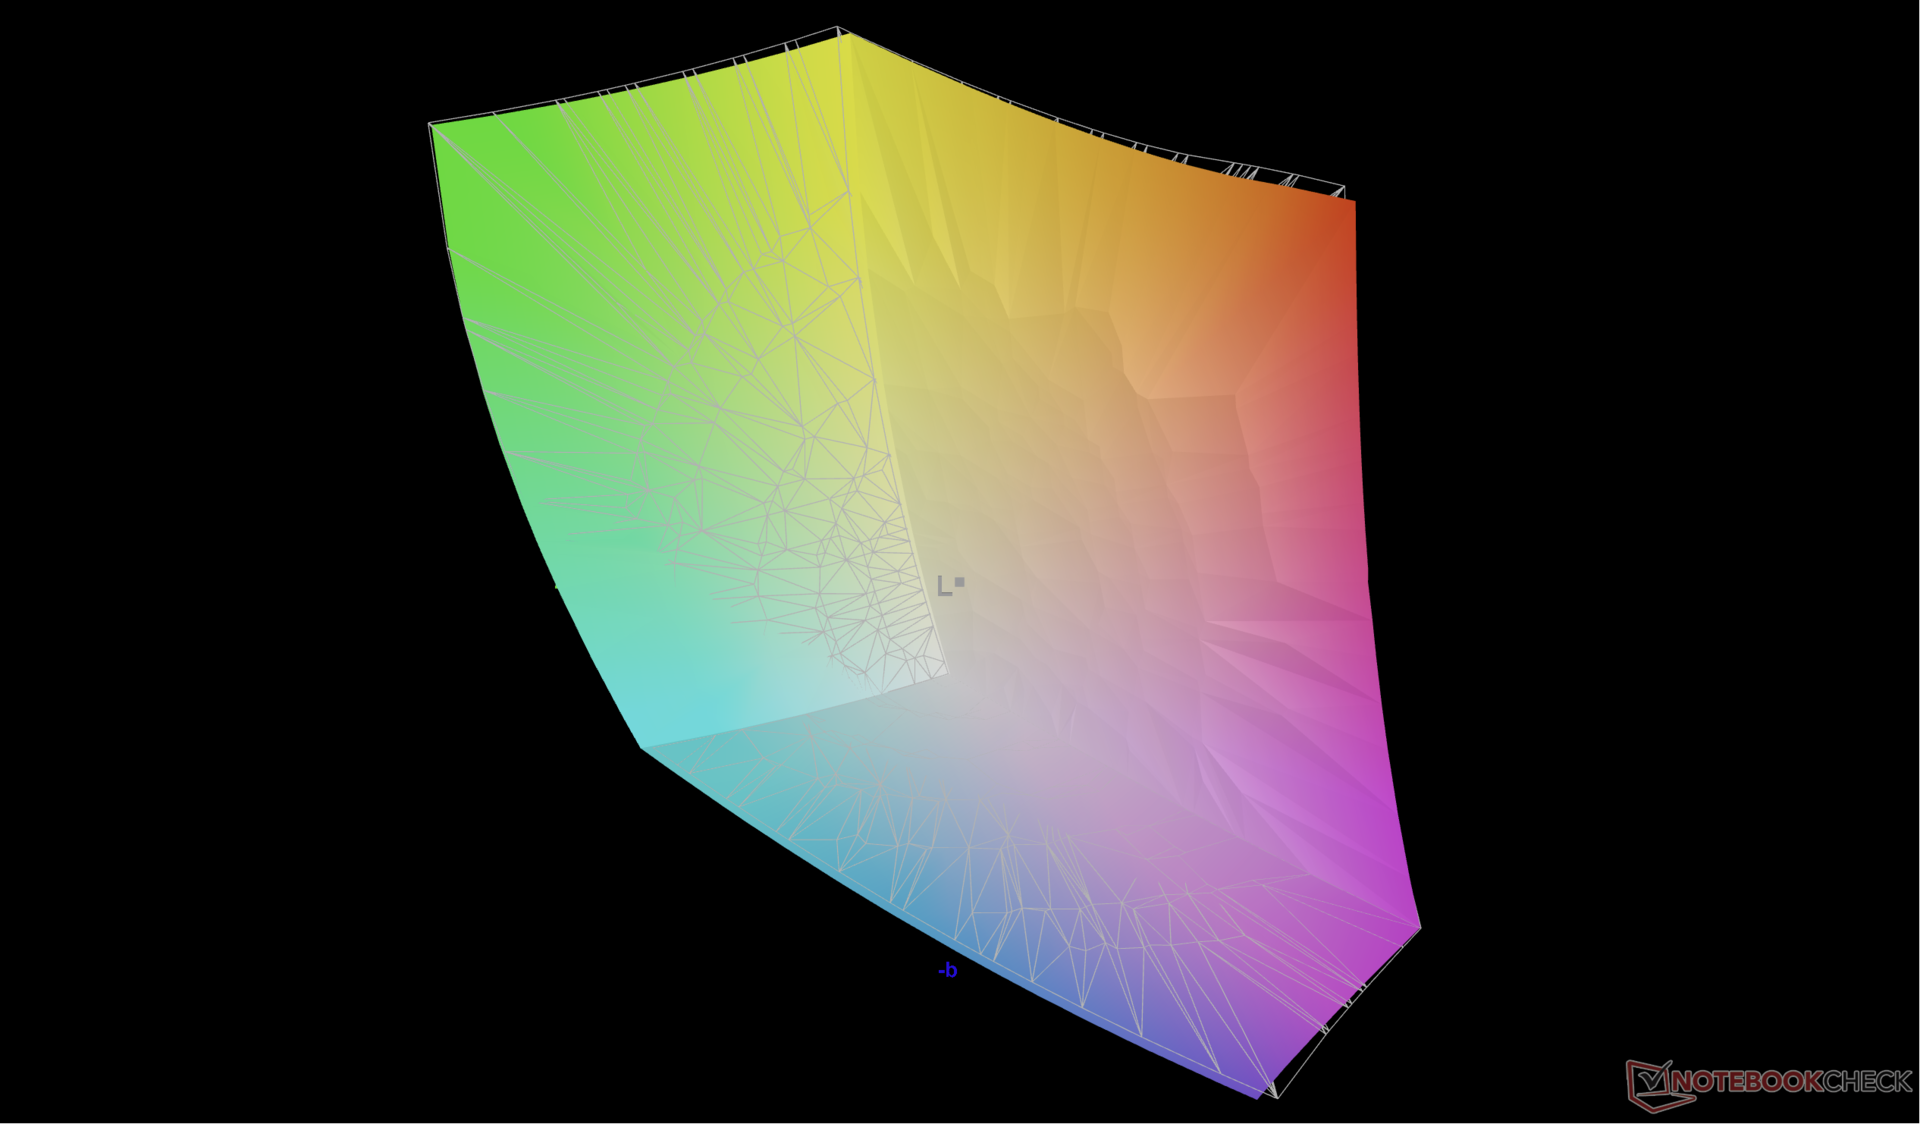
O Alienware m16 R1 utiliza o mesmo painel BOE NE16NZ4 encontrado noAlienware x16 R1 e, portanto, a experiência de visualização é essencialmente idêntica entre os dois modelos. Esse painel de última geração é adequado para jogos e criação de conteúdo com cores mais amplas do que o painel MNG007DA2-3 do Legion Pro 7. No entanto, as telas do Razer Blade 16 Early 2023 ou do HP Omen Transcend 16 são visivelmente mais brilhantes, o que pode ser útil para conteúdo HDR.

| |||||||||||||||||||||||||
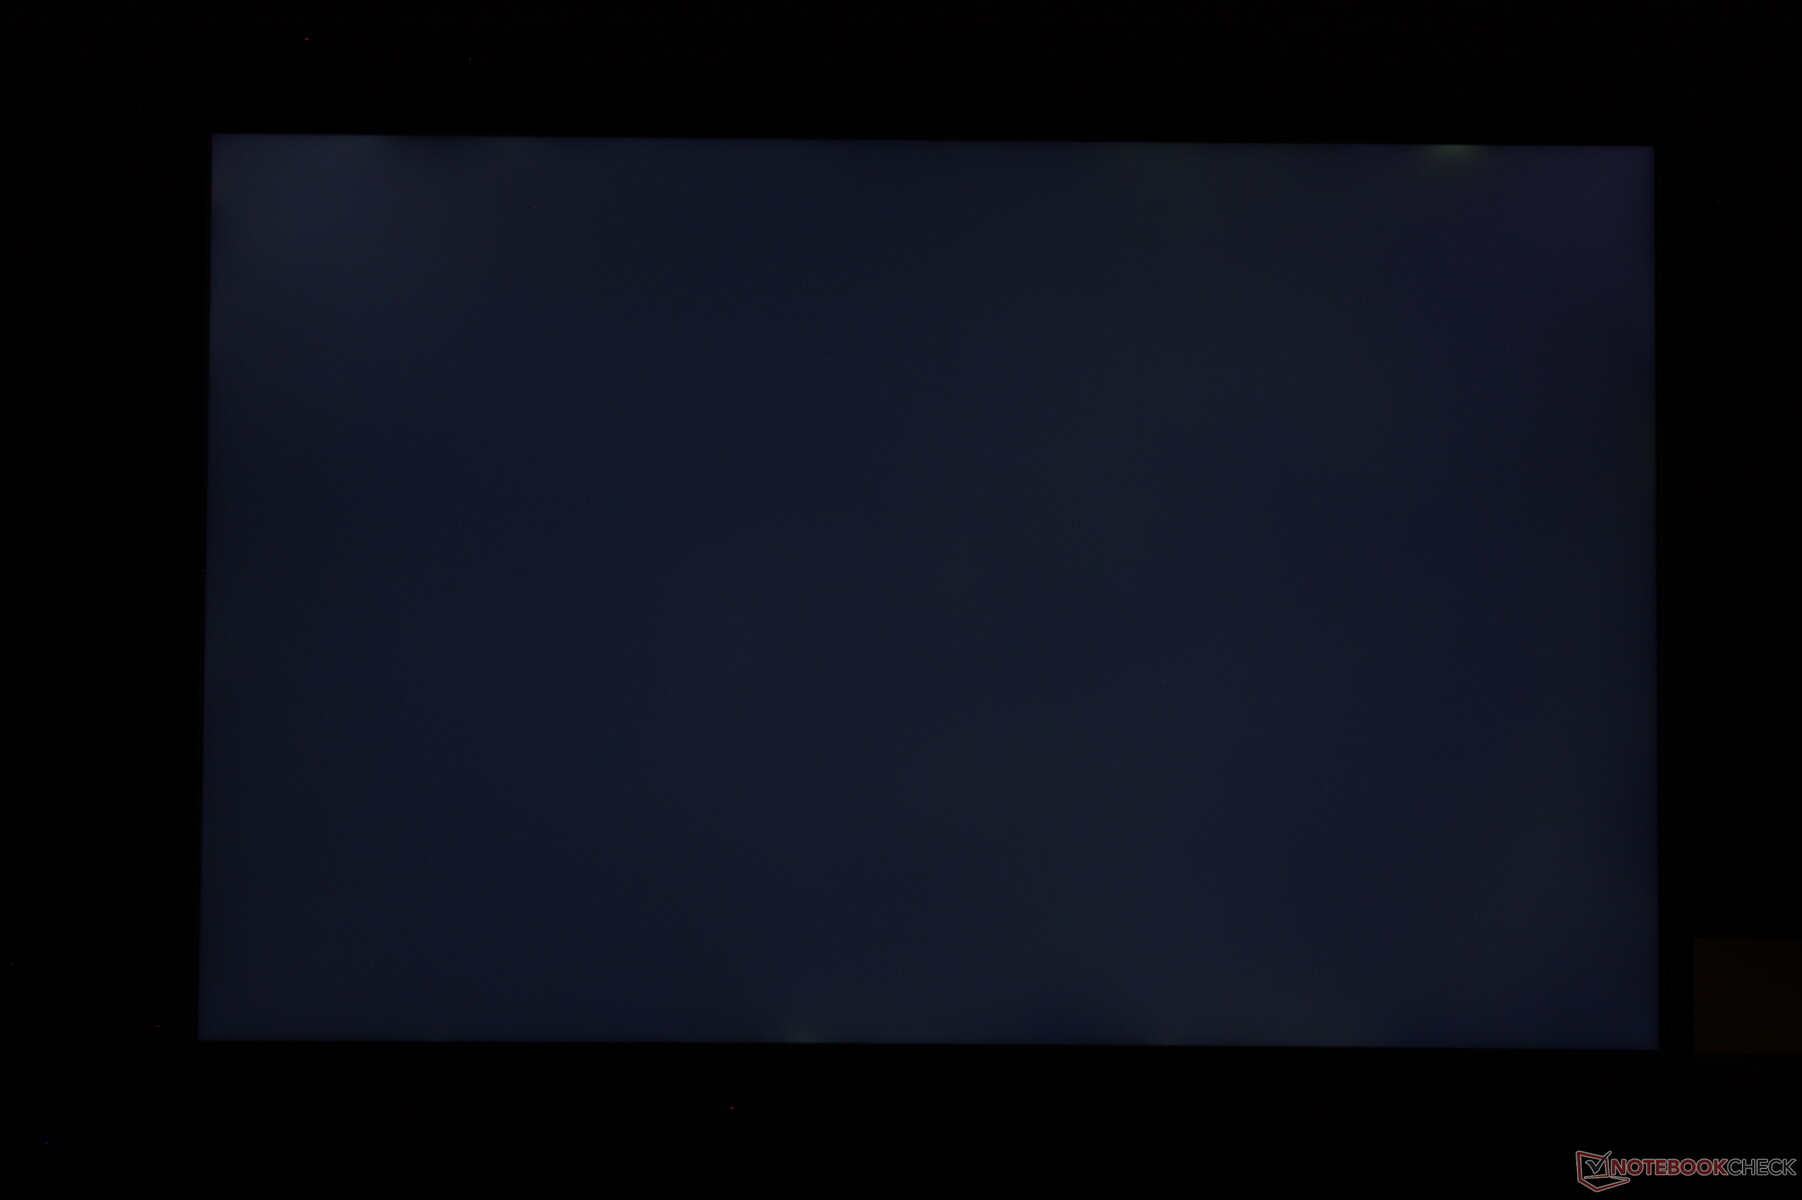
iluminação: 89 %
iluminação com acumulador: 329 cd/m²
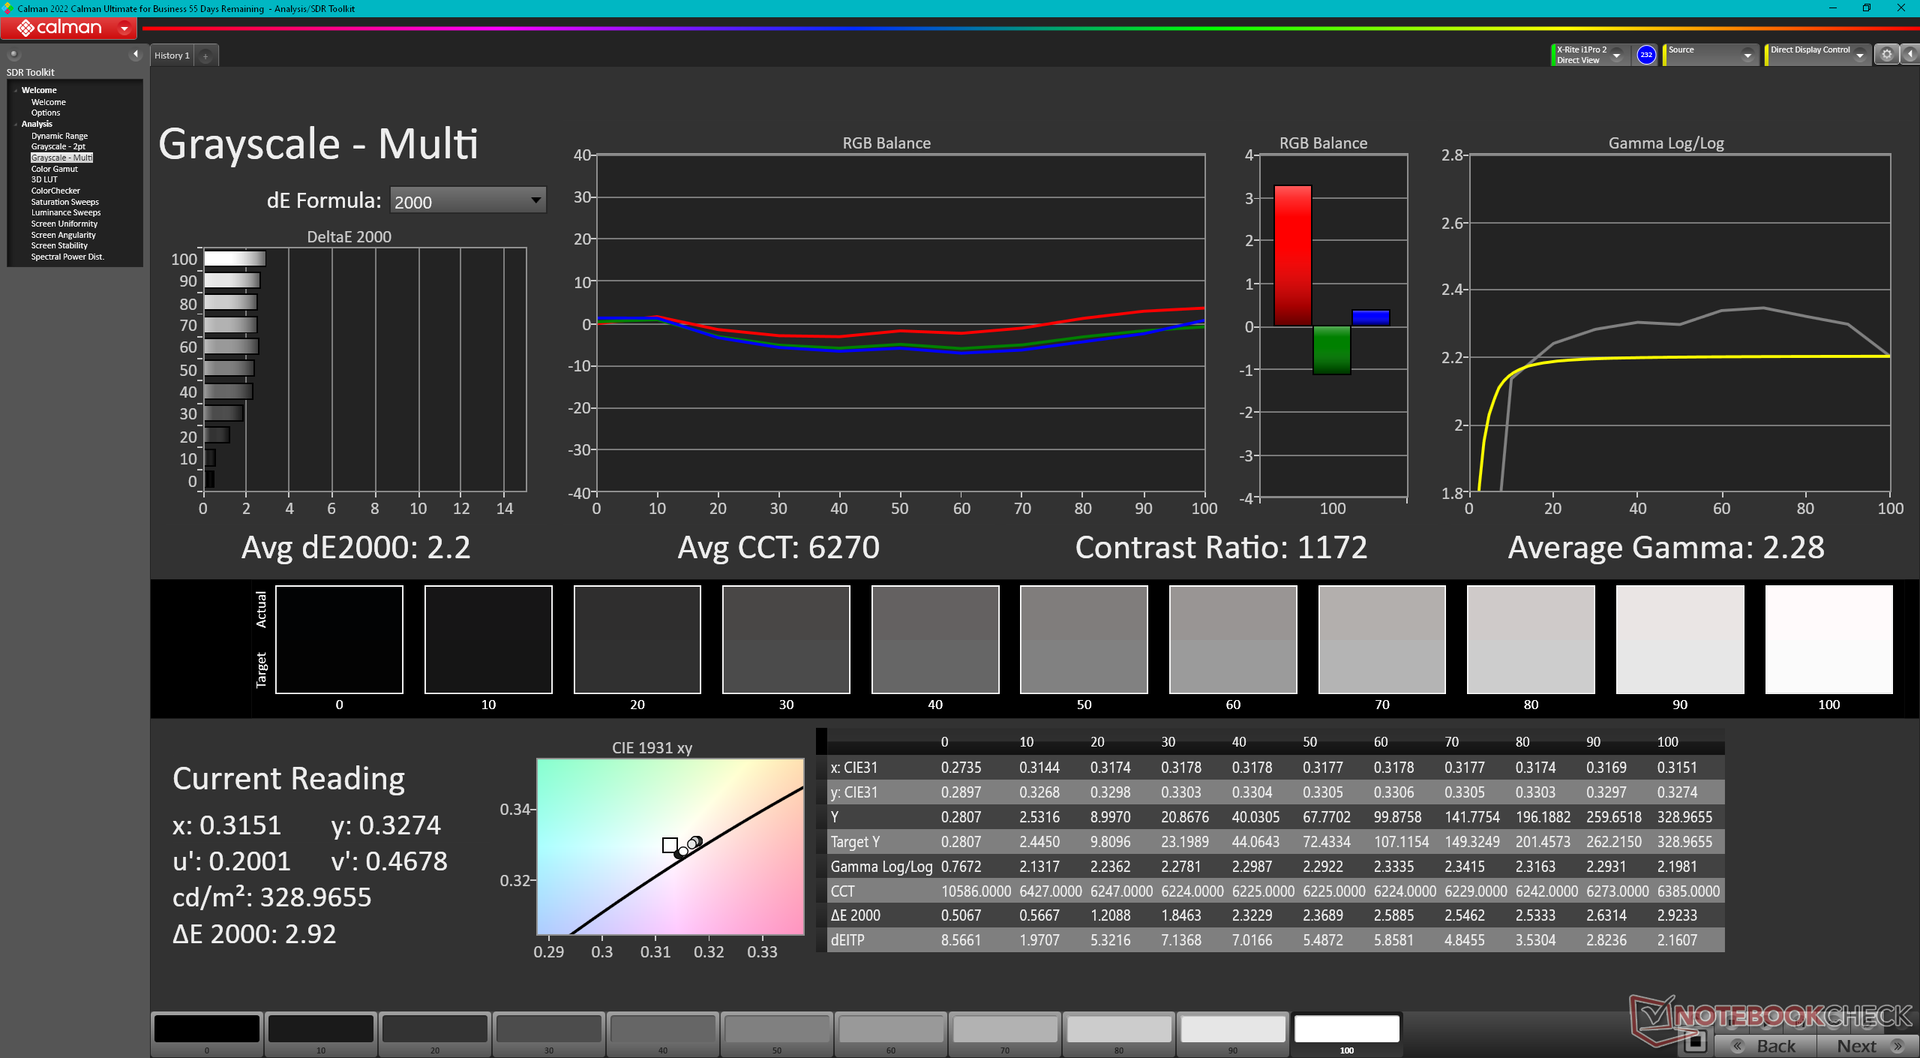
Contraste: 1028:1 (Preto: 0.32 cd/m²)
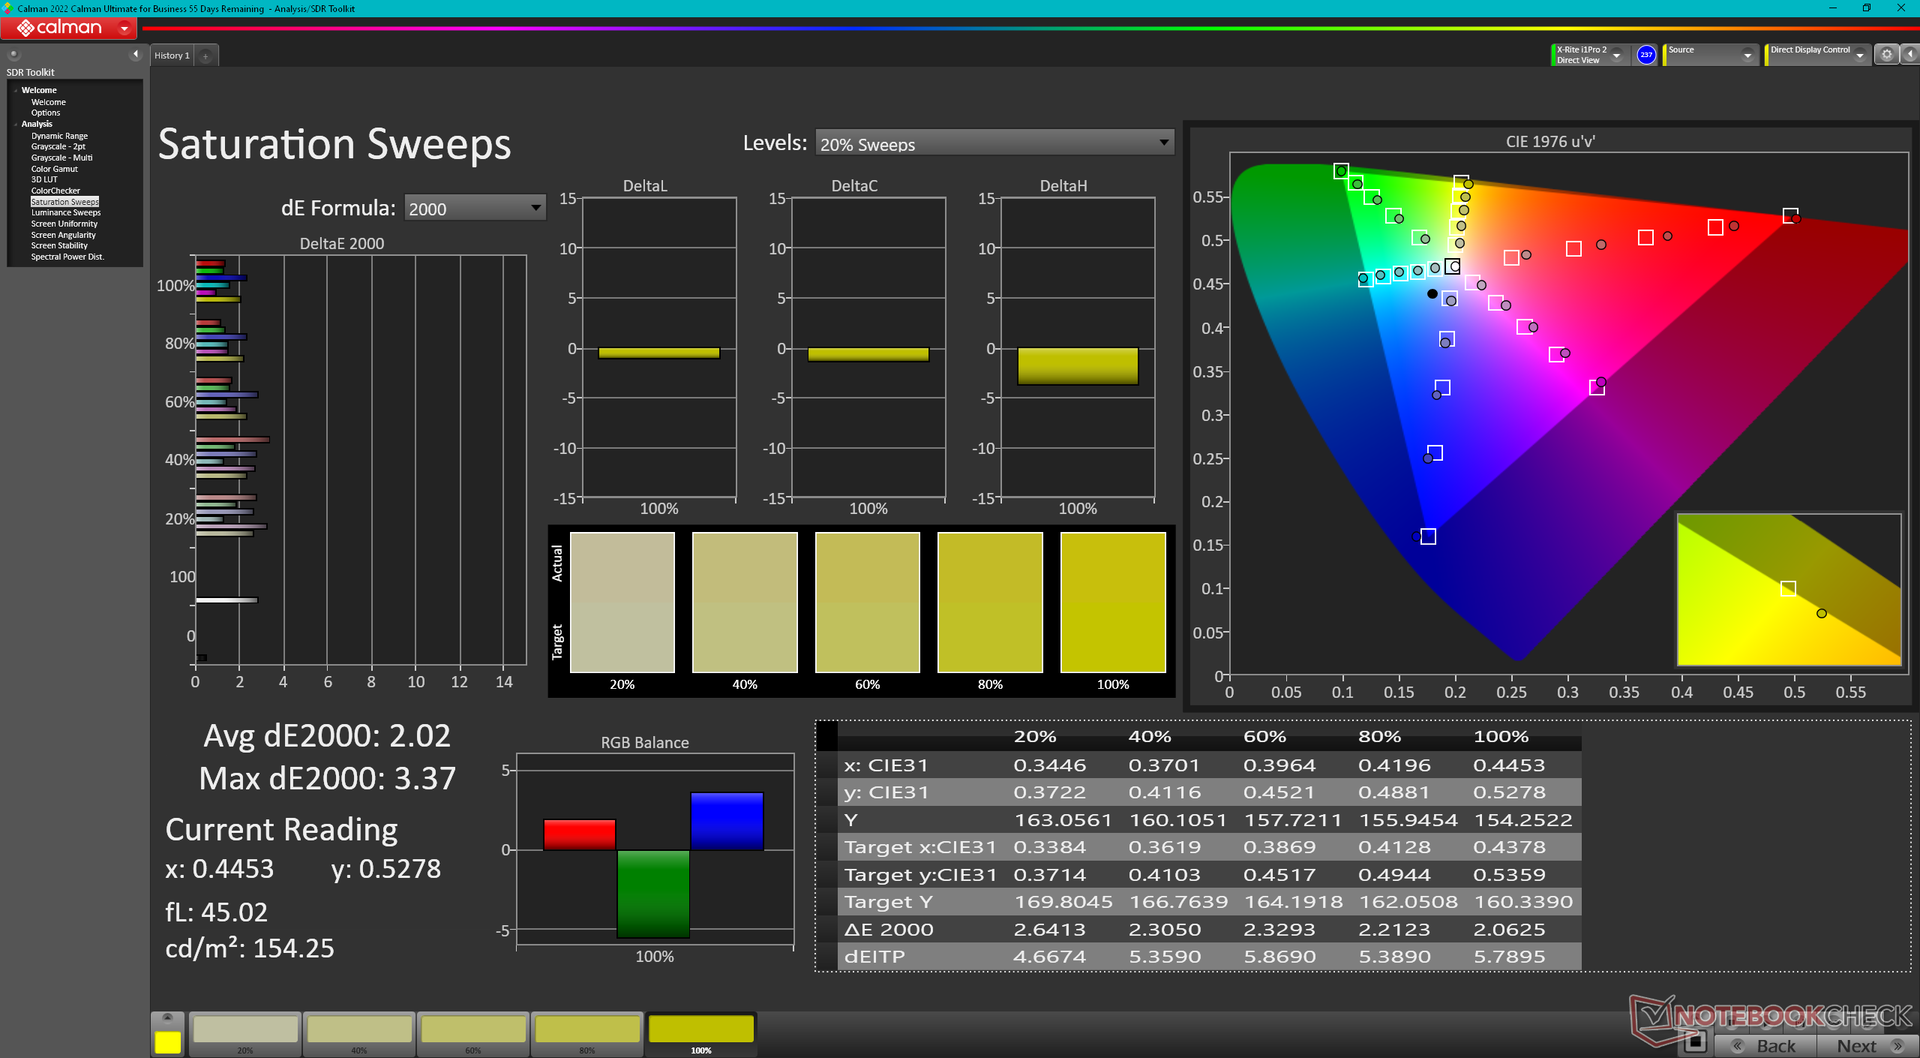
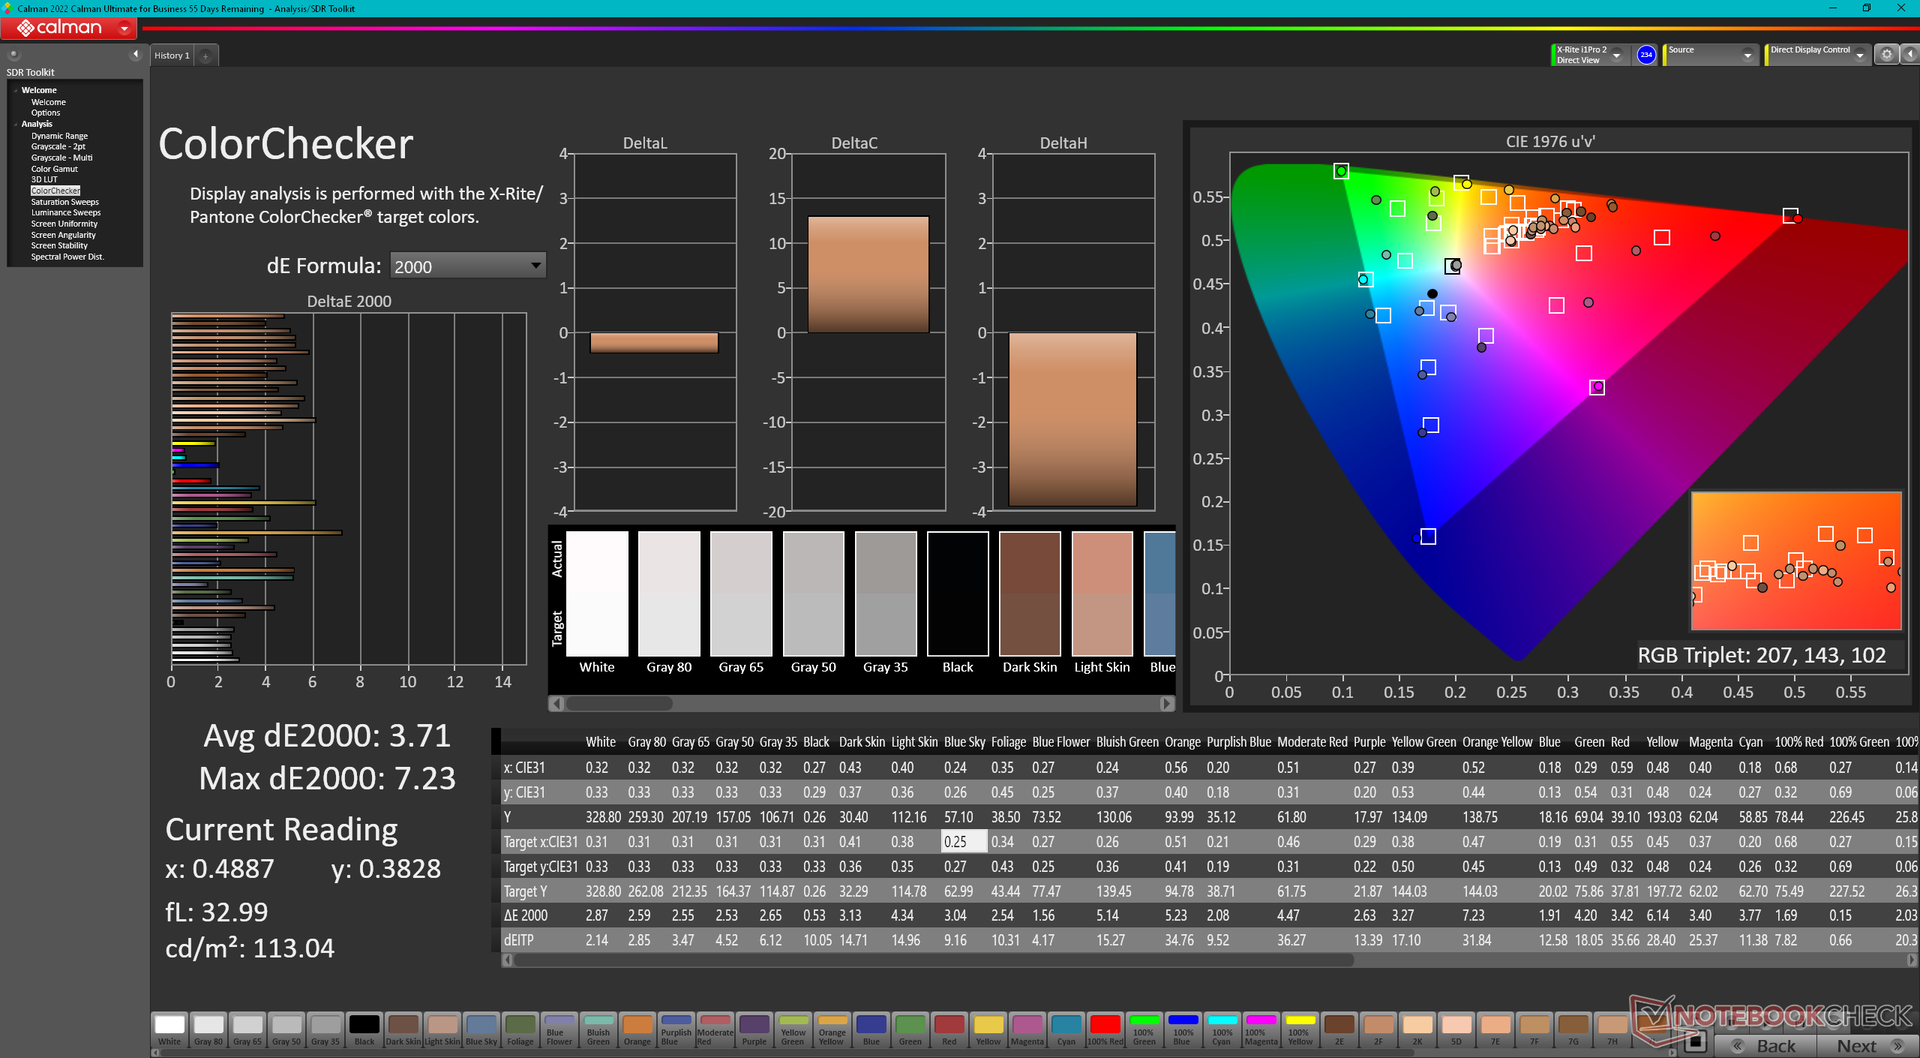
ΔE ColorChecker Calman: 3.71 | ∀{0.5-29.43 Ø4.71}
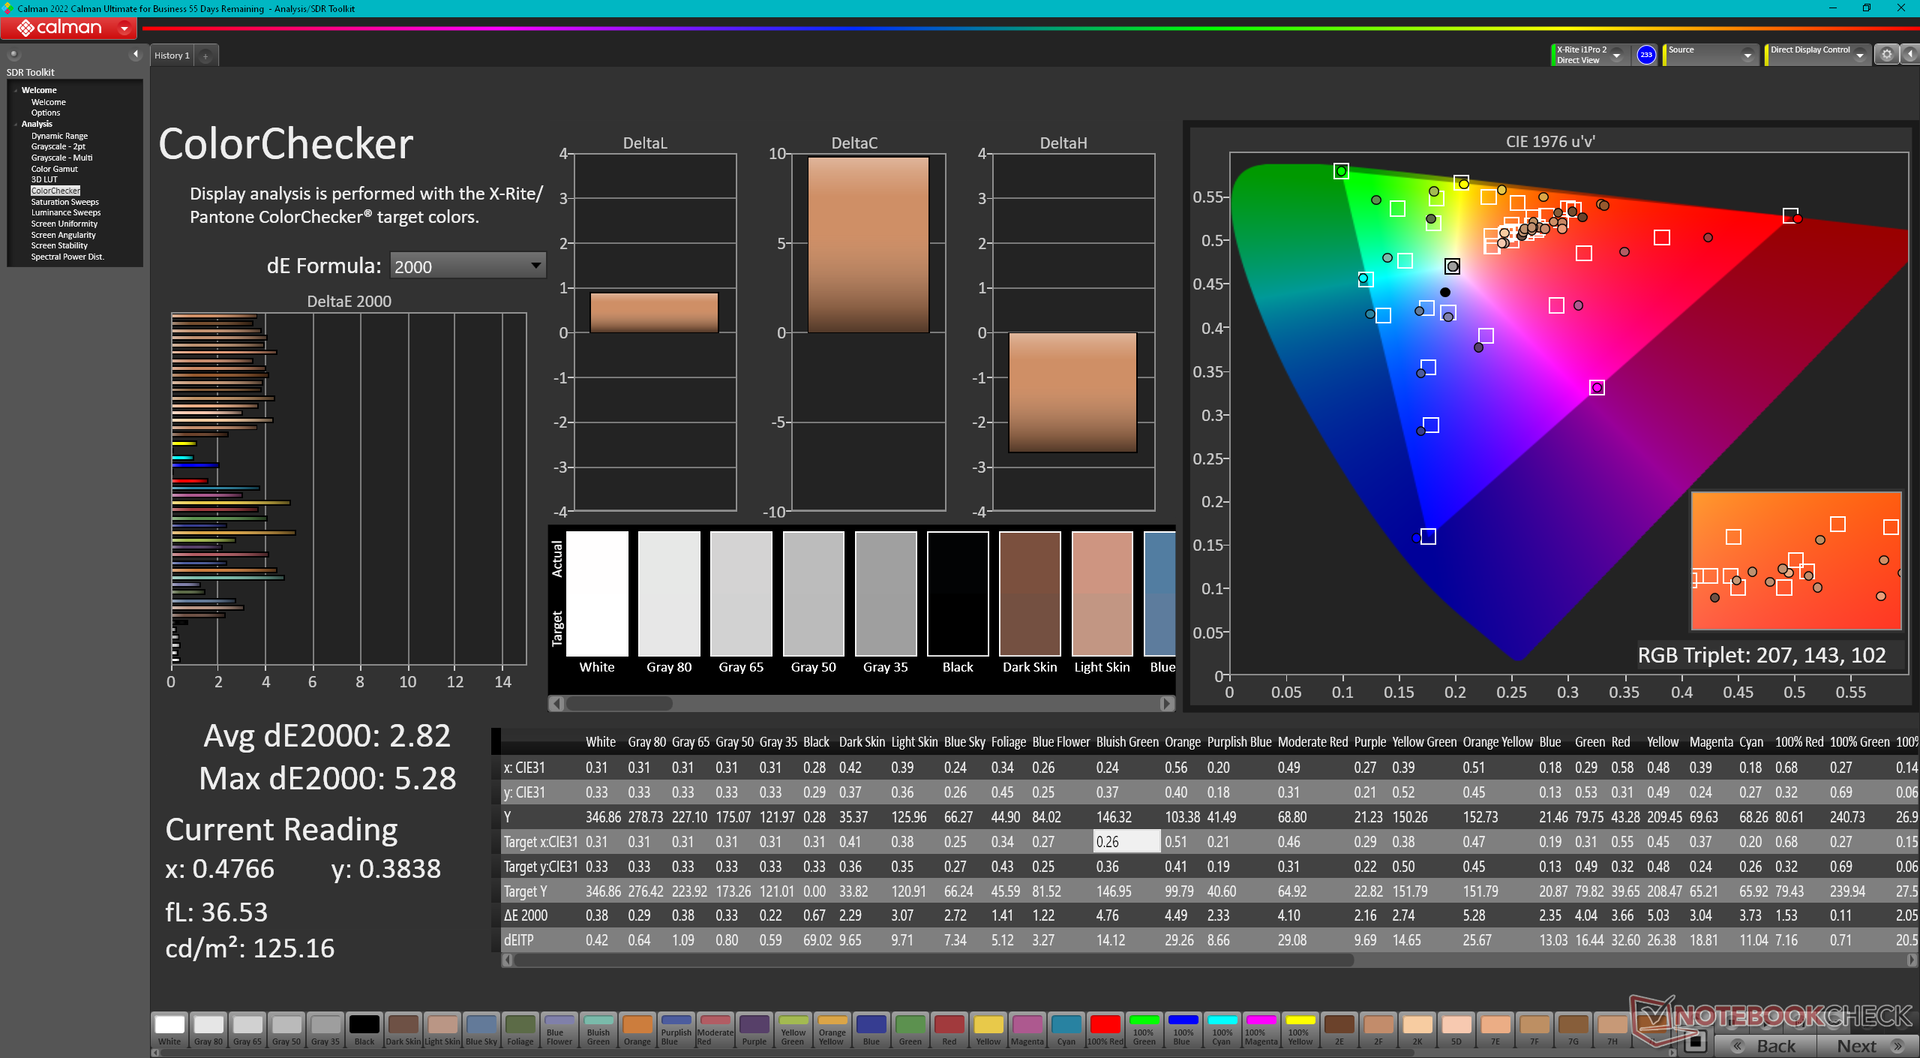
calibrated: 2.82
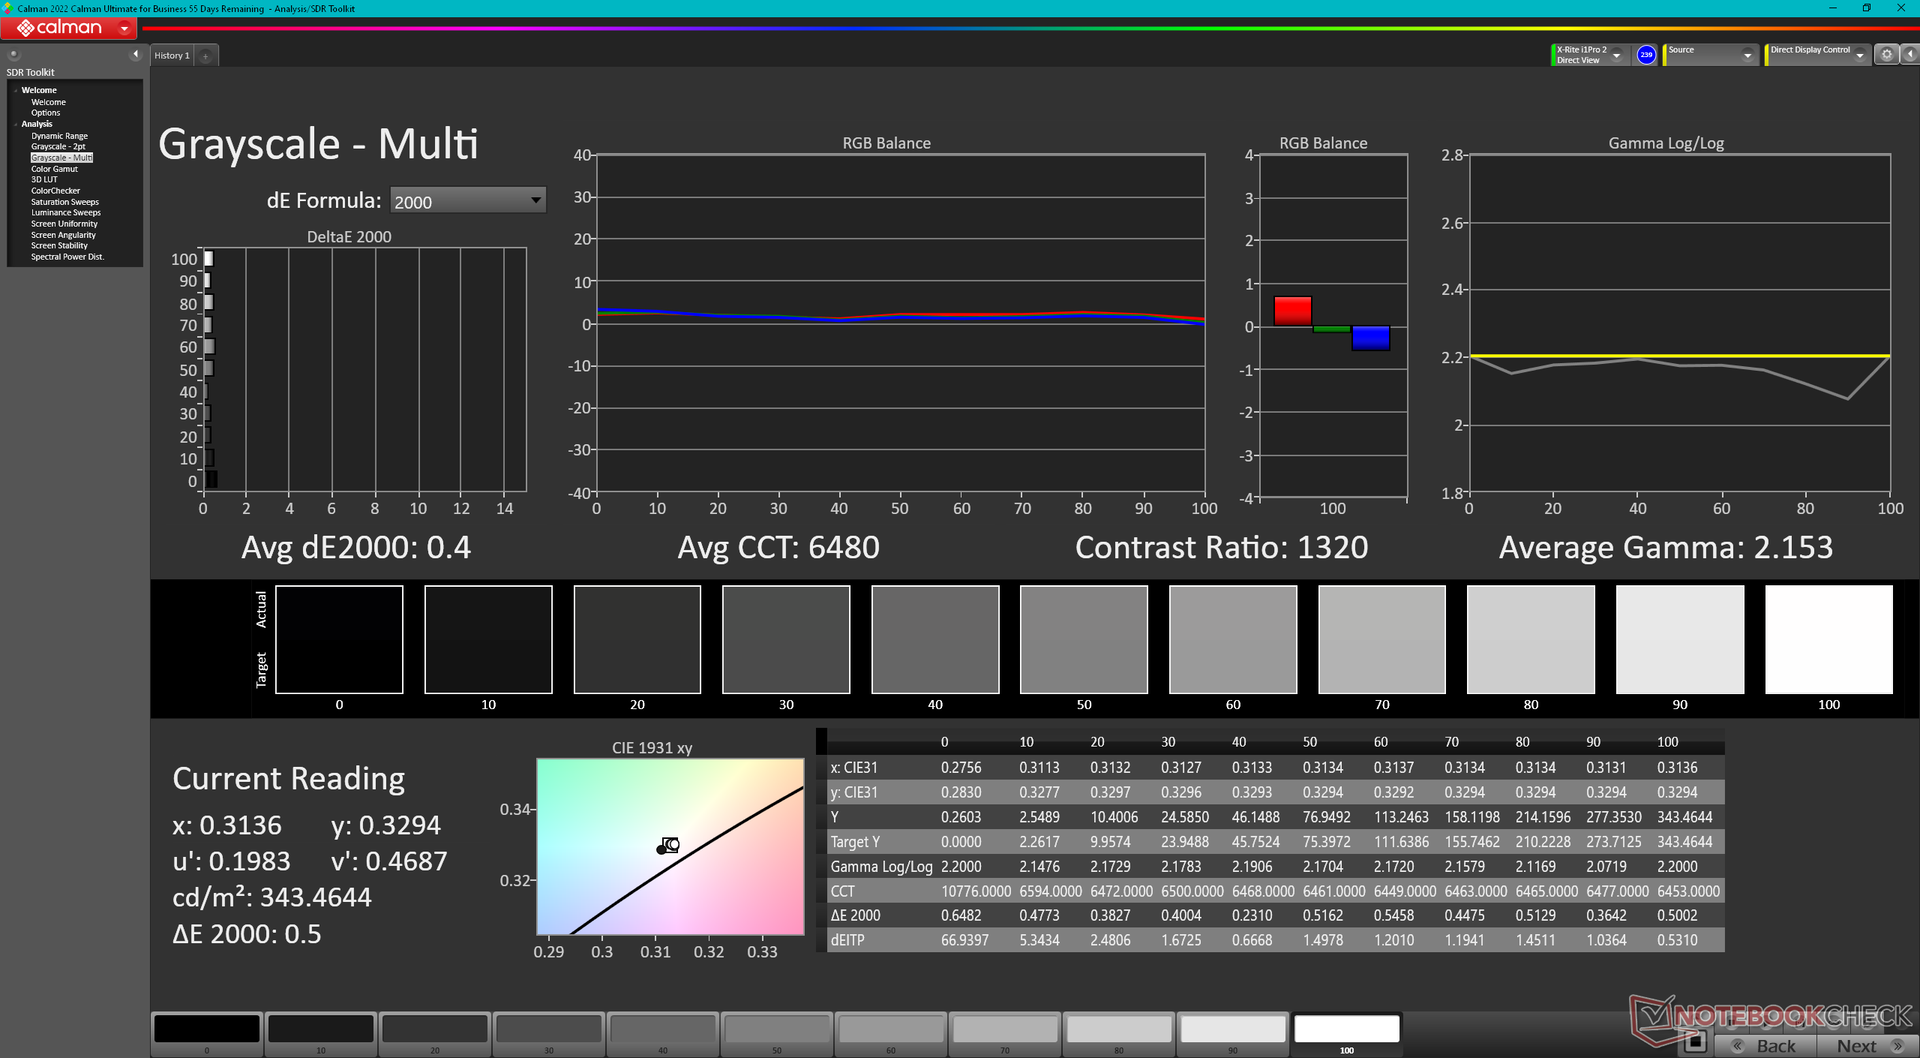
ΔE Greyscale Calman: 2.2 | ∀{0.09-98 Ø4.96}
88.9% AdobeRGB 1998 (Argyll 3D)
99.9% sRGB (Argyll 3D)
98.6% Display P3 (Argyll 3D)
Gamma: 2.3
CCT: 6270 K
| Alienware m16 R1 AMD BOE NE16NZ4, IPS, 2560x1600, 16" | Alienware x16 R1 BOE NE16NZ4, IPS, 2560x1600, 16" | HP Omen Transcend 16 AUOA3A6, Mini-LED, 2560x1600, 16" | Lenovo Legion Pro 7 RTX4090 MNG007DA2-3 (CSO1628), IPS, 2560x1600, 16" | Asus ROG Strix G16 G614JZ TL160ADMP03-0, IPS, 2560x1600, 16" | Razer Blade 16 Early 2023 CSOT T3 MNG007DA4-1, IPS, 2560x1600, 16" | |
|---|---|---|---|---|---|---|
| Display | 0% | 0% | -16% | -2% | 0% | |
| Display P3 Coverage (%) | 98.6 | 99.2 1% | 99.2 1% | 69.5 -30% | 97 -2% | 98.5 0% |
| sRGB Coverage (%) | 99.9 | 100 0% | 100 0% | 99.8 0% | 99.9 0% | 100 0% |
| AdobeRGB 1998 Coverage (%) | 88.9 | 88.6 0% | 87.6 -1% | 71.6 -19% | 84.9 -4% | 89.7 1% |
| Response Times | -7% | -316% | -33% | 14% | -31% | |
| Response Time Grey 50% / Grey 80% * (ms) | 5.1 ? | 5.1 ? -0% | 26.4 ? -418% | 10.9 ? -114% | 5.1 ? -0% | 6.6 ? -29% |
| Response Time Black / White * (ms) | 9 ? | 10.3 ? -14% | 28.2 ? -213% | 4.6 ? 49% | 6.6 ? 27% | 12 ? -33% |
| PWM Frequency (Hz) | 3506 ? | |||||
| Screen | 18% | 224% | 23% | 23% | 18% | |
| Brightness middle (cd/m²) | 329 | 302.2 -8% | 791.1 140% | 491 49% | 470 43% | 456.8 39% |
| Brightness (cd/m²) | 317 | 285 -10% | 800 152% | 472 49% | 459 45% | 437 38% |
| Brightness Distribution (%) | 89 | 89 0% | 95 7% | 91 2% | 93 4% | 83 -7% |
| Black Level * (cd/m²) | 0.32 | 0.26 19% | 0.04 87% | 0.4 -25% | 0.42 -31% | 0.35 -9% |
| Contrast (:1) | 1028 | 1162 13% | 19778 1824% | 1228 19% | 1119 9% | 1305 27% |
| Colorchecker dE 2000 * | 3.71 | 1.63 56% | 4.37 -18% | 1.6 57% | 1.86 50% | 3.7 -0% |
| Colorchecker dE 2000 max. * | 7.23 | 4.13 43% | 10.39 -44% | 5.15 29% | 3.87 46% | 6.42 11% |
| Colorchecker dE 2000 calibrated * | 2.82 | 1.17 59% | 1.04 63% | 0.97 66% | 0.93 67% | 0.66 77% |
| Greyscale dE 2000 * | 2.2 | 2.5 -14% | 6.5 -195% | 3 -36% | 2.7 -23% | 2.6 -18% |
| Gamma | 2.3 96% | 2.23 99% | 2.28 96% | 2.211 100% | 2.246 98% | 2.3 96% |
| CCT | 6270 104% | 6590 99% | 6000 108% | 6979 93% | 6711 97% | 6108 106% |
| Média Total (Programa/Configurações) | 4% /
10% | -31% /
99% | -9% /
7% | 12% /
17% | -4% /
7% |
* ... menor é melhor
A tela é calibrada de forma decente e pronta para uso de acordo com o padrão P3, com valores DeltaE médios de escala de cinza e cor de apenas 2,2 e 3,71, respectivamente. A calibração da tela com um colorímetro X-Rite melhoraria ainda mais a escala de cinza para um deltaE médio de apenas 0,4 para cores mais precisas em geral. Nosso perfil ICM calibrado está disponível para download gratuito acima.
Exibir tempos de resposta
| ↔ Tempo de resposta preto para branco | ||
|---|---|---|
| 9 ms ... ascensão ↗ e queda ↘ combinadas | ↗ 4.8 ms ascensão | 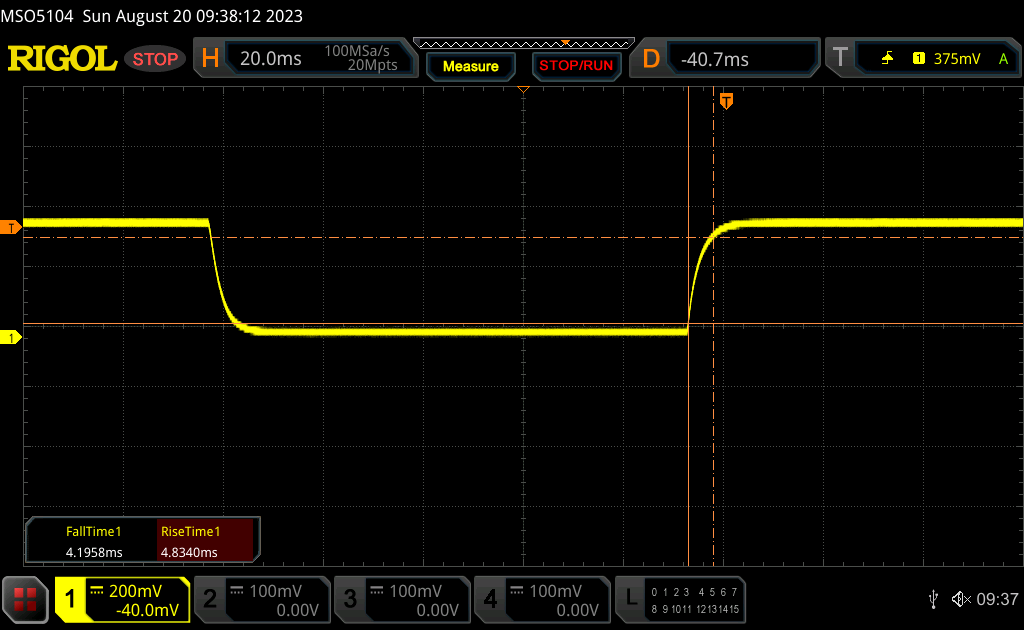 |
| ↘ 4.2 ms queda | ||
| A tela mostra taxas de resposta rápidas em nossos testes e deve ser adequada para jogos. Em comparação, todos os dispositivos testados variam de 0.1 (mínimo) a 240 (máximo) ms. » 25 % de todos os dispositivos são melhores. Isso significa que o tempo de resposta medido é melhor que a média de todos os dispositivos testados (19.8 ms). | ||
| ↔ Tempo de resposta 50% cinza a 80% cinza | ||
| 5.1 ms ... ascensão ↗ e queda ↘ combinadas | ↗ 2.5 ms ascensão | 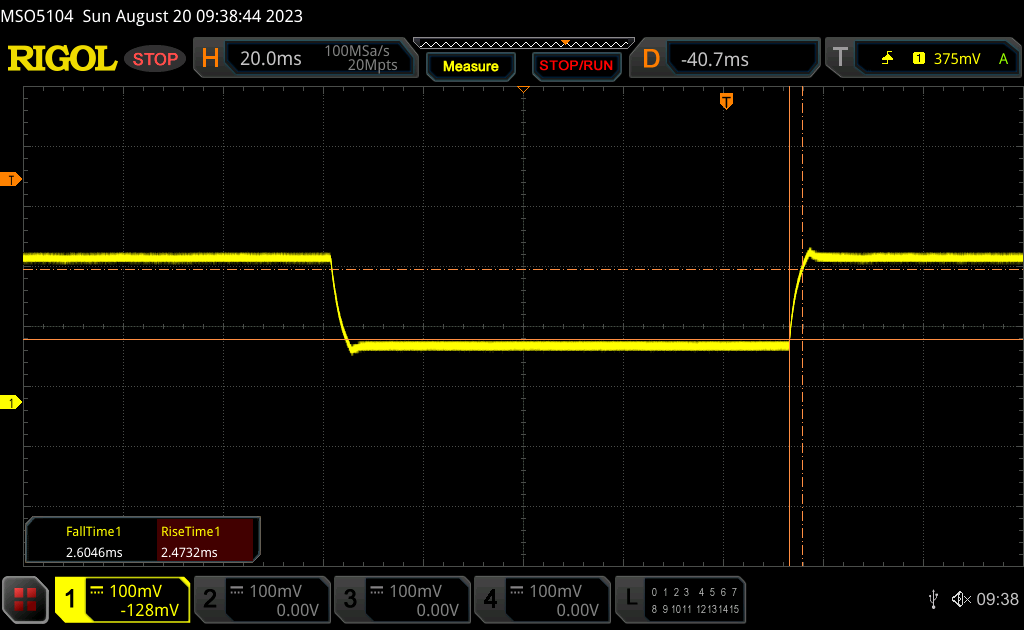 |
| ↘ 2.6 ms queda | ||
| A tela mostra taxas de resposta muito rápidas em nossos testes e deve ser muito adequada para jogos em ritmo acelerado. Em comparação, todos os dispositivos testados variam de 0.165 (mínimo) a 636 (máximo) ms. » 17 % de todos os dispositivos são melhores. Isso significa que o tempo de resposta medido é melhor que a média de todos os dispositivos testados (31 ms). | ||
Cintilação da tela / PWM (modulação por largura de pulso)
| Tela tremeluzindo / PWM não detectado | 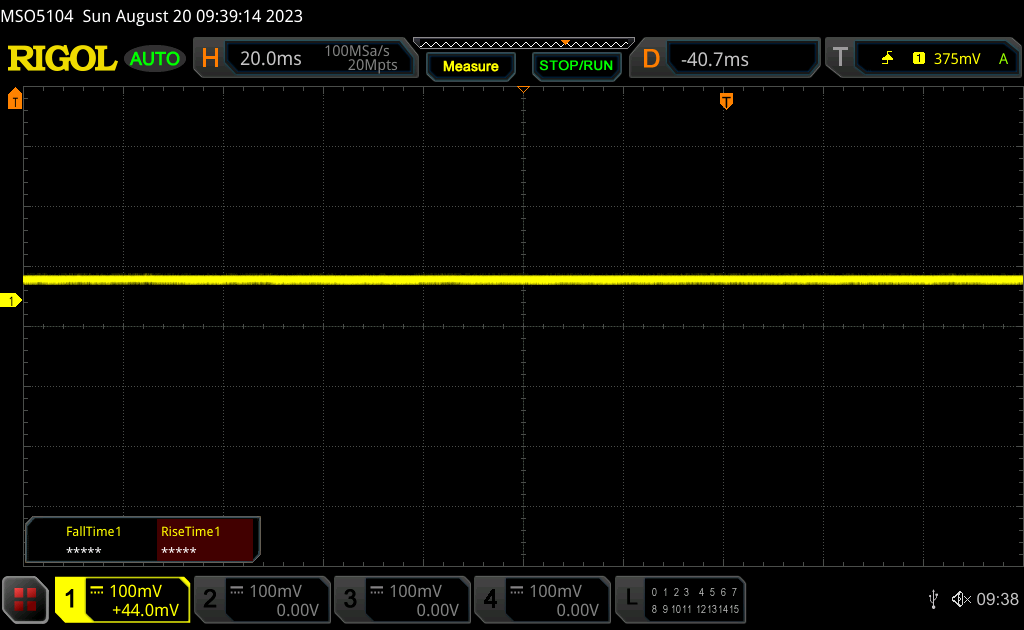 | ||
[pwm_comparison] Em comparação: 52 % de todos os dispositivos testados não usam PWM para escurecer a tela. Se PWM foi detectado, uma média de 7747 (mínimo: 5 - máximo: 343500) Hz foi medida. | |||
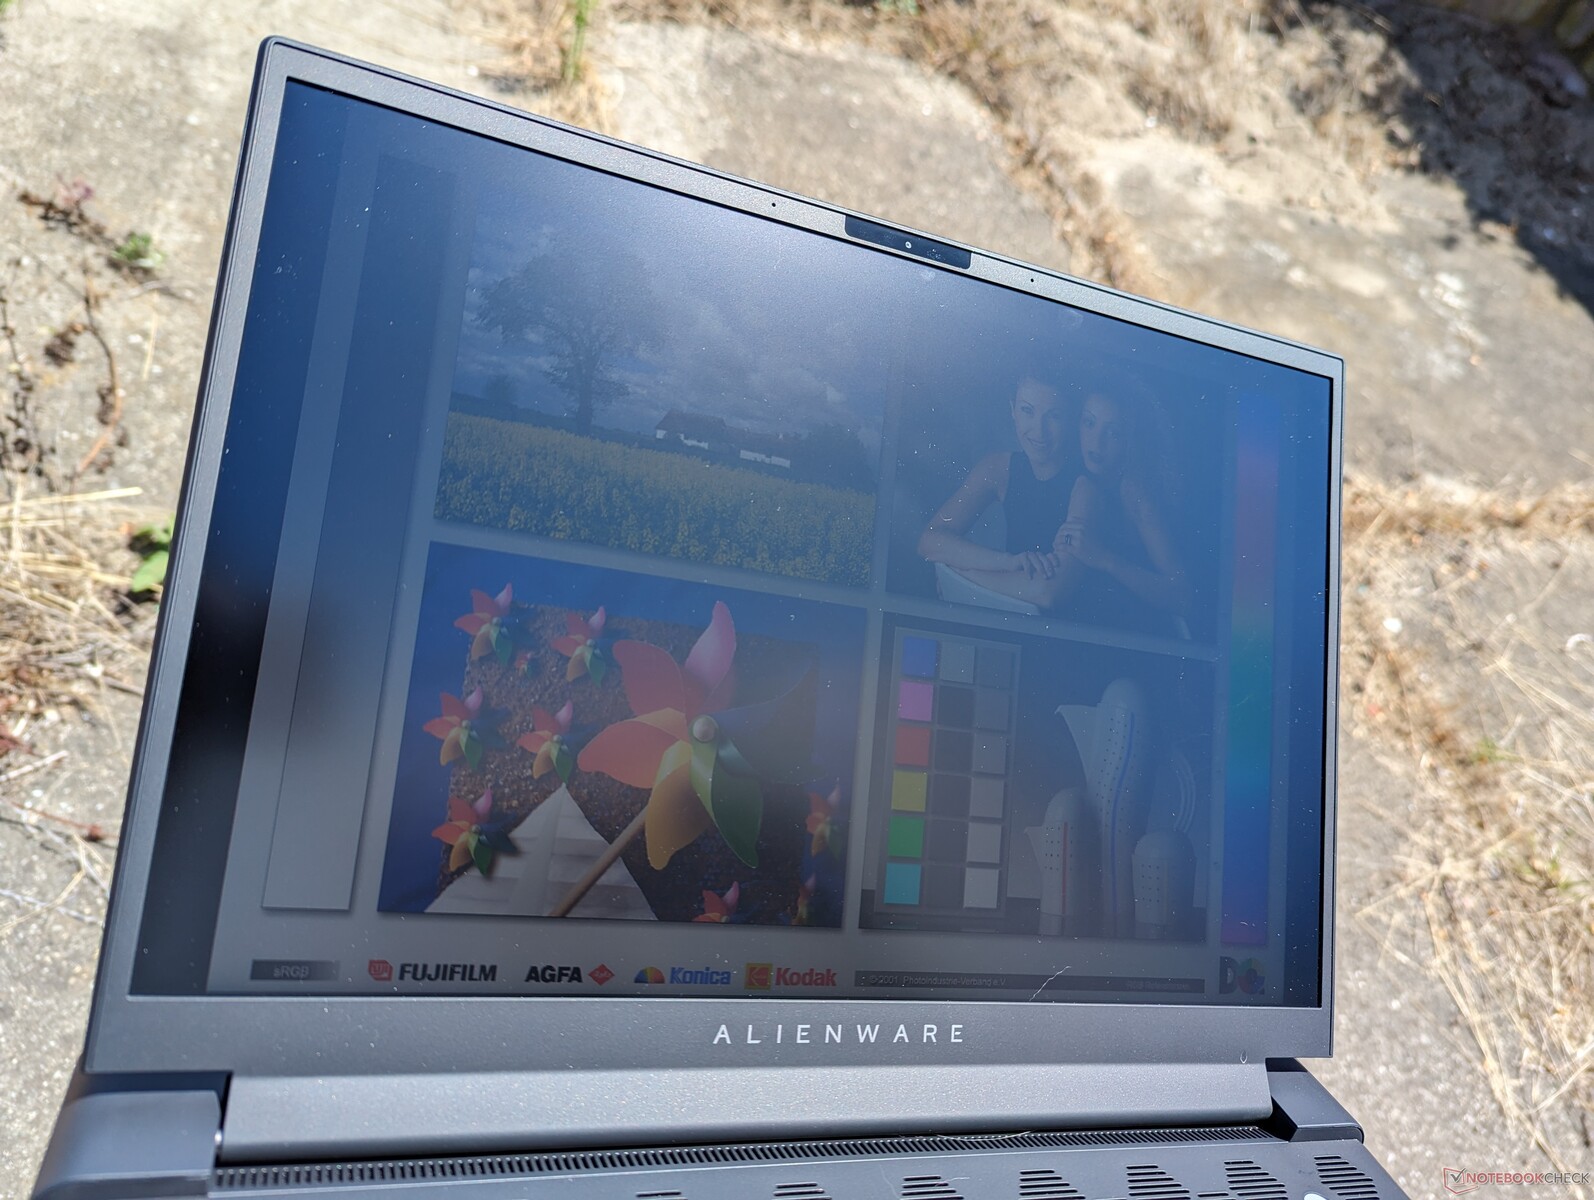
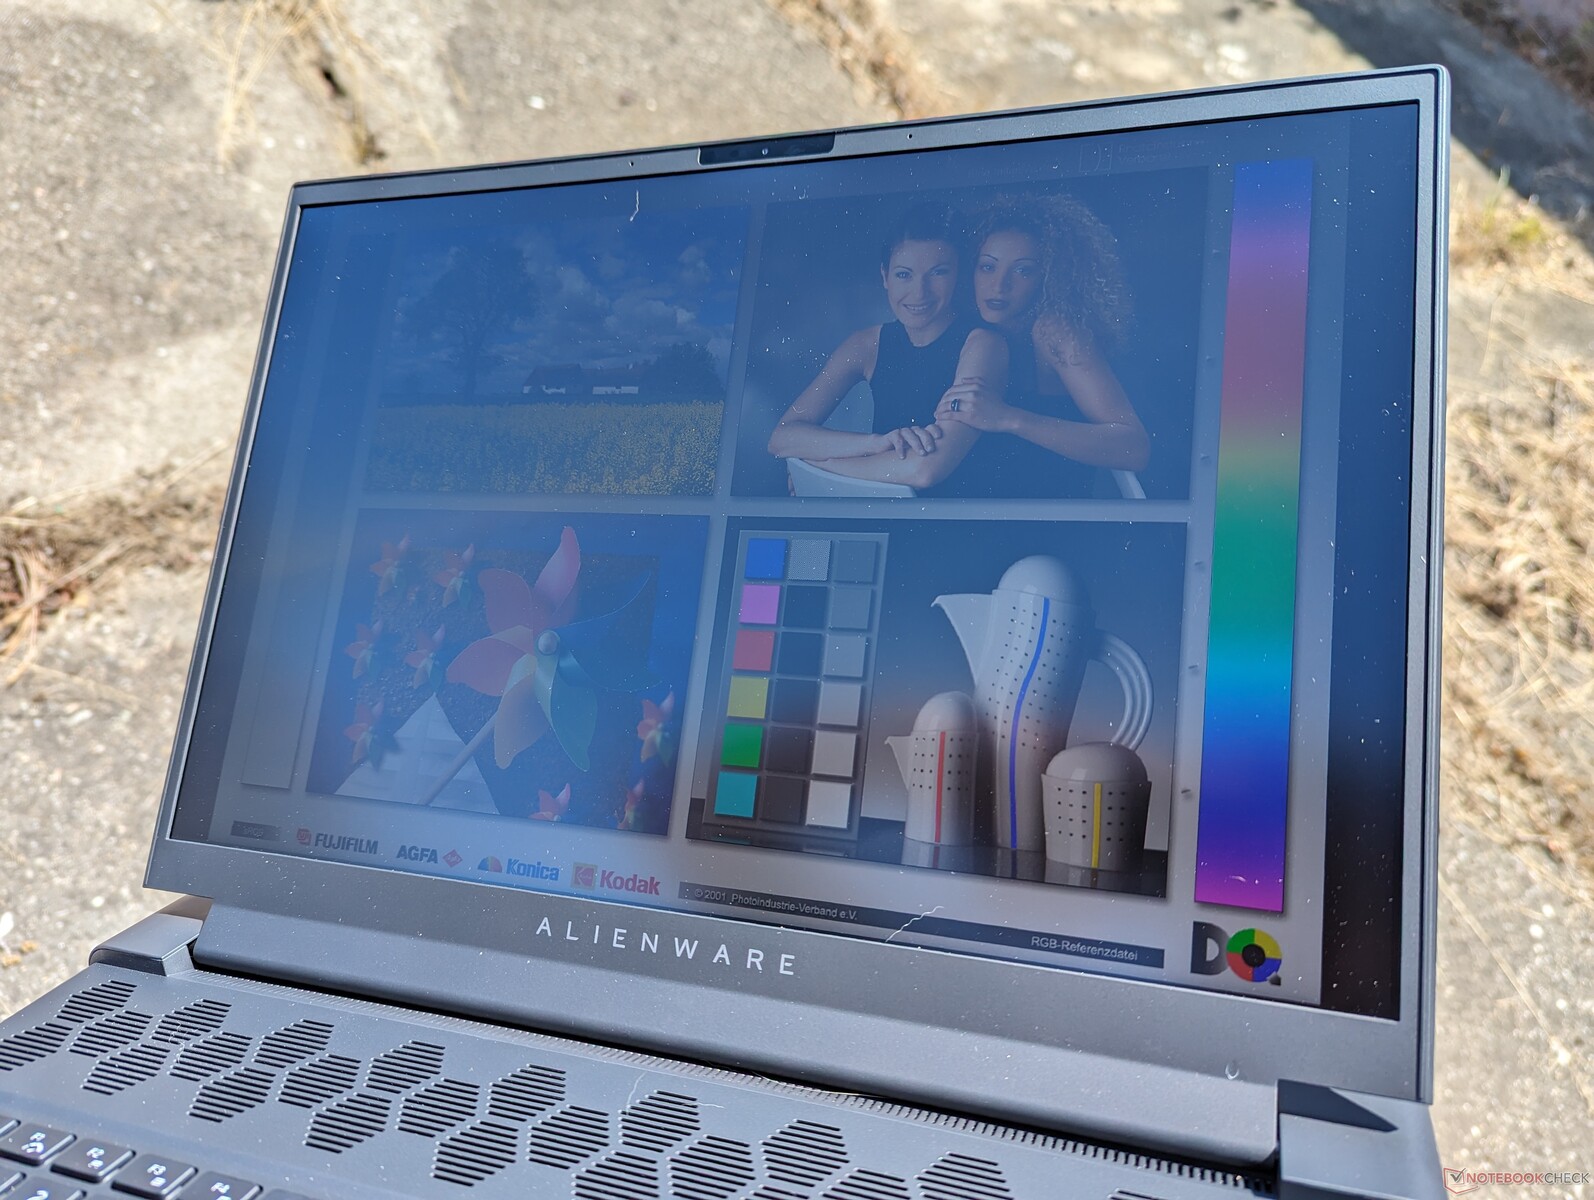
A visibilidade em ambientes externos é decente apenas quando está sob a sombra. O Omen Transcend 16 e sua tela mini-LED são duas vezes mais brilhantes se a visibilidade externa for uma preocupação.
Desempenho - AMD ou Intel?
Condições de teste
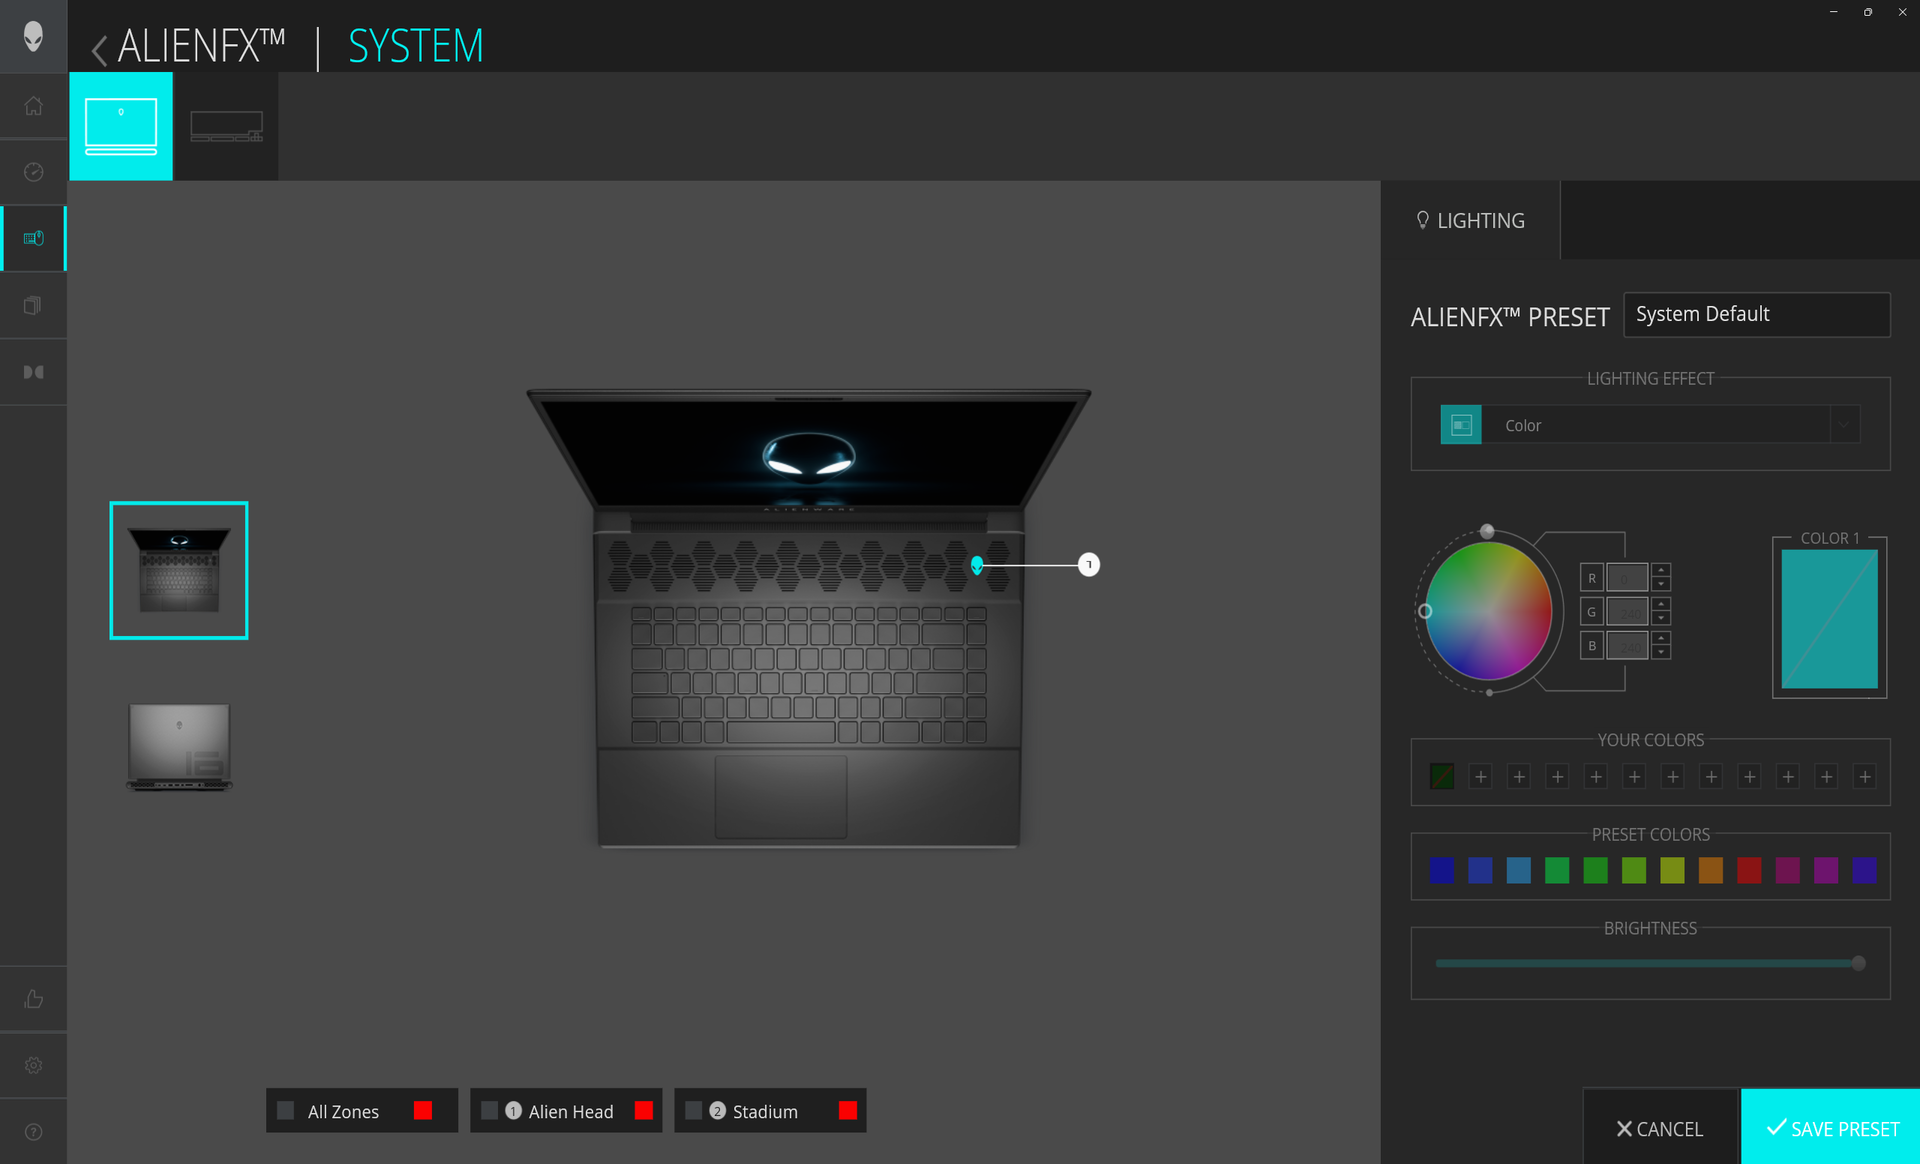
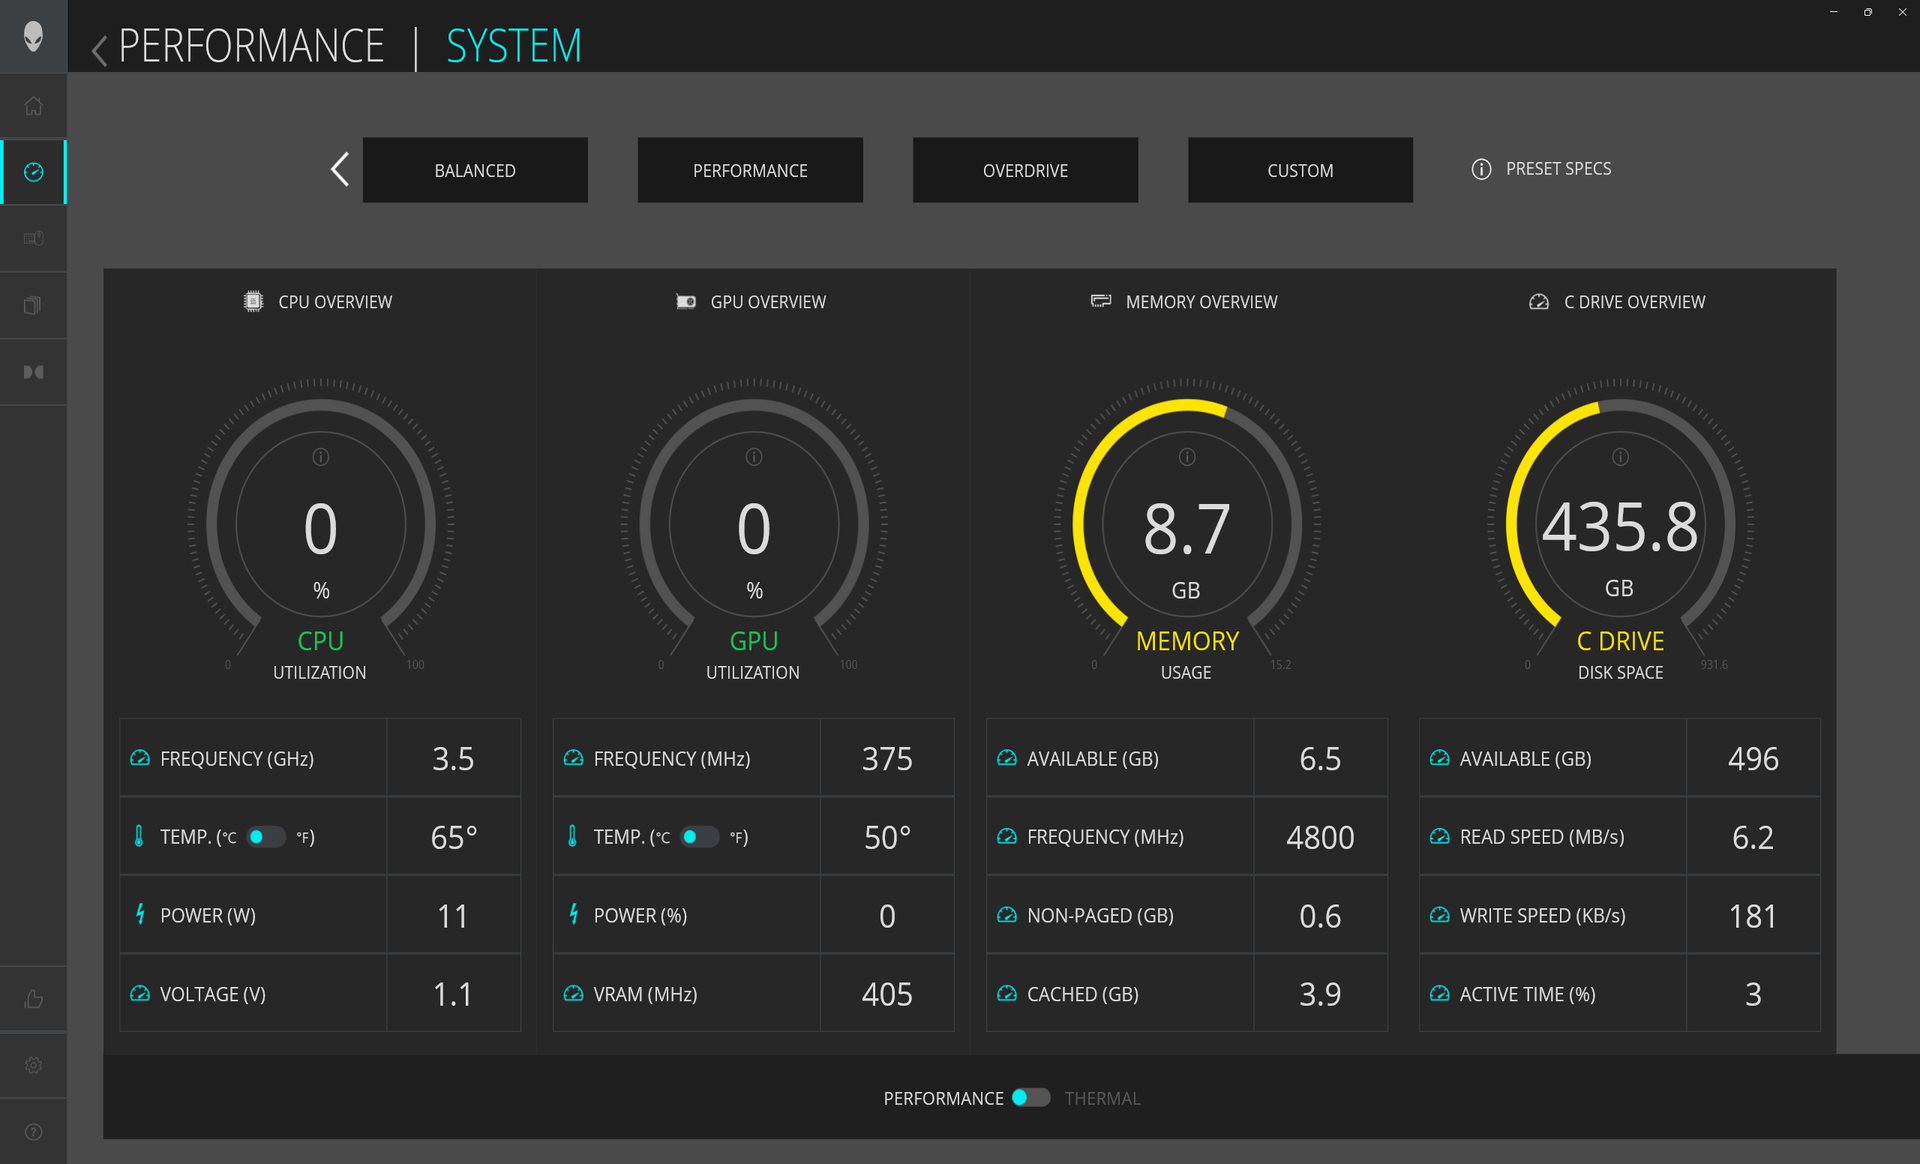
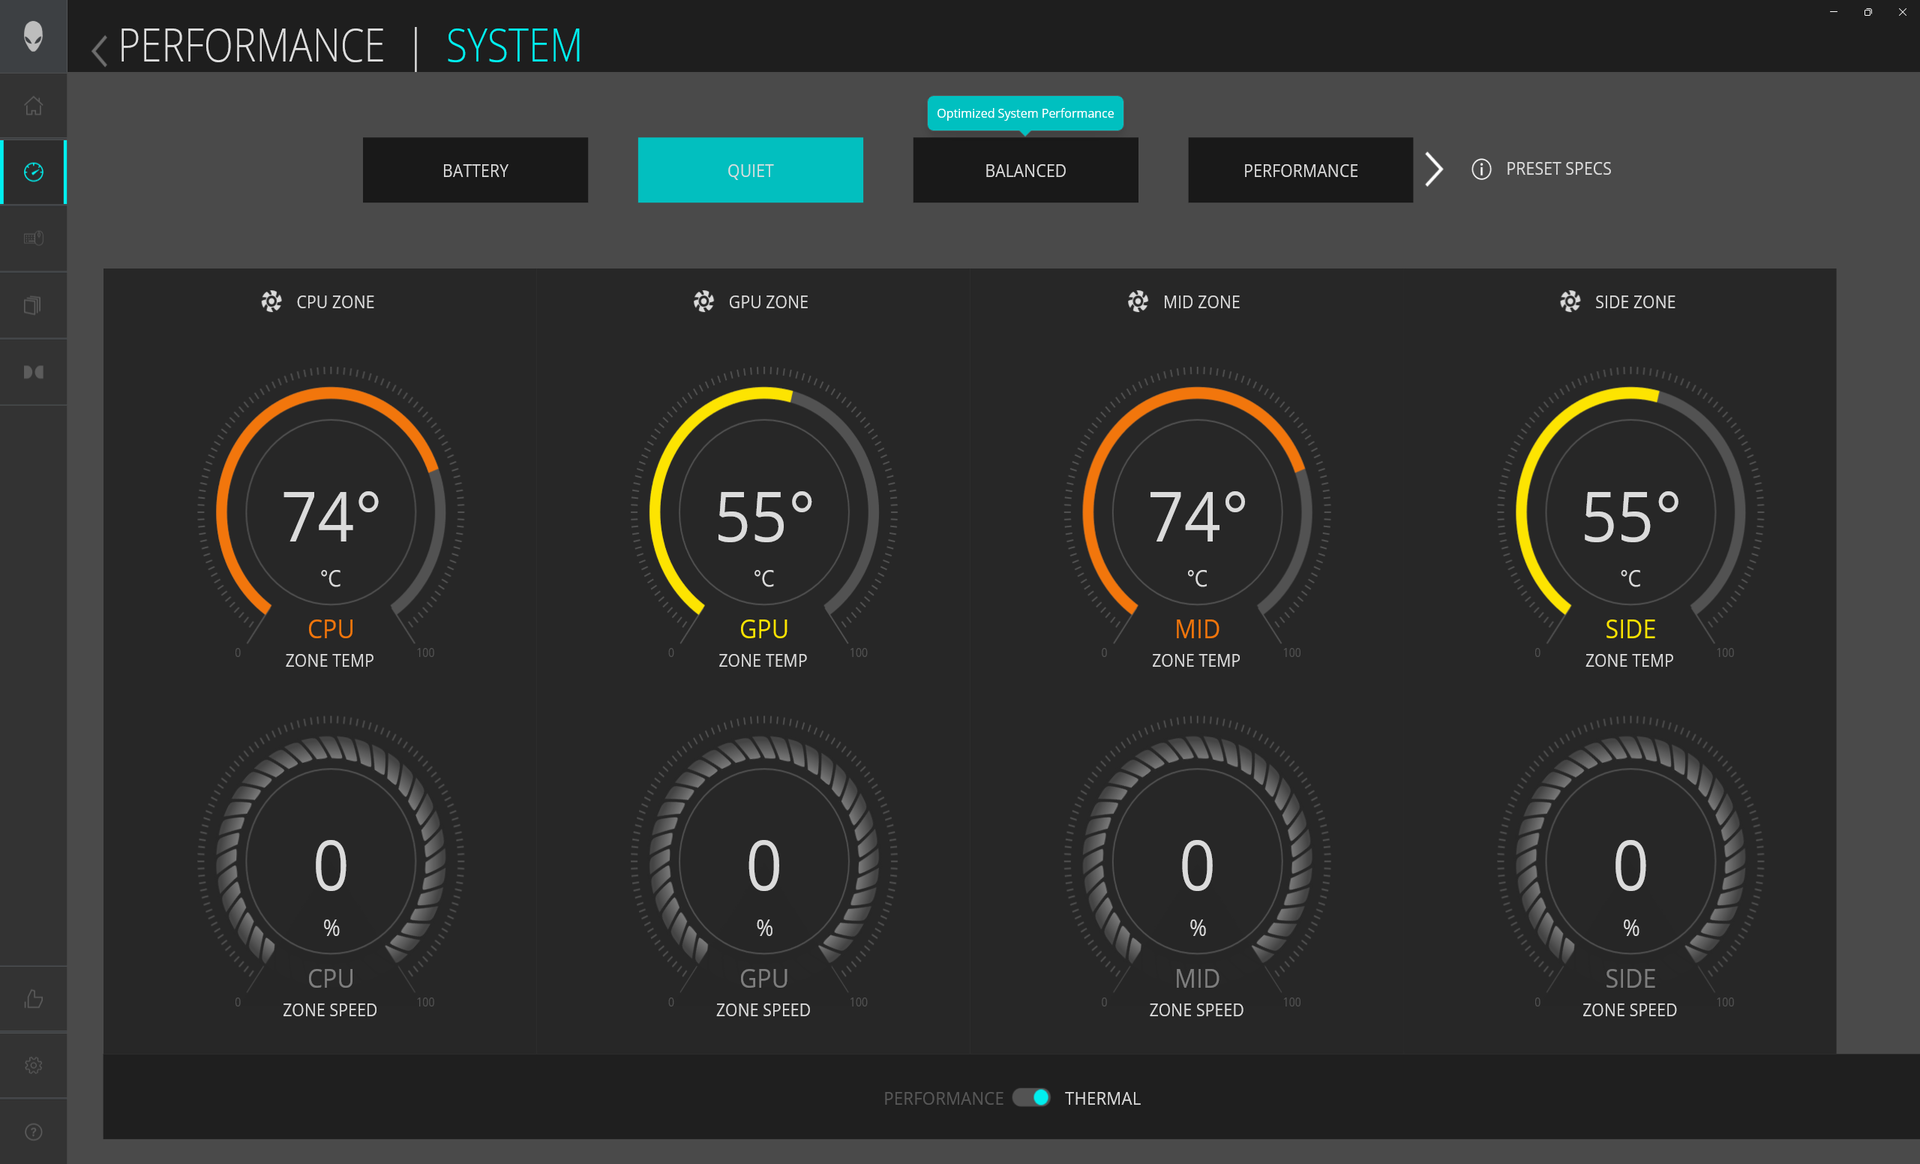
Configuramos nossa unidade para o modo Overdrive por meio do Alienware Command Center e a GPU para o modo dGPU antes de executar os benchmarks abaixo. Os usuários devem se familiarizar com o Command Center, pois ele é o centro de controle dos recursos do sistema relacionados a desempenho, sinais vitais e iluminação. O Command Center não deve ser confundido com o My Alienware, que é o software de garantia e suporte.
Há suporte para o Advanced Optimus ou MUX. O G-Sync, no entanto, não é compatível com a tela interna das versões AMD do Alienware m16, pois esse recurso é atualmente exclusivo das versões Intel. Em vez disso, o FreeSync é suportado em seu lugar.
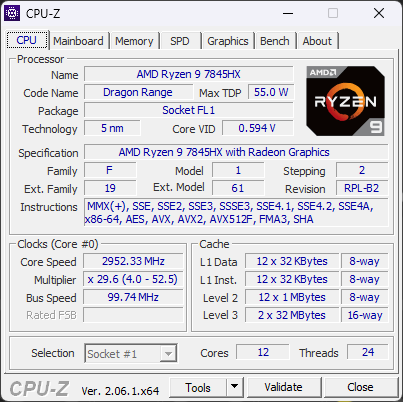
Processador
O Ryzen 9 7845HX tem um desempenho mais próximo do impressionante Ryzen 9 7945HX do que do Ryzen 7 7745HX. O desempenho multithread é cerca de 20 a 25% mais lento do que o Ryzen 9 7945HX ou cerca de 50% mais lento do que o Ryzen 7 7745HX. Portanto, a CPU está um pouco abaixo do concorrente Core i9-13900HX mas bem à frente do Core i7-13700HX. O conceito de se contentar com um desempenho mais lento da CPU ao optar pela AMD em vez da Intel não se aplica a esta geração.
A sustentabilidade do desempenho é excelente, conforme demonstrado pelos resultados estáveis do Cinebench R15 xT abaixo.
Cinebench R15 Multi Loop
Cinebench R23: Multi Core | Single Core
Cinebench R20: CPU (Multi Core) | CPU (Single Core)
Cinebench R15: CPU Multi 64Bit | CPU Single 64Bit
Blender: v2.79 BMW27 CPU
7-Zip 18.03: 7z b 4 | 7z b 4 -mmt1
Geekbench 5.5: Multi-Core | Single-Core
HWBOT x265 Benchmark v2.2: 4k Preset
LibreOffice : 20 Documents To PDF
R Benchmark 2.5: Overall mean
* ... menor é melhor
AIDA64: FP32 Ray-Trace | FPU Julia | CPU SHA3 | CPU Queen | FPU SinJulia | FPU Mandel | CPU AES | CPU ZLib | FP64 Ray-Trace | CPU PhotoWorxx
| Performance rating | |
| Alienware m16 R1 AMD | |
| Média AMD Ryzen 9 7845HX | |
| Lenovo Legion Pro 7 RTX4090 | |
| Asus ROG Strix G16 G614JZ | |
| HP Omen Transcend 16 | |
| Razer Blade 16 Early 2023 | |
| Alienware x16 R1 | |
| AIDA64 / FP32 Ray-Trace | |
| Alienware m16 R1 AMD | |
| Média AMD Ryzen 9 7845HX (n=1) | |
| Asus ROG Strix G16 G614JZ | |
| Lenovo Legion Pro 7 RTX4090 | |
| Razer Blade 16 Early 2023 | |
| Razer Blade 16 Early 2023 | |
| Razer Blade 16 Early 2023 | |
| HP Omen Transcend 16 | |
| Alienware x16 R1 | |
| AIDA64 / CPU Queen | |
| Alienware m16 R1 AMD | |
| Média AMD Ryzen 9 7845HX (n=1) | |
| Asus ROG Strix G16 G614JZ | |
| Lenovo Legion Pro 7 RTX4090 | |
| Razer Blade 16 Early 2023 | |
| Razer Blade 16 Early 2023 | |
| HP Omen Transcend 16 | |
| Alienware x16 R1 | |
| AIDA64 / FPU SinJulia | |
| Alienware m16 R1 AMD | |
| Média AMD Ryzen 9 7845HX (n=1) | |
| Asus ROG Strix G16 G614JZ | |
| Razer Blade 16 Early 2023 | |
| Razer Blade 16 Early 2023 | |
| Razer Blade 16 Early 2023 | |
| Lenovo Legion Pro 7 RTX4090 | |
| HP Omen Transcend 16 | |
| Alienware x16 R1 | |
| AIDA64 / FPU Mandel | |
| Alienware m16 R1 AMD | |
| Média AMD Ryzen 9 7845HX (n=1) | |
| Lenovo Legion Pro 7 RTX4090 | |
| Asus ROG Strix G16 G614JZ | |
| Razer Blade 16 Early 2023 | |
| Razer Blade 16 Early 2023 | |
| Razer Blade 16 Early 2023 | |
| HP Omen Transcend 16 | |
| Alienware x16 R1 | |
| AIDA64 / FP64 Ray-Trace | |
| Alienware m16 R1 AMD | |
| Média AMD Ryzen 9 7845HX (n=1) | |
| Asus ROG Strix G16 G614JZ | |
| Lenovo Legion Pro 7 RTX4090 | |
| Razer Blade 16 Early 2023 | |
| Razer Blade 16 Early 2023 | |
| Razer Blade 16 Early 2023 | |
| HP Omen Transcend 16 | |
| Alienware x16 R1 | |
| AIDA64 / CPU PhotoWorxx | |
| Razer Blade 16 Early 2023 | |
| Razer Blade 16 Early 2023 | |
| Razer Blade 16 Early 2023 | |
| Lenovo Legion Pro 7 RTX4090 | |
| HP Omen Transcend 16 | |
| Alienware x16 R1 | |
| Asus ROG Strix G16 G614JZ | |
| Alienware m16 R1 AMD | |
| Média AMD Ryzen 9 7845HX (n=1) | |
Desempenho do sistema
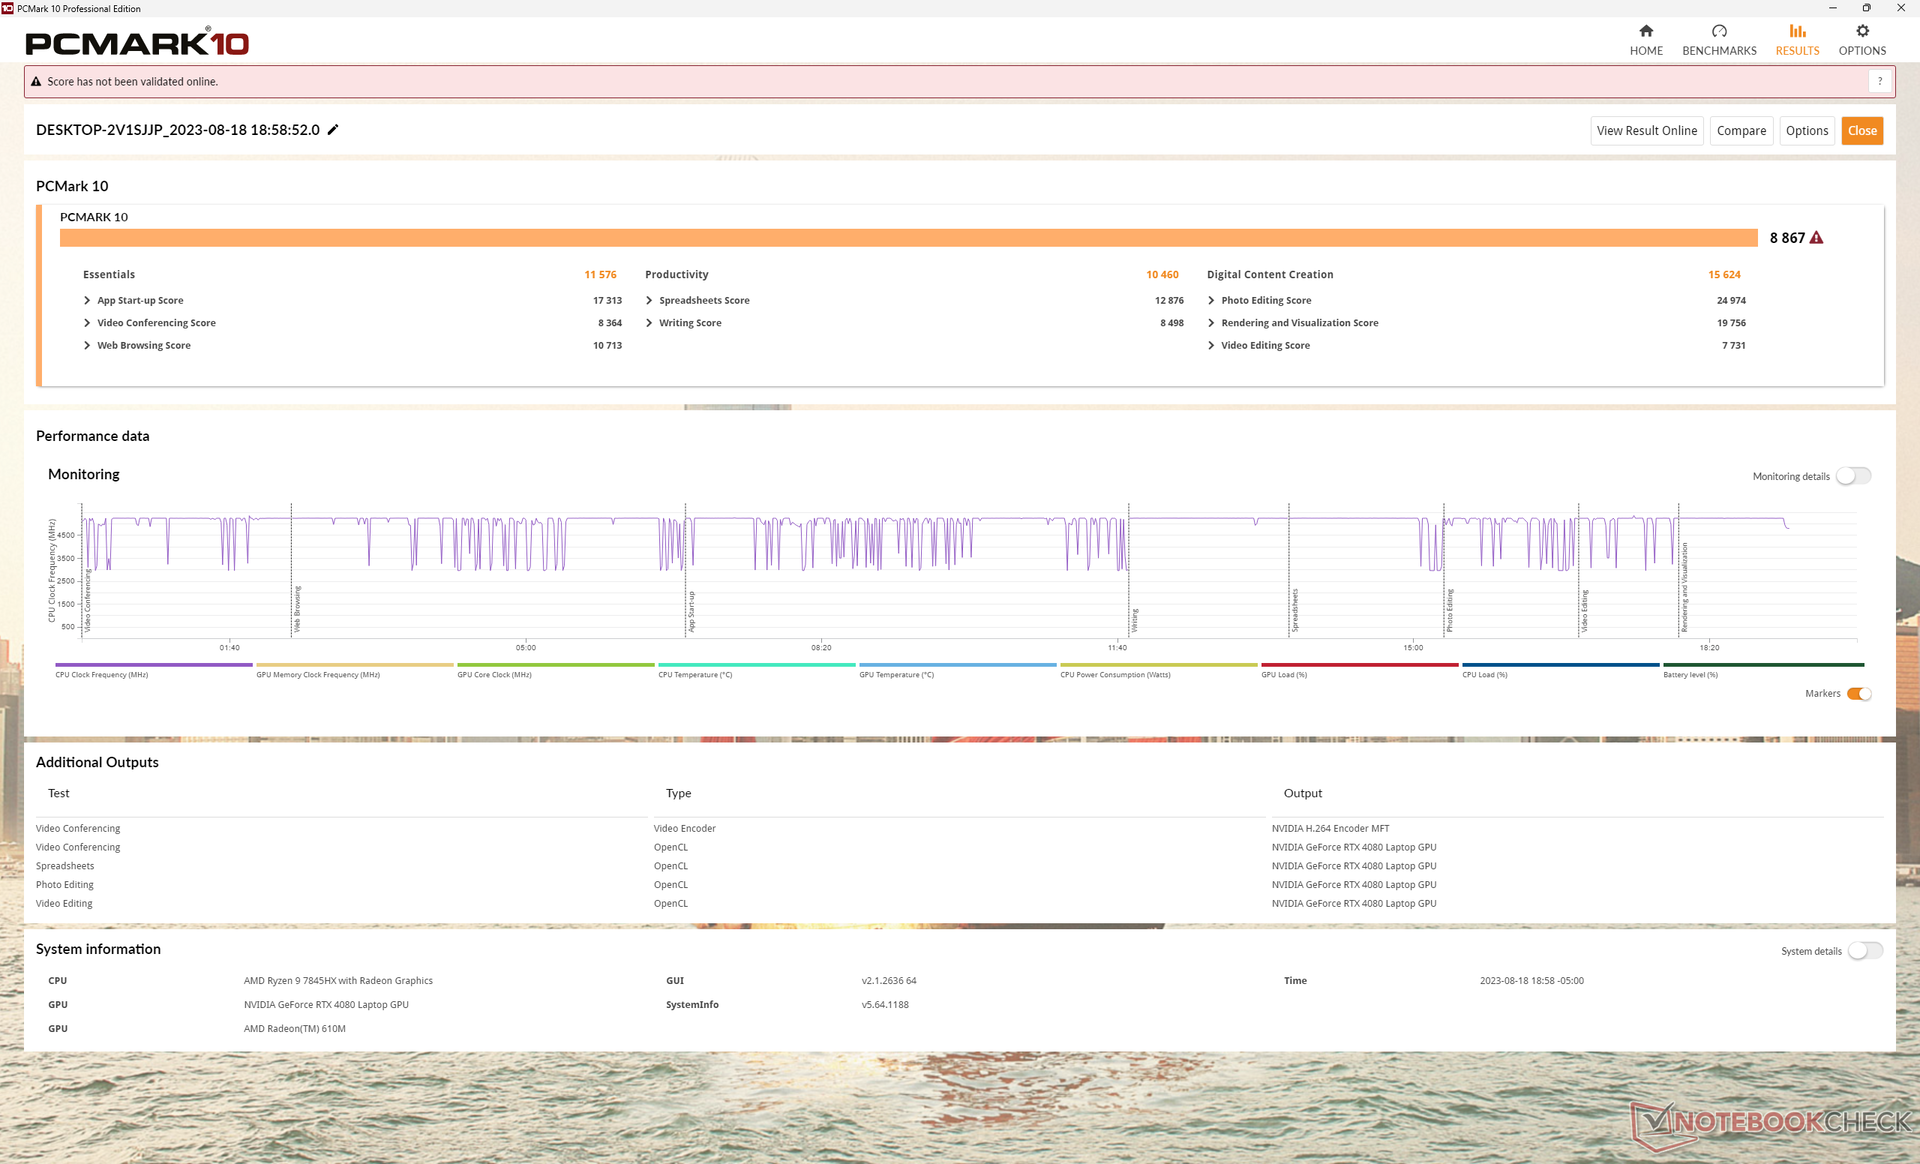
As pontuações do PCMark são algumas das mais altas de qualquer laptop para jogos. A margem mais ampla está no subteste Produtividade, que se concentra no desempenho da CPU.
Infelizmente, tivemos vários problemas ao sair do modo de suspensão em nossa unidade de teste. O sistema às vezes reiniciava sem motivo ao abrir a tampa ou mostrava a tela azul da morte, mesmo depois de atualizar para os drivers mais recentes da Dell e da Nvidia no momento da análise.
CrossMark: Overall | Productivity | Creativity | Responsiveness
| PCMark 10 / Score | |
| Alienware m16 R1 AMD | |
| Média AMD Ryzen 9 7845HX, NVIDIA GeForce RTX 4080 Laptop GPU (n=1) | |
| Alienware x16 R1 | |
| Lenovo Legion Pro 7 RTX4090 | |
| HP Omen Transcend 16 | |
| Razer Blade 16 Early 2023 | |
| Asus ROG Strix G16 G614JZ | |
| PCMark 10 / Essentials | |
| Asus ROG Strix G16 G614JZ | |
| Alienware m16 R1 AMD | |
| Média AMD Ryzen 9 7845HX, NVIDIA GeForce RTX 4080 Laptop GPU (n=1) | |
| HP Omen Transcend 16 | |
| Alienware x16 R1 | |
| Lenovo Legion Pro 7 RTX4090 | |
| Razer Blade 16 Early 2023 | |
| PCMark 10 / Productivity | |
| Alienware m16 R1 AMD | |
| Média AMD Ryzen 9 7845HX, NVIDIA GeForce RTX 4080 Laptop GPU (n=1) | |
| Alienware x16 R1 | |
| HP Omen Transcend 16 | |
| Lenovo Legion Pro 7 RTX4090 | |
| Razer Blade 16 Early 2023 | |
| Asus ROG Strix G16 G614JZ | |
| PCMark 10 / Digital Content Creation | |
| Alienware m16 R1 AMD | |
| Média AMD Ryzen 9 7845HX, NVIDIA GeForce RTX 4080 Laptop GPU (n=1) | |
| Lenovo Legion Pro 7 RTX4090 | |
| Razer Blade 16 Early 2023 | |
| Alienware x16 R1 | |
| HP Omen Transcend 16 | |
| Asus ROG Strix G16 G614JZ | |
| CrossMark / Overall | |
| Asus ROG Strix G16 G614JZ | |
| Alienware m16 R1 AMD | |
| Média AMD Ryzen 9 7845HX, NVIDIA GeForce RTX 4080 Laptop GPU (n=1) | |
| HP Omen Transcend 16 | |
| Alienware x16 R1 | |
| Razer Blade 16 Early 2023 | |
| CrossMark / Productivity | |
| Asus ROG Strix G16 G614JZ | |
| Alienware m16 R1 AMD | |
| Média AMD Ryzen 9 7845HX, NVIDIA GeForce RTX 4080 Laptop GPU (n=1) | |
| Alienware x16 R1 | |
| HP Omen Transcend 16 | |
| Razer Blade 16 Early 2023 | |
| CrossMark / Creativity | |
| Asus ROG Strix G16 G614JZ | |
| HP Omen Transcend 16 | |
| Alienware m16 R1 AMD | |
| Média AMD Ryzen 9 7845HX, NVIDIA GeForce RTX 4080 Laptop GPU (n=1) | |
| Alienware x16 R1 | |
| Razer Blade 16 Early 2023 | |
| CrossMark / Responsiveness | |
| Asus ROG Strix G16 G614JZ | |
| Alienware x16 R1 | |
| Alienware m16 R1 AMD | |
| Média AMD Ryzen 9 7845HX, NVIDIA GeForce RTX 4080 Laptop GPU (n=1) | |
| HP Omen Transcend 16 | |
| Razer Blade 16 Early 2023 | |
| PCMark 10 Score | 8867 pontos | |
Ajuda | ||
| AIDA64 / Memory Copy | |
| Razer Blade 16 Early 2023 | |
| Razer Blade 16 Early 2023 | |
| Razer Blade 16 Early 2023 | |
| Lenovo Legion Pro 7 RTX4090 | |
| HP Omen Transcend 16 | |
| Alienware x16 R1 | |
| Asus ROG Strix G16 G614JZ | |
| Alienware m16 R1 AMD | |
| Média AMD Ryzen 9 7845HX (n=1) | |
| AIDA64 / Memory Read | |
| Lenovo Legion Pro 7 RTX4090 | |
| Razer Blade 16 Early 2023 | |
| Razer Blade 16 Early 2023 | |
| Razer Blade 16 Early 2023 | |
| HP Omen Transcend 16 | |
| Asus ROG Strix G16 G614JZ | |
| Alienware x16 R1 | |
| Alienware m16 R1 AMD | |
| Média AMD Ryzen 9 7845HX (n=1) | |
| AIDA64 / Memory Write | |
| Alienware x16 R1 | |
| Razer Blade 16 Early 2023 | |
| Razer Blade 16 Early 2023 | |
| Razer Blade 16 Early 2023 | |
| Lenovo Legion Pro 7 RTX4090 | |
| HP Omen Transcend 16 | |
| Asus ROG Strix G16 G614JZ | |
| Alienware m16 R1 AMD | |
| Média AMD Ryzen 9 7845HX (n=1) | |
| AIDA64 / Memory Latency | |
| Alienware x16 R1 | |
| Razer Blade 16 Early 2023 | |
| Razer Blade 16 Early 2023 | |
| Razer Blade 16 Early 2023 | |
| Alienware m16 R1 AMD | |
| Média AMD Ryzen 9 7845HX (n=1) | |
| HP Omen Transcend 16 | |
| Asus ROG Strix G16 G614JZ | |
| Lenovo Legion Pro 7 RTX4090 | |
* ... menor é melhor
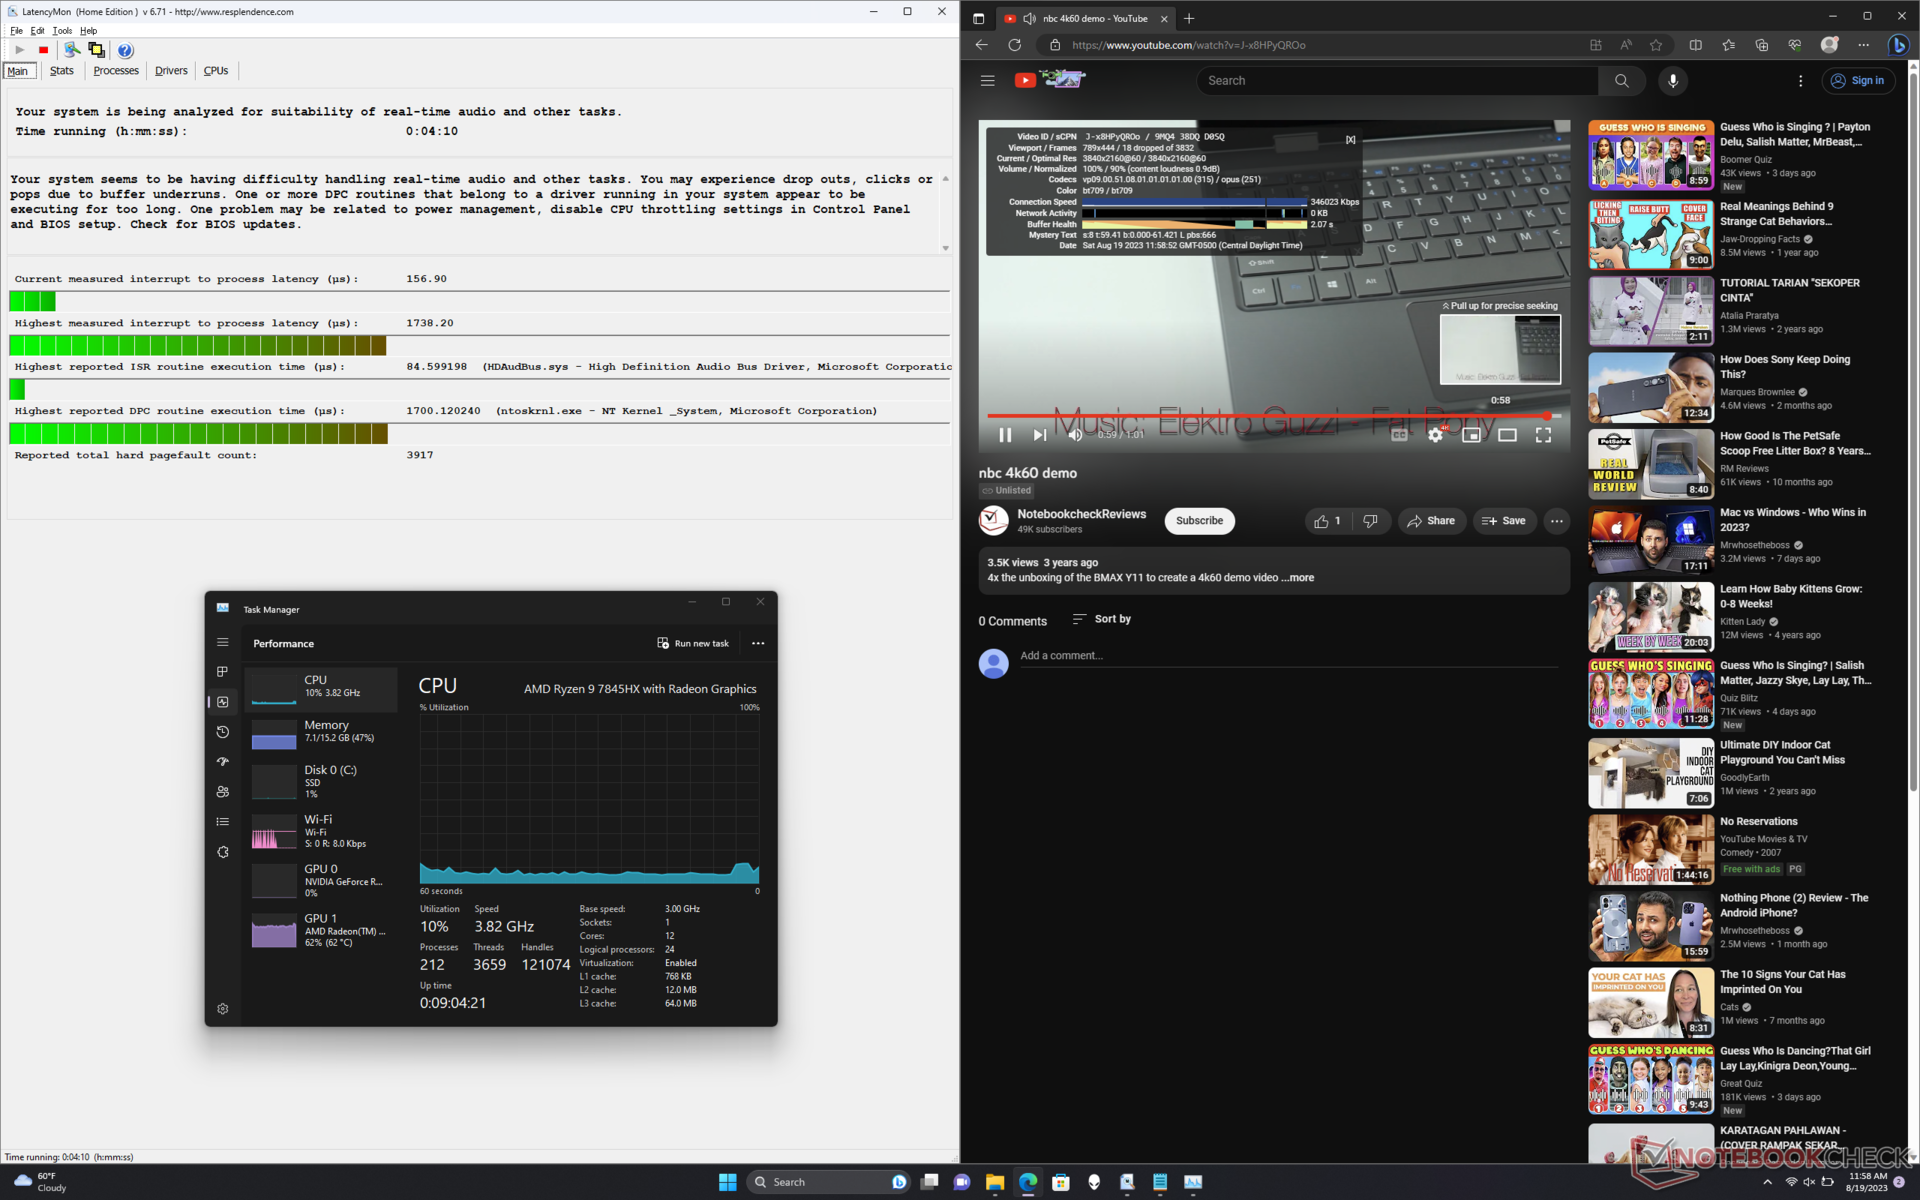
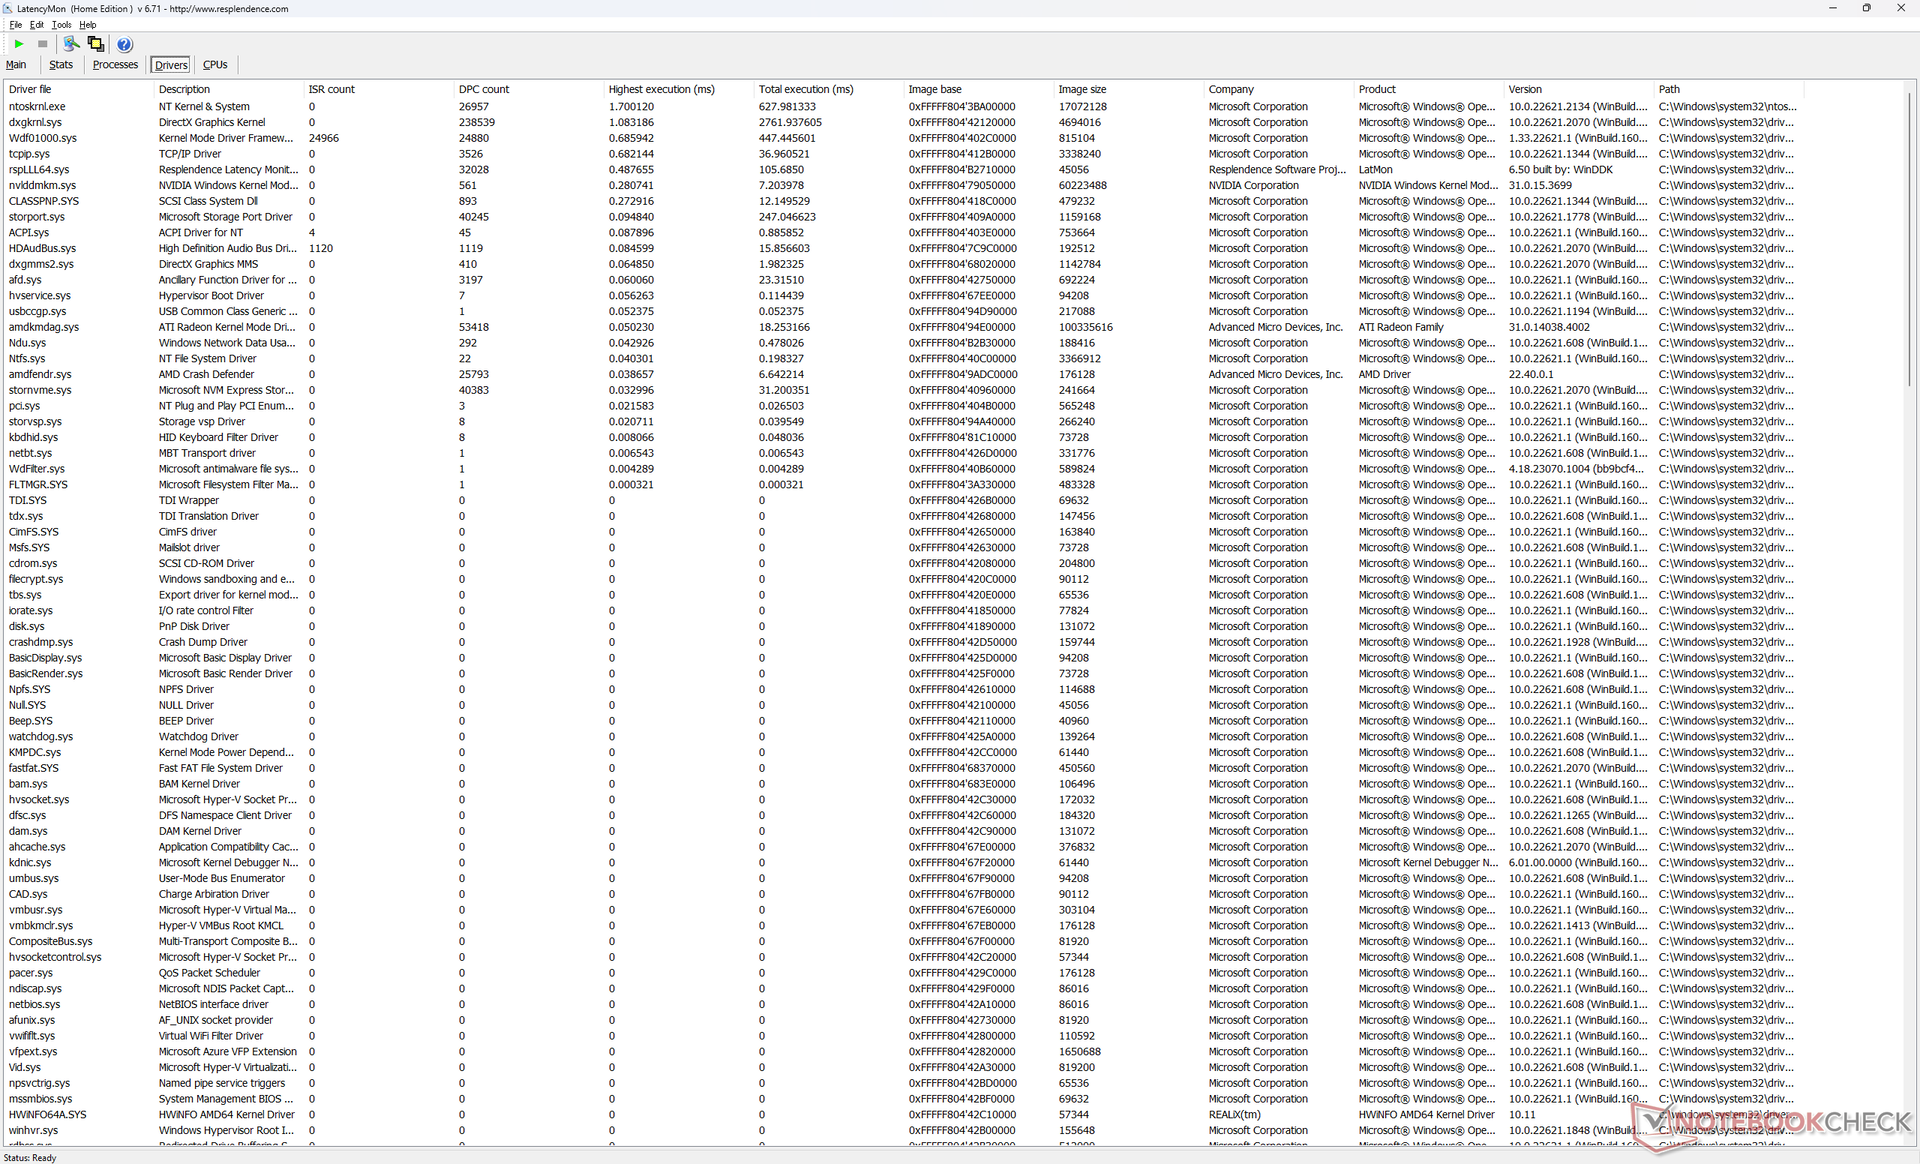
Latência DPC
O LatencyMon revela problemas leves de DPC relacionados ao ntoskrnl.exe. Além disso, a reprodução de vídeo 4K a 60 FPS é imperfeita, com 18 quadros perdidos registrados durante um teste de vídeo de um minuto, o que sugere um possível bug na aceleração de hardware da AMD. Os resultados não melhoraram mesmo após a repetição do teste.
| DPC Latencies / LatencyMon - interrupt to process latency (max), Web, Youtube, Prime95 | |
| Lenovo Legion Pro 7 RTX4090 | |
| Asus ROG Strix G16 G614JZ | |
| Razer Blade 16 Early 2023 | |
| Alienware m16 R1 AMD | |
| HP Omen Transcend 16 | |
| Alienware x16 R1 | |
* ... menor é melhor
Dispositivos de armazenamento
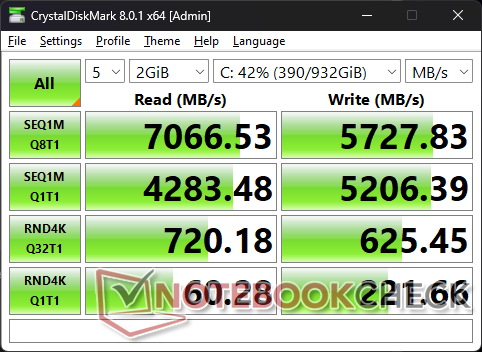
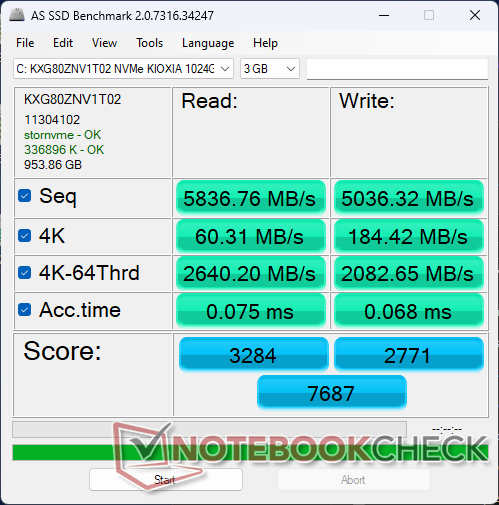
Nossa unidade é fornecida com uma unidade de ponta de 1 TB Kioxia KXG80ZNV1T02 que oferece taxas de leitura e gravação sequenciais de até 7000 MB/s e 5600 MB/s, respectivamente, de acordo com o fabricante. A unidade é capaz de sustentar taxas de transferência máximas de mais de 6500 MB/s por períodos prolongados sem problemas de estrangulamento.
É possível instalar até três SSDs M.2, enquanto o Alienware x16 e o HP Omen 16 só podem suportar até dois cada. A terceira unidade, no entanto, deve ter 30 mm de comprimento.

| Drive Performance rating - Percent | |
| Alienware x16 R1 | |
| Lenovo Legion Pro 7 RTX4090 | |
| Alienware m16 R1 AMD | |
| Razer Blade 16 Early 2023 | |
| HP Omen Transcend 16 | |
| Asus ROG Strix G16 G614JZ | |
* ... menor é melhor
Disk Throttling: DiskSpd Read Loop, Queue Depth 8
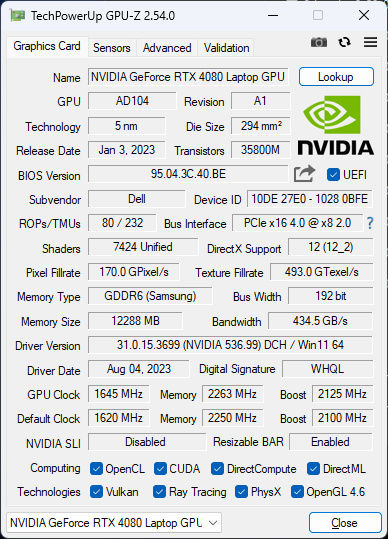
Desempenho da GPU - Gráficos TGP de 175 W
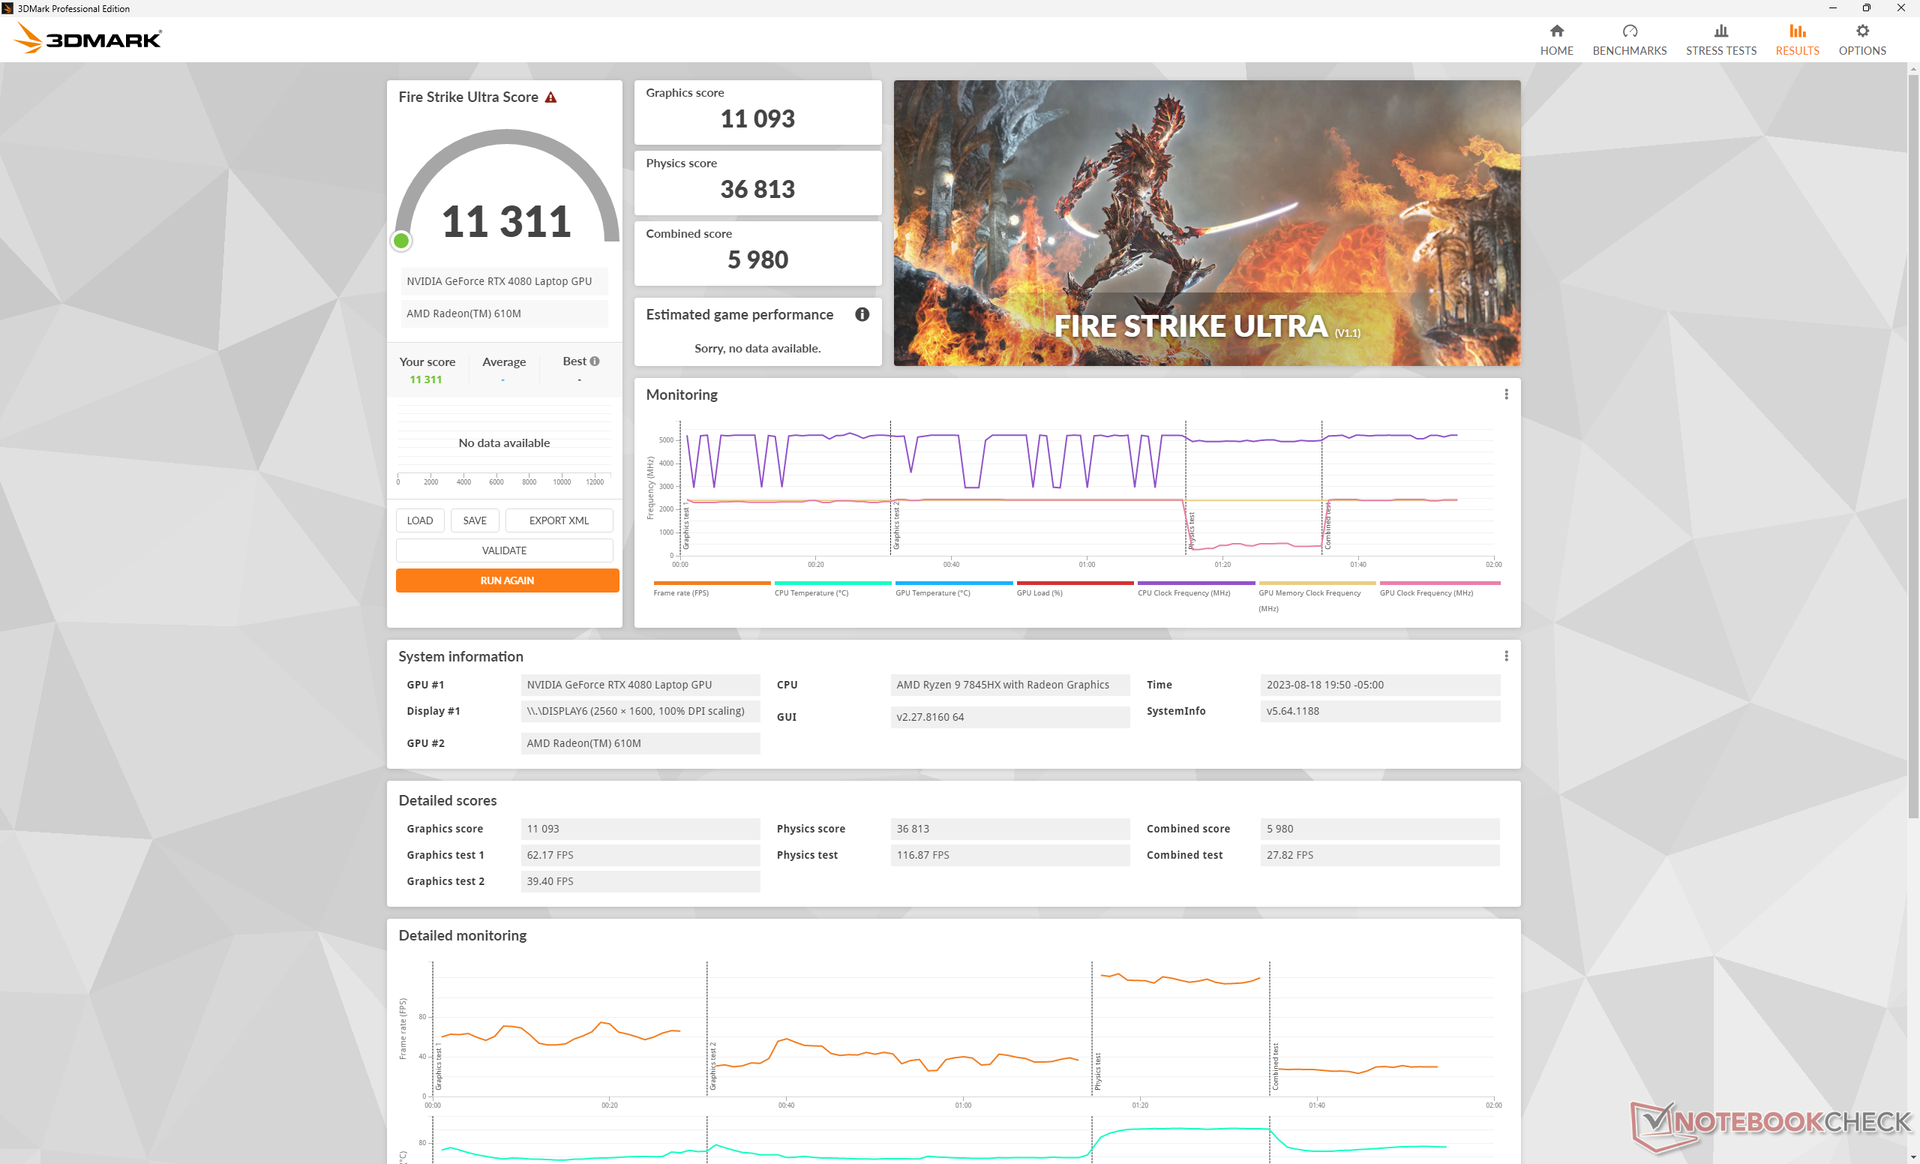
O desempenho gráfico é cerca de 5 a 10 por cento mais rápido do que a média dos notebooks para jogos em nosso banco de dados equipados com a mesma GPU RTX 4080 já que o Alienware tem como meta um TGP de 175 W relativamente alto. De fato, o desempenho é apenas cerca de 5% mais lento do que oAsus Zephyrus Duo 16 executado com a RTX 4090.
Espera-se que o upgrade para a SKU RTX 4090 aumente o desempenho em apenas 10% em relação à nossa RTX 4080, enquanto o downgrade para a RTX 4070 deve diminuir o desempenho de forma mais significativa, em até 30% a 40%, com base em nosso tempo com a HP Omen Transcend 16. Portanto, os entusiastas devem considerar SKUs com a RTX 4080, no mínimo.
É interessante notar que há apenas pequenas diferenças de desempenho entre os modos Balanced, Performance e Overdrive, como mostram as pontuações Fire Strike na tabela abaixo. É importante observar isso, pois os modos diferem significativamente em termos de ruído do ventilador.
| Perfil de energia | Pontuação de gráficos | Pontuação de física | Pontuação combinada |
| Energia da bateria | 22290 (-50%) | 30178 (-17%) | 9109 (-35%) |
| Modo equilibrado | 43406 (-3%) | 35237 (-4%) | 14721 (+5%) |
| Modo de desempenho | 44306 (-1%) | 36106 (-1%) | 13682 (-3%) |
| Modo Overdrive | 44782 | 36557 | 14045 |
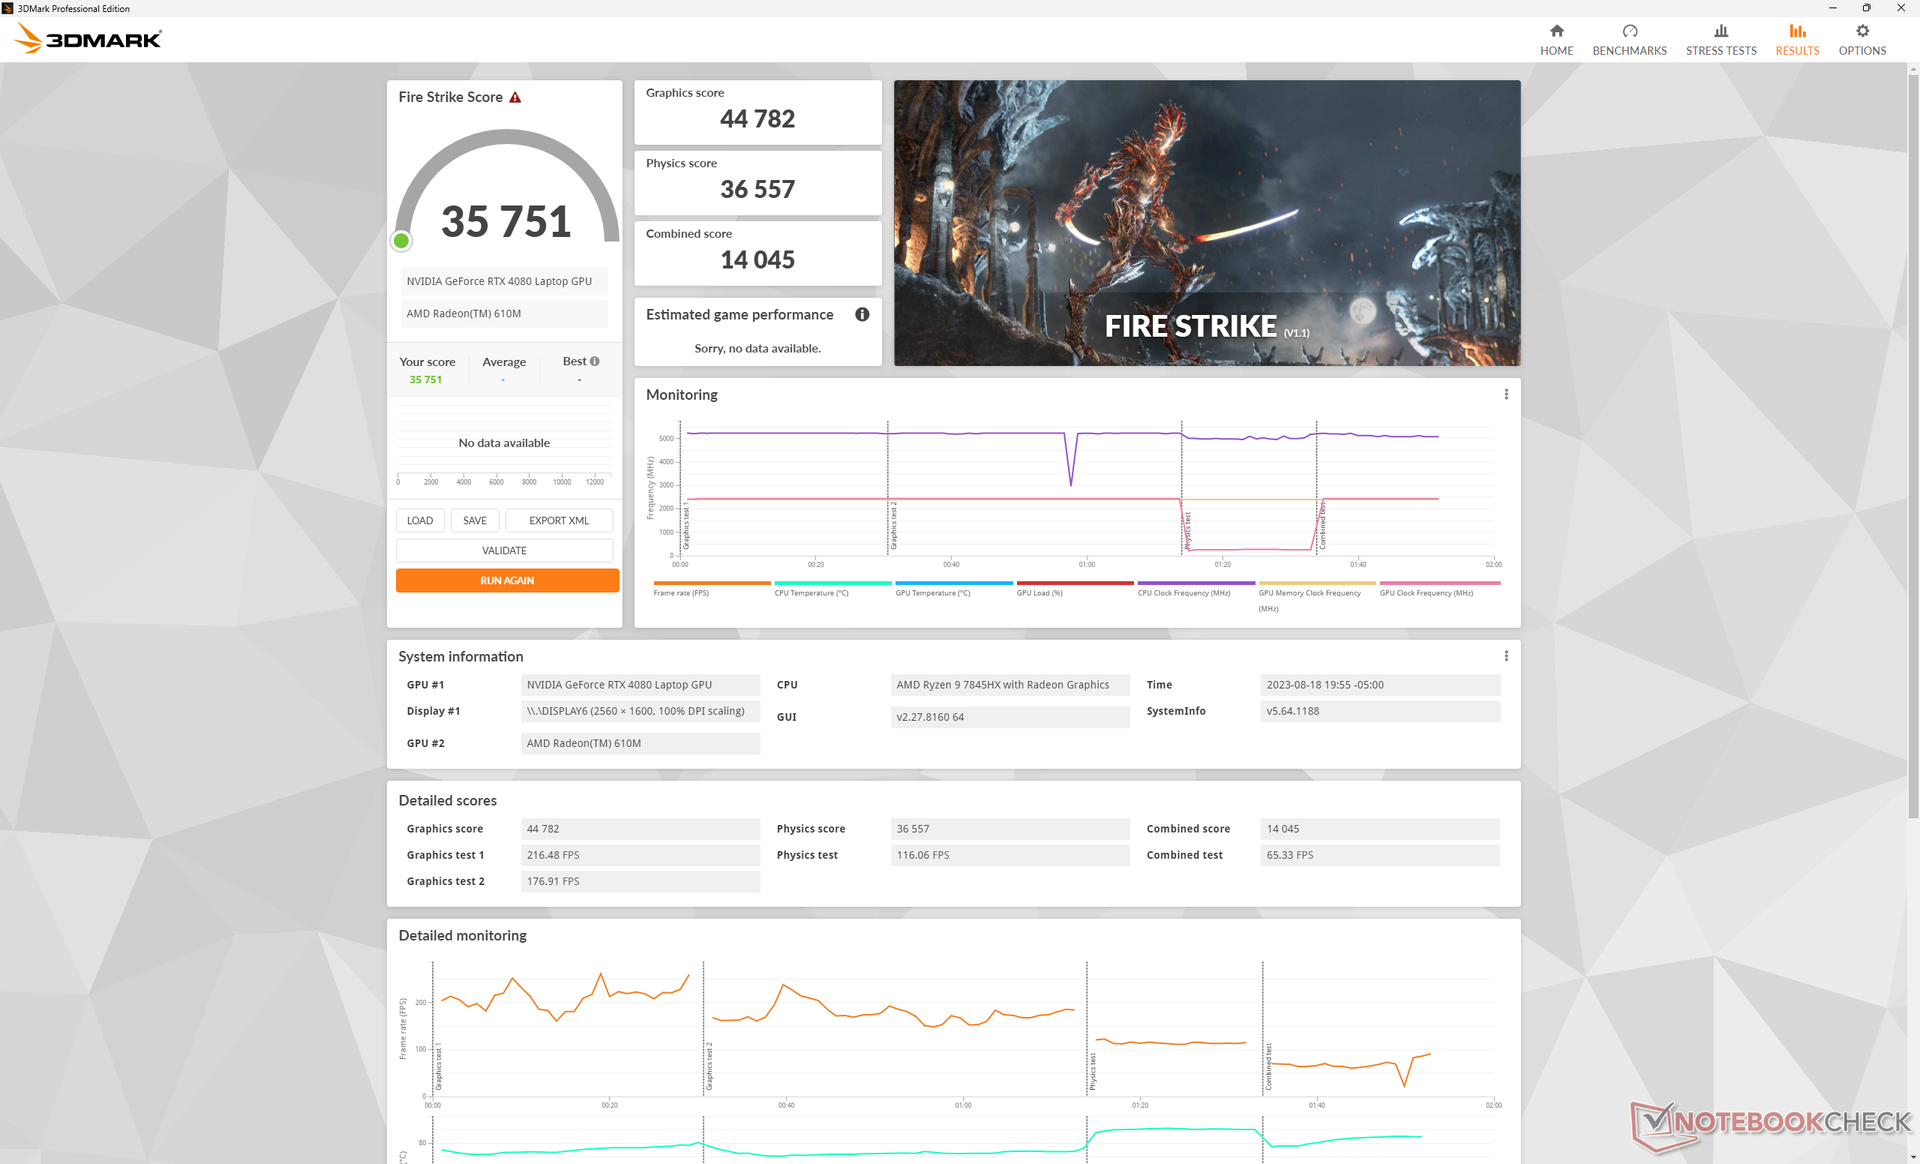

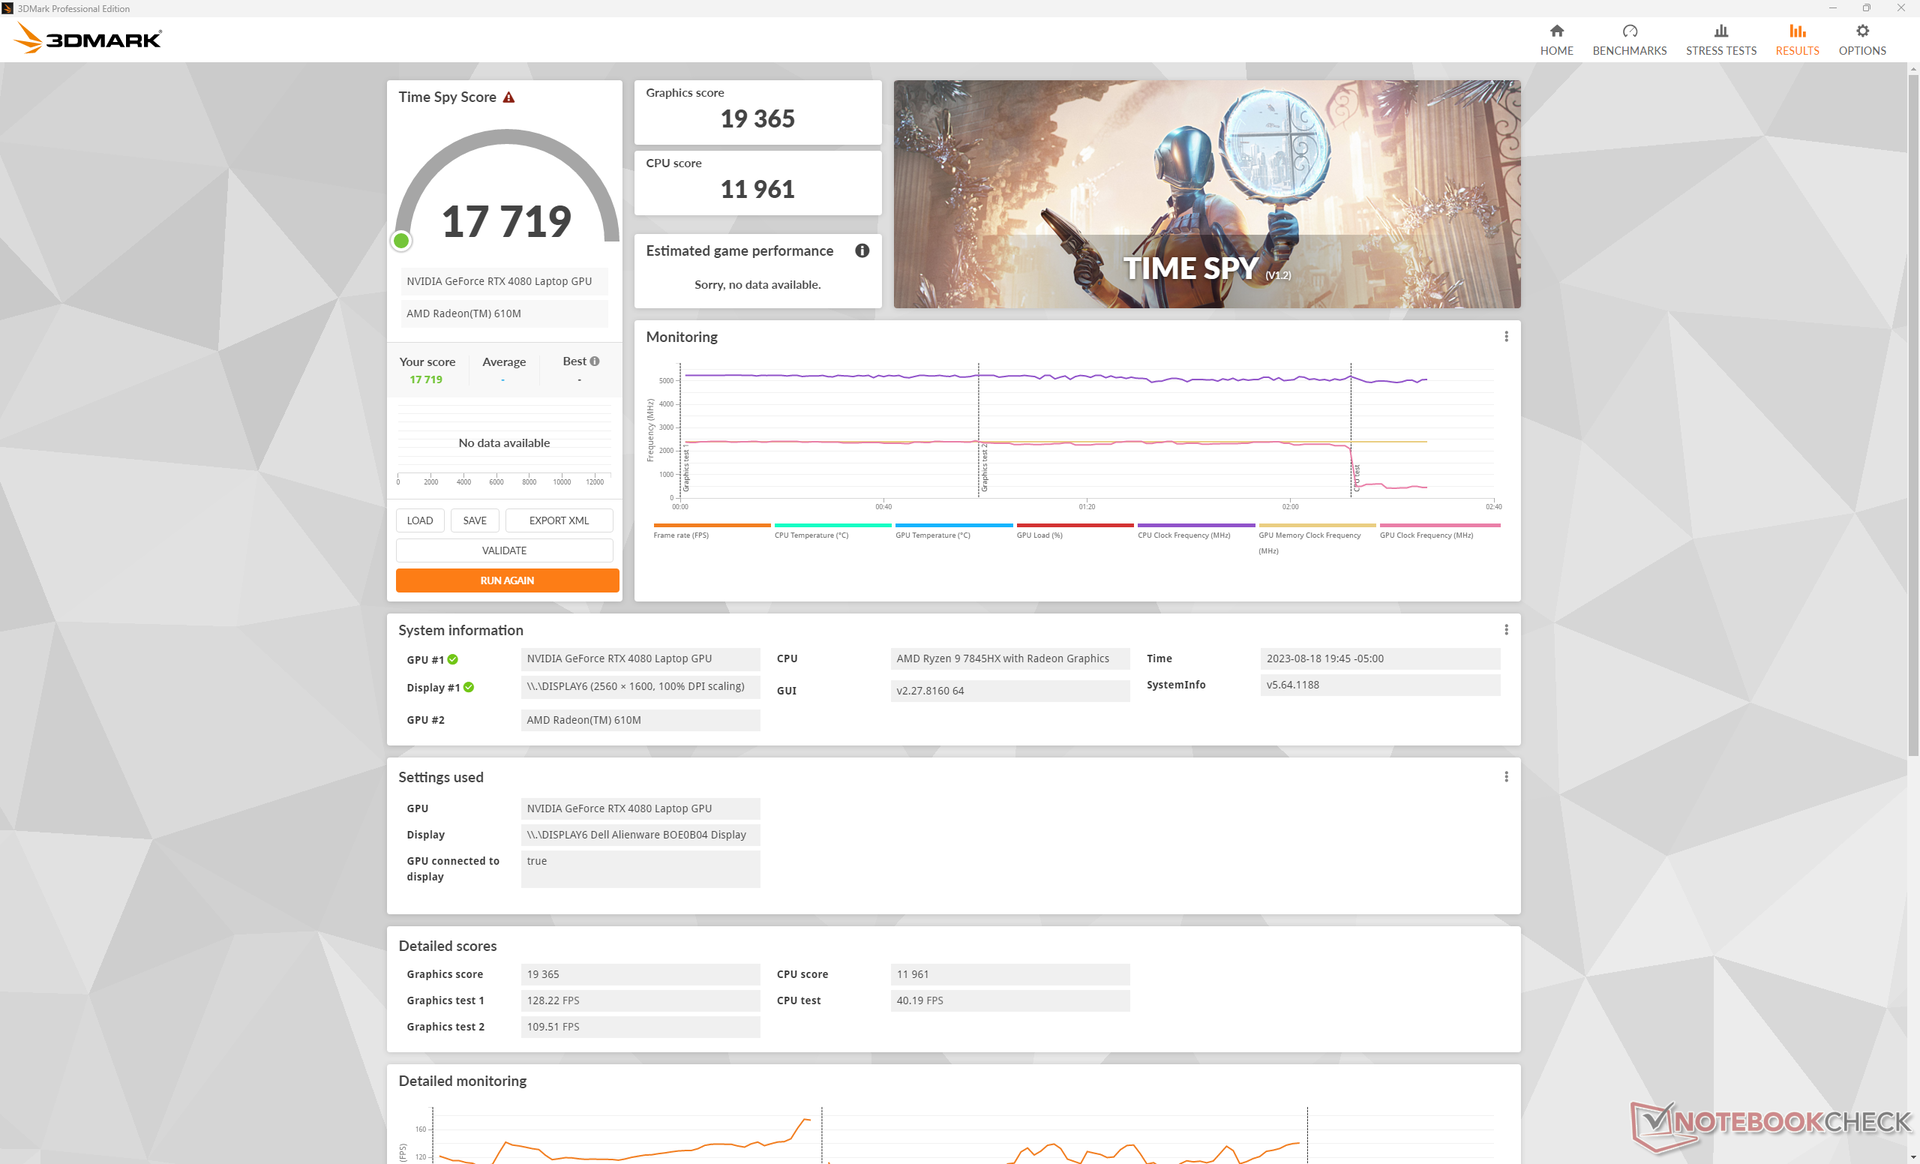
| 3DMark 11 Performance | 40681 pontos | |
| 3DMark Fire Strike Score | 35751 pontos | |
| 3DMark Time Spy Score | 17719 pontos | |
Ajuda | ||
* ... menor é melhor
Desempenho em jogos
O desempenho em jogos é excelente, com resultados de 5 a 10% mais rápidos do que outros notebooks com a mesma GPU RTX 4080, conforme previsto pelo 3DMark. Os benefícios também se estendem às configurações gráficas mais baixas, o que pode ajudar os jogadores que preferem maximizar as taxas de quadros em vez da resolução. A RTX 4080 móvel é potente o suficiente para reproduzir qualquer título atual na resolução QHD+ nativa a mais de 60 FPS, embora seja muito mais fraca do que uma rTX 4080 para desktop.
Infelizmente, a estabilidade do desempenho não é perfeita. Quando estava ocioso no Witcher 3, por exemplo, as taxas de quadros ocasionalmente caíam para 70 FPS antes de voltarem para a faixa de mais de 150 FPS, conforme mostrado no gráfico abaixo. Isso sugere uma otimização deficiente dos recursos em segundo plano que podem estar interrompendo o aplicativo em foco.
Witcher 3 FPS Chart
| baixo | média | alto | ultra | QHD | 4K | |
|---|---|---|---|---|---|---|
| The Witcher 3 (2015) | 573.1 | 452.2 | 349.3 | 169.7 | 121.5 | |
| Dota 2 Reborn (2015) | 229 | 191.8 | 180.4 | 164.7 | 161 | |
| Final Fantasy XV Benchmark (2018) | 230 | 218 | 167.6 | 131.6 | 76.1 | |
| X-Plane 11.11 (2018) | 171.1 | 149 | 113.1 | 95 | ||
| Far Cry 5 (2018) | 160 | 145 | 141 | 136 | 131 | 91 |
| Strange Brigade (2018) | 572 | 461 | 400 | 357 | 248 | 123.1 |
| Cyberpunk 2077 1.6 (2022) | 154 | 151.4 | 137.5 | 128.3 | 84.5 | 39.7 |
| Tiny Tina's Wonderlands (2022) | 317.1 | 265.9 | 201.1 | 160.8 | 112.9 | 59 |
| F1 22 (2022) | 323 | 296 | 285 | 124.2 | 78.1 | 39.5 |
| Returnal (2023) | 128 | 122 | 117 | 107 | 80 | 44 |
Emissões
Ruído do sistema - grandes diferenças entre os perfis de potência
Os ventiladores estão quase sempre ativos, com pouco menos de 30 dB(A) contra um fundo silencioso de 23 dB(A). Embora audível, o ruído é pelo menos estável, pois as ventoinhas não pulsam mais alto ao executar cargas pouco exigentes, como navegadores ou vídeo.
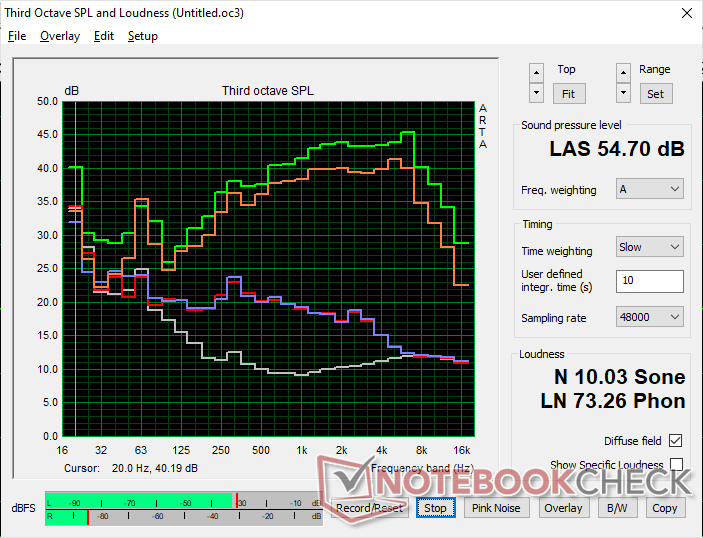
O ruído da ventoinha ao jogar nos modos Balanced, Performance ou Overdrive pode chegar a 49,4 dB(A), 51 dB(A) e 54,7 dB(A), respectivamente. Como a perda de desempenho no modo Balanced é mínima, conforme mencionado acima, os usuários podem considerar a possibilidade de jogar no modo Balanced em vez de no modo Performance ou Overdrive, pois o ruído do ventilador é visivelmente mais baixo. Outros notebooks para jogos de 16 polegadas, como o Razer Blade 16 ou o Omen Transcend 16 tendem a se estabilizar na faixa mais alta de 50 dB(A), de baixa a média, durante a execução de jogos.

Barulho
| Ocioso |
| 22.9 / 29.7 / 29.7 dB |
| Carga |
| 29.8 / 54.7 dB |
 | ||
30 dB silencioso 40 dB(A) audível 50 dB(A) ruidosamente alto |
||
min: | ||
| Alienware m16 R1 AMD GeForce RTX 4080 Laptop GPU, R9 7845HX, Kioxia XG8 KXG80ZNV1T02 | Alienware x16 R1 GeForce RTX 4080 Laptop GPU, i9-13900HK, SK hynix PC801 HFS001TEJ9X101N | HP Omen Transcend 16 GeForce RTX 4070 Laptop GPU, i9-13900HX, SK hynix PC801 HFS002TEJ9X101N | Lenovo Legion Pro 7 RTX4090 GeForce RTX 4090 Laptop GPU, i9-13900HX, Samsung PM9A1 MZVL21T0HCLR | Asus ROG Strix G16 G614JZ GeForce RTX 4080 Laptop GPU, i9-13980HX, WD PC SN560 SDDPNQE-1T00 | Razer Blade 16 Early 2023 GeForce RTX 4080 Laptop GPU, i9-13950HX, SSSTC CA6-8D1024 | |
|---|---|---|---|---|---|---|
| Noise | 0% | -11% | -17% | -9% | 4% | |
| desligado / ambiente * (dB) | 22.9 | 22.7 1% | 22.9 -0% | 25 -9% | 25 -9% | 23 -0% |
| Idle Minimum * (dB) | 22.9 | 23.1 -1% | 29.1 -27% | 28 -22% | 26 -14% | 23 -0% |
| Idle Average * (dB) | 29.7 | 25.8 13% | 29.1 2% | 30 -1% | 28 6% | 23 23% |
| Idle Maximum * (dB) | 29.7 | 25.8 13% | 29.1 2% | 38 -28% | 30 -1% | 23.6 21% |
| Load Average * (dB) | 29.8 | 39.3 -32% | 45.7 -53% | 48 -61% | 48 -61% | 39 -31% |
| Witcher 3 ultra * (dB) | 54.7 | 49.9 9% | 54.3 1% | 53 3% | 49 10% | 51.6 6% |
| Load Maximum * (dB) | 54.7 | 54.8 -0% | 54.3 1% | 55 -1% | 52 5% | 51.3 6% |
* ... menor é melhor
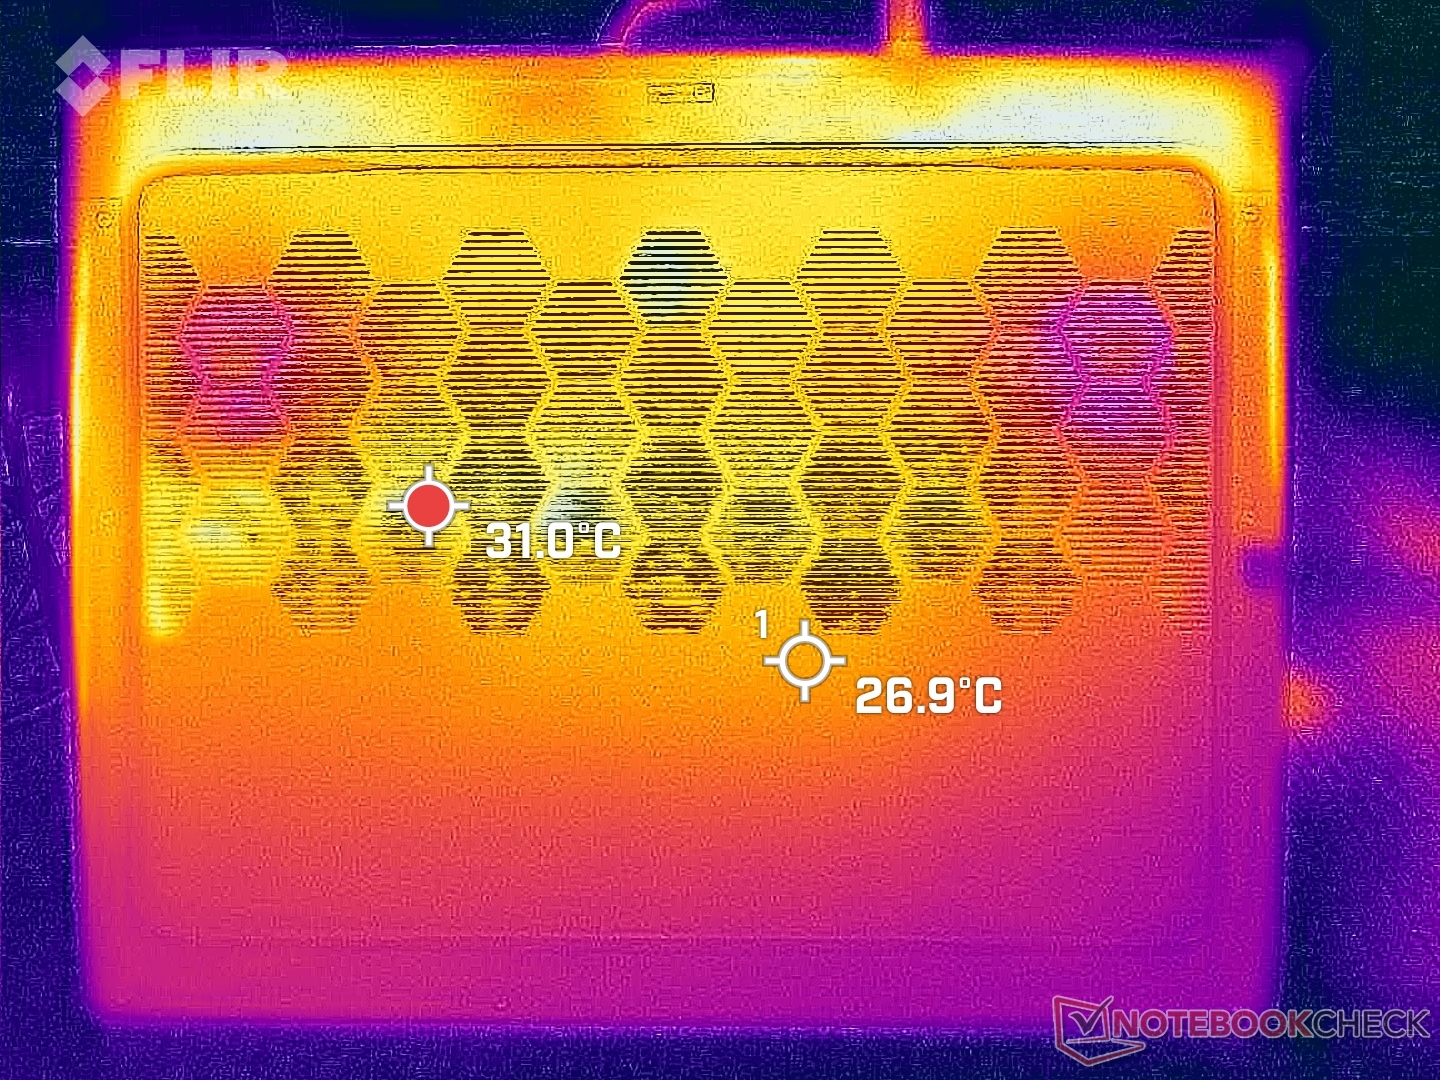
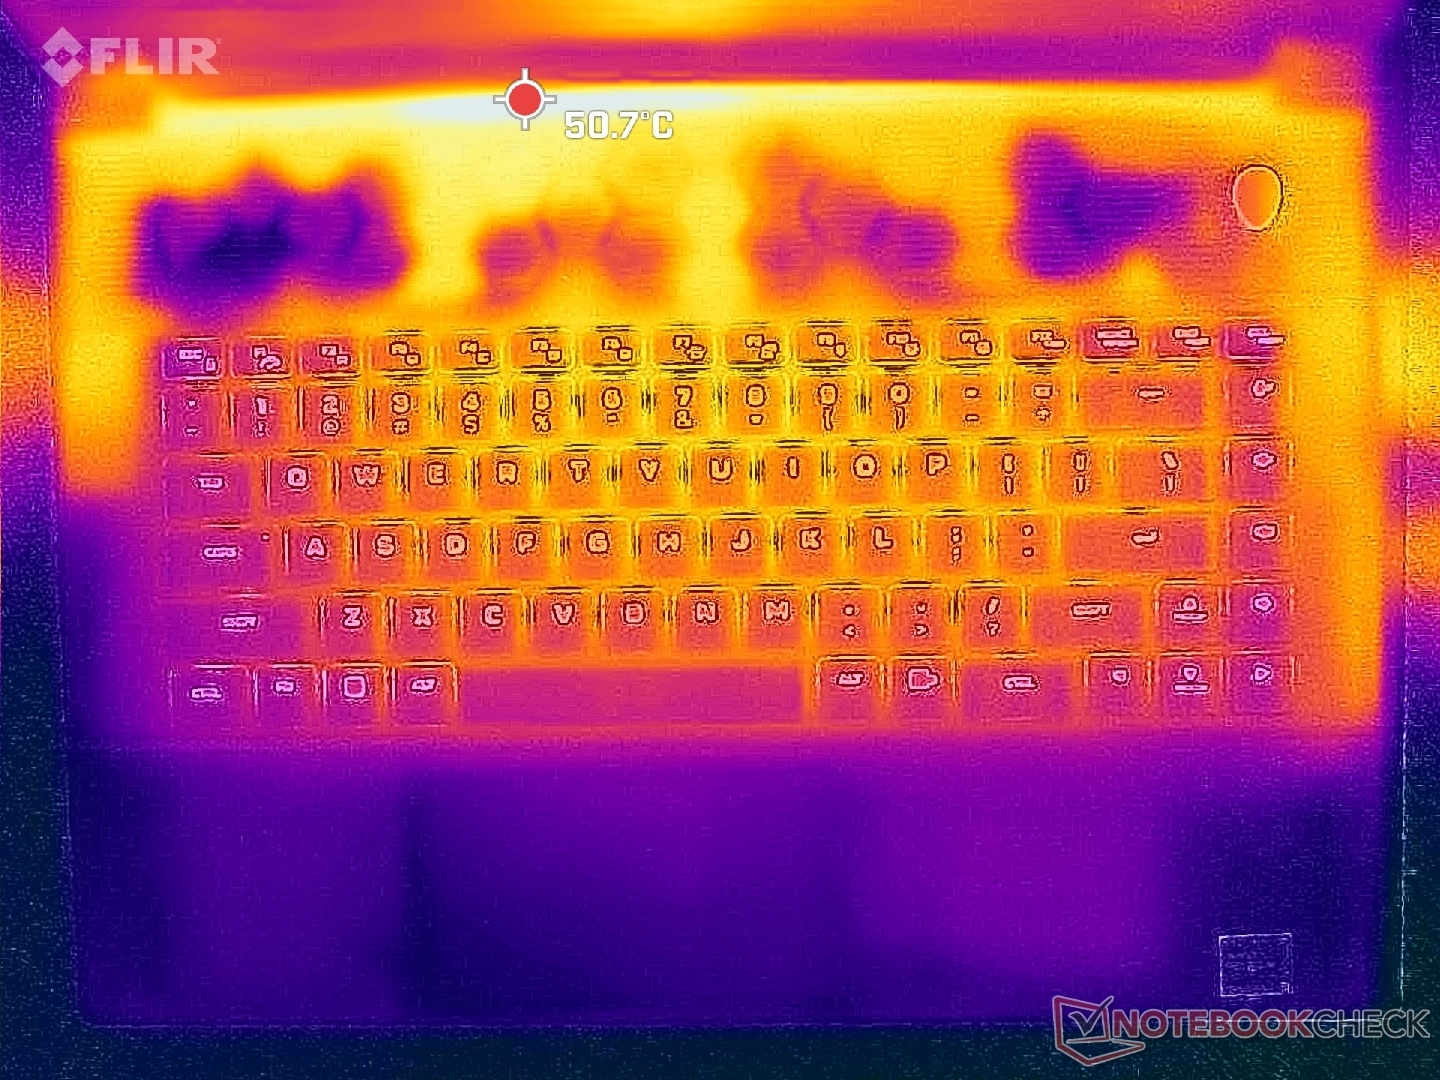
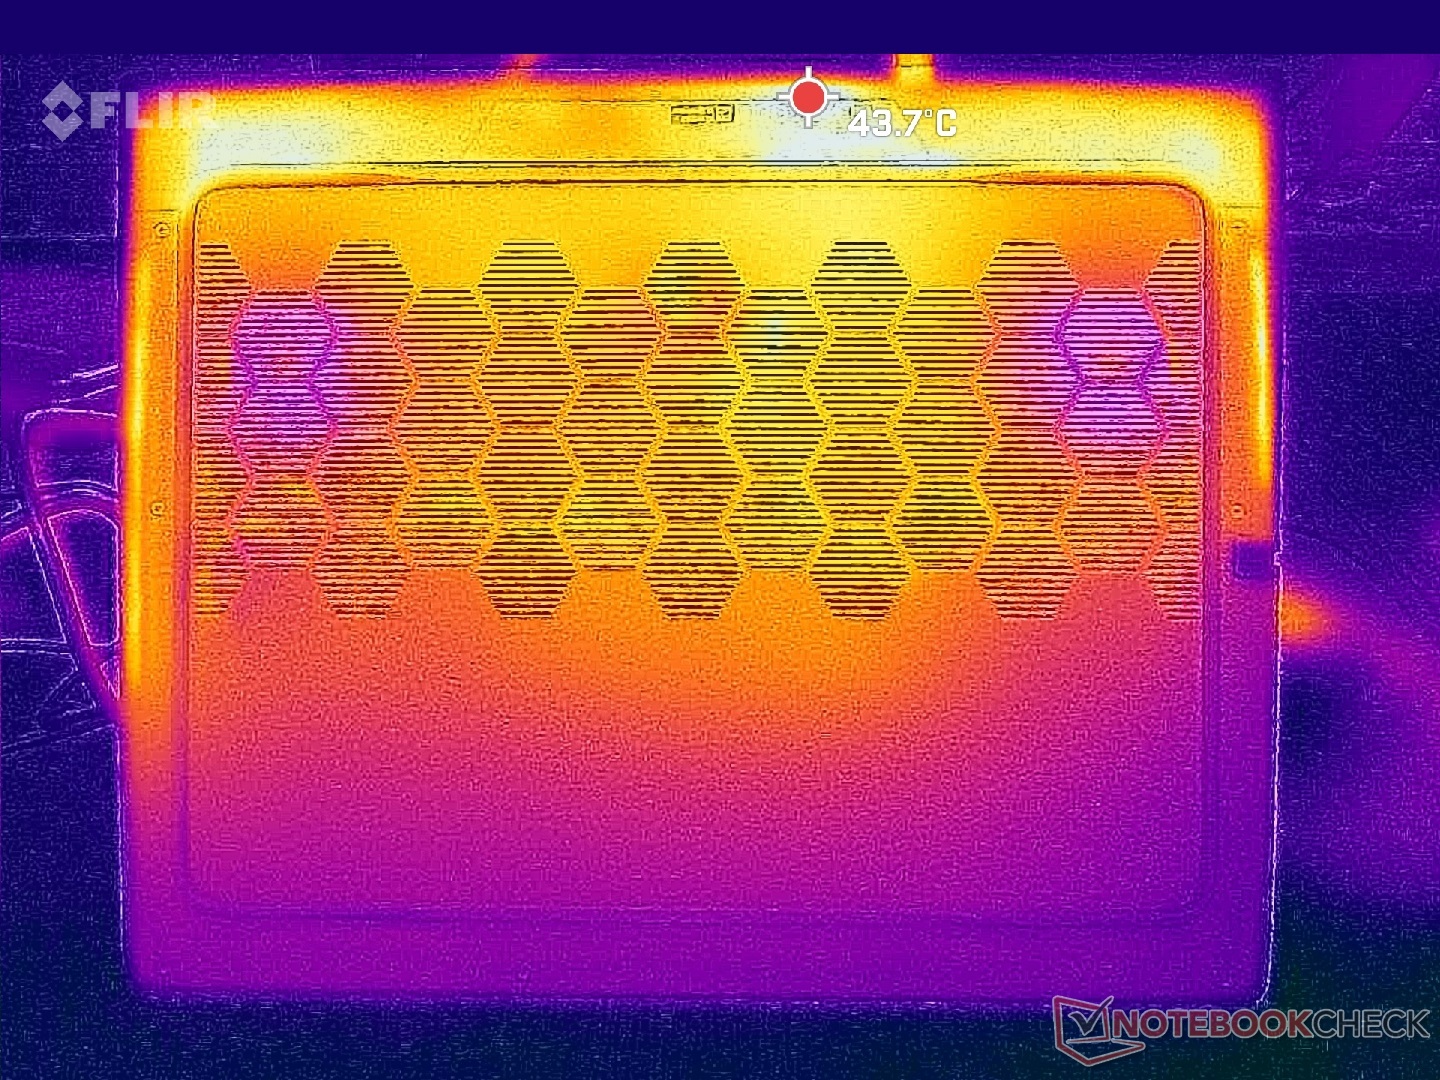
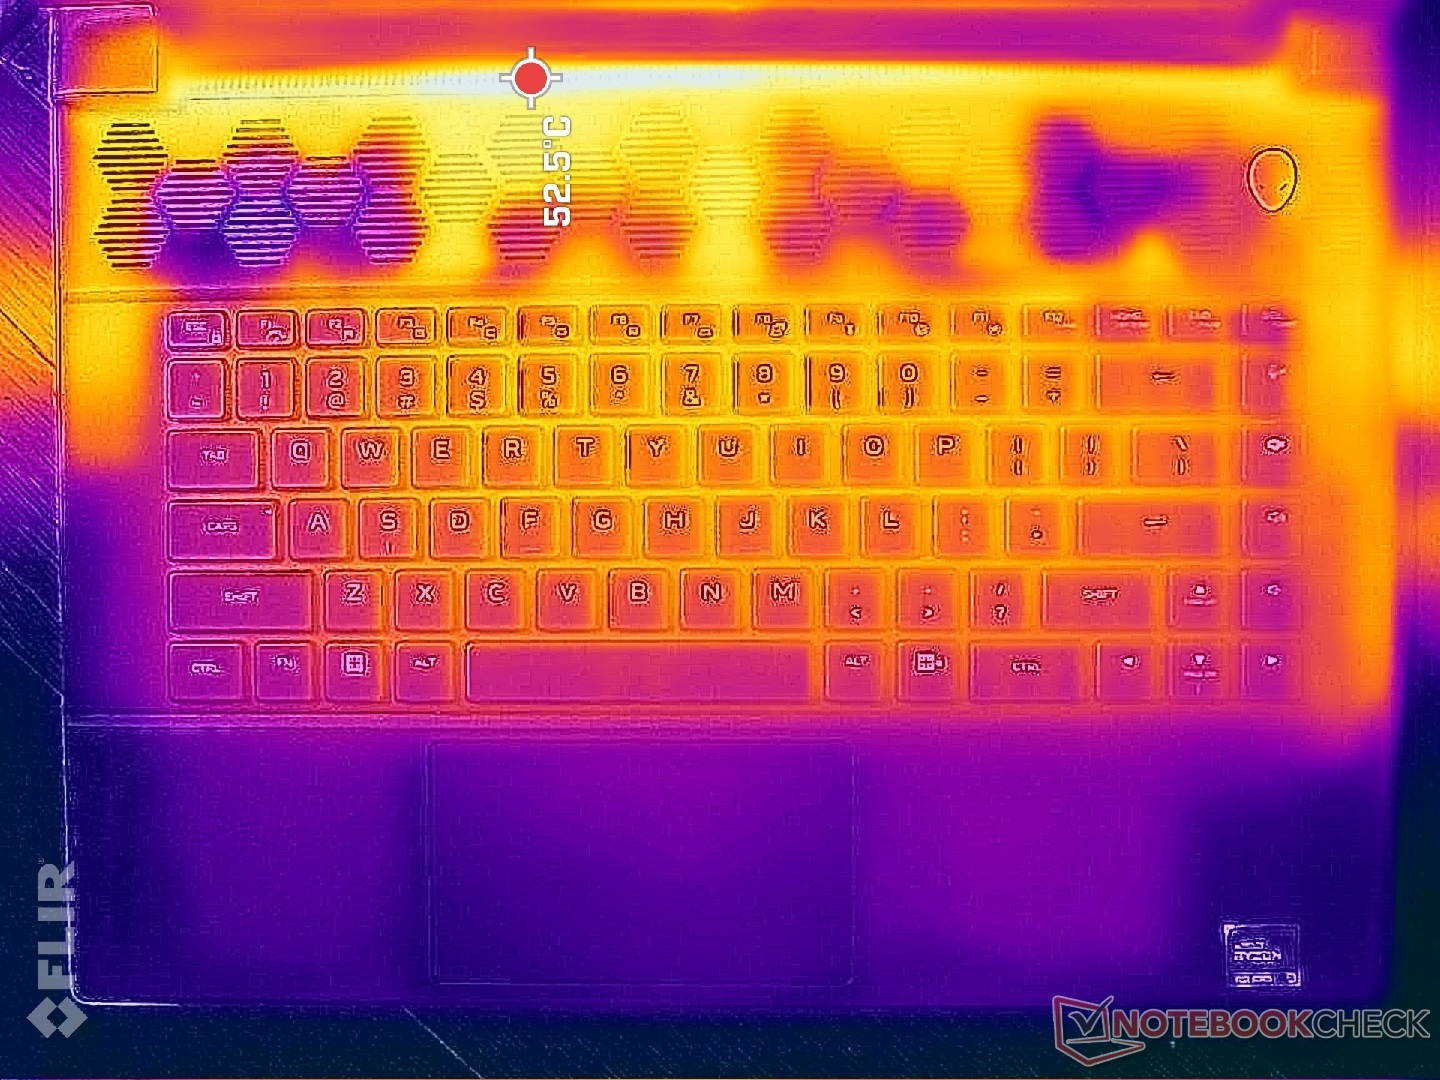
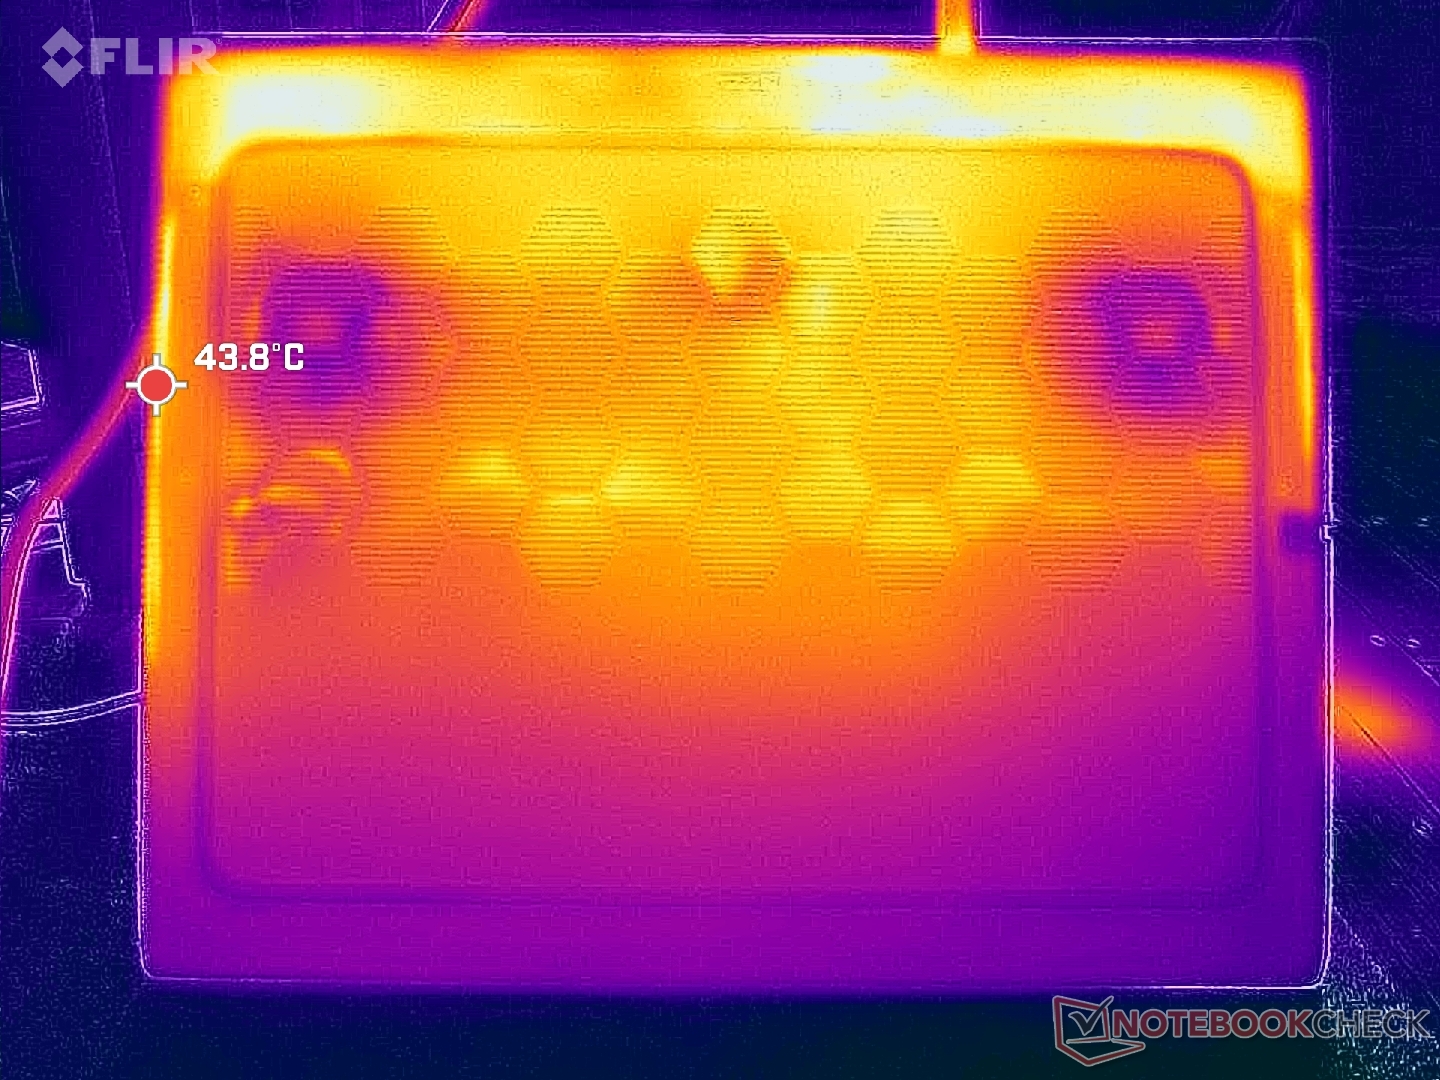
Temperatura
As temperaturas da superfície podem ser muito quentes, chegando a 50 °C na parte traseira. Felizmente, as regiões dos apoios para as mãos e do teclado permanecem mais frias ao toque, proporcionando maior conforto, em parte devido às amplas grades de ventilação. A parte central do teclado, por exemplo, atinge 42 °C quando se está jogando, em comparação com 46 °C no Lenovo Legion Pro 7 16.
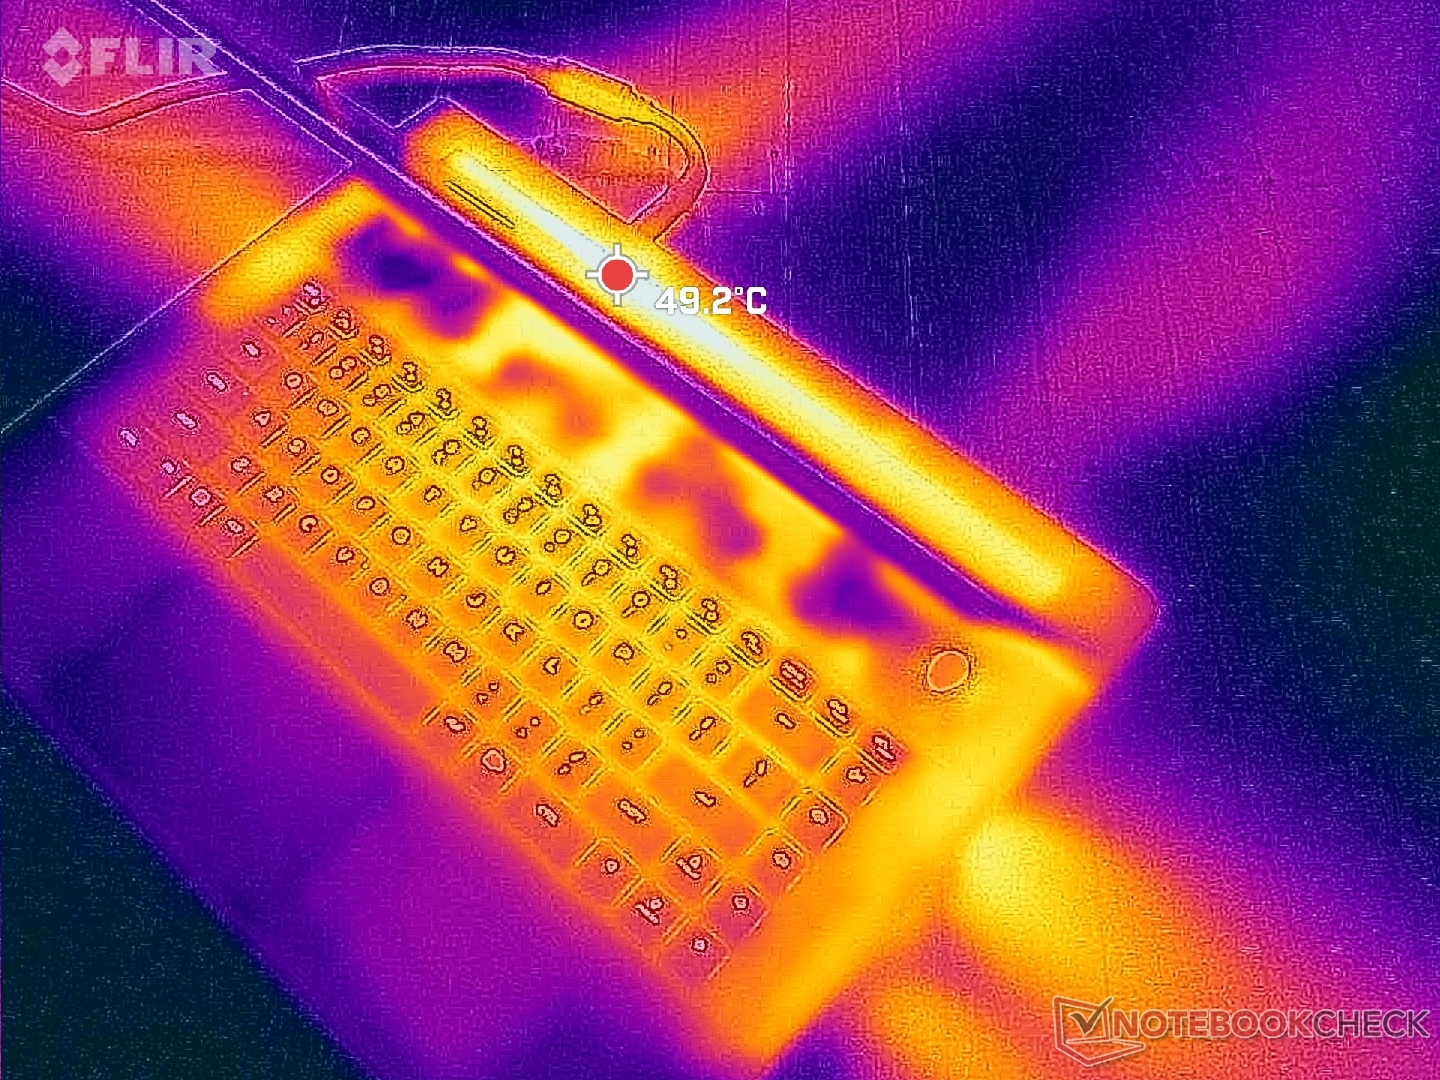
(-) A temperatura máxima no lado superior é 48 °C / 118 F, em comparação com a média de 40.4 °C / 105 F , variando de 21.2 a 68.8 °C para a classe Gaming.
(+) A parte inferior aquece até um máximo de 39 °C / 102 F, em comparação com a média de 43.2 °C / 110 F
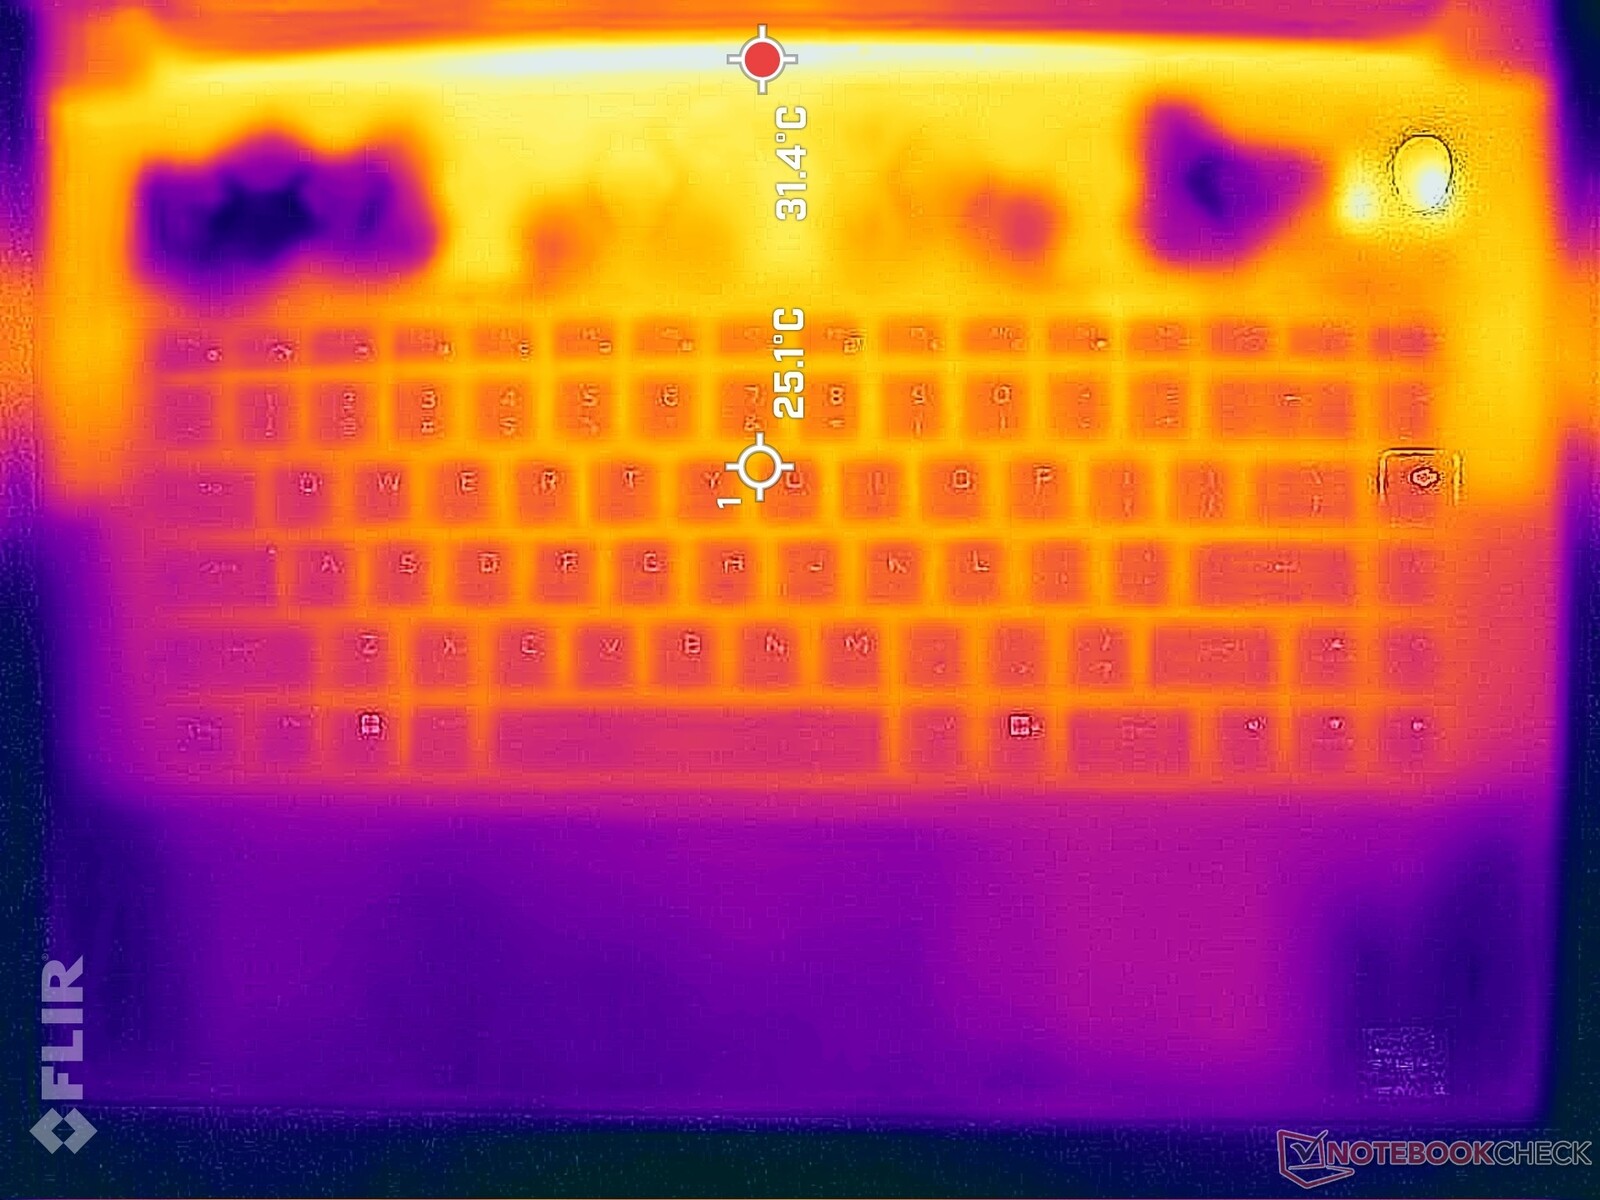
(±) Em uso inativo, a temperatura média para o lado superior é 32.2 °C / 90 F, em comparação com a média do dispositivo de 33.9 °C / ### class_avg_f### F.
(-) Jogando The Witcher 3, a temperatura média para o lado superior é 38.1 °C / 101 F, em comparação com a média do dispositivo de 33.9 °C / ## #class_avg_f### F.
(+) Os apoios para as mãos e o touchpad são mais frios que a temperatura da pele, com um máximo de 30.4 °C / 86.7 F e, portanto, são frios ao toque.
(±) A temperatura média da área do apoio para as mãos de dispositivos semelhantes foi 28.8 °C / 83.8 F (-1.6 °C / -2.9 F).
| Alienware m16 R1 AMD AMD Ryzen 9 7845HX, NVIDIA GeForce RTX 4080 Laptop GPU | Alienware x16 R1 Intel Core i9-13900HK, NVIDIA GeForce RTX 4080 Laptop GPU | HP Omen Transcend 16 Intel Core i9-13900HX, NVIDIA GeForce RTX 4070 Laptop GPU | Lenovo Legion Pro 7 RTX4090 Intel Core i9-13900HX, NVIDIA GeForce RTX 4090 Laptop GPU | Asus ROG Strix G16 G614JZ Intel Core i9-13980HX, NVIDIA GeForce RTX 4080 Laptop GPU | Razer Blade 16 Early 2023 Intel Core i9-13950HX, NVIDIA GeForce RTX 4080 Laptop GPU | |
|---|---|---|---|---|---|---|
| Heat | -5% | 1% | -10% | -6% | 12% | |
| Maximum Upper Side * (°C) | 48 | 47.2 2% | 47.4 1% | 53 -10% | 54 -13% | 40 17% |
| Maximum Bottom * (°C) | 39 | 47.8 -23% | 54.4 -39% | 59 -51% | 55 -41% | 37.6 4% |
| Idle Upper Side * (°C) | 37 | 36.8 1% | 28.4 23% | 34 8% | 29 22% | 32.4 12% |
| Idle Bottom * (°C) | 36.2 | 35.8 1% | 29.2 19% | 32 12% | 33 9% | 31.4 13% |
* ... menor é melhor
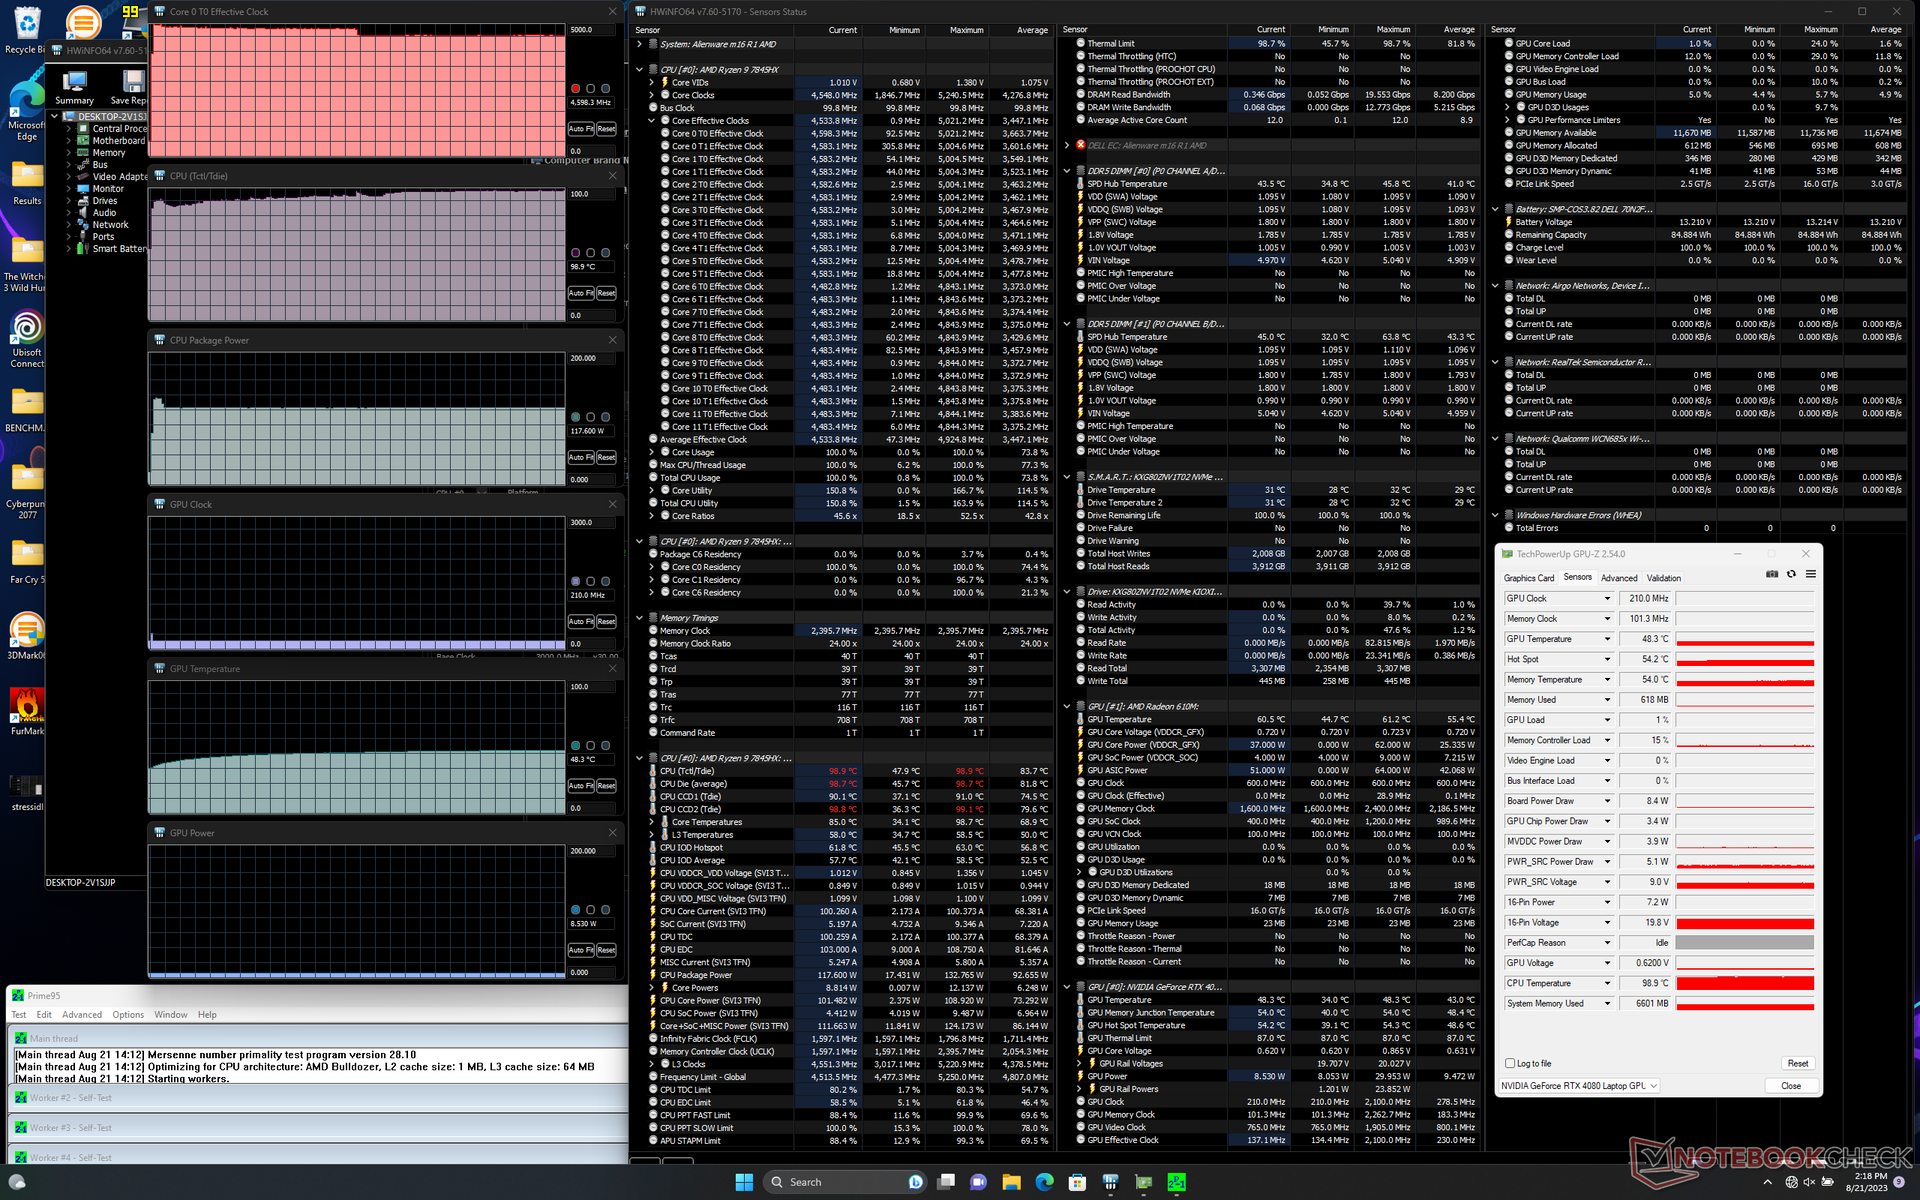
Teste de estresse
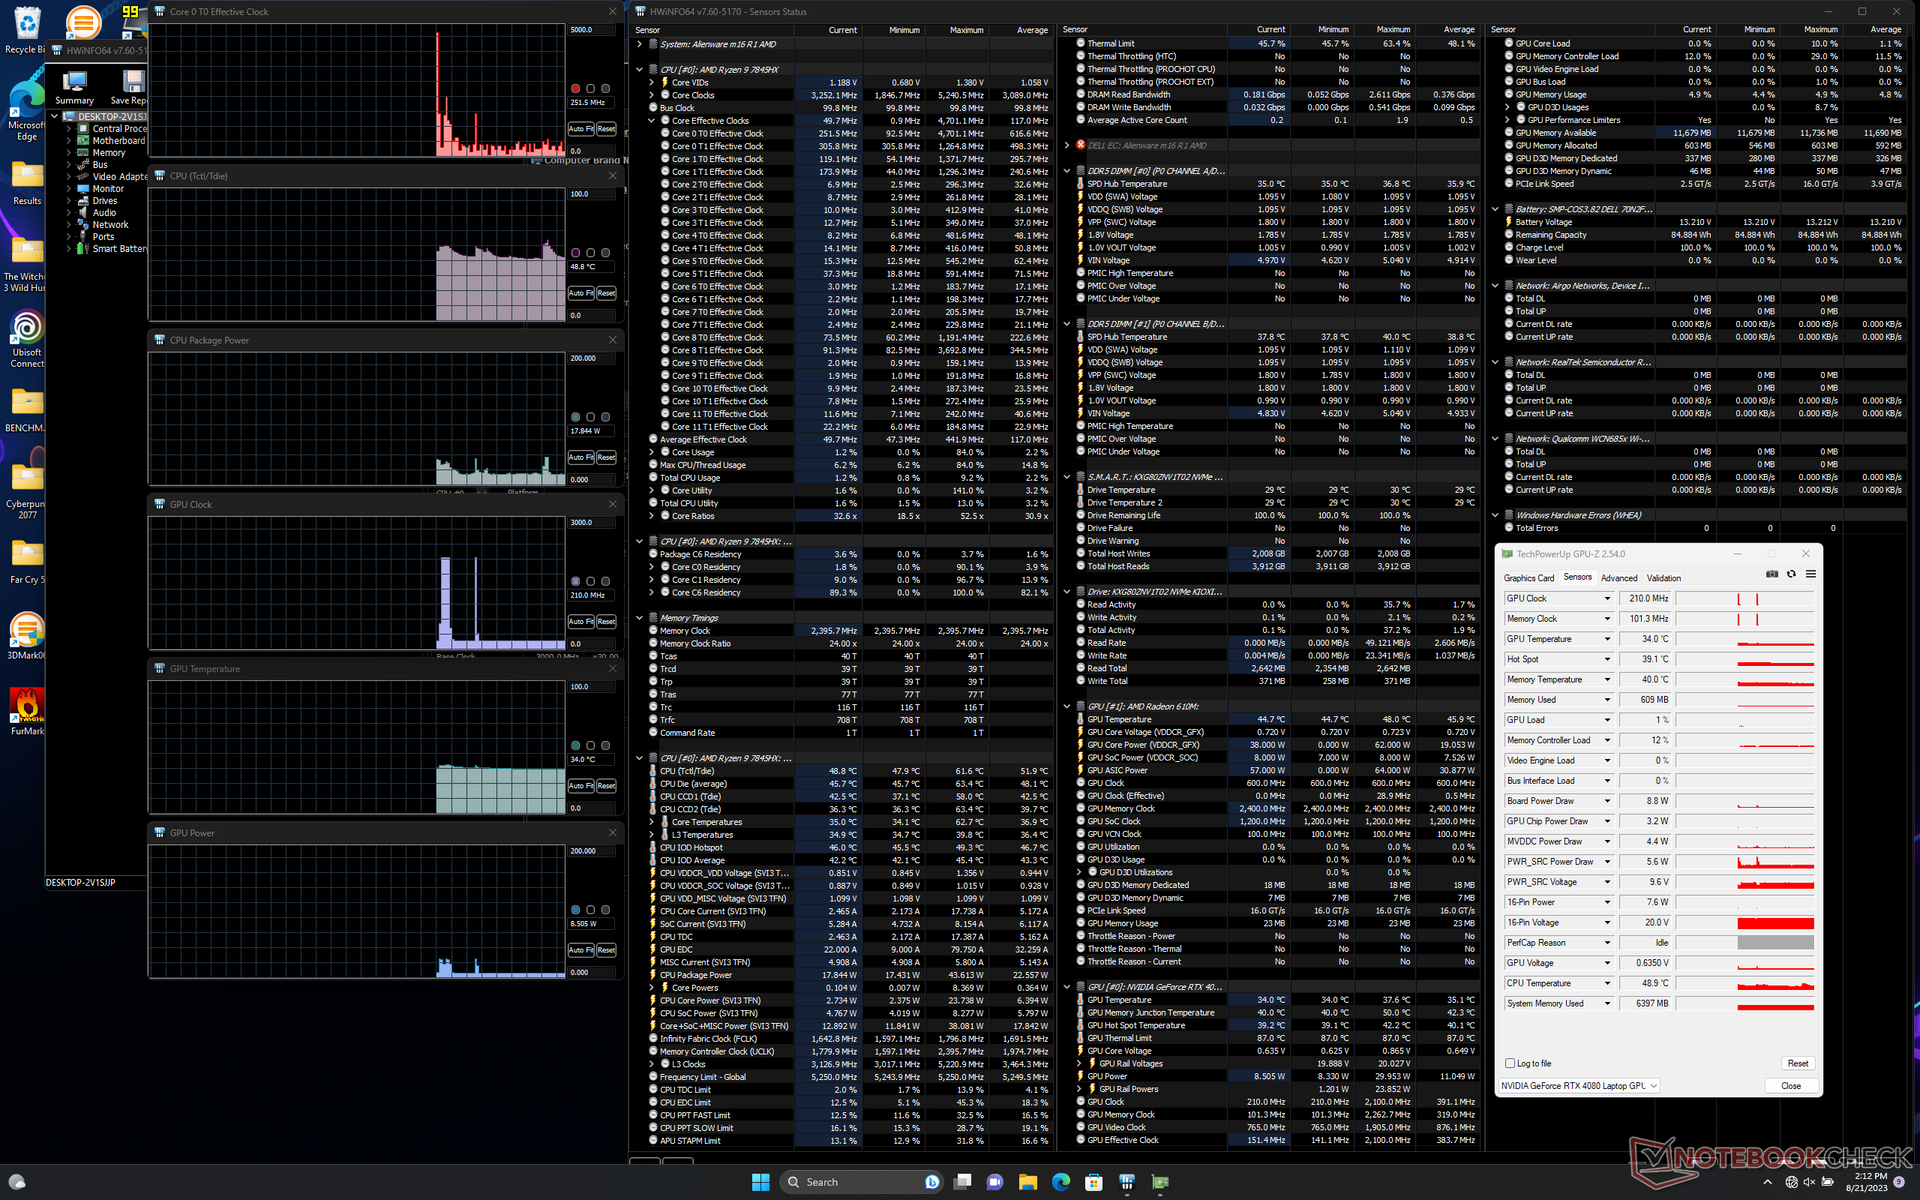
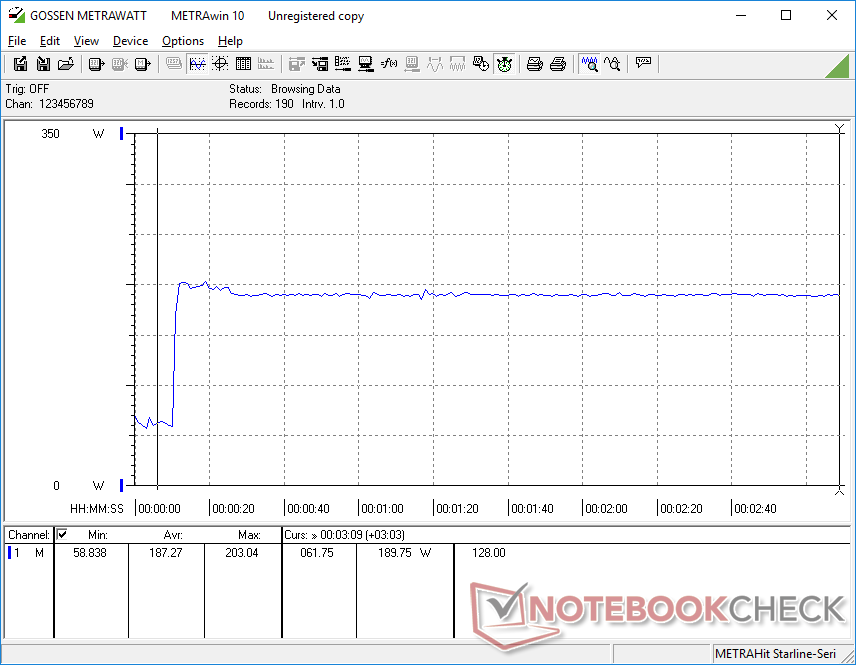
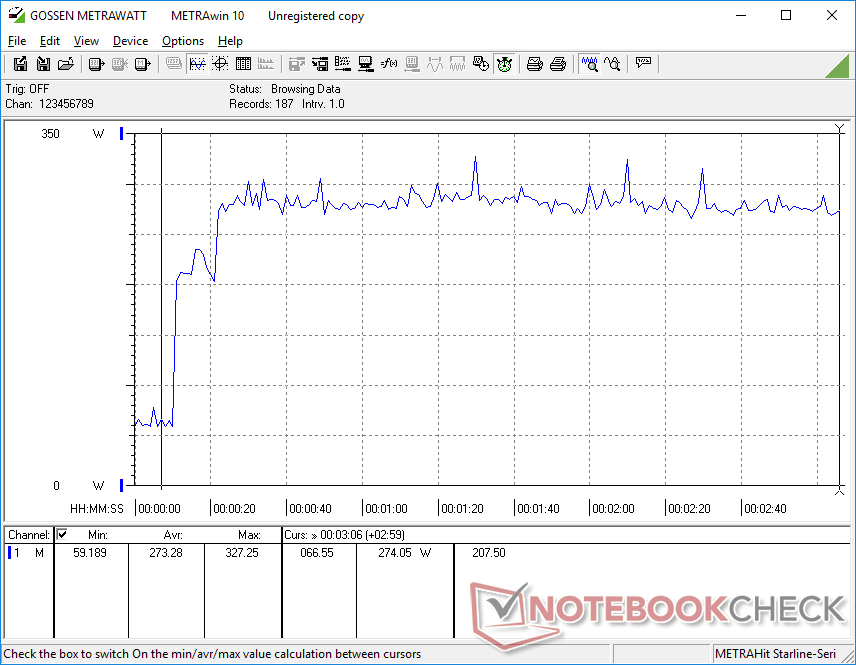
A inicialização do Prime95 faz com que a CPU aumente para 5 GHz, 132 W e 99 C por vários segundos antes de se estabilizar em 4,6 GHz, 118 W e 85 C.
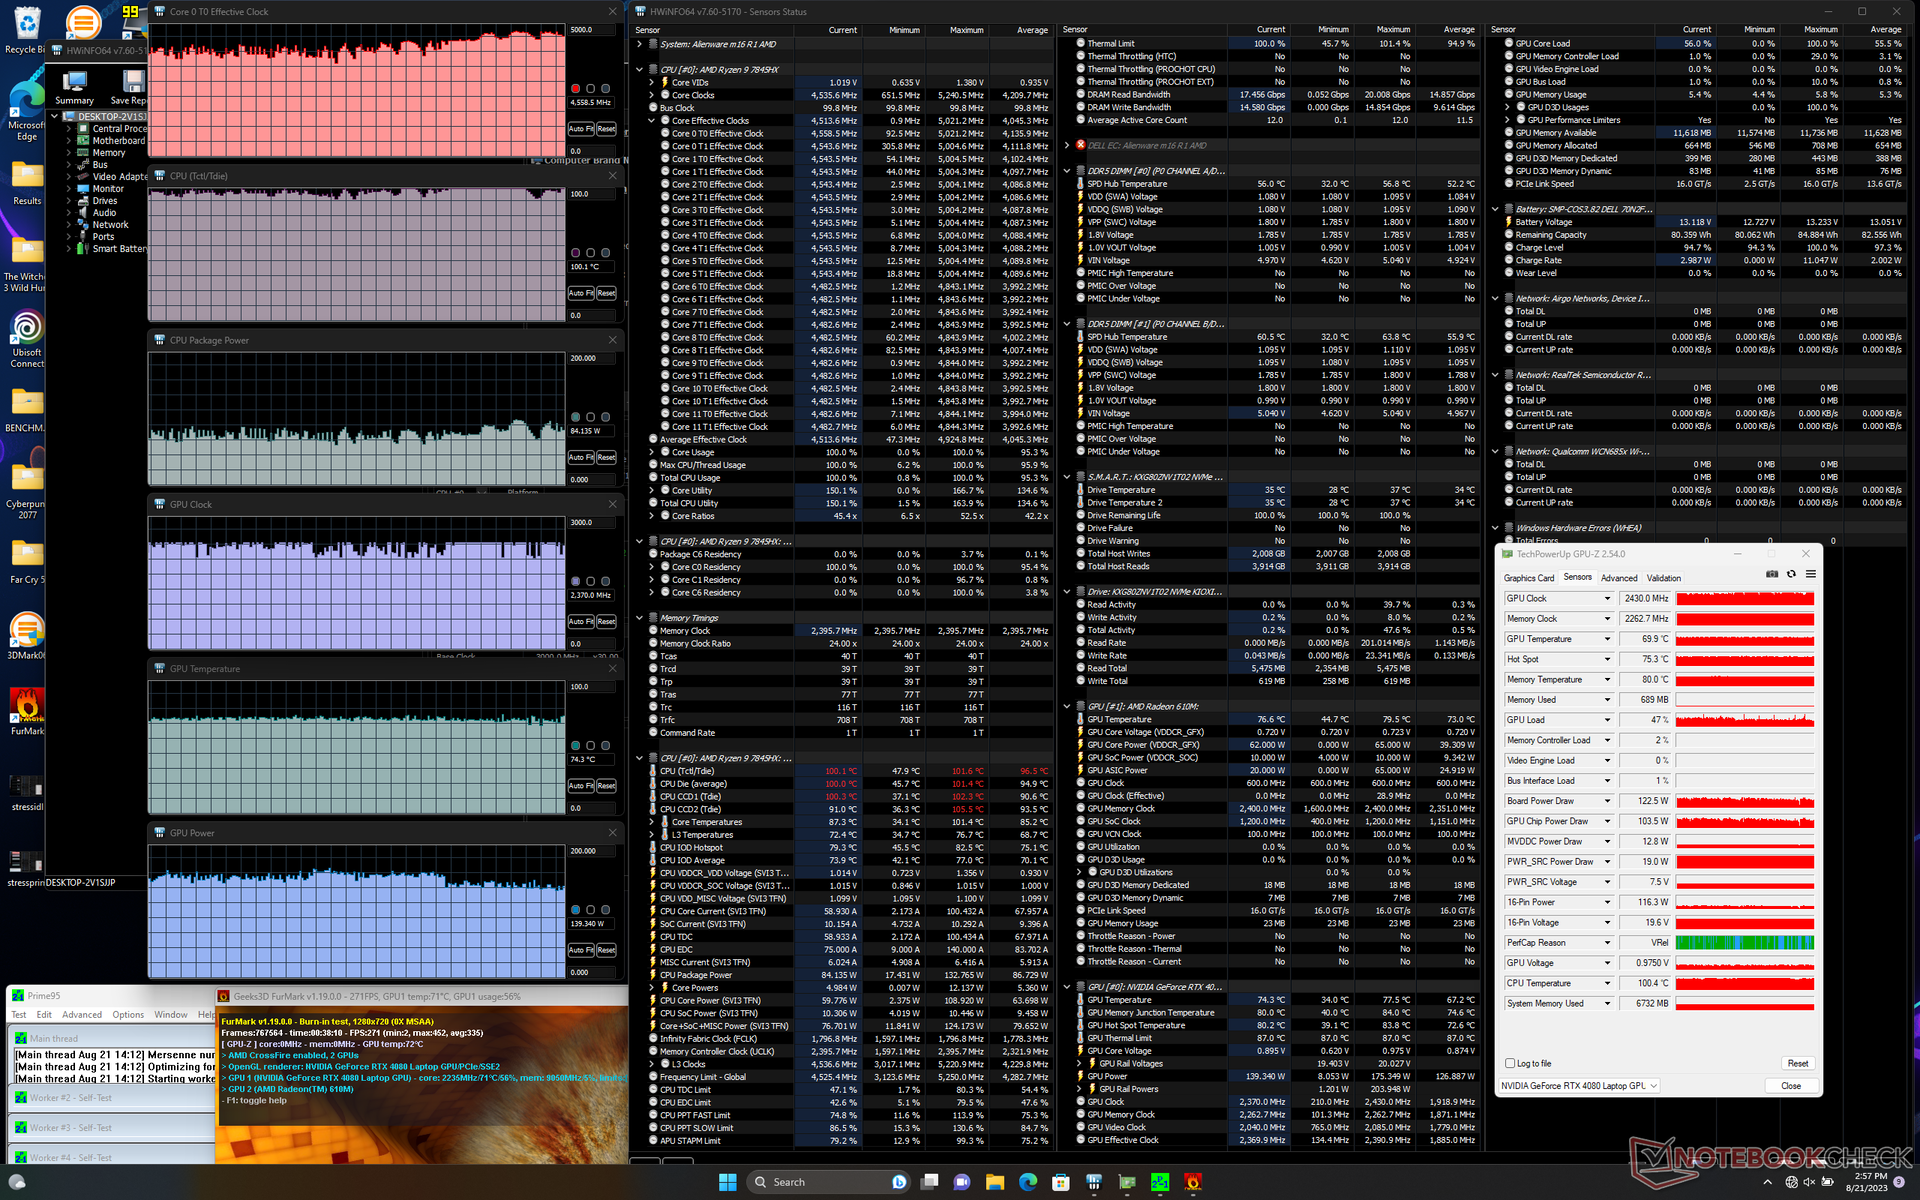
A execução do Witcher 3 no modo Overdrive, a GPU se estabilizaria em 2430 MHz de clock, 2263 MHz de VRAM e 158 W de consumo de energia da placa, em comparação com 2415 MHz de clock, 2250 MHz de VRAM e 156 W no modo Balanced, de acordo com o GPU-Z. As diferenças de desempenho muito pequenas entre os dois modos se alinham com nossas observações do site Fire Strike mencionadas acima. As temperaturas do núcleo seriam alguns graus mais quentes no modo Balanced em comparação com o modo Overdrive, pois os ventiladores são visivelmente mais silenciosos no modo Balanced.
Observe que, embora a GPU seja classificada para 175 W TGP, só conseguimos atingir até 160 W em condições reais de jogo.
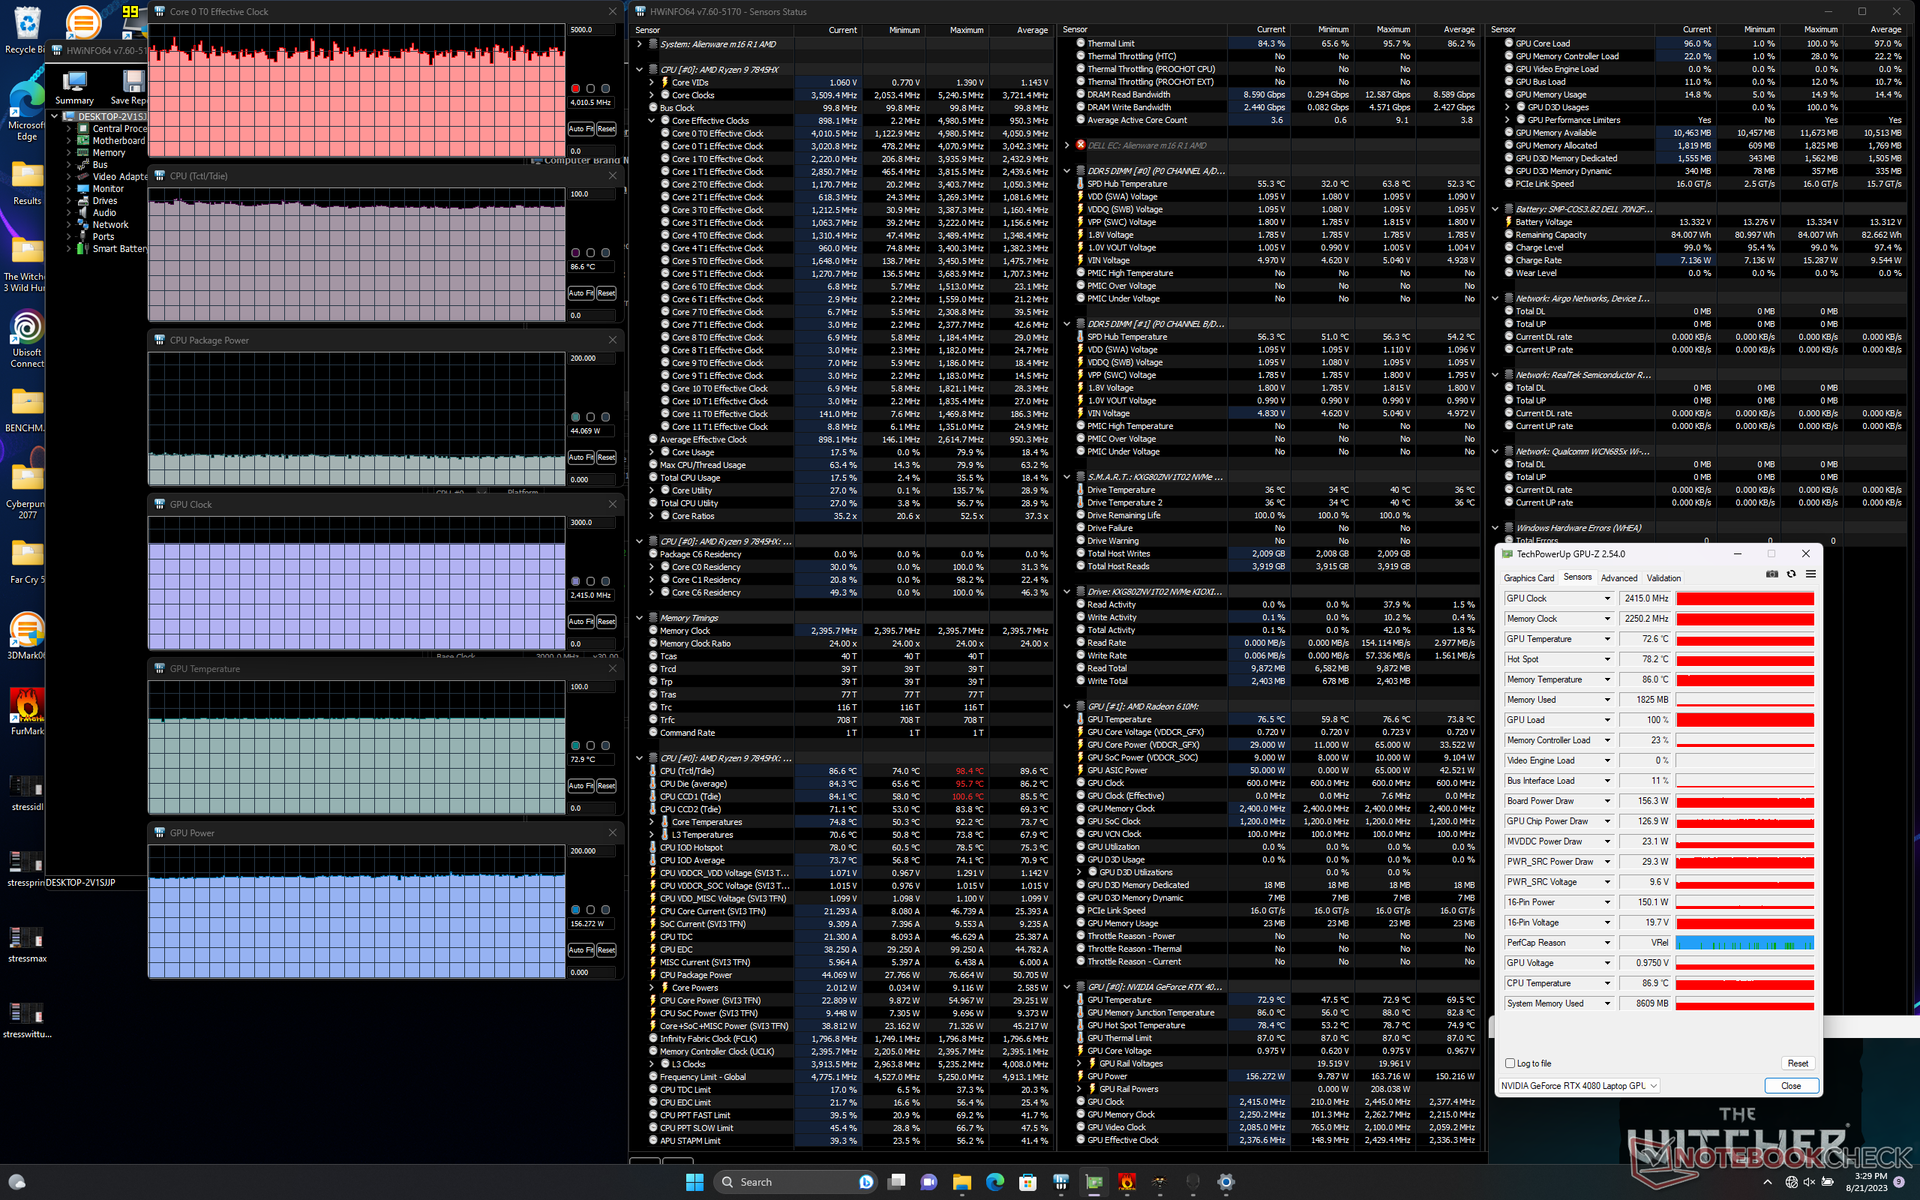
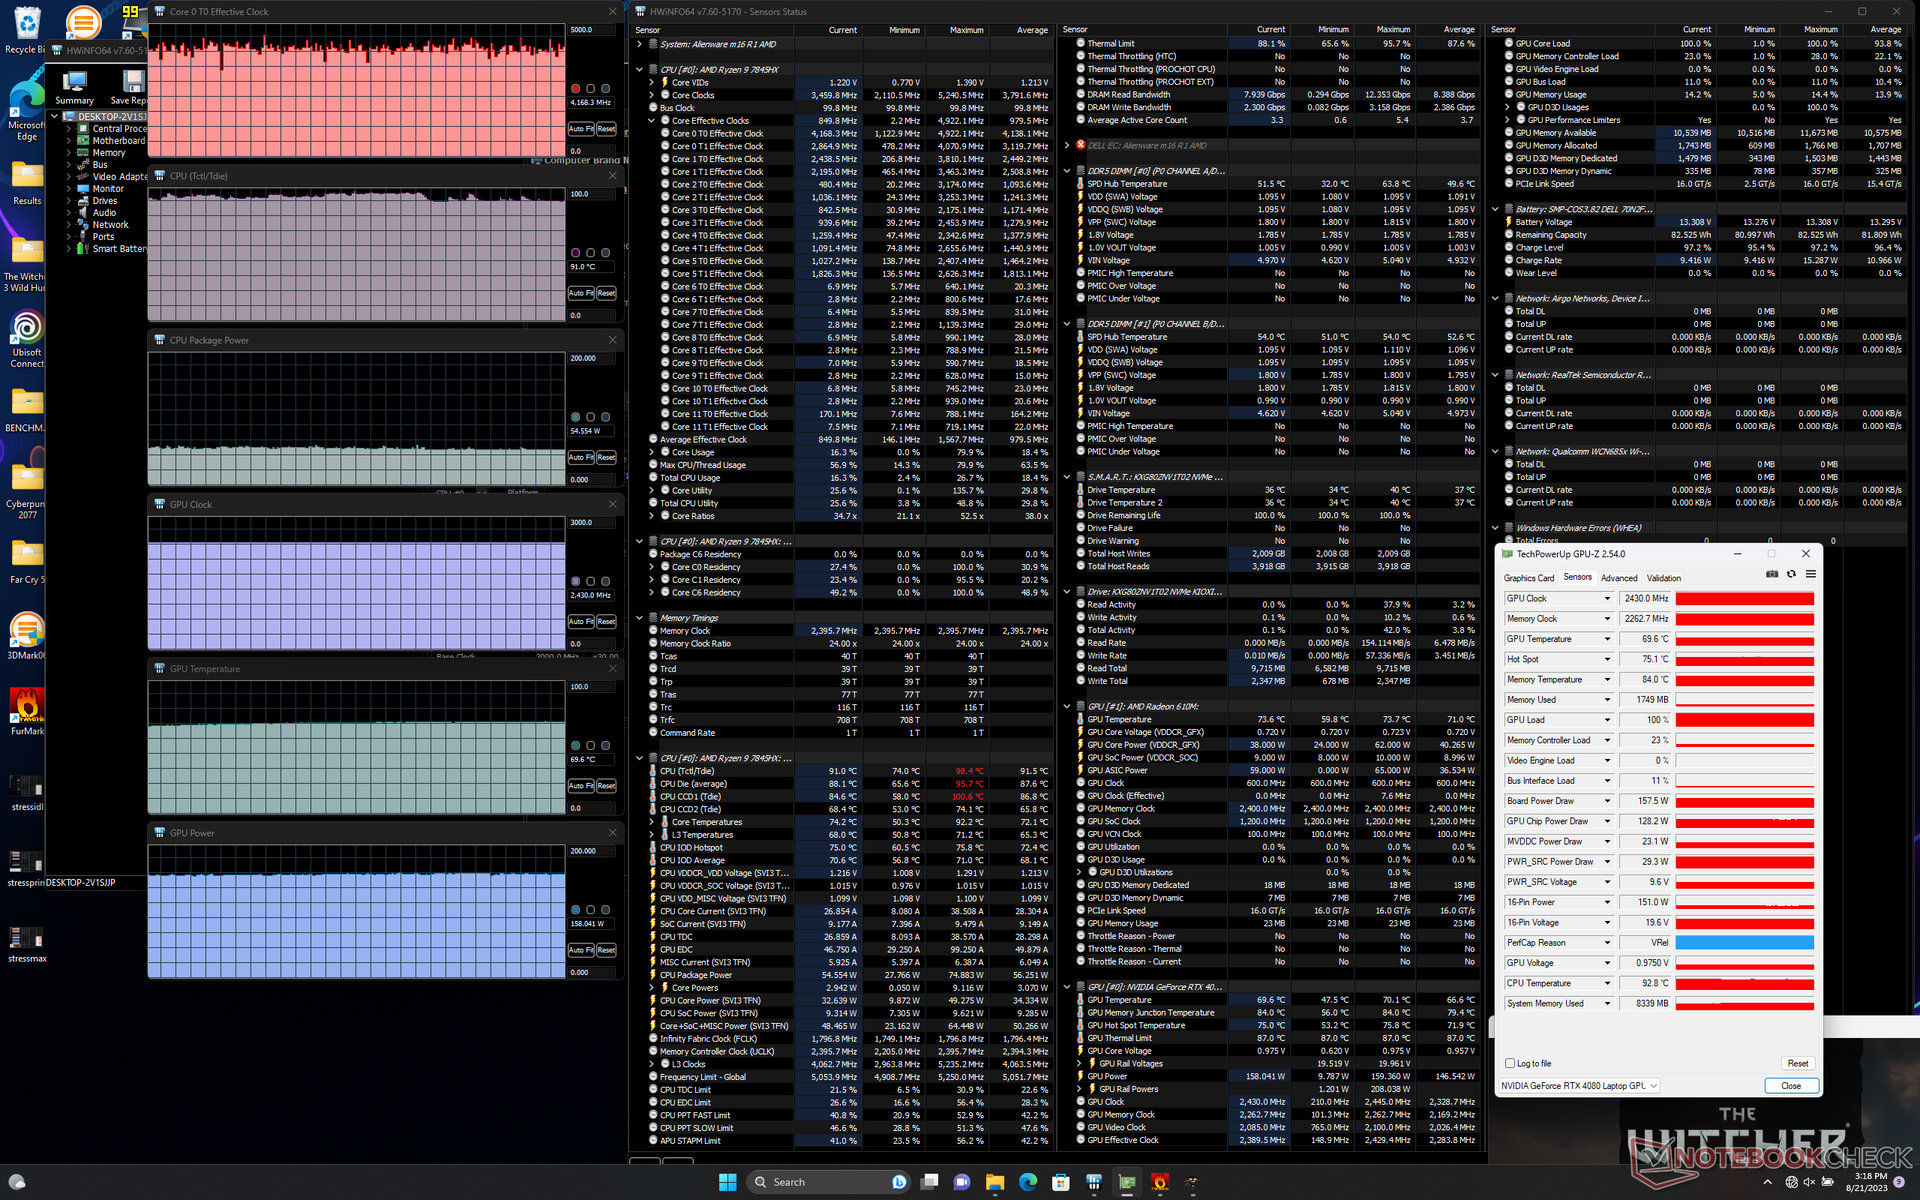
| Clock da CPU (GHz) | Clock da GPU (MHz) | Temperatura média da CPU (°C) | Temperatura média da GPU (°C) | |
| Sistema ocioso | -- | - | 49 | 34 |
| Estresse doPrime95 | 4.6 | -- | 85 | 49 |
| Estresse doPrime95 + FurMark | ~4.0 - 4.6 | ~2430 | 87 | 74 |
| Witcher 3 Estresse(modo balanceado) | ~4.1 | 2415 | 75 | 73 |
| Witcher 3 Estresse(modo Overdrive) | ~4.1 | 2430 | 74 | 70 |
Alto-falantes
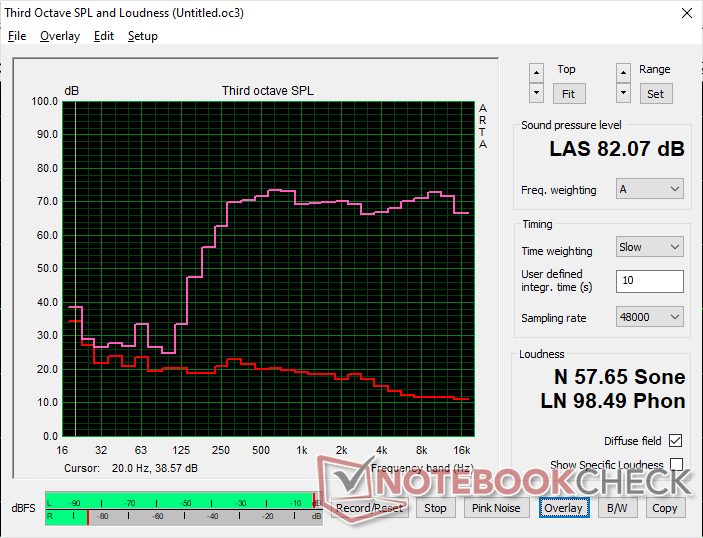
Alienware m16 R1 AMD análise de áudio
(+) | os alto-falantes podem tocar relativamente alto (###valor### dB)
Graves 100 - 315Hz
(-) | quase nenhum baixo - em média 20.6% menor que a mediana
(-) | graves não são lineares (15.3% delta para frequência anterior)
Médios 400 - 2.000 Hz
(+) | médios equilibrados - apenas 1.4% longe da mediana
(+) | médios são lineares (2.1% delta para frequência anterior)
Altos 2 - 16 kHz
(+) | agudos equilibrados - apenas 1.9% longe da mediana
(+) | os máximos são lineares (2.9% delta da frequência anterior)
Geral 100 - 16.000 Hz
(+) | o som geral é linear (13.9% diferença em relação à mediana)
Comparado com a mesma classe
» 22% de todos os dispositivos testados nesta classe foram melhores, 7% semelhantes, 70% piores
» O melhor teve um delta de 6%, a média foi 18%, o pior foi 132%
Comparado com todos os dispositivos testados
» 16% de todos os dispositivos testados foram melhores, 4% semelhantes, 80% piores
» O melhor teve um delta de 4%, a média foi 23%, o pior foi 134%
Apple MacBook Pro 16 2021 M1 Pro análise de áudio
(+) | os alto-falantes podem tocar relativamente alto (###valor### dB)
Graves 100 - 315Hz
(+) | bons graves - apenas 3.8% longe da mediana
(+) | o baixo é linear (5.2% delta para a frequência anterior)
Médios 400 - 2.000 Hz
(+) | médios equilibrados - apenas 1.3% longe da mediana
(+) | médios são lineares (2.1% delta para frequência anterior)
Altos 2 - 16 kHz
(+) | agudos equilibrados - apenas 1.9% longe da mediana
(+) | os máximos são lineares (2.7% delta da frequência anterior)
Geral 100 - 16.000 Hz
(+) | o som geral é linear (4.6% diferença em relação à mediana)
Comparado com a mesma classe
» 0% de todos os dispositivos testados nesta classe foram melhores, 0% semelhantes, 100% piores
» O melhor teve um delta de 5%, a média foi 17%, o pior foi 45%
Comparado com todos os dispositivos testados
» 0% de todos os dispositivos testados foram melhores, 0% semelhantes, 100% piores
» O melhor teve um delta de 4%, a média foi 23%, o pior foi 134%
Gerenciamento de energia
Consumo de energia
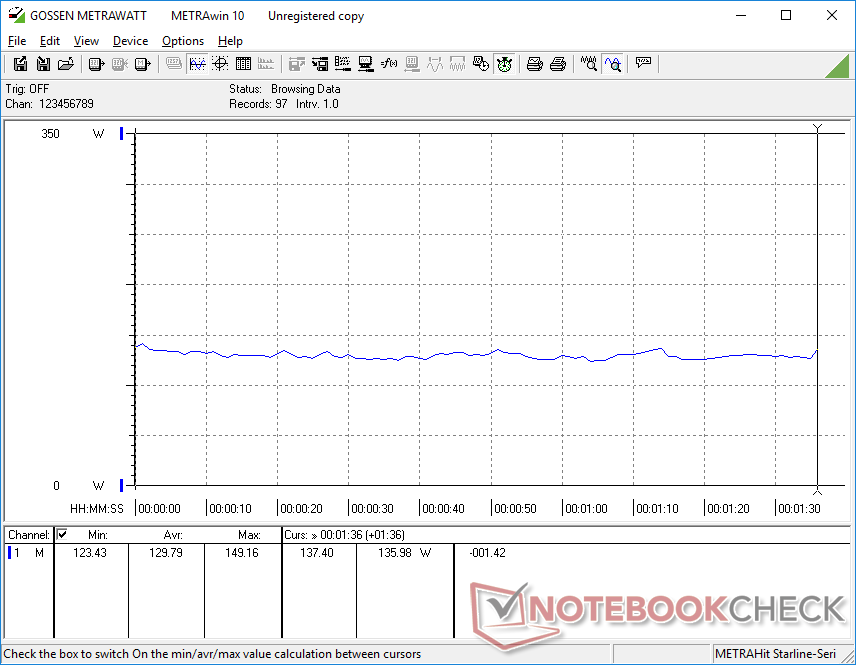
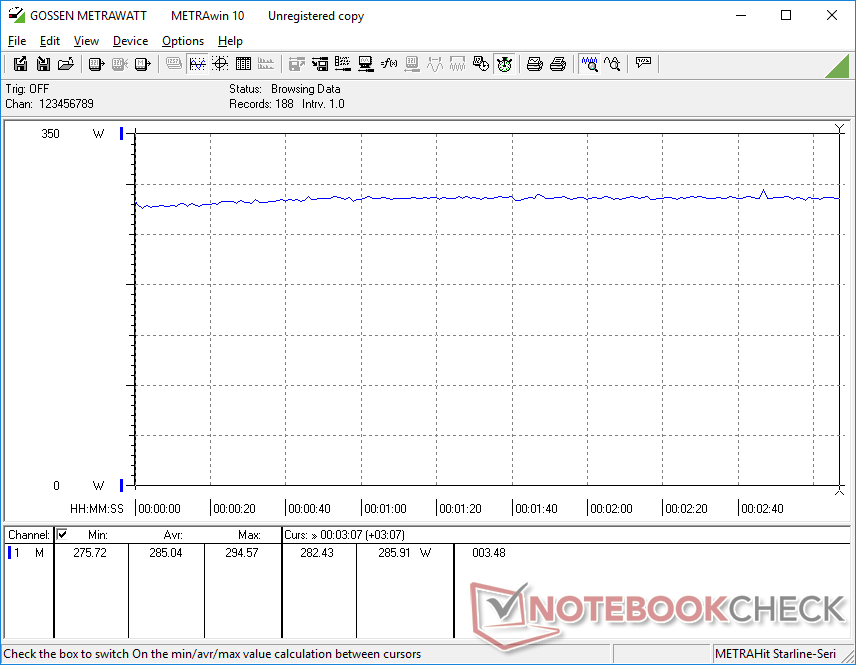
Os notebooks Alienware sempre tiveram alguns dos números mais altos de consumo de energia e nosso Alienware m16 R1 não é diferente. A simples inatividade no desktop consumiria entre 39 W e 69 W, em comparação com menos da metade no Lenovo Legion Pro 7 ou no Asus ROG Strix G16. Esses altos níveis de marcha lenta provavelmente são responsáveis pelos resultados pouco animadores da duração da bateria na próxima seção.
O consumo de energia durante os jogos é, em média, de 285 W, o que, mais uma vez, é mais do que a maioria dos outros notebooks para jogos, incluindo até mesmo o Alienware x16 da Dell.
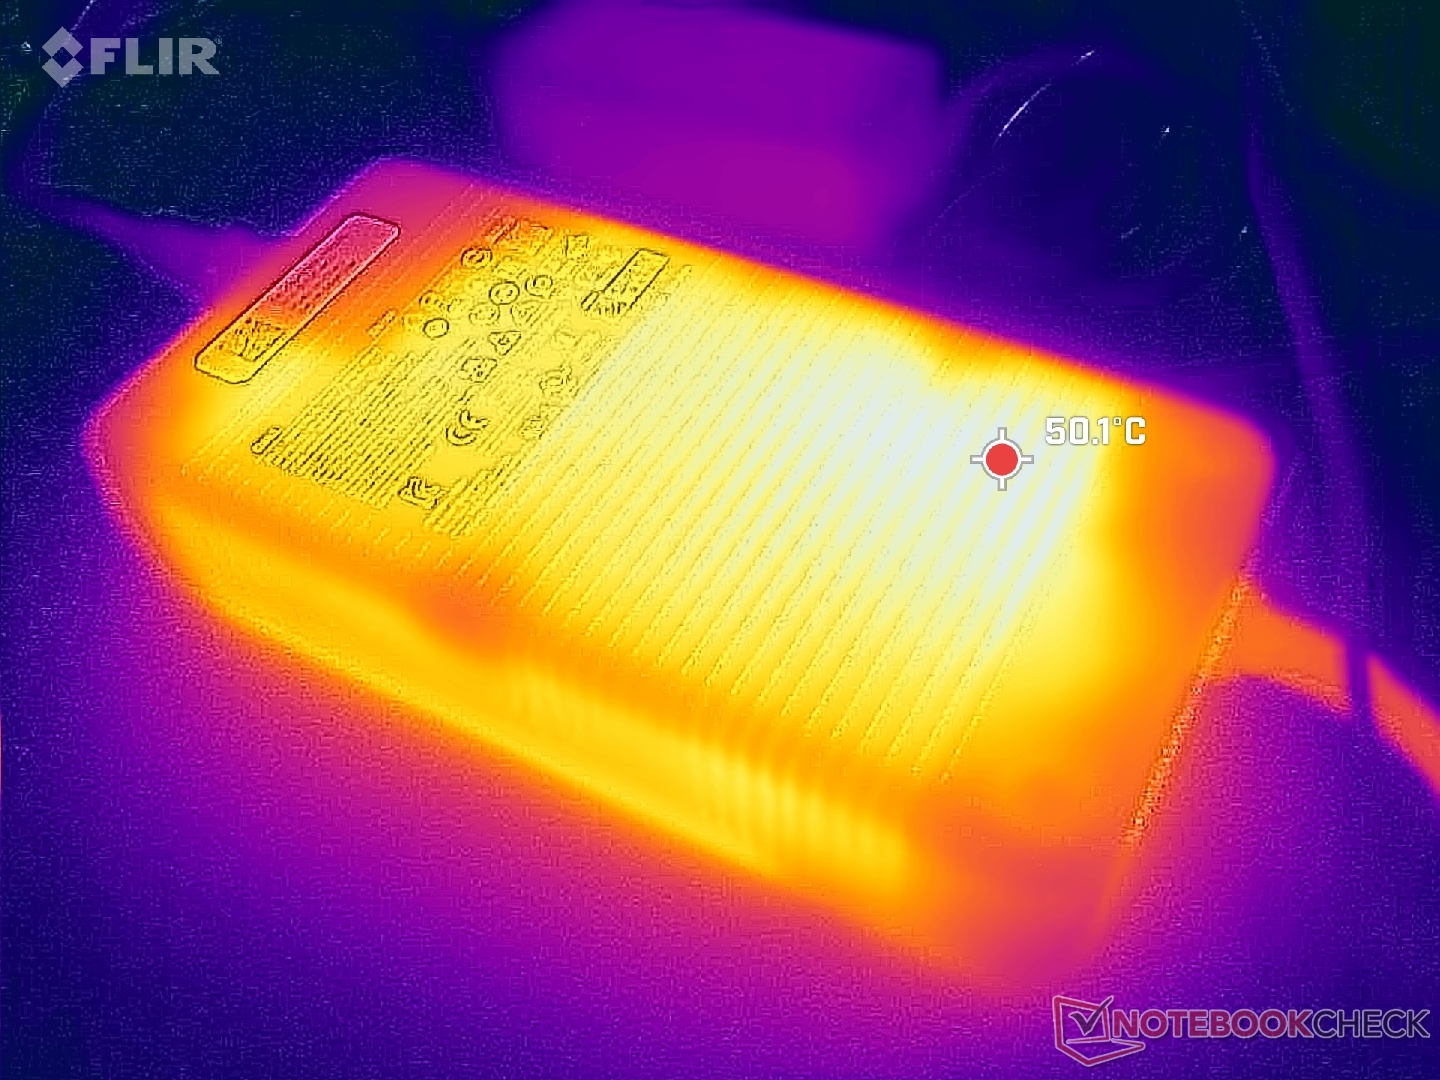
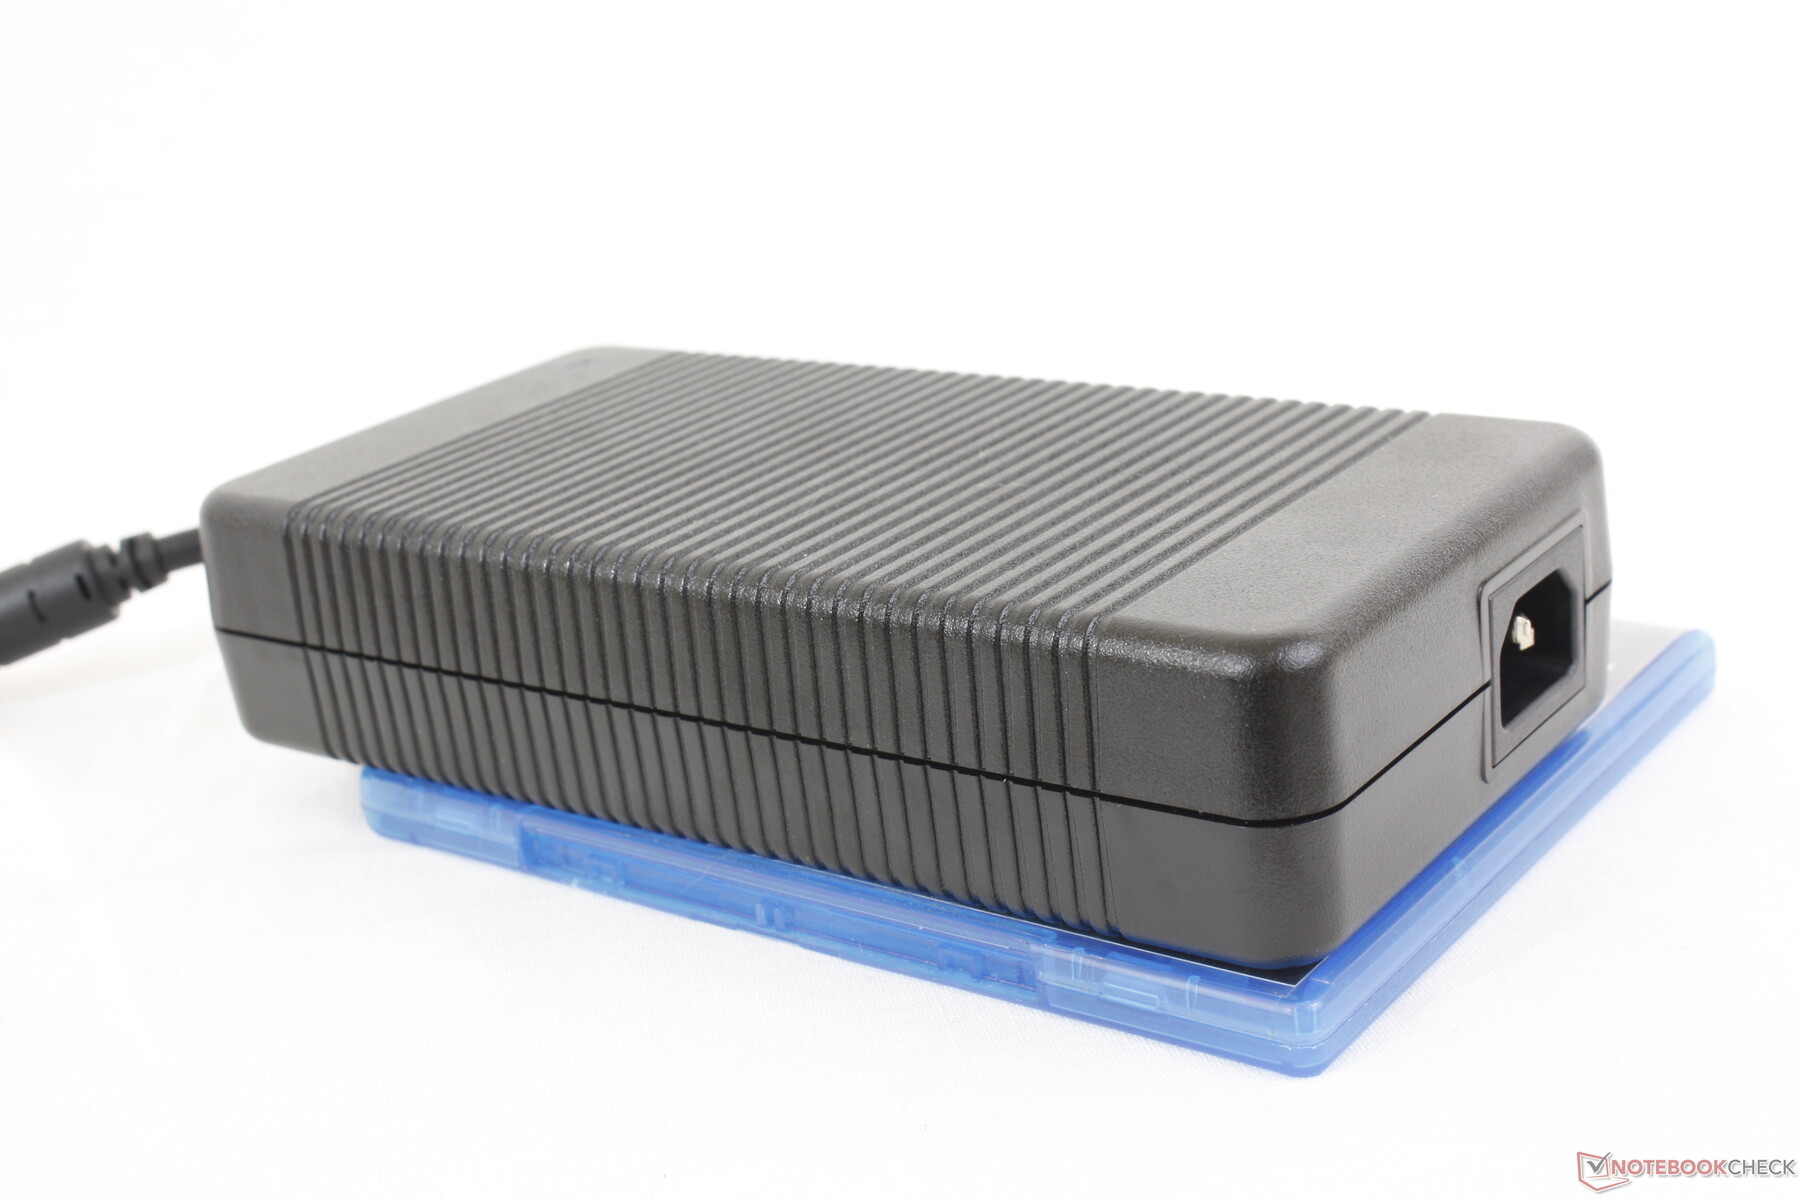
O adaptador CA de 330 W é grande (~20 x 10 x 4,5 cm) e volumoso. Em comparação, o adaptador CA GaN de 330 W, atualmente enviado com os laptops Razer mais recentes, é visivelmente mais portátil.
| desligado | |
| Ocioso | |
| Carga |
|
Key:
min: | |
| Alienware m16 R1 AMD R9 7845HX, GeForce RTX 4080 Laptop GPU, Kioxia XG8 KXG80ZNV1T02, IPS, 2560x1600, 16" | Alienware x16 R1 i9-13900HK, GeForce RTX 4080 Laptop GPU, SK hynix PC801 HFS001TEJ9X101N, IPS, 2560x1600, 16" | HP Omen Transcend 16 i9-13900HX, GeForce RTX 4070 Laptop GPU, SK hynix PC801 HFS002TEJ9X101N, Mini-LED, 2560x1600, 16" | Lenovo Legion Pro 7 RTX4090 i9-13900HX, GeForce RTX 4090 Laptop GPU, Samsung PM9A1 MZVL21T0HCLR, IPS, 2560x1600, 16" | Asus ROG Strix G16 G614JZ i9-13980HX, GeForce RTX 4080 Laptop GPU, WD PC SN560 SDDPNQE-1T00, IPS, 2560x1600, 16" | Razer Blade 16 Early 2023 i9-13950HX, GeForce RTX 4080 Laptop GPU, SSSTC CA6-8D1024, IPS, 2560x1600, 16" | |
|---|---|---|---|---|---|---|
| Power Consumption | 21% | 27% | 23% | 35% | 29% | |
| Idle Minimum * (Watt) | 39 | 25.2 35% | 19.2 51% | 20 49% | 10 74% | 15.2 61% |
| Idle Average * (Watt) | 44.6 | 29.9 33% | 22.7 49% | 25 44% | 16 64% | 22.8 49% |
| Idle Maximum * (Watt) | 68.1 | 49.8 27% | 55.4 19% | 35 49% | 27 60% | 49.8 27% |
| Load Average * (Watt) | 129.8 | 105.4 19% | 128.4 1% | 136 -5% | 129 1% | 121.2 7% |
| Witcher 3 ultra * (Watt) | 285 | 263 8% | 206 28% | 282 1% | 247 13% | 242 15% |
| Load Maximum * (Watt) | 327.3 | 313.8 4% | 292 11% | 320 2% | 342 -4% | 273.7 16% |
* ... menor é melhor
Power Consumption Witcher 3 / Stresstest
Power Consumption external Monitor
Duração da bateria
A duração da bateria continua ruim, com pouco menos de 4 horas de navegação em WLAN no mundo real, quando no perfil de energia balanceado com a iGPU ativa. Tentamos até mesmo usar o perfil de energia especial "Bateria" por meio do Alienware Command Center e nossos resultados ainda não melhoraram. Os modelos concorrentes, como o Lenovo Legion Pro 7 ou o Asus ROG Strix G16, são capazes de durar muito mais tempo.
O carregamento da capacidade vazia até a capacidade total leva um pouco mais de 2 horas. O sistema também pode ser recarregado via USB-C, embora em um ritmo mais lento.
| Alienware m16 R1 AMD R9 7845HX, GeForce RTX 4080 Laptop GPU, 86 Wh | Alienware x16 R1 i9-13900HK, GeForce RTX 4080 Laptop GPU, 90 Wh | HP Omen Transcend 16 i9-13900HX, GeForce RTX 4070 Laptop GPU, 97 Wh | Lenovo Legion Pro 7 RTX4090 i9-13900HX, GeForce RTX 4090 Laptop GPU, 99.9 Wh | Asus ROG Strix G16 G614JZ i9-13980HX, GeForce RTX 4080 Laptop GPU, 90 Wh | Razer Blade 16 Early 2023 i9-13950HX, GeForce RTX 4080 Laptop GPU, 95.2 Wh | |
|---|---|---|---|---|---|---|
| Duração da bateria | 13% | 41% | 38% | 100% | 88% | |
| Reader / Idle (h) | 4 | 7.3 83% | 6.3 58% | 8.9 123% | ||
| WiFi v1.3 (h) | 3.7 | 2.5 -32% | 4.2 14% | 5.1 38% | 9.7 162% | 6.1 65% |
| Load (h) | 0.8 | 0.7 -13% | 1.2 50% | 1.1 38% | 1.4 75% |
Pro
Contra
Veredicto - Rápido e repleto de recursos, mas precisa de otimizações
O Alienware m16 R1 reúne uma quantidade insana de potência e recursos para um laptop de 16 polegadas. Estamos falando de metal líquido, câmara de vapor, quatro ventoinhas, três compartimentos para SSD, teclado mecânico CherryMX, placa de vídeo de 175 W, RAM atualizável e até mesmo opções de CPU e GPU da Intel e da AMD. Os modelos concorrentes para jogos de 16 polegadas, como o HP Omen Transcend 16, Razer Blade 16ou Asus Zephyrus M16 têm conjuntos de recursos comparativamente menores e, em geral, também são mais lentos, mesmo quando configurados com a mesma GPU da nossa configuração de teste. Os engenheiros da Alienware merecem muito crédito, considerando a densidade do Alienware m16 R1.
Por outro lado, a longa lista de recursos integrados também pode funcionar contra o laptop, já que o Alienware m16 é mais pesado e maior do que muitas alternativas. A duração da bateria, em particular, é bastante prejudicada, independentemente da configuração do perfil de energia. Se você valoriza a portabilidade, talvez seja melhor procurar outro produto. Além disso, o modelo ainda não conta com alguns recursos populares, como OLED e mini-LED.
O Alienware m16 R1 é inegavelmente rápido e repleto de recursos, com resultados acima da média em todos os aspectos. Entretanto, os benefícios do desempenho são obtidos ao custo de um peso maior e de um tamanho maior.
Os erros que encontramos durante nossa análise merecem uma menção. Os saltos de quadros durante a reprodução de vídeo 4K, as falhas na taxa de quadros durante os jogos e os problemas ao acordar do modo de suspensão são lamentáveis, considerando que a Alienware é supostamente uma marca entusiasta. Talvez a Dell esteja mordendo um pouco mais do que pode mastigar com suas inúmeras configurações Intel-Nvidia, AMD-Nvidia e AMD-AMD, o que pode tornar a solução de problemas bastante complicada.
Preço e disponibilidade
A Dell agora está enviando seu modelo Alienware m16 nas versões Intel e AMD. A versão AMD custa a partir de US$ 1.700 e pode chegar a mais de US$ 3.000 a US$ 4.000 se estiver totalmente configurada.
Alienware m16 R1 AMD
- 08/23/2023 v7 (old)
Allen Ngo
Transparência
A seleção dos dispositivos a serem analisados é feita pela nossa equipe editorial. A amostra de teste foi fornecida ao autor como empréstimo pelo fabricante ou varejista para fins desta revisão. O credor não teve influência nesta revisão, nem o fabricante recebeu uma cópia desta revisão antes da publicação. Não houve obrigação de publicar esta revisão. Como empresa de mídia independente, a Notebookcheck não está sujeita à autoridade de fabricantes, varejistas ou editores.
É assim que o Notebookcheck está testando
Todos os anos, o Notebookcheck analisa de forma independente centenas de laptops e smartphones usando procedimentos padronizados para garantir que todos os resultados sejam comparáveis. Desenvolvemos continuamente nossos métodos de teste há cerca de 20 anos e definimos padrões da indústria no processo. Em nossos laboratórios de teste, equipamentos de medição de alta qualidade são utilizados por técnicos e editores experientes. Esses testes envolvem um processo de validação em vários estágios. Nosso complexo sistema de classificação é baseado em centenas de medições e benchmarks bem fundamentados, o que mantém a objetividade.Price comparison

