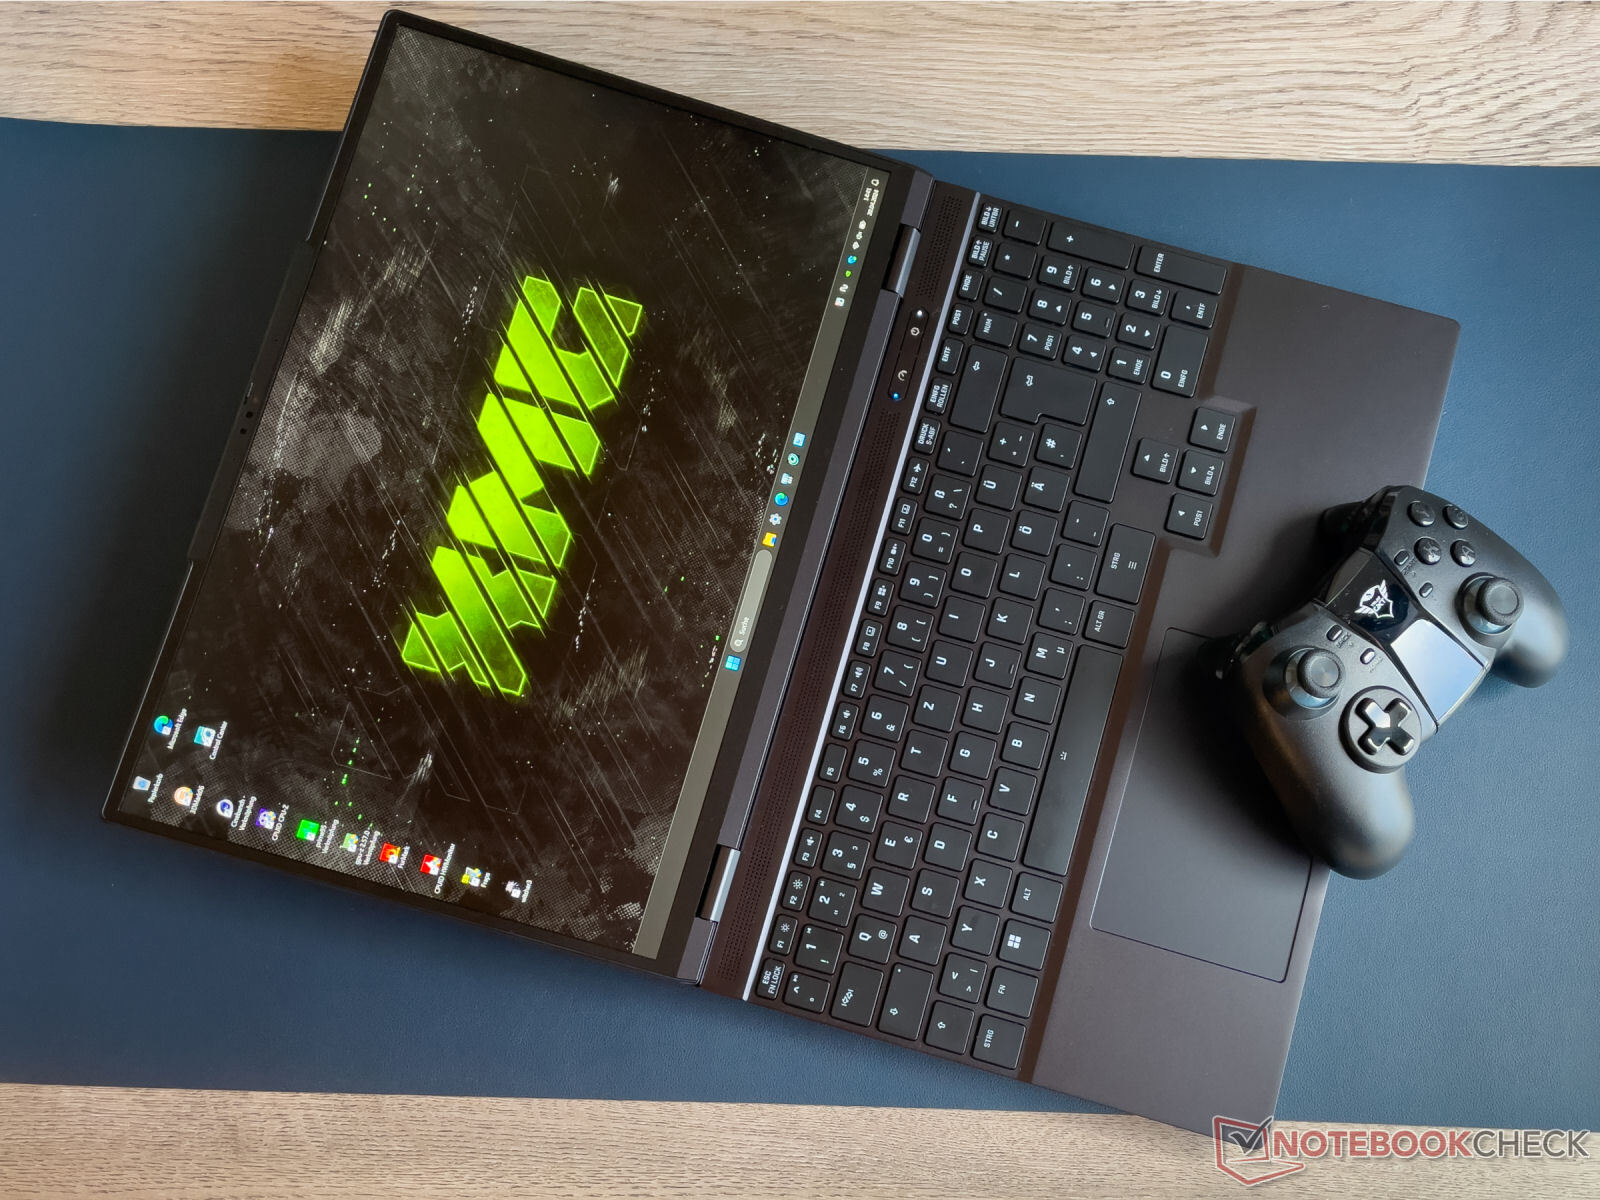
Análise do XMG Fusion 15 (Early 24): Um laptop RTX 4070 compacto para gamers e criadores
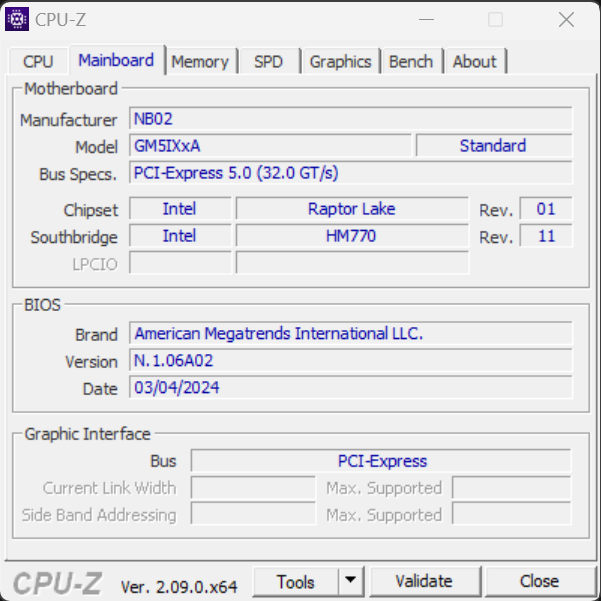
O XMG Fusion 15 (Early 24) - um laptop de 15,3 polegadas para gamers e criadores - é baseado em um barebone (GM5IX7A) do fabricante Tongfang. Raptor Lake, Ada Lovelace e 32 GB de RAM equipam o laptop para streaming, renderização e jogos. A variante atual pode ser adquirida por cerca de US$ 2.500. Os concorrentes incluem dispositivos como o Aorus 16X (2024), Alienware m16 R2, HP Omen Transcend 16 e o Lenovo Legion Pro 5 16IRX9.
Possíveis concorrentes em comparação
Avaliação | Data | Modelo | Peso | Altura | Size | Resolução | Preço |
|---|---|---|---|---|---|---|---|
| 88.9 % v7 (old) | 05/2024 | Schenker XMG Fusion 15 (Early 24) i9-14900HX, GeForce RTX 4070 Laptop GPU | 2.1 kg | 21.9 mm | 15.30" | 2560x1600 | |
| 87.4 % v7 (old) | 04/2024 | Aorus 16X 2024 i9-14900HX, GeForce RTX 4070 Laptop GPU | 2.3 kg | 20 mm | 16.00" | 2560x1600 | |
| 90.2 % v7 (old) | 03/2024 | Alienware m16 R2 Ultra 7 155H, GeForce RTX 4070 Laptop GPU | 2.5 kg | 23.5 mm | 16.00" | 2560x1600 | |
| 88.4 % v7 (old) | 02/2024 | HP Omen Transcend 16-u1095ng i9-14900HX, GeForce RTX 4070 Laptop GPU | 2.3 kg | 20 mm | 16.00" | 2560x1600 | |
| 89.3 % v7 (old) | 04/2024 | Lenovo Legion Pro 5 16IRX9 i9-14900HX, GeForce RTX 4070 Laptop GPU | 2.5 kg | 26.95 mm | 16.00" | 2560x1600 |
Estojo - O laptop XMG tem um estojo de alumínio
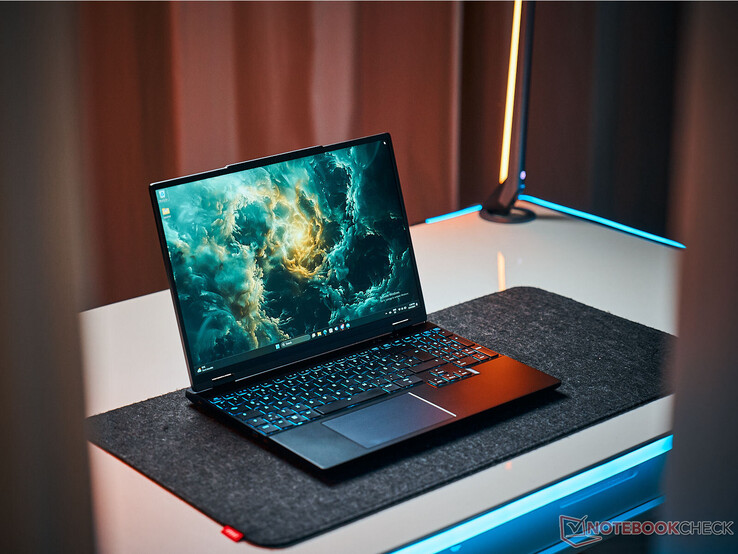
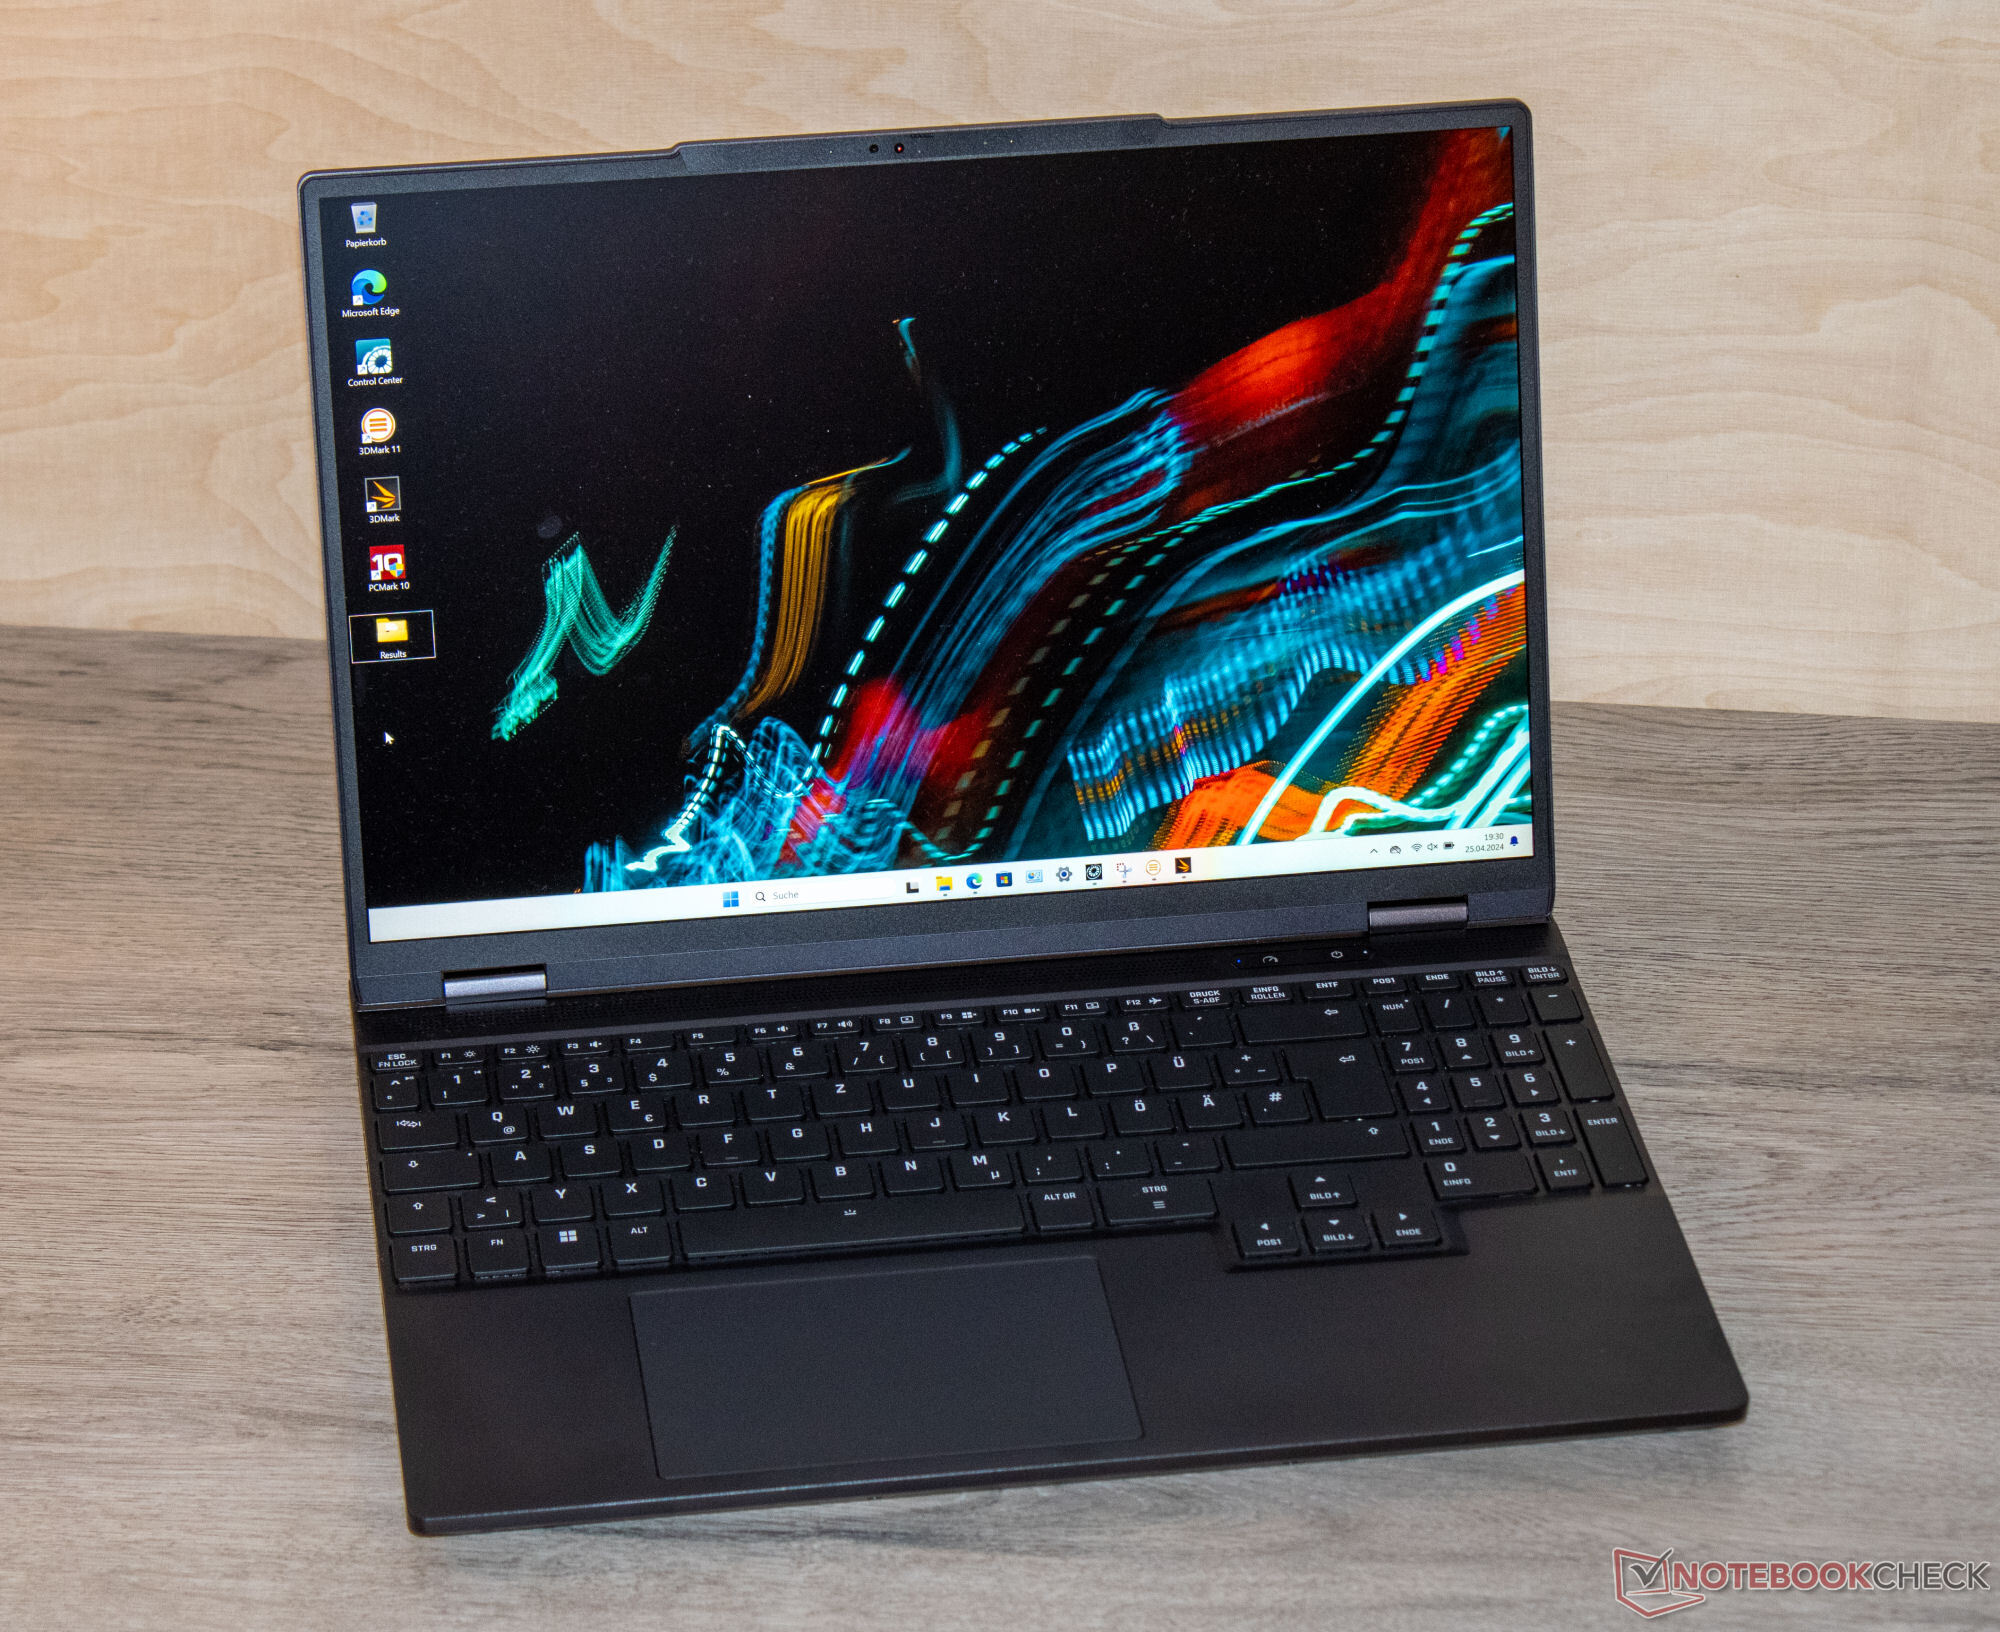
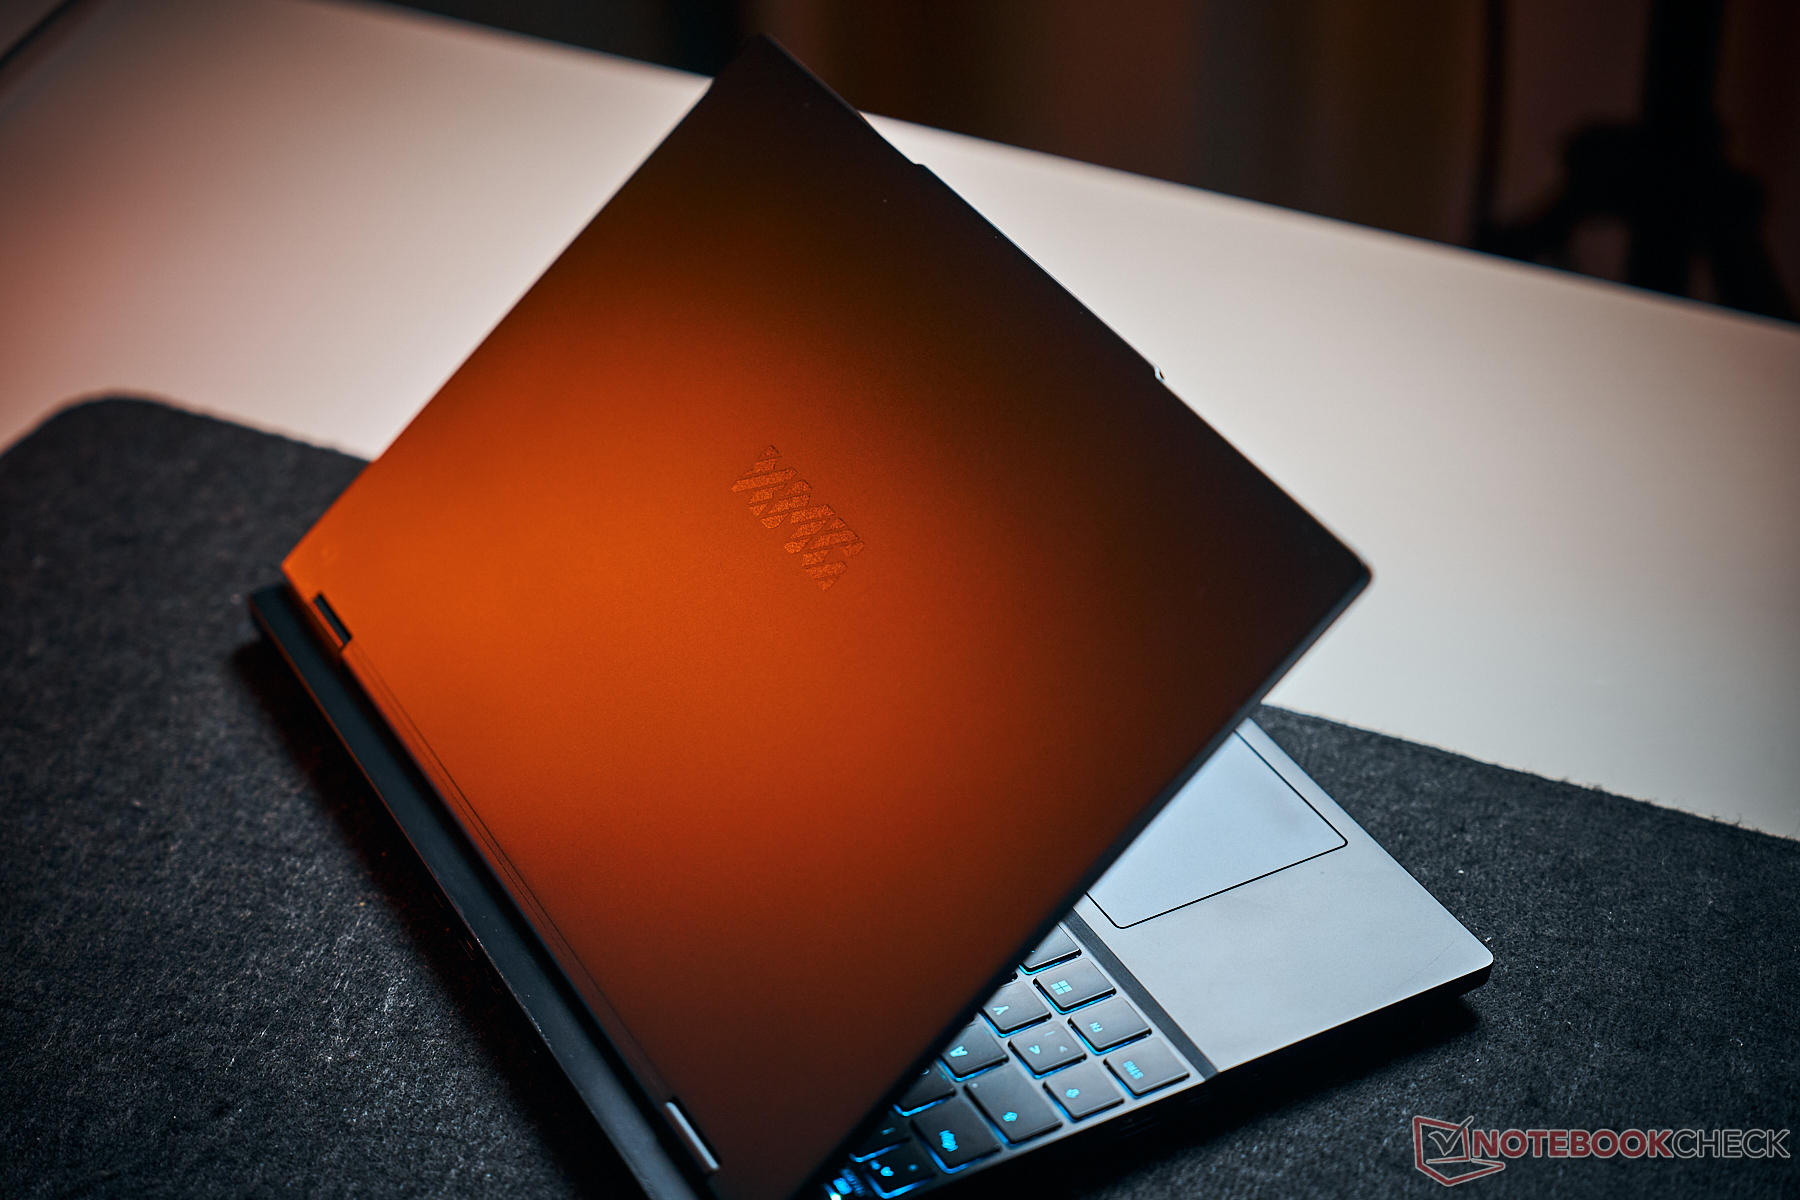
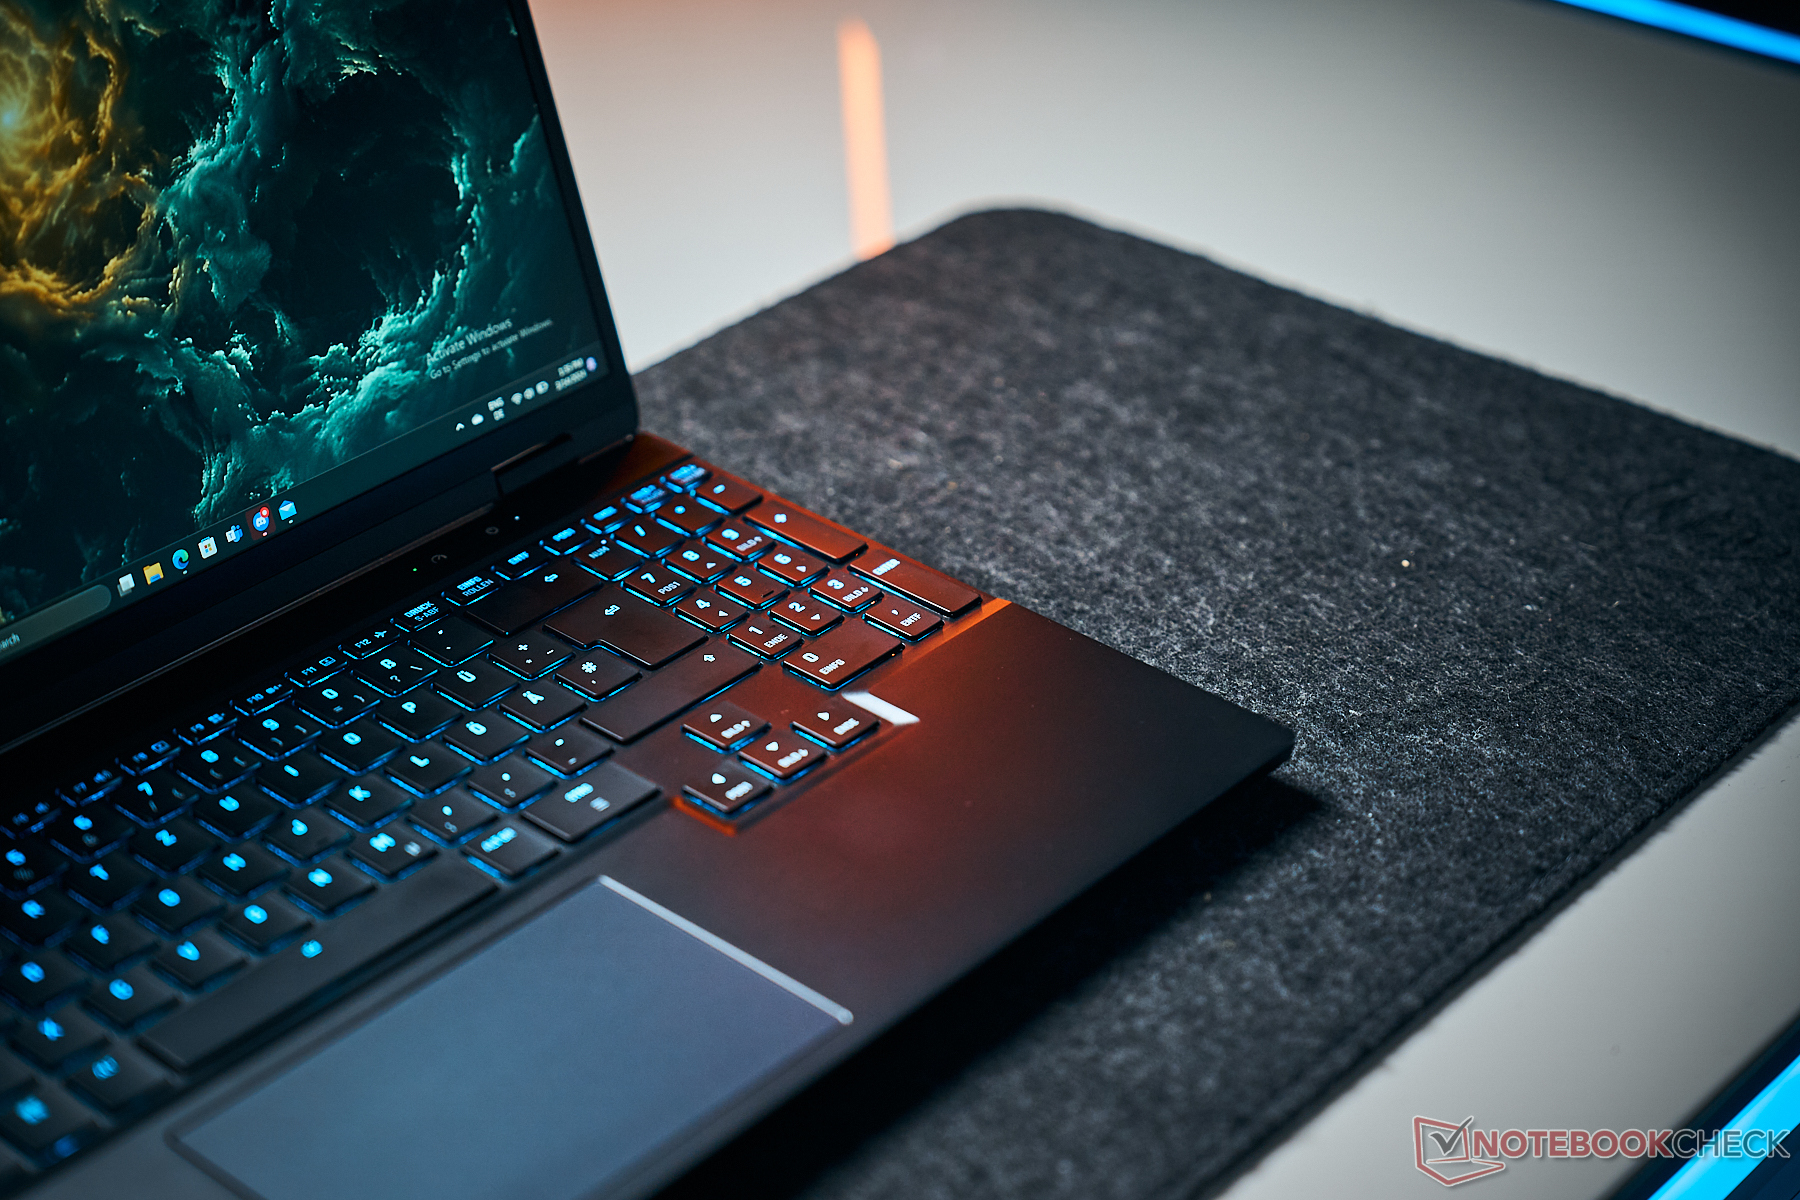
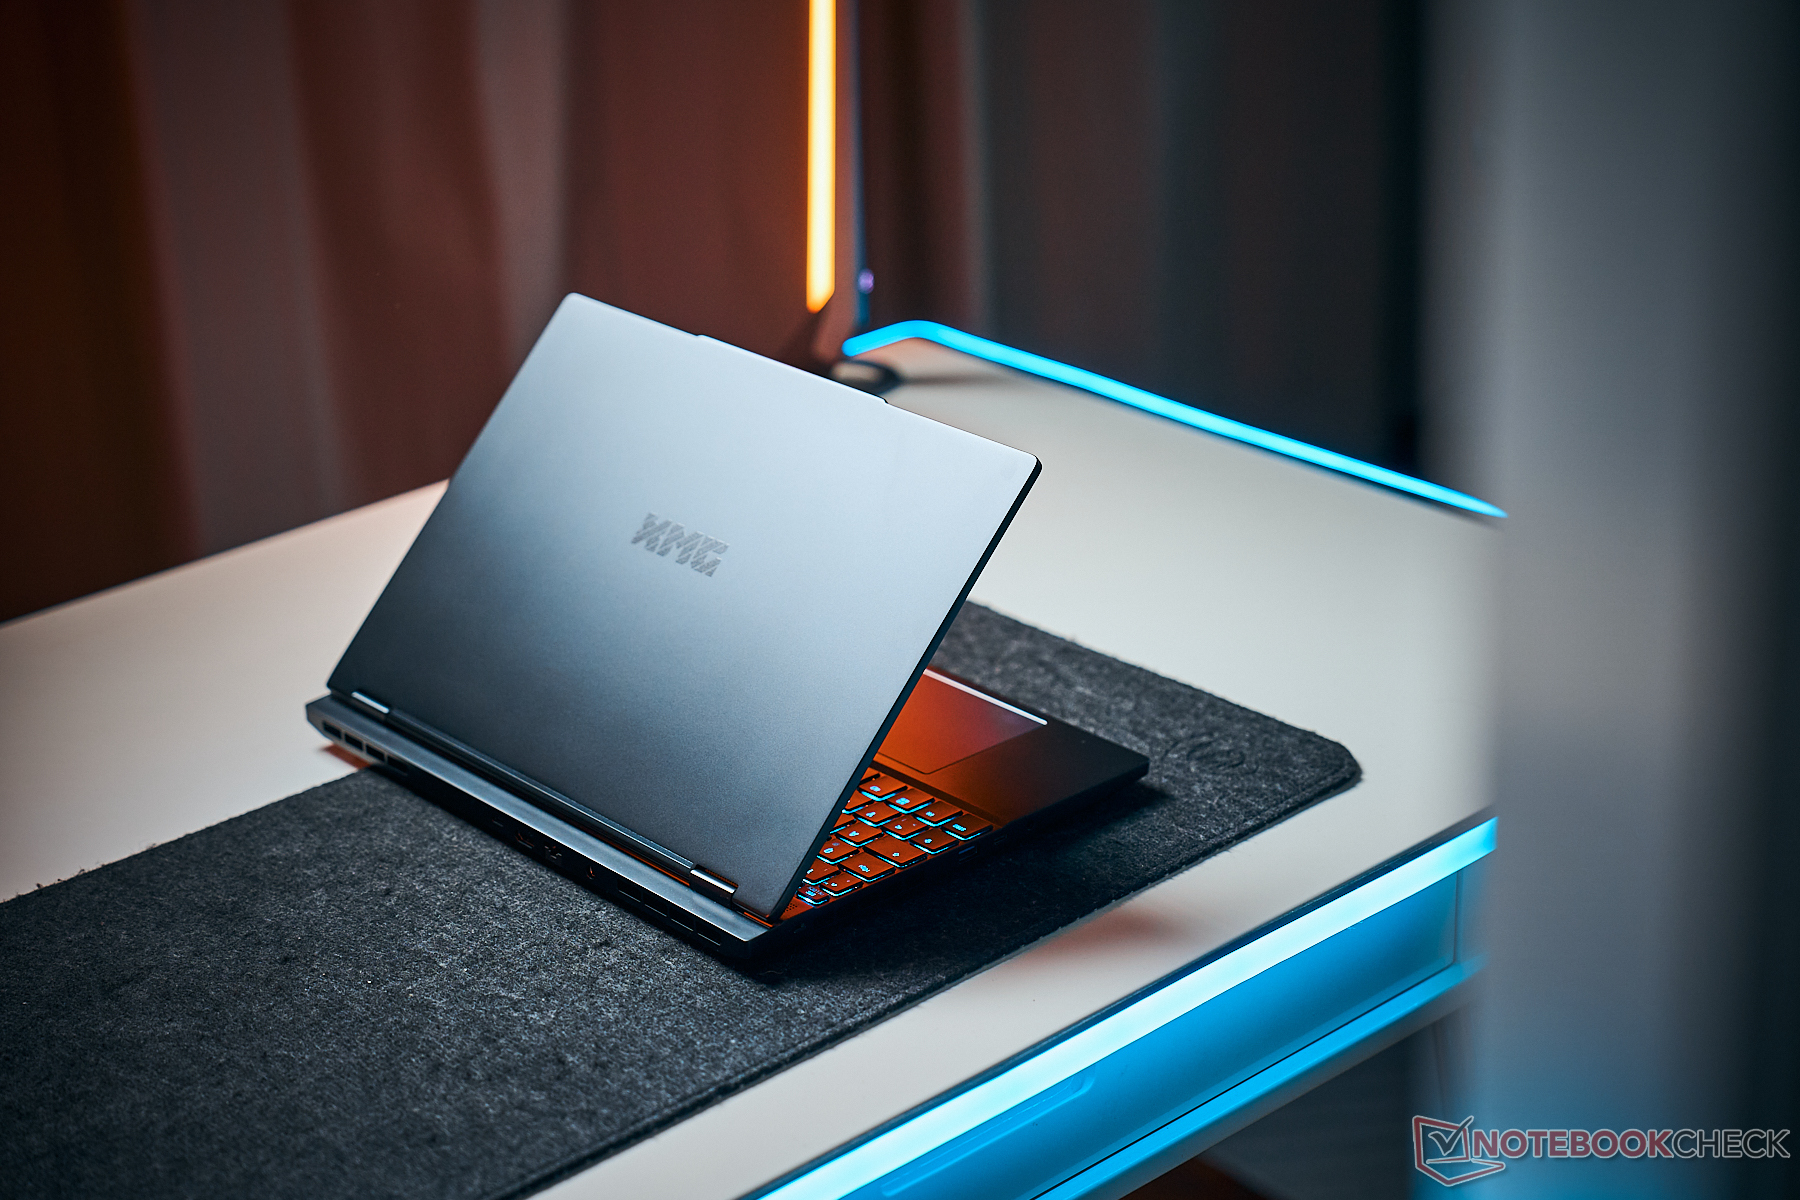
A Schenker optou por um gabinete de alumínio preto fosco e elegante com superfícies lisas. O laptop não apresenta nenhum elemento de design chamativo ou tiras de LED - apenas a luz de fundo do teclado (RGB) dá um pouco de cor ao dispositivo. O laptop dificilmente se destacaria em ambientes profissionais.
Não notamos nenhuma saliência de material e todos os espaços se alinham perfeitamente. A unidade de base e a tampa podem ser ligeiramente torcidas, mas isso não é nada fora do comum. Pressionar a parte de trás da tampa não resulta em nenhuma mudança de imagem. As dobradiças rígidas permitem um ângulo máximo de abertura de 180 graus. É possível abri-lo com uma mão.
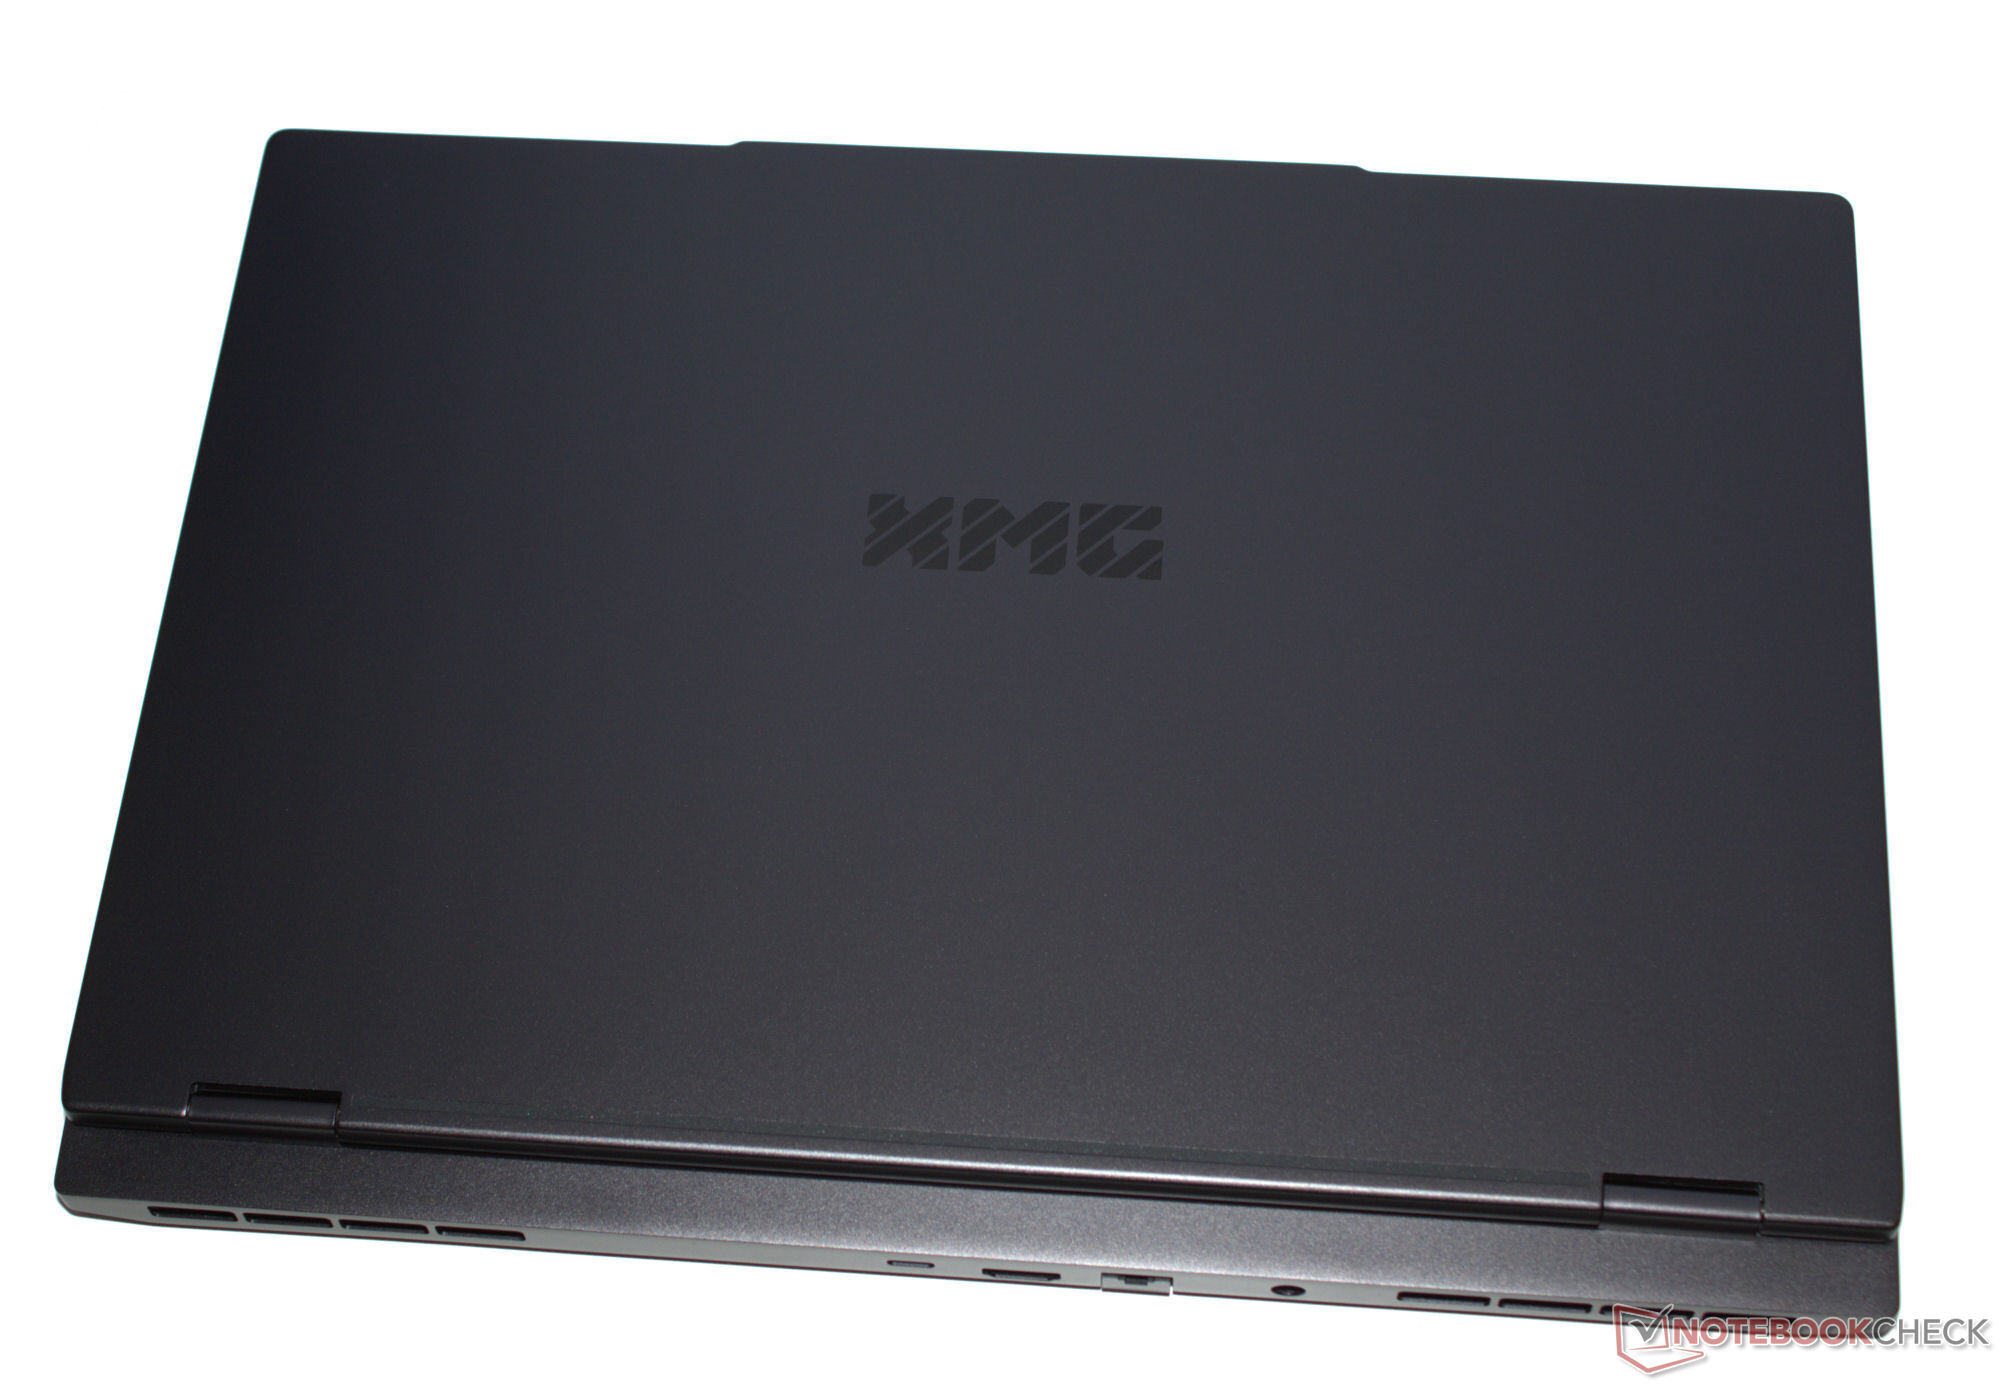
Não é nenhuma surpresa: Dentro do campo de comparação, o Fusion é o dispositivo mais compacto - ele apresenta a menor tela. Ao mesmo tempo, ele também é o mais leve de todos.
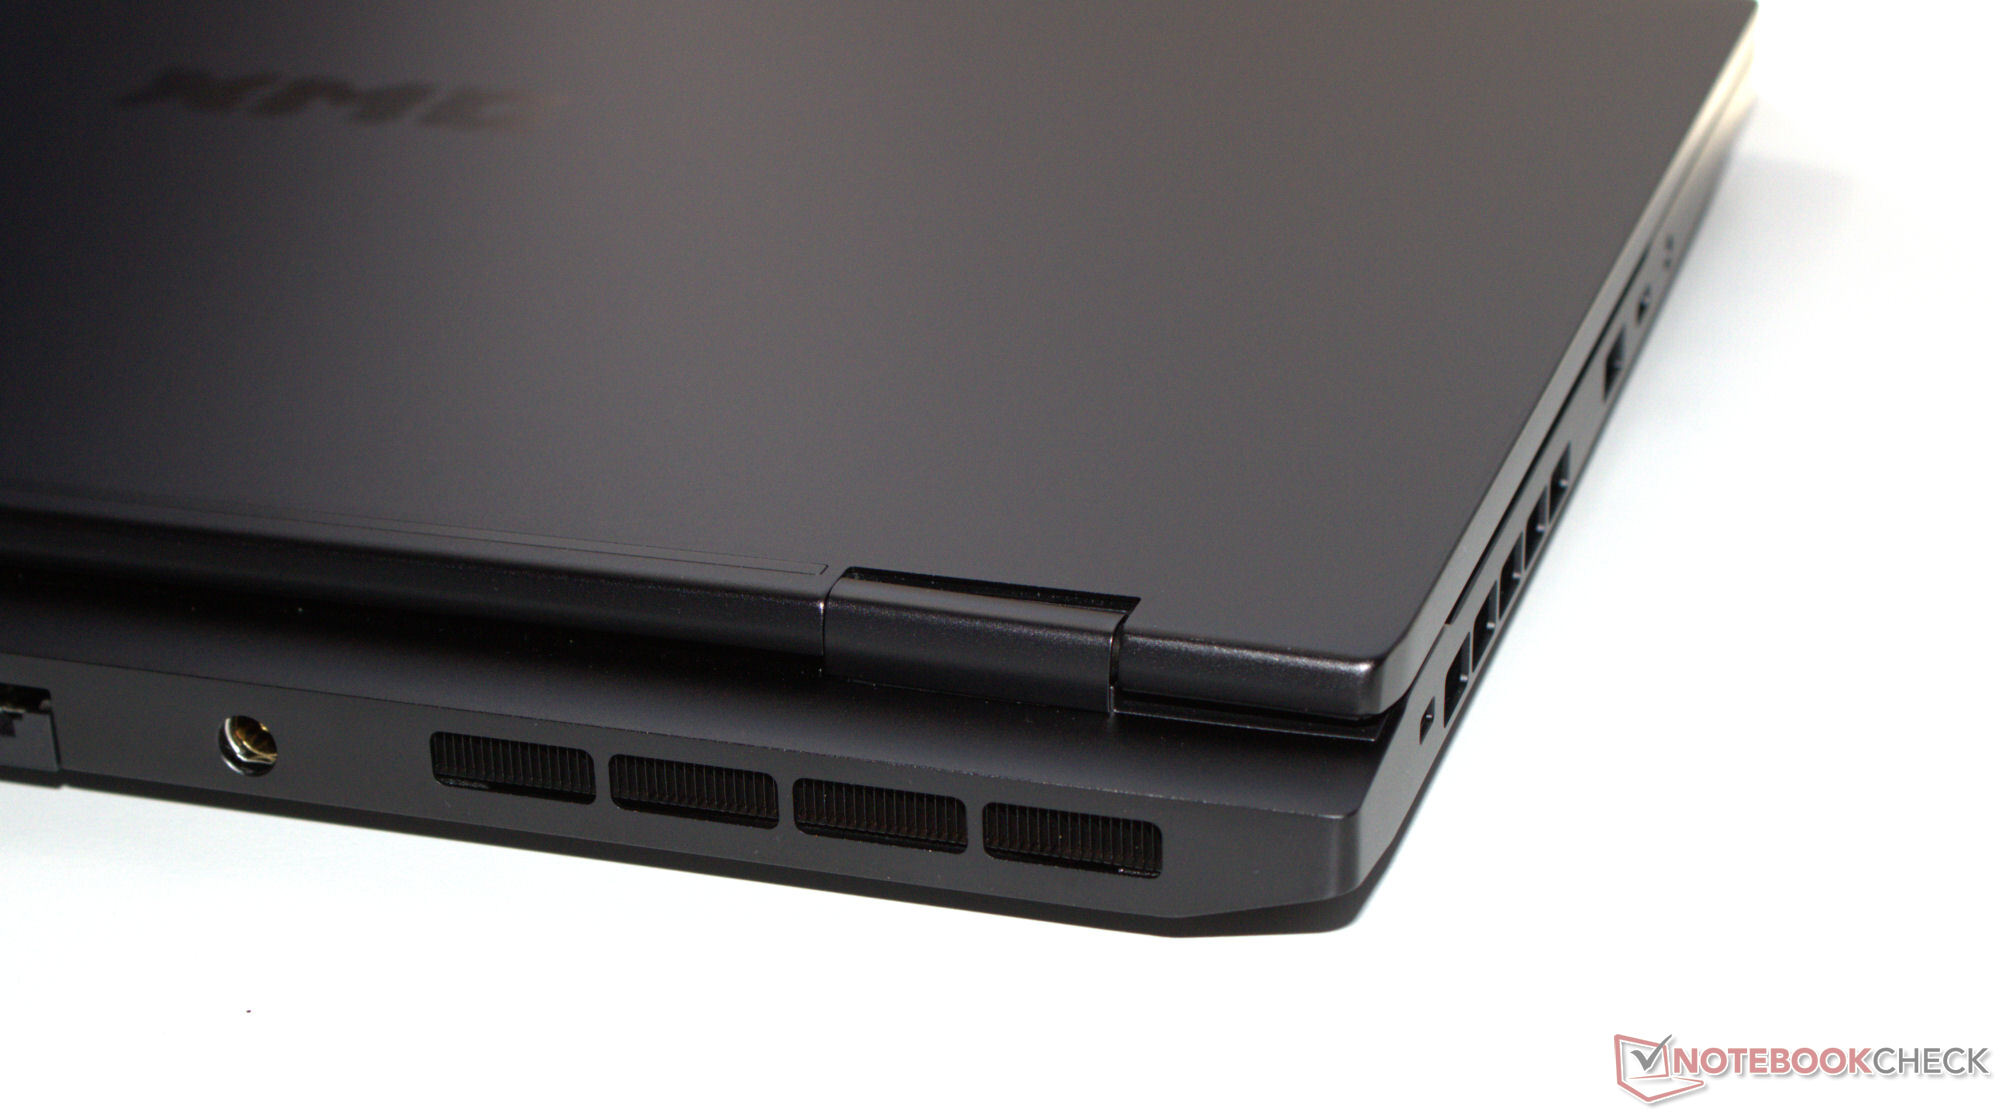
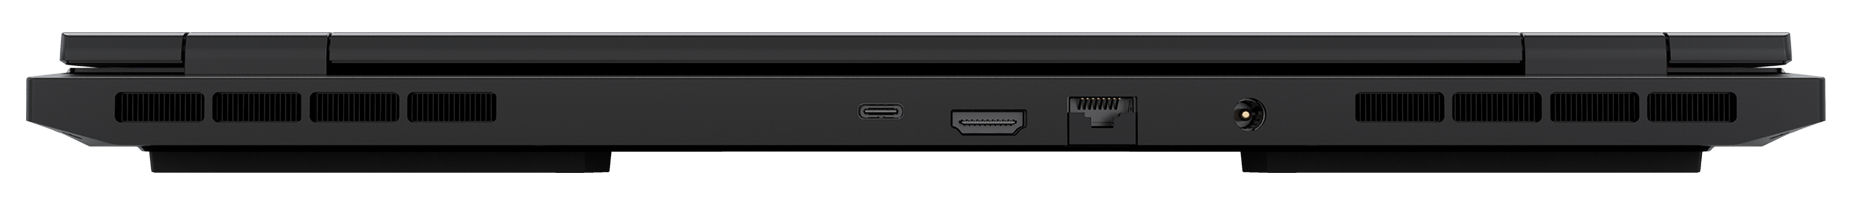
Conectividade - O Fusion 15 com Thunderbolt 4
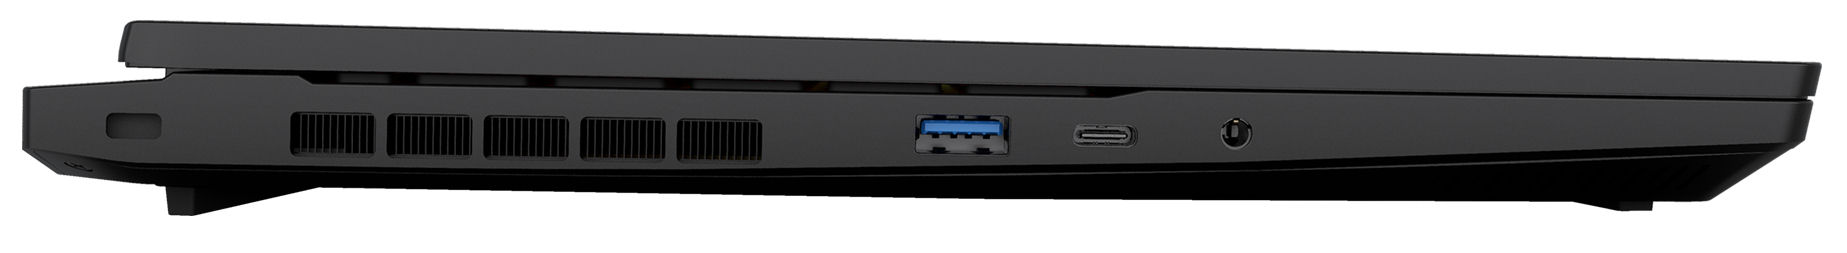
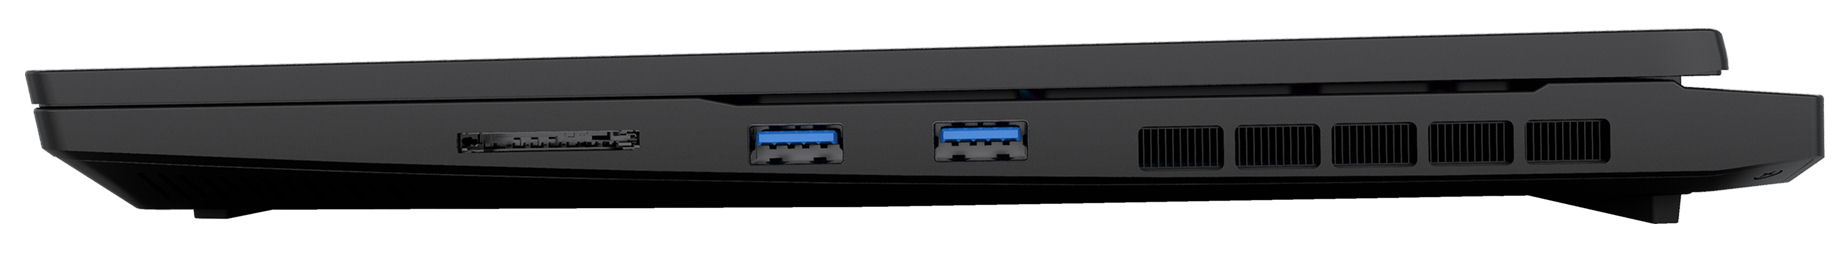
O Fusion possui três portas USB-A (USB 3.2 Gen 1) e duas portas USB-C (1x USB 3.2 Gen 1, 1x Thunderbolt 4). A porta TB4 suporta Power Delivery e pode emitir um sinal DisplayPort. No total, o laptop tem duas saídas de vídeo (1x HDMI, 1x DP). Um conector de áudio e uma porta Gigabit Ethernet completam suas opções de conectividade. As saídas de vídeo e a conexão de energia estão localizadas na parte traseira do dispositivo. Os cabos correspondentes saem pela parte traseira, portanto não atrapalham o senhor.
Leitor de cartão SD
Com taxas de transferência de 81 MB/s (transferência de 250 imagens jpg, cada uma com 5 MB de tamanho) e 82 MB/s (cópia de grandes blocos de dados), o leitor de cartão SD (cartão de referência: AV PRO microSD 128 GB V60) tem velocidade média. A concorrência oferece, em grande parte, leitores mais rápidos.
| SD Card Reader | |
| average JPG Copy Test (av. of 3 runs) | |
| Aorus 16X 2024 (AV PRO microSD 128 GB V60) | |
| Média da turma Gaming (20.9 - 210, n=54, últimos 2 anos) | |
| Schenker XMG Fusion 15 (Early 24) (AV PRO microSD 128 GB V60) | |
| Alienware m16 R2 (AV PRO microSD 128 GB V60) | |
| maximum AS SSD Seq Read Test (1GB) | |
| Alienware m16 R2 (AV PRO microSD 128 GB V60) | |
| Aorus 16X 2024 (AV PRO microSD 128 GB V60) | |
| Média da turma Gaming (25.5 - 261, n=51, últimos 2 anos) | |
| Schenker XMG Fusion 15 (Early 24) (AV PRO microSD 128 GB V60) | |
Comunicação
O Fusion usa um chip WiFi 6E (Intel AX211) que, na melhor das hipóteses (sem dispositivos WiFi nas proximidades, curta distância entre o laptop e o servidor), atinge taxas de dados muito boas. As conexões com fio são feitas por um controlador Gigabit Ethernet (YT6801) da Motorcomm, um fabricante que nunca encontramos antes.
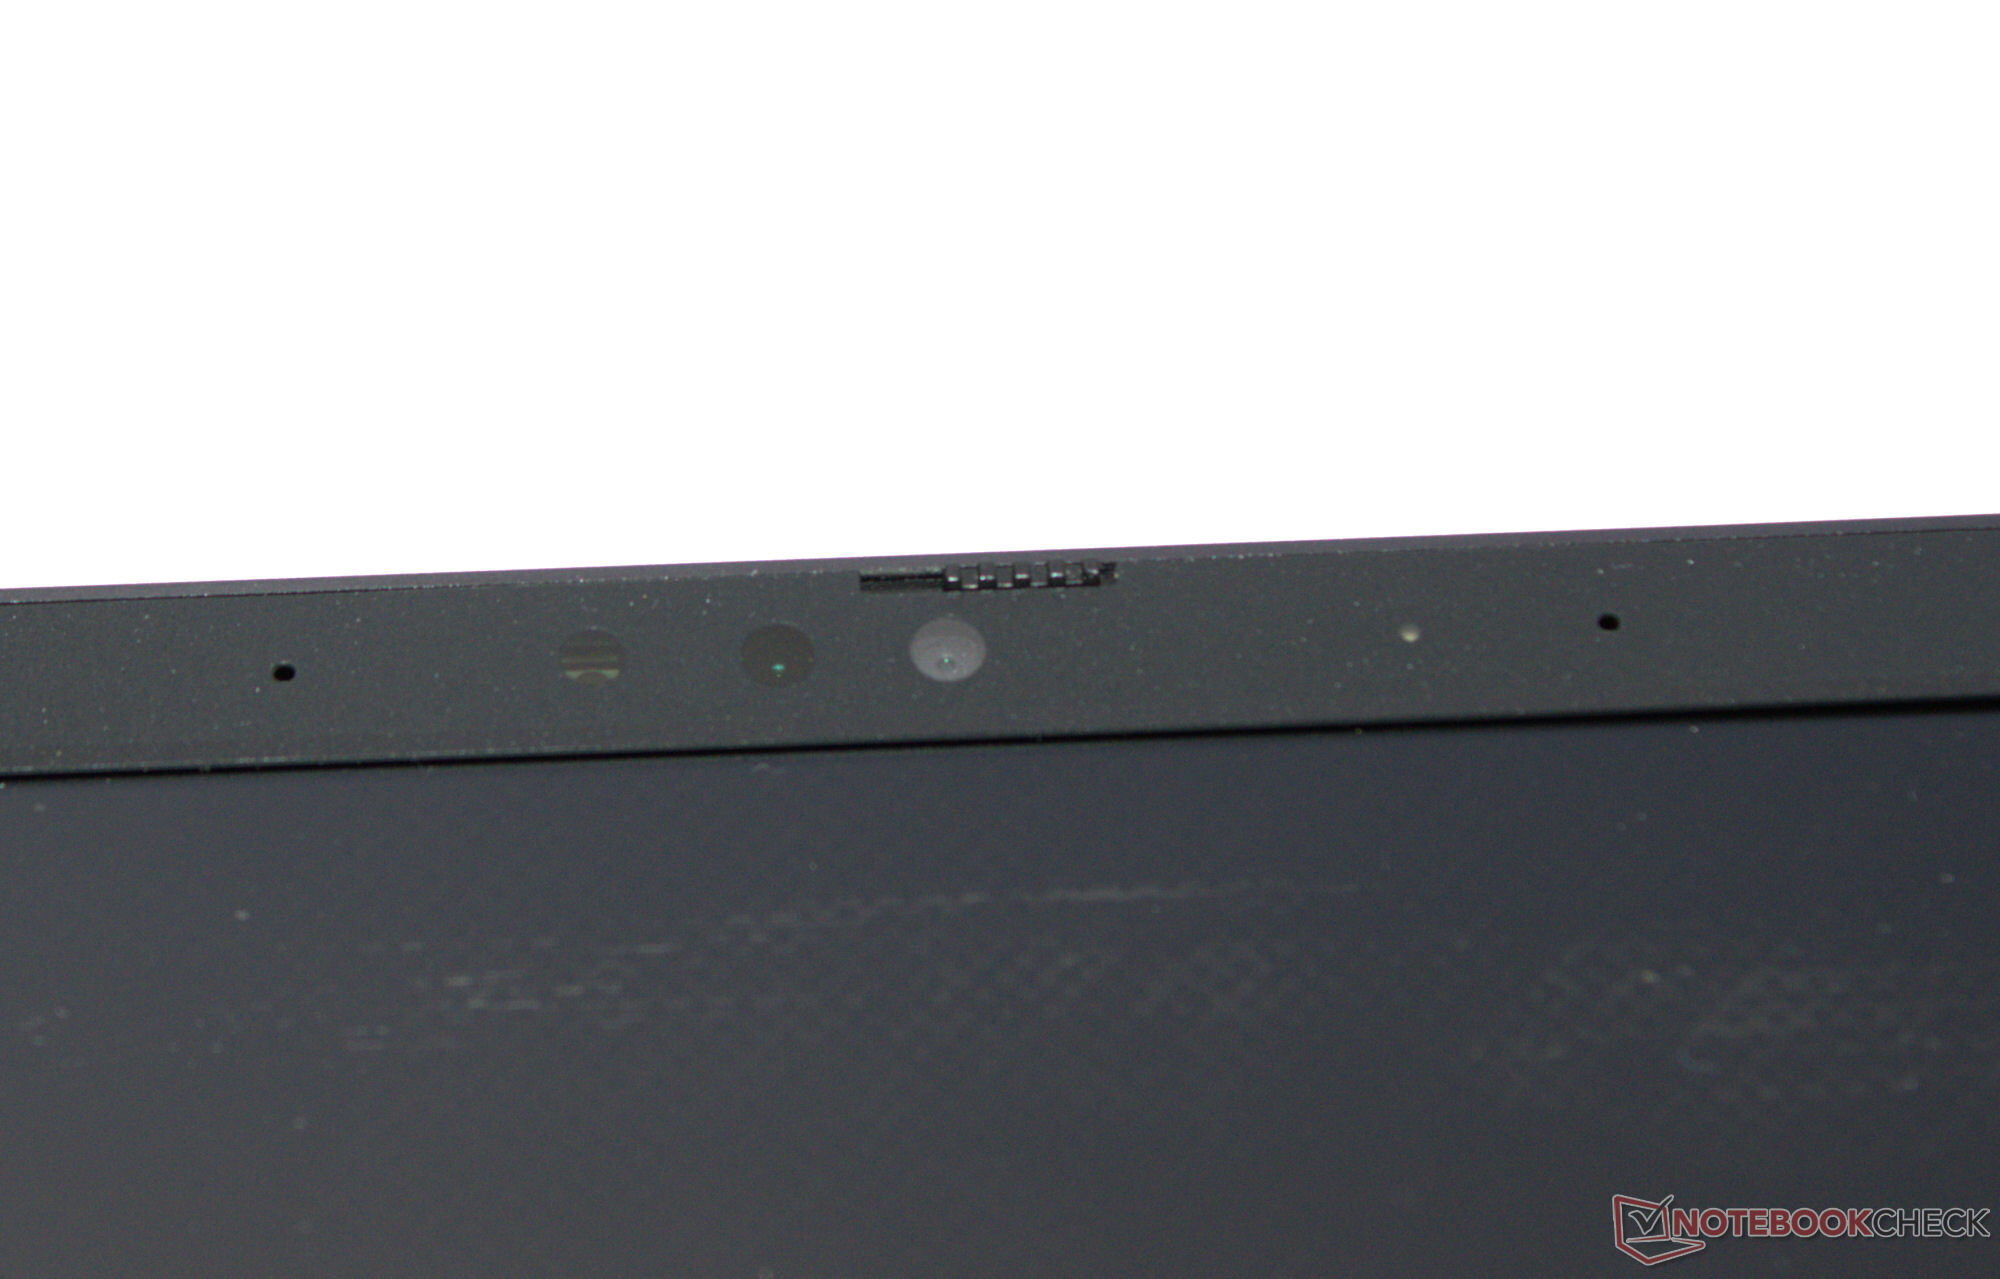
Webcam
Sua webcam (2,1 MP) é de qualidade média. Ela falha quando se trata de precisão de cores: Com um desvio de cerca de 9, o valor-alvo (DeltaE<3) não foi atingido. No entanto, ela é compatível com o Windows Hello. Além disso, ele é equipado com uma tampa mecânica.

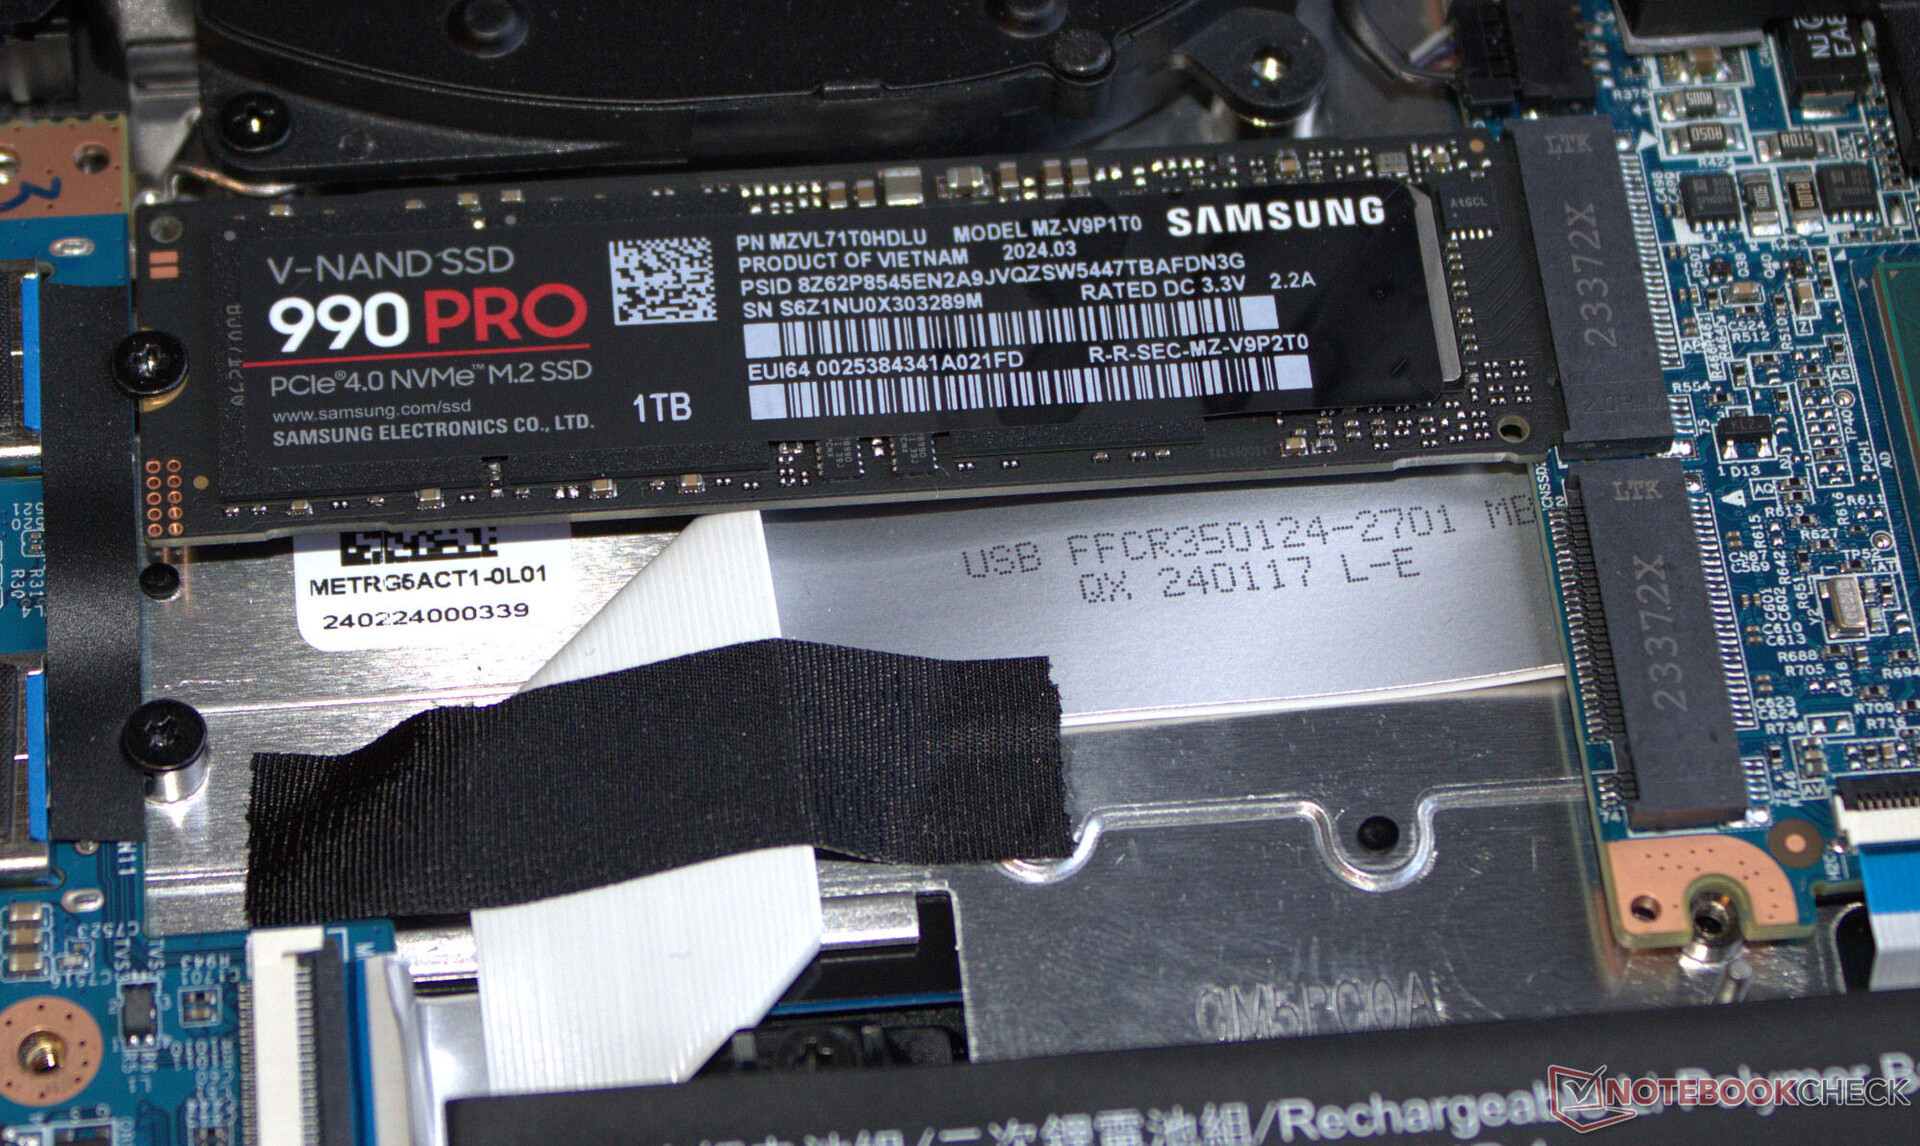
 GeForce RTX 4070 Laptop GPU, i9-14900HX, Samsung 990 Pro 1 TB")
 GeForce RTX 4070 Laptop GPU, i9-14900HX, Samsung 990 Pro 1 TB")
Acessórios
O laptop é fornecido com um pendrive USB (driver, manuais), adesivos e um mousepad.
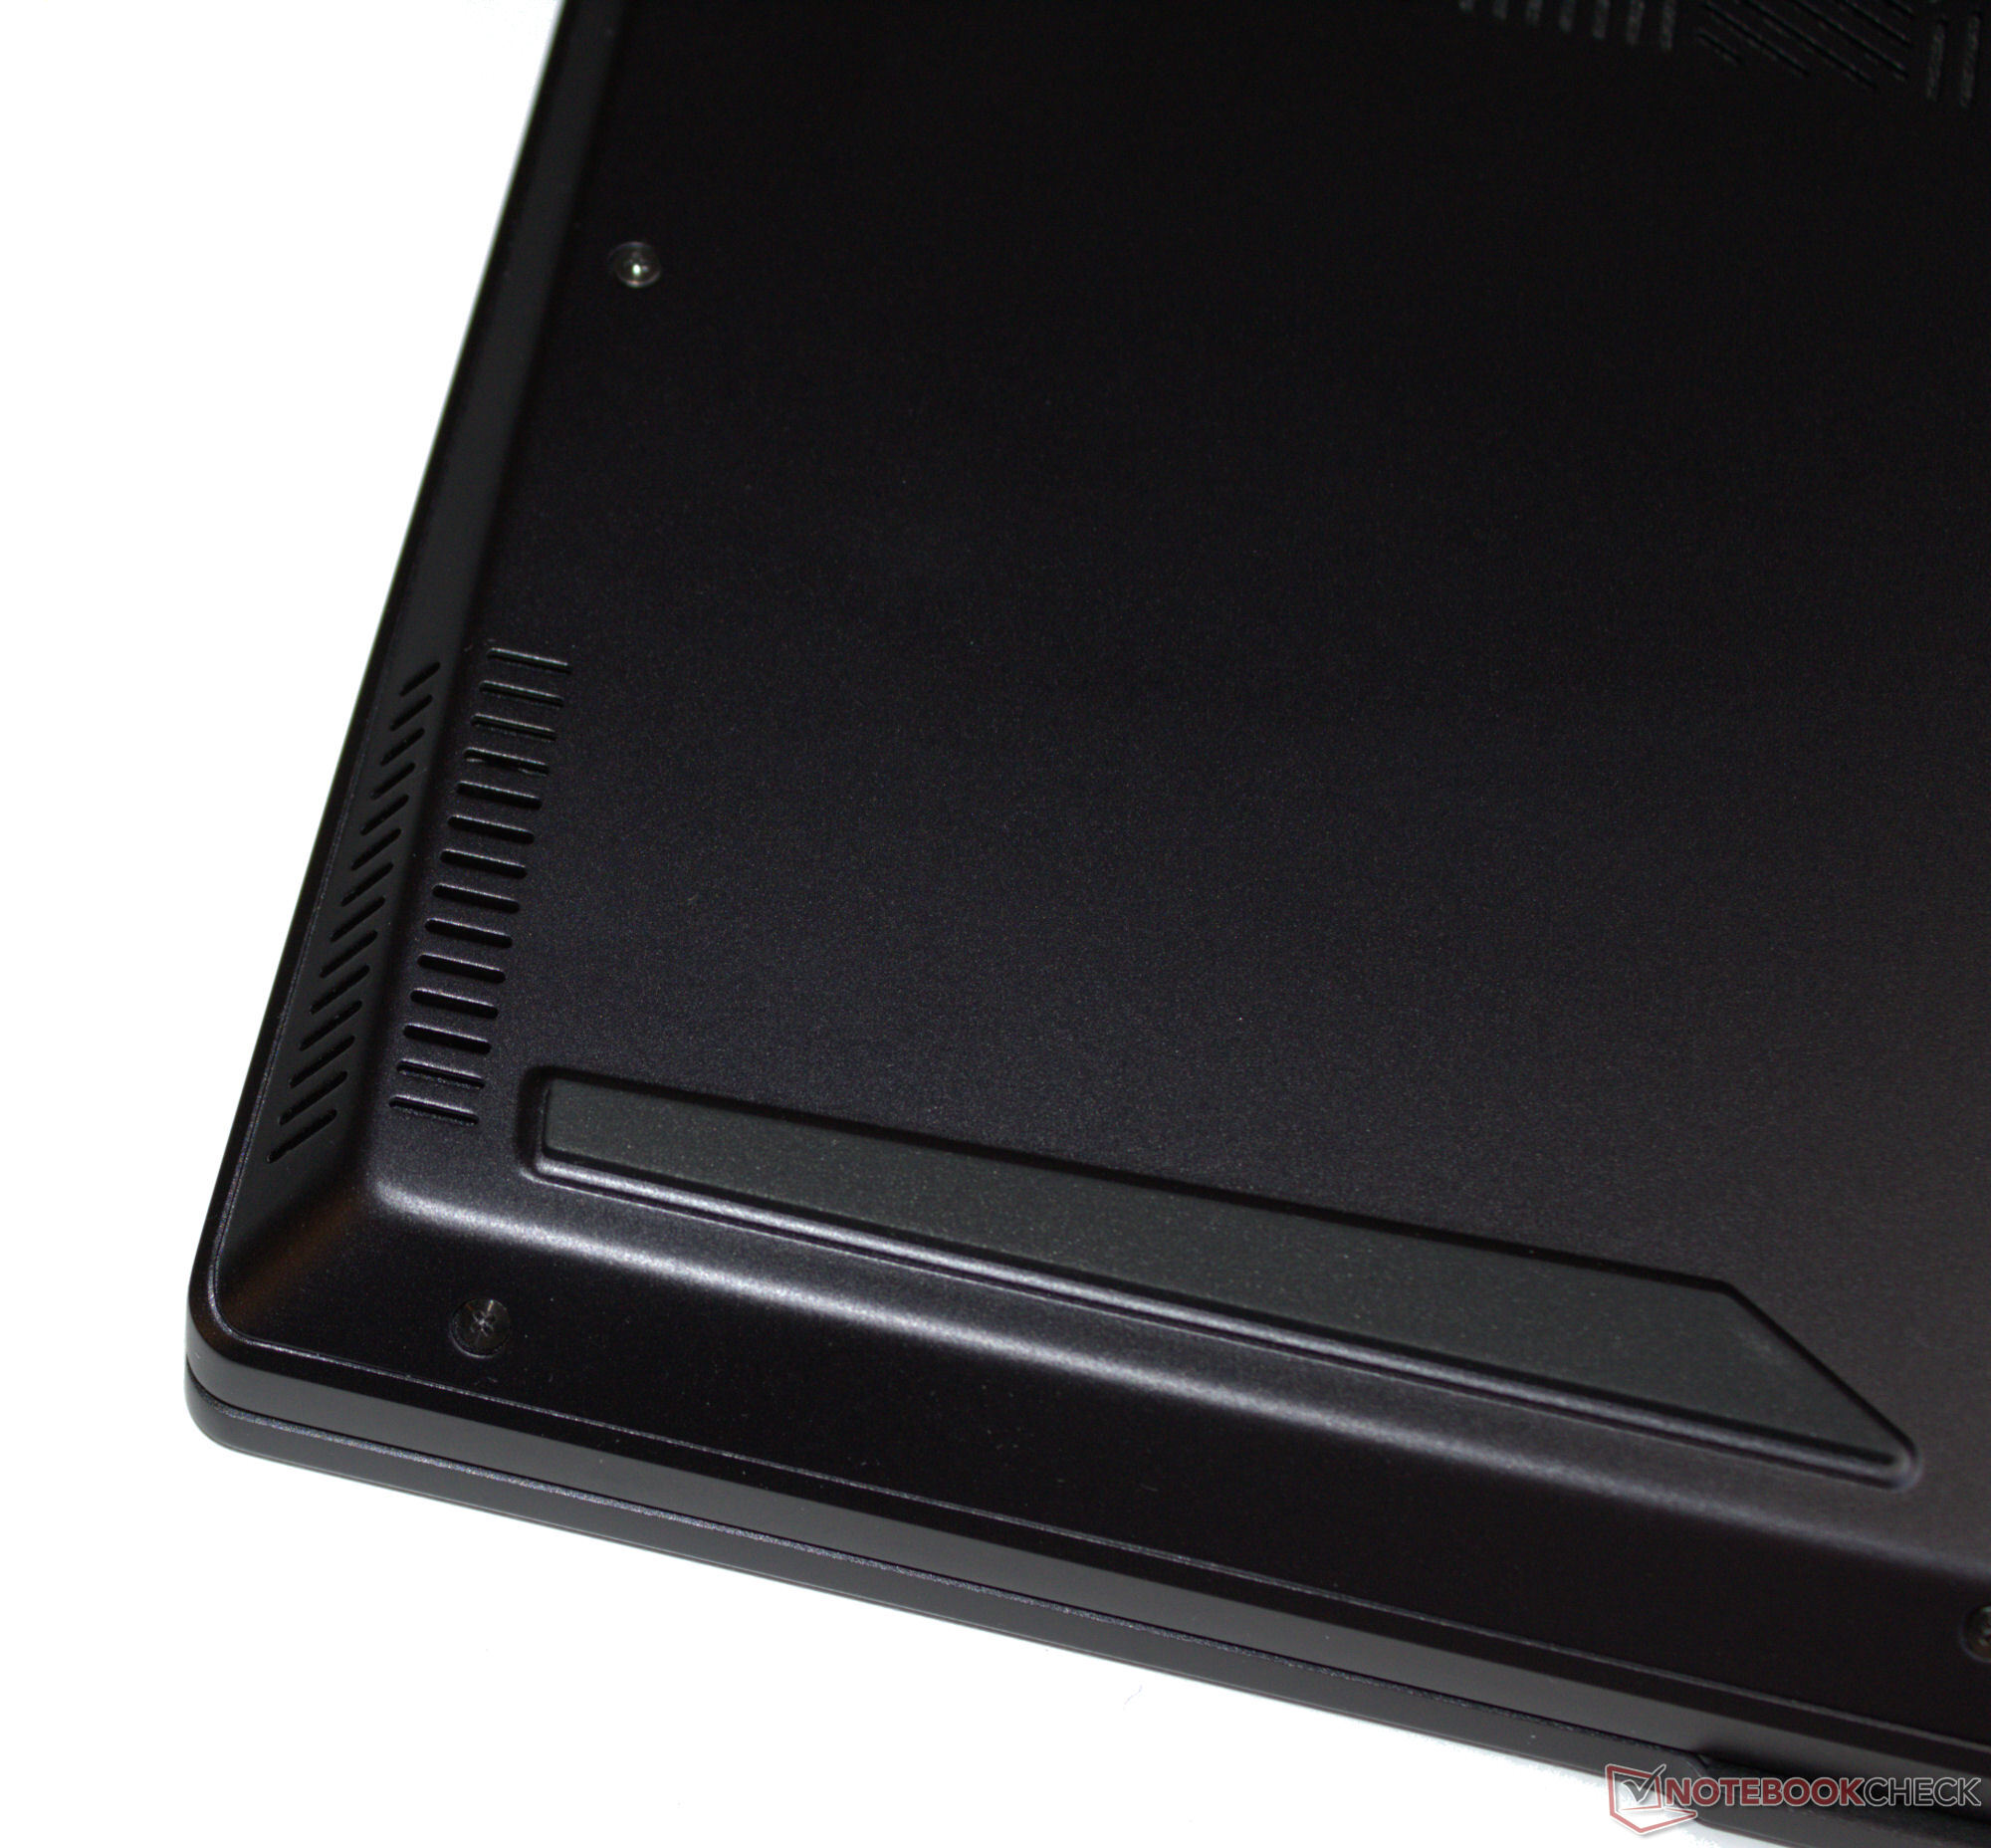
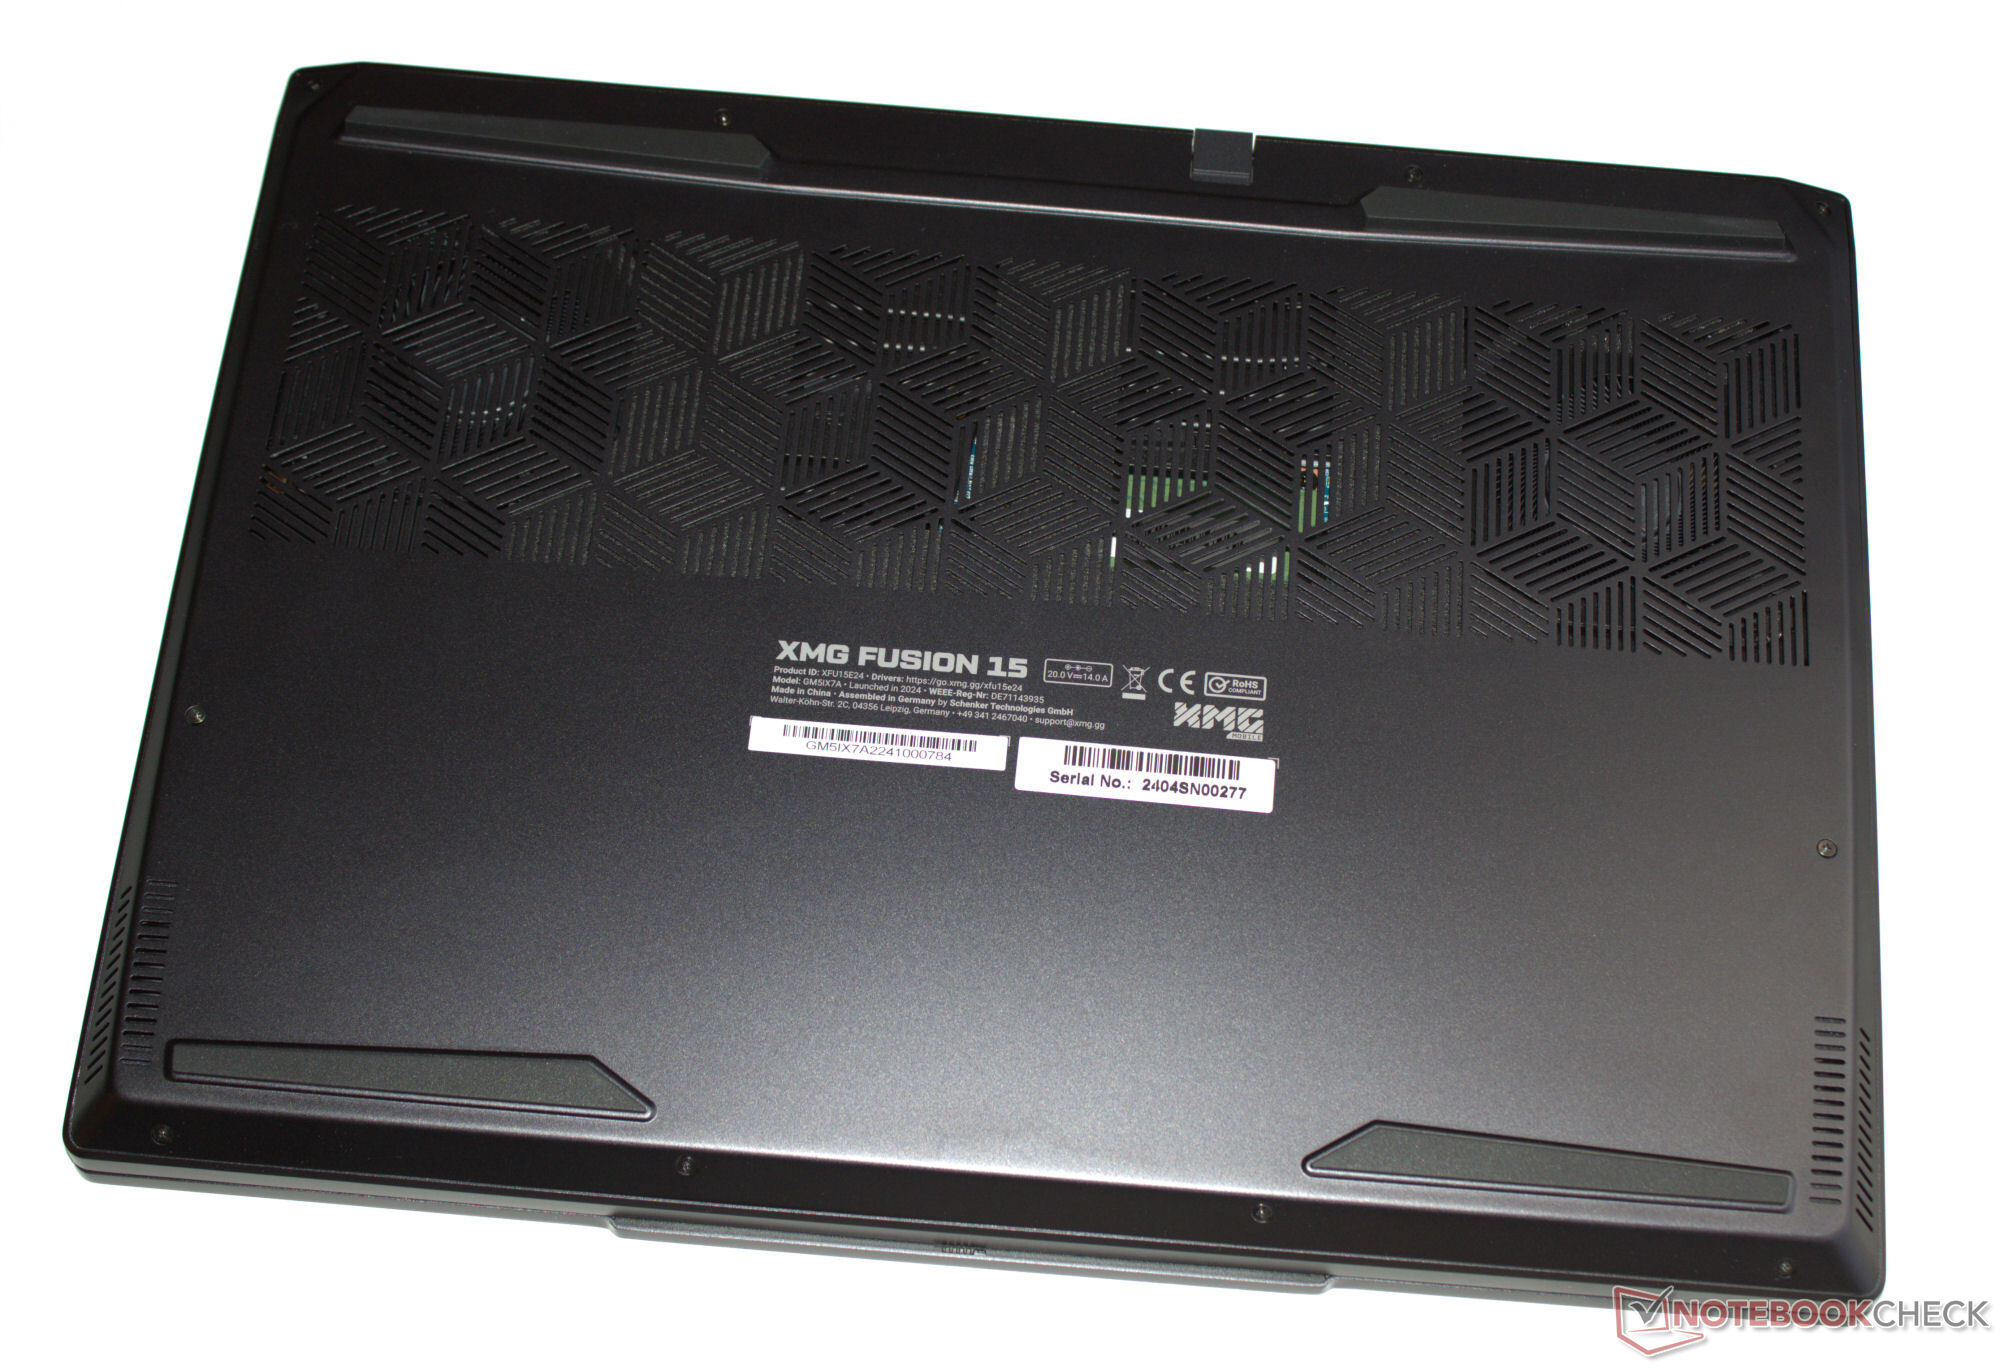
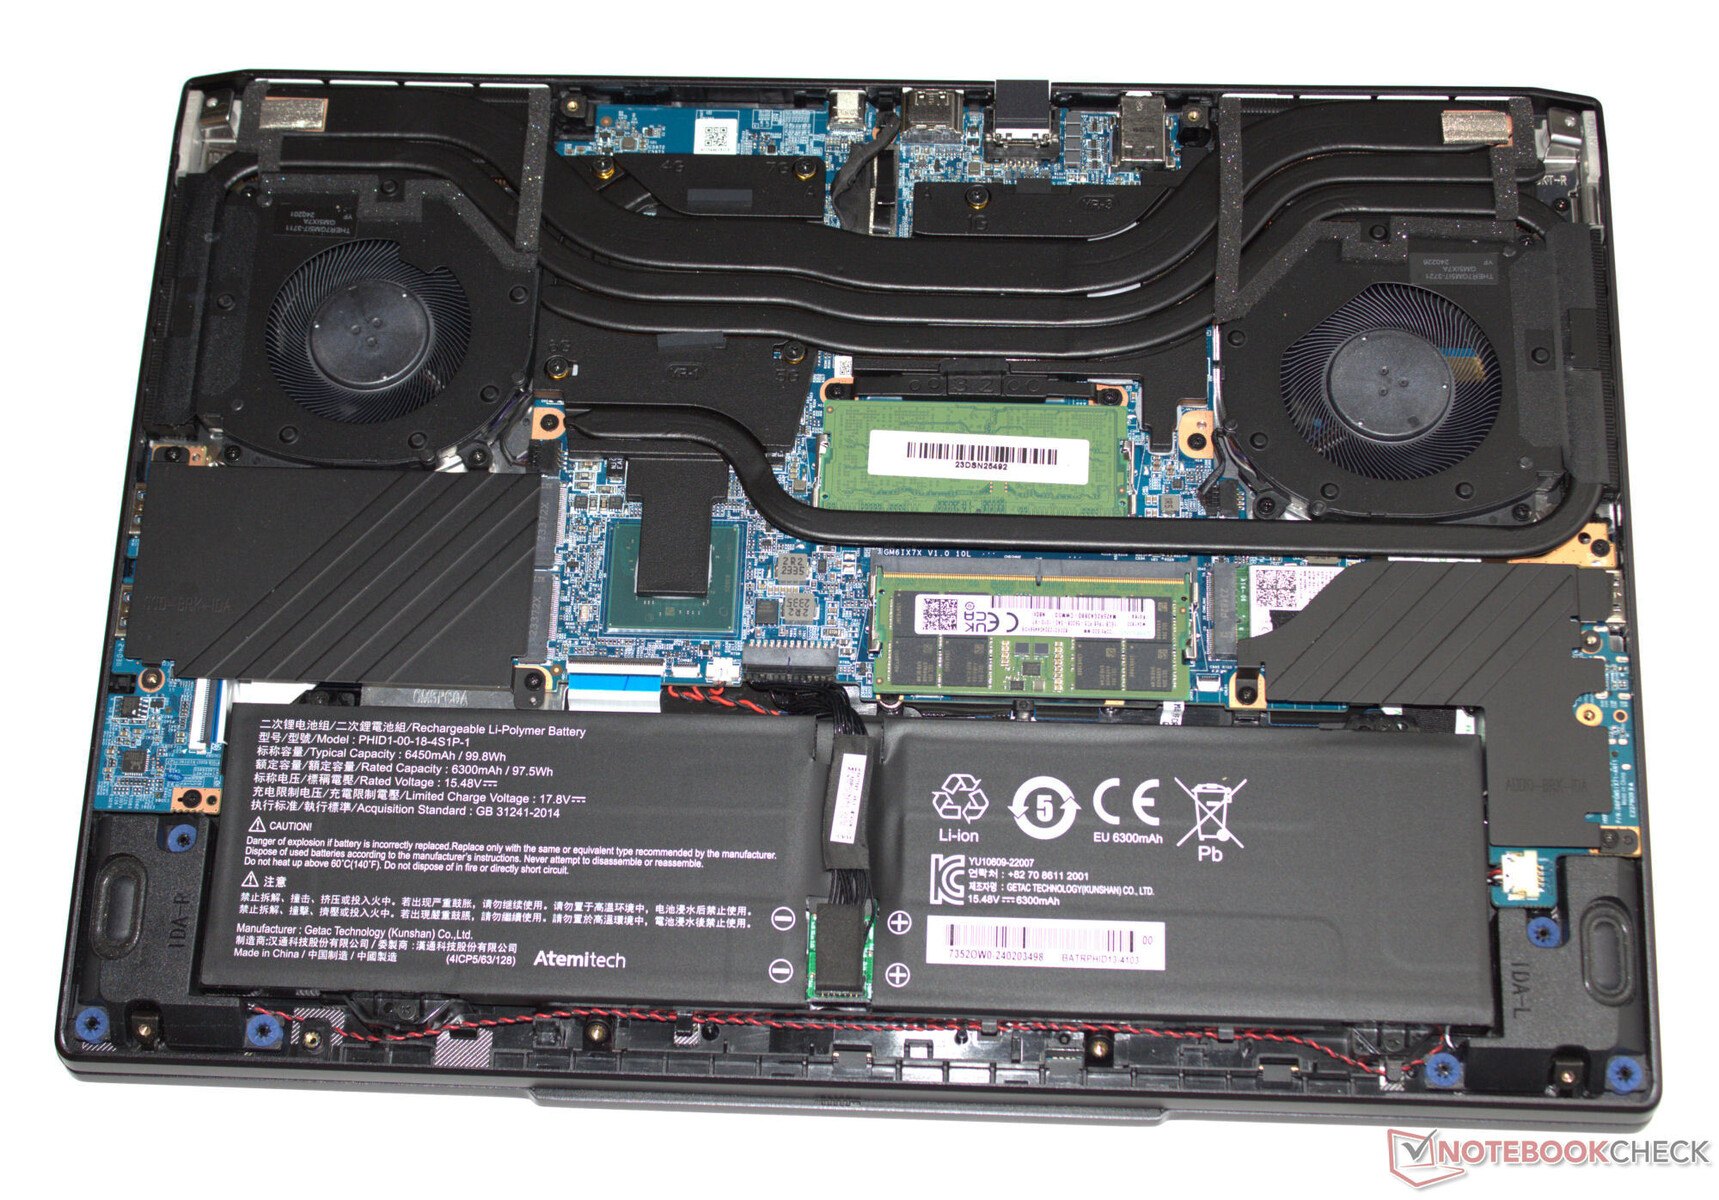
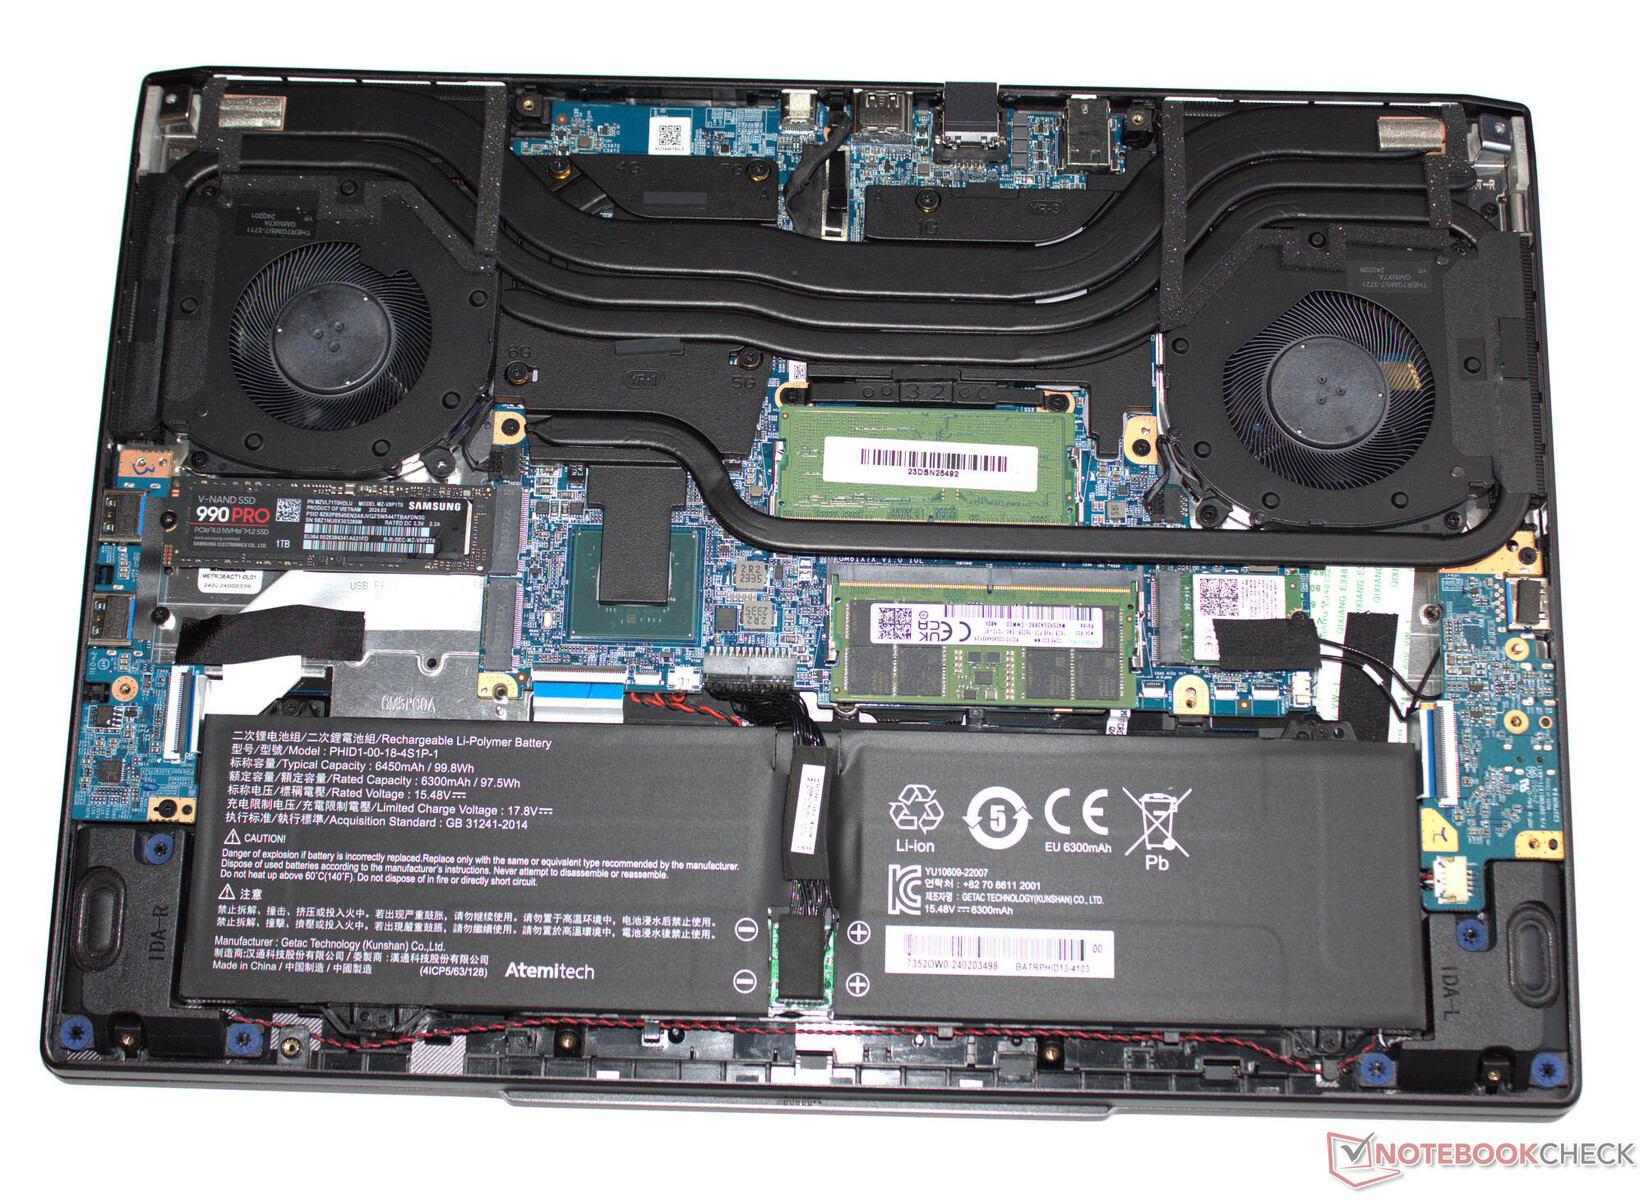
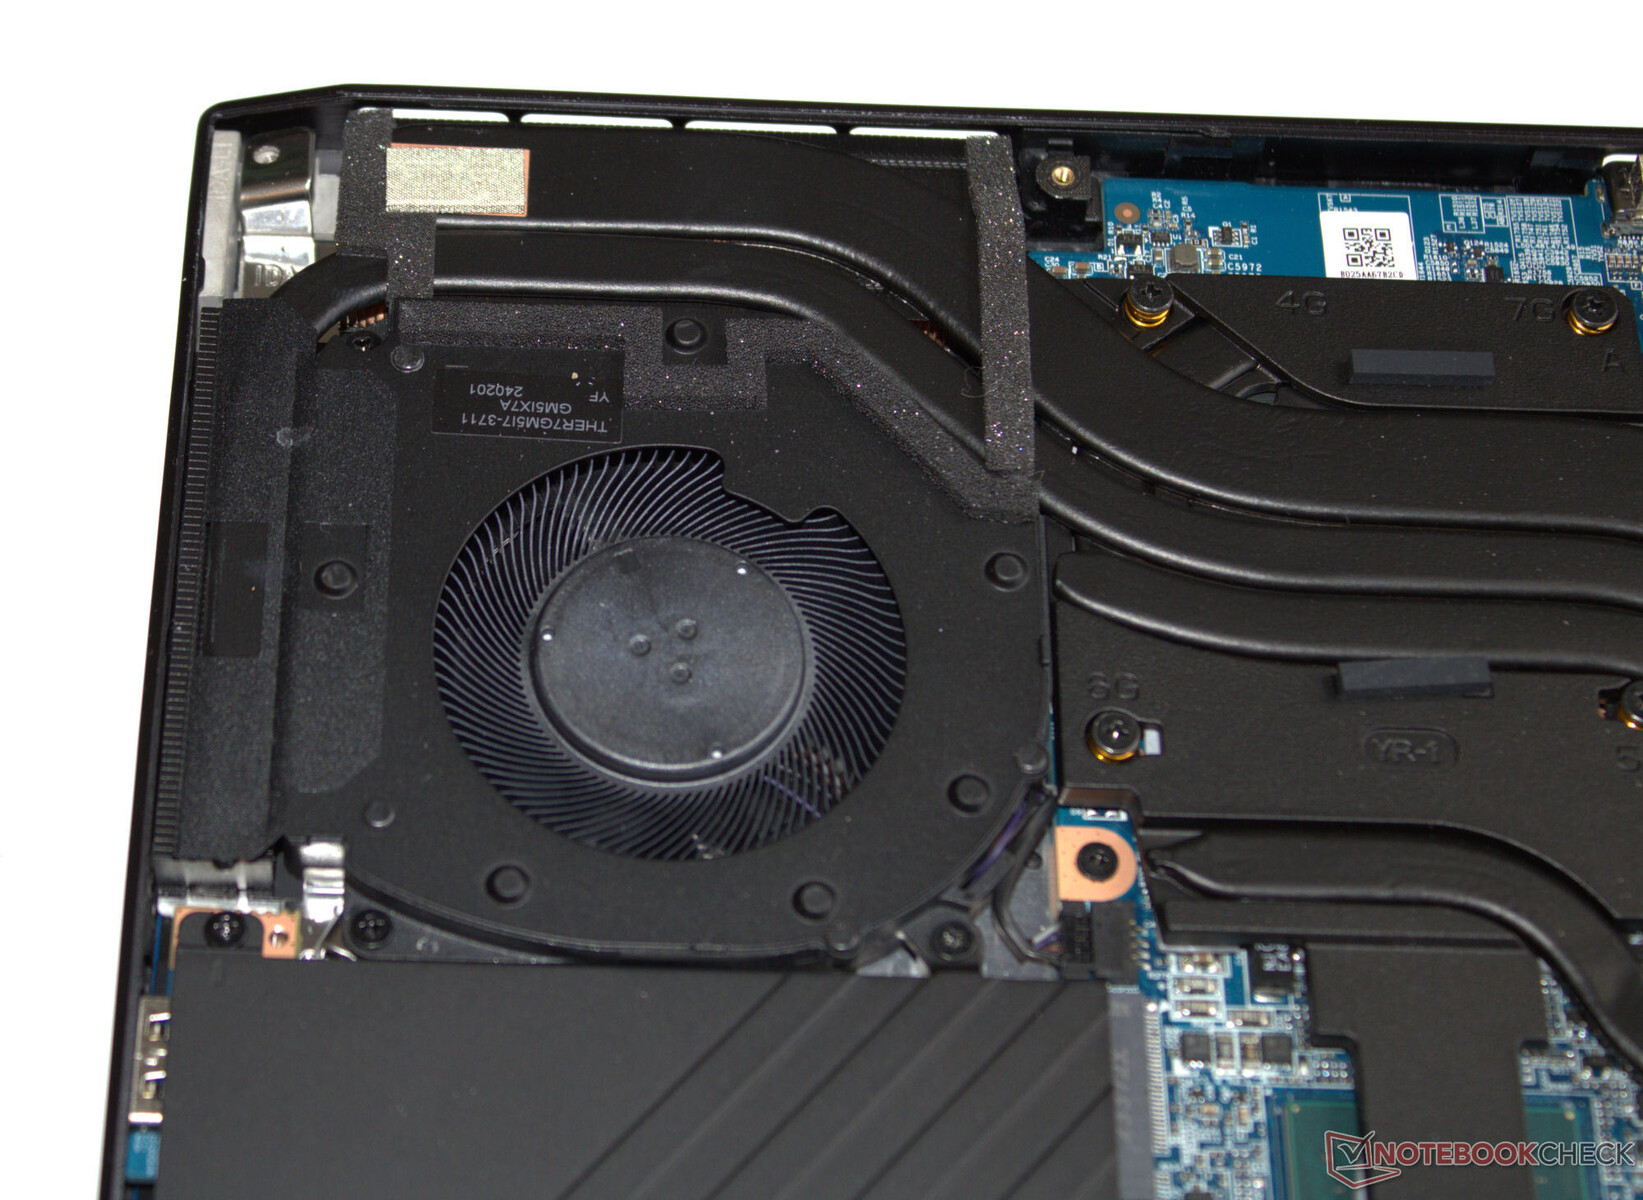
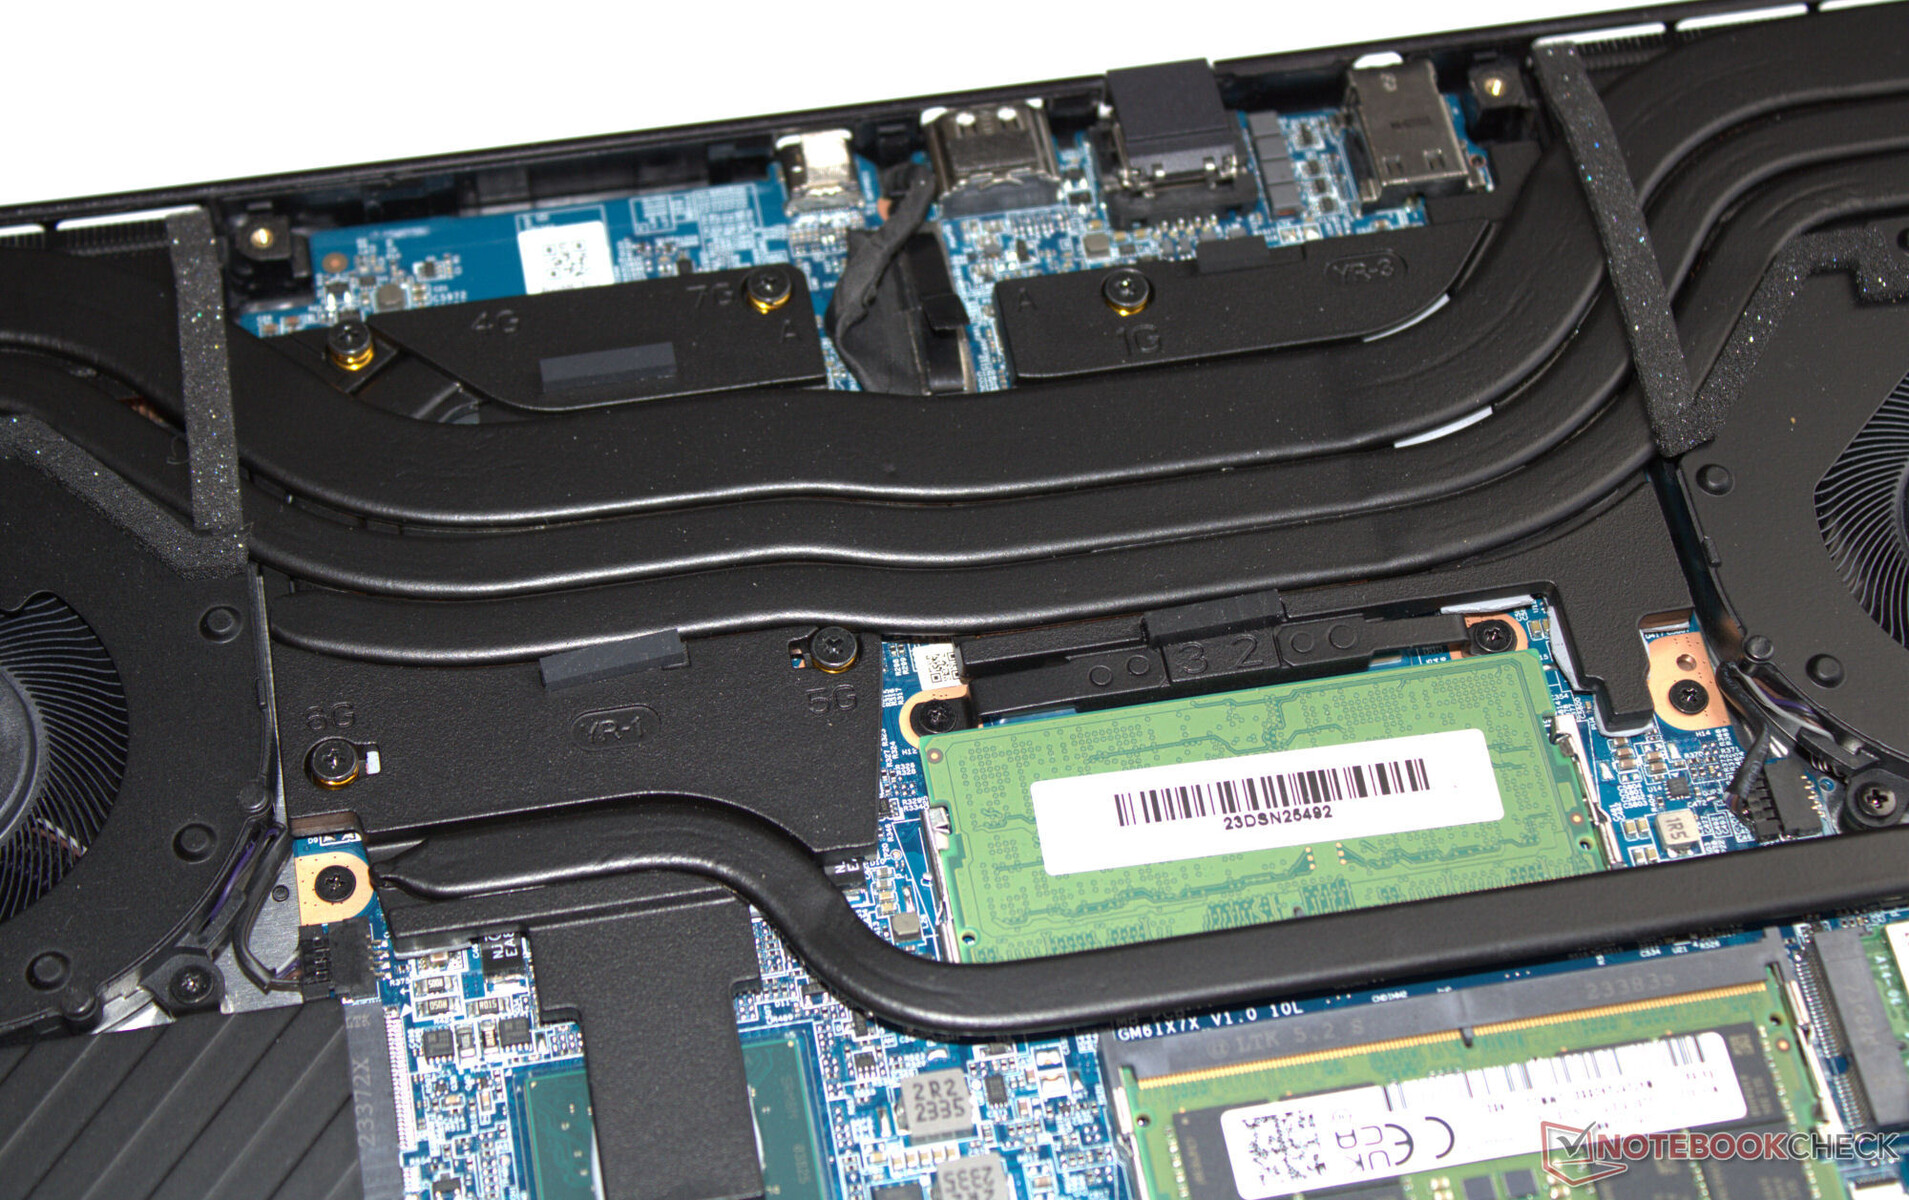
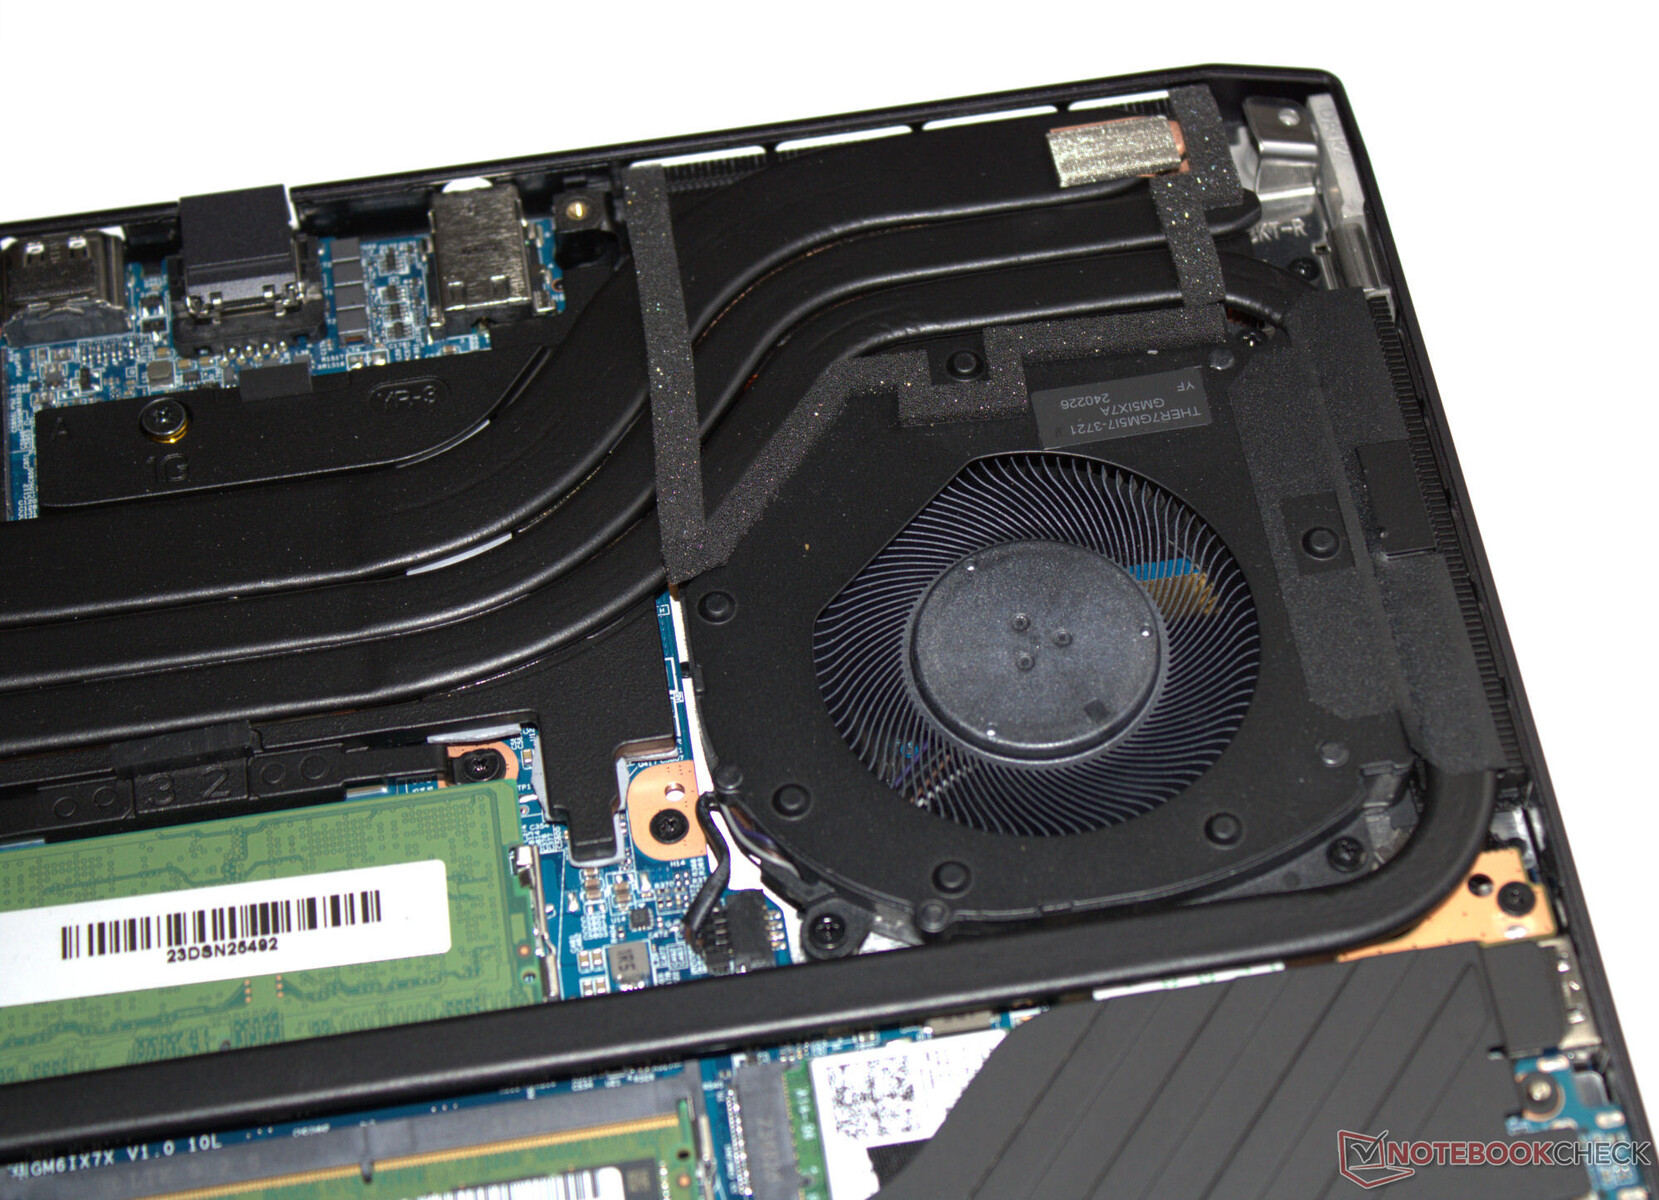
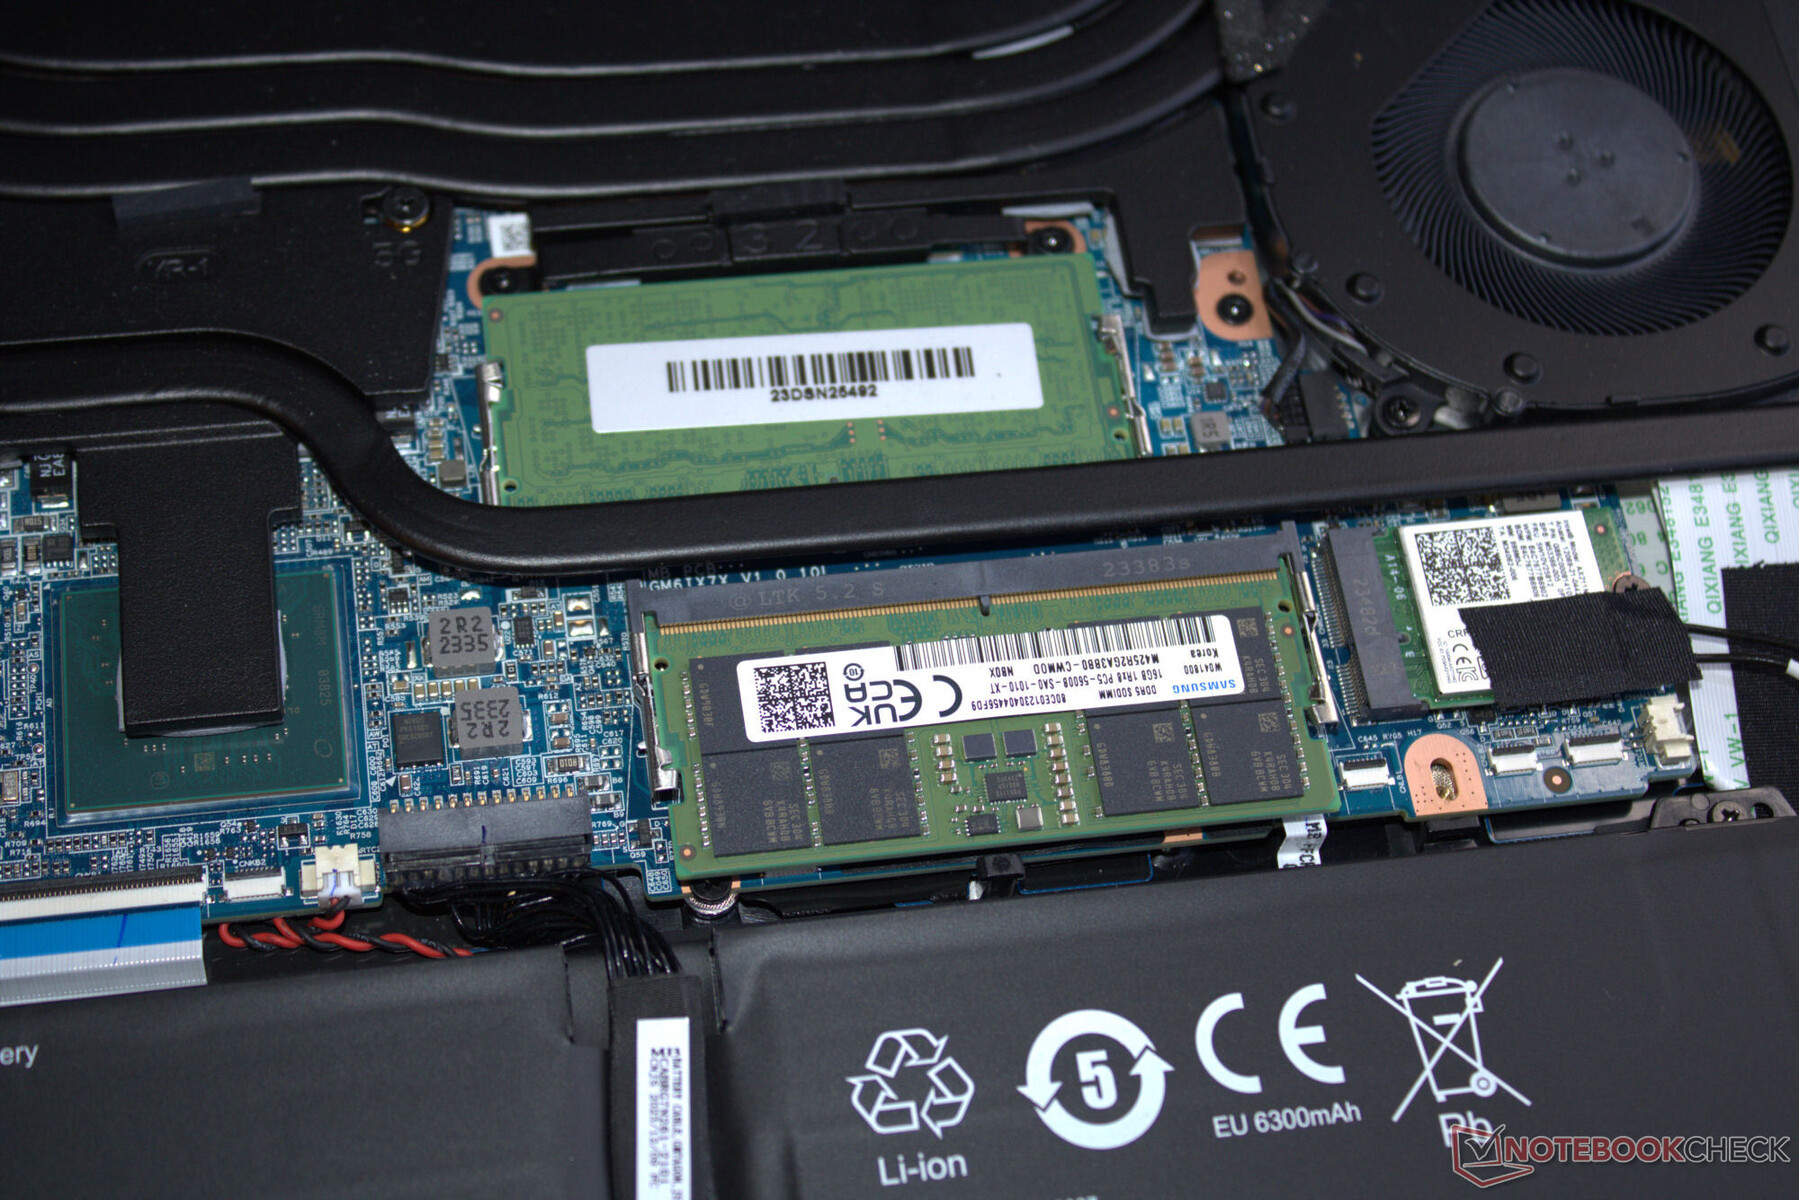
Manutenção
Depois de remover todos os parafusos na parte inferior do dispositivo, a parte inferior do gabinete pode ser retirada com bastante facilidade - o senhor pode precisar apenas de um plectro ou de uma espátula plana para ajudar nisso. Em seguida, é possível acessar os bancos de RAM (ambos ocupados), SSD (PCIe 4, M.2-2280), segundo slot SSD (PCIe 4, M.2-2280), módulo WLAN, ventiladores, bateria do BIOS e a bateria do laptop.
Garantia
O dispositivo é coberto por uma garantia básica de dois anos, que inclui serviço de coleta e um serviço de reparo rápido de 6 meses (reparo em 48 horas). O senhor pode estender essa garantia para 36 meses mediante o pagamento de uma taxa.
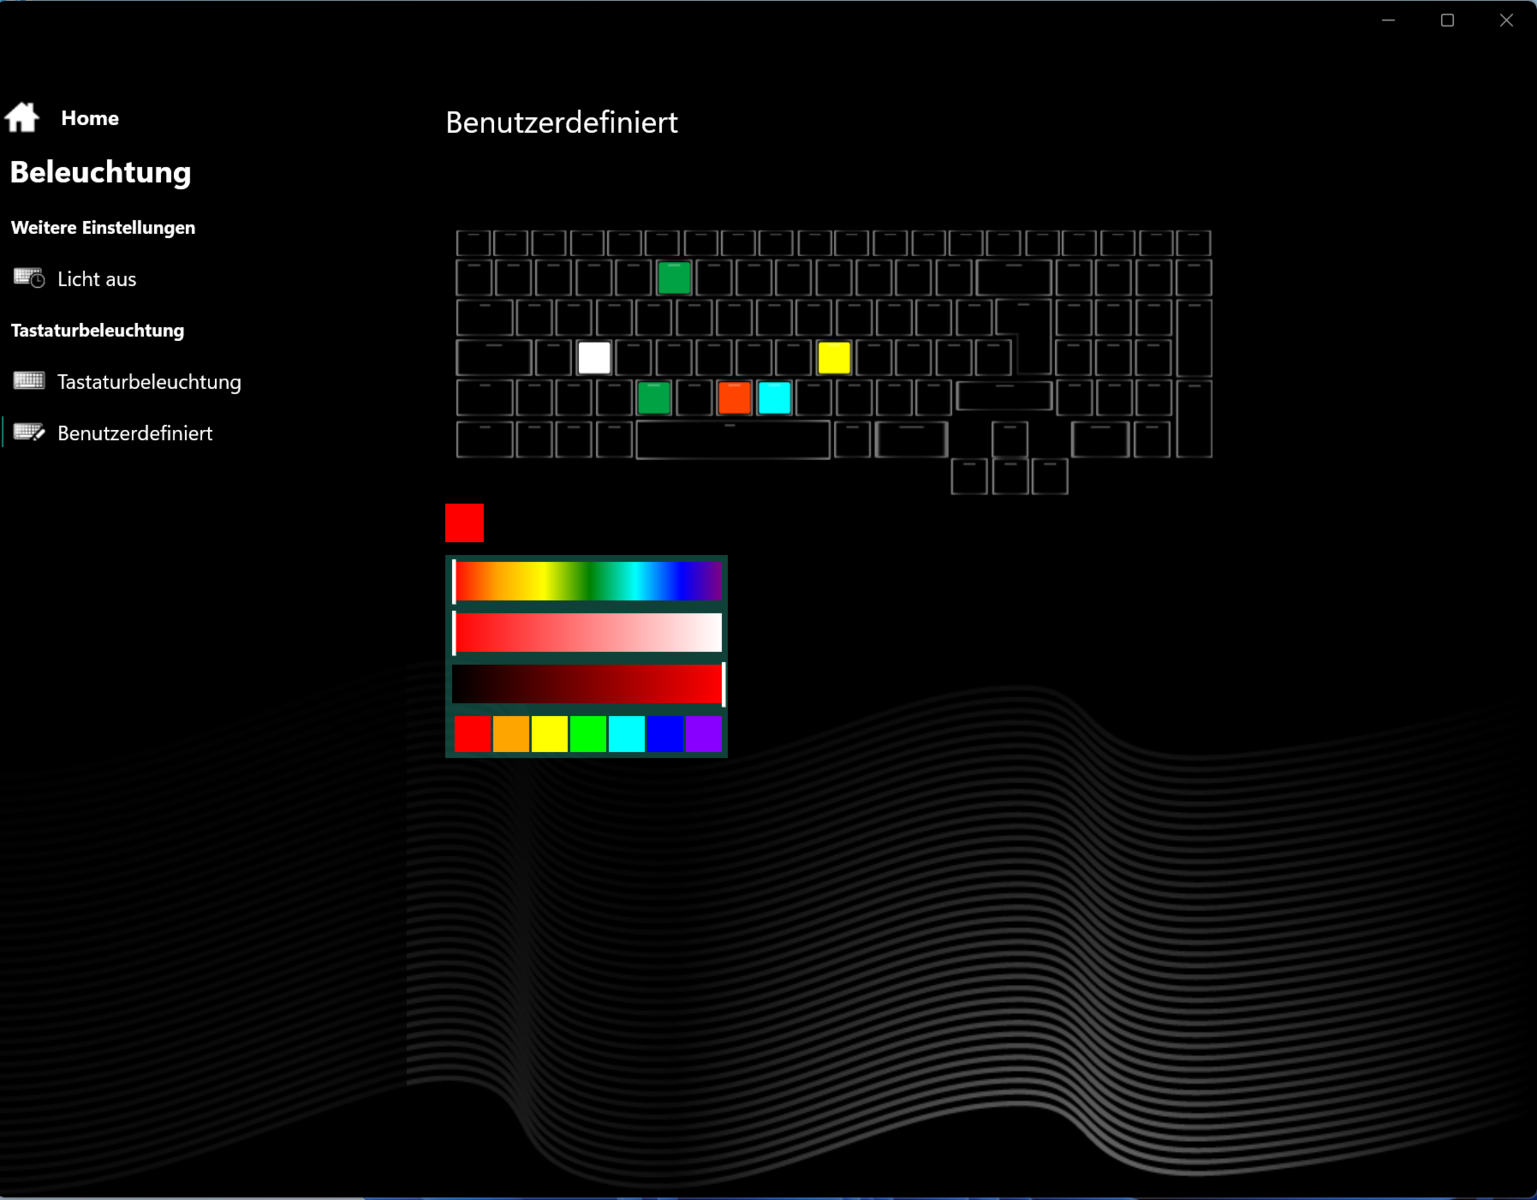
Dispositivos de entrada - Luz de fundo RGB de uma tecla
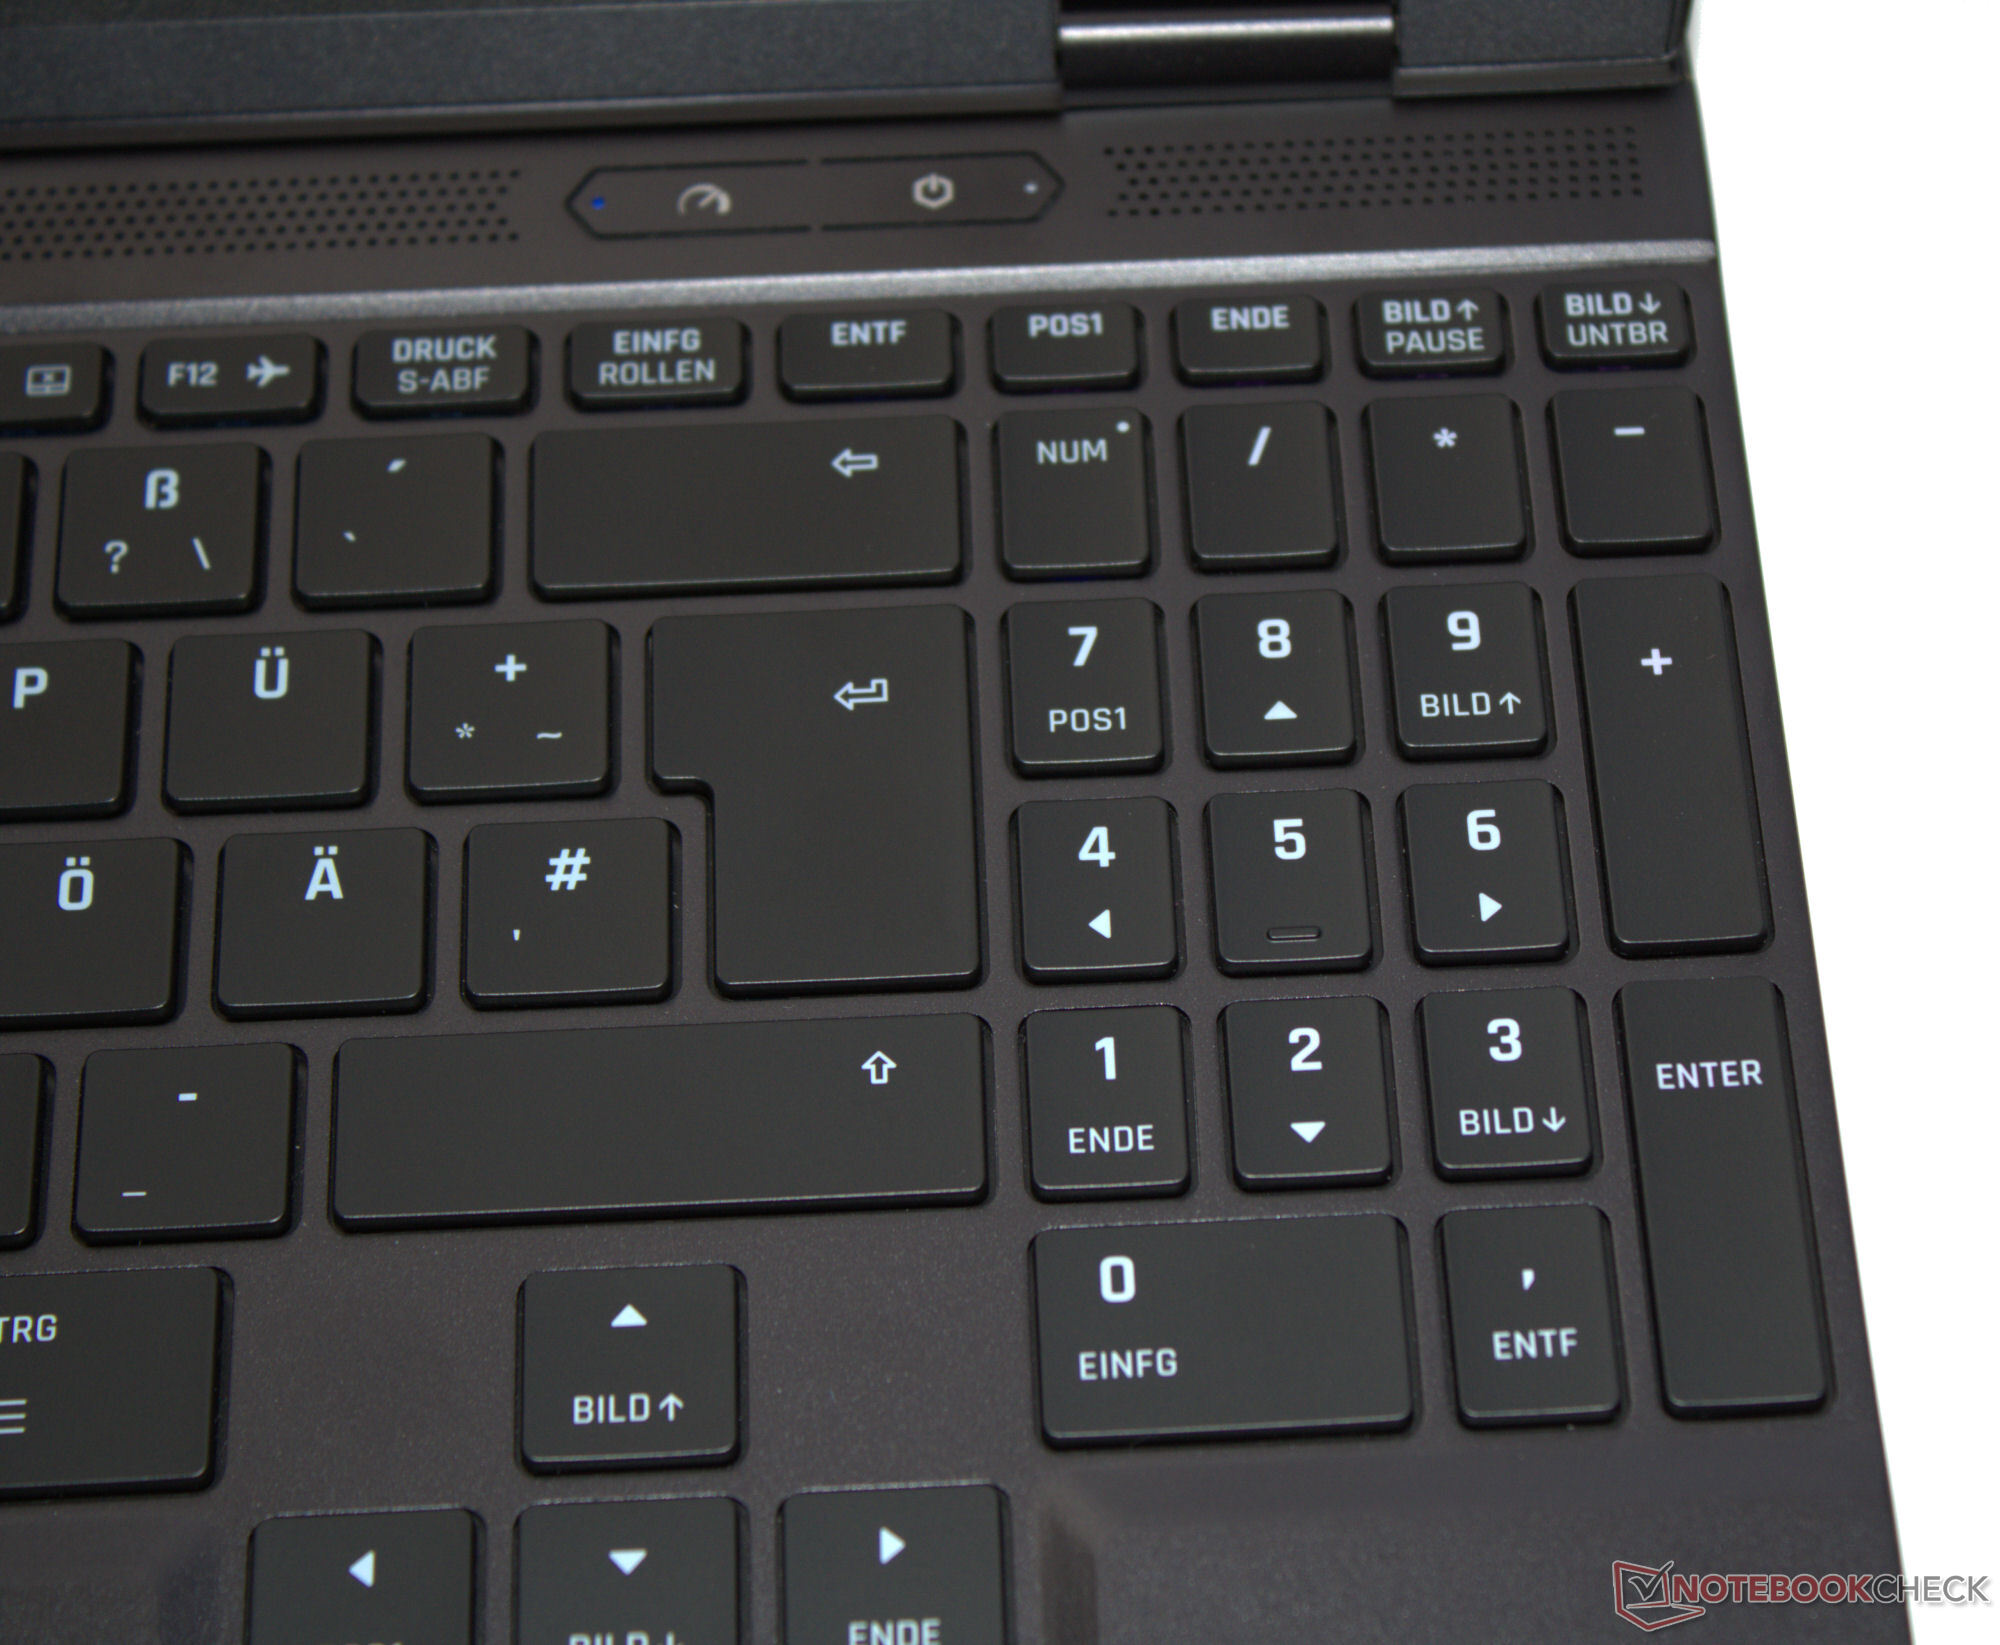
Teclado
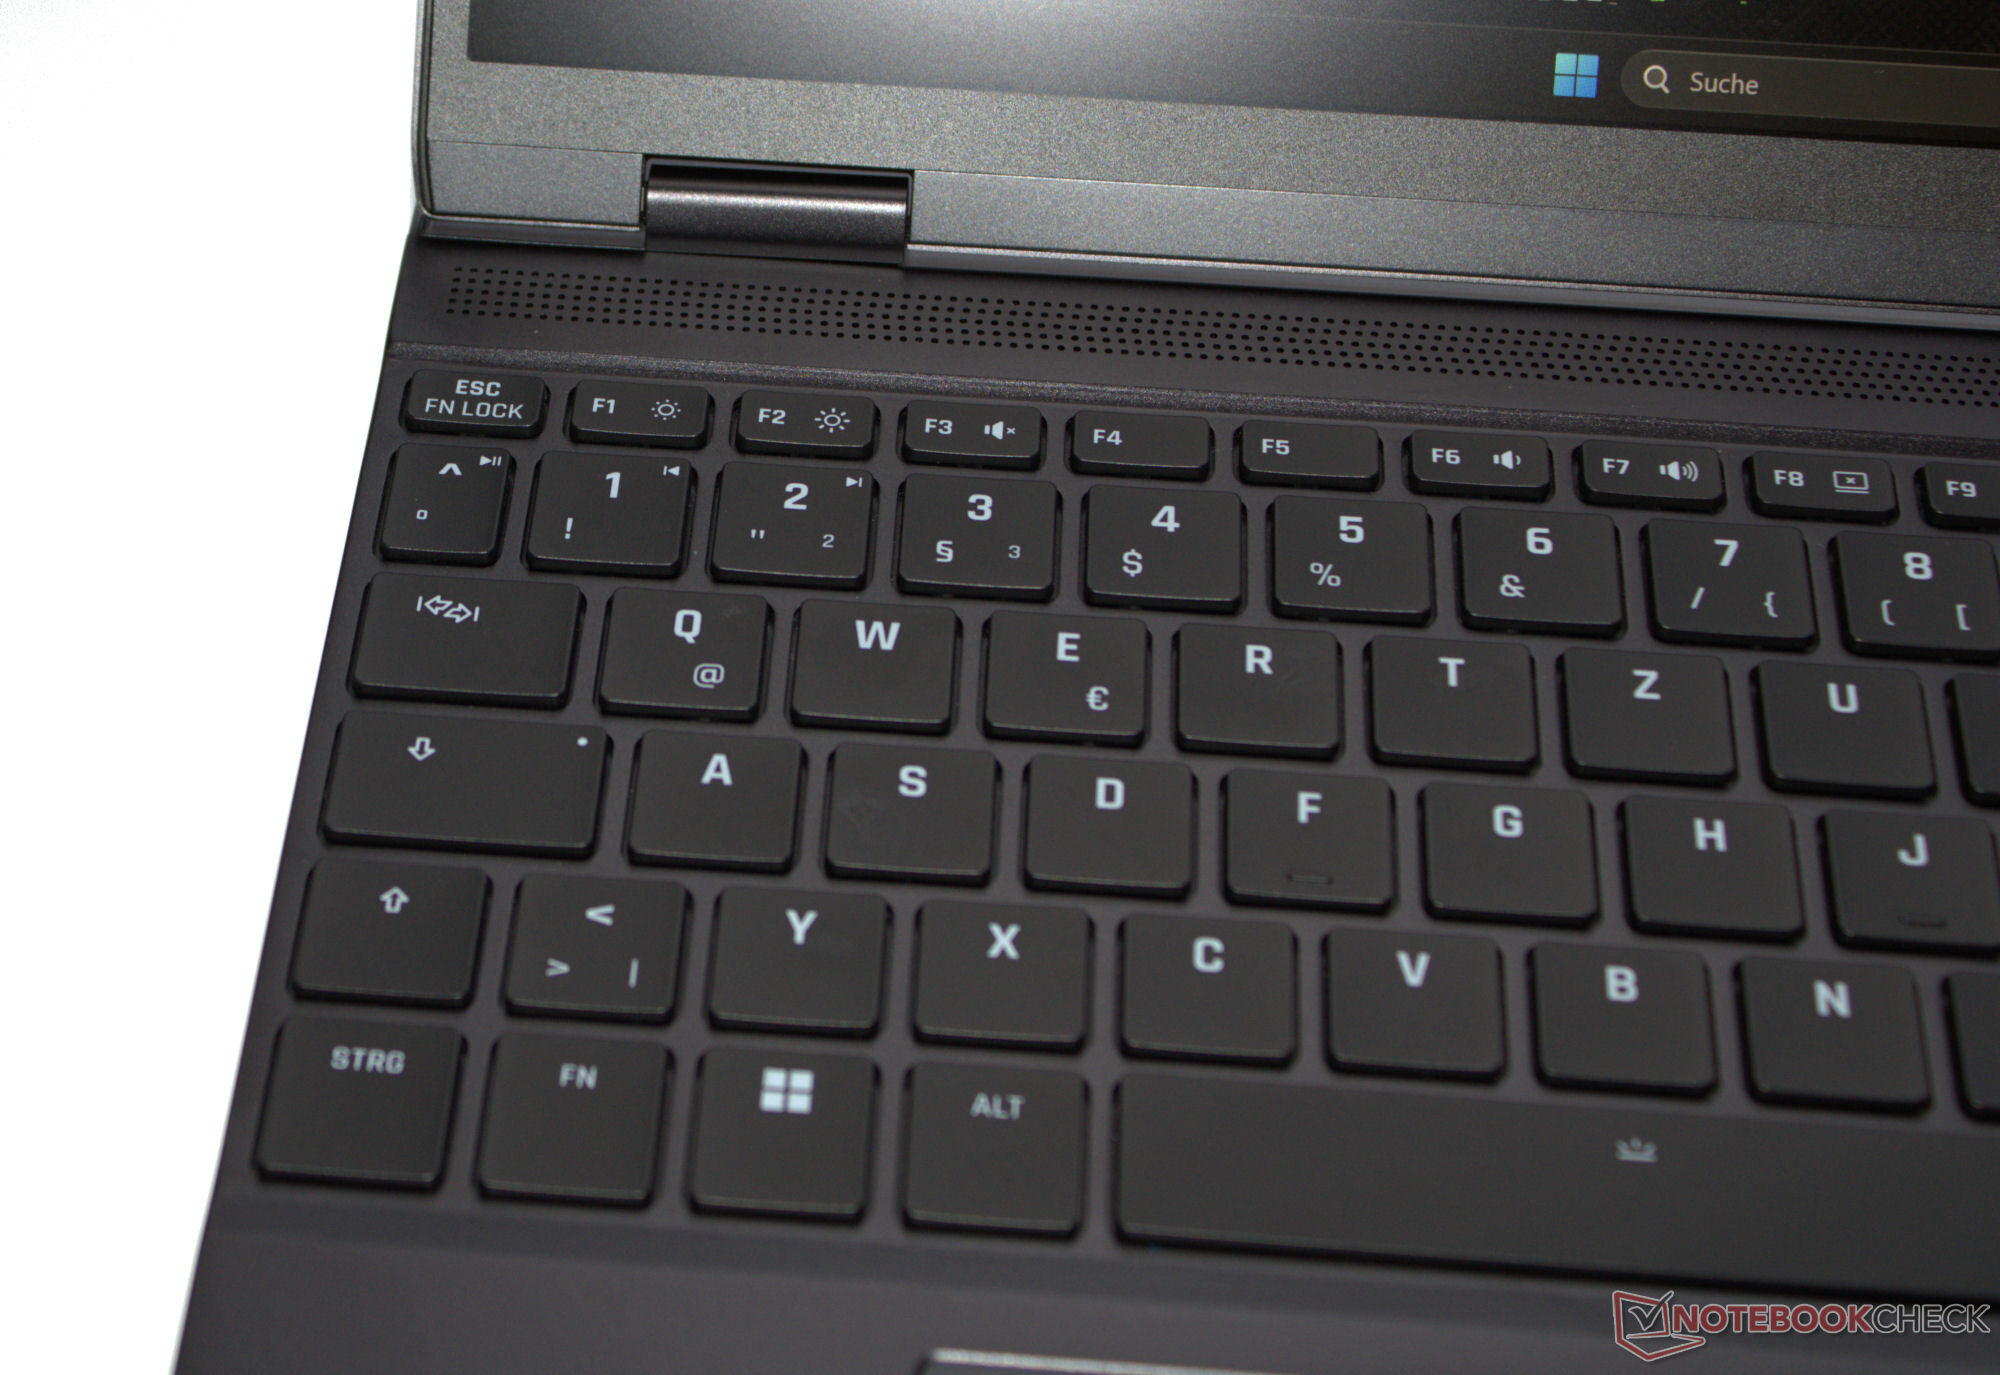
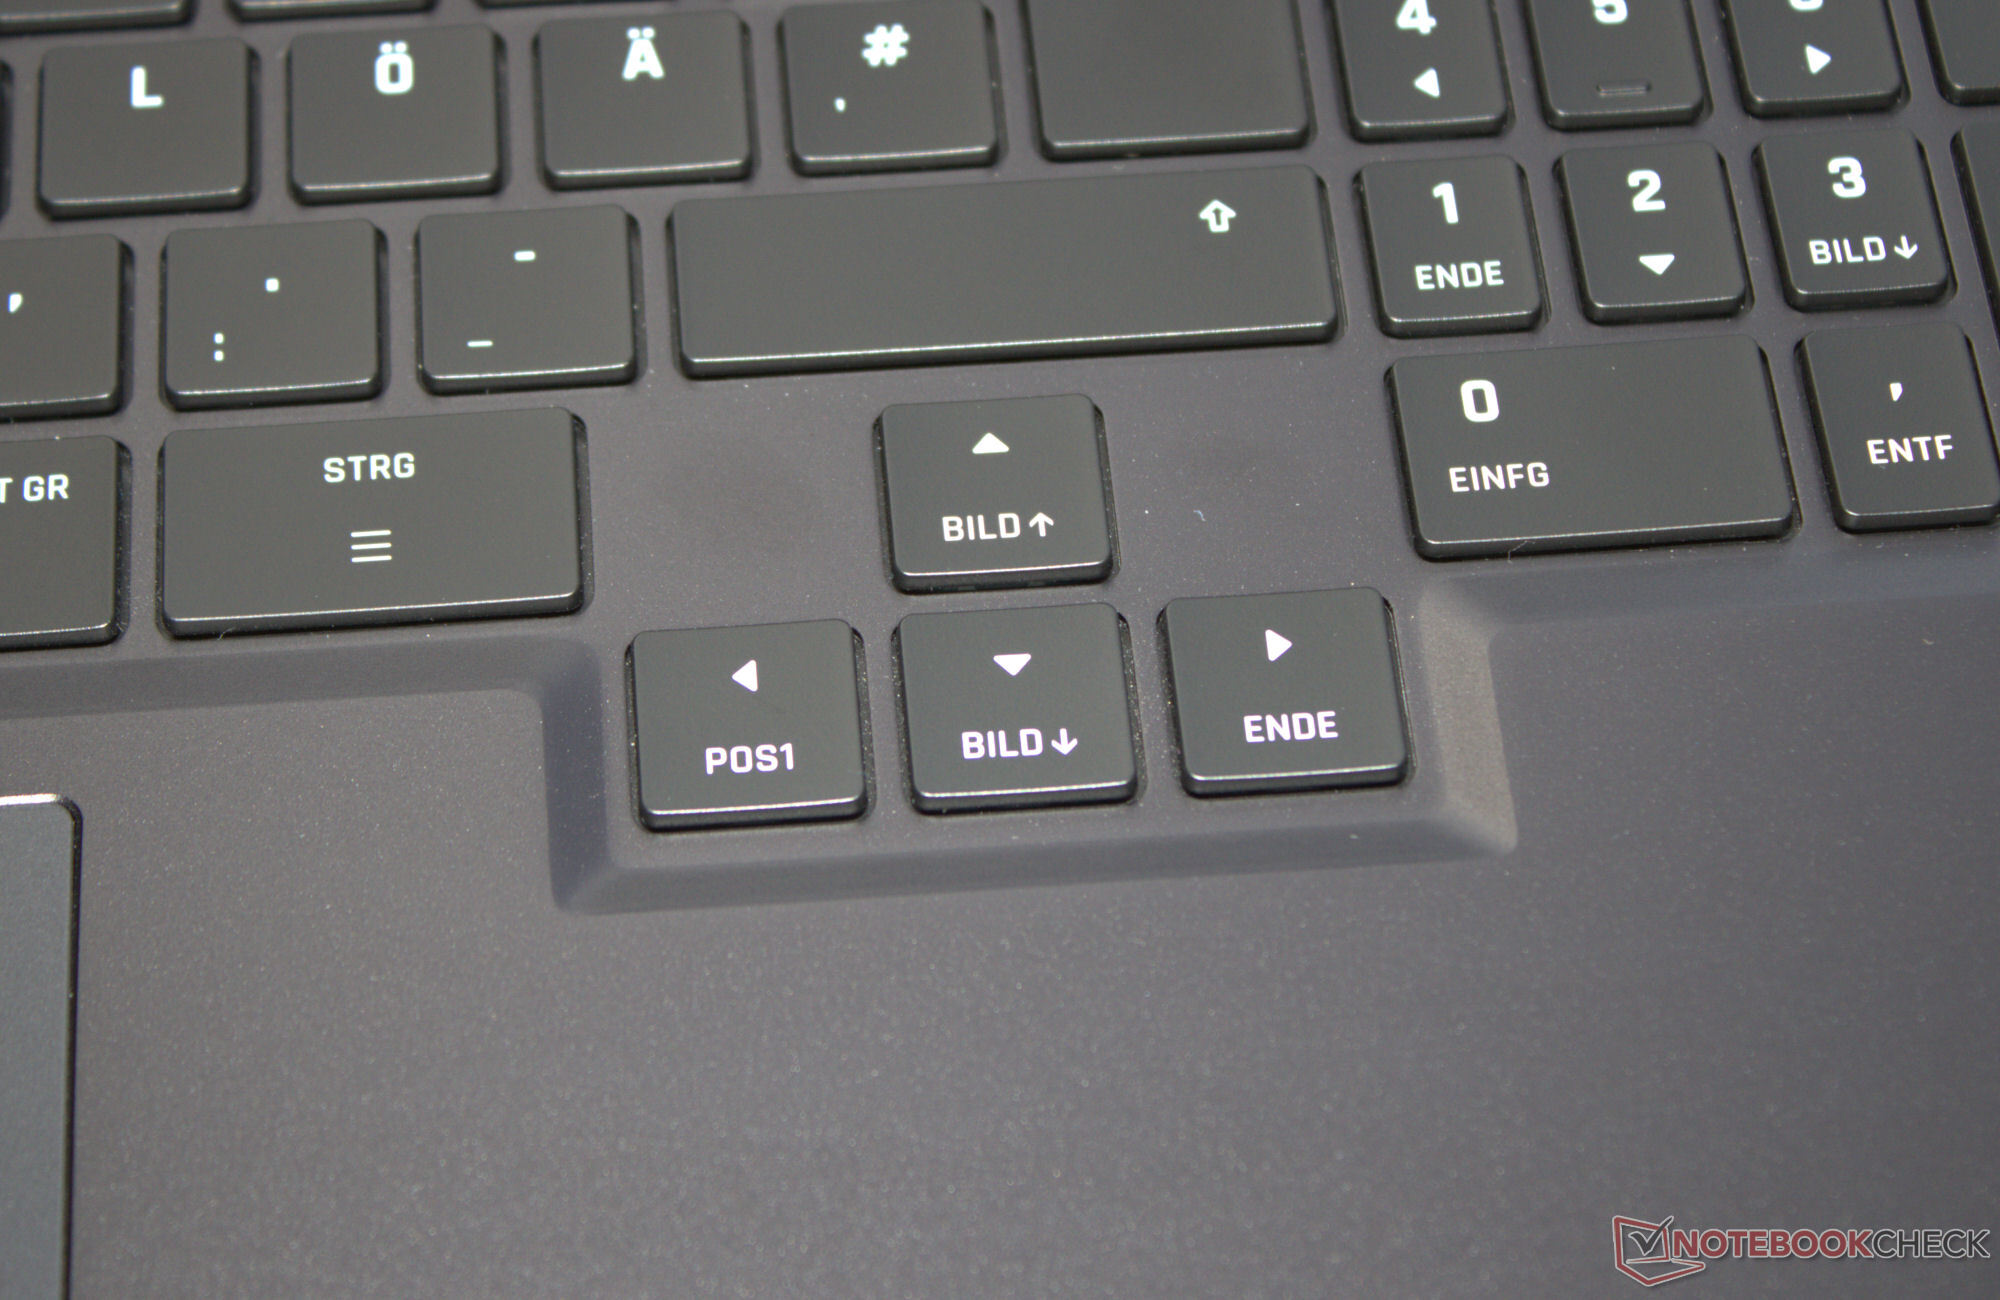
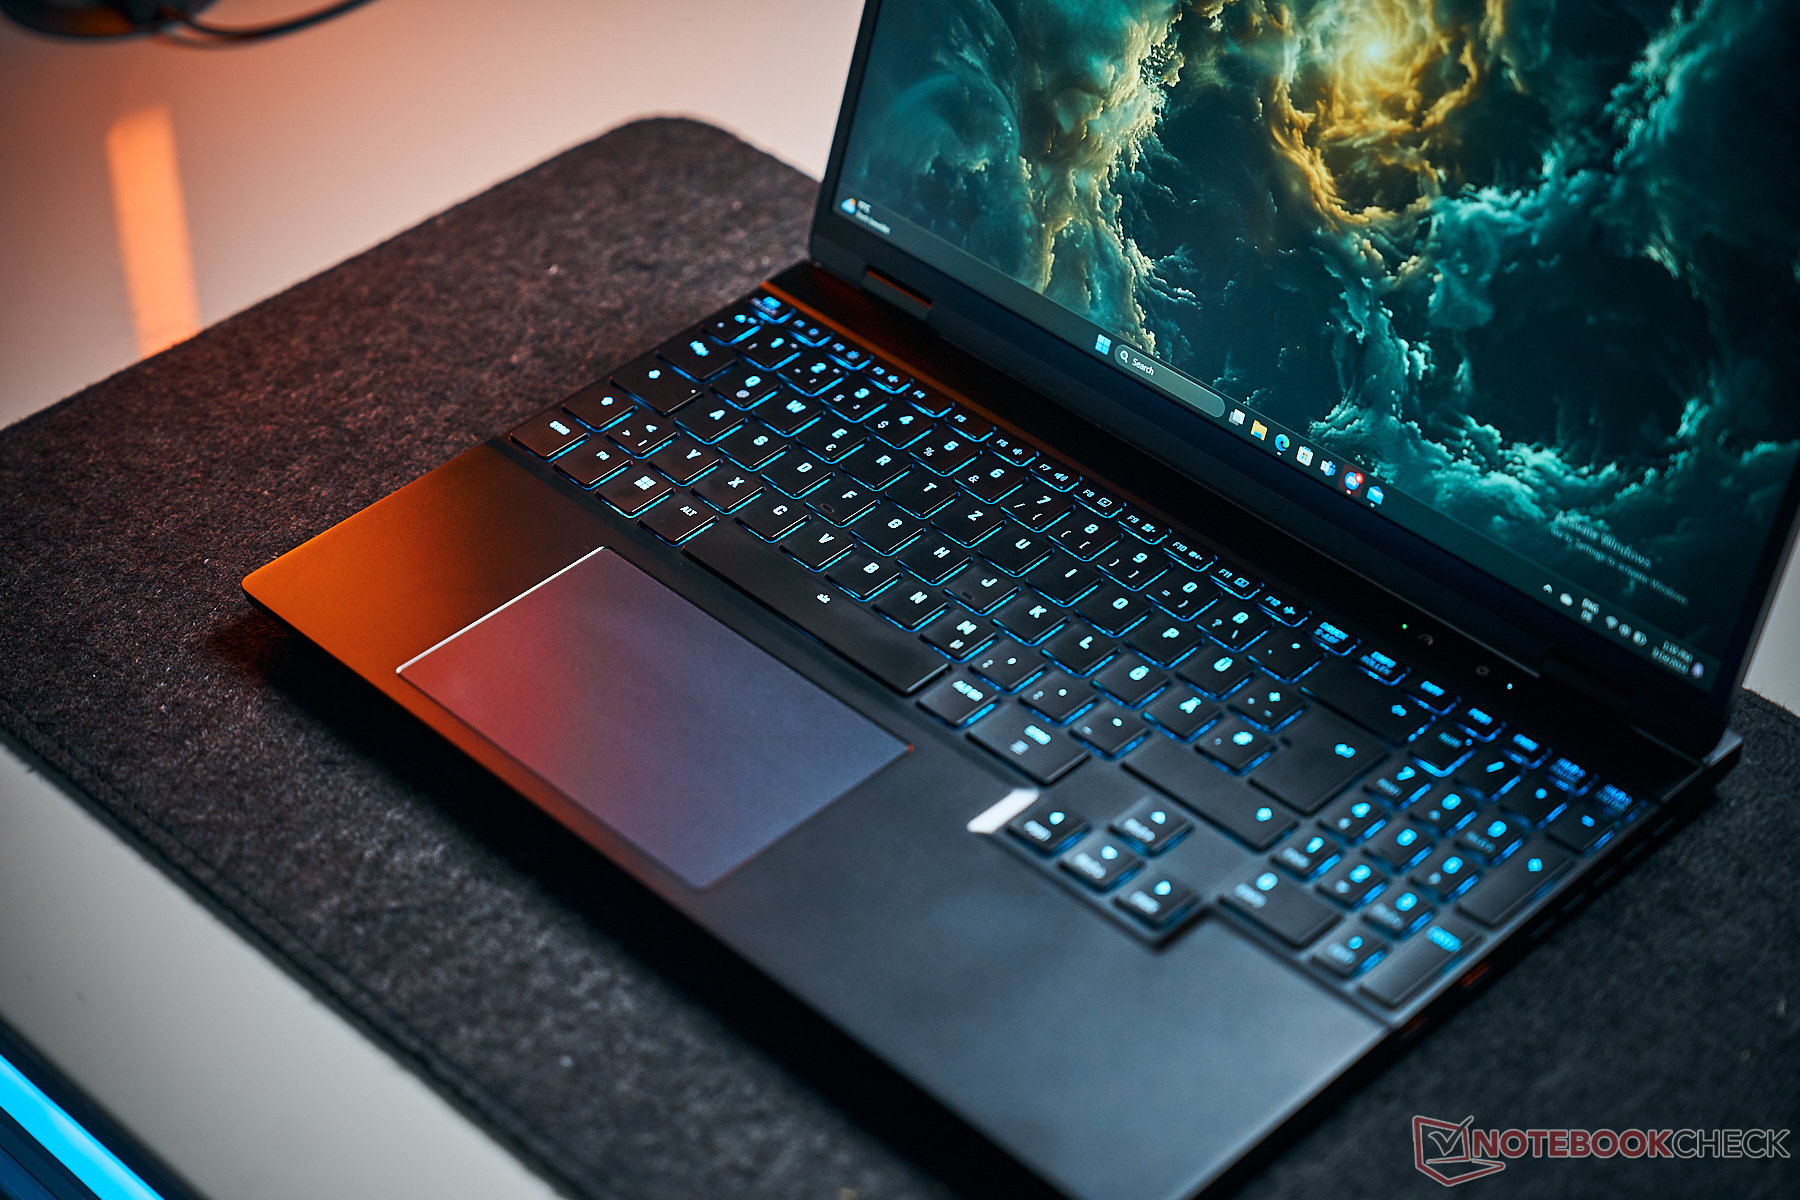
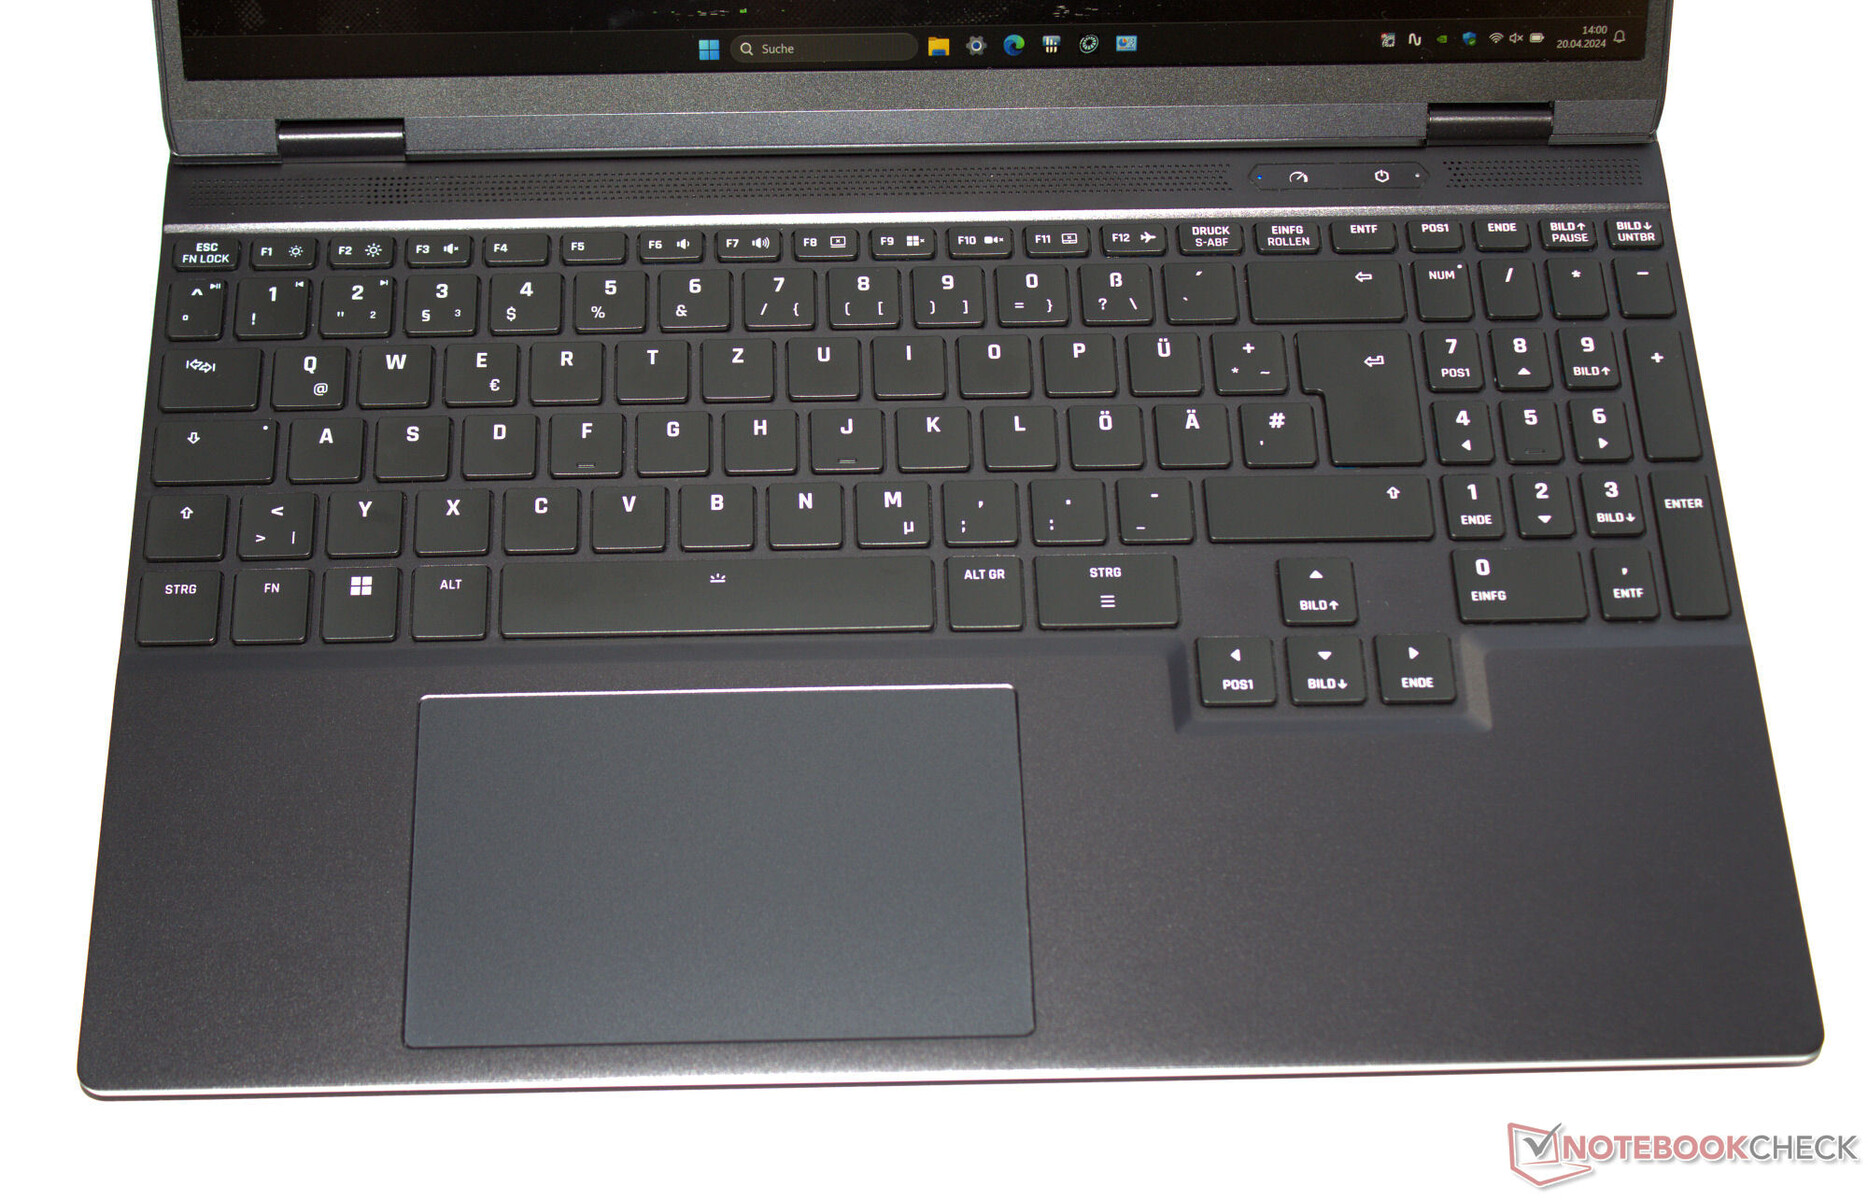
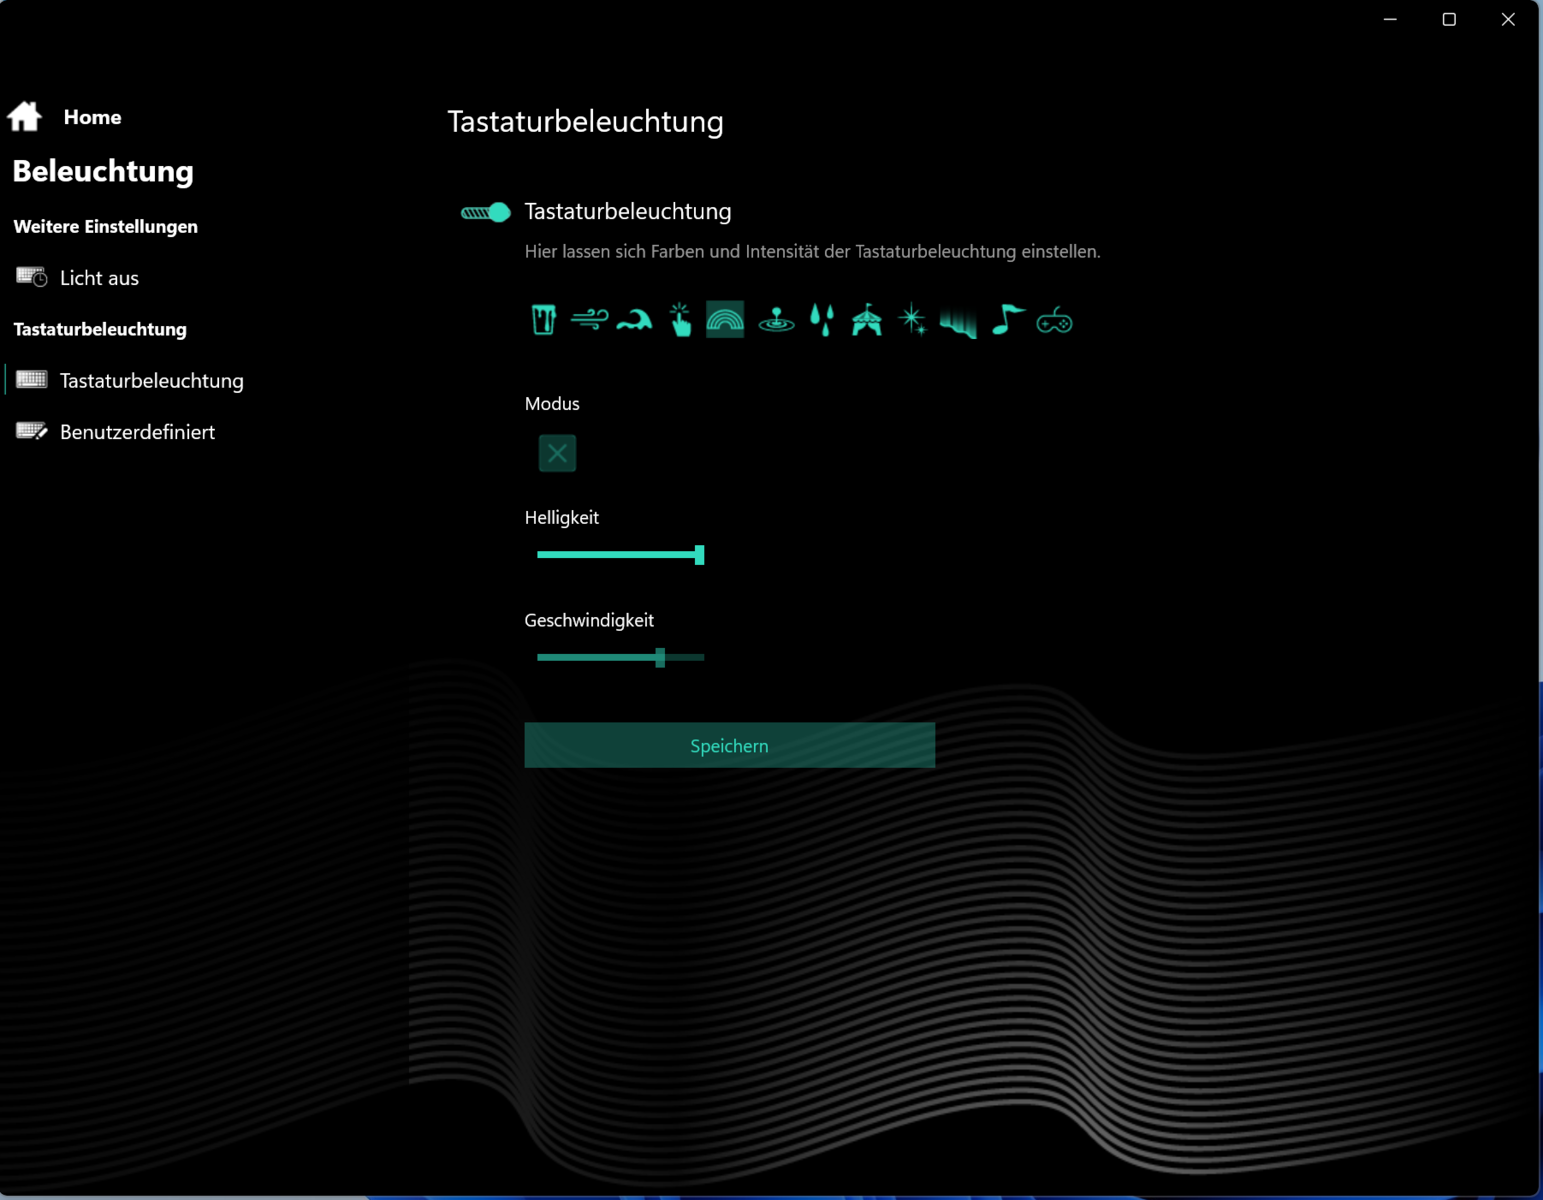
As teclas do teclado chiclet (retroiluminação RGB de quatro níveis) apresentam uma elevação média e um ponto de pressão claro. Sua resistência poderia ser um pouco mais nítida, mas isso é uma questão de gosto. O teclado cede um pouco ao digitar, mas não se mostrou incômodo durante nosso teste. Pontos positivos: As quatro teclas de seta não são apenas de tamanho normal, mas também estão separadas das outras teclas.
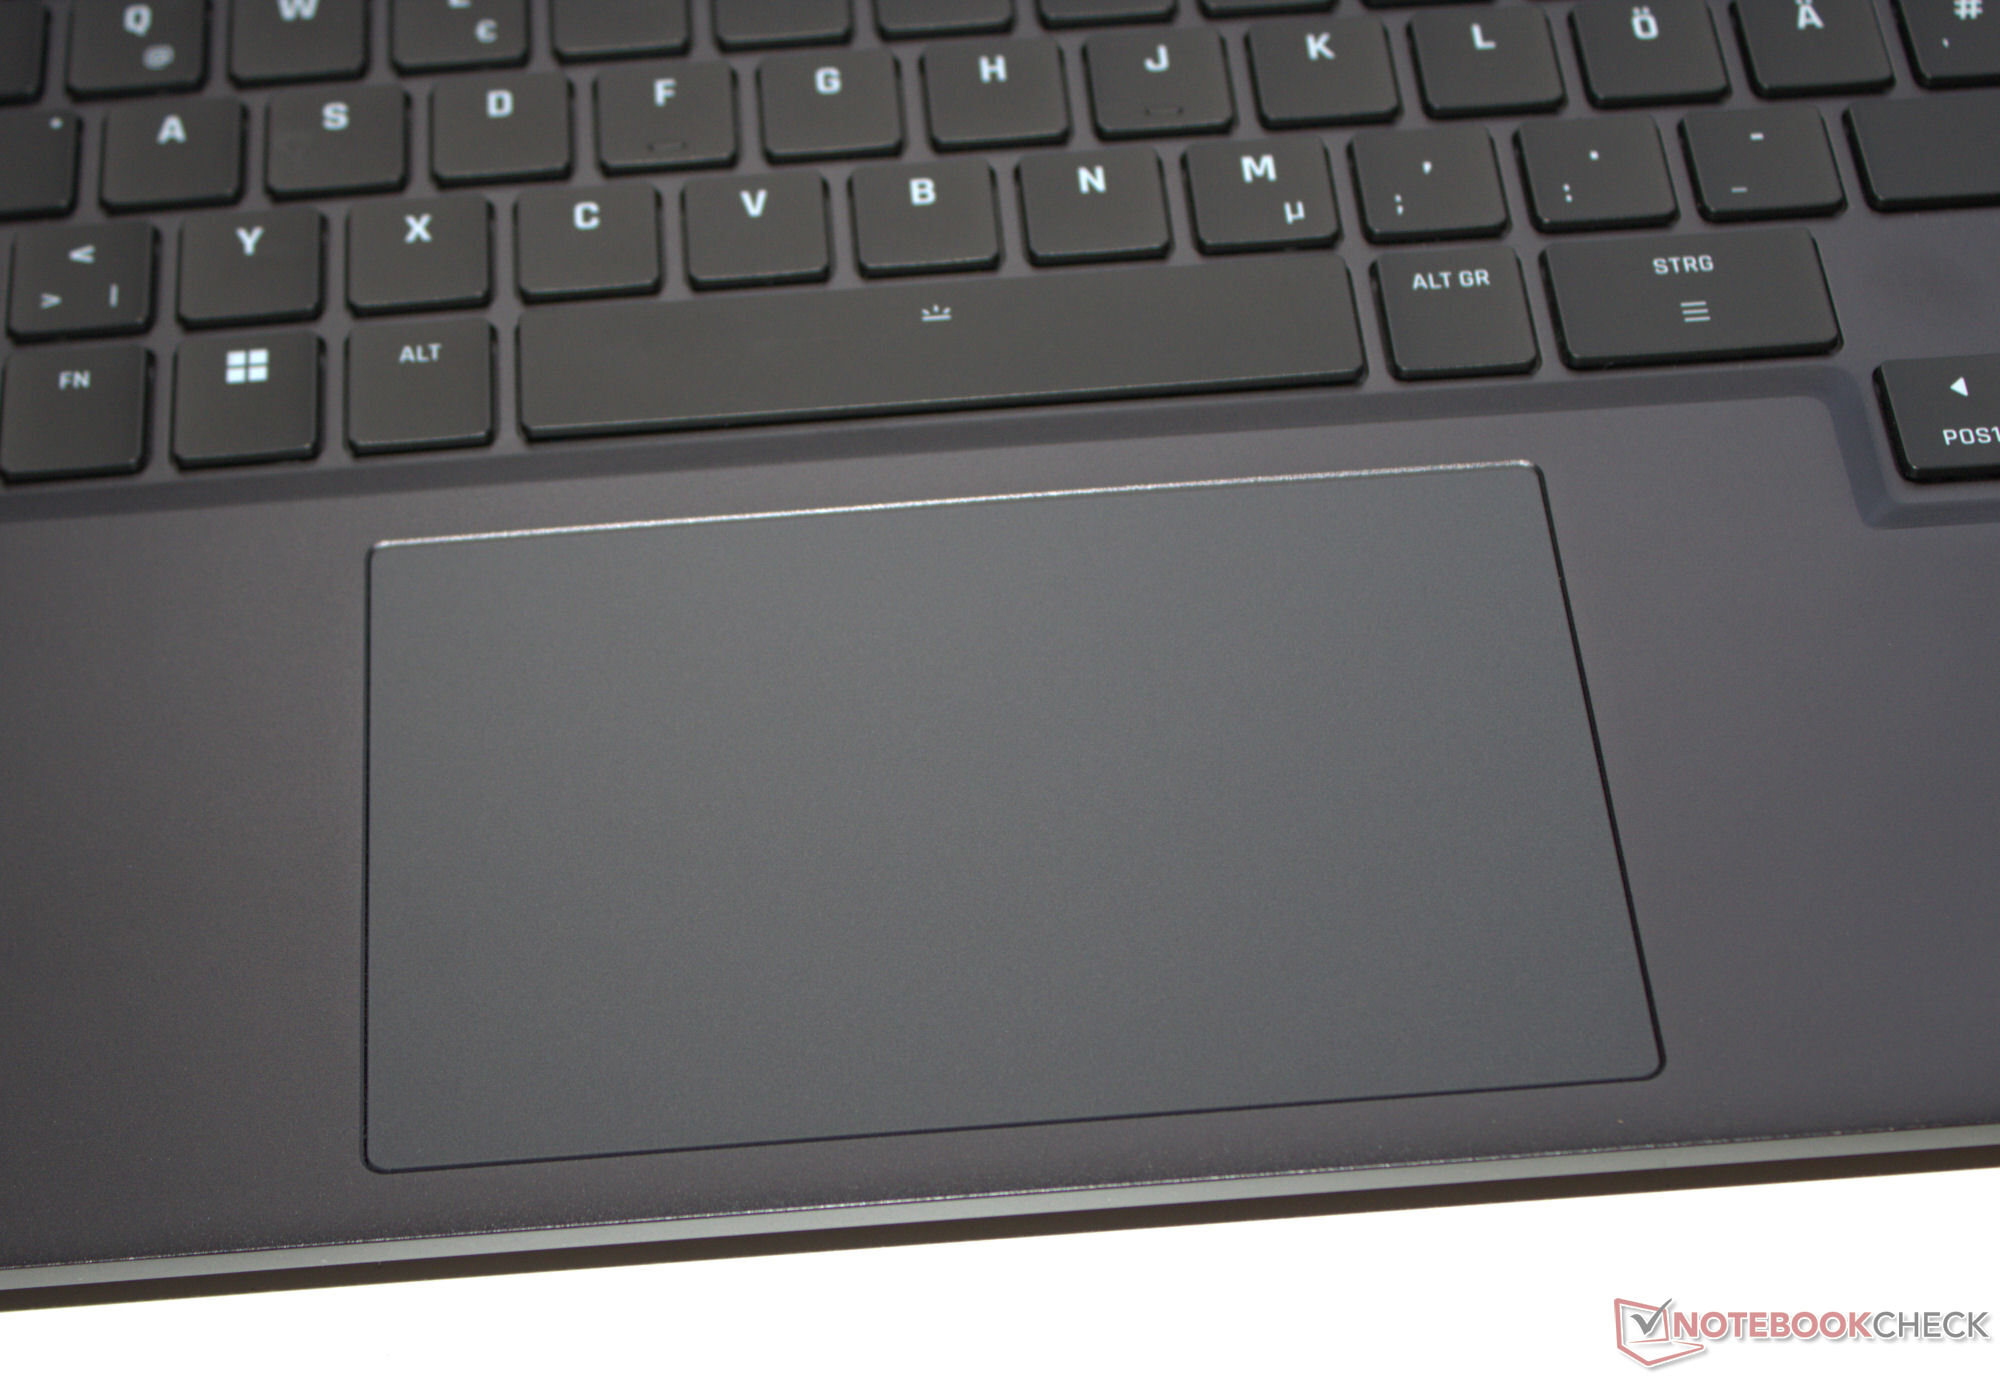
Touchpad
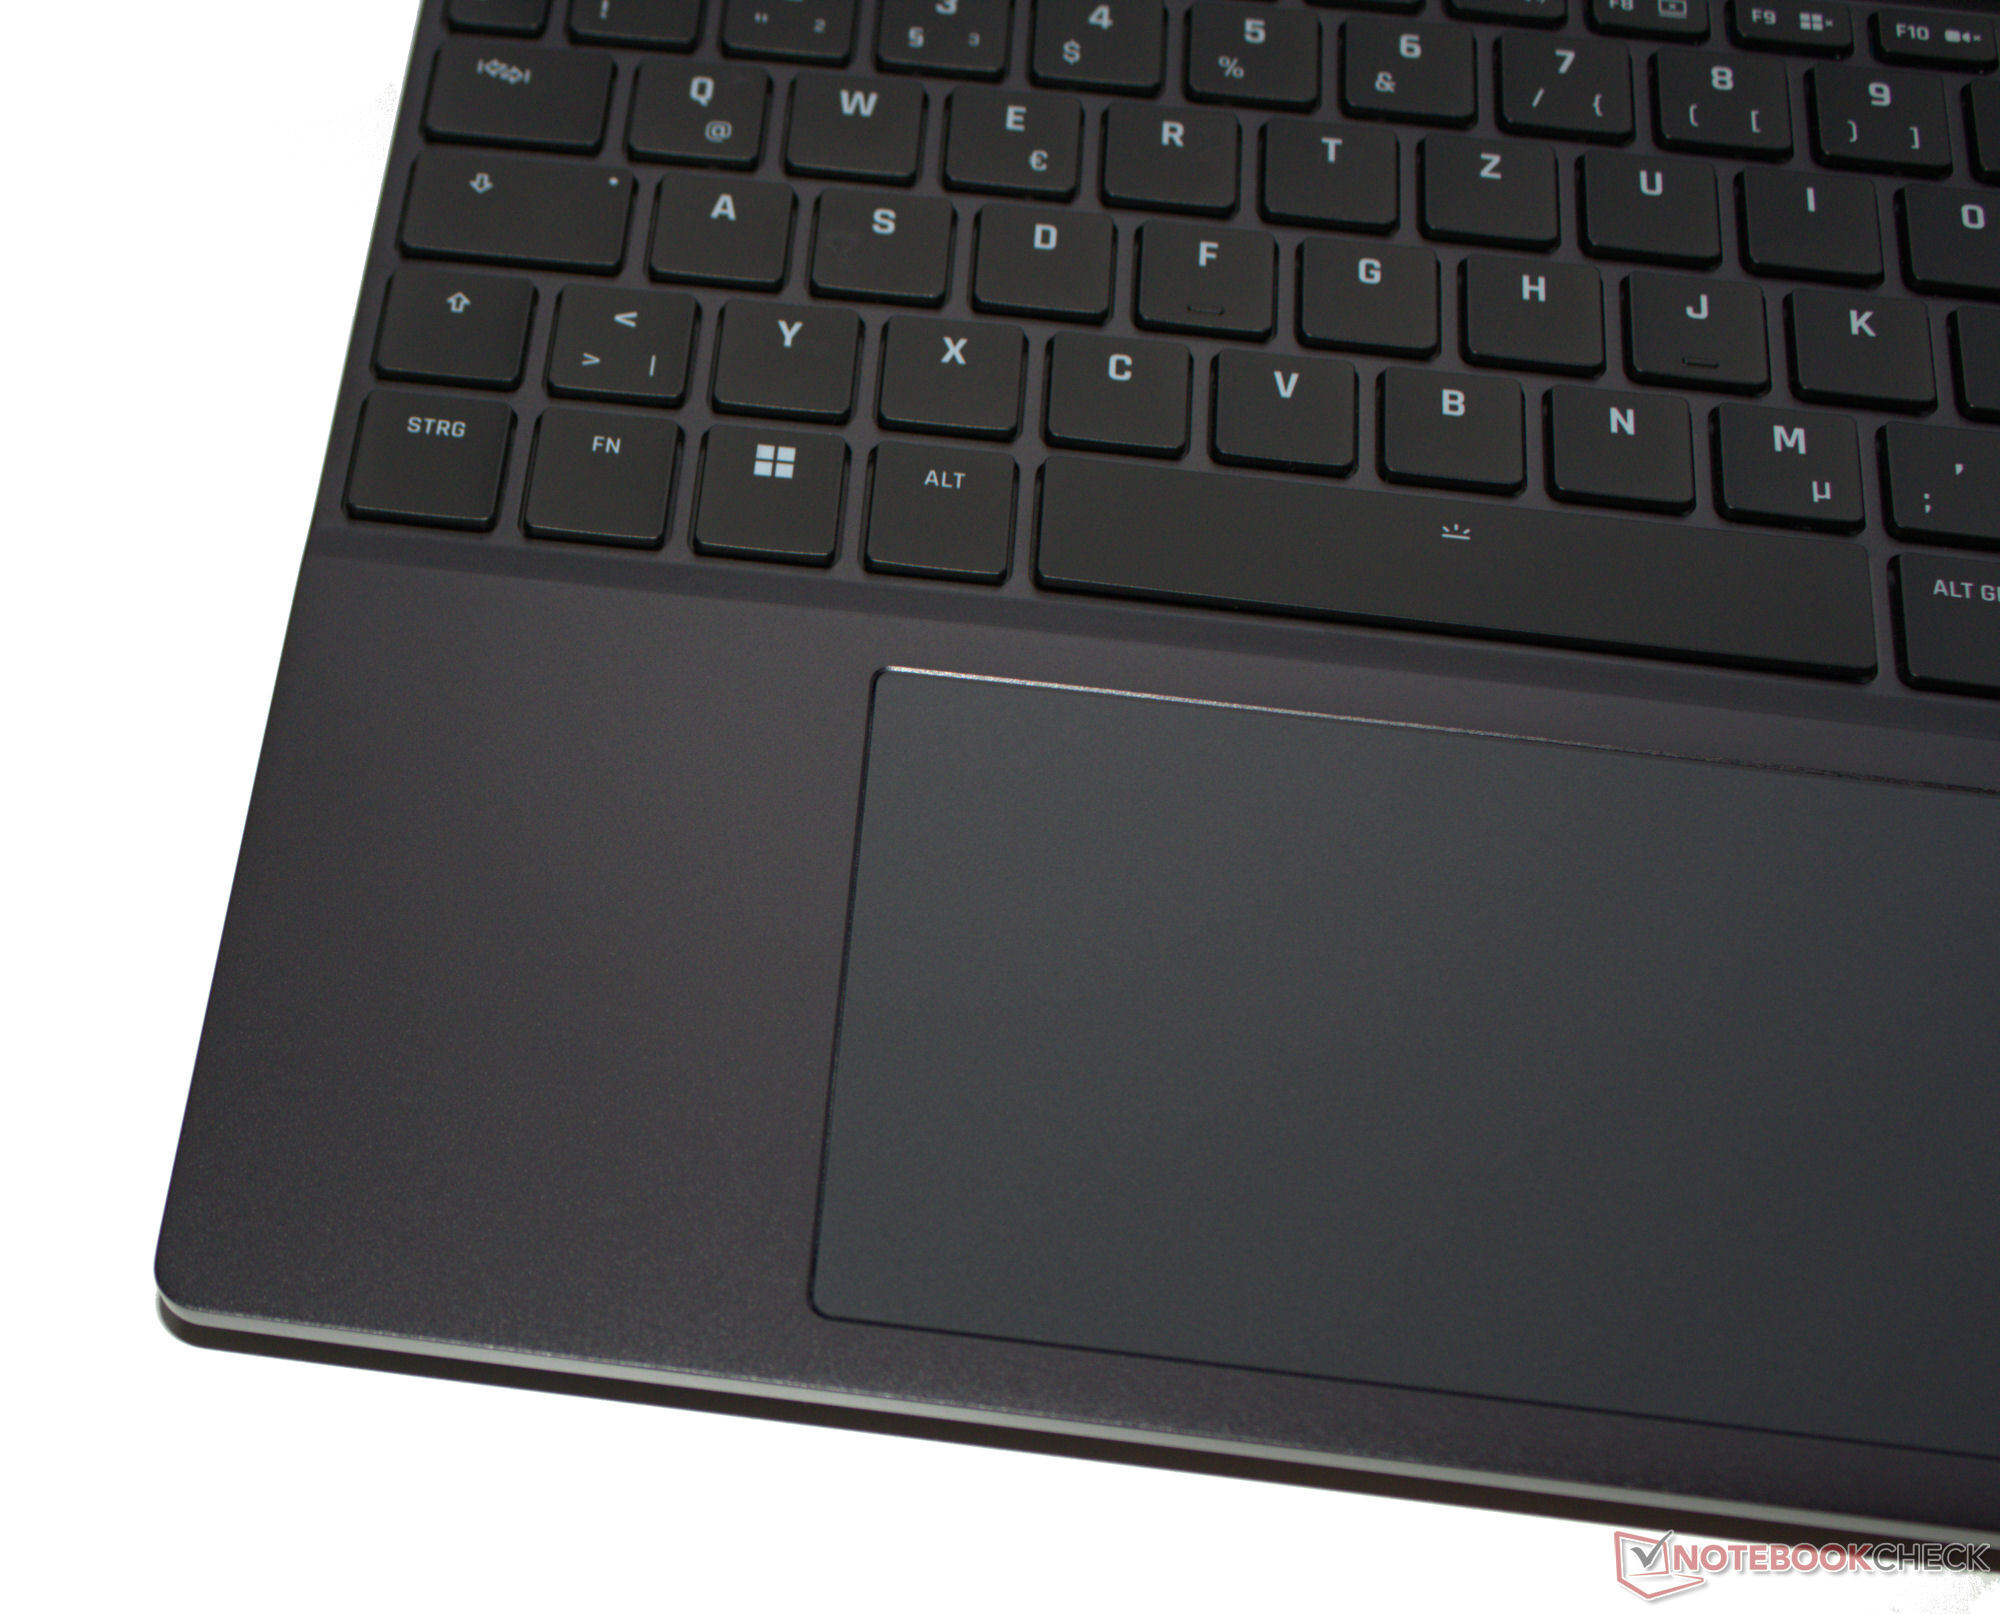
Um clickpad multitoque (aprox. 12,3 x 7,8 cm) substitui a necessidade de um mouse e sua superfície lisa facilita o deslizamento dos dedos. Ele apresenta uma elevação curta e um ponto de pressão claro.
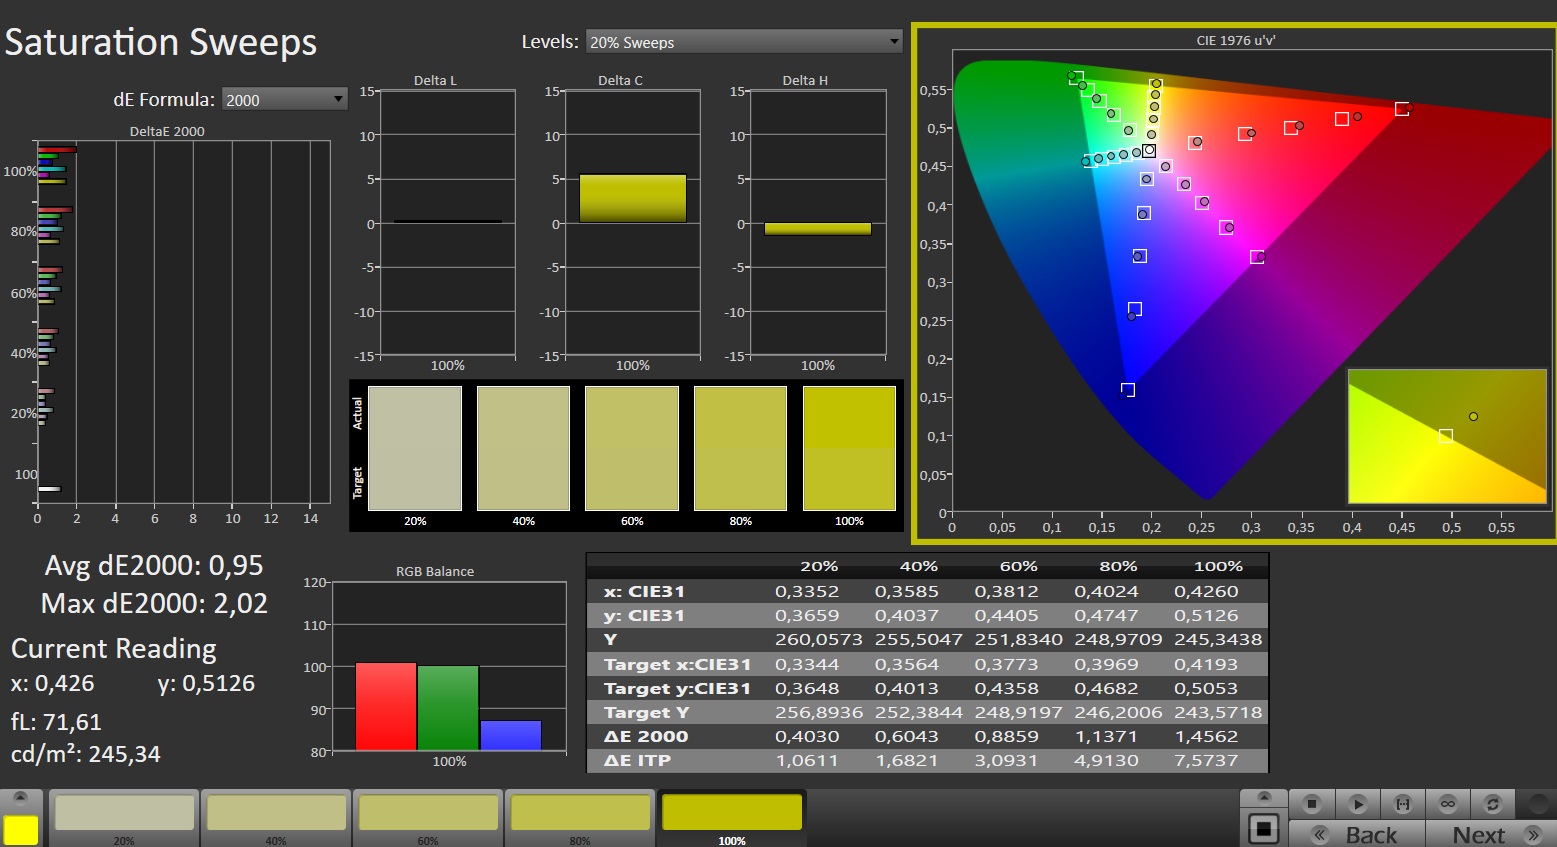
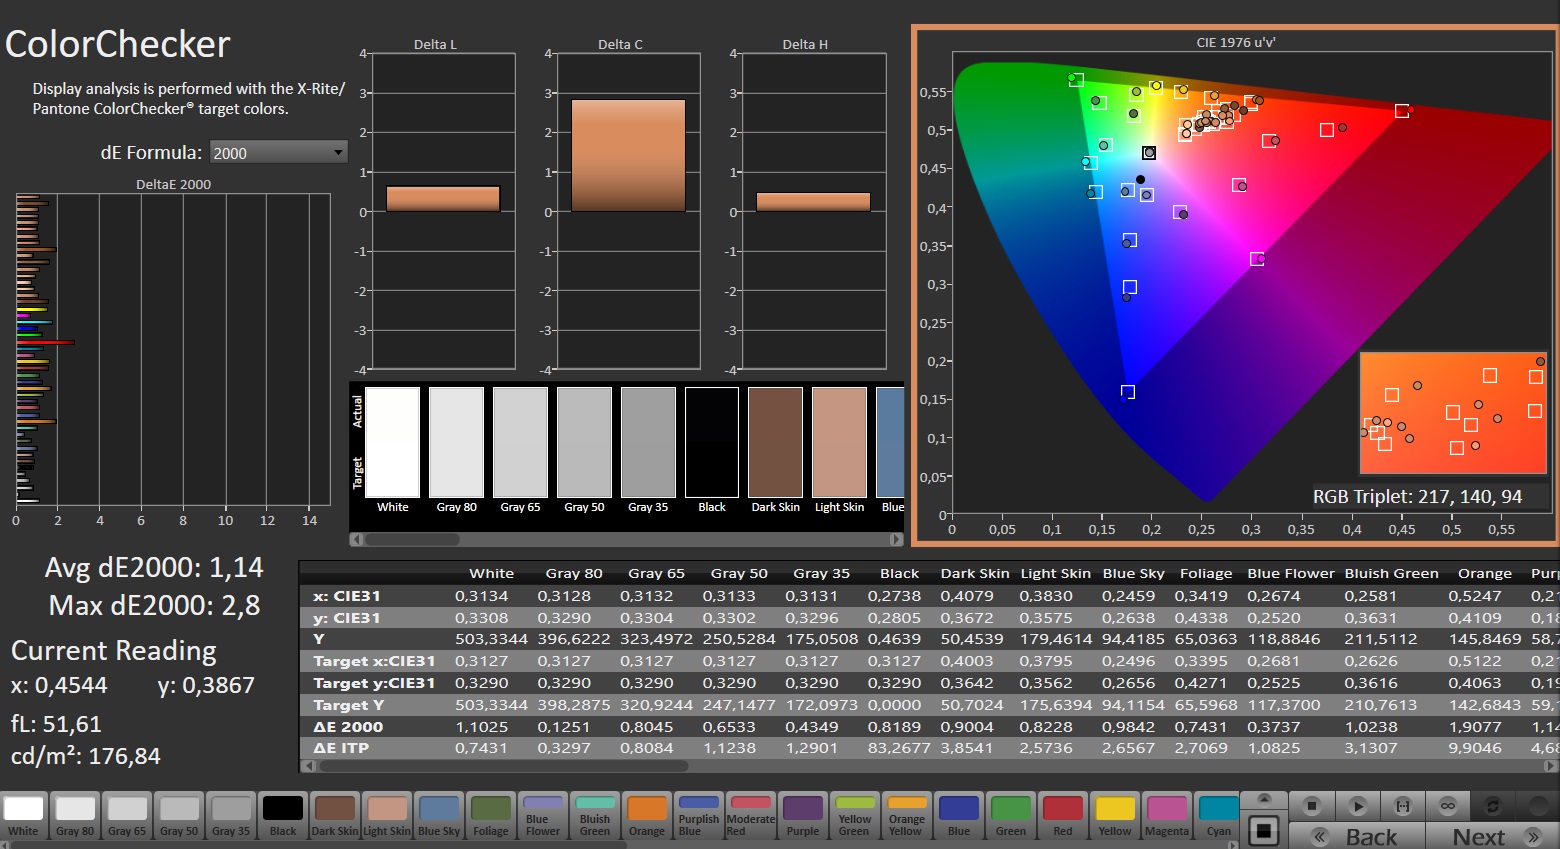
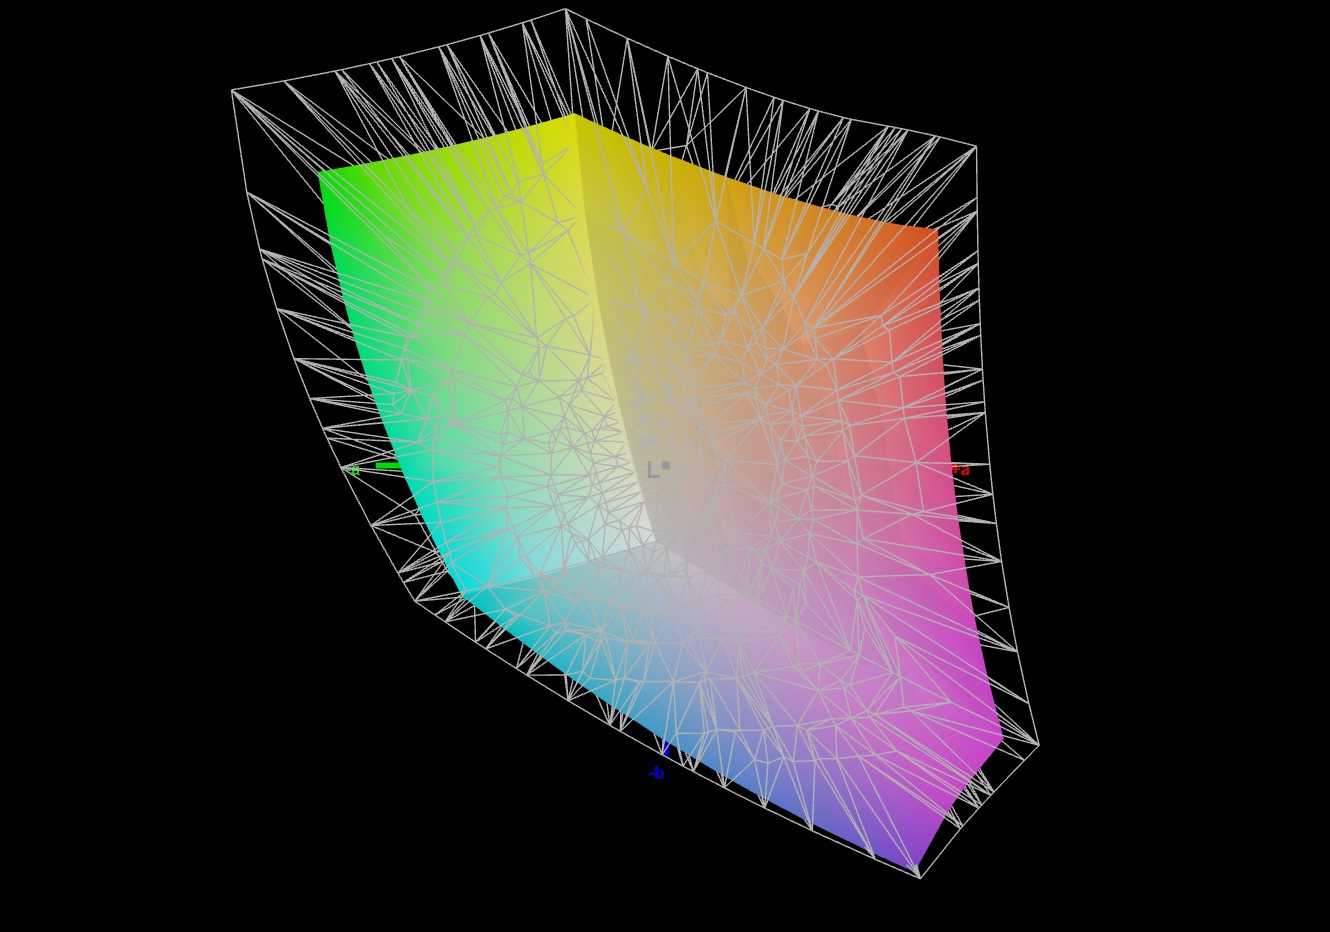
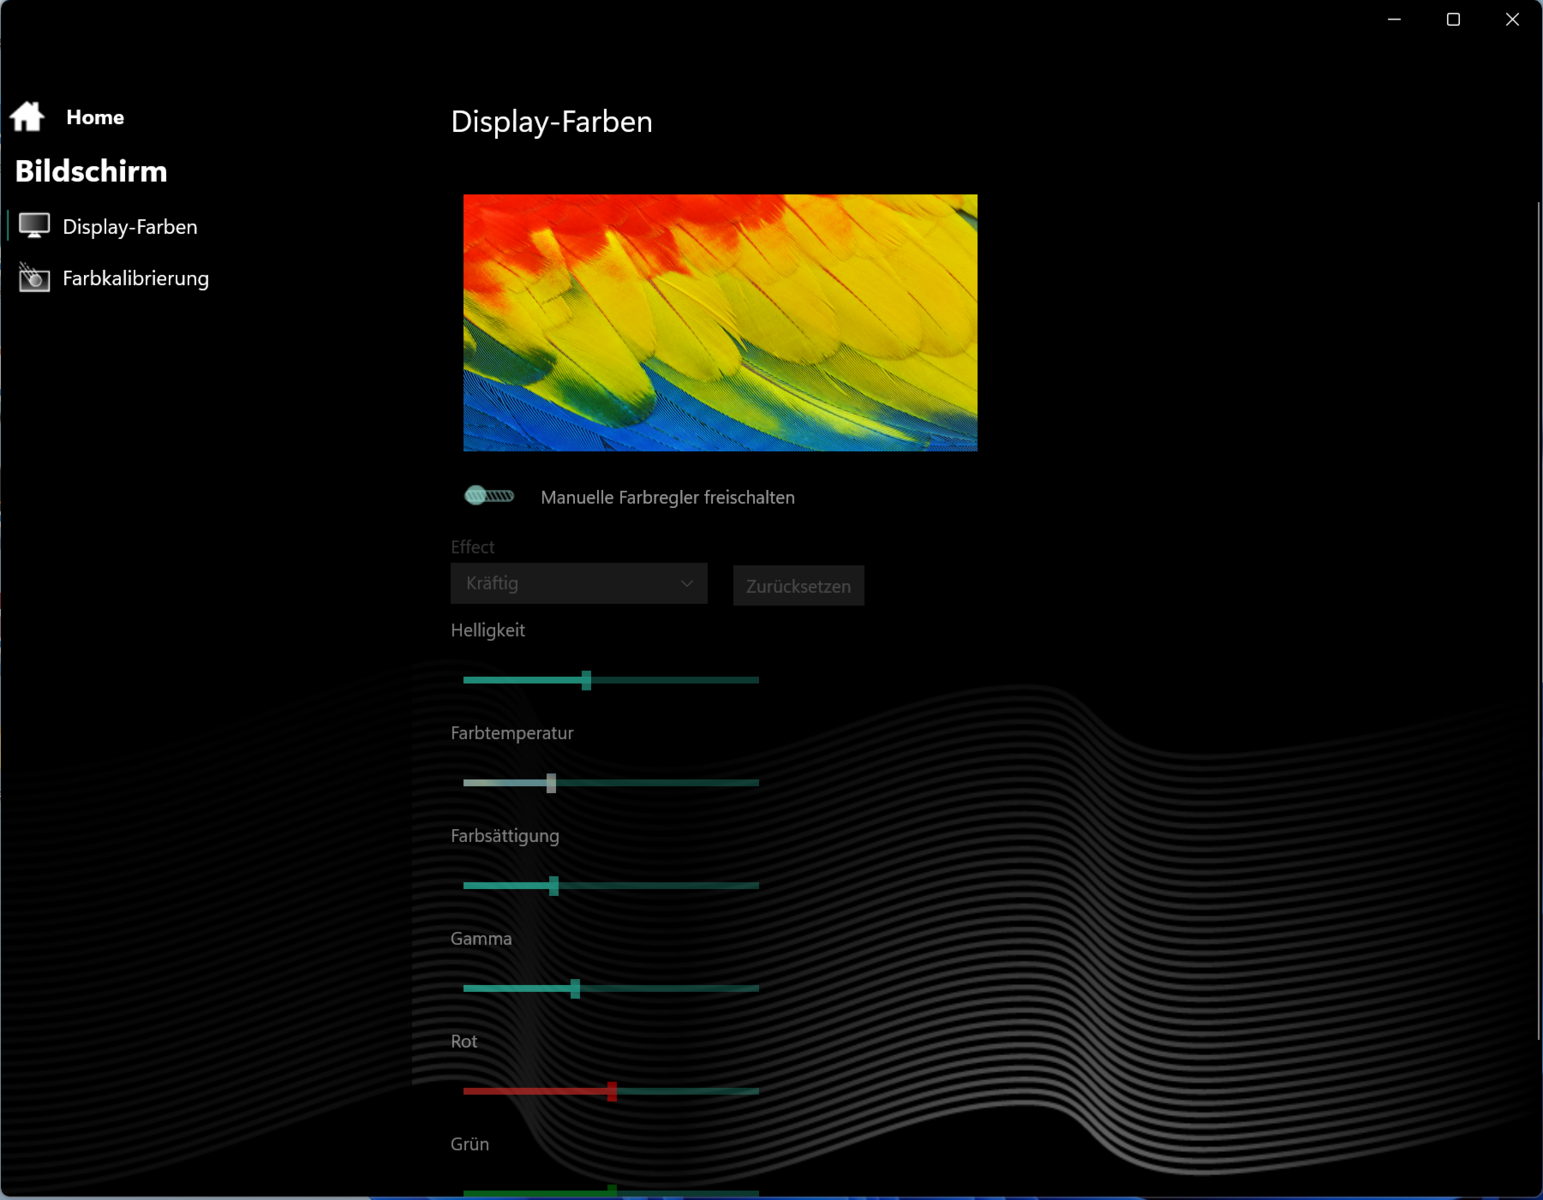
Tela - Painel brilhante com cobertura sRGB
A Schenker equipou o Fusion com uma tela de 15,3 polegadas (2.560 x 1.600 pixels) com uma proporção de 16:10. O painel fosco de 240 Hz apresenta Adaptive Sync, sem cintilação de PWM, tempos de resposta curtos e excelente brilho. Não há telas alternativas disponíveis.

| |||||||||||||||||||||||||
iluminação: 89 %
iluminação com acumulador: 491 cd/m²
Contraste: 1045:1 (Preto: 0.47 cd/m²)
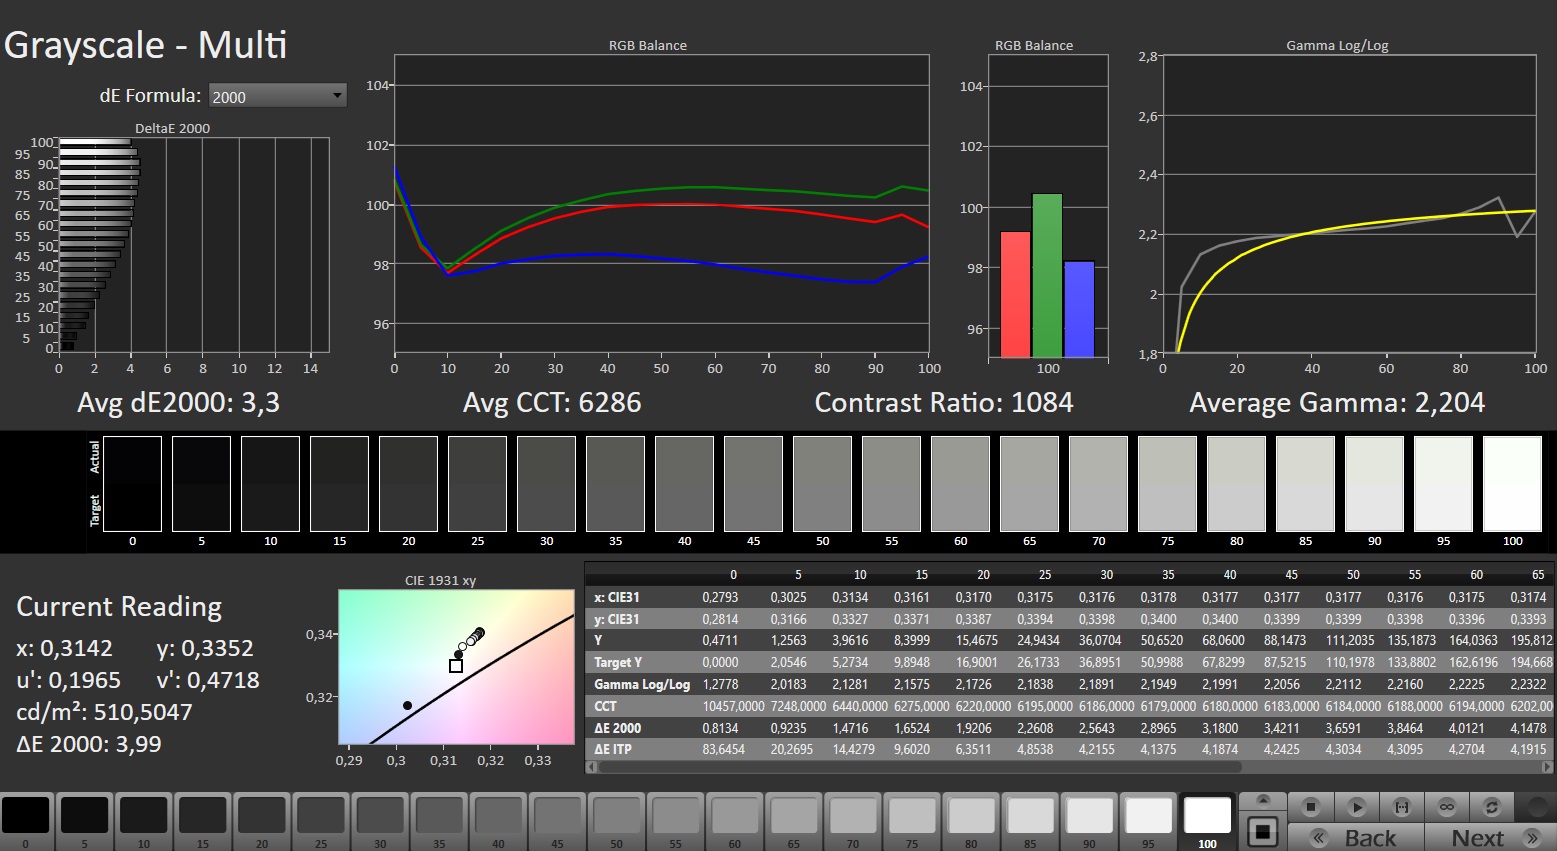
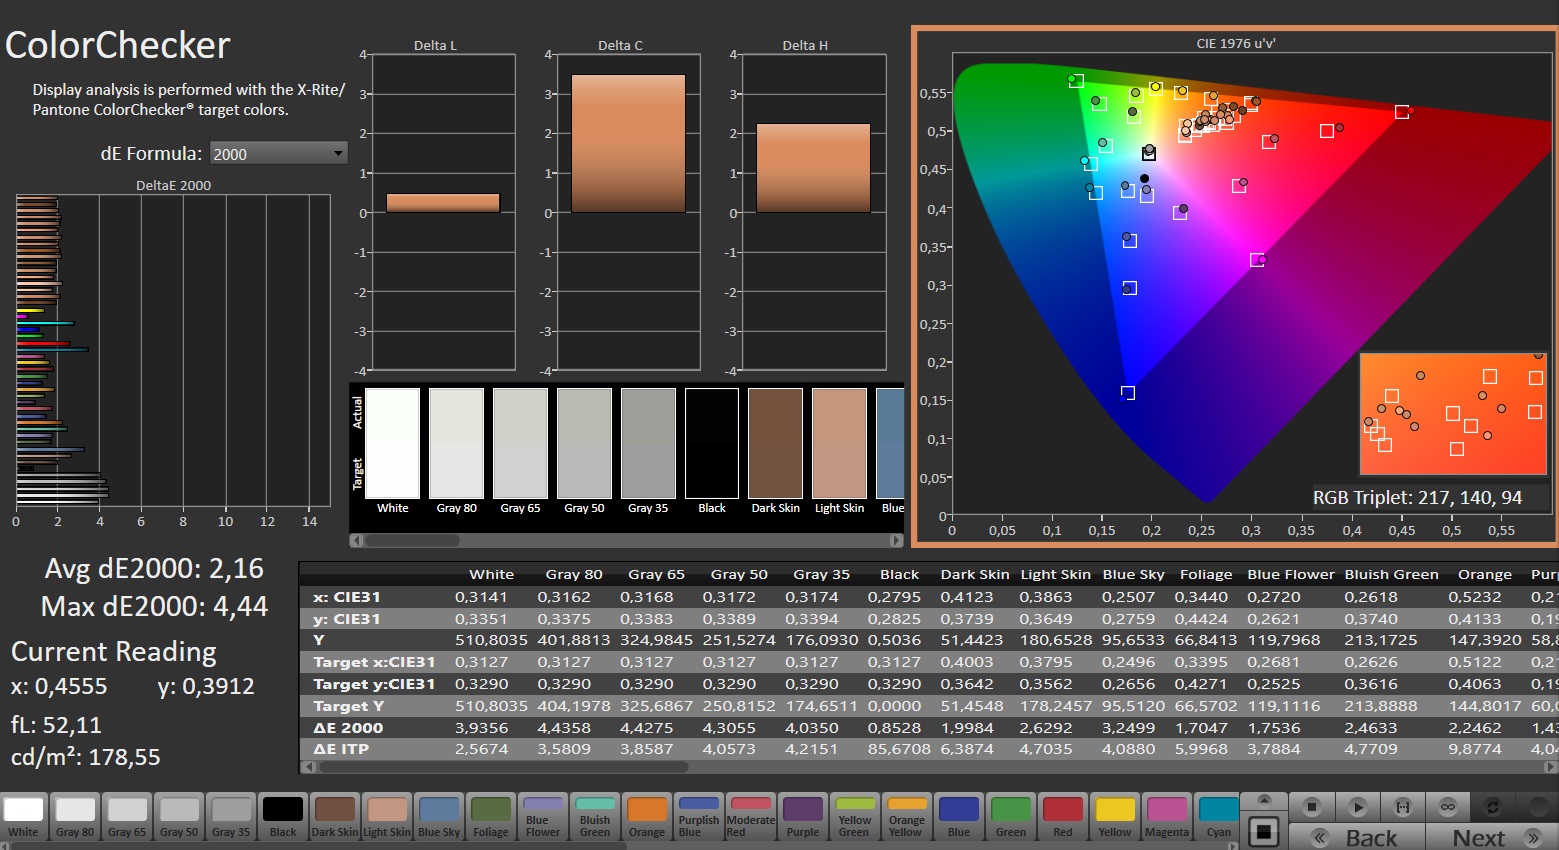
ΔE ColorChecker Calman: 2.16 | ∀{0.5-29.43 Ø4.71}
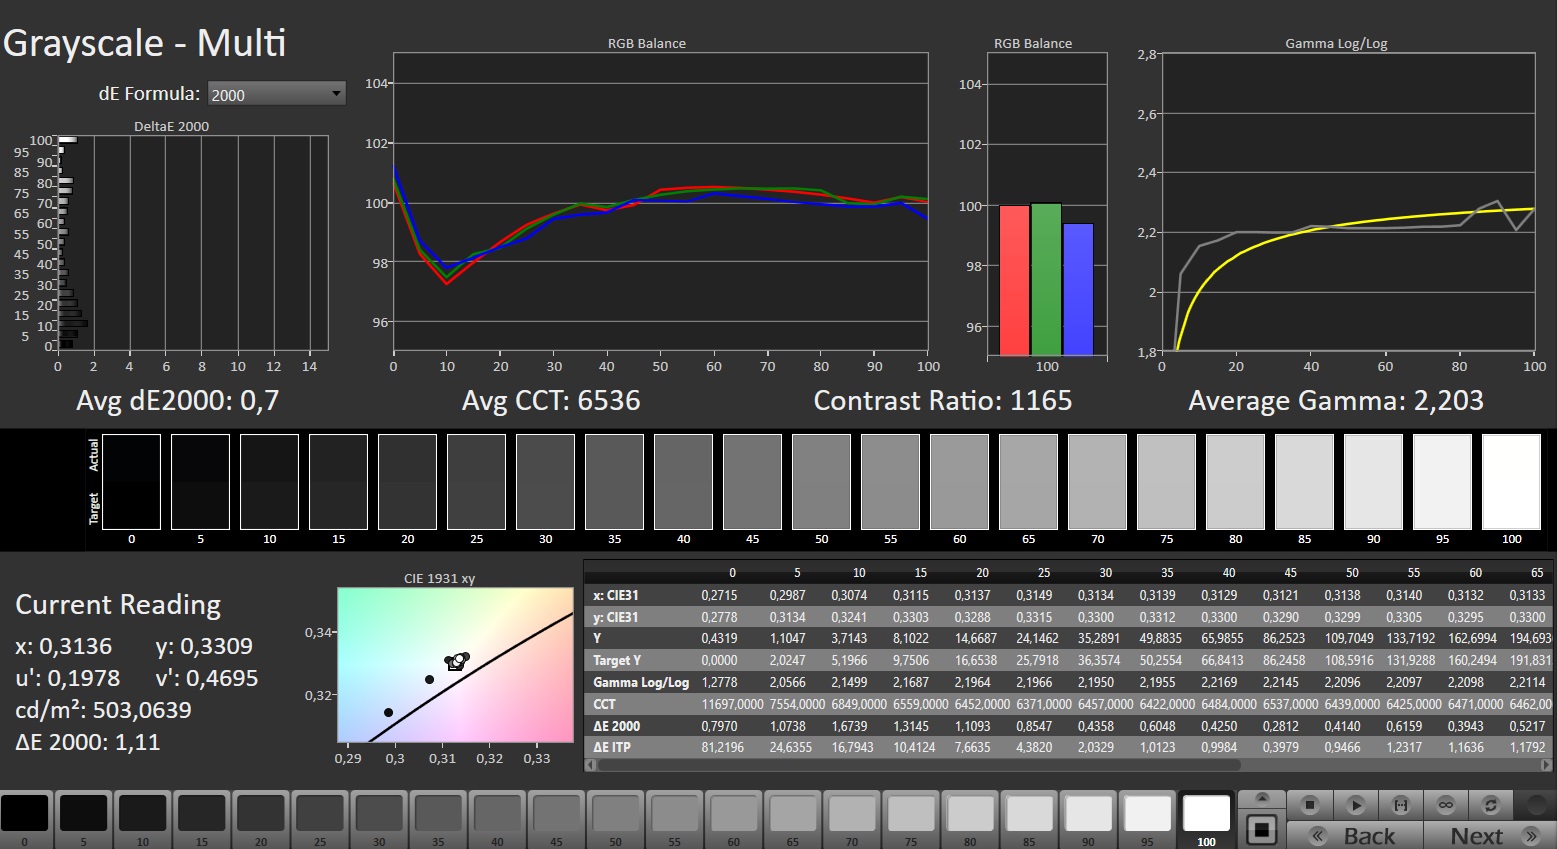
calibrated: 1.14
ΔE Greyscale Calman: 3.3 | ∀{0.09-98 Ø4.96}
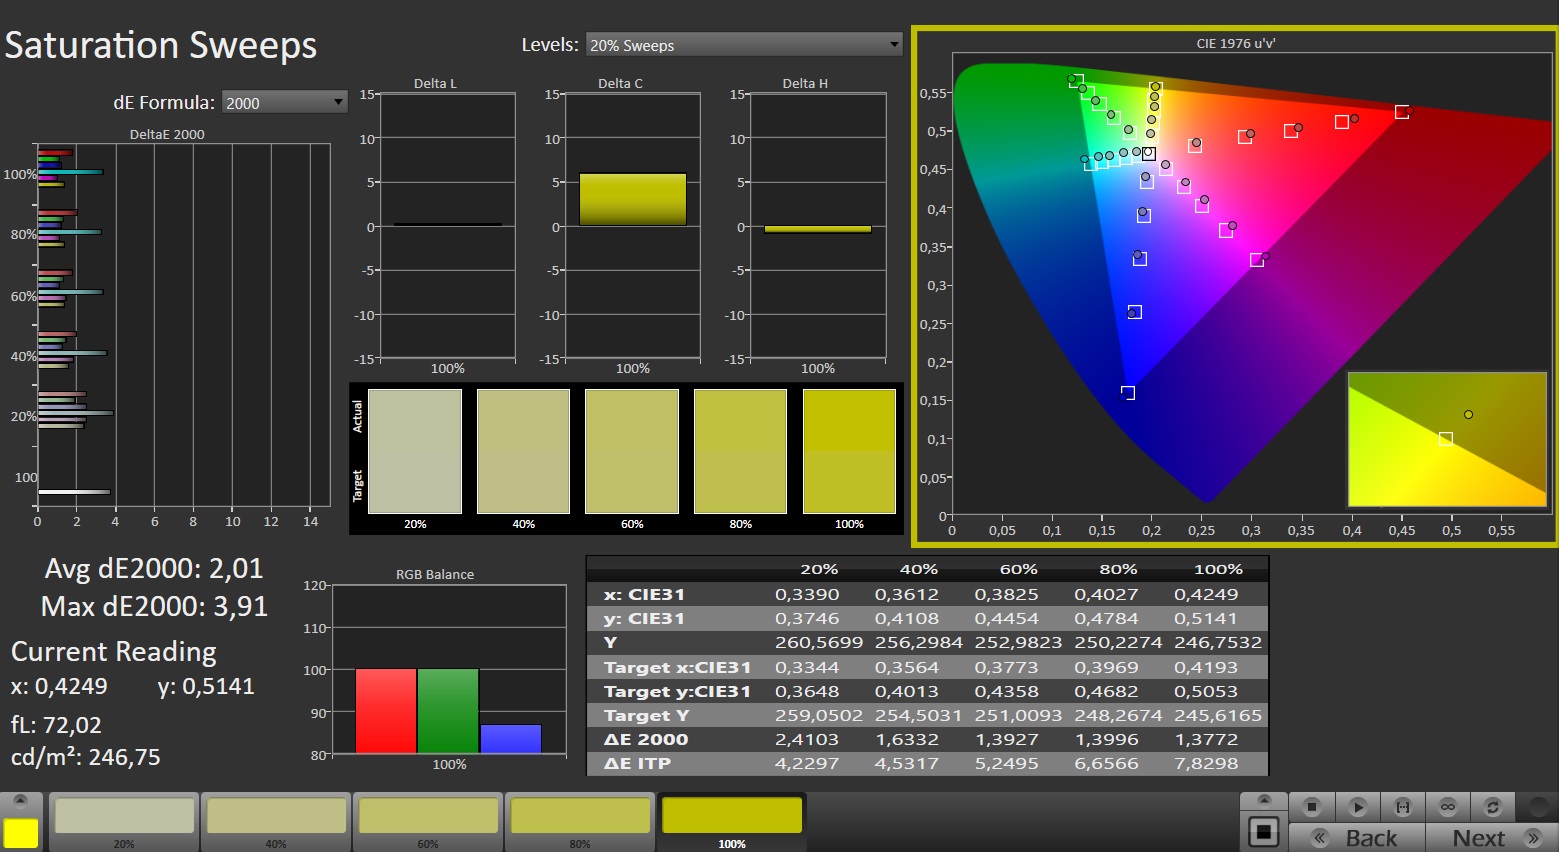
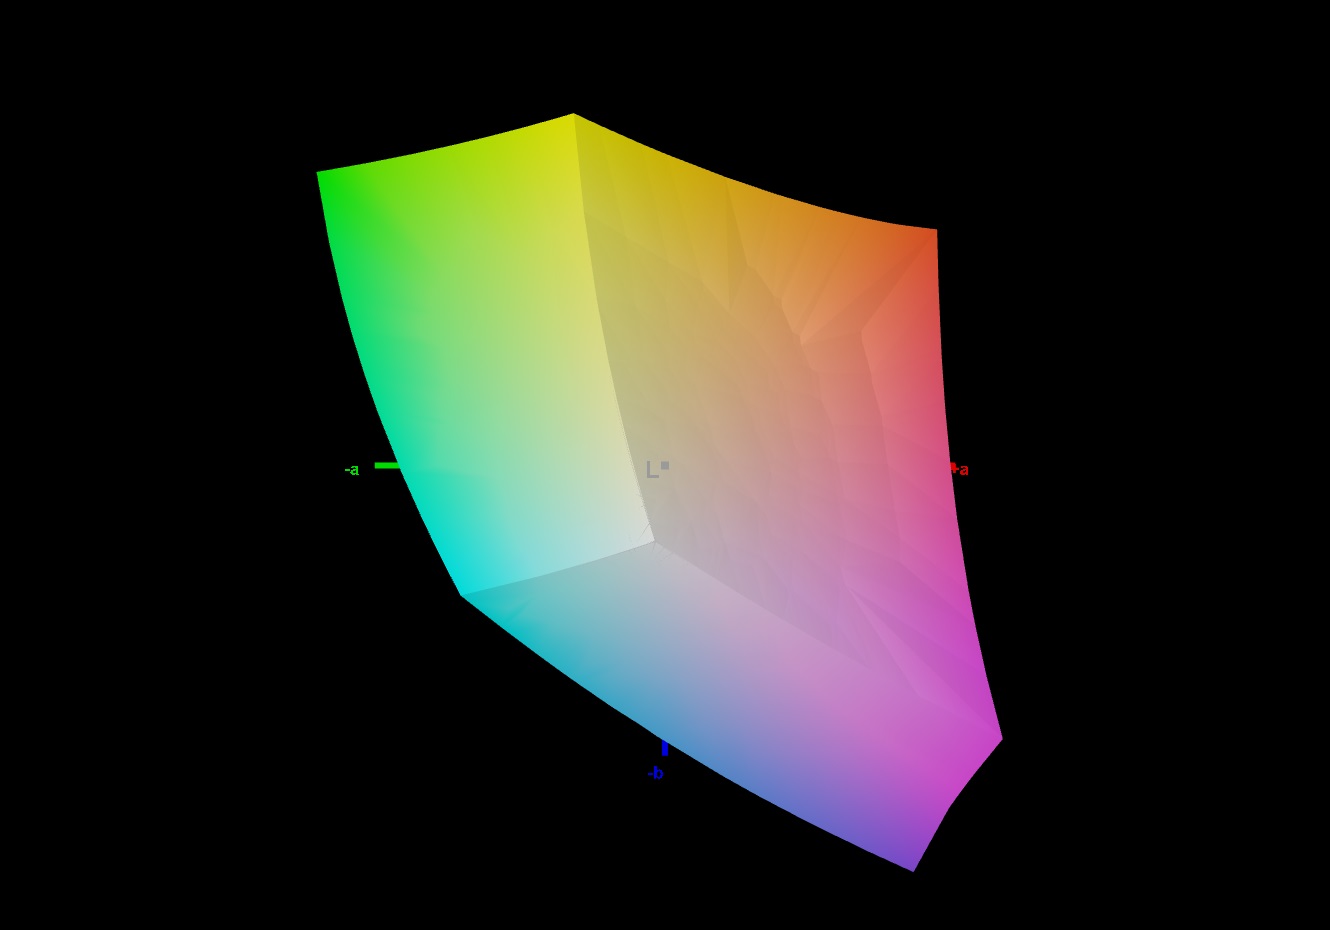
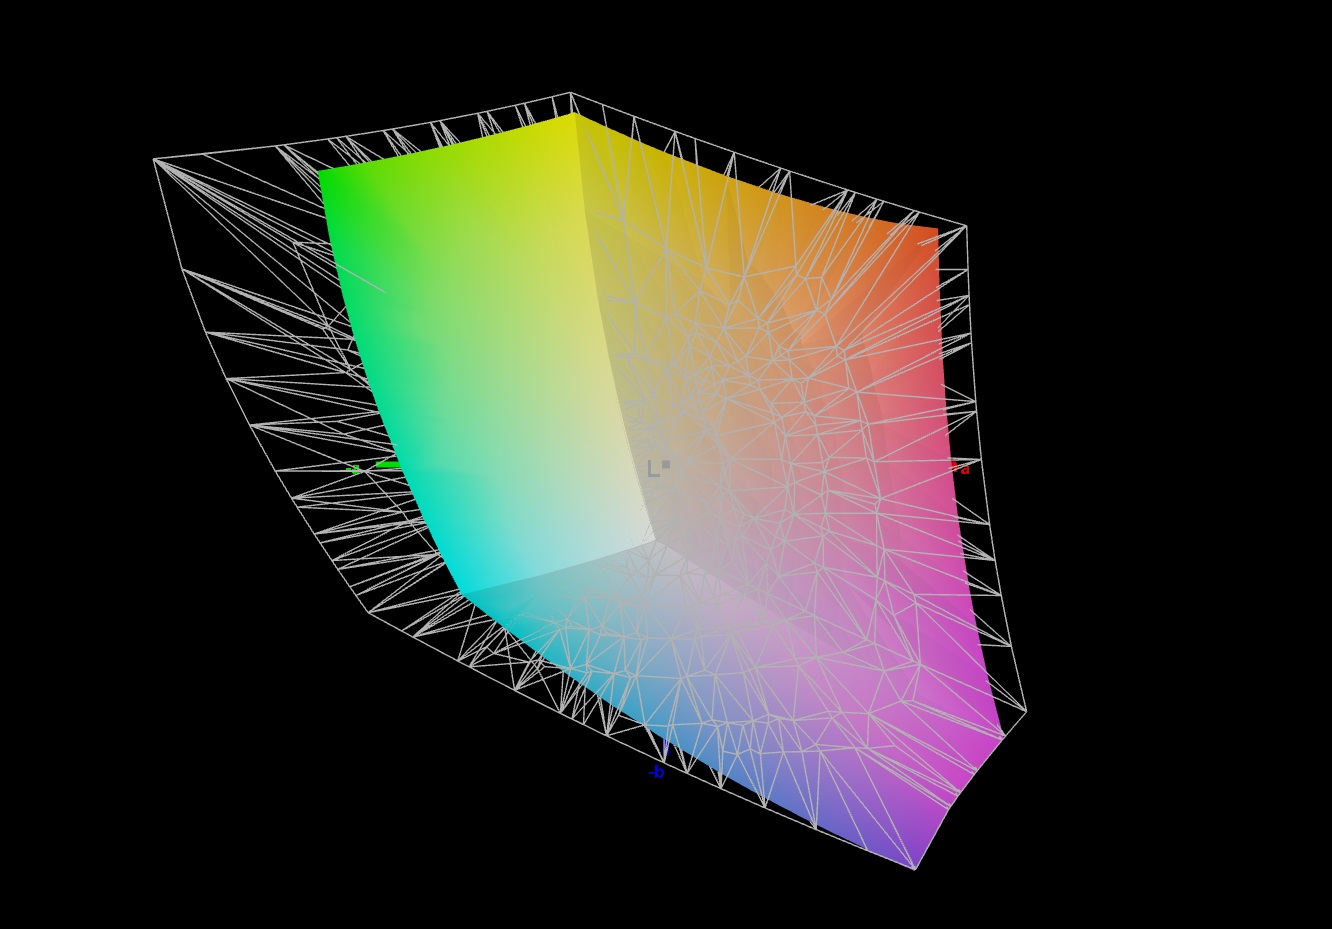
75% AdobeRGB 1998 (Argyll 3D)
100% sRGB (Argyll 3D)
73.5% Display P3 (Argyll 3D)
Gamma: 2.204
CCT: 6286 K
| Schenker XMG Fusion 15 (Early 24) BOE NJ NE153QDM-NZ1, IPS, 2560x1600, 15.3" | Aorus 16X 2024 BOE CQ NE160QDM-NY1, IPS, 2560x1600, 16" | Alienware m16 R2 BOE NE16NYH, IPS, 2560x1600, 16" | HP Omen Transcend 16-u1095ng ATNA60DL02-0 (SDC41A4), OLED, 2560x1600, 16" | Lenovo Legion Pro 5 16IRX9 BOE NE160QDM-NYC, IPS, 2560x1600, 16" | |
|---|---|---|---|---|---|
| Display | -7% | -3% | 22% | -5% | |
| Display P3 Coverage (%) | 73.5 | 67.2 -9% | 71 -3% | 99.8 36% | 69.3 -6% |
| sRGB Coverage (%) | 100 | 96.7 -3% | 100 0% | 100 0% | 99.4 -1% |
| AdobeRGB 1998 Coverage (%) | 75 | 69.3 -8% | 71.4 -5% | 97 29% | 70.1 -7% |
| Response Times | -27% | -41% | 96% | -105% | |
| Response Time Grey 50% / Grey 80% * (ms) | 5 ? | 7.5 ? -50% | 5.7 ? -14% | 0.2 ? 96% | 11.9 ? -138% |
| Response Time Black / White * (ms) | 5.2 ? | 5.4 ? -4% | 8.7 ? -67% | 0.2 ? 96% | 8.9 ? -71% |
| PWM Frequency (Hz) | 120 ? | ||||
| Screen | -1% | 11% | 182% | 17% | |
| Brightness middle (cd/m²) | 491 | 542 10% | 345.8 -30% | 390 -21% | 384 -22% |
| Brightness (cd/m²) | 460 | 504 10% | 337 -27% | 392 -15% | 366 -20% |
| Brightness Distribution (%) | 89 | 86 -3% | 87 -2% | 98 10% | 91 2% |
| Black Level * (cd/m²) | 0.47 | 0.45 4% | 0.3 36% | 0.02 96% | 0.35 26% |
| Contrast (:1) | 1045 | 1204 15% | 1153 10% | 19500 1766% | 1097 5% |
| Colorchecker dE 2000 * | 2.16 | 2.73 -26% | 1.99 8% | 1.94 10% | 0.97 55% |
| Colorchecker dE 2000 max. * | 4.44 | 5.29 -19% | 3.52 21% | 4.26 4% | 3.57 20% |
| Colorchecker dE 2000 calibrated * | 1.14 | 1.32 -16% | 0.62 46% | 4.21 -269% | 0.77 32% |
| Greyscale dE 2000 * | 3.3 | 2.9 12% | 2.1 36% | 1.5 55% | 1.5 55% |
| Gamma | 2.204 100% | 2.192 100% | 2.32 95% | 2.221 99% | 2.24 98% |
| CCT | 6286 103% | 6173 105% | 6369 102% | 6395 102% | 6709 97% |
| Média Total (Programa/Configurações) | -12% /
-6% | -11% /
1% | 100% /
135% | -31% /
-5% |
* ... menor é melhor
O monitor já mostrou uma boa representação de cores logo que saiu da caixa: Com um desvio de cerca de 2,2, o valor-alvo (DeltaE < 3) foi atingido. A calibração do monitor reduz seu desvio para 1,14 e resulta em tons de cinza mais equilibrados. O painel é capaz de cobrir completamente o espaço de cores sRGB, mas não os espaços de cores AdobeRGB ou DCI P3. Isso não é diferente na maioria das telas de seus concorrentes.
Exibir tempos de resposta
| ↔ Tempo de resposta preto para branco | ||
|---|---|---|
| 5.2 ms ... ascensão ↗ e queda ↘ combinadas | ↗ 1.5 ms ascensão | 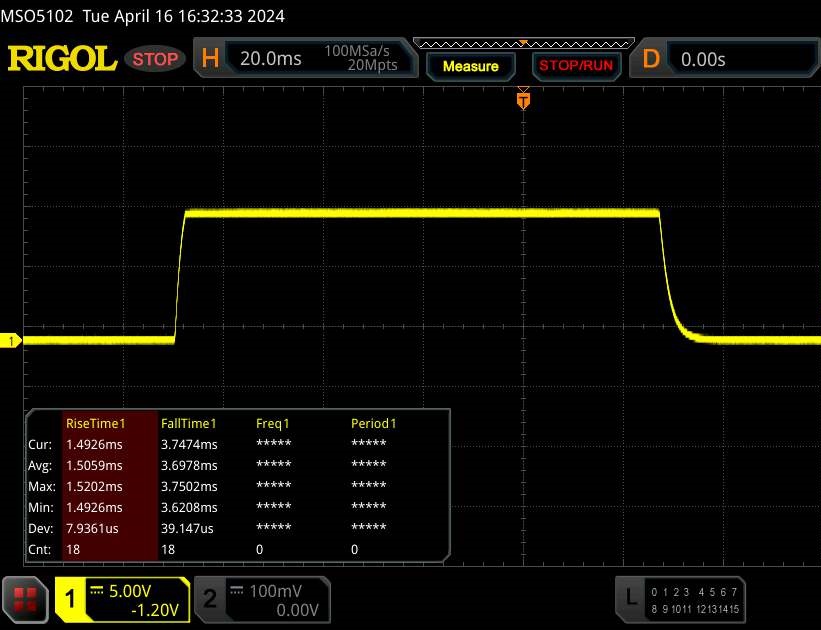 |
| ↘ 3.7 ms queda | ||
| A tela mostra taxas de resposta muito rápidas em nossos testes e deve ser muito adequada para jogos em ritmo acelerado. Em comparação, todos os dispositivos testados variam de 0.1 (mínimo) a 240 (máximo) ms. » 18 % de todos os dispositivos são melhores. Isso significa que o tempo de resposta medido é melhor que a média de todos os dispositivos testados (19.8 ms). | ||
| ↔ Tempo de resposta 50% cinza a 80% cinza | ||
| 5 ms ... ascensão ↗ e queda ↘ combinadas | ↗ 2.3 ms ascensão | 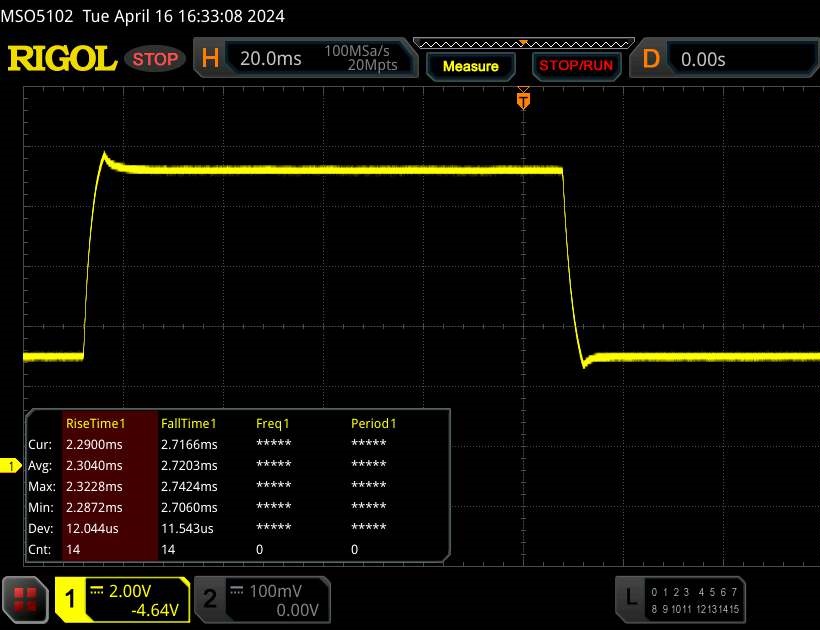 |
| ↘ 2.7 ms queda | ||
| A tela mostra taxas de resposta muito rápidas em nossos testes e deve ser muito adequada para jogos em ritmo acelerado. Em comparação, todos os dispositivos testados variam de 0.165 (mínimo) a 636 (máximo) ms. » 17 % de todos os dispositivos são melhores. Isso significa que o tempo de resposta medido é melhor que a média de todos os dispositivos testados (31 ms). | ||
Cintilação da tela / PWM (modulação por largura de pulso)
| Tela tremeluzindo / PWM não detectado | 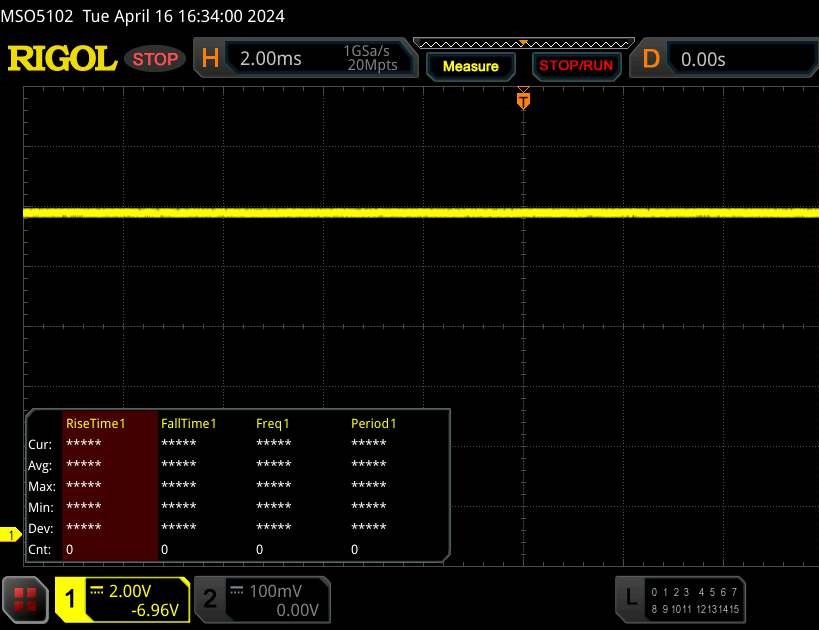 | ||
[pwm_comparison] Em comparação: 52 % de todos os dispositivos testados não usam PWM para escurecer a tela. Se PWM foi detectado, uma média de 7757 (mínimo: 5 - máximo: 343500) Hz foi medida. | |||
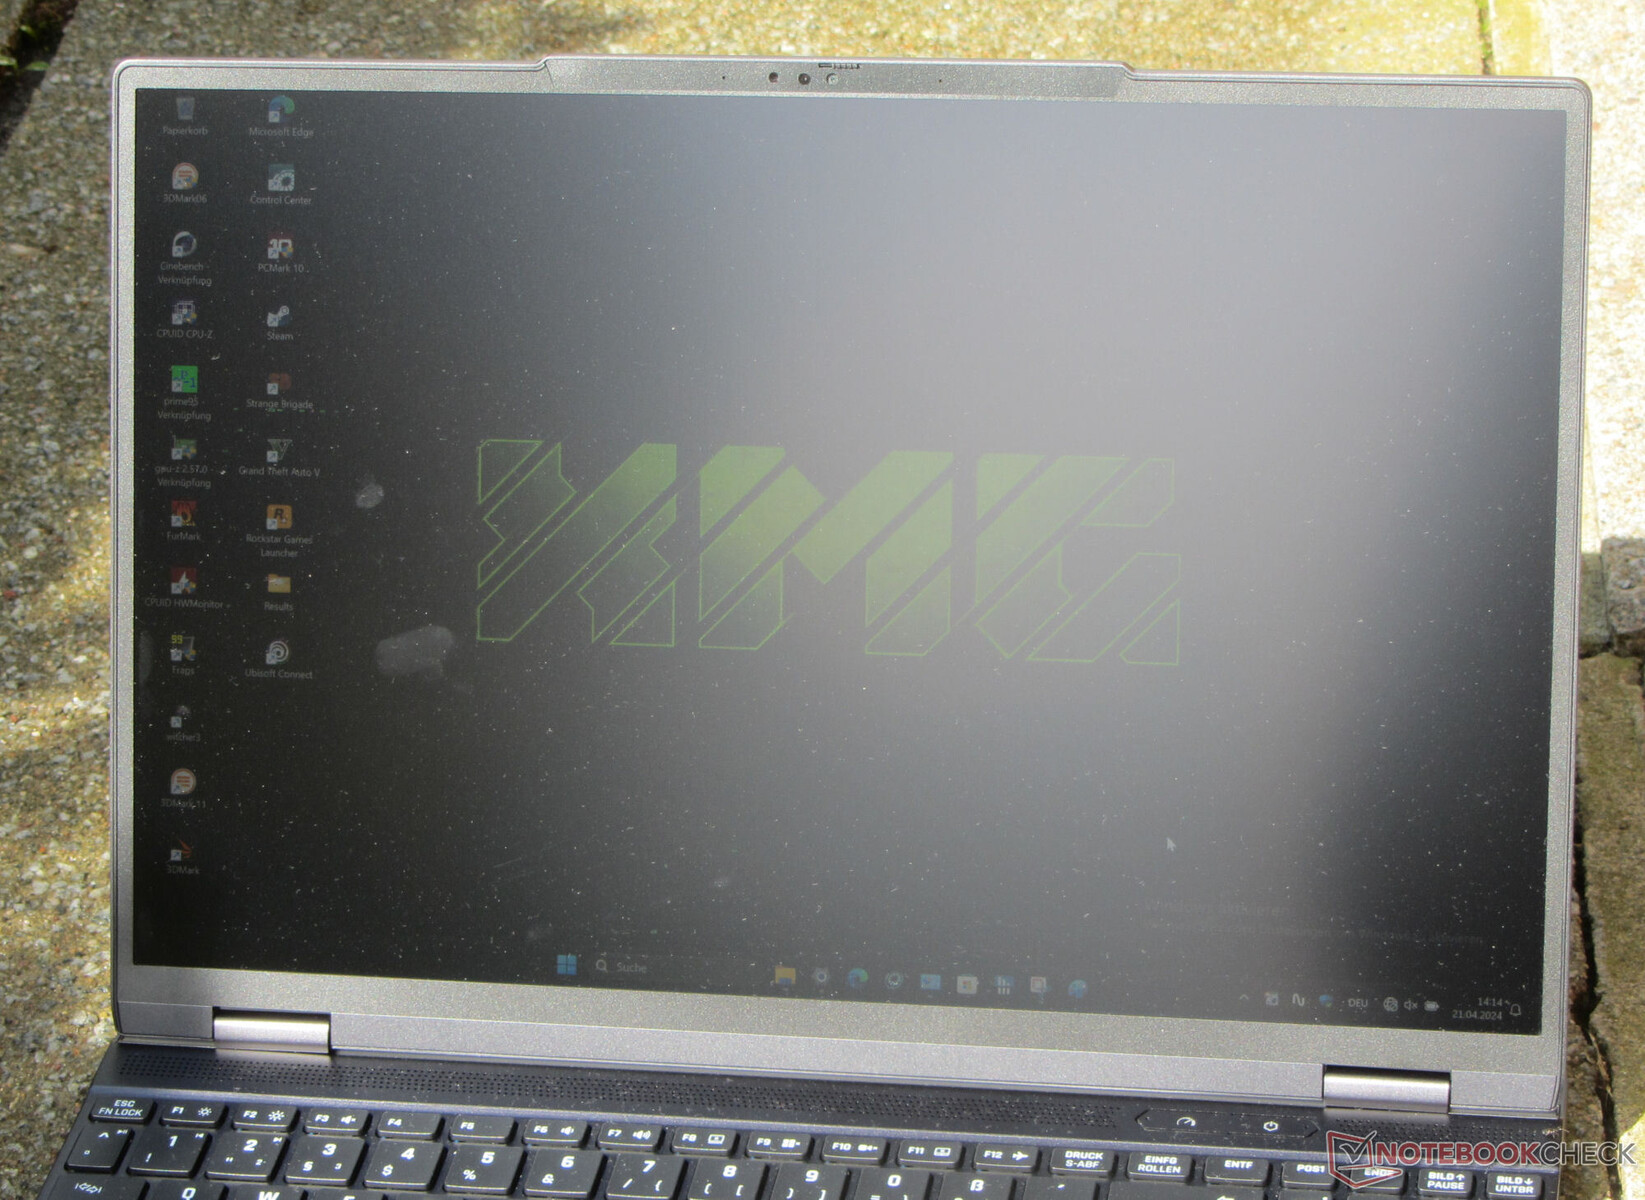
O painel IPS estável com ângulo de visão do dispositivo permanece legível de todos os ângulos. Ao ar livre, o senhor pode ler na tela, desde que o sol não esteja brilhando muito forte.

Desempenho - Raptor Lake e Ada Lovelace alimentam o laptop
O poderoso e compacto XMG Fusion 15 (Early 24) é voltado para gamers e criadores. Raptor Lake e Ada Lovelace proporcionam o desempenho necessário. O laptop pode ser configurado individualmente na loja on-line Schenker. A variante atual custa cerca de US$ 2.500. Os modelos mais baratos custam a partir de aproximadamente US$ 1.700.
Condições de teste
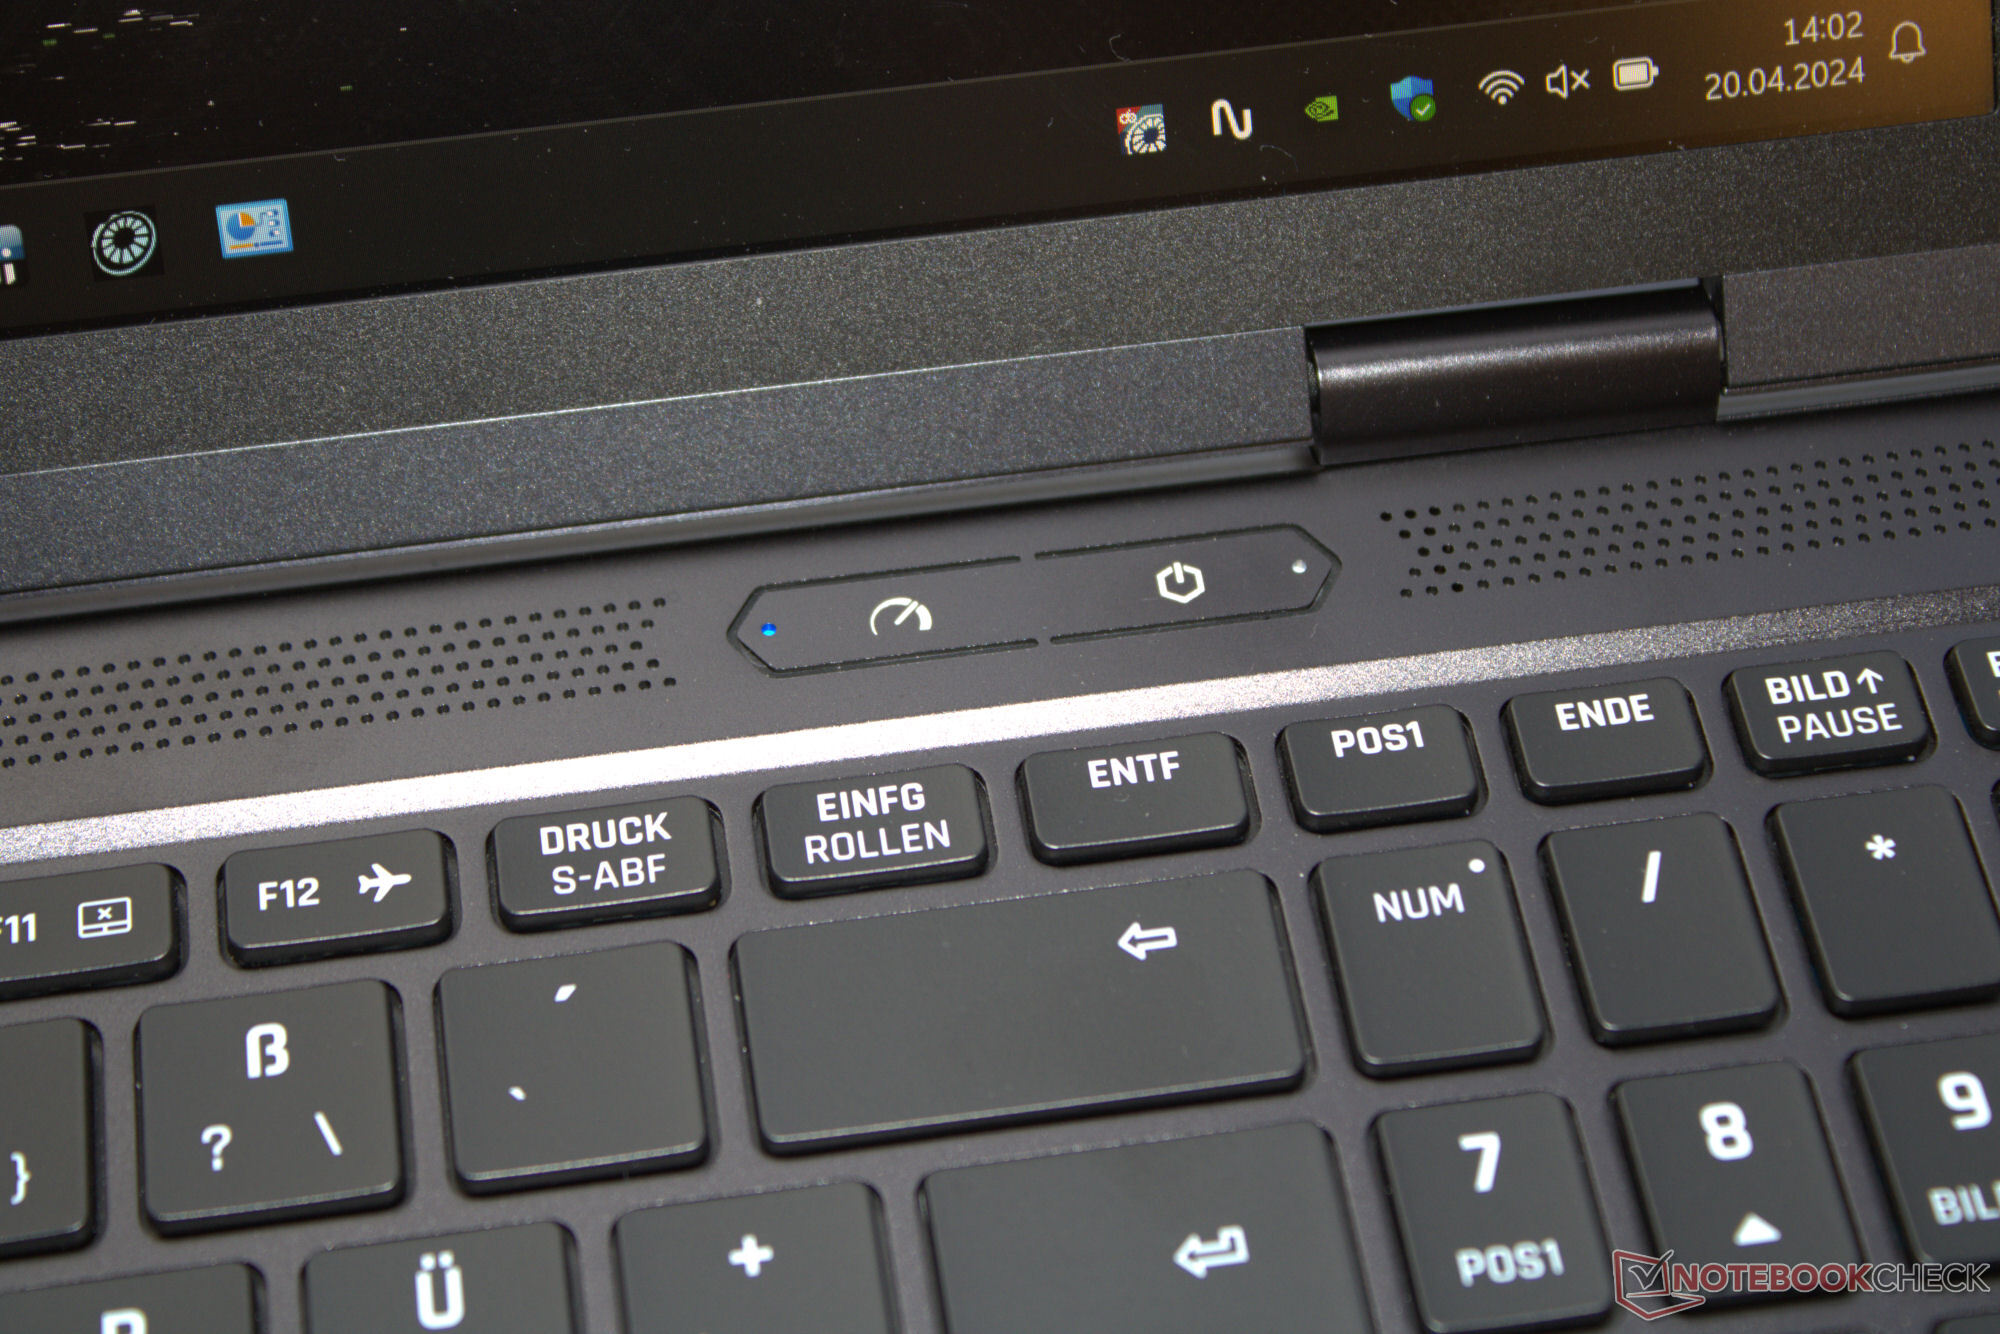
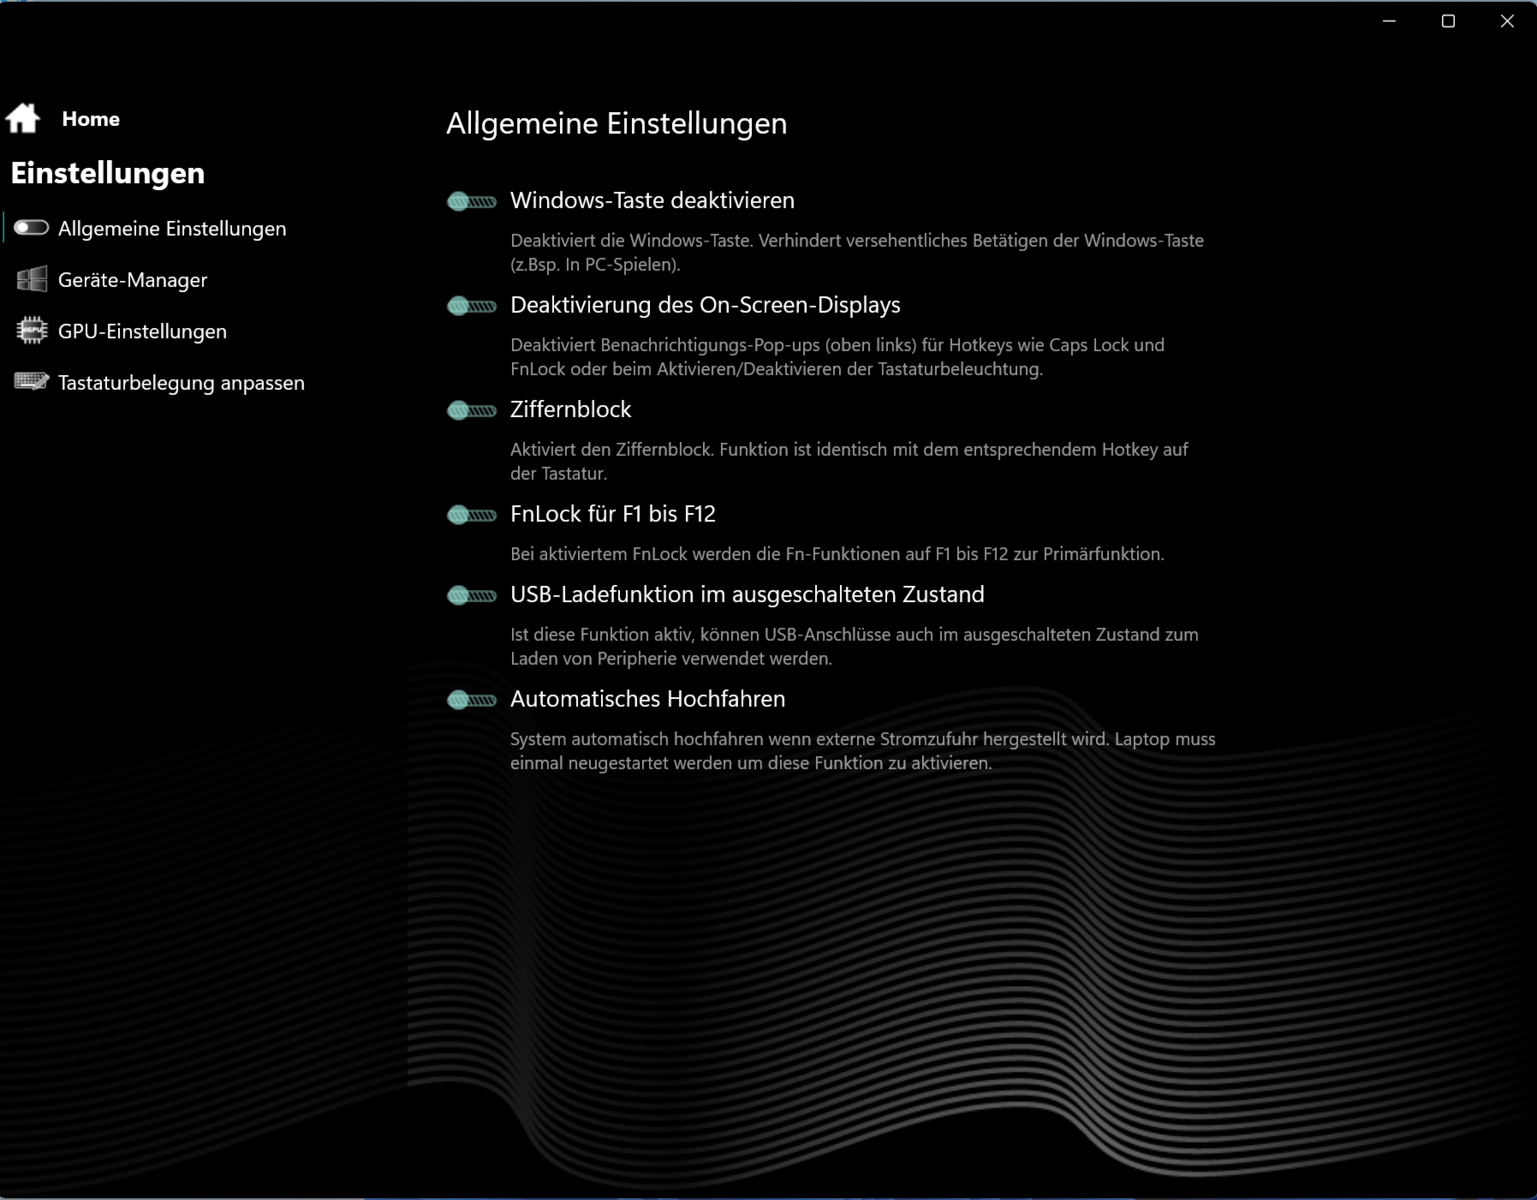
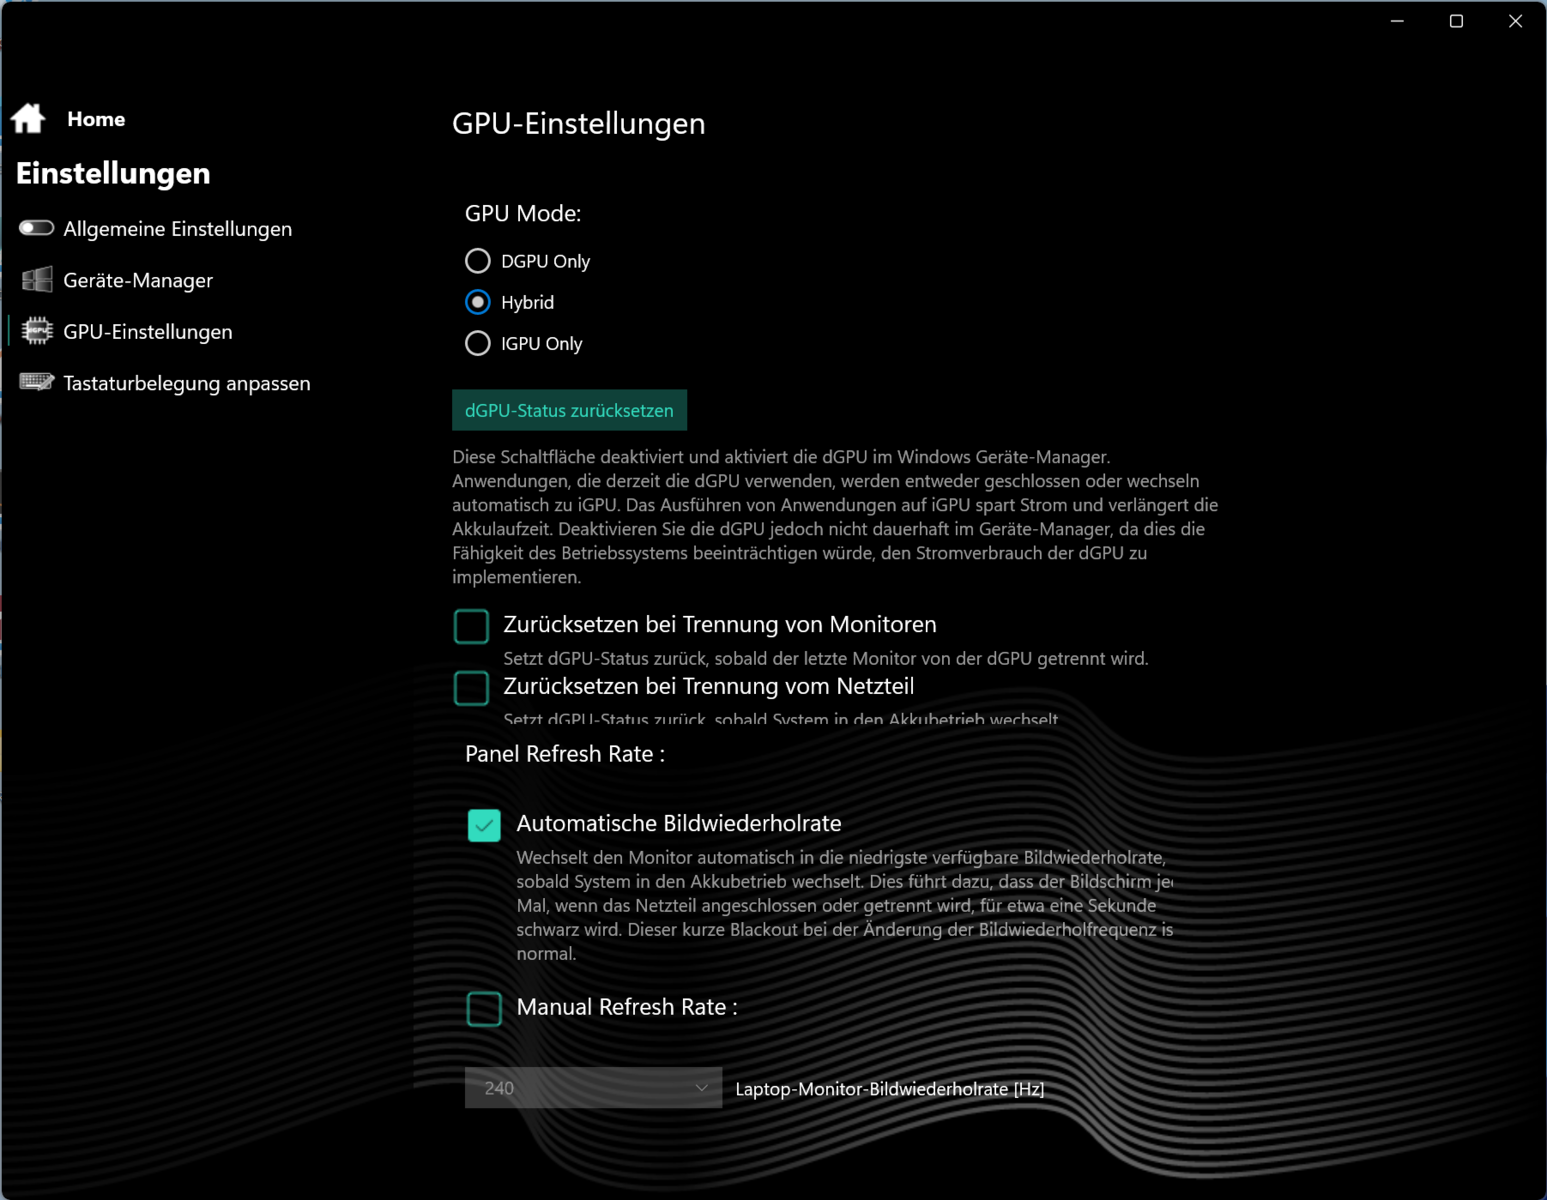
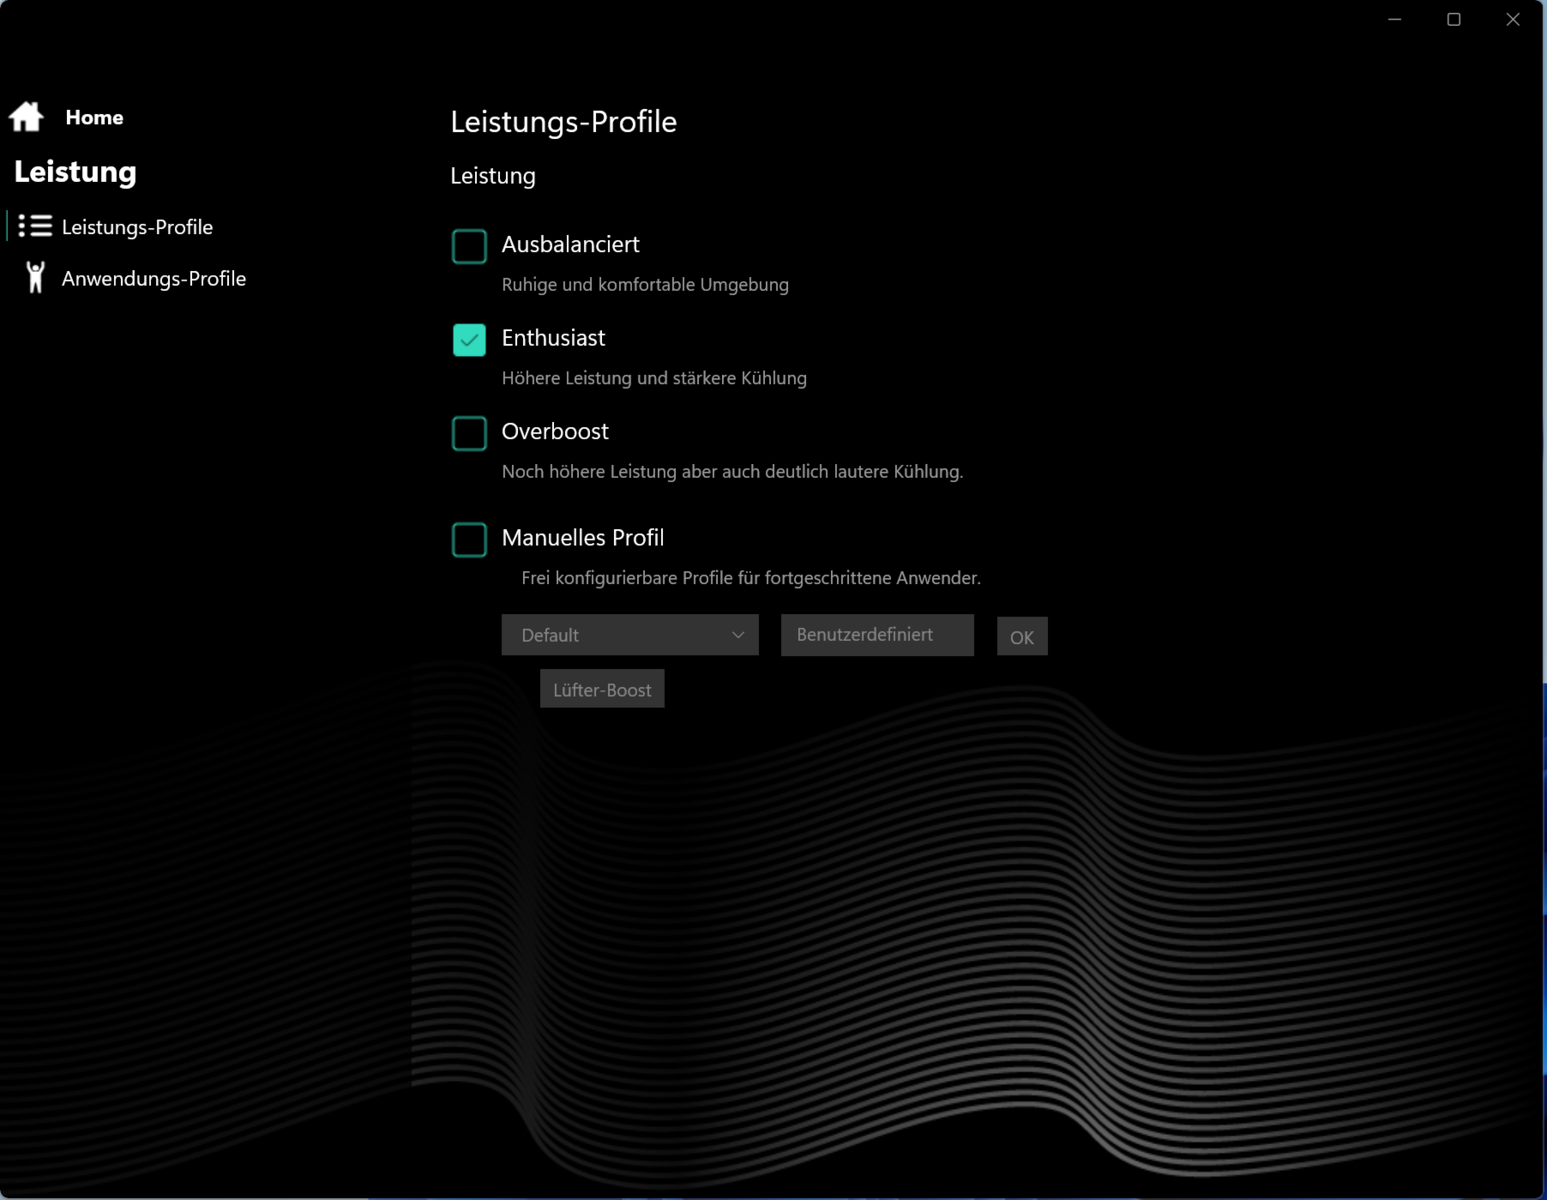
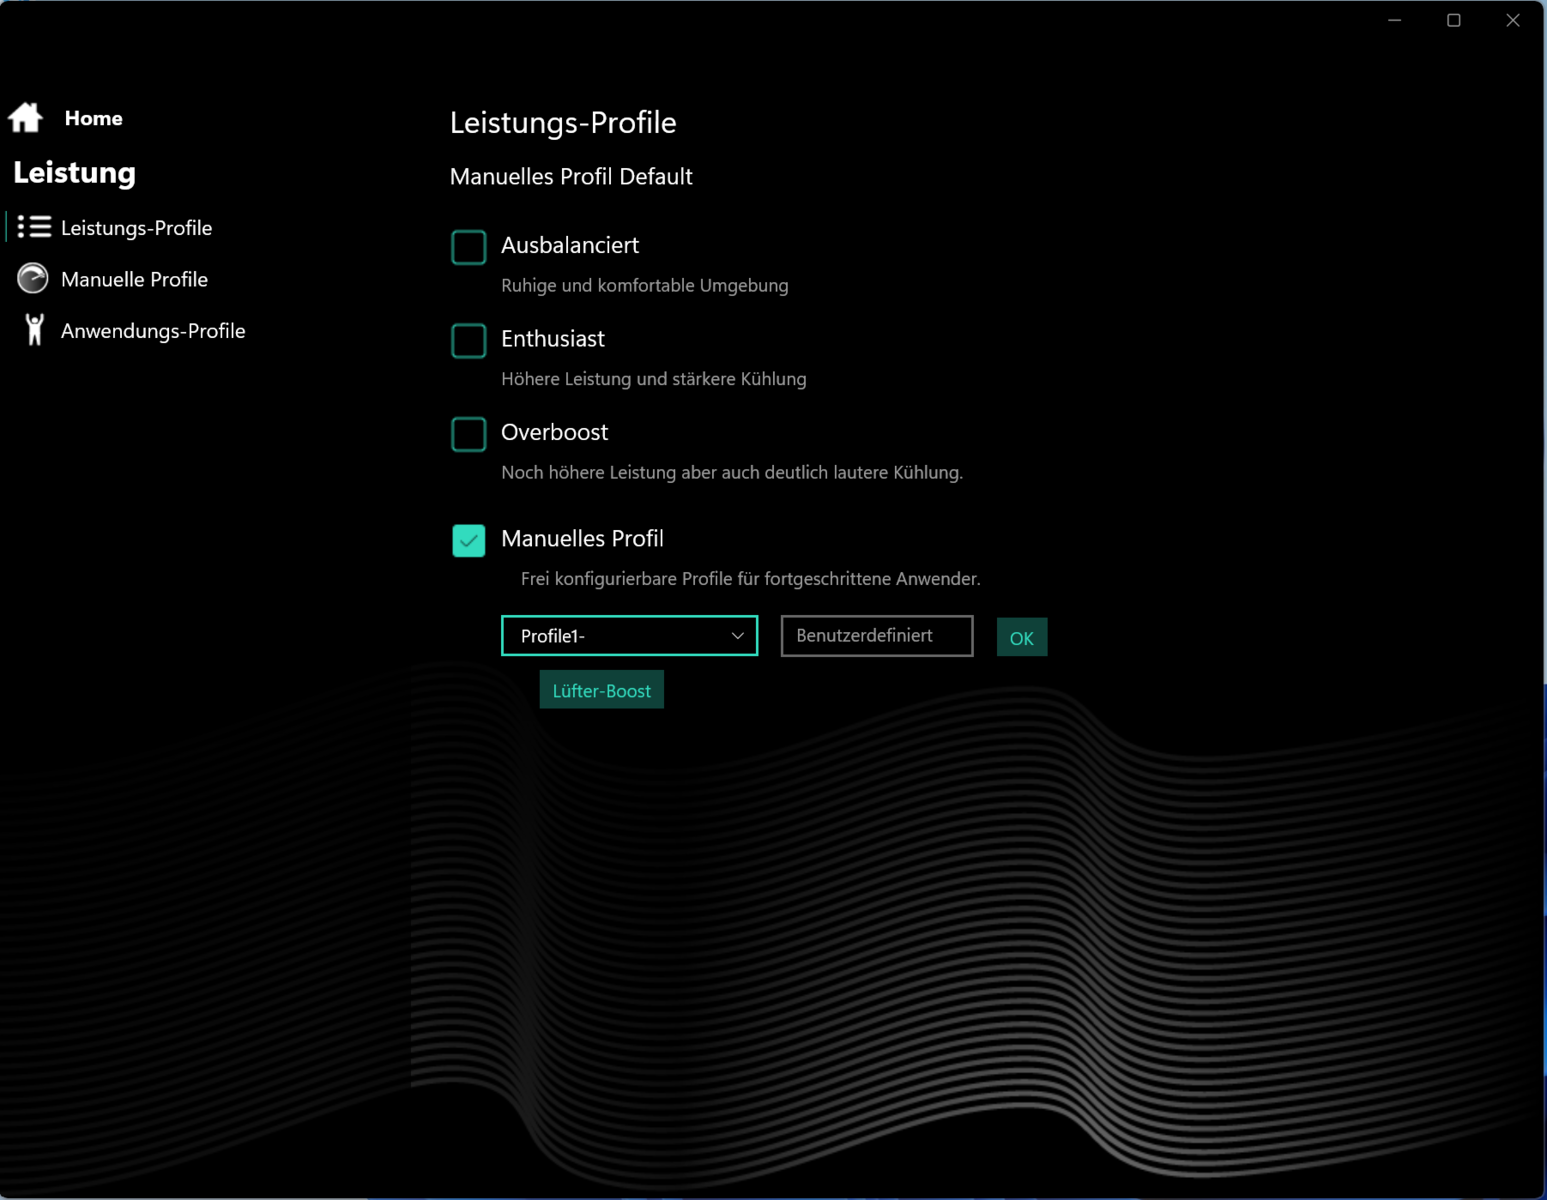
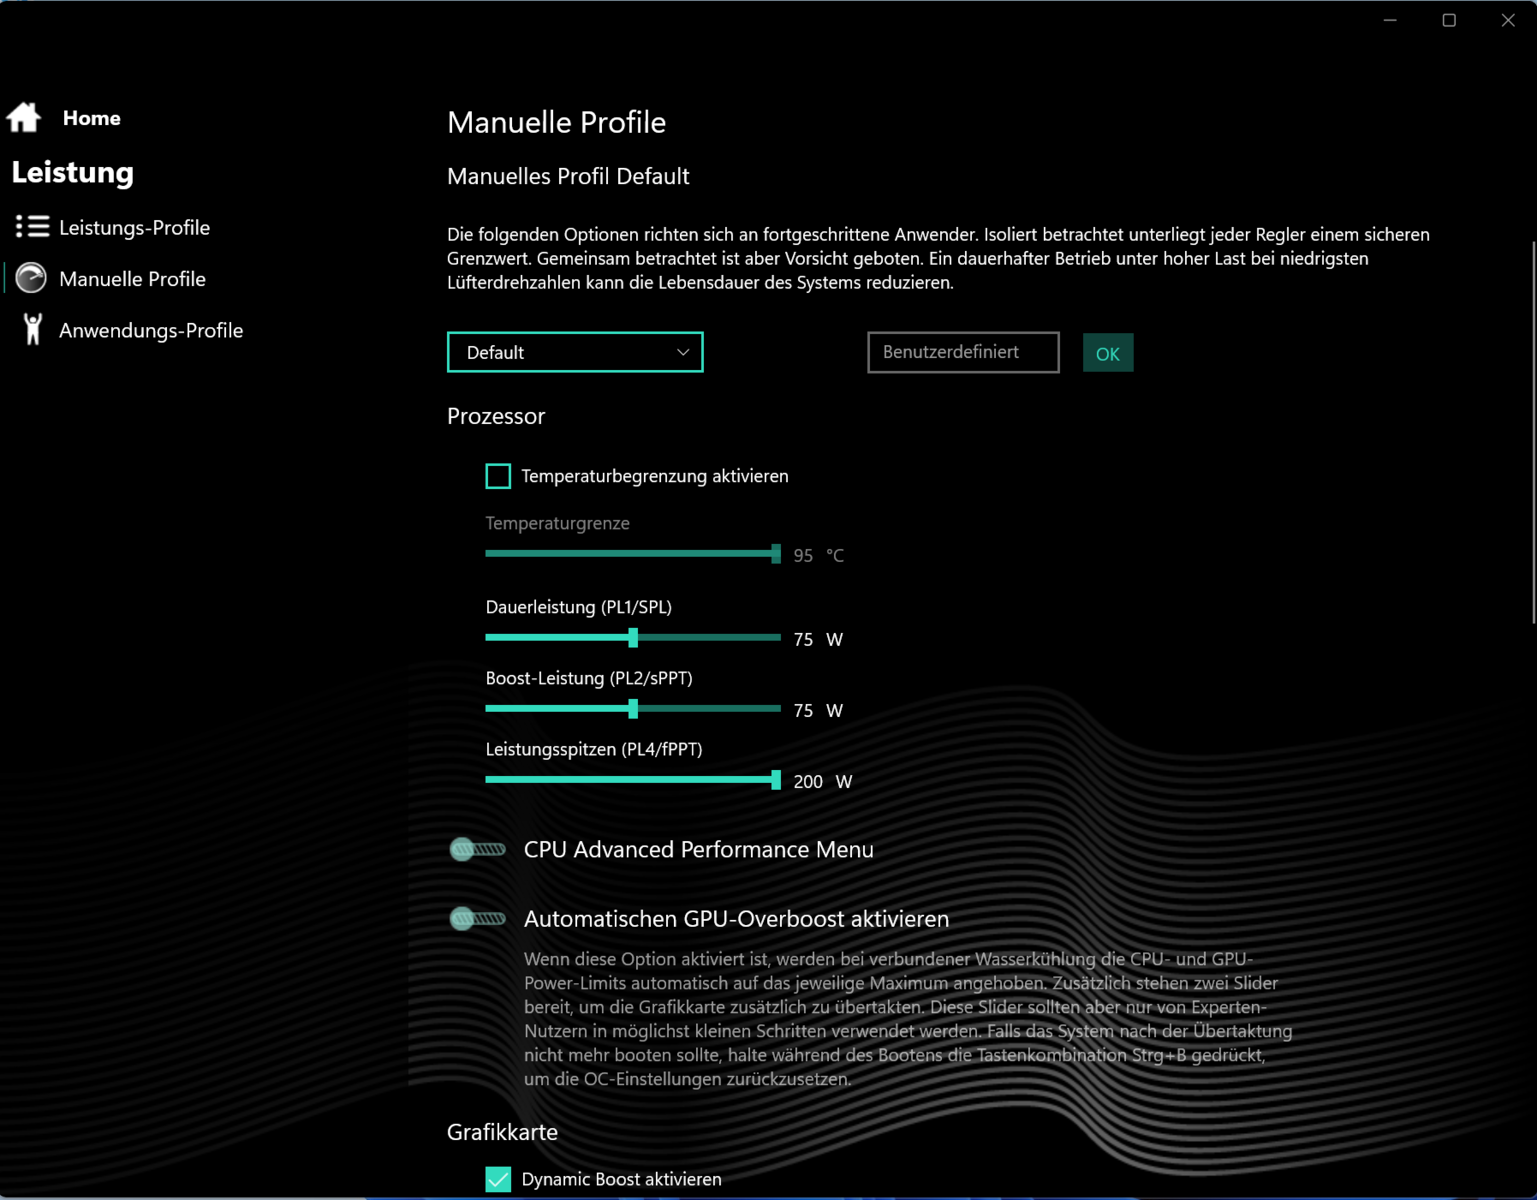
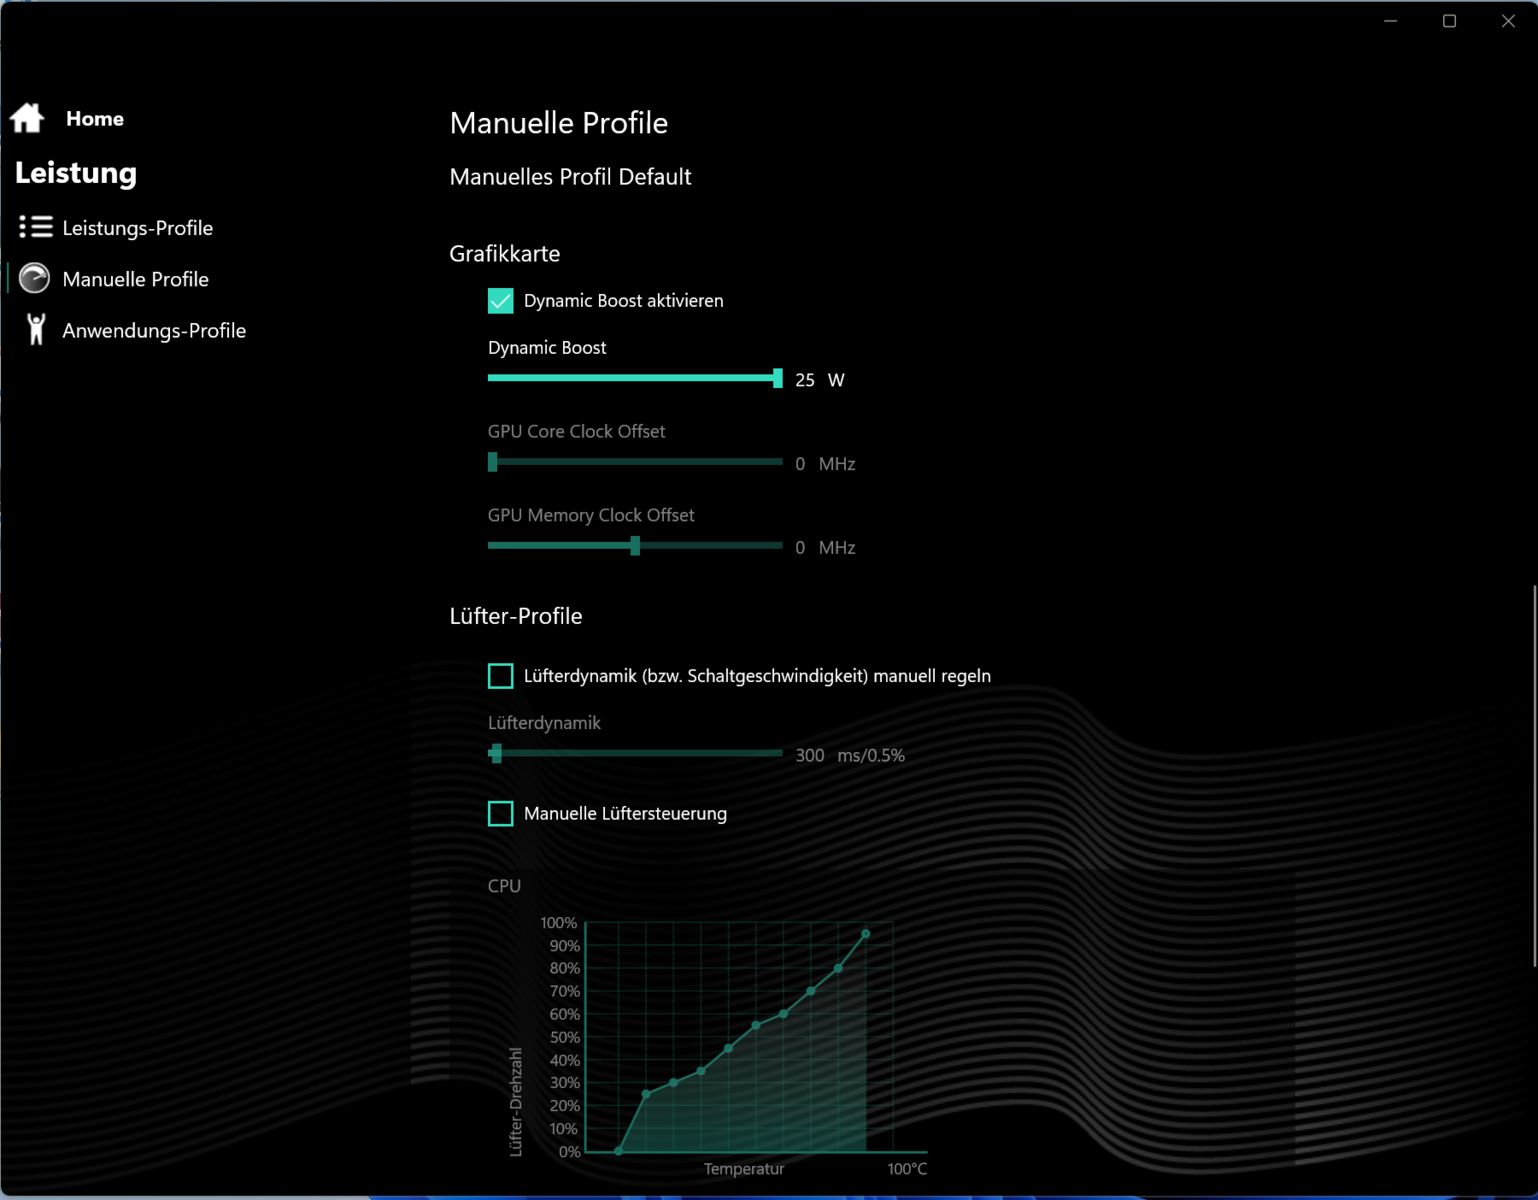
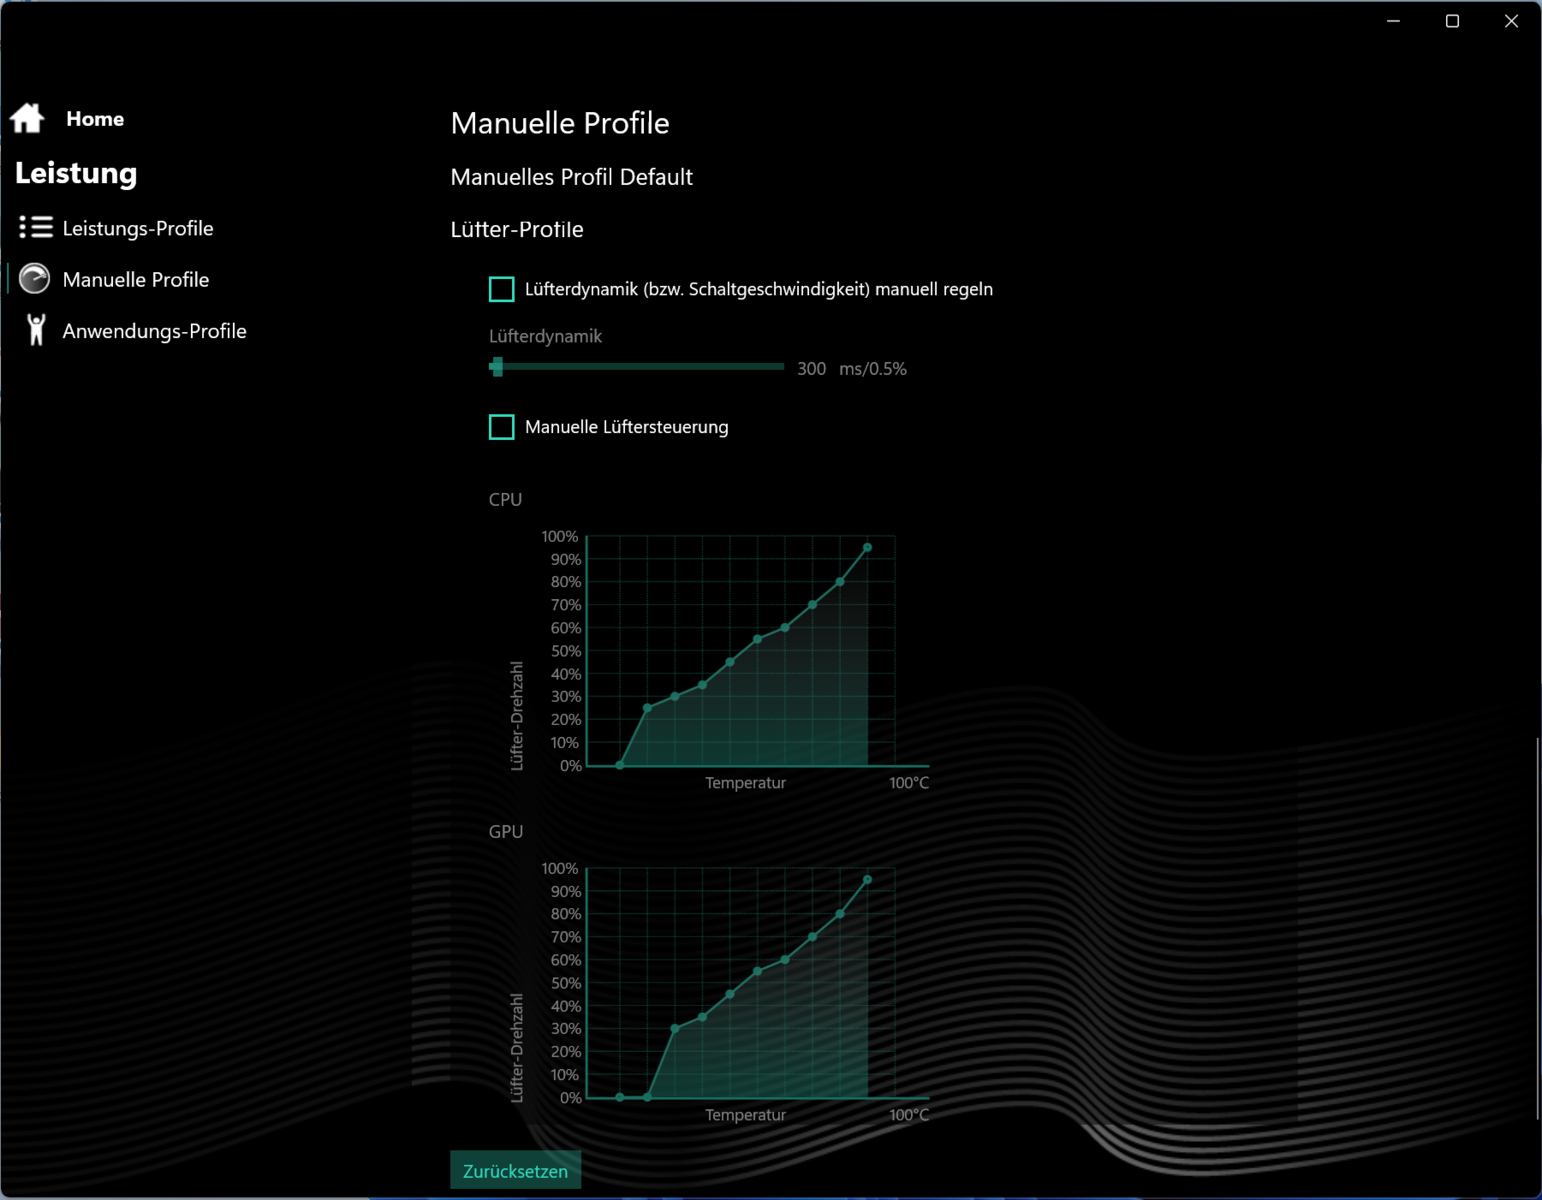
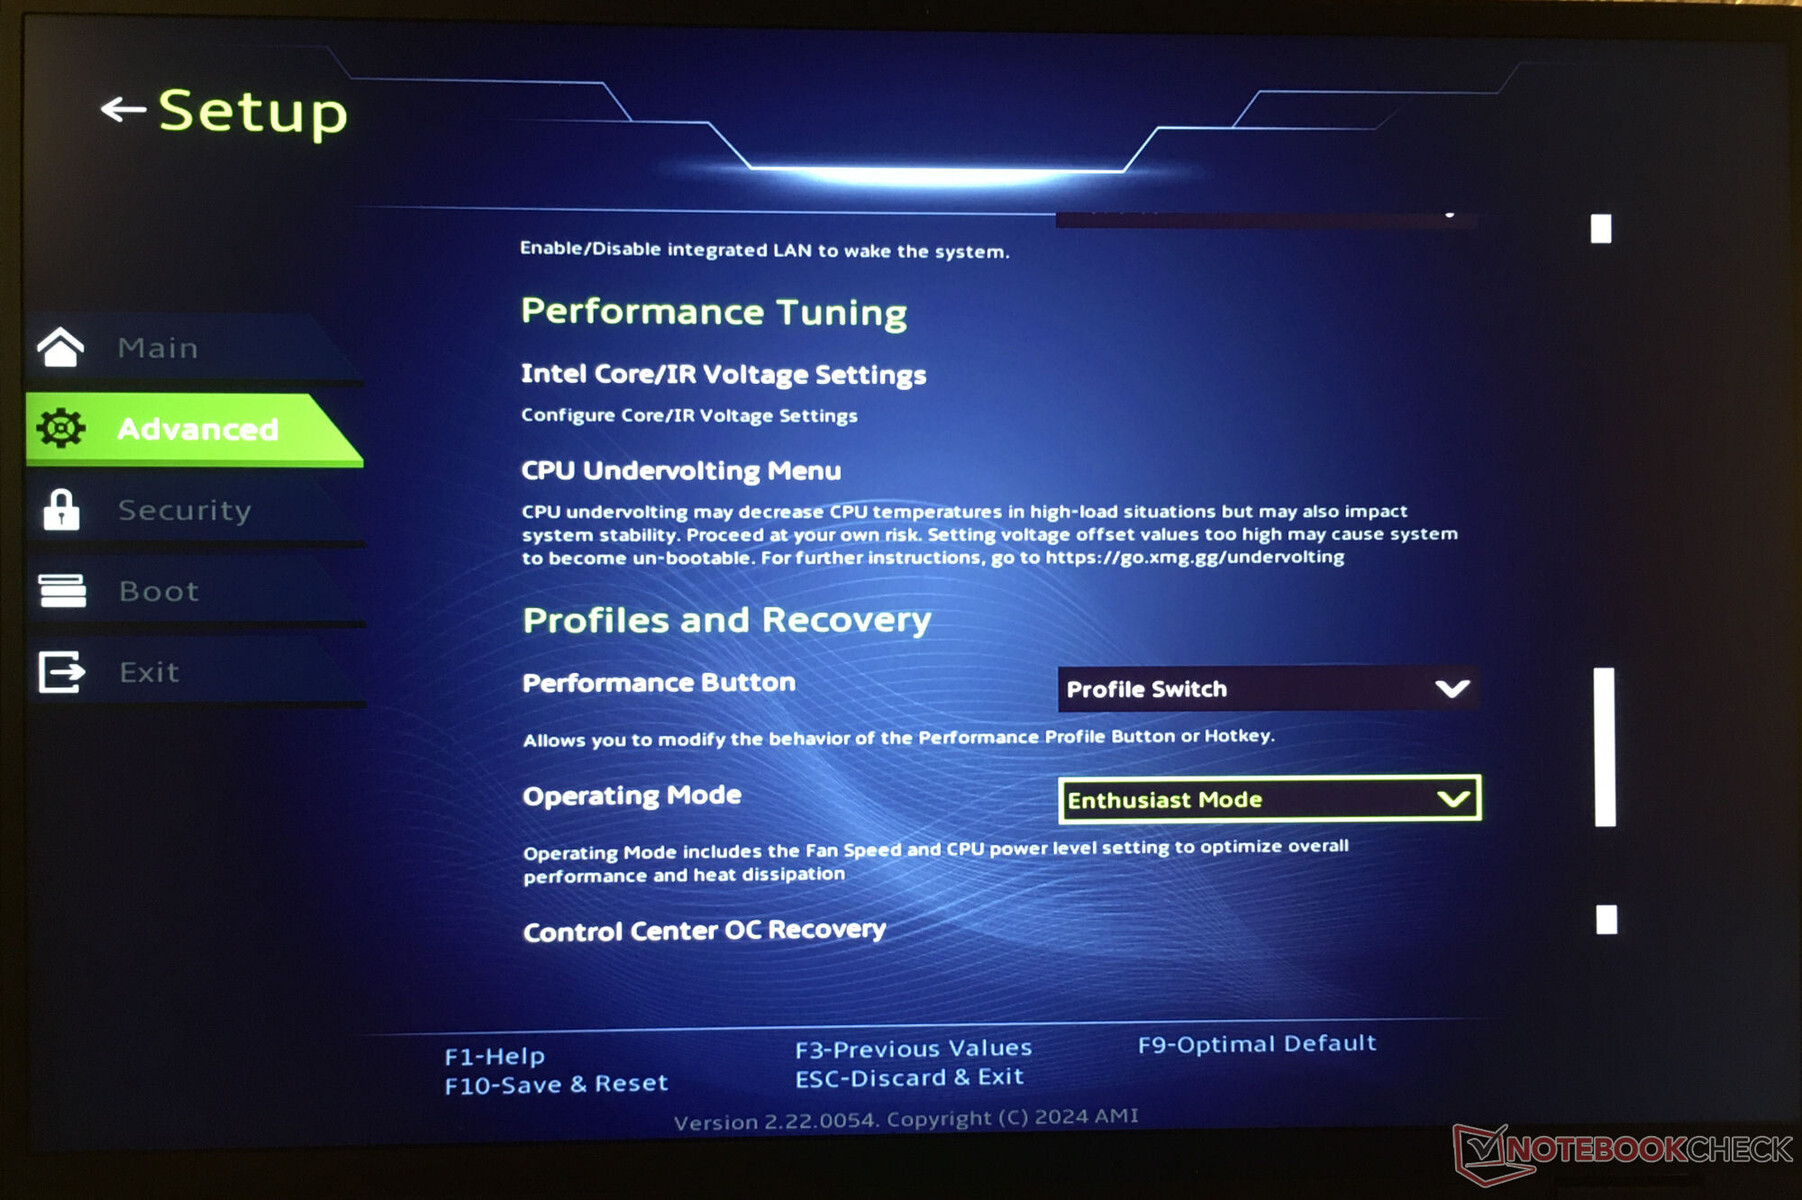
O laptop oferece três modos de desempenho específicos do fabricante (consulte a tabela), que podem ser alternados rapidamente por meio de um botão separado (próximo ao botão liga/desliga). Perfis individuais podem ser criados usando o software Control Center pré-instalado. Por exemplo, os limites de potência da CPU, o TGP da GPU e/ou os limites superiores de temperatura do dispositivo podem ser ajustados.
Os modos Enthusiast (benchmarks) e Balanced (testes de bateria) foram usados durante nosso teste. O modo GPU foi definido como Hybrid (= Optimus).
| Entusiasta | Overboost | Balanceado | |
|---|---|---|---|
| Limite de potência 1 (HWInfo) | 160 watts | 160 watts | 160 watts |
| Limite de potência 2 (HWInfo) | 170 watts | 170 watts | 170 watts |
| Ruído (Witcher 3) | 51 dB(A) | 53 dB(A) | 39 dB(A) |
| Desempenho (Witcher 3) | 128 fps | 130 fps | 14-128 fps |

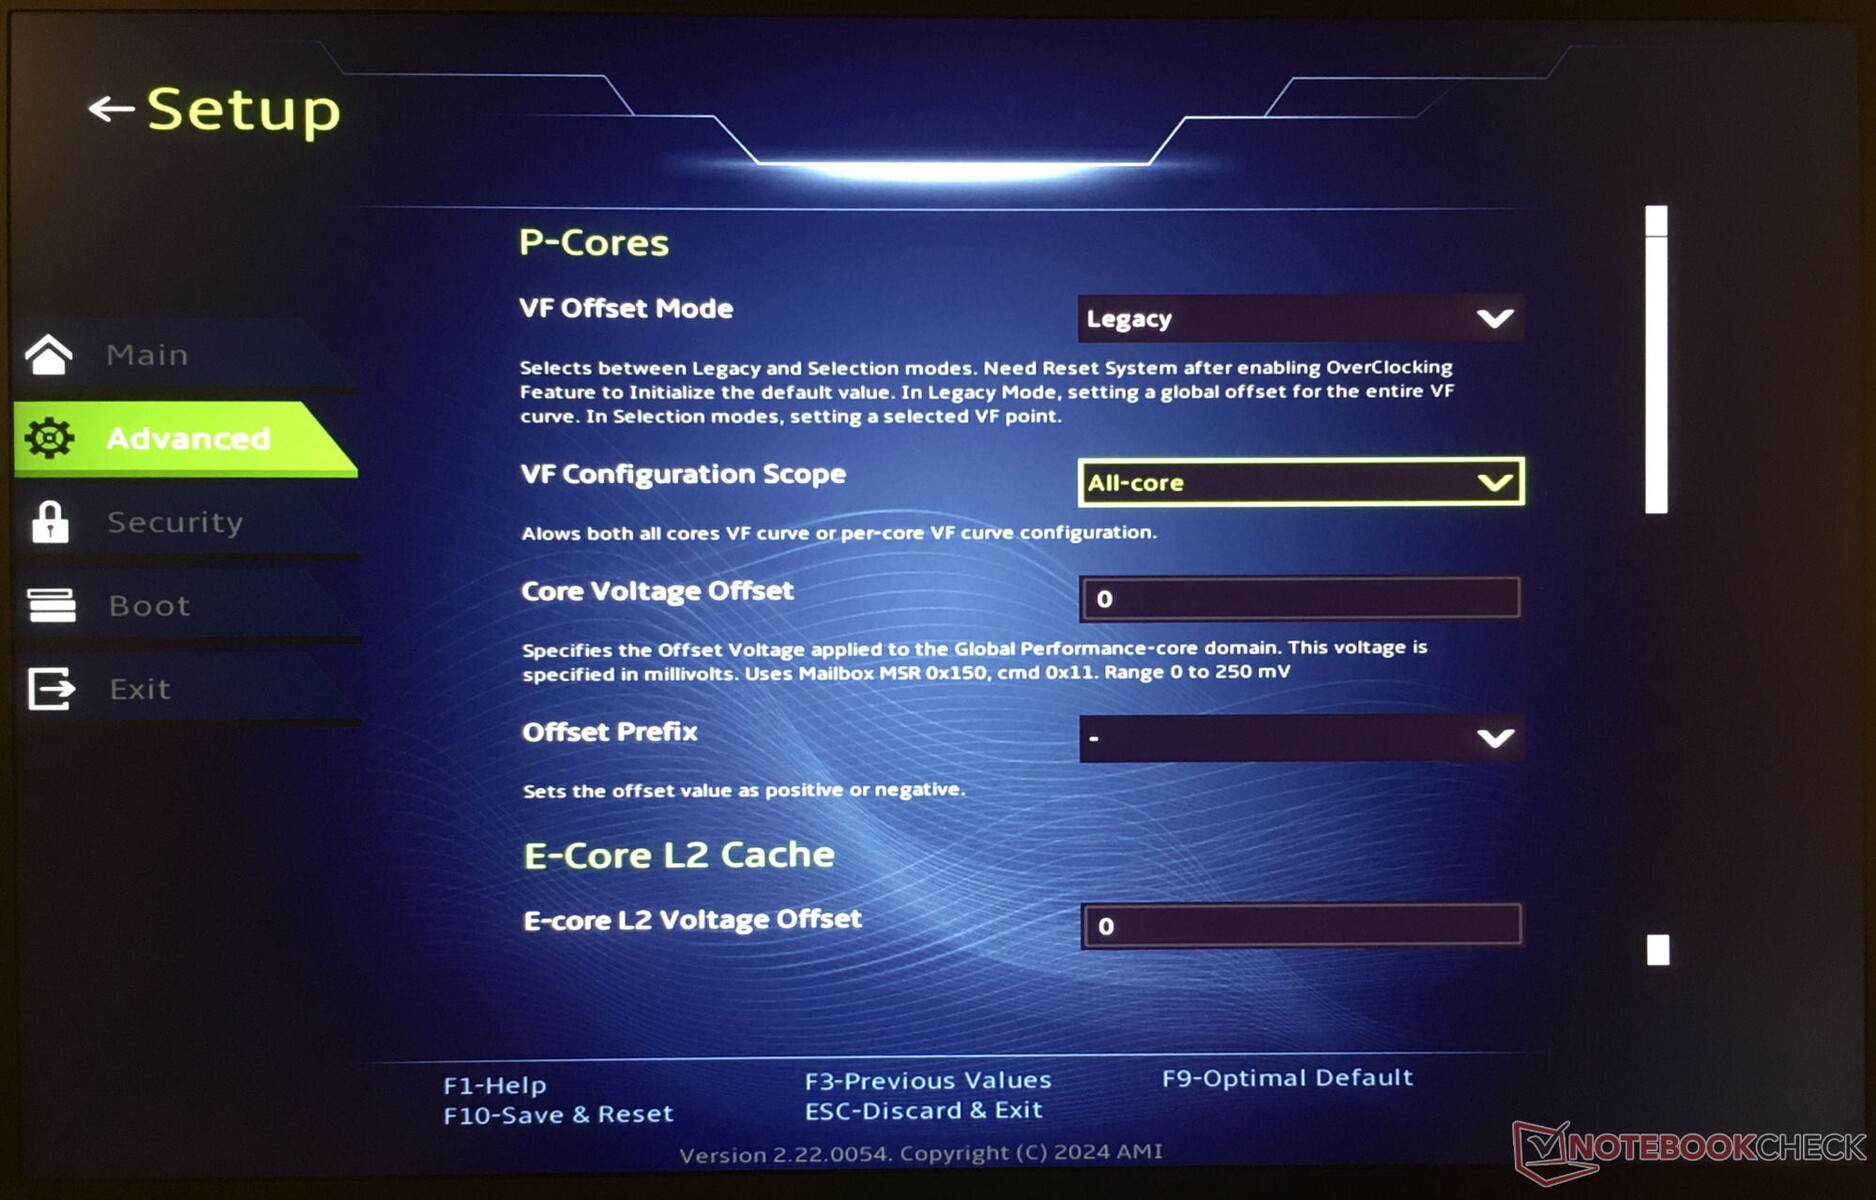
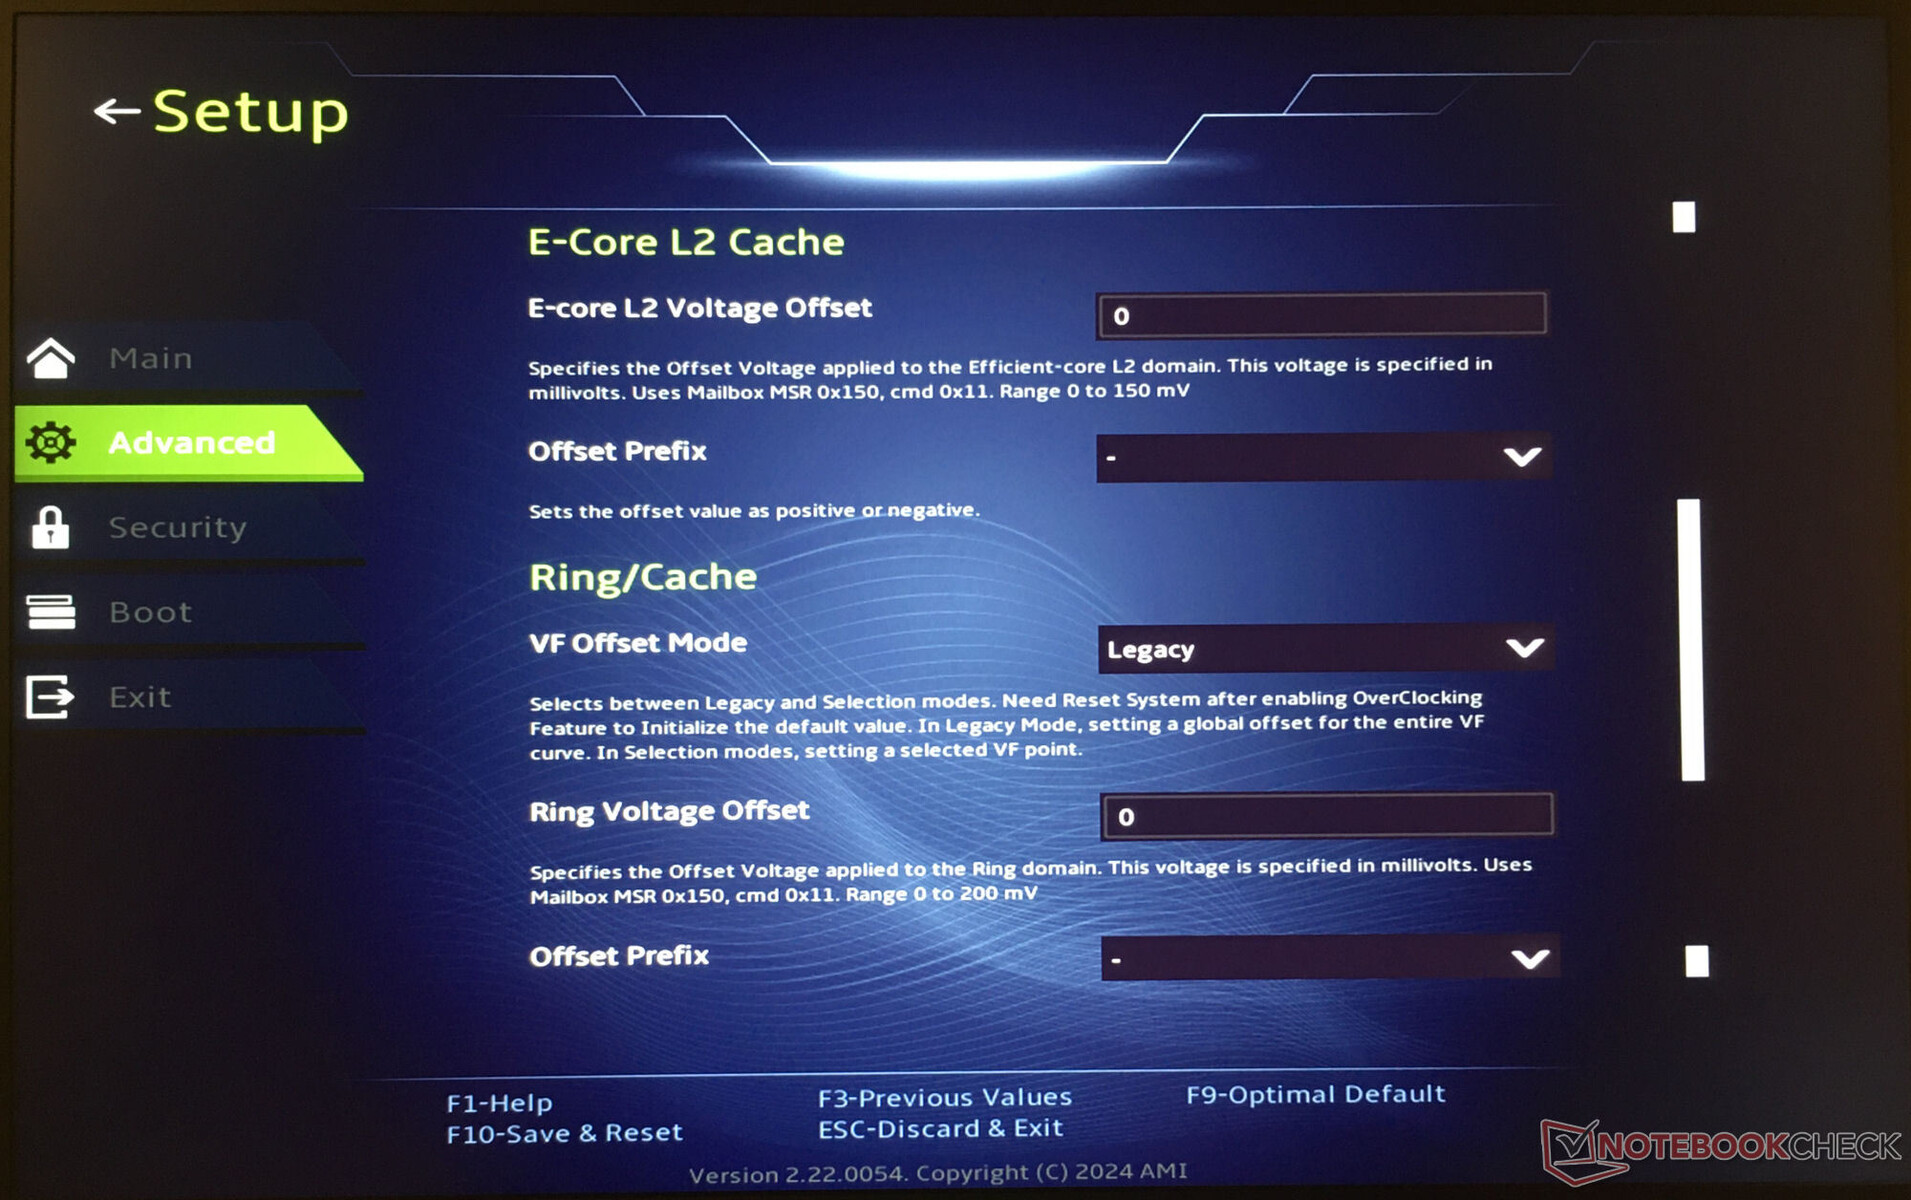
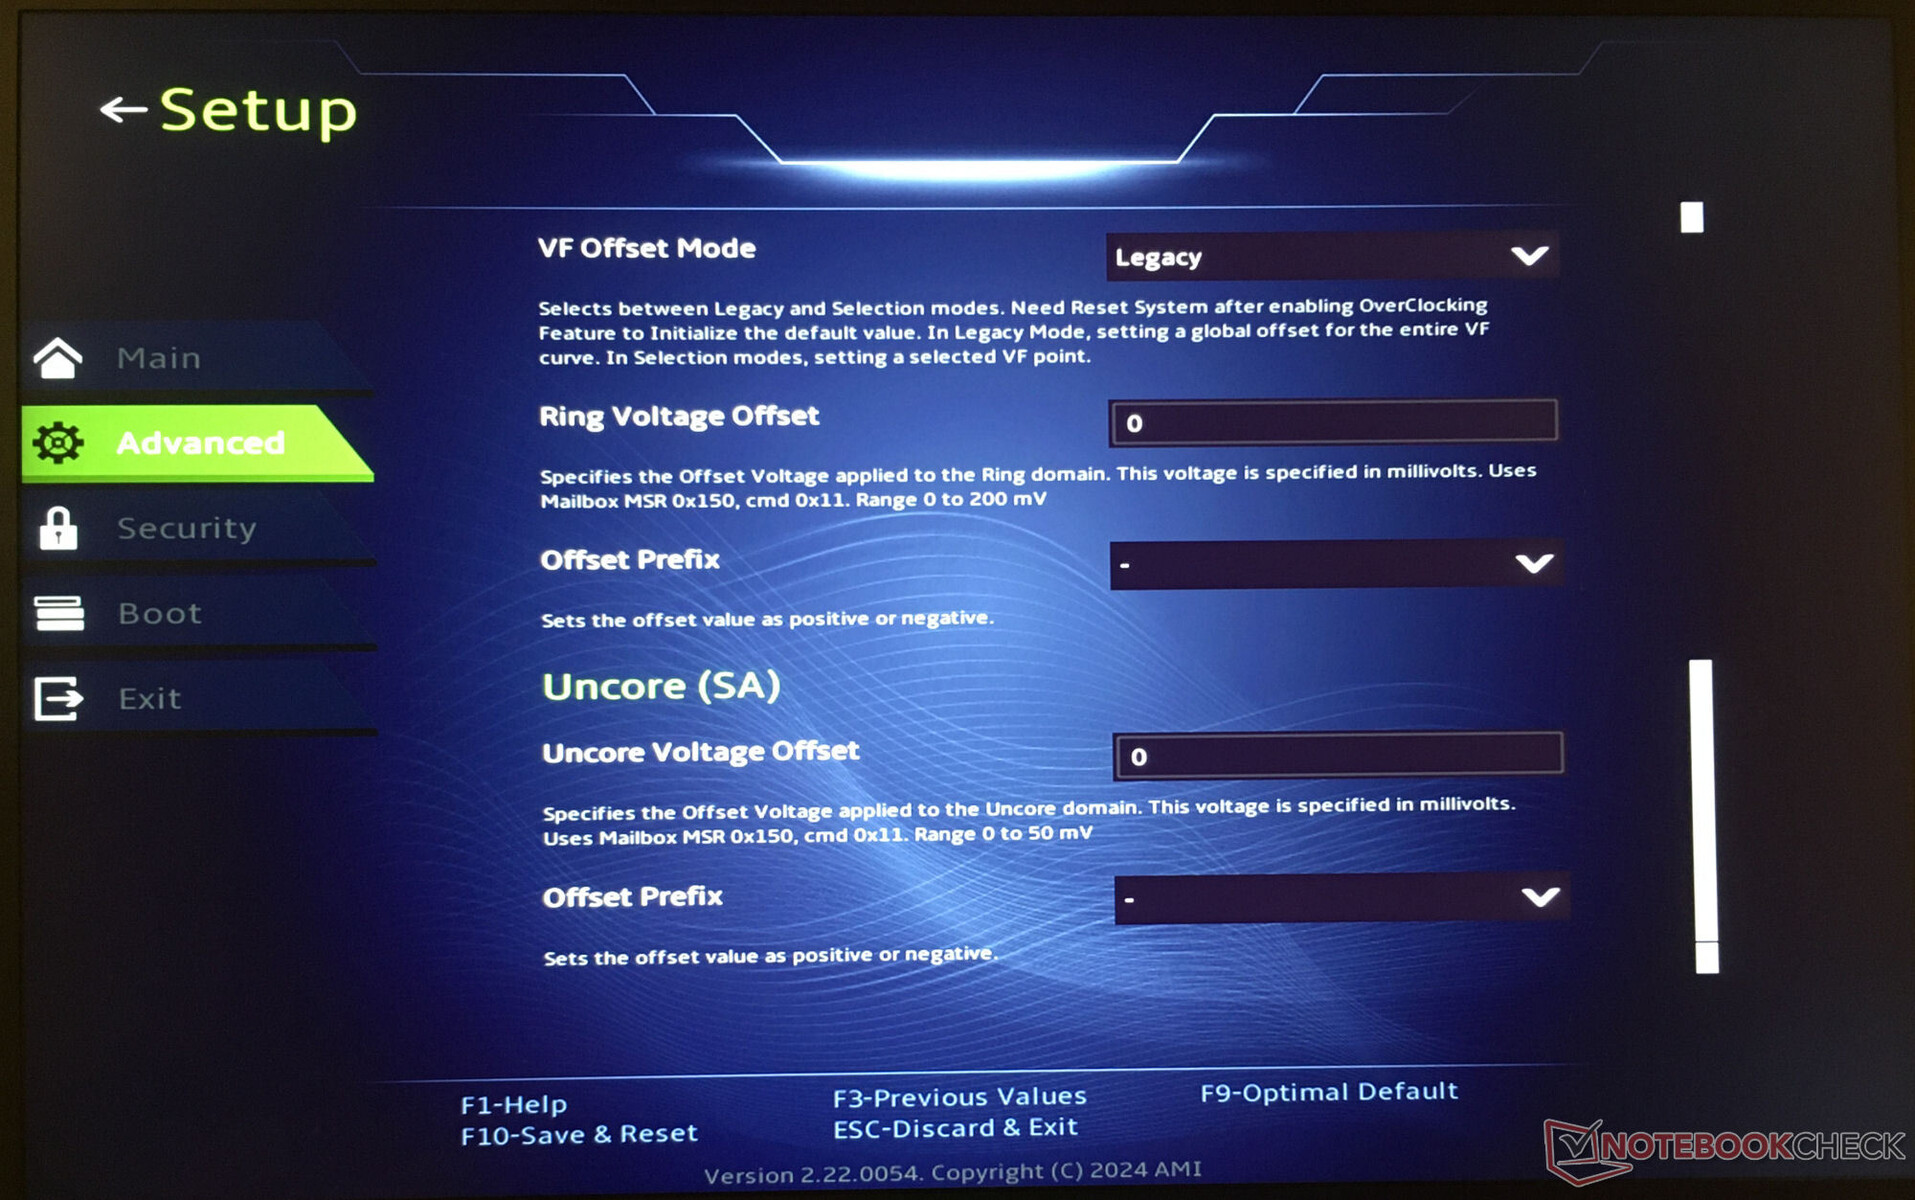
Subvoltagem
O processador pode ser operado com tensões mais baixas do que as previstas pelo fabricante (undervolting). Como resultado, o consumo de energia e as emissões de calor do dispositivo são reduzidos. Mas tenha cuidado: A redução excessiva da tensão pode levar a um sistema instável ou defeituoso. Nesse caso, as alterações devem ser revertidas - a subtensão deve ser realizada por sua própria conta e risco.
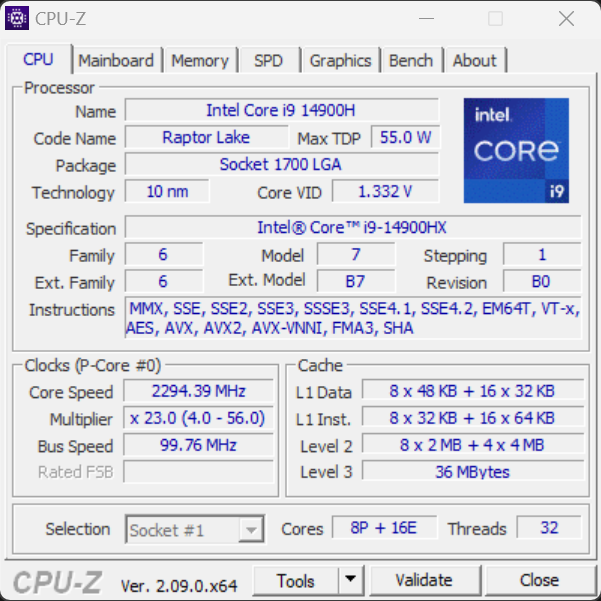
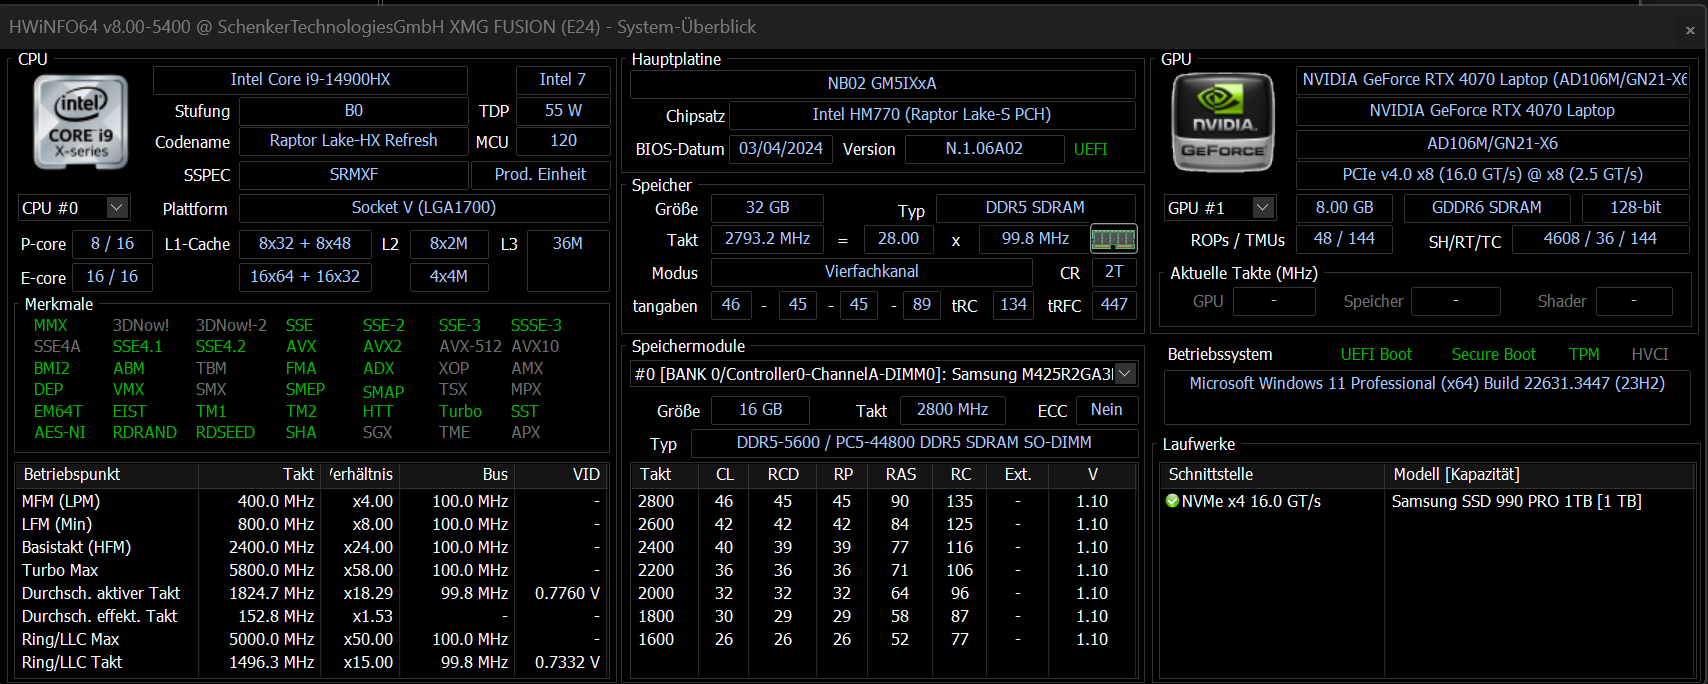
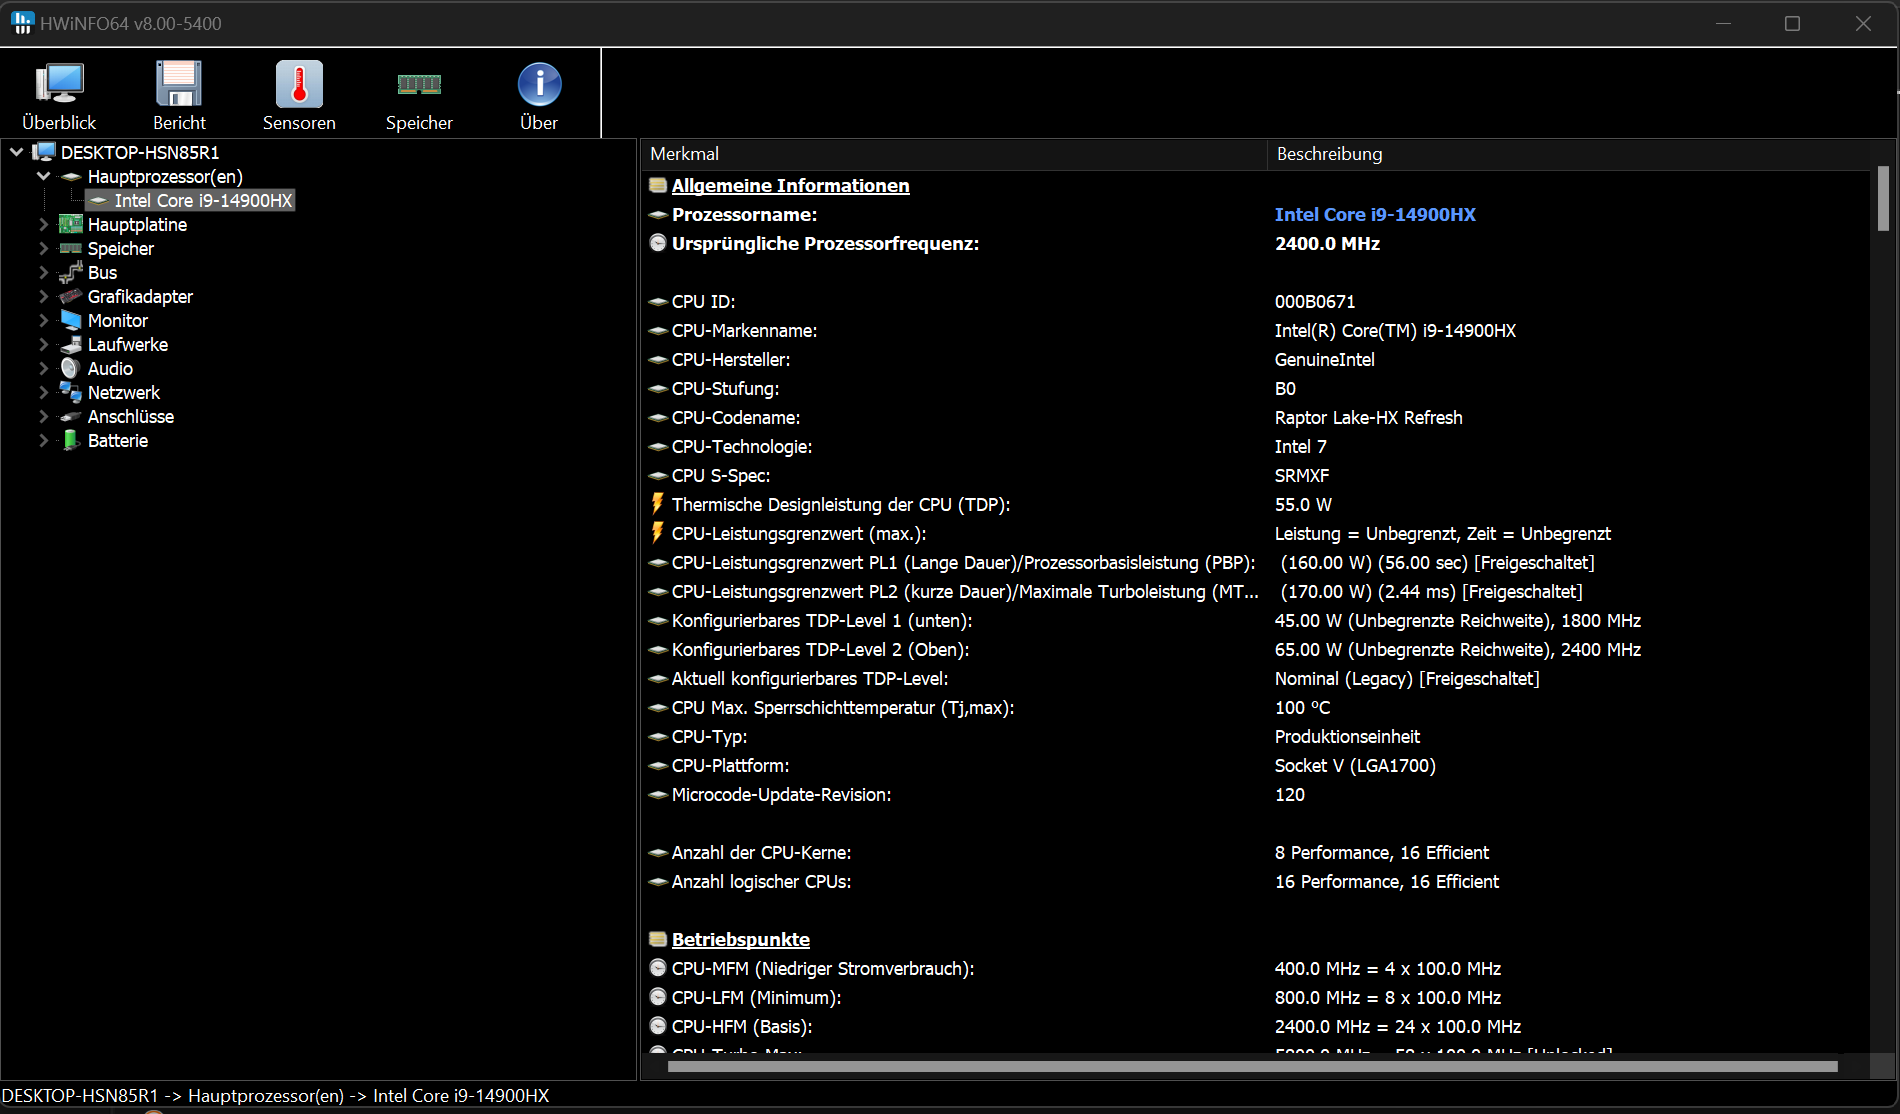
Processador
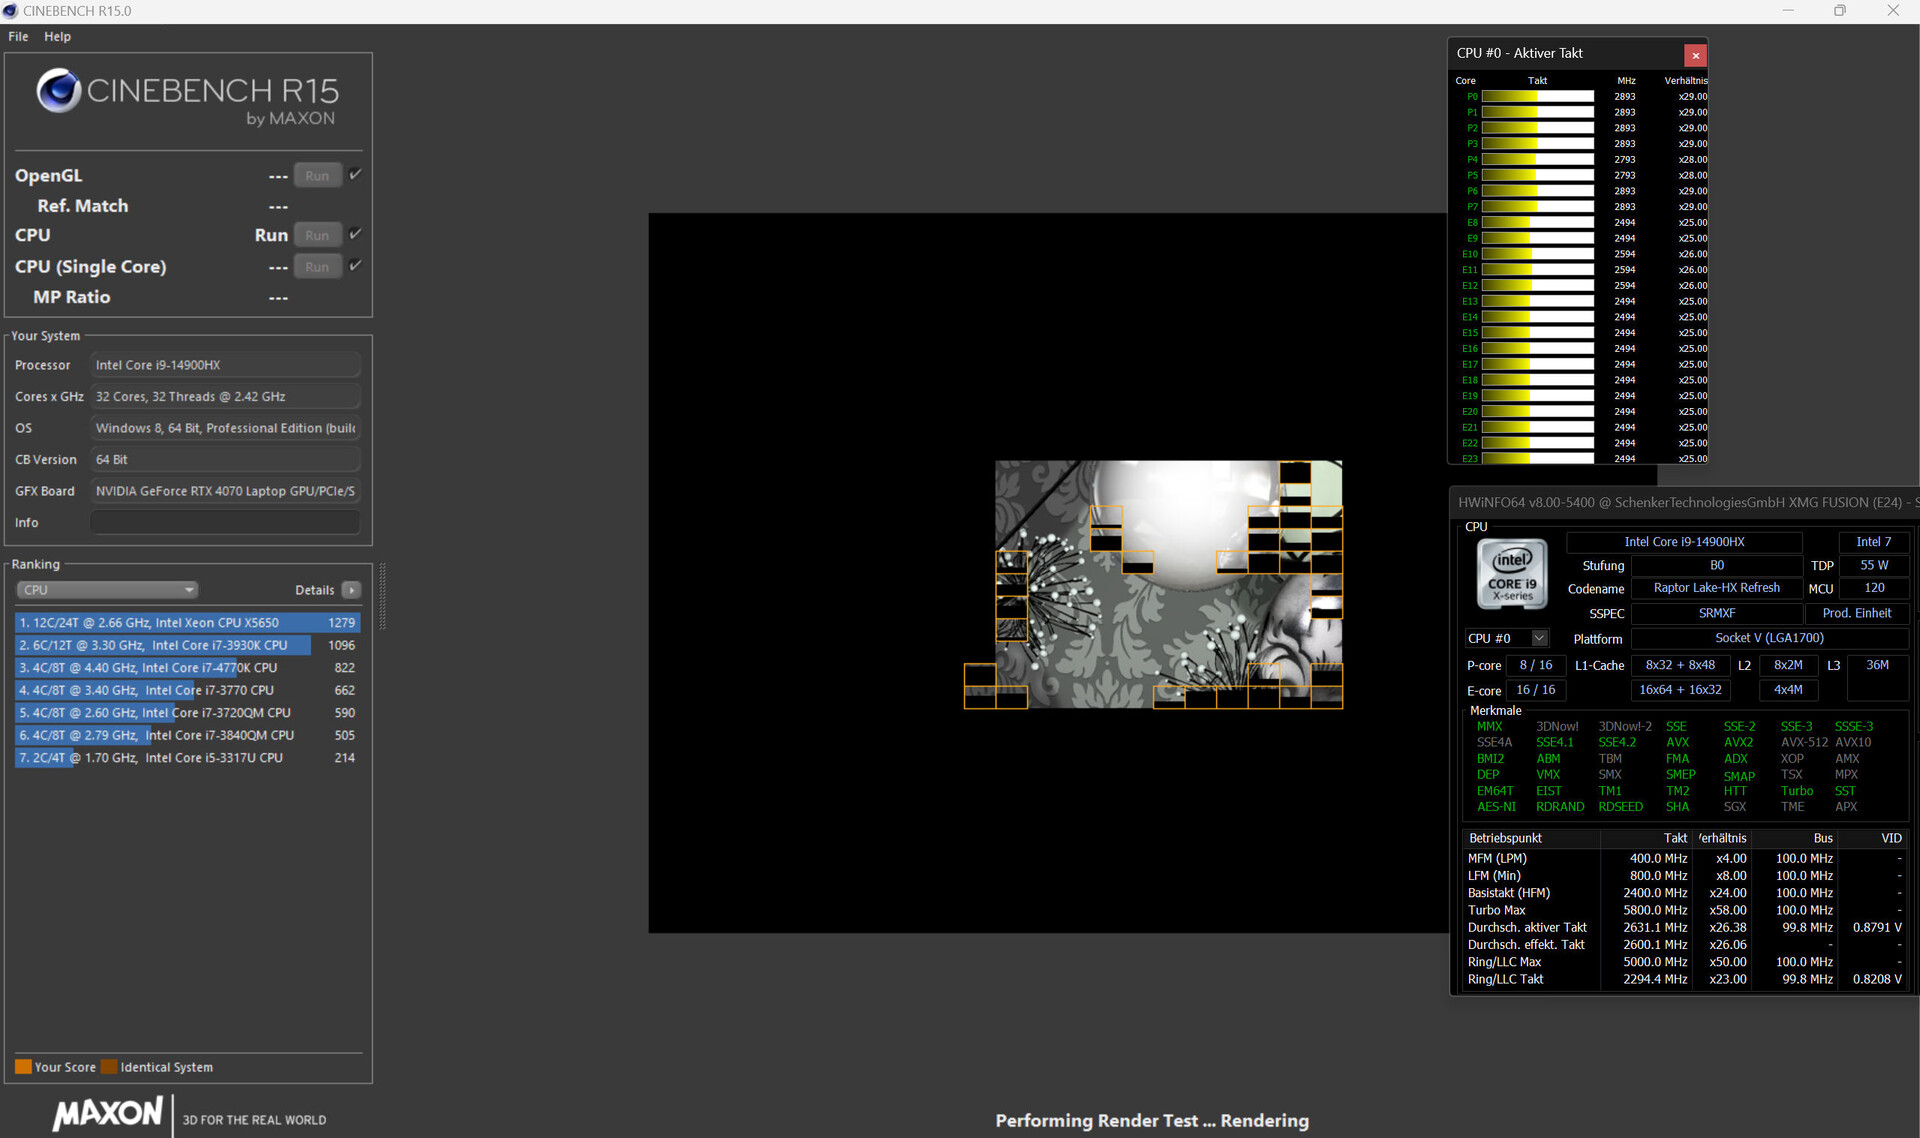
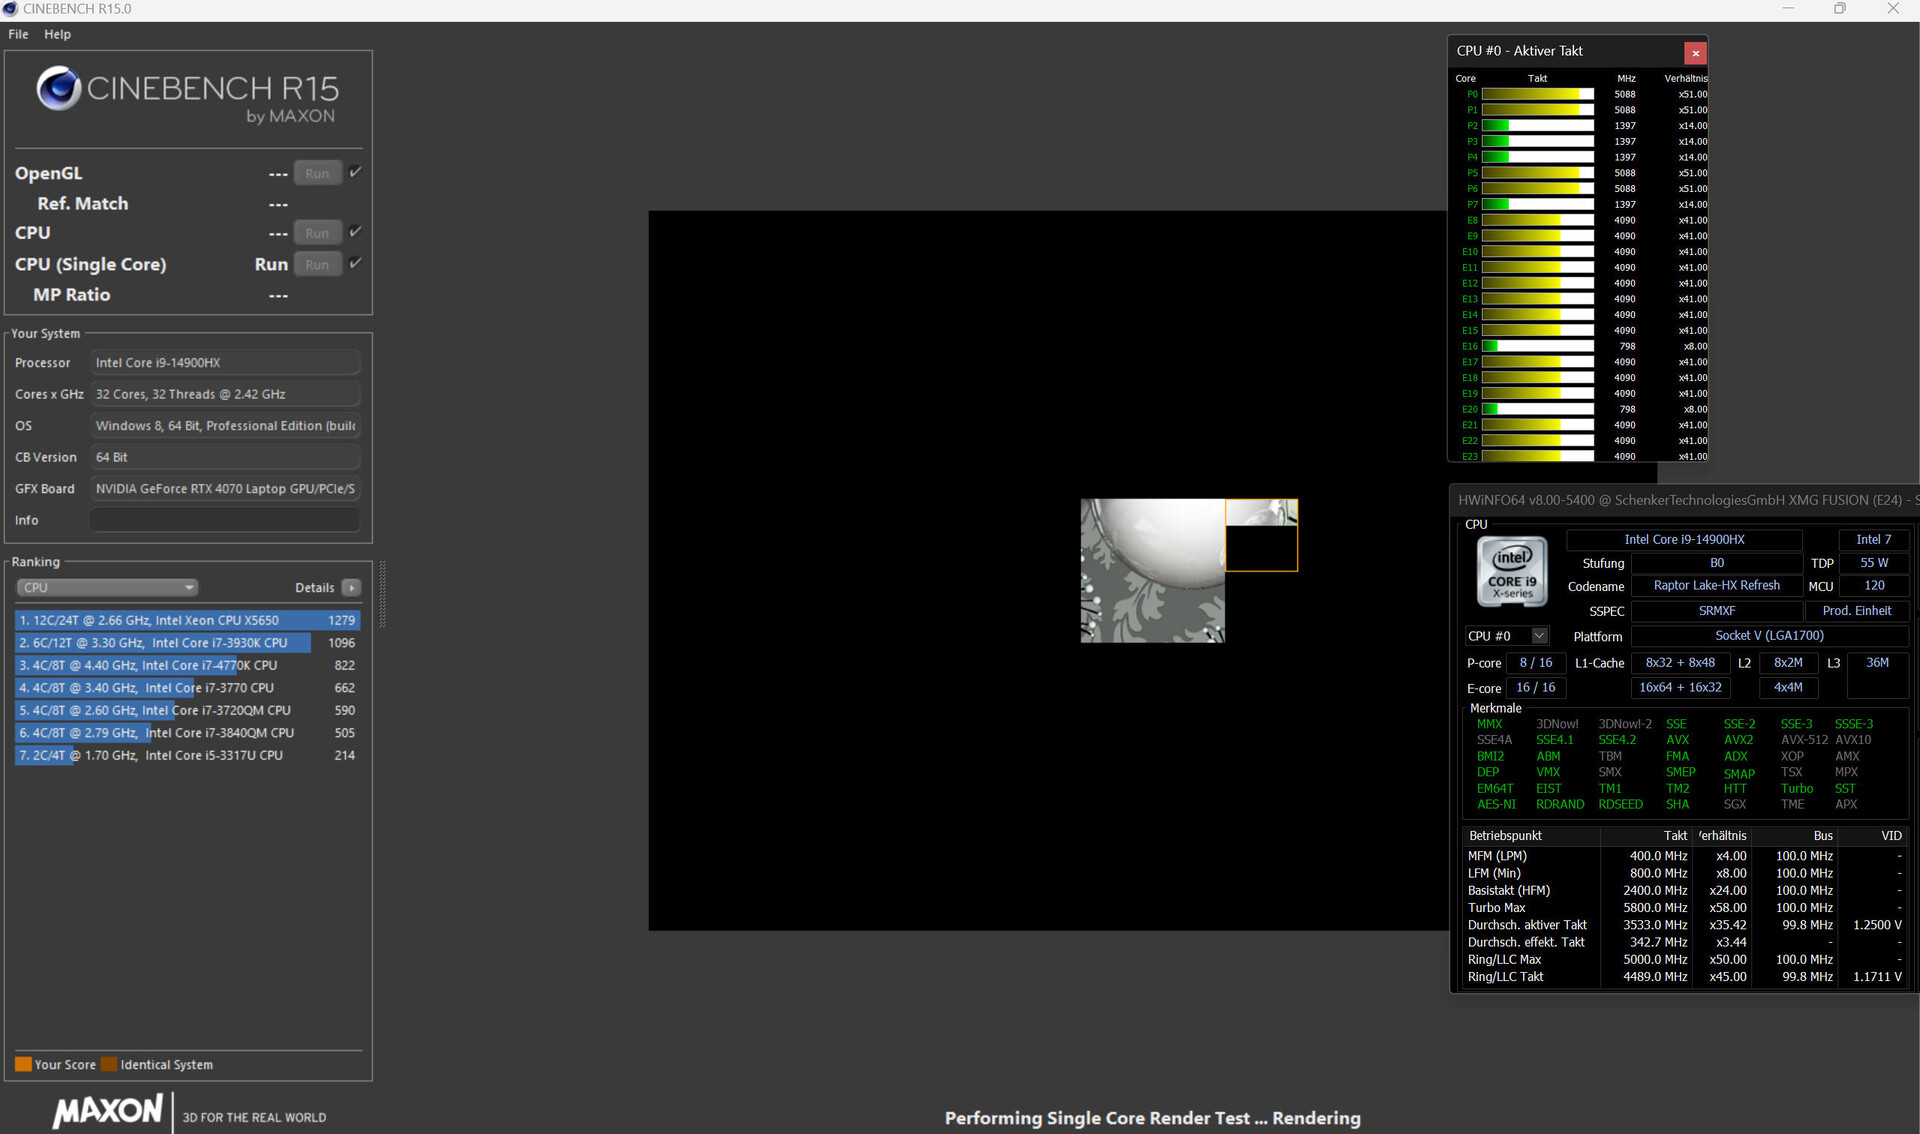
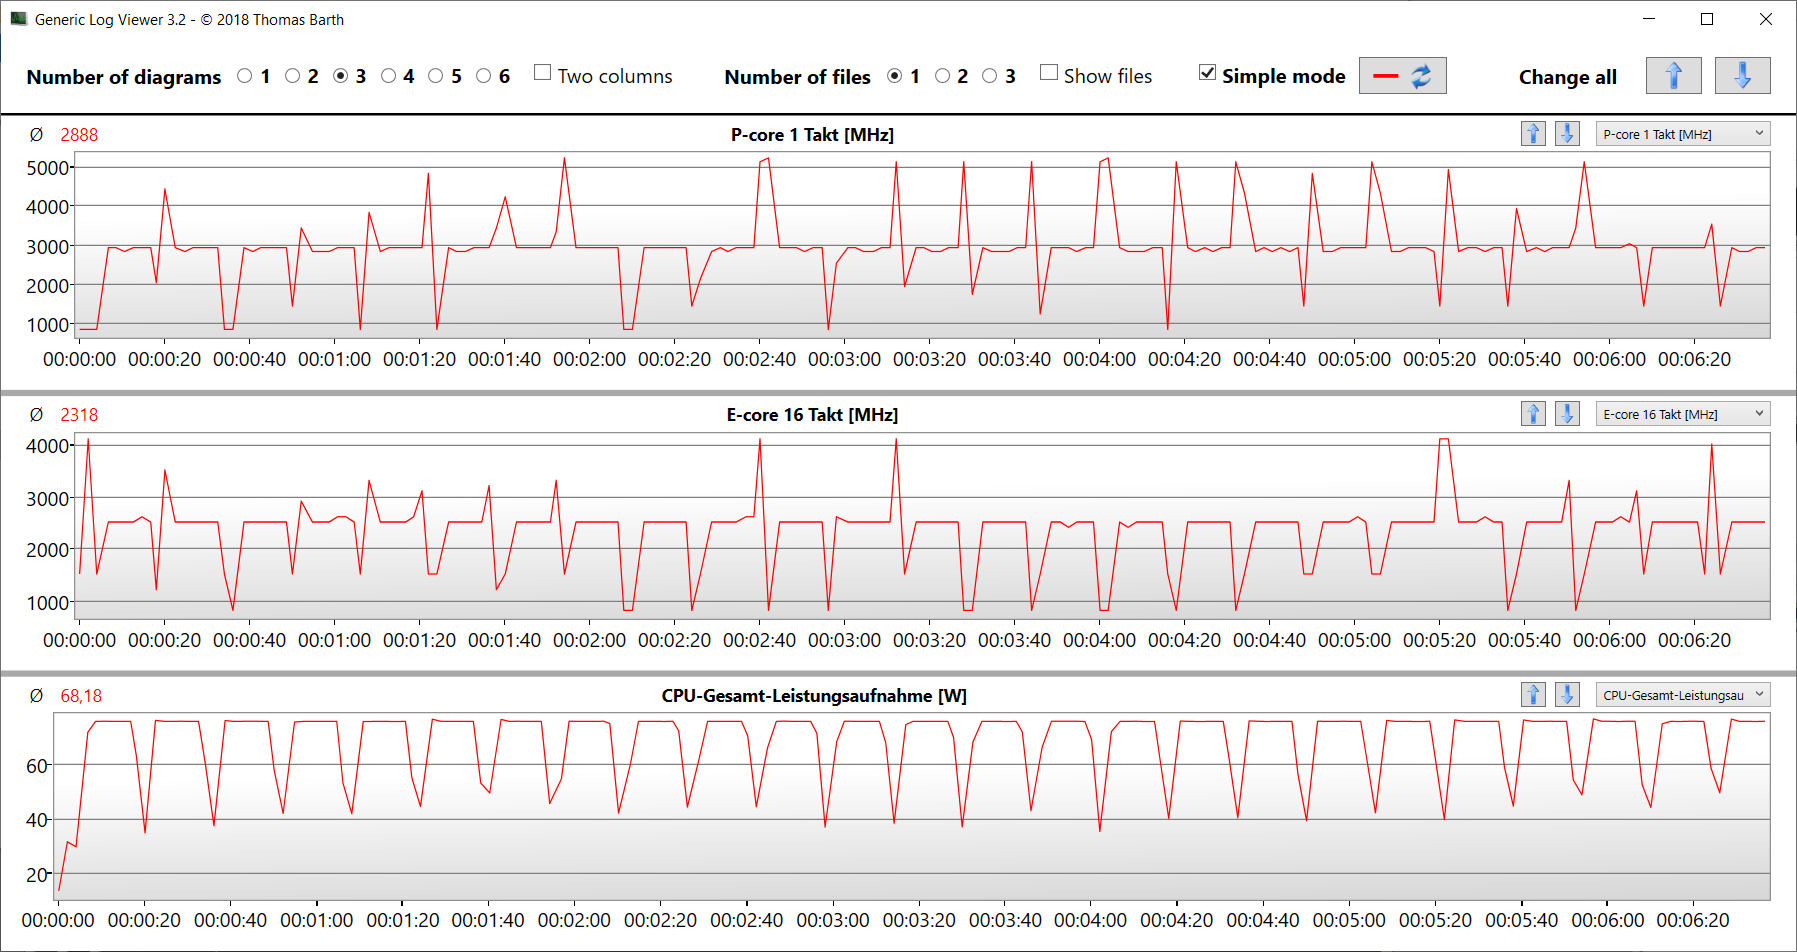
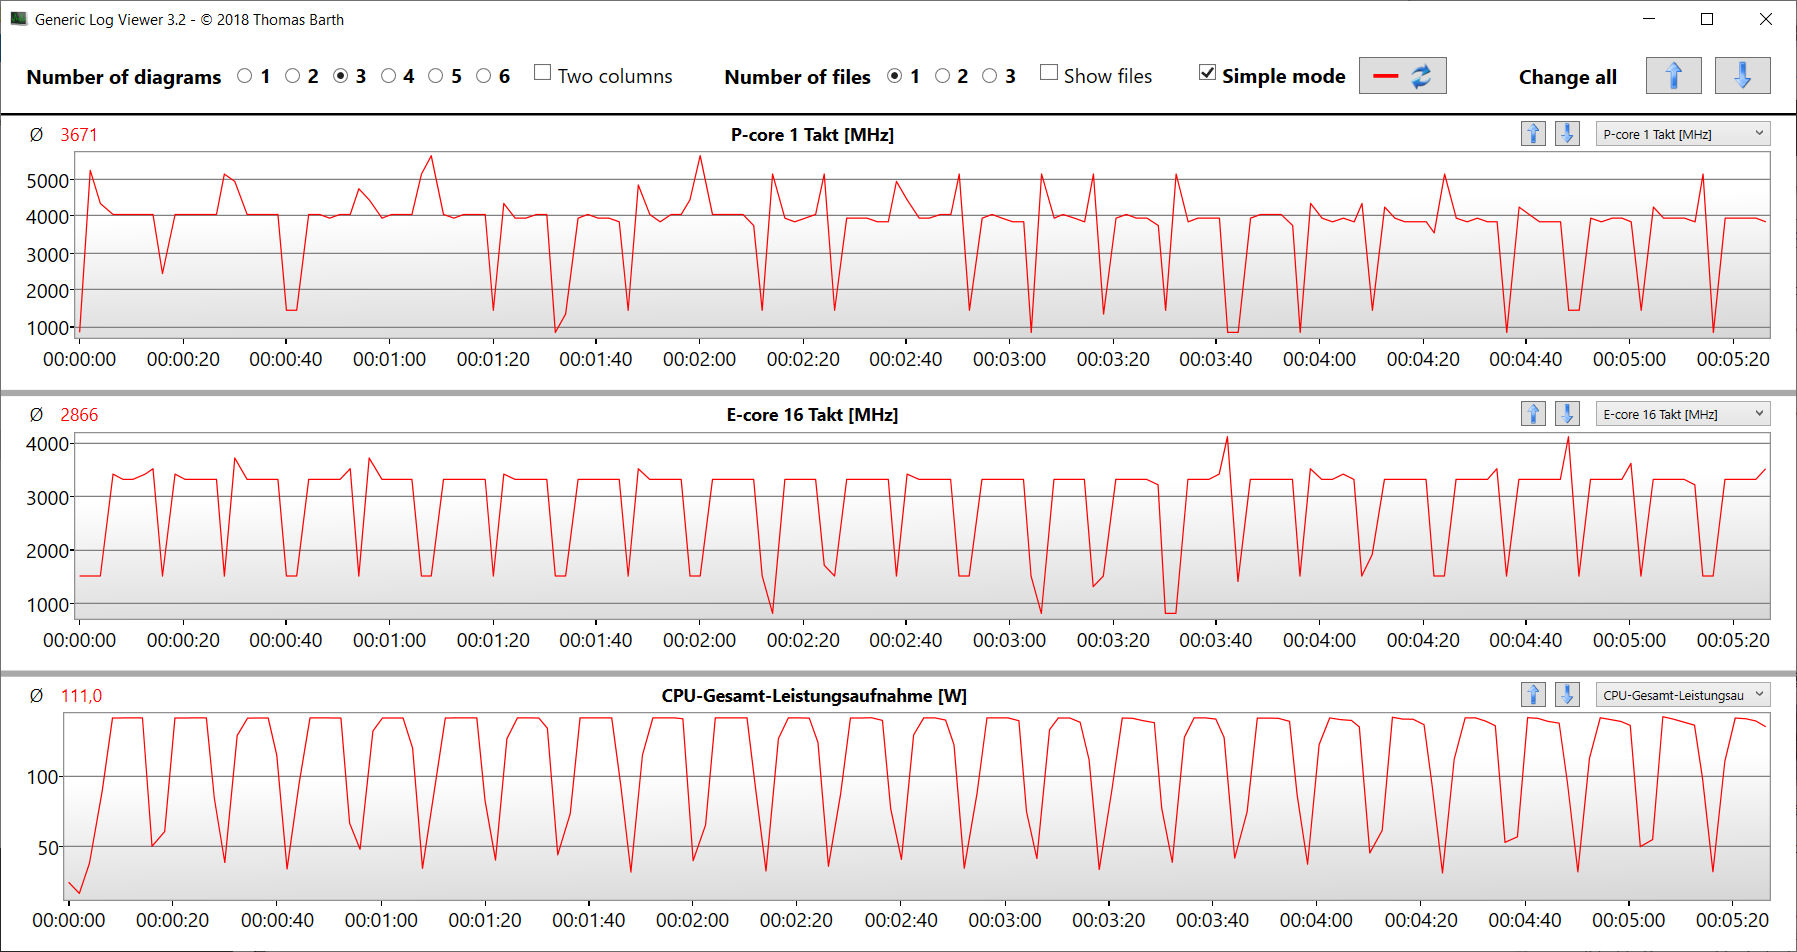
O Core i9-14900HX (Raptor Lake) com 24 núcleos de CPU (8P + 16E = 32 threads) atinge taxas de clock máximas de 5,8 GHz (P) e 4,1 GHz (E). A carga permanente de vários threads (CB15 Loop) resulta em taxas de clock estáveis - o nível depende do modo de energia selecionado.
OEnthusiast fornece valores de benchmark abaixo da média da CPU, enquanto o Overboost os eleva significativamente acima da média - isso se aplica principalmente ao desempenho multi-thread do laptop. Seu desempenho de thread único varia em um nível alto e muito semelhante ao usar os três perfis.
Mais informações sobre o Core i9 podem ser encontradas em nosso artigo de análiseAnálise da atualização do Intel Raptor Lake-HX - Core i9-14900HX com mais desempenho de núcleo único .
Cinebench R15 Multi continuous test
| CPU Performance rating - Percent | |
| Schenker XMG Fusion 15 (Early 24) | |
| Lenovo Legion Pro 5 16IRX9 | |
| Aorus 16X 2024 | |
| Média Intel Core i9-14900HX | |
| Schenker XMG Fusion 15 (Early 24) | |
| Média da turma Gaming | |
| HP Omen Transcend 16-u1095ng | |
| Alienware m16 R2 -1! | |
| Cinebench R23 | |
| Multi Core | |
| Schenker XMG Fusion 15 (Early 24) (Overboost) | |
| Lenovo Legion Pro 5 16IRX9 | |
| Média Intel Core i9-14900HX (17078 - 36249, n=37) | |
| Aorus 16X 2024 | |
| Média da turma Gaming (10488 - 42661, n=107, últimos 2 anos) | |
| Schenker XMG Fusion 15 (Early 24) | |
| HP Omen Transcend 16-u1095ng | |
| Alienware m16 R2 | |
| Single Core | |
| Schenker XMG Fusion 15 (Early 24) (Overboost) | |
| Aorus 16X 2024 | |
| HP Omen Transcend 16-u1095ng | |
| Média Intel Core i9-14900HX (1720 - 2245, n=37) | |
| Lenovo Legion Pro 5 16IRX9 | |
| Schenker XMG Fusion 15 (Early 24) | |
| Média da turma Gaming (1166 - 2415, n=107, últimos 2 anos) | |
| Alienware m16 R2 | |
| Cinebench R20 | |
| CPU (Multi Core) | |
| Schenker XMG Fusion 15 (Early 24) (Overboost) | |
| Lenovo Legion Pro 5 16IRX9 | |
| Média Intel Core i9-14900HX (6579 - 13832, n=37) | |
| Aorus 16X 2024 | |
| Média da turma Gaming (4029 - 16433, n=106, últimos 2 anos) | |
| Schenker XMG Fusion 15 (Early 24) | |
| HP Omen Transcend 16-u1095ng | |
| Alienware m16 R2 | |
| CPU (Single Core) | |
| Schenker XMG Fusion 15 (Early 24) (Overboost) | |
| Aorus 16X 2024 | |
| HP Omen Transcend 16-u1095ng | |
| Média Intel Core i9-14900HX (657 - 859, n=37) | |
| Lenovo Legion Pro 5 16IRX9 | |
| Média da turma Gaming (442 - 913, n=106, últimos 2 anos) | |
| Schenker XMG Fusion 15 (Early 24) | |
| Alienware m16 R2 | |
| Cinebench R15 | |
| CPU Multi 64Bit | |
| Lenovo Legion Pro 5 16IRX9 | |
| Schenker XMG Fusion 15 (Early 24) (Overboost) | |
| Média Intel Core i9-14900HX (3263 - 5589, n=38) | |
| Aorus 16X 2024 | |
| Média da turma Gaming (1578 - 6330, n=105, últimos 2 anos) | |
| HP Omen Transcend 16-u1095ng | |
| Schenker XMG Fusion 15 (Early 24) | |
| Alienware m16 R2 | |
| CPU Single 64Bit | |
| Aorus 16X 2024 | |
| Schenker XMG Fusion 15 (Early 24) (Overboost) | |
| Média Intel Core i9-14900HX (247 - 323, n=37) | |
| Lenovo Legion Pro 5 16IRX9 | |
| HP Omen Transcend 16-u1095ng | |
| Média da turma Gaming (188.8 - 350, n=106, últimos 2 anos) | |
| Schenker XMG Fusion 15 (Early 24) | |
| Alienware m16 R2 | |
| Blender - v2.79 BMW27 CPU | |
| HP Omen Transcend 16-u1095ng | |
| Média da turma Gaming (79 - 330, n=104, últimos 2 anos) | |
| Schenker XMG Fusion 15 (Early 24) | |
| Aorus 16X 2024 | |
| Média Intel Core i9-14900HX (91 - 206, n=37) | |
| Lenovo Legion Pro 5 16IRX9 | |
| Schenker XMG Fusion 15 (Early 24) (Overboost) | |
| 7-Zip 18.03 | |
| 7z b 4 | |
| Schenker XMG Fusion 15 (Early 24) (Overboost) | |
| Lenovo Legion Pro 5 16IRX9 | |
| Média Intel Core i9-14900HX (66769 - 136645, n=37) | |
| Aorus 16X 2024 | |
| Schenker XMG Fusion 15 (Early 24) | |
| Média da turma Gaming (33491 - 148086, n=105, últimos 2 anos) | |
| HP Omen Transcend 16-u1095ng | |
| Alienware m16 R2 | |
| 7z b 4 -mmt1 | |
| Schenker XMG Fusion 15 (Early 24) | |
| Schenker XMG Fusion 15 (Early 24) (Overboost) | |
| Aorus 16X 2024 | |
| HP Omen Transcend 16-u1095ng | |
| Média Intel Core i9-14900HX (5452 - 7545, n=37) | |
| Lenovo Legion Pro 5 16IRX9 | |
| Média da turma Gaming (4199 - 7436, n=105, últimos 2 anos) | |
| Alienware m16 R2 | |
| Geekbench 6.7 | |
| Multi-Core | |
| Lenovo Legion Pro 5 16IRX9 (6.2.1) | |
| Schenker XMG Fusion 15 (Early 24) (6.2.1, Overboost) | |
| Aorus 16X 2024 (6.2.1) | |
| Média Intel Core i9-14900HX (13158 - 19665, n=37) | |
| Schenker XMG Fusion 15 (Early 24) (6.2.1) | |
| HP Omen Transcend 16-u1095ng (6.2.1) | |
| Média da turma Gaming (6625 - 22850, n=106, últimos 2 anos) | |
| Alienware m16 R2 (6.2.1) | |
| Single-Core | |
| Schenker XMG Fusion 15 (Early 24) (6.2.1) | |
| Aorus 16X 2024 (6.2.1) | |
| Schenker XMG Fusion 15 (Early 24) (6.2.1, Overboost) | |
| Média Intel Core i9-14900HX (2419 - 3129, n=37) | |
| Lenovo Legion Pro 5 16IRX9 (6.2.1) | |
| Média da turma Gaming (1490 - 3259, n=106, últimos 2 anos) | |
| HP Omen Transcend 16-u1095ng (6.2.1) | |
| Alienware m16 R2 (6.2.1) | |
| Geekbench 5.5 | |
| Multi-Core | |
| Lenovo Legion Pro 5 16IRX9 | |
| Schenker XMG Fusion 15 (Early 24) (Overboost) | |
| Aorus 16X 2024 | |
| Média Intel Core i9-14900HX (8618 - 23194, n=37) | |
| HP Omen Transcend 16-u1095ng | |
| Média da turma Gaming (6460 - 28263, n=105, últimos 2 anos) | |
| Schenker XMG Fusion 15 (Early 24) | |
| Alienware m16 R2 | |
| Single-Core | |
| Aorus 16X 2024 | |
| Schenker XMG Fusion 15 (Early 24) (Overboost) | |
| Schenker XMG Fusion 15 (Early 24) | |
| Média Intel Core i9-14900HX (1669 - 2210, n=37) | |
| Média da turma Gaming (986 - 2474, n=105, últimos 2 anos) | |
| HP Omen Transcend 16-u1095ng | |
| Lenovo Legion Pro 5 16IRX9 | |
| Alienware m16 R2 | |
| HWBOT x265 Benchmark v2.2 - 4k Preset | |
| Schenker XMG Fusion 15 (Early 24) (Overboost) | |
| Lenovo Legion Pro 5 16IRX9 | |
| Média Intel Core i9-14900HX (16.8 - 38.9, n=37) | |
| Média da turma Gaming (11.5 - 44.4, n=105, últimos 2 anos) | |
| Aorus 16X 2024 | |
| Schenker XMG Fusion 15 (Early 24) | |
| HP Omen Transcend 16-u1095ng | |
| Alienware m16 R2 | |
| LibreOffice - 20 Documents To PDF | |
| HP Omen Transcend 16-u1095ng (6.3.4.2) | |
| Alienware m16 R2 (6.3.4.2) | |
| Média da turma Gaming (33.2 - 88.8, n=105, últimos 2 anos) | |
| Média Intel Core i9-14900HX (19 - 85.1, n=37) | |
| Lenovo Legion Pro 5 16IRX9 (6.3.4.2) | |
| Schenker XMG Fusion 15 (Early 24) (6.3.4.2) | |
| Aorus 16X 2024 (6.3.4.2) | |
| Schenker XMG Fusion 15 (Early 24) (6.3.4.2, Overboost) | |
| R Benchmark 2.5 - Overall mean | |
| Alienware m16 R2 | |
| Média da turma Gaming (0.3439 - 0.759, n=106, últimos 2 anos) | |
| HP Omen Transcend 16-u1095ng | |
| Lenovo Legion Pro 5 16IRX9 | |
| Média Intel Core i9-14900HX (0.3604 - 0.4859, n=37) | |
| Aorus 16X 2024 | |
| Schenker XMG Fusion 15 (Early 24) (Overboost) | |
| Schenker XMG Fusion 15 (Early 24) | |
* ... menor é melhor
AIDA64: FP32 Ray-Trace | FPU Julia | CPU SHA3 | CPU Queen | FPU SinJulia | FPU Mandel | CPU AES | CPU ZLib | FP64 Ray-Trace | CPU PhotoWorxx
| Performance rating | |
| Schenker XMG Fusion 15 (Early 24) | |
| Média da turma Gaming | |
| Lenovo Legion Pro 5 16IRX9 | |
| Média Intel Core i9-14900HX | |
| Aorus 16X 2024 | |
| Schenker XMG Fusion 15 (Early 24) | |
| HP Omen Transcend 16-u1095ng | |
| Alienware m16 R2 | |
| AIDA64 / FP32 Ray-Trace | |
| Média da turma Gaming (10227 - 85542, n=105, últimos 2 anos) | |
| Schenker XMG Fusion 15 (Early 24) (v6.92.6600, Overboost) | |
| Lenovo Legion Pro 5 16IRX9 (v6.92.6600) | |
| Média Intel Core i9-14900HX (13098 - 33474, n=36) | |
| Aorus 16X 2024 (v6.92.6600) | |
| Schenker XMG Fusion 15 (Early 24) (v6.92.6600) | |
| Alienware m16 R2 (v6.92.6600) | |
| HP Omen Transcend 16-u1095ng (v6.92.6600) | |
| AIDA64 / FPU Julia | |
| Média da turma Gaming (51376 - 238426, n=105, últimos 2 anos) | |
| Schenker XMG Fusion 15 (Early 24) (v6.92.6600, Overboost) | |
| Lenovo Legion Pro 5 16IRX9 (v6.92.6600) | |
| Média Intel Core i9-14900HX (67573 - 166040, n=36) | |
| Aorus 16X 2024 (v6.92.6600) | |
| Schenker XMG Fusion 15 (Early 24) (v6.92.6600) | |
| Alienware m16 R2 (v6.92.6600) | |
| HP Omen Transcend 16-u1095ng (v6.92.6600) | |
| AIDA64 / CPU SHA3 | |
| Schenker XMG Fusion 15 (Early 24) (v6.92.6600, Overboost) | |
| Média da turma Gaming (2180 - 10115, n=105, últimos 2 anos) | |
| Lenovo Legion Pro 5 16IRX9 (v6.92.6600) | |
| Média Intel Core i9-14900HX (3589 - 7979, n=36) | |
| Aorus 16X 2024 (v6.92.6600) | |
| Schenker XMG Fusion 15 (Early 24) (v6.92.6600) | |
| HP Omen Transcend 16-u1095ng (v6.92.6600) | |
| Alienware m16 R2 (v6.92.6600) | |
| AIDA64 / CPU Queen | |
| Lenovo Legion Pro 5 16IRX9 (v6.92.6600) | |
| Schenker XMG Fusion 15 (Early 24) (v6.92.6600, Overboost) | |
| Aorus 16X 2024 (v6.92.6600) | |
| Média Intel Core i9-14900HX (118405 - 148966, n=36) | |
| Schenker XMG Fusion 15 (Early 24) (v6.92.6600) | |
| HP Omen Transcend 16-u1095ng (v6.92.6600) | |
| Média da turma Gaming (49785 - 173351, n=90, últimos 2 anos) | |
| Alienware m16 R2 (v6.92.6600) | |
| AIDA64 / FPU SinJulia | |
| Schenker XMG Fusion 15 (Early 24) (v6.92.6600, Overboost) | |
| Lenovo Legion Pro 5 16IRX9 (v6.92.6600) | |
| Média Intel Core i9-14900HX (10475 - 18517, n=36) | |
| Aorus 16X 2024 (v6.92.6600) | |
| Média da turma Gaming (4424 - 33636, n=105, últimos 2 anos) | |
| Schenker XMG Fusion 15 (Early 24) (v6.92.6600) | |
| HP Omen Transcend 16-u1095ng (v6.92.6600) | |
| Alienware m16 R2 (v6.92.6600) | |
| AIDA64 / FPU Mandel | |
| Média da turma Gaming (25115 - 128721, n=105, últimos 2 anos) | |
| Schenker XMG Fusion 15 (Early 24) (v6.92.6600, Overboost) | |
| Lenovo Legion Pro 5 16IRX9 (v6.92.6600) | |
| Média Intel Core i9-14900HX (32543 - 83662, n=36) | |
| Aorus 16X 2024 (v6.92.6600) | |
| Schenker XMG Fusion 15 (Early 24) (v6.92.6600) | |
| Alienware m16 R2 (v6.92.6600) | |
| HP Omen Transcend 16-u1095ng (v6.92.6600) | |
| AIDA64 / CPU AES | |
| Schenker XMG Fusion 15 (Early 24) (v6.92.6600, Overboost) | |
| Schenker XMG Fusion 15 (Early 24) (v6.92.6600) | |
| Média Intel Core i9-14900HX (86964 - 241777, n=36) | |
| Lenovo Legion Pro 5 16IRX9 (v6.92.6600) | |
| Aorus 16X 2024 (v6.92.6600) | |
| Média da turma Gaming (39258 - 247074, n=105, últimos 2 anos) | |
| HP Omen Transcend 16-u1095ng (v6.92.6600) | |
| Alienware m16 R2 (v6.92.6600) | |
| AIDA64 / CPU ZLib | |
| Schenker XMG Fusion 15 (Early 24) (v6.92.6600, Overboost) | |
| Lenovo Legion Pro 5 16IRX9 (v6.92.6600) | |
| Média Intel Core i9-14900HX (1054 - 2292, n=36) | |
| Aorus 16X 2024 (v6.92.6600) | |
| Média da turma Gaming (574 - 2531, n=105, últimos 2 anos) | |
| Schenker XMG Fusion 15 (Early 24) (v6.92.6600) | |
| HP Omen Transcend 16-u1095ng (v6.92.6600) | |
| Alienware m16 R2 (v6.92.6600) | |
| AIDA64 / FP64 Ray-Trace | |
| Média da turma Gaming (5509 - 45446, n=105, últimos 2 anos) | |
| Schenker XMG Fusion 15 (Early 24) (v6.92.6600, Overboost) | |
| Lenovo Legion Pro 5 16IRX9 (v6.92.6600) | |
| Média Intel Core i9-14900HX (6809 - 18349, n=36) | |
| Aorus 16X 2024 (v6.92.6600) | |
| Schenker XMG Fusion 15 (Early 24) (v6.92.6600) | |
| Alienware m16 R2 (v6.92.6600) | |
| HP Omen Transcend 16-u1095ng (v6.92.6600) | |
| AIDA64 / CPU PhotoWorxx | |
| Lenovo Legion Pro 5 16IRX9 (v6.92.6600) | |
| HP Omen Transcend 16-u1095ng (v6.92.6600) | |
| Aorus 16X 2024 (v6.92.6600) | |
| Schenker XMG Fusion 15 (Early 24) (v6.92.6600, Overboost) | |
| Schenker XMG Fusion 15 (Early 24) (v6.92.6600) | |
| Média Intel Core i9-14900HX (23903 - 54702, n=36) | |
| Média da turma Gaming (12271 - 89891, n=105, últimos 2 anos) | |
| Alienware m16 R2 (v6.92.6600) | |
Desempenho do sistema
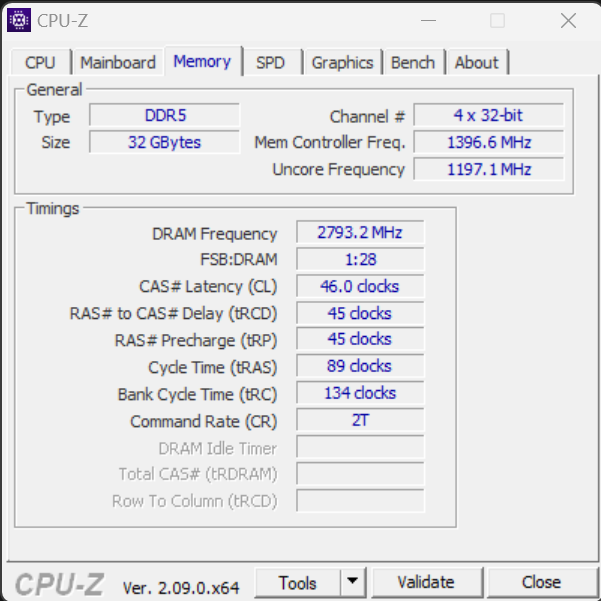
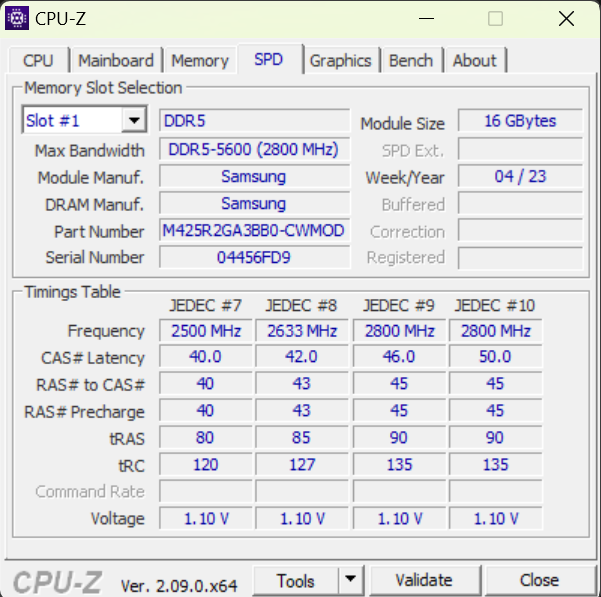
O sistema de funcionamento suave não deixa a desejar em termos de potência de computação. Os jogos, o streaming e a renderização não representam grandes desafios para o laptop. As taxas de transferência da RAM estão dentro de um nível normal para a RAM DDR5-5600. Os resultados do PCMark também foram bons.
CrossMark: Overall | Productivity | Creativity | Responsiveness
WebXPRT 3: Overall
WebXPRT 4: Overall
Mozilla Kraken 1.1: Total
| PCMark 10 / Score | |
| Lenovo Legion Pro 5 16IRX9 | |
| Schenker XMG Fusion 15 (Early 24) | |
| Média da turma Gaming (5828 - 12414, n=93, últimos 2 anos) | |
| Aorus 16X 2024 | |
| Média Intel Core i9-14900HX, NVIDIA GeForce RTX 4070 Laptop GPU (7768 - 8550, n=8) | |
| HP Omen Transcend 16-u1095ng | |
| Alienware m16 R2 | |
| PCMark 10 / Essentials | |
| Schenker XMG Fusion 15 (Early 24) | |
| Lenovo Legion Pro 5 16IRX9 | |
| Aorus 16X 2024 | |
| Média Intel Core i9-14900HX, NVIDIA GeForce RTX 4070 Laptop GPU (10104 - 11815, n=8) | |
| Média da turma Gaming (8810 - 11935, n=97, últimos 2 anos) | |
| HP Omen Transcend 16-u1095ng | |
| Alienware m16 R2 | |
| PCMark 10 / Productivity | |
| Média da turma Gaming (6845 - 25323, n=95, últimos 2 anos) | |
| Aorus 16X 2024 | |
| Schenker XMG Fusion 15 (Early 24) | |
| Média Intel Core i9-14900HX, NVIDIA GeForce RTX 4070 Laptop GPU (9577 - 11103, n=8) | |
| HP Omen Transcend 16-u1095ng | |
| Lenovo Legion Pro 5 16IRX9 | |
| Alienware m16 R2 | |
| PCMark 10 / Digital Content Creation | |
| Lenovo Legion Pro 5 16IRX9 | |
| Média da turma Gaming (7602 - 19954, n=95, últimos 2 anos) | |
| Schenker XMG Fusion 15 (Early 24) | |
| Média Intel Core i9-14900HX, NVIDIA GeForce RTX 4070 Laptop GPU (12114 - 14827, n=8) | |
| Aorus 16X 2024 | |
| Alienware m16 R2 | |
| HP Omen Transcend 16-u1095ng | |
| CrossMark / Overall | |
| Aorus 16X 2024 | |
| Schenker XMG Fusion 15 (Early 24) | |
| Média Intel Core i9-14900HX, NVIDIA GeForce RTX 4070 Laptop GPU (2002 - 2312, n=7) | |
| Lenovo Legion Pro 5 16IRX9 | |
| Média da turma Gaming (1366 - 2409, n=94, últimos 2 anos) | |
| Alienware m16 R2 | |
| CrossMark / Productivity | |
| Aorus 16X 2024 | |
| Schenker XMG Fusion 15 (Early 24) | |
| Média Intel Core i9-14900HX, NVIDIA GeForce RTX 4070 Laptop GPU (1827 - 2191, n=7) | |
| Média da turma Gaming (1386 - 2254, n=94, últimos 2 anos) | |
| Lenovo Legion Pro 5 16IRX9 | |
| Alienware m16 R2 | |
| CrossMark / Creativity | |
| Aorus 16X 2024 | |
| Média Intel Core i9-14900HX, NVIDIA GeForce RTX 4070 Laptop GPU (2258 - 2458, n=7) | |
| Schenker XMG Fusion 15 (Early 24) | |
| Lenovo Legion Pro 5 16IRX9 | |
| Média da turma Gaming (1343 - 2786, n=94, últimos 2 anos) | |
| Alienware m16 R2 | |
| CrossMark / Responsiveness | |
| Aorus 16X 2024 | |
| Média Intel Core i9-14900HX, NVIDIA GeForce RTX 4070 Laptop GPU (1734 - 2330, n=7) | |
| Schenker XMG Fusion 15 (Early 24) | |
| Lenovo Legion Pro 5 16IRX9 | |
| Média da turma Gaming (1226 - 2334, n=94, últimos 2 anos) | |
| Alienware m16 R2 | |
| WebXPRT 3 / Overall | |
| HP Omen Transcend 16-u1095ng | |
| Schenker XMG Fusion 15 (Early 24) | |
| Aorus 16X 2024 | |
| Lenovo Legion Pro 5 16IRX9 | |
| Média Intel Core i9-14900HX, NVIDIA GeForce RTX 4070 Laptop GPU (269 - 342, n=8) | |
| Média da turma Gaming (220 - 532, n=98, últimos 2 anos) | |
| Alienware m16 R2 | |
| WebXPRT 4 / Overall | |
| Schenker XMG Fusion 15 (Early 24) | |
| Média Intel Core i9-14900HX, NVIDIA GeForce RTX 4070 Laptop GPU (291 - 304, n=6) | |
| Lenovo Legion Pro 5 16IRX9 | |
| Média da turma Gaming (165 - 354, n=98, últimos 2 anos) | |
| Alienware m16 R2 | |
| Mozilla Kraken 1.1 / Total | |
| Alienware m16 R2 | |
| Média da turma Gaming (391 - 590, n=100, últimos 2 anos) | |
| Lenovo Legion Pro 5 16IRX9 | |
| Média Intel Core i9-14900HX, NVIDIA GeForce RTX 4070 Laptop GPU (431 - 469, n=8) | |
| HP Omen Transcend 16-u1095ng | |
| Aorus 16X 2024 | |
| Schenker XMG Fusion 15 (Early 24) | |
* ... menor é melhor
| PCMark 10 Score | 8522 pontos | |
Ajuda | ||
| AIDA64 / Memory Copy | |
| Lenovo Legion Pro 5 16IRX9 | |
| Aorus 16X 2024 | |
| HP Omen Transcend 16-u1095ng | |
| Schenker XMG Fusion 15 (Early 24) | |
| Média Intel Core i9-14900HX (38028 - 83392, n=36) | |
| Média da turma Gaming (21750 - 129946, n=105, últimos 2 anos) | |
| Alienware m16 R2 | |
| AIDA64 / Memory Read | |
| Aorus 16X 2024 | |
| Lenovo Legion Pro 5 16IRX9 | |
| Schenker XMG Fusion 15 (Early 24) | |
| HP Omen Transcend 16-u1095ng | |
| Média Intel Core i9-14900HX (43306 - 87568, n=36) | |
| Alienware m16 R2 | |
| Média da turma Gaming (22956 - 118858, n=105, últimos 2 anos) | |
| AIDA64 / Memory Write | |
| HP Omen Transcend 16-u1095ng | |
| Aorus 16X 2024 | |
| Lenovo Legion Pro 5 16IRX9 | |
| Média da turma Gaming (22297 - 135096, n=105, últimos 2 anos) | |
| Média Intel Core i9-14900HX (37146 - 80589, n=36) | |
| Schenker XMG Fusion 15 (Early 24) | |
| Alienware m16 R2 | |
| AIDA64 / Memory Latency | |
| Alienware m16 R2 | |
| Média da turma Gaming (75.3 - 259, n=105, últimos 2 anos) | |
| HP Omen Transcend 16-u1095ng | |
| Média Intel Core i9-14900HX (76.1 - 105, n=36) | |
| Lenovo Legion Pro 5 16IRX9 | |
| Schenker XMG Fusion 15 (Early 24) | |
| Aorus 16X 2024 | |
* ... menor é melhor
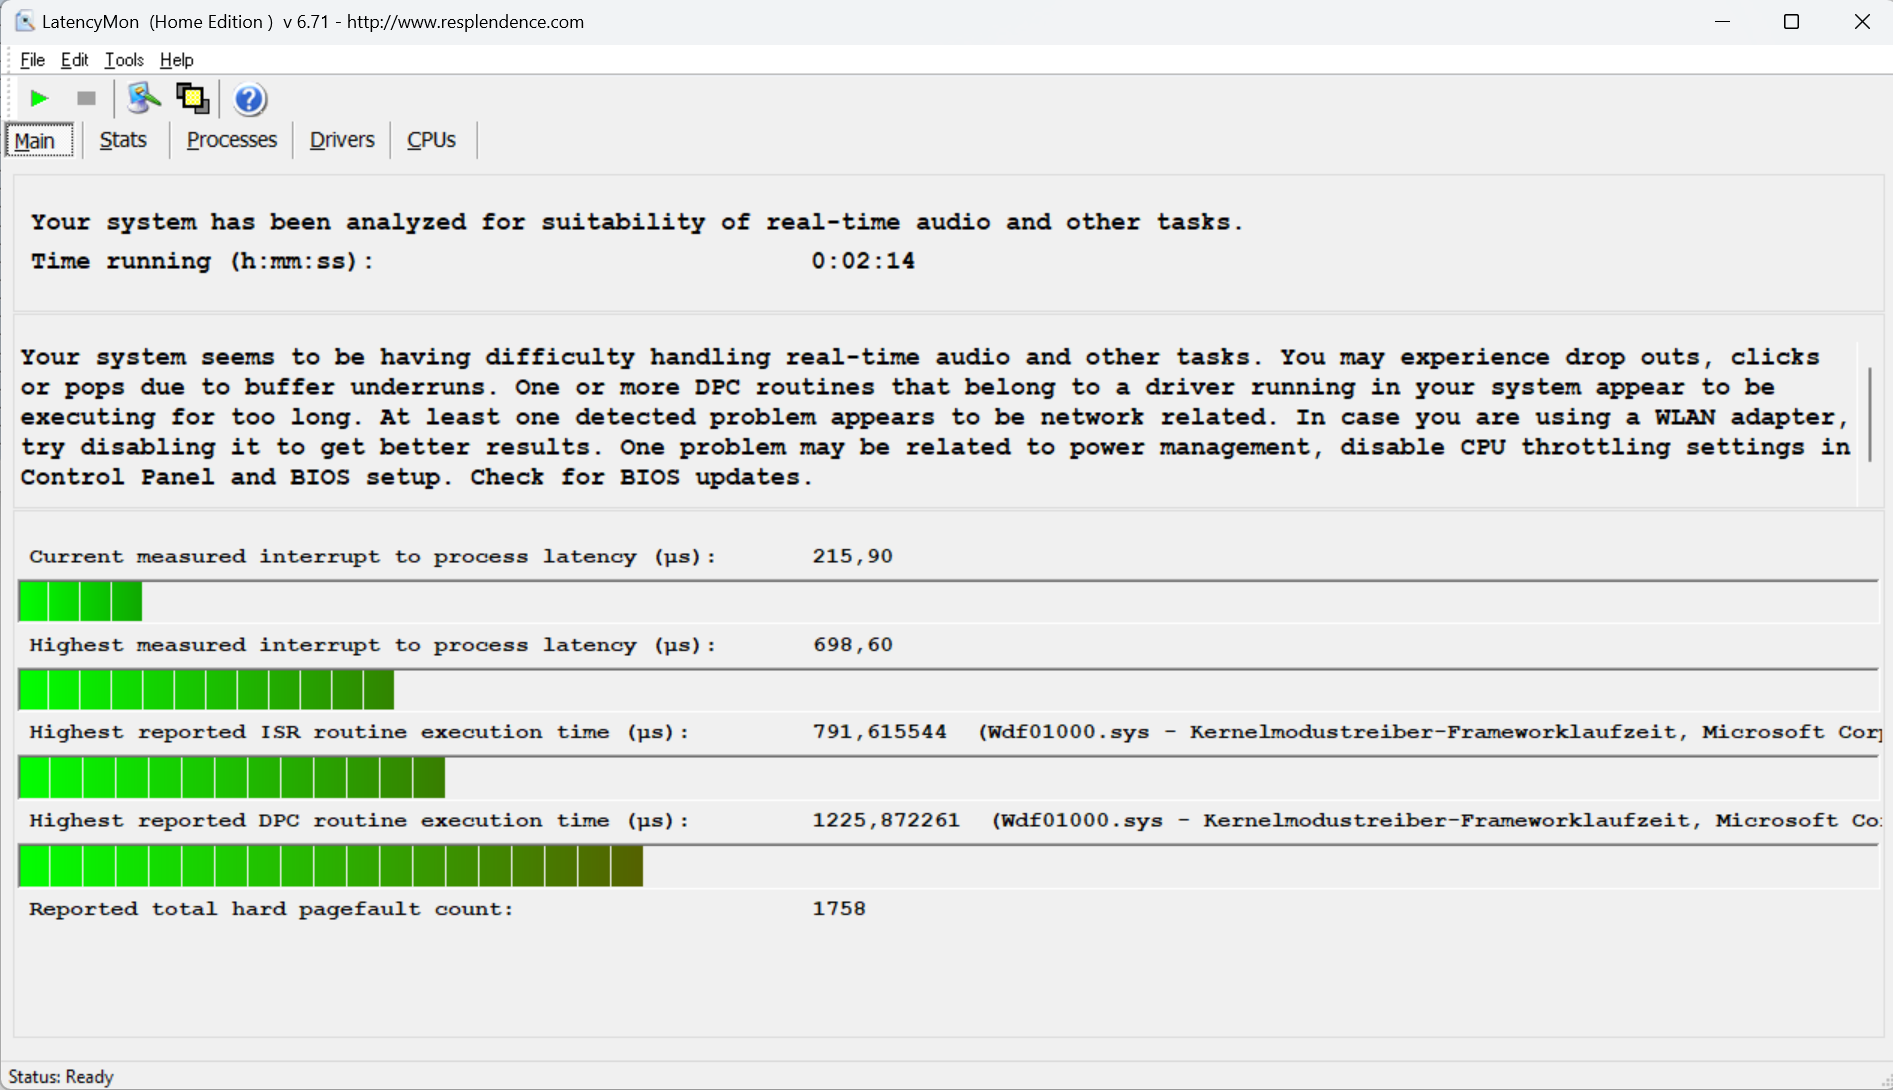
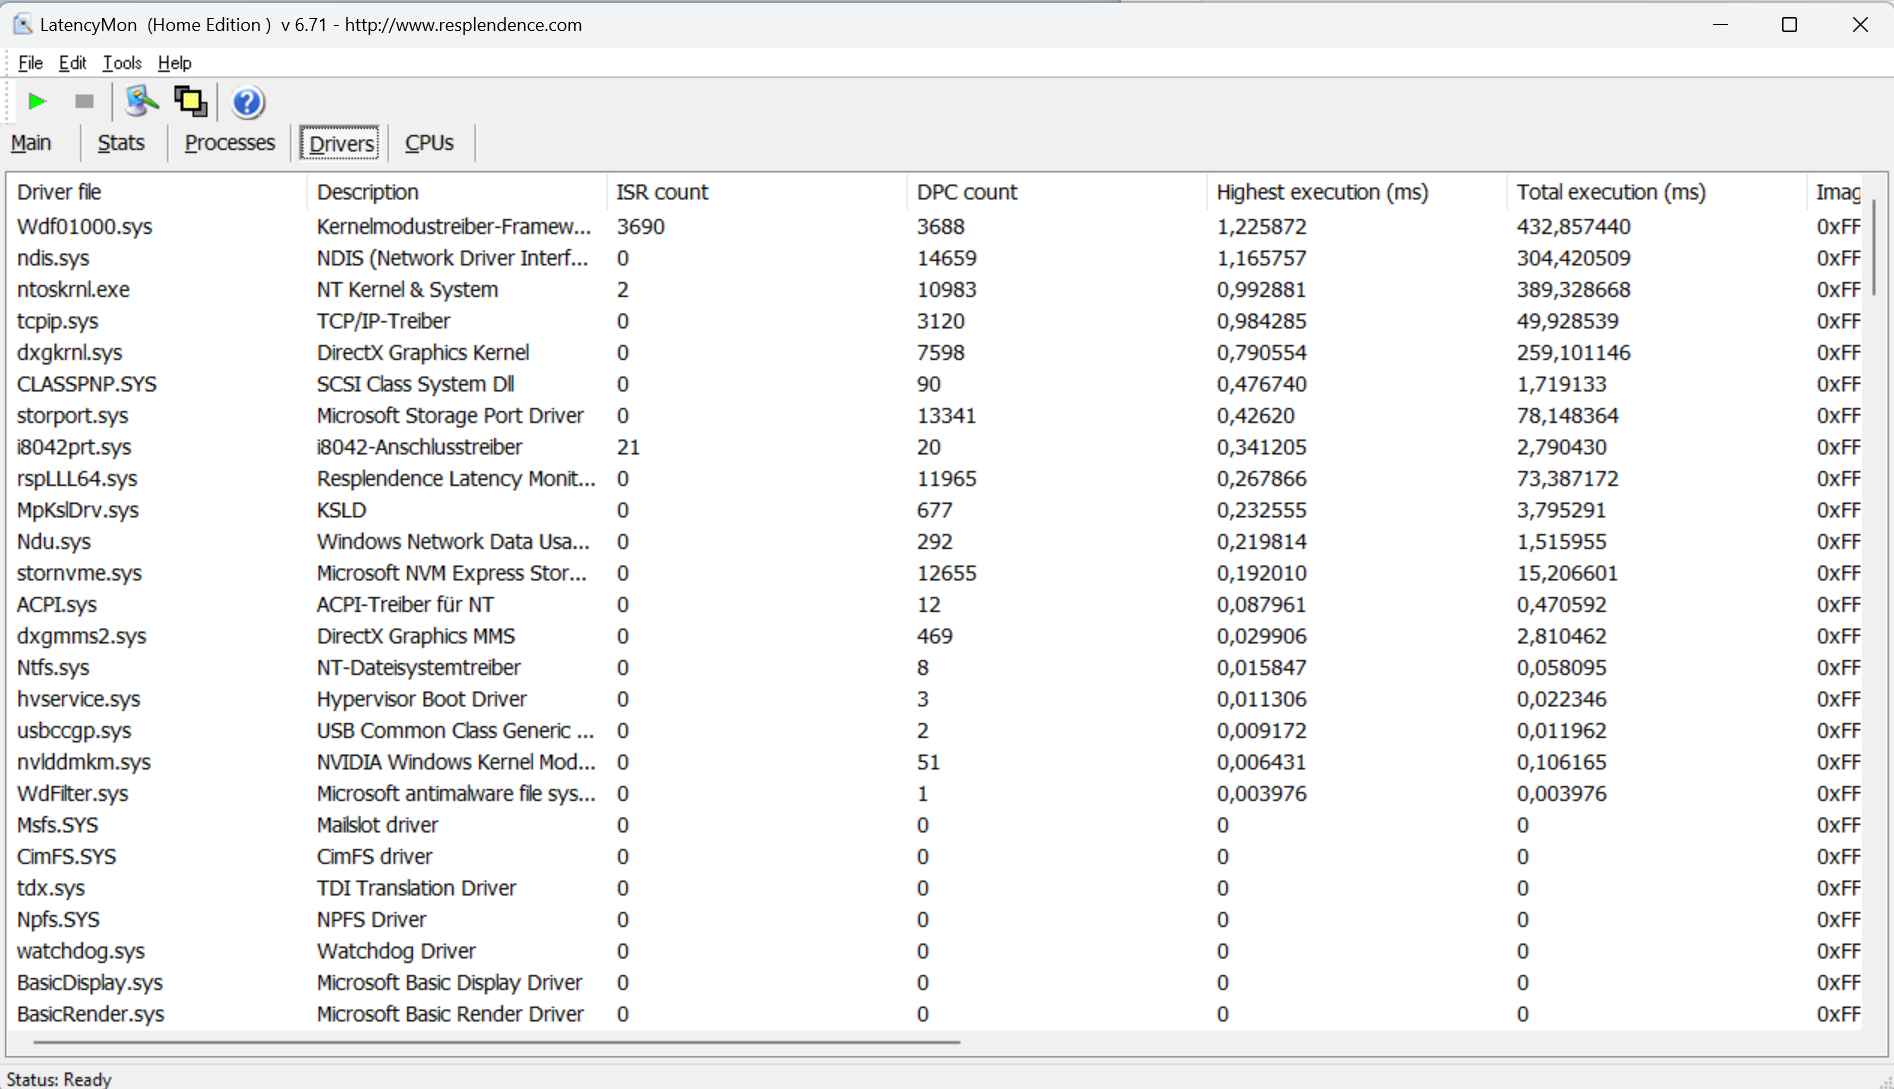
Latências de DPC
O teste padronizado do monitor de latência (navegação na Web, reprodução de vídeo 4k, alta carga do Prime95) revelou algumas anomalias. O sistema não parece ser adequado para edição de vídeo e áudio em tempo real. Futuras atualizações de software podem levar a melhorias ou até mesmo a deteriorações.
| DPC Latencies / LatencyMon - interrupt to process latency (max), Web, Youtube, Prime95 | |
| Alienware m16 R2 | |
| HP Omen Transcend 16-u1095ng | |
| Aorus 16X 2024 | |
| Lenovo Legion Pro 5 16IRX9 | |
| Schenker XMG Fusion 15 (Early 24) | |
* ... menor é melhor
Dispositivos de armazenamento
O Fusion pode acomodar um total de dois SSDs PCIe-4 no formato M.2-2280. Há suporte para RAID-0/1. O SSD Samsung (1 TB) do nosso dispositivo de teste apresentou excelentes taxas de dados. Ponto positivo: Não notamos nenhum estrangulamento térmico.

| Drive Performance rating - Percent | |
| Schenker XMG Fusion 15 (Early 24) | |
| Média Samsung 990 Pro 1 TB | |
| Lenovo Legion Pro 5 16IRX9 | |
| Aorus 16X 2024 | |
| Alienware m16 R2 | |
| Média da turma Gaming | |
| HP Omen Transcend 16-u1095ng | |
* ... menor é melhor
Reading continuous performance: DiskSpd Read Loop, Queue Depth 8
Placa de vídeo
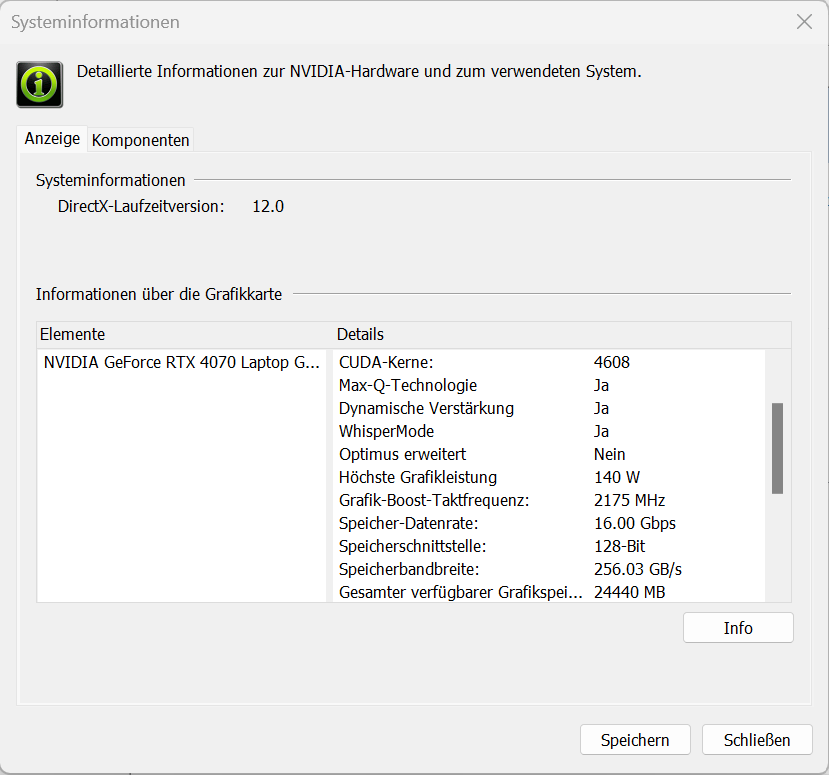
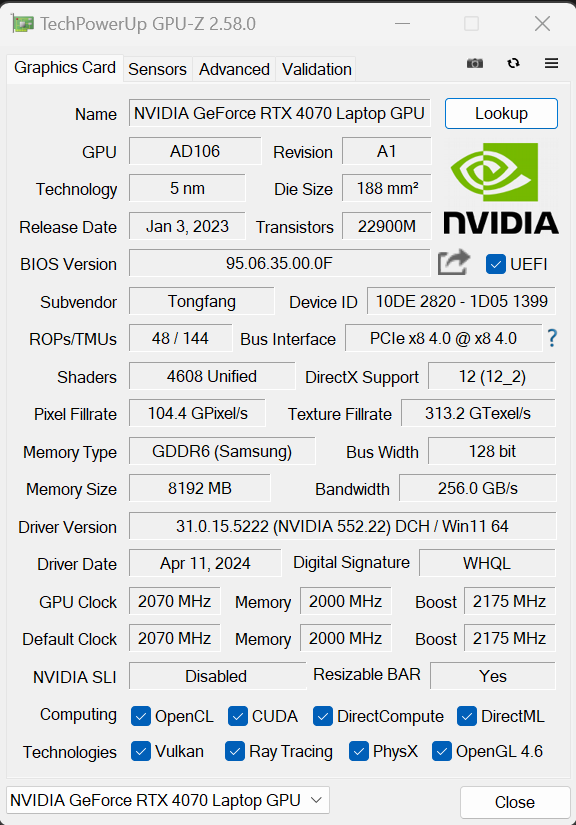
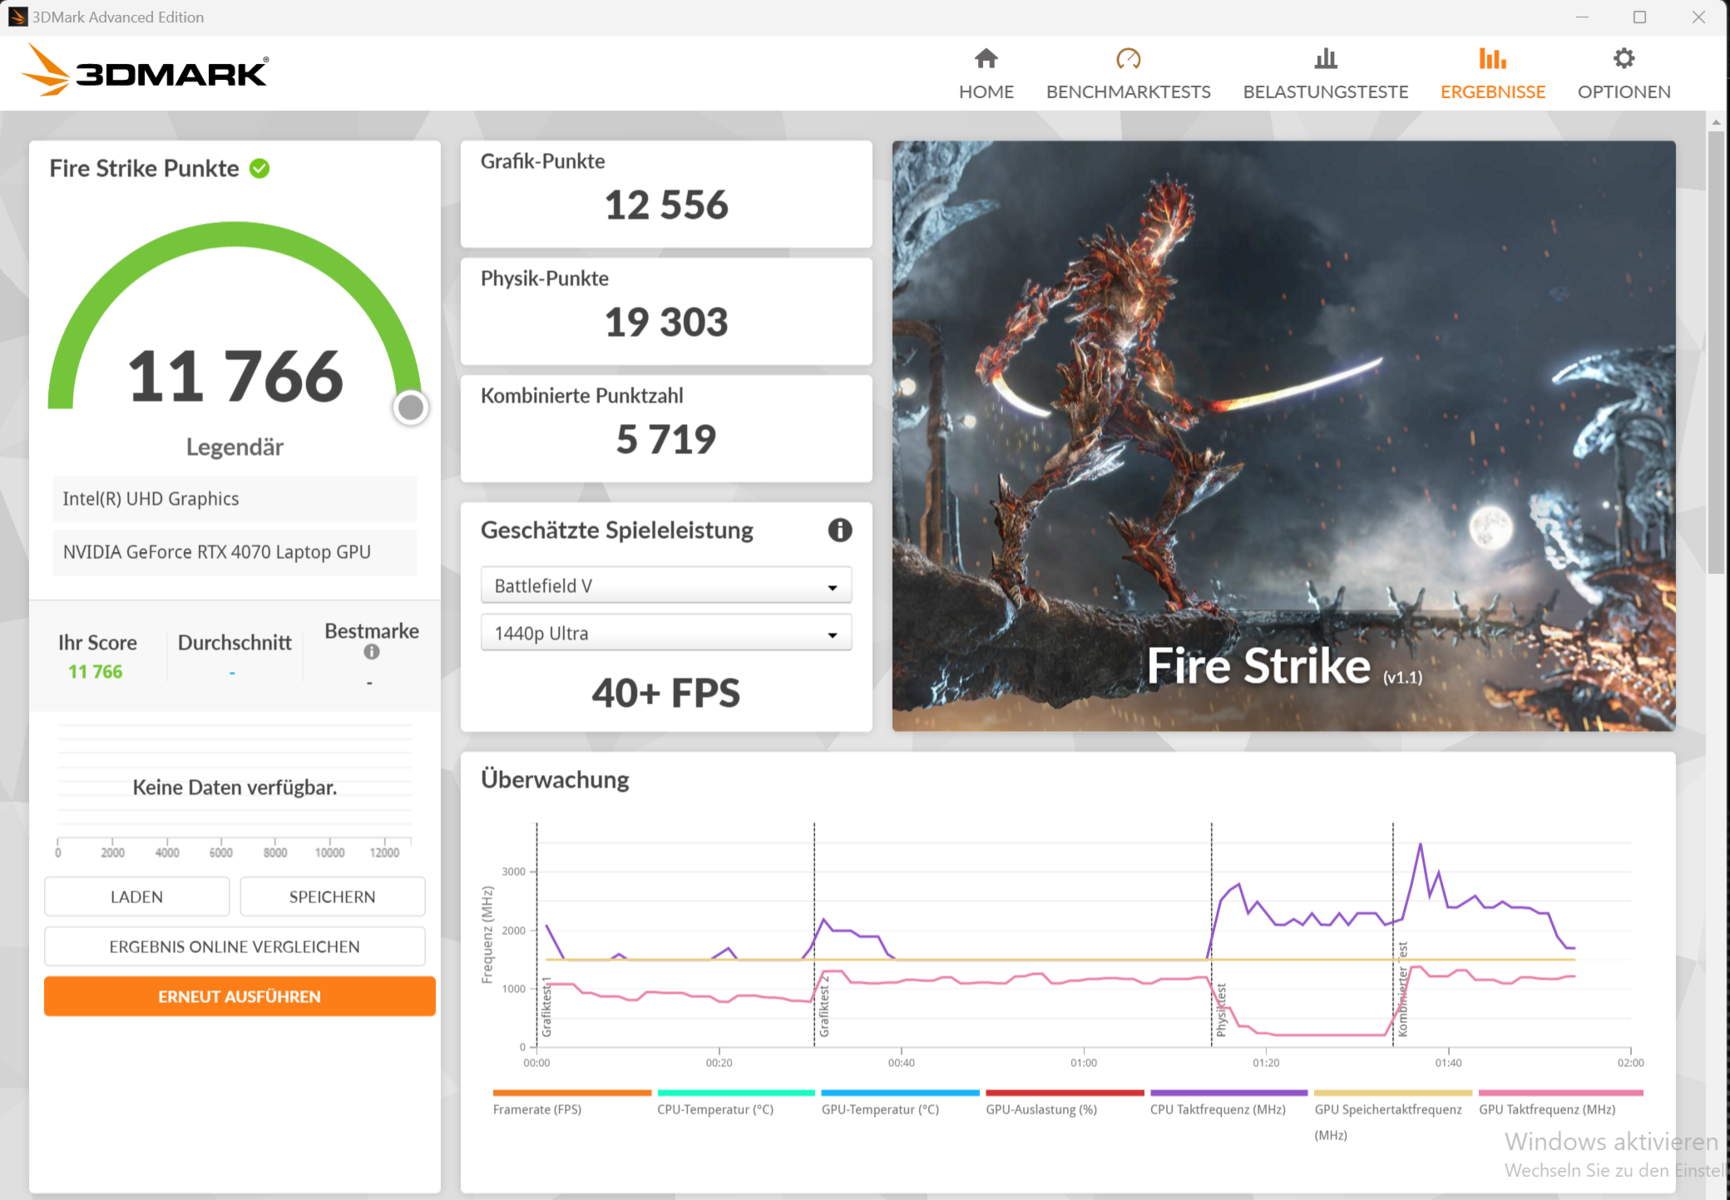
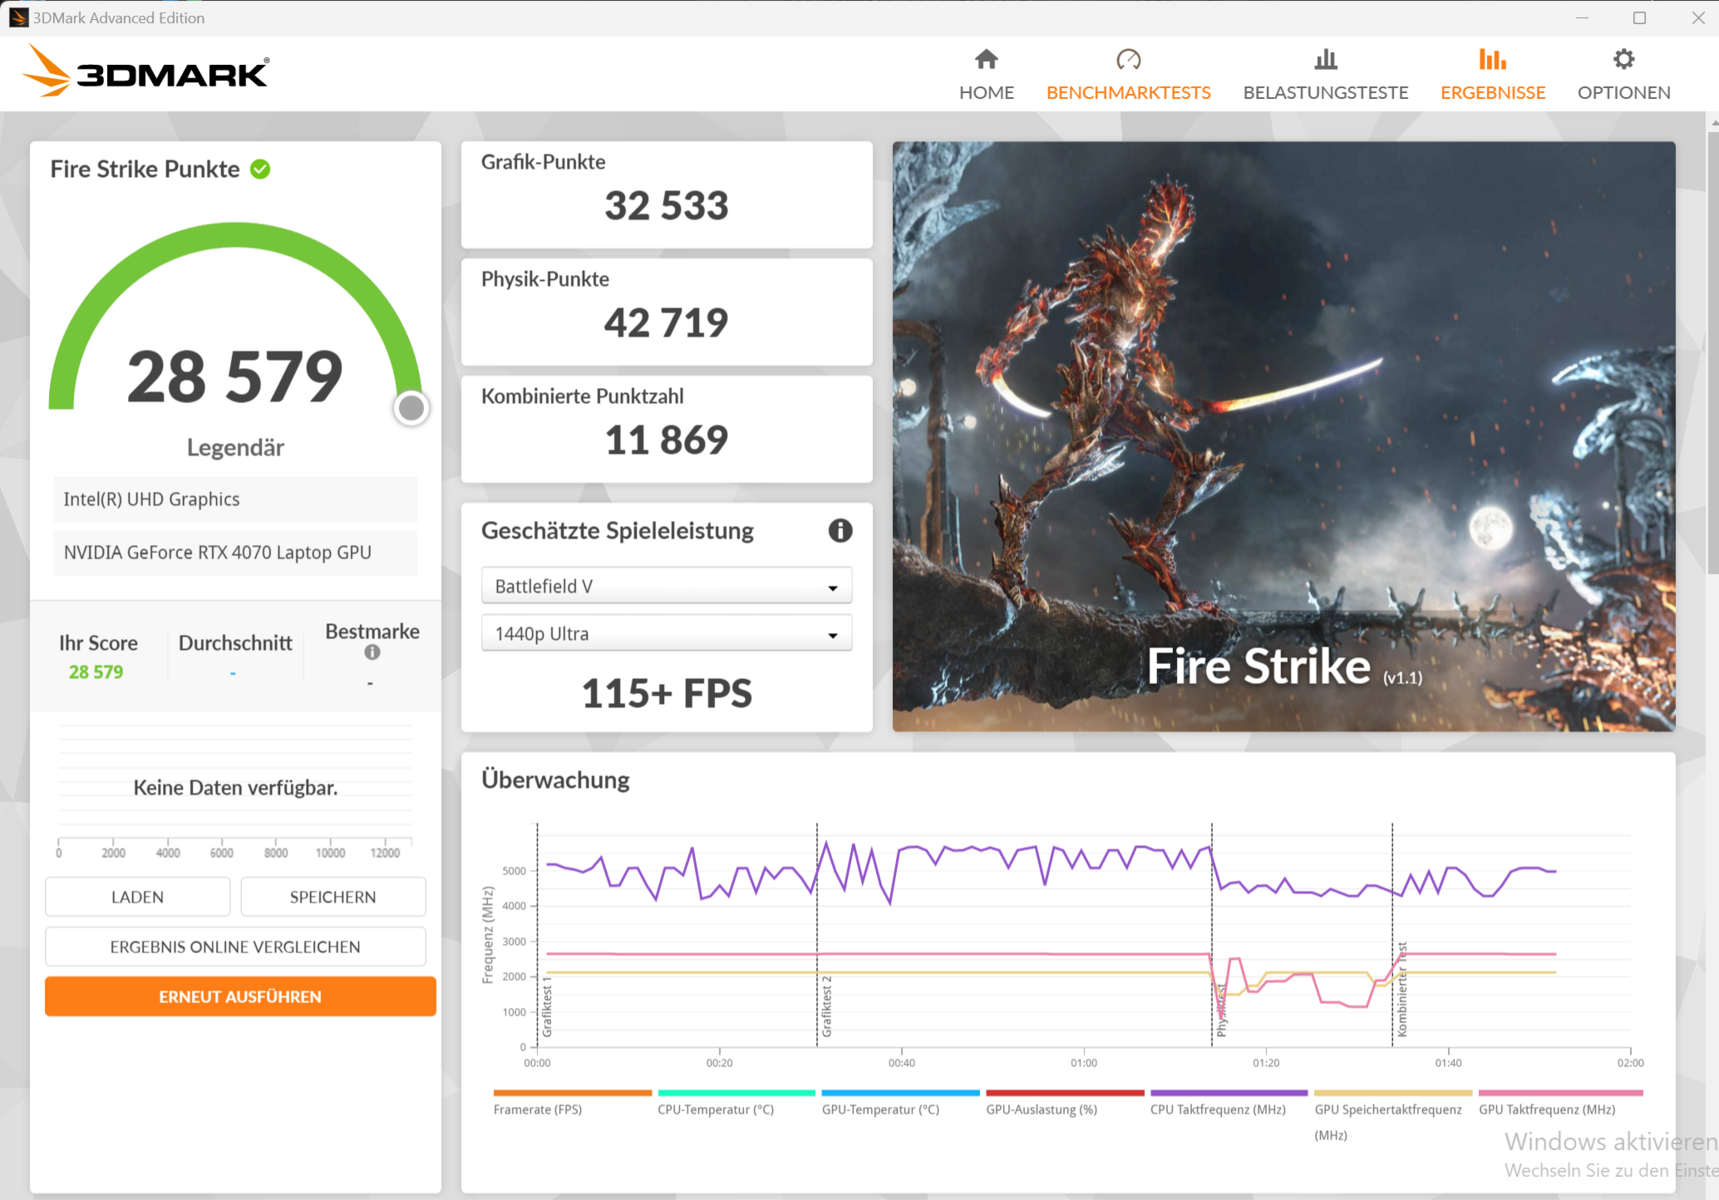
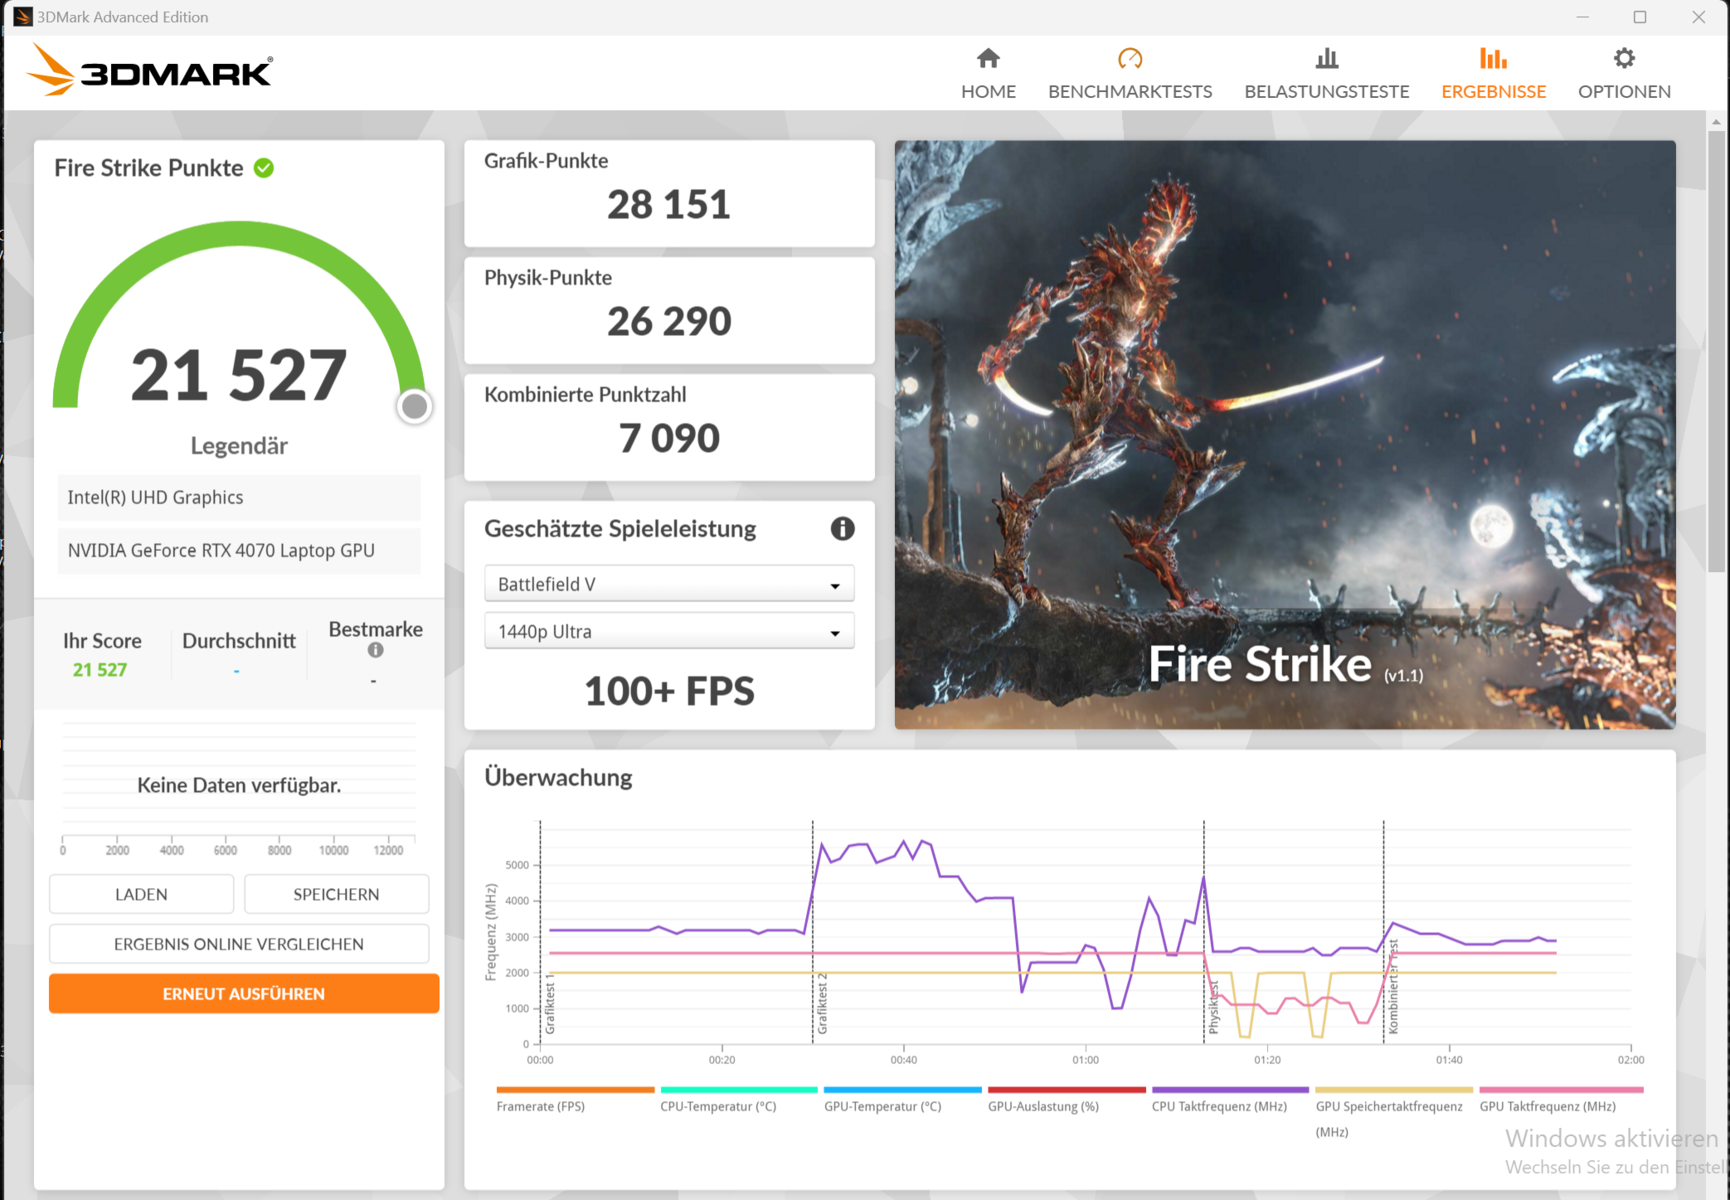
Schenker permitiu que o laptop GeForce RTX 4070 do laptop um TGP máximo de 140 watts (115 watts + 25 watts de Dynamic Boost) - mais do que isso não é recomendado pela Nvidia. A GPU tem acesso a 8 GB de VRAM (GDDR6), o que é um pouco baixo para as demandas atuais. Os benchmarks apresentaram resultados acima da média da RTX-4070(Enthusiast) e o Overboost resultou apenas em uma pequena vantagem. A alternância entre a dGPU e o Optimus requer uma reinicialização.

| 3DMark Performance rating - Percent | |
| Média da turma Gaming | |
| Schenker XMG Fusion 15 (Early 24) | |
| Lenovo Legion Pro 5 16IRX9 | |
| Schenker XMG Fusion 15 (Early 24) | |
| Alienware m16 R2 | |
| Aorus 16X 2024 | |
| Média NVIDIA GeForce RTX 4070 Laptop GPU | |
| HP Omen Transcend 16-u1095ng | |
| 3DMark 11 - 1280x720 Performance GPU | |
| Média da turma Gaming (21841 - 80022, n=104, últimos 2 anos) | |
| Schenker XMG Fusion 15 (Early 24) (Overboost) | |
| Schenker XMG Fusion 15 (Early 24) | |
| Lenovo Legion Pro 5 16IRX9 | |
| Alienware m16 R2 | |
| Aorus 16X 2024 | |
| Média NVIDIA GeForce RTX 4070 Laptop GPU (24229 - 46434, n=67) | |
| HP Omen Transcend 16-u1095ng | |
| 3DMark | |
| 1920x1080 Fire Strike Graphics | |
| Média da turma Gaming (12242 - 62849, n=115, últimos 2 anos) | |
| Schenker XMG Fusion 15 (Early 24) (Overboost) | |
| Schenker XMG Fusion 15 (Early 24) | |
| Lenovo Legion Pro 5 16IRX9 | |
| Alienware m16 R2 | |
| Aorus 16X 2024 | |
| Média NVIDIA GeForce RTX 4070 Laptop GPU (12242 - 33451, n=71) | |
| HP Omen Transcend 16-u1095ng | |
| 2560x1440 Time Spy Graphics | |
| Média da turma Gaming (5012 - 26212, n=115, últimos 2 anos) | |
| Schenker XMG Fusion 15 (Early 24) (Overboost) | |
| Lenovo Legion Pro 5 16IRX9 | |
| Alienware m16 R2 | |
| Schenker XMG Fusion 15 (Early 24) | |
| Aorus 16X 2024 | |
| Média NVIDIA GeForce RTX 4070 Laptop GPU (5012 - 13391, n=70) | |
| HP Omen Transcend 16-u1095ng | |
| 3DMark 06 Standard Score | 63892 pontos | |
| 3DMark 11 Performance | 36008 pontos | |
| 3DMark Fire Strike Score | 26661 pontos | |
| 3DMark Time Spy Score | 13067 pontos | |
Ajuda | ||
| Geekbench 5.5 | |
| OpenCL Score | |
| Média da turma Gaming (80702 - 277970, n=101, últimos 2 anos) | |
| Schenker XMG Fusion 15 (Early 24) | |
| Schenker XMG Fusion 15 (Early 24) (Overboost) | |
| Aorus 16X 2024 | |
| HP Omen Transcend 16-u1095ng | |
| Média NVIDIA GeForce RTX 4070 Laptop GPU (17391 - 132836, n=68) | |
| Lenovo Legion Pro 5 16IRX9 | |
| Alienware m16 R2 | |
| Vulkan Score 5.5 | |
| Média da turma Gaming (18857 - 246759, n=76, últimos 2 anos) | |
| Schenker XMG Fusion 15 (Early 24) (Overboost) | |
| Aorus 16X 2024 | |
| Schenker XMG Fusion 15 (Early 24) | |
| Média NVIDIA GeForce RTX 4070 Laptop GPU (28158 - 102618, n=37) | |
| Alienware m16 R2 | |
| Lenovo Legion Pro 5 16IRX9 | |
| Geekbench 6.7 | |
| GPU OpenCL | |
| Média da turma Gaming (67235 - 253130, n=103, últimos 2 anos) | |
| Schenker XMG Fusion 15 (Early 24) (6.2.1) | |
| Schenker XMG Fusion 15 (Early 24) (6.2.1, Overboost) | |
| HP Omen Transcend 16-u1095ng (6.2.1) | |
| Aorus 16X 2024 (6.2.1) | |
| Lenovo Legion Pro 5 16IRX9 (6.2.1) | |
| Média NVIDIA GeForce RTX 4070 Laptop GPU (85488 - 129836, n=45) | |
| Alienware m16 R2 (6.2.1) | |
| GPU Vulkan | |
| Schenker XMG Fusion 15 (Early 24) (6.2.1, Overboost) | |
| Média da turma Gaming (7562 - 244348, n=59, últimos 2 anos) | |
| Alienware m16 R2 (6.2.1) | |
| Lenovo Legion Pro 5 16IRX9 (6.2.1) | |
| Média NVIDIA GeForce RTX 4070 Laptop GPU (89638 - 120033, n=24) | |
| Schenker XMG Fusion 15 (Early 24) (6.2.1) | |
| Aorus 16X 2024 (6.2.1) | |
| V-Ray 5 Benchmark | |
| GPU RTX | |
| Média da turma Gaming (1146 - 4363, n=33, últimos 2 anos) | |
| Lenovo Legion Pro 5 16IRX9 (5.0.1) | |
| Schenker XMG Fusion 15 (Early 24) (5.0.1, Overboost) | |
| Schenker XMG Fusion 15 (Early 24) (5.0.1) | |
| Alienware m16 R2 (5.0.1) | |
| Aorus 16X 2024 (5.0.1) | |
| Média NVIDIA GeForce RTX 4070 Laptop GPU (171 - 1872, n=39) | |
| GPU CUDA | |
| Média da turma Gaming (887 - 3288, n=33, últimos 2 anos) | |
| Lenovo Legion Pro 5 16IRX9 (5.0.1) | |
| Schenker XMG Fusion 15 (Early 24) (5.0.1, Overboost) | |
| Schenker XMG Fusion 15 (Early 24) (5.0.1) | |
| Alienware m16 R2 (5.0.1) | |
| Aorus 16X 2024 (5.0.1) | |
| Média NVIDIA GeForce RTX 4070 Laptop GPU (120 - 1356, n=39) | |
| CPU | |
| Schenker XMG Fusion 15 (Early 24) (5.0.1, Overboost) | |
| Média da turma Gaming (5864 - 30302, n=32, últimos 2 anos) | |
| Lenovo Legion Pro 5 16IRX9 (5.0.1) | |
| Aorus 16X 2024 (5.0.1) | |
| Schenker XMG Fusion 15 (Early 24) (5.0.1) | |
| Média NVIDIA GeForce RTX 4070 Laptop GPU (9339 - 20388, n=38) | |
| Alienware m16 R2 (5.0.1) | |
| V-Ray Benchmark Next 4.10 | |
| GPU | |
| Média da turma Gaming (427 - 1627, n=99, últimos 2 anos) | |
| Lenovo Legion Pro 5 16IRX9 (v4.10.07 ) | |
| Schenker XMG Fusion 15 (Early 24) (v4.10.07, Overboost) | |
| Média NVIDIA GeForce RTX 4070 Laptop GPU (434 - 686, n=52) | |
| Schenker XMG Fusion 15 (Early 24) (v4.10.07 ) | |
| HP Omen Transcend 16-u1095ng (v4.10.07 ) | |
| Aorus 16X 2024 (v4.10.07 ) | |
| CPU | |
| Schenker XMG Fusion 15 (Early 24) (v4.10.07, Overboost) | |
| Lenovo Legion Pro 5 16IRX9 (v4.10.07 ) | |
| Média da turma Gaming (10048 - 45327, n=97, últimos 2 anos) | |
| Aorus 16X 2024 (v4.10.07 ) | |
| Schenker XMG Fusion 15 (Early 24) (v4.10.07 ) | |
| HP Omen Transcend 16-u1095ng (v4.10.07 ) | |
| Média NVIDIA GeForce RTX 4070 Laptop GPU (12638 - 35173, n=52) | |
* ... menor é melhor
Desempenho em jogos
O hardware foi projetado para jogos QHD em configurações altas ou máximas. Ao usar o DLSS 3 e o Frame Generation, o senhor pode jogar em resoluções mais altas e configurações máximas, incluindo ray tracing - mas somente com jogos compatíveis com essas funções. Observamos taxas de quadros acima da média da RTX-4070(Enthusiast) e o Overboost resultou em uma pequena vantagem.
| Performance rating - Percent | |
| Média da turma Gaming | |
| Schenker XMG Fusion 15 (Early 24) | |
| Lenovo Legion Pro 5 16IRX9 | |
| Schenker XMG Fusion 15 (Early 24) | |
| Aorus 16X 2024 | |
| HP Omen Transcend 16-u1095ng | |
| Média NVIDIA GeForce RTX 4070 Laptop GPU | |
| Alienware m16 R2 -1! | |
| The Witcher 3 - 1920x1080 Ultra Graphics & Postprocessing (HBAO+) | |
| Média da turma Gaming (104.7 - 240, n=7, últimos 2 anos) | |
| Lenovo Legion Pro 5 16IRX9 | |
| Schenker XMG Fusion 15 (Early 24) (Overboost) | |
| Schenker XMG Fusion 15 (Early 24) | |
| Aorus 16X 2024 | |
| Alienware m16 R2 | |
| HP Omen Transcend 16-u1095ng | |
| Média NVIDIA GeForce RTX 4070 Laptop GPU (69.8 - 133.7, n=57) | |
| GTA V - 1920x1080 Highest AA:4xMSAA + FX AF:16x | |
| Schenker XMG Fusion 15 (Early 24) (Overboost) | |
| Schenker XMG Fusion 15 (Early 24) | |
| Média da turma Gaming (48.3 - 186.9, n=94, últimos 2 anos) | |
| Lenovo Legion Pro 5 16IRX9 | |
| HP Omen Transcend 16-u1095ng | |
| Média NVIDIA GeForce RTX 4070 Laptop GPU (48.3 - 141.6, n=63) | |
| Aorus 16X 2024 | |
| Final Fantasy XV Benchmark - 1920x1080 High Quality | |
| Média da turma Gaming (41 - 215, n=95, últimos 2 anos) | |
| Schenker XMG Fusion 15 (Early 24) (1.3, Overboost) | |
| Lenovo Legion Pro 5 16IRX9 (1.3) | |
| Schenker XMG Fusion 15 (Early 24) (1.3) | |
| Alienware m16 R2 (1.3) | |
| Aorus 16X 2024 (1.3) | |
| Média NVIDIA GeForce RTX 4070 Laptop GPU (41 - 131.9, n=65) | |
| HP Omen Transcend 16-u1095ng (1.3) | |
| Strange Brigade - 1920x1080 ultra AA:ultra AF:16 | |
| Média da turma Gaming (76.3 - 458, n=87, últimos 2 anos) | |
| Lenovo Legion Pro 5 16IRX9 (1.47.22.14 D3D12) | |
| Schenker XMG Fusion 15 (Early 24) (1.47.22.14 D3D12, Overboost) | |
| Alienware m16 R2 (1.47.22.14 D3D12) | |
| Schenker XMG Fusion 15 (Early 24) (1.47.22.14 D3D12) | |
| Aorus 16X 2024 (1.47.22.14 D3D12) | |
| Média NVIDIA GeForce RTX 4070 Laptop GPU (76.3 - 234, n=63) | |
| HP Omen Transcend 16-u1095ng (1.47.22.14 D3D12) | |
| Dota 2 Reborn - 1920x1080 ultra (3/3) best looking | |
| Schenker XMG Fusion 15 (Early 24) (Overboost) | |
| Lenovo Legion Pro 5 16IRX9 | |
| Schenker XMG Fusion 15 (Early 24) | |
| Aorus 16X 2024 | |
| HP Omen Transcend 16-u1095ng | |
| Média da turma Gaming (84.8 - 248, n=107, últimos 2 anos) | |
| Média NVIDIA GeForce RTX 4070 Laptop GPU (89.7 - 191.2, n=67) | |
| Alienware m16 R2 | |
| X-Plane 11.11 - 1920x1080 high (fps_test=3) | |
| Schenker XMG Fusion 15 (Early 24) (Overboost) | |
| Lenovo Legion Pro 5 16IRX9 | |
| Schenker XMG Fusion 15 (Early 24) | |
| Aorus 16X 2024 | |
| HP Omen Transcend 16-u1095ng | |
| Média NVIDIA GeForce RTX 4070 Laptop GPU (52.1 - 147.9, n=69) | |
| Média da turma Gaming (55.5 - 143.5, n=109, últimos 2 anos) | |
| Alienware m16 R2 | |
| Cyberpunk 2077 | |
| 1920x1080 Ultra Preset (FSR off) | |
| Média da turma Gaming (17.7 - 169.9, n=115, últimos 2 anos) | |
| Schenker XMG Fusion 15 (Early 24) (2.02, Overboost) | |
| Lenovo Legion Pro 5 16IRX9 (2.02) | |
| Schenker XMG Fusion 15 (Early 24) (2.02) | |
| Alienware m16 R2 (2.02) | |
| Média NVIDIA GeForce RTX 4070 Laptop GPU (30.7 - 90.7, n=40) | |
| Aorus 16X 2024 (2.02) | |
| 2560x1440 Ultra Preset (FSR off) | |
| Média da turma Gaming (24.8 - 122.8, n=93, últimos 2 anos) | |
| Schenker XMG Fusion 15 (Early 24) (2.02, Overboost) | |
| Lenovo Legion Pro 5 16IRX9 (2.02) | |
| Alienware m16 R2 (2.02) | |
| Schenker XMG Fusion 15 (Early 24) (2.02) | |
| Aorus 16X 2024 (2.02) | |
| Média NVIDIA GeForce RTX 4070 Laptop GPU (24.8 - 57.1, n=37) | |
| 1920x1080 Ray Tracing Ultra Preset (DLSS off) | |
| Média da turma Gaming (19.1 - 84.9, n=36, últimos 2 anos) | |
| Schenker XMG Fusion 15 (Early 24) (2.02, Overboost) | |
| Lenovo Legion Pro 5 16IRX9 (2.02) | |
| Schenker XMG Fusion 15 (Early 24) (2.02) | |
| Alienware m16 R2 (2.02) | |
| Aorus 16X 2024 (2.02) | |
| Média NVIDIA GeForce RTX 4070 Laptop GPU (19.1 - 46.8, n=23) | |
| Dragon's Dogma 2 | |
| 1920x1080 High Preset | |
| Schenker XMG Fusion 15 (Early 24) | |
| Média da turma Gaming (61.5 - 99.3, n=6, últimos 2 anos) | |
| Média NVIDIA GeForce RTX 4070 Laptop GPU (61.3 - 80, n=5) | |
| 2560x1440 High Preset | |
| Média da turma Gaming (51.6 - 93.4, n=6, últimos 2 anos) | |
| Schenker XMG Fusion 15 (Early 24) | |
| Média NVIDIA GeForce RTX 4070 Laptop GPU (47.7 - 61.3, n=5) | |
| Alone in the Dark | |
| 1920x1080 Cinematic Preset | |
| Schenker XMG Fusion 15 (Early 24) | |
| Aorus 16X 2024 | |
| Média NVIDIA GeForce RTX 4070 Laptop GPU (105.5 - 126, n=5) | |
| 2560x1440 Cinematic Preset | |
| Schenker XMG Fusion 15 (Early 24) | |
| Média NVIDIA GeForce RTX 4070 Laptop GPU (37.4 - 76.6, n=5) | |
| Aorus 16X 2024 | |
| The Witcher 3 v4 | |
| 1920x1080 Ultra Preset / On AA:FX | |
| Schenker XMG Fusion 15 (Early 24) | |
| Média NVIDIA GeForce RTX 4070 Laptop GPU (85 - 86.5, n=2) | |
| 1920x1080 RT Ultra Preset / On AA:FX | |
| Schenker XMG Fusion 15 (Early 24) | |
| Média NVIDIA GeForce RTX 4070 Laptop GPU (36 - 40.4, n=2) | |
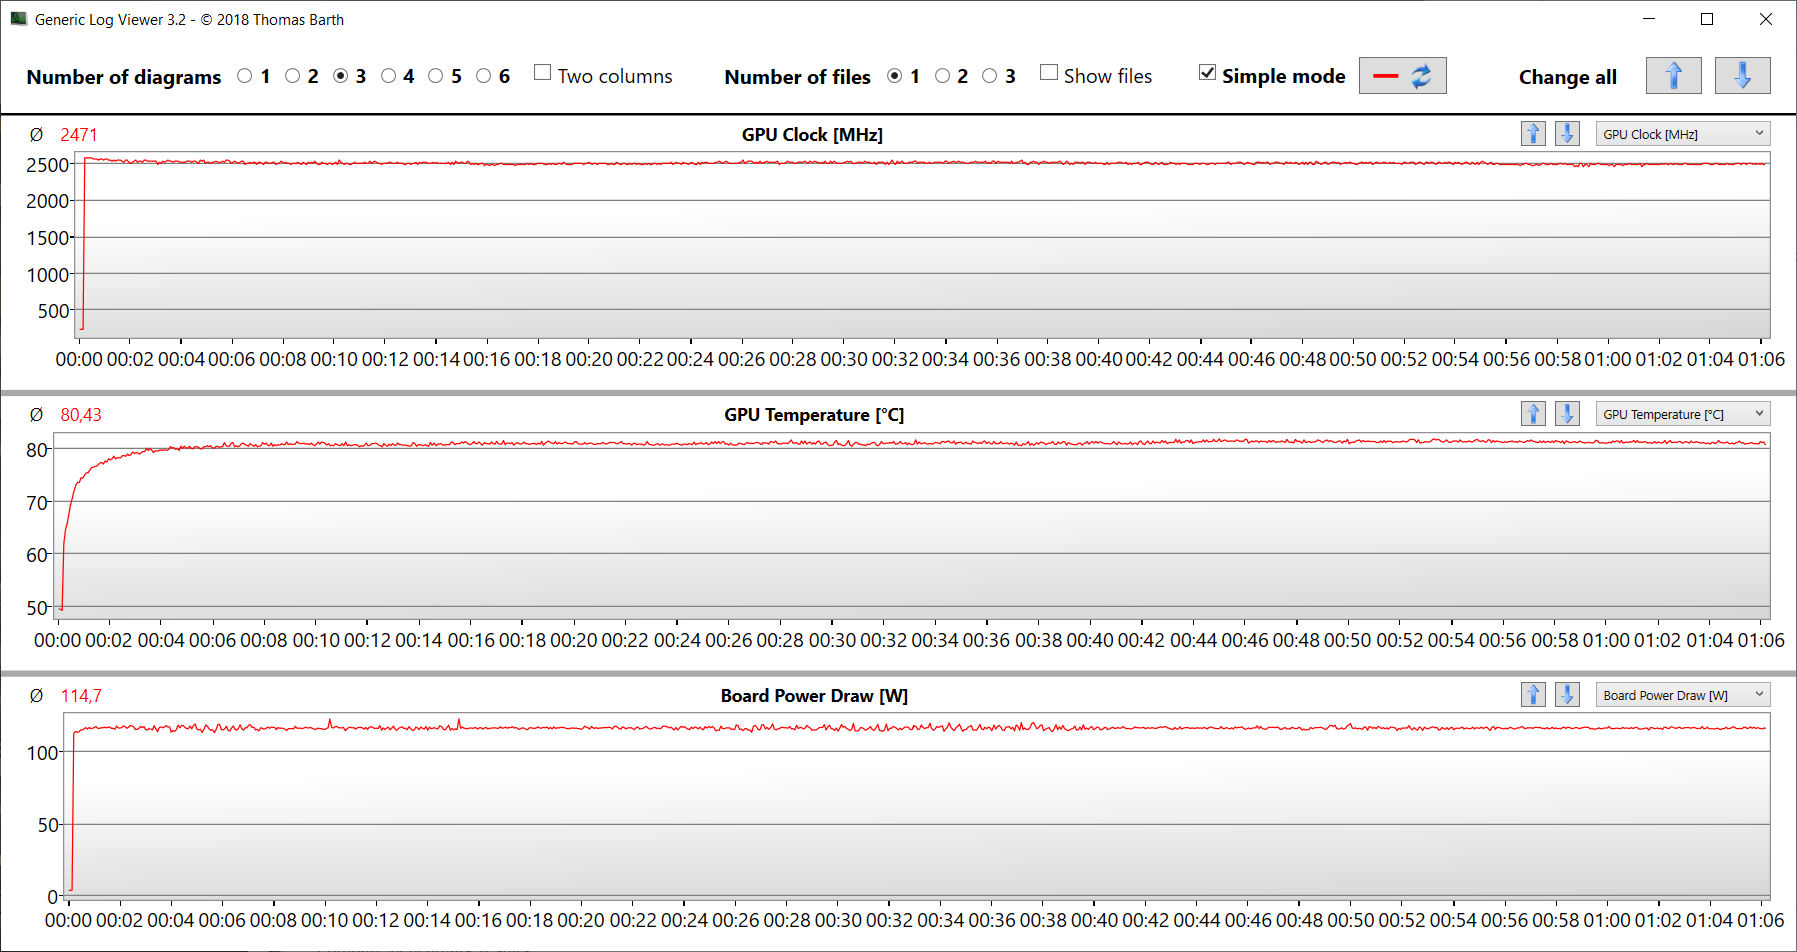
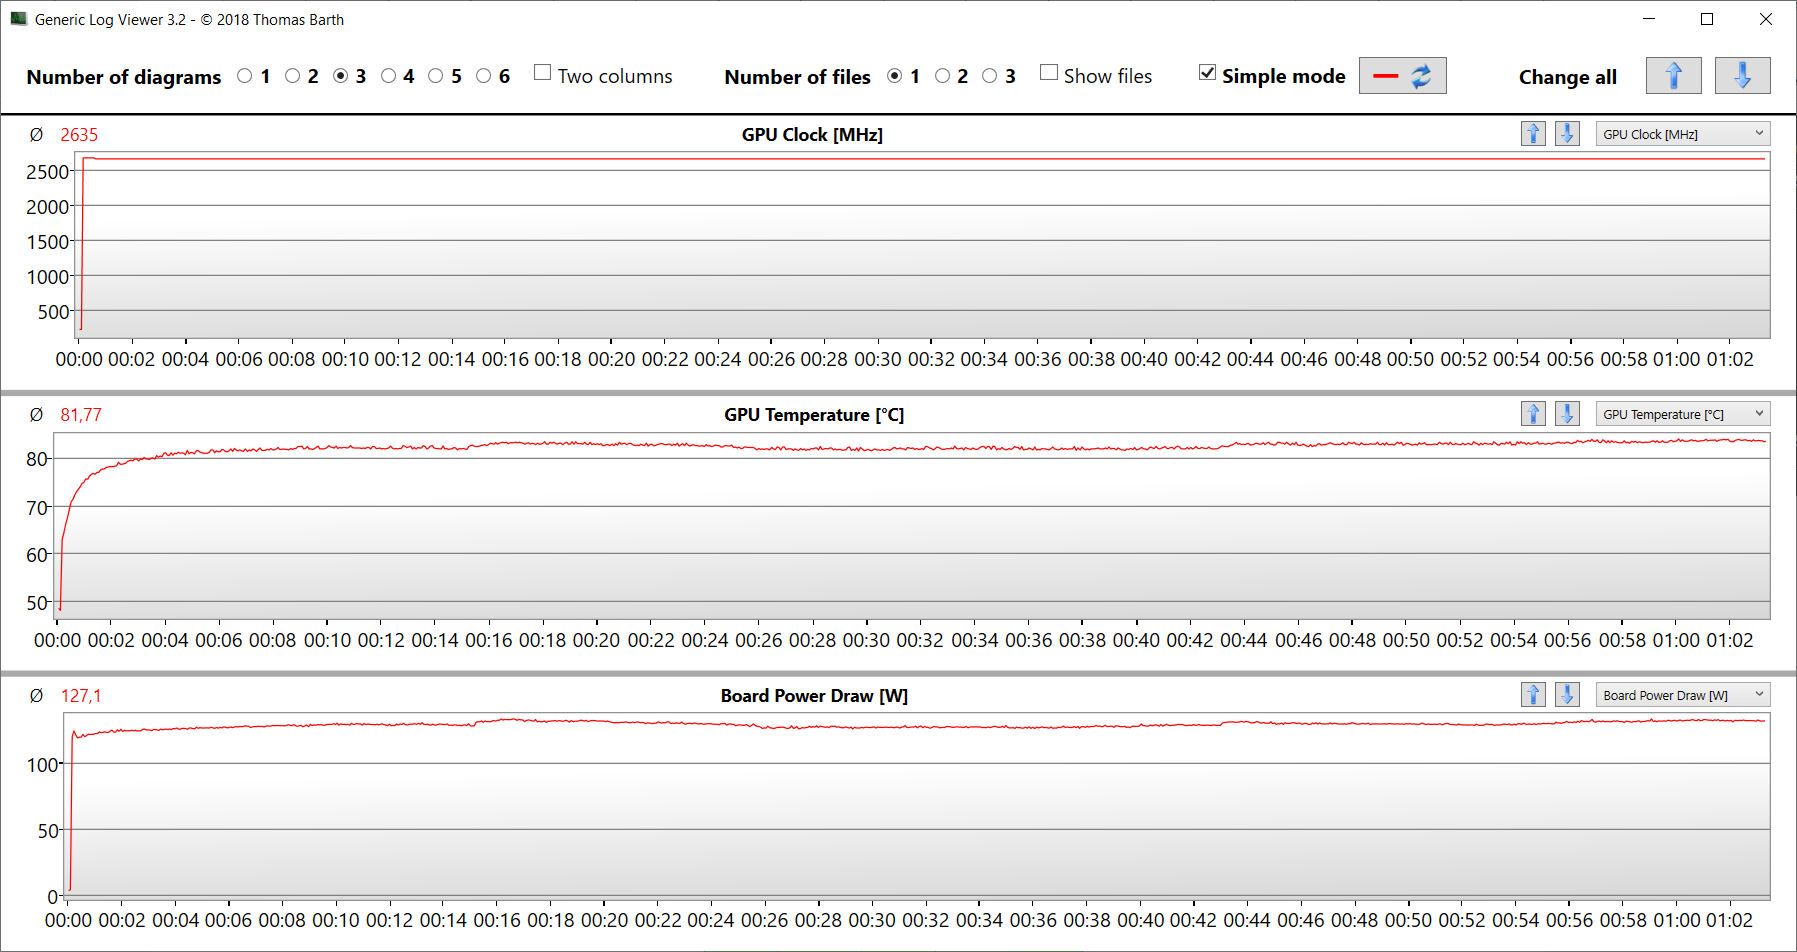
Para testar se suas taxas de quadros permanecem estáveis por um longo período, deixamos o jogo The Witcher 3 rodar por cerca de 60 minutos em Full HD e com as configurações definidas no máximo. Não movemos o personagem do jogo. Não notamos um colapso na taxa de quadros, no entanto, eles caíram alguns por cento após cerca de 50 minutos(Enthusiast). Com o perfil Overboost ativado, esse comportamento não ocorreu.
Witcher 3 FPS diagram
| baixo | média | alto | ultra | QHD | |
|---|---|---|---|---|---|
| GTA V (2015) | 187.8 | 187 | 186.4 | 137.6 | 98.2 |
| The Witcher 3 (2015) | 603.3 | 418.4 | 246.2 | 128 | 92.2 |
| Dota 2 Reborn (2015) | 234 | 207 | 196.5 | 182.1 | |
| Final Fantasy XV Benchmark (2018) | 226 | 175.5 | 124.6 | 90.5 | |
| X-Plane 11.11 (2018) | 205 | 173.3 | 136.9 | ||
| Far Cry 5 (2018) | 204 | 176 | 166 | 157 | 124 |
| Strange Brigade (2018) | 558 | 313 | 245 | 214 | 139.2 |
| The Witcher 3 v4 (2023) | 271 | 215 | 176.2 | 86.5 | |
| Baldur's Gate 3 (2023) | 157.2 | 121.2 | 106.1 | 105 | 82.1 |
| Cyberpunk 2077 (2023) | 156.6 | 124.5 | 103.6 | 87 | 52.6 |
| Alan Wake 2 (2023) | 74.3 | 71.4 | 70.1 | 42.8 | |
| Alone in the Dark (2024) | 222 | 209 | 196.5 | 126 | 76.6 |
| Dragon's Dogma 2 (2024) | 83.9 | 80 | 61.3 |
Emissões - O laptop Schenker esquenta bastante
Emissões de ruído
No uso diário e em marcha lenta, o laptop funciona de forma muito silenciosa. Embora as ventoinhas estejam permanentemente ativadas (podem ser desativadas pelo BIOS), elas só podem ser ouvidas em ambientes muito silenciosos. Sob carga, as coisas mudam rapidamente: Observamos emissões nasais de até 53 dB(A)(Enthusiast). O modo Overboost resultou em valores ainda mais altos. O dispositivo funciona de forma consideravelmente mais silenciosa quando se usa o modo Balanced - aocusto de algum desempenho.
Barulho
| Ocioso |
| 27 / 28 / 33 dB |
| Carga |
| 52 / 53 dB |
 | ||
30 dB silencioso 40 dB(A) audível 50 dB(A) ruidosamente alto |
||
min: | ||
| Schenker XMG Fusion 15 (Early 24) i9-14900HX, GeForce RTX 4070 Laptop GPU | Aorus 16X 2024 i9-14900HX, GeForce RTX 4070 Laptop GPU | Alienware m16 R2 Ultra 7 155H, GeForce RTX 4070 Laptop GPU | HP Omen Transcend 16-u1095ng i9-14900HX, GeForce RTX 4070 Laptop GPU | Lenovo Legion Pro 5 16IRX9 i9-14900HX, GeForce RTX 4070 Laptop GPU | |
|---|---|---|---|---|---|
| Noise | -5% | 8% | 5% | 6% | |
| desligado / ambiente * (dB) | 25 | 26 -4% | 24.7 1% | 24 4% | 23.9 4% |
| Idle Minimum * (dB) | 27 | 26 4% | 25.3 6% | 29 -7% | 24.3 10% |
| Idle Average * (dB) | 28 | 32 -14% | 25.3 10% | 30 -7% | 24.3 13% |
| Idle Maximum * (dB) | 33 | 38 -15% | 25.3 23% | 31 6% | 28.9 12% |
| Load Average * (dB) | 52 | 54 -4% | 31.7 39% | 45 13% | 45.8 12% |
| Witcher 3 ultra * (dB) | 51 | 50 2% | 53.8 -5% | 44 14% | 51 -0% |
| Load Maximum * (dB) | 53 | 55 -4% | 62 -17% | 47 11% | 56.6 -7% |
* ... menor é melhor
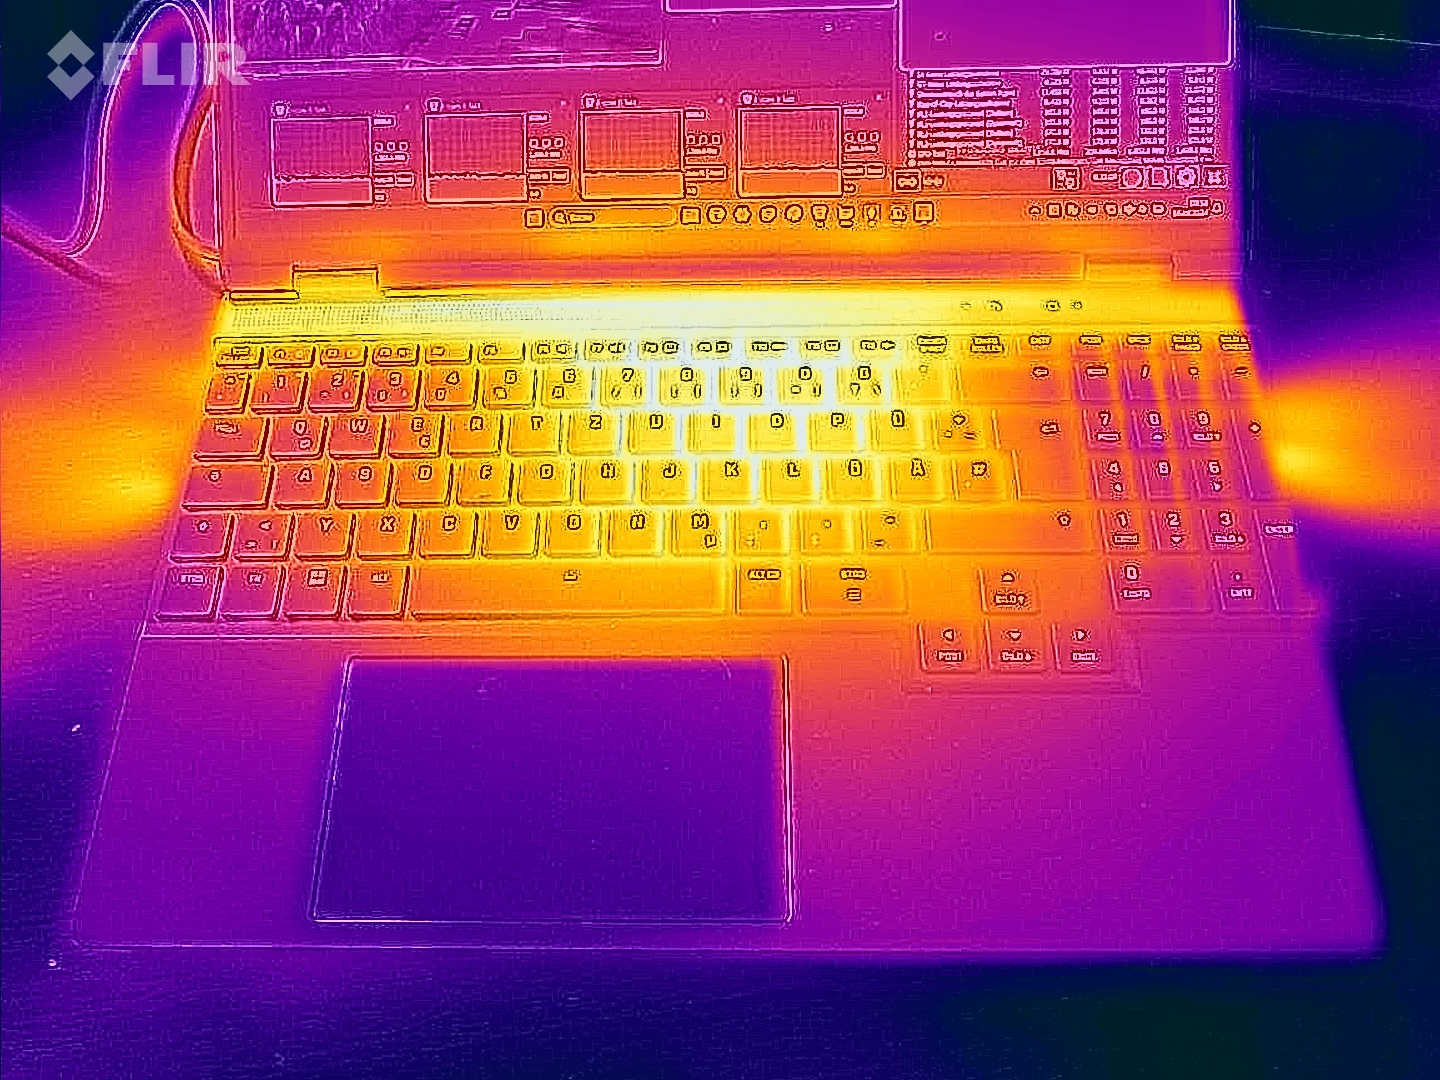
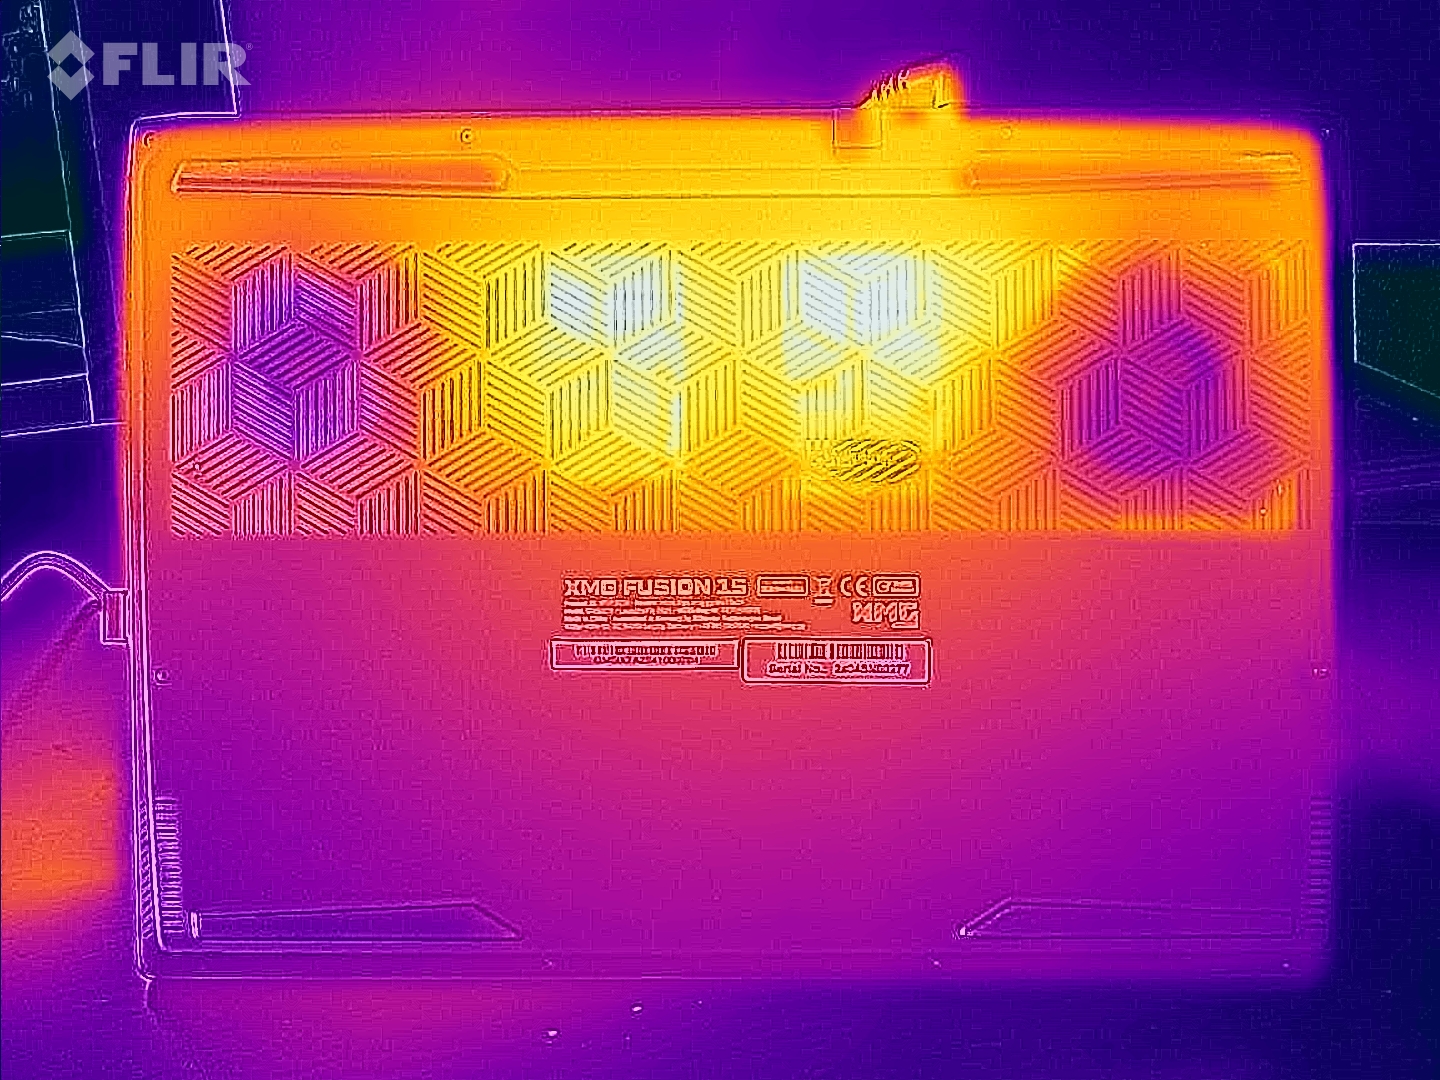
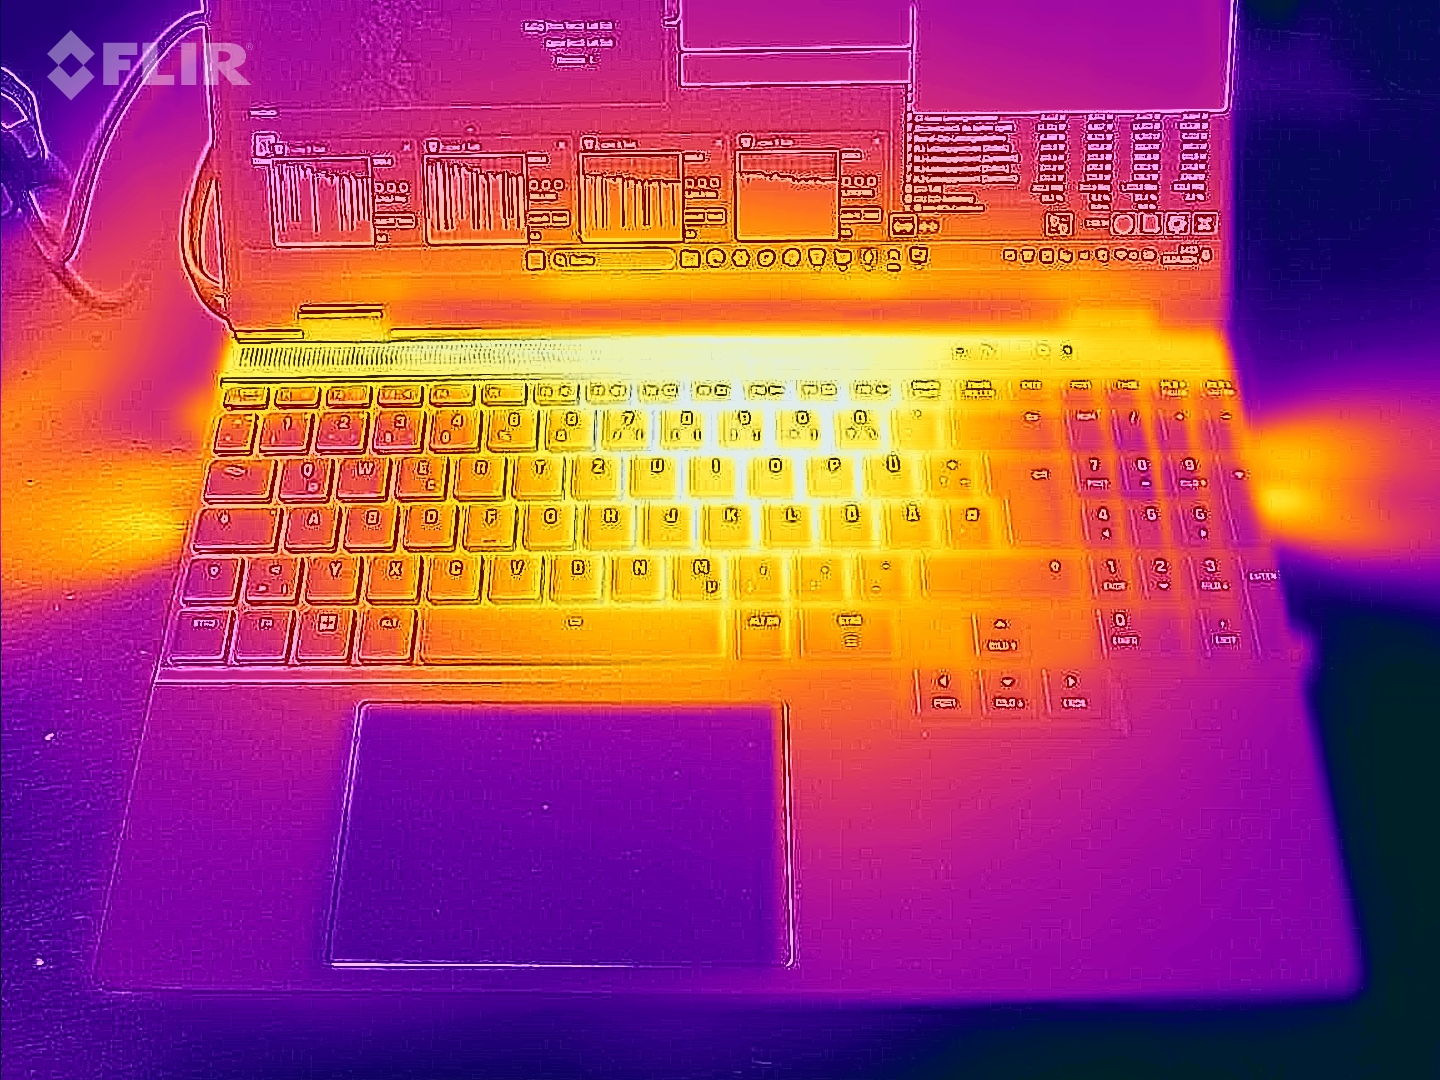
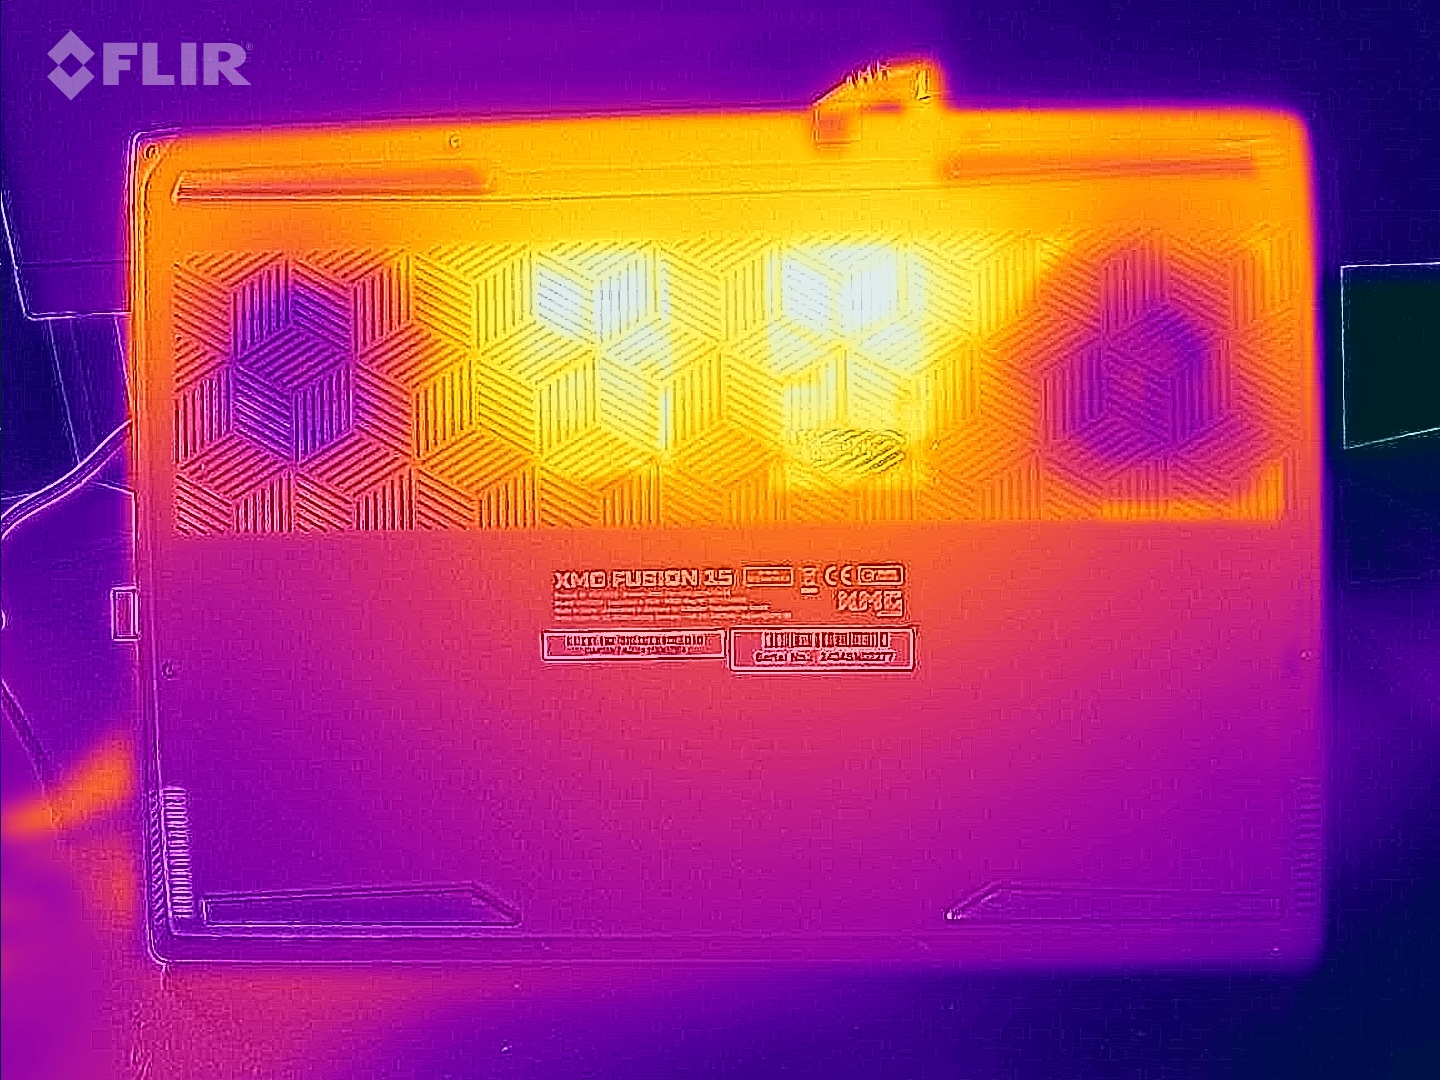
Temperatura
O teste de estresse e o Witcher 3 levaram o laptop a aquecer consideravelmente. Às vezes, ele atingia valores na faixa superior de 50 graus Celsius. No uso diário (escritório, Internet), os valores geralmente permanecem na zona verde.
(-) A temperatura máxima no lado superior é 48 °C / 118 F, em comparação com a média de 40.4 °C / 105 F , variando de 21.2 a 68.8 °C para a classe Gaming.
(-) A parte inferior aquece até um máximo de 56 °C / 133 F, em comparação com a média de 43.2 °C / 110 F
(+) Em uso inativo, a temperatura média para o lado superior é 26.6 °C / 80 F, em comparação com a média do dispositivo de 33.9 °C / ### class_avg_f### F.
(-) Jogando The Witcher 3, a temperatura média para o lado superior é 40.4 °C / 105 F, em comparação com a média do dispositivo de 33.9 °C / ## #class_avg_f### F.
(+) Os apoios para as mãos e o touchpad estão atingindo a temperatura máxima da pele (34 °C / 93.2 F) e, portanto, não estão quentes.
(-) A temperatura média da área do apoio para as mãos de dispositivos semelhantes foi 28.8 °C / 83.8 F (-5.2 °C / -9.4 F).
| Schenker XMG Fusion 15 (Early 24) Intel Core i9-14900HX, NVIDIA GeForce RTX 4070 Laptop GPU | Aorus 16X 2024 Intel Core i9-14900HX, NVIDIA GeForce RTX 4070 Laptop GPU | Alienware m16 R2 Intel Core Ultra 7 155H, NVIDIA GeForce RTX 4070 Laptop GPU | HP Omen Transcend 16-u1095ng Intel Core i9-14900HX, NVIDIA GeForce RTX 4070 Laptop GPU | Lenovo Legion Pro 5 16IRX9 Intel Core i9-14900HX, NVIDIA GeForce RTX 4070 Laptop GPU | |
|---|---|---|---|---|---|
| Heat | -5% | -14% | -6% | -8% | |
| Maximum Upper Side * (°C) | 48 | 41 15% | 44.8 7% | 49 -2% | 43.8 9% |
| Maximum Bottom * (°C) | 56 | 41 27% | 48 14% | 63 -13% | 55.4 1% |
| Idle Upper Side * (°C) | 28 | 37 -32% | 37.2 -33% | 30 -7% | 32.8 -17% |
| Idle Bottom * (°C) | 29 | 38 -31% | 42 -45% | 29 -0% | 36 -24% |
* ... menor é melhor
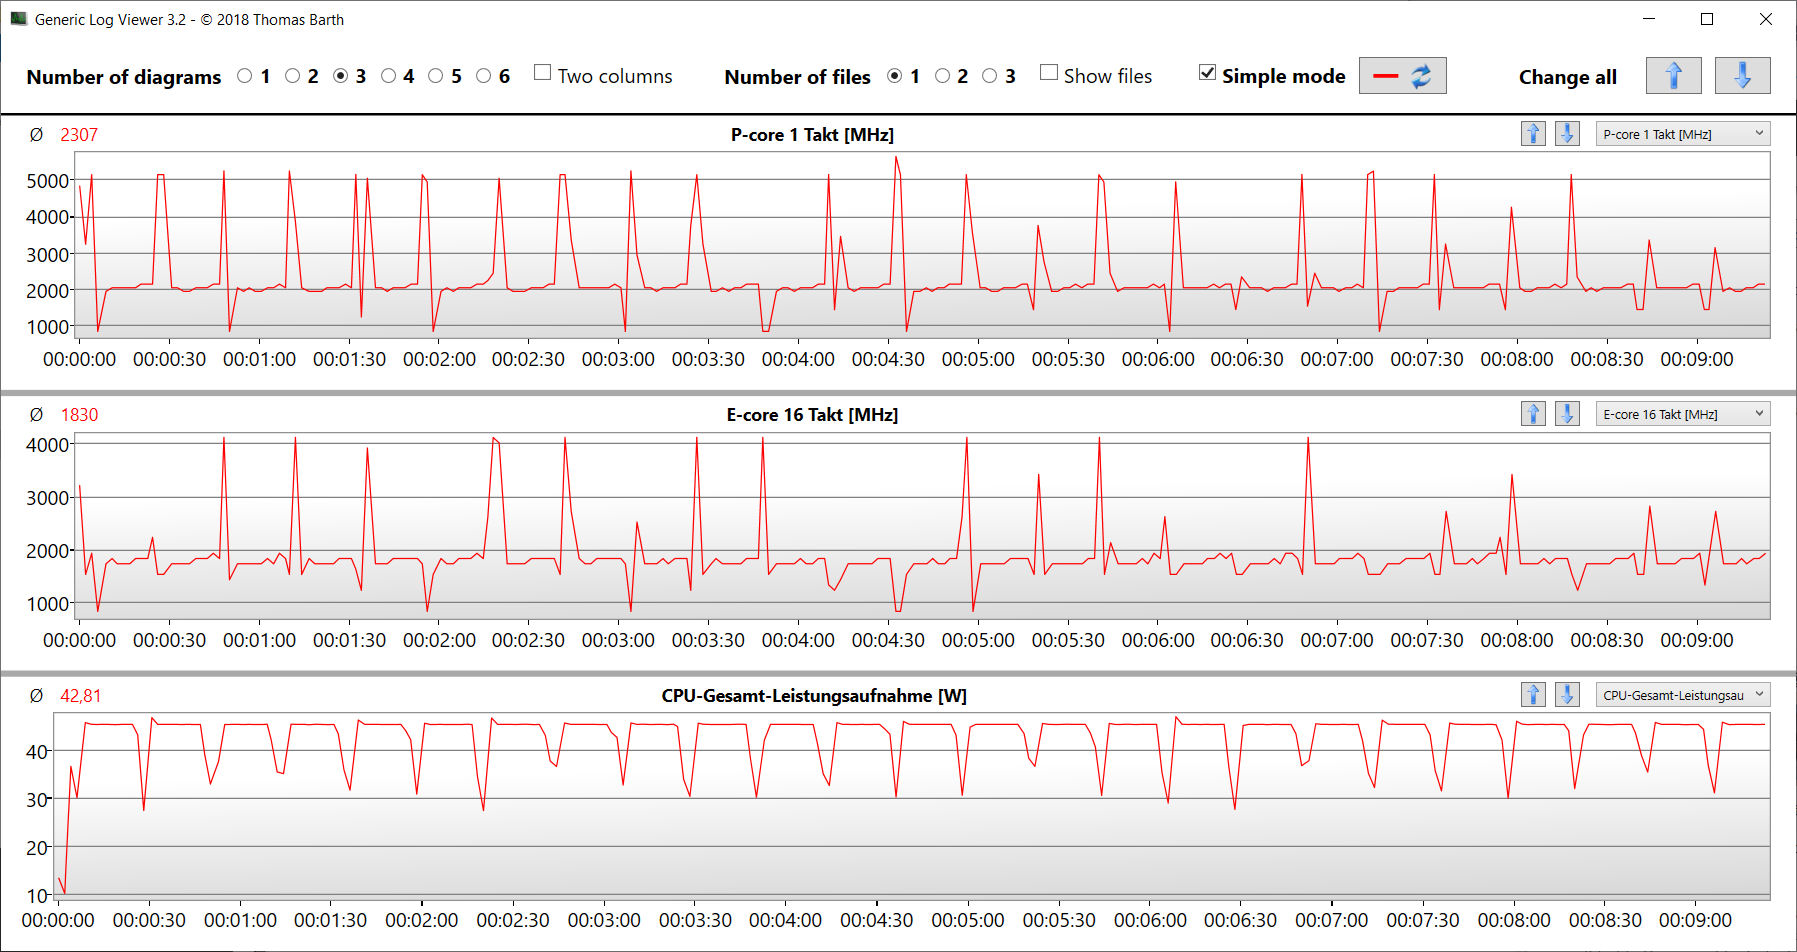
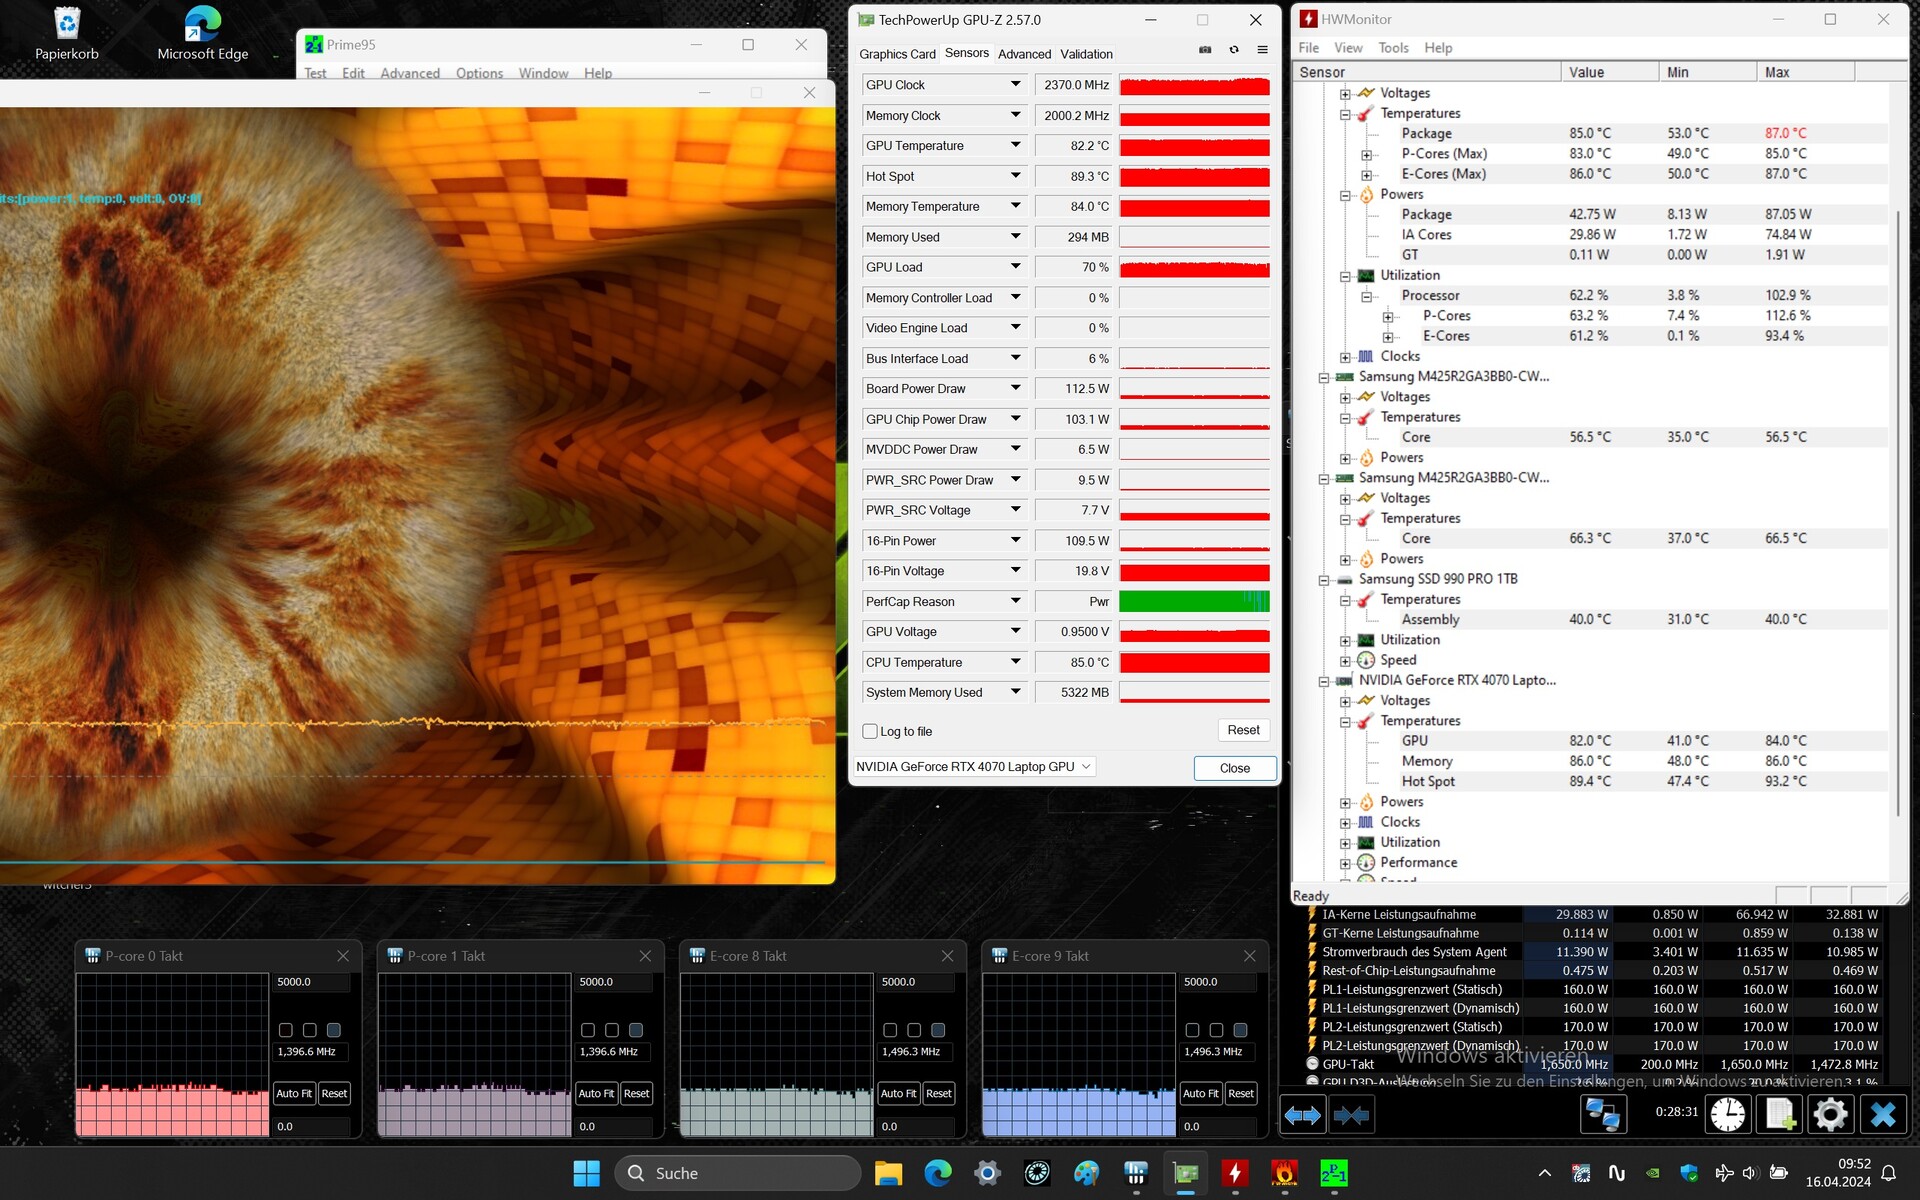
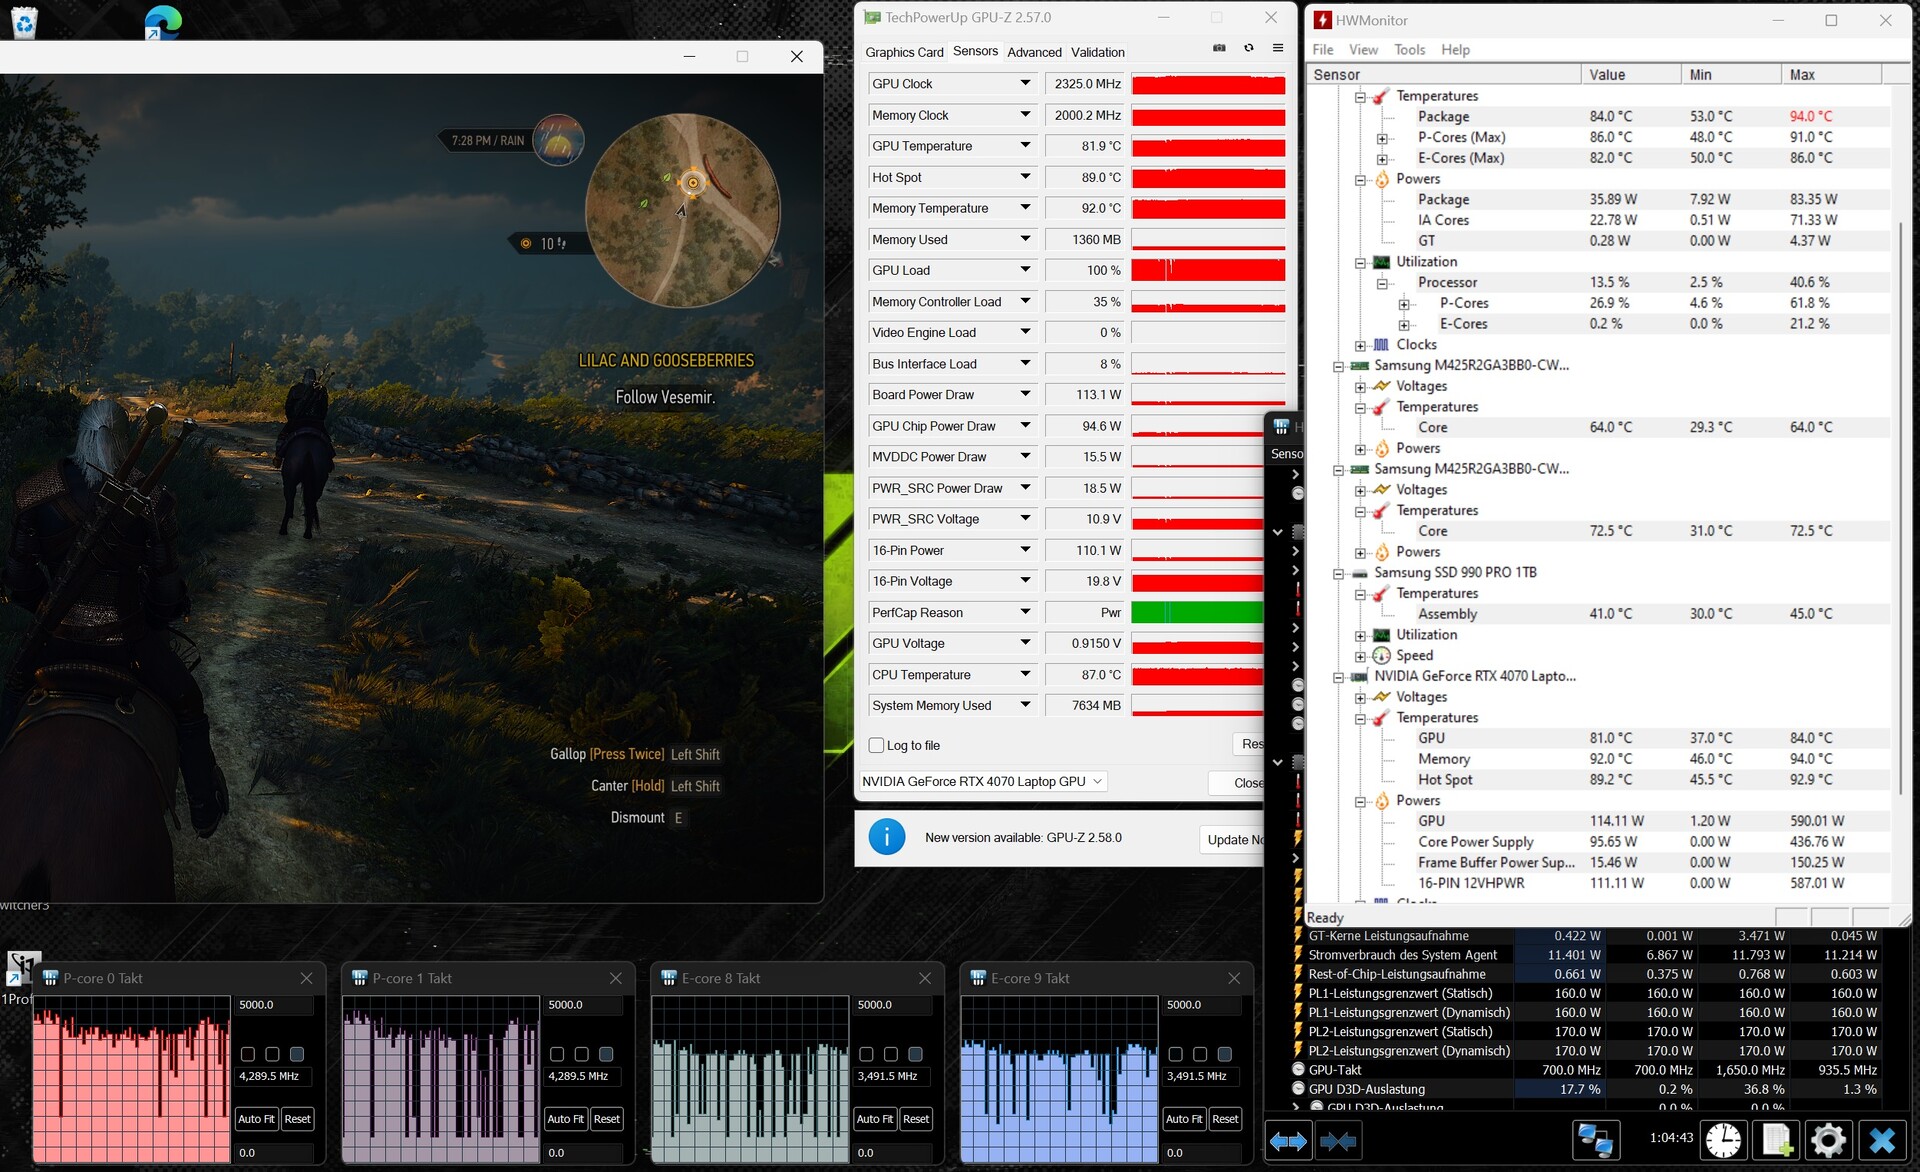
Teste de estresse
O cenário extremo simulado pelo teste de estresse (Prime95 e Furmark em operação contínua) verifica a estabilidade do sistema sob carga total. O clock da CPU diminuiu lenta e continuamente de valores ligeiramente acima da taxa de clock base para valores abaixo dela. O núcleo gráfico funcionou em alta velocidade o tempo todo.
Alto-falantes
Os alto-falantes estéreo do laptop produzem um som decente, mas não têm graves. É possível obter uma experiência sonora melhor conectando fones de ouvido ou alto-falantes externos.
Schenker XMG Fusion 15 (Early 24) análise de áudio
(+) | os alto-falantes podem tocar relativamente alto (###valor### dB)
Graves 100 - 315Hz
(-) | quase nenhum baixo - em média 15.8% menor que a mediana
(±) | a linearidade dos graves é média (12.5% delta para a frequência anterior)
Médios 400 - 2.000 Hz
(+) | médios equilibrados - apenas 4.4% longe da mediana
(+) | médios são lineares (5.9% delta para frequência anterior)
Altos 2 - 16 kHz
(+) | agudos equilibrados - apenas 2% longe da mediana
(+) | os máximos são lineares (4.8% delta da frequência anterior)
Geral 100 - 16.000 Hz
(+) | o som geral é linear (11.5% diferença em relação à mediana)
Comparado com a mesma classe
» 10% de todos os dispositivos testados nesta classe foram melhores, 3% semelhantes, 87% piores
» O melhor teve um delta de 6%, a média foi 18%, o pior foi 132%
Comparado com todos os dispositivos testados
» 8% de todos os dispositivos testados foram melhores, 2% semelhantes, 90% piores
» O melhor teve um delta de 4%, a média foi 23%, o pior foi 134%
Aorus 16X 2024 análise de áudio
(+) | os alto-falantes podem tocar relativamente alto (###valor### dB)
Graves 100 - 315Hz
(±) | graves reduzidos - em média 8.5% menor que a mediana
(±) | a linearidade dos graves é média (8.3% delta para a frequência anterior)
Médios 400 - 2.000 Hz
(+) | médios equilibrados - apenas 3.1% longe da mediana
(+) | médios são lineares (5.8% delta para frequência anterior)
Altos 2 - 16 kHz
(+) | agudos equilibrados - apenas 2.5% longe da mediana
(±) | a linearidade dos máximos é média (7% delta para frequência anterior)
Geral 100 - 16.000 Hz
(+) | o som geral é linear (8.4% diferença em relação à mediana)
Comparado com a mesma classe
» 2% de todos os dispositivos testados nesta classe foram melhores, 1% semelhantes, 97% piores
» O melhor teve um delta de 6%, a média foi 18%, o pior foi 132%
Comparado com todos os dispositivos testados
» 2% de todos os dispositivos testados foram melhores, 1% semelhantes, 97% piores
» O melhor teve um delta de 4%, a média foi 23%, o pior foi 134%
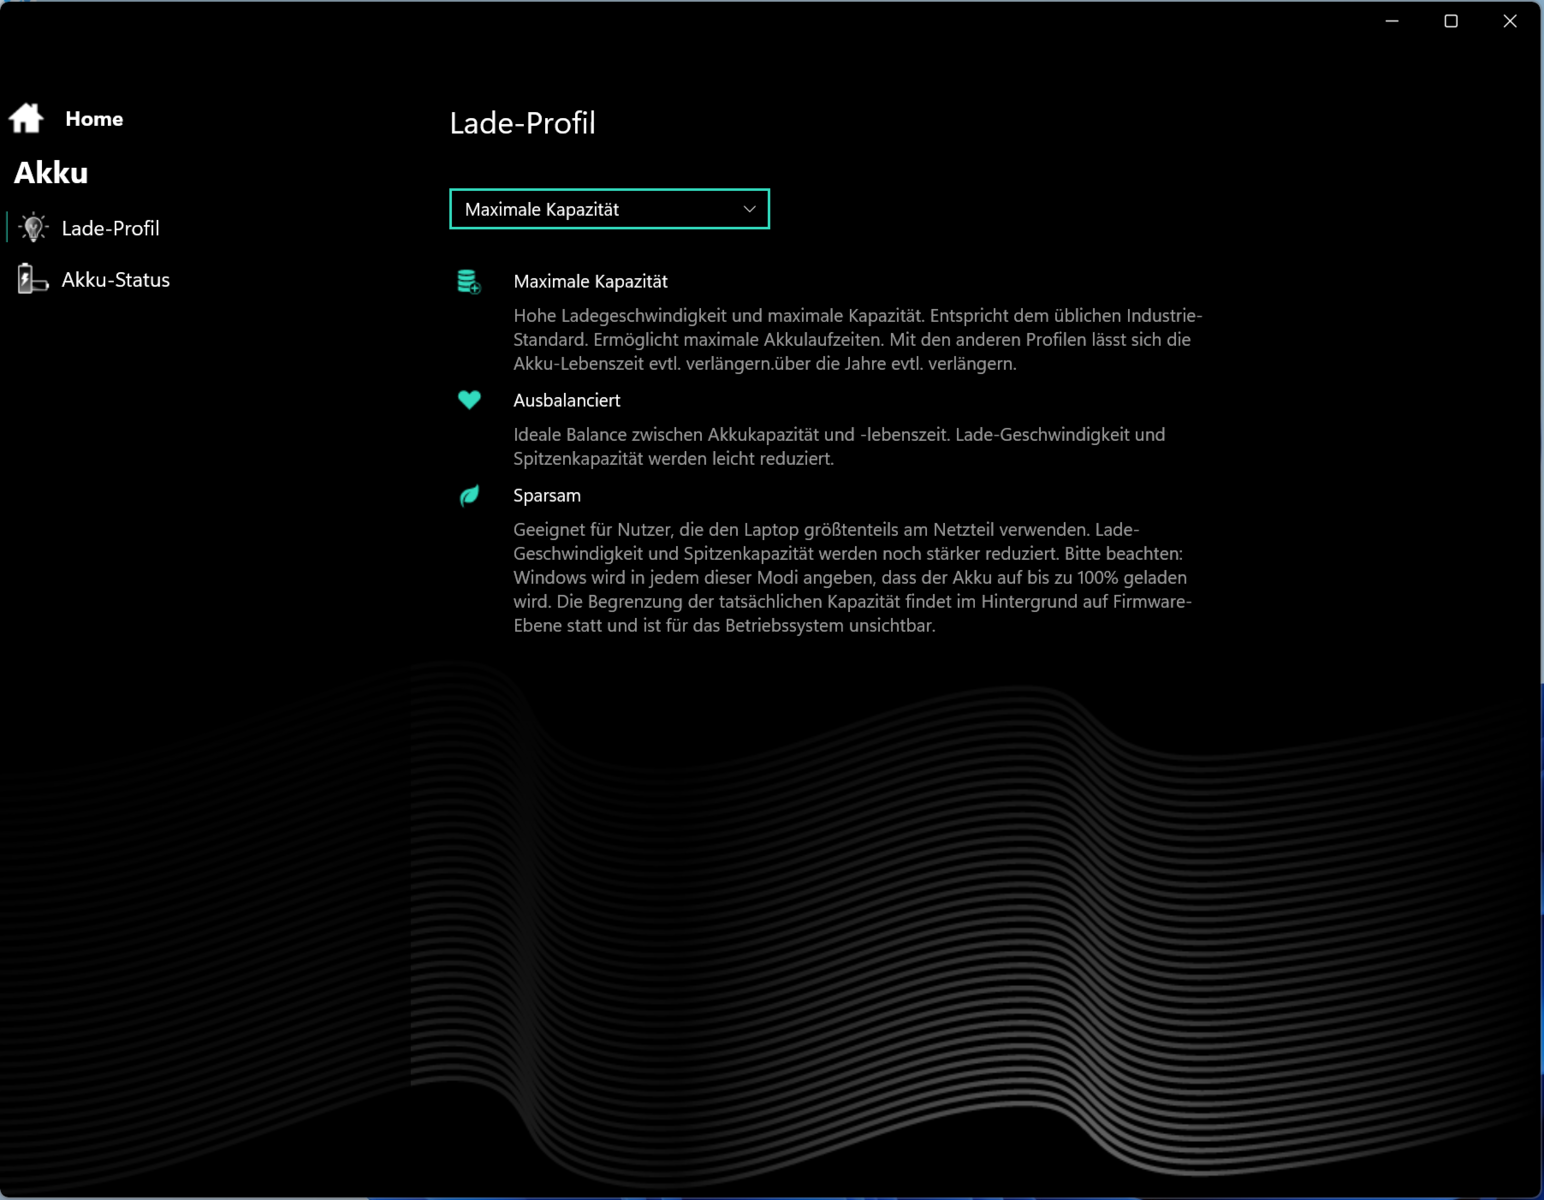
Gerenciamento de energia - O Fusion 15 oferece tempos de execução muito bons
Consumo de energia
Sua necessidade de energia é praticamente normal para o hardware instalado. Exceção: Apesar de uma bateria totalmente carregada, medimos um valor de consumo de energia de cerca de 20 watts com o laptop desligado. É provável que isso seja um bug. O teste Witcher 3 teste e o teste de estresse foram executados com valores de consumo de energia ligeiramente menores. A fonte de alimentação (280 watts) é suficiente em termos de potência.
| Ocioso | |
| Carga |
|
Key:
min: | |
| Schenker XMG Fusion 15 (Early 24) i9-14900HX, GeForce RTX 4070 Laptop GPU | Aorus 16X 2024 i9-14900HX, GeForce RTX 4070 Laptop GPU | Alienware m16 R2 Ultra 7 155H, GeForce RTX 4070 Laptop GPU | HP Omen Transcend 16-u1095ng i9-14900HX, GeForce RTX 4070 Laptop GPU | Média da turma Gaming | |
|---|---|---|---|---|---|
| Power Consumption | -21% | -3% | -10% | -18% | |
| Idle Minimum * (Watt) | 8 | 13 -63% | 8.1 -1% | 10 -25% | 13 ? -63% |
| Idle Average * (Watt) | 14 | 18 -29% | 13 7% | 18 -29% | 18.7 ? -34% |
| Idle Maximum * (Watt) | 26 | 35 -35% | 40.3 -55% | 32 -23% | 24.3 ? 7% |
| Load Average * (Watt) | 118 | 138 -17% | 79 33% | 128 -8% | 110.2 ? 7% |
| Witcher 3 ultra * (Watt) | 192.7 | 172.6 10% | 188.1 2% | 148.4 23% | |
| Load Maximum * (Watt) | 244 | 222 9% | 254.9 -4% | 242 1% | 258 ? -6% |
* ... menor é melhor
Power consumption Witcher 3 / stress test
Power consumption with external monitor
Tempos de execução
Durante nosso teste de WiFi (carregamento de sites por meio de um script) e teste de vídeo (curta-metragem Big Buck Bunny (codificação H.264, FHD) em um loop), medimos tempos de execução de 8:00 horas e 10:02 horas, respectivamente. Esses valores são muito bons.
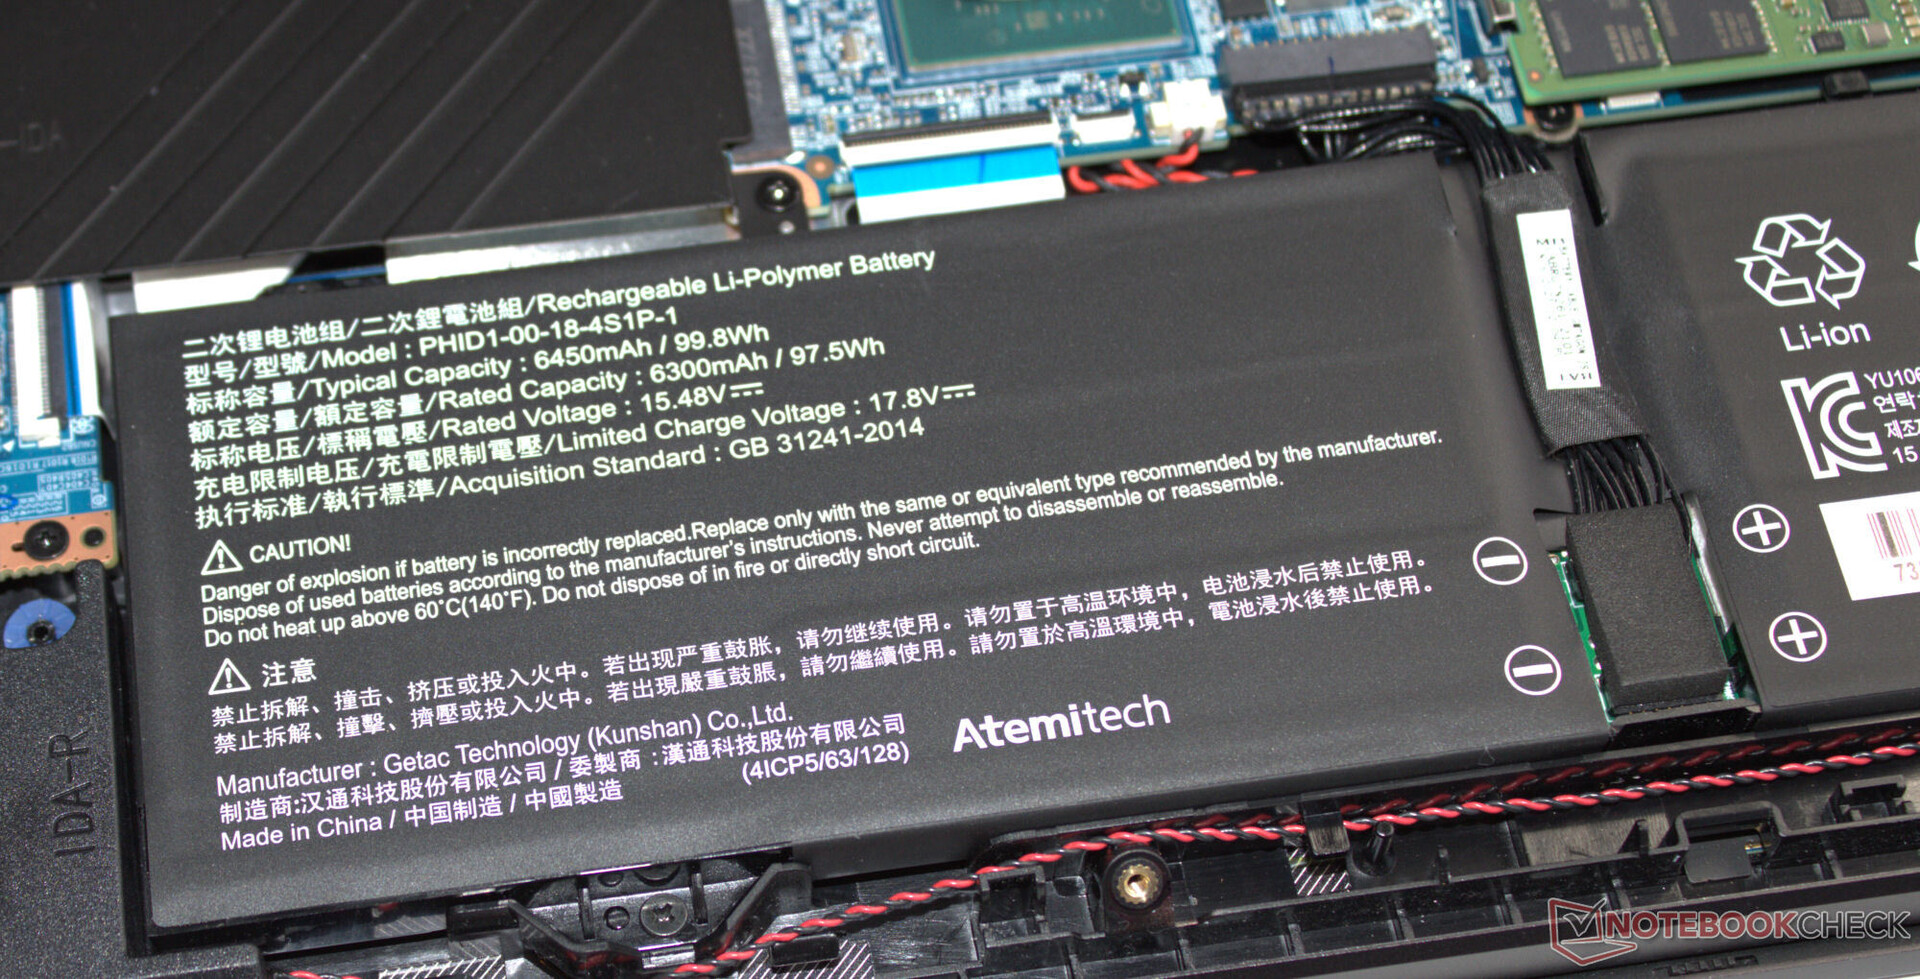
| Schenker XMG Fusion 15 (Early 24) i9-14900HX, GeForce RTX 4070 Laptop GPU, 99.8 Wh | Aorus 16X 2024 i9-14900HX, GeForce RTX 4070 Laptop GPU, 99 Wh | Alienware m16 R2 Ultra 7 155H, GeForce RTX 4070 Laptop GPU, 90 Wh | HP Omen Transcend 16-u1095ng i9-14900HX, GeForce RTX 4070 Laptop GPU, 97 Wh | Lenovo Legion Pro 5 16IRX9 i9-14900HX, GeForce RTX 4070 Laptop GPU, 80 Wh | Média da turma Gaming | |
|---|---|---|---|---|---|---|
| Duração da bateria | -16% | -26% | -39% | -52% | -30% | |
| Reader / Idle (h) | 15.2 | 12.6 -17% | 12.6 -17% | 6.7 -56% | 8.16 ? -46% | |
| H.264 (h) | 10 | 9 -10% | 8.32 ? -17% | |||
| WiFi v1.3 (h) | 8 | 8 0% | 8.1 1% | 4.9 -39% | 4.8 -40% | 7.11 ? -11% |
| Load (h) | 2.7 | 1.7 -37% | 1 -63% | 1.1 -59% | 1.502 ? -44% |
Pro
Contra
Veredicto - Portátil, potente, perseverante
As dimensões compactas e o baixo peso (aprox. 2,1 kg) não são prejudicados pela redução do desempenho do hardware. O Core i9 e o processador GeForce RTX 4070 são capazes de trabalhar com taxas de clock consistentemente altas. A fusão de desempenho e portabilidade do laptop pode ser classificada como um sucesso.
O XMG Fusion 15 (Early 24) - um laptop potente e portátil para gamers e criadores.
O laptop fica bastante quente quando carregado e, ao fazê-lo, produz bastante ruído. Emissões mais moderadas exigem o sacrifício de alguma potência de computação. Sua tela de 15,3 polegadas (2.560 x 1.600 pixels, IPS, 240 Hz, Adaptive Sync) com proporção de 16:10 é impressionante no geral. Seu alto brilho é digno de nota.
Uma carga completa (99,8 Wh) é suficiente para tempos de execução práticos de cerca de 8 a 10 horas - valores muito bons. Ponto positivo: A bateria pode ser carregada por meio de uma fonte de alimentação USB-C (mín. 100 watts, 20 V) - a porta TB4 do laptop é compatível com o Power Delivery. Como resultado, o senhor não precisa necessariamente carregar a fonte de alimentação proprietária (280 watts) o tempo todo.
Uma alternativa poderia ser a Aorus 16X (2024). Esse laptop oferece uma potência de computação comparável, bem como tempos de execução igualmente bons.
Preço e disponibilidade
O XMG Fusion 15 (Early 24) pode ser configurado e encomendado diretamente na loja on-line da Schenker. O dispositivo de teste atual custa cerca de US$ 2.500. Os preços começam a partir de aproximadamente US$ 1.700.
Schenker XMG Fusion 15 (Early 24)
- 05/01/2024 v7 (old)
Sascha Mölck
Transparência
A seleção dos dispositivos a serem analisados é feita pela nossa equipe editorial. A amostra de teste foi fornecida ao autor como empréstimo pelo fabricante ou varejista para fins desta revisão. O credor não teve influência nesta revisão, nem o fabricante recebeu uma cópia desta revisão antes da publicação. Não houve obrigação de publicar esta revisão. Como empresa de mídia independente, a Notebookcheck não está sujeita à autoridade de fabricantes, varejistas ou editores.
É assim que o Notebookcheck está testando
Todos os anos, o Notebookcheck analisa de forma independente centenas de laptops e smartphones usando procedimentos padronizados para garantir que todos os resultados sejam comparáveis. Desenvolvemos continuamente nossos métodos de teste há cerca de 20 anos e definimos padrões da indústria no processo. Em nossos laboratórios de teste, equipamentos de medição de alta qualidade são utilizados por técnicos e editores experientes. Esses testes envolvem um processo de validação em vários estágios. Nosso complexo sistema de classificação é baseado em centenas de medições e benchmarks bem fundamentados, o que mantém a objetividade.Price comparison

