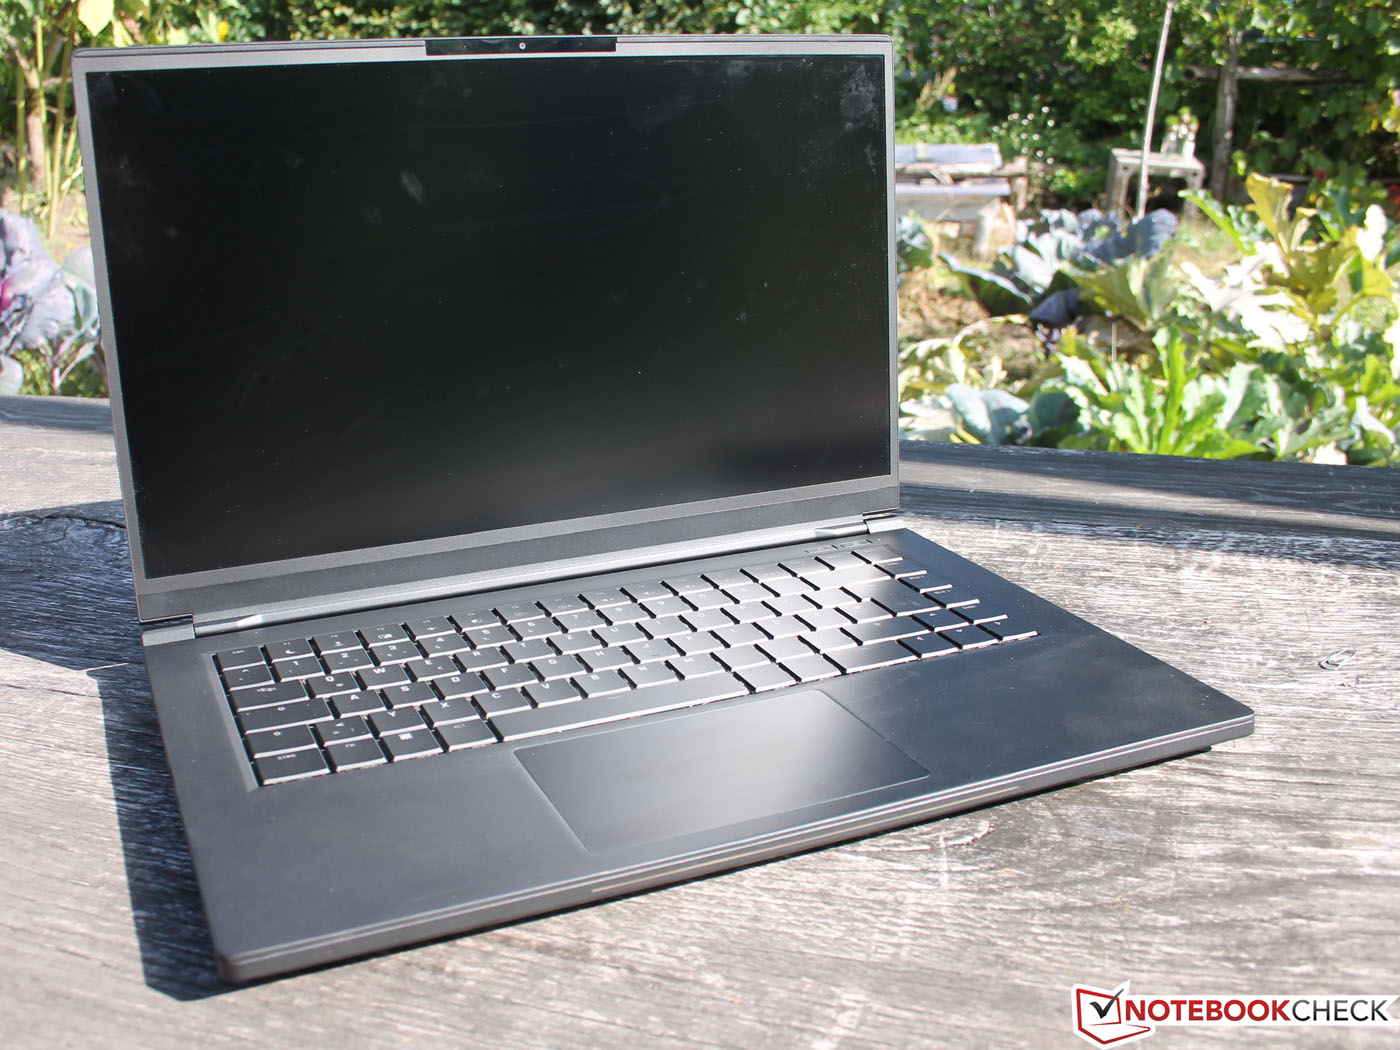
Breve Análise do Schenker XMG Fusion 15: O design de referência da Intel desafia a concorrência
| SD Card Reader | |
| average JPG Copy Test (av. of 3 runs) | |
| Gigabyte Aero 15 Classic-XA (Toshiba Exceria Pro SDXC 64 GB UHS-II) | |
| Lenovo ThinkPad P1 2019-20QT000RGE (Toshiba Exceria Pro SDXC 64 GB UHS-II) | |
| Média da turma Gaming (20.9 - 210, n=54, últimos 2 anos) | |
| Schenker XMG Fusion 15 XFU15L19 (Toshiba Exceria Pro SDXC 64 GB UHS-II) | |
| maximum AS SSD Seq Read Test (1GB) | |
| Gigabyte Aero 15 Classic-XA (Toshiba Exceria Pro SDXC 64 GB UHS-II) | |
| Lenovo ThinkPad P1 2019-20QT000RGE (Toshiba Exceria Pro SDXC 64 GB UHS-II) | |
| Média da turma Gaming (25.5 - 261, n=51, últimos 2 anos) | |
| Schenker XMG Fusion 15 XFU15L19 (Toshiba Exceria Pro SDXC 64 GB UHS-II) | |
| |||||||||||||||||||||||||
iluminação: 85 %
iluminação com acumulador: 331 cd/m²
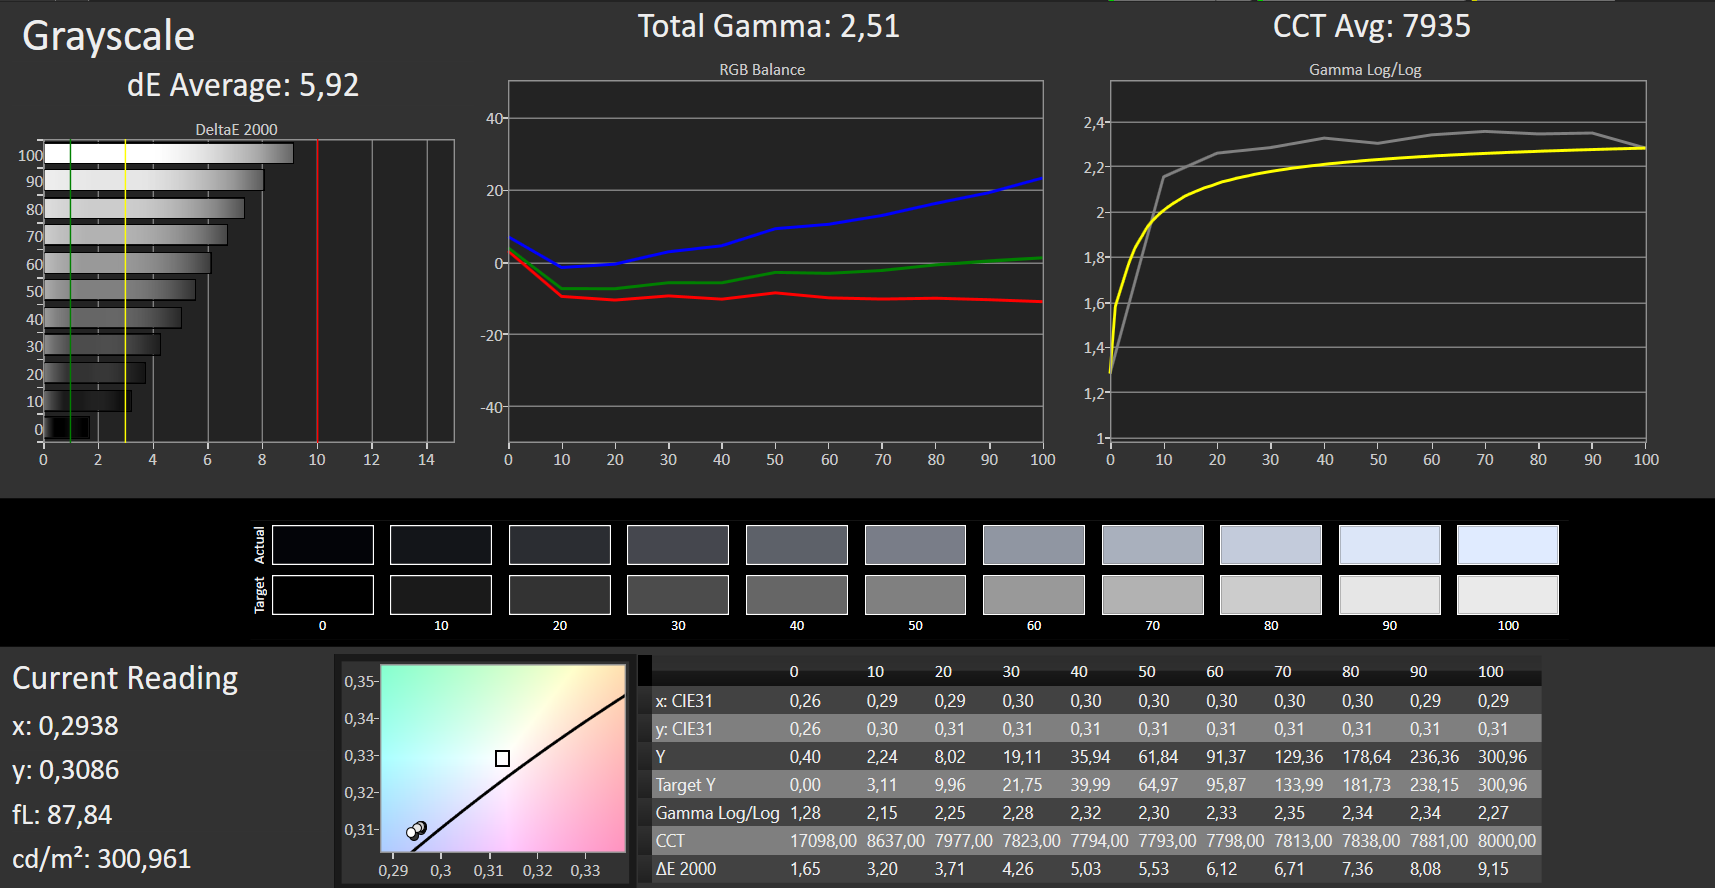
Contraste: 1034:1 (Preto: 0.32 cd/m²)
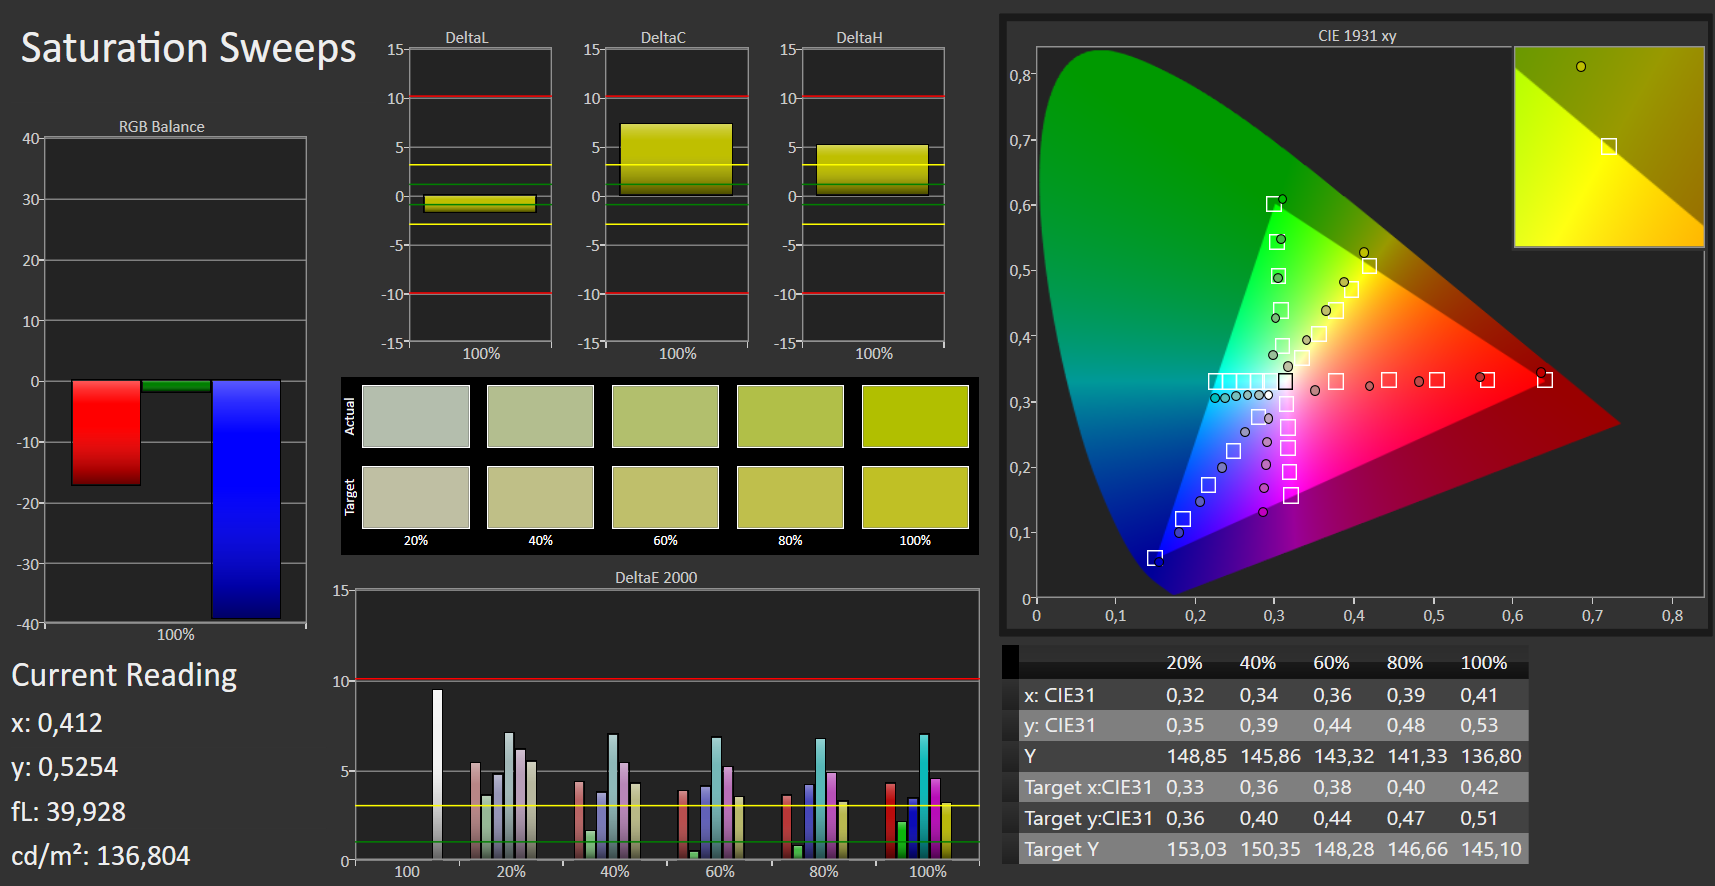
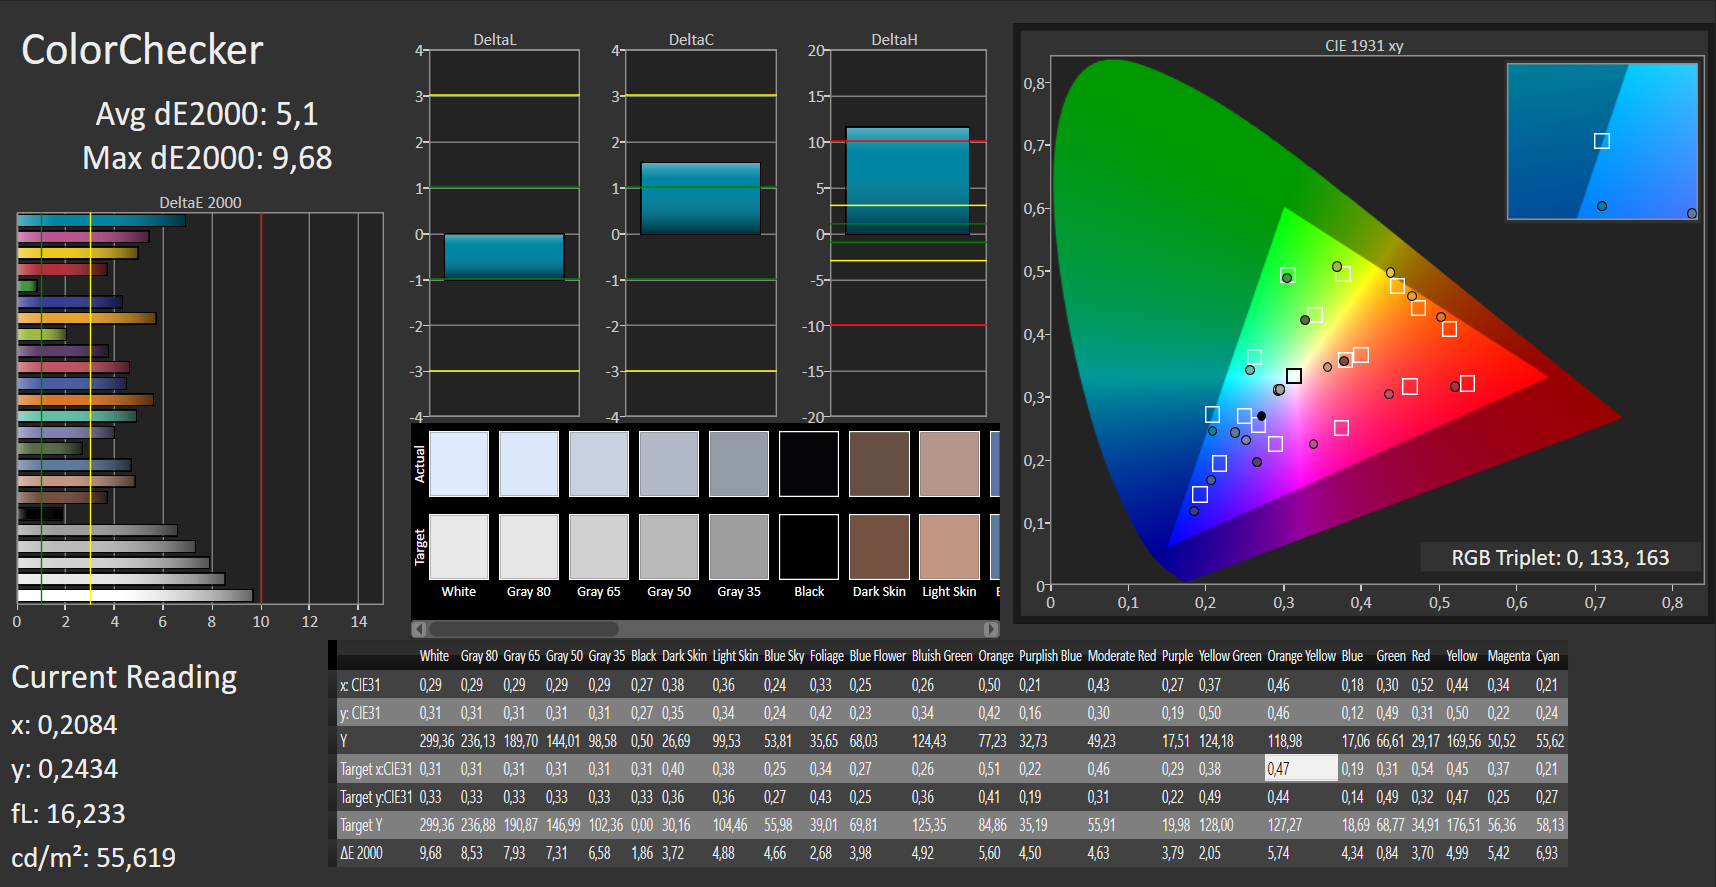
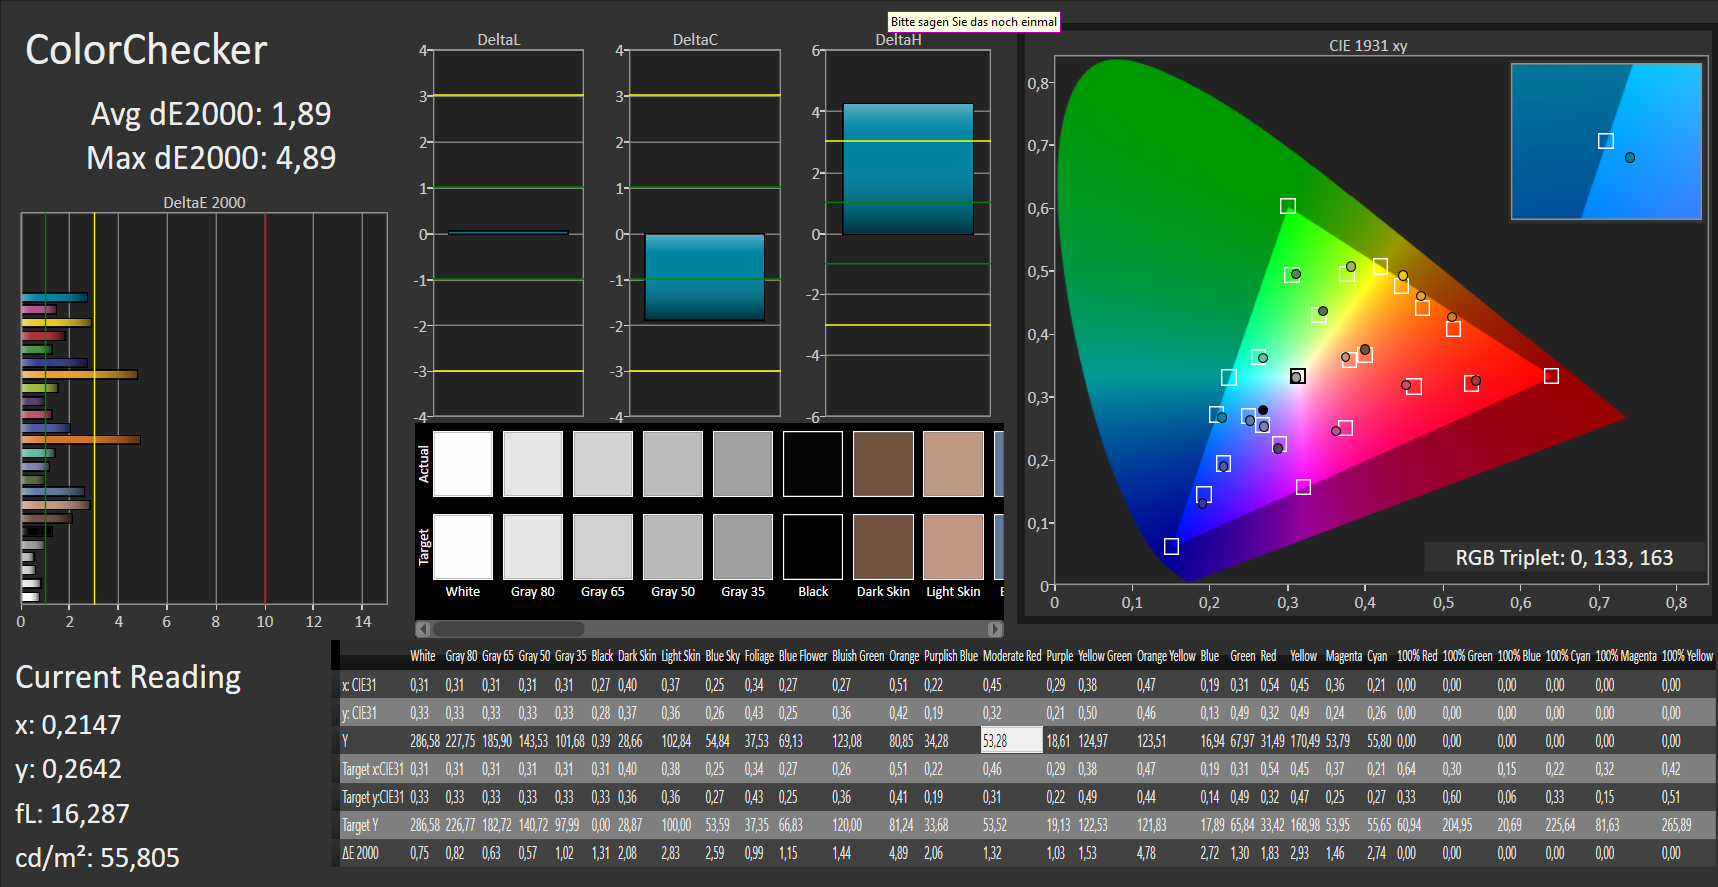
ΔE ColorChecker Calman: 4.5 | ∀{0.5-29.43 Ø4.73}
calibrated: 1.9
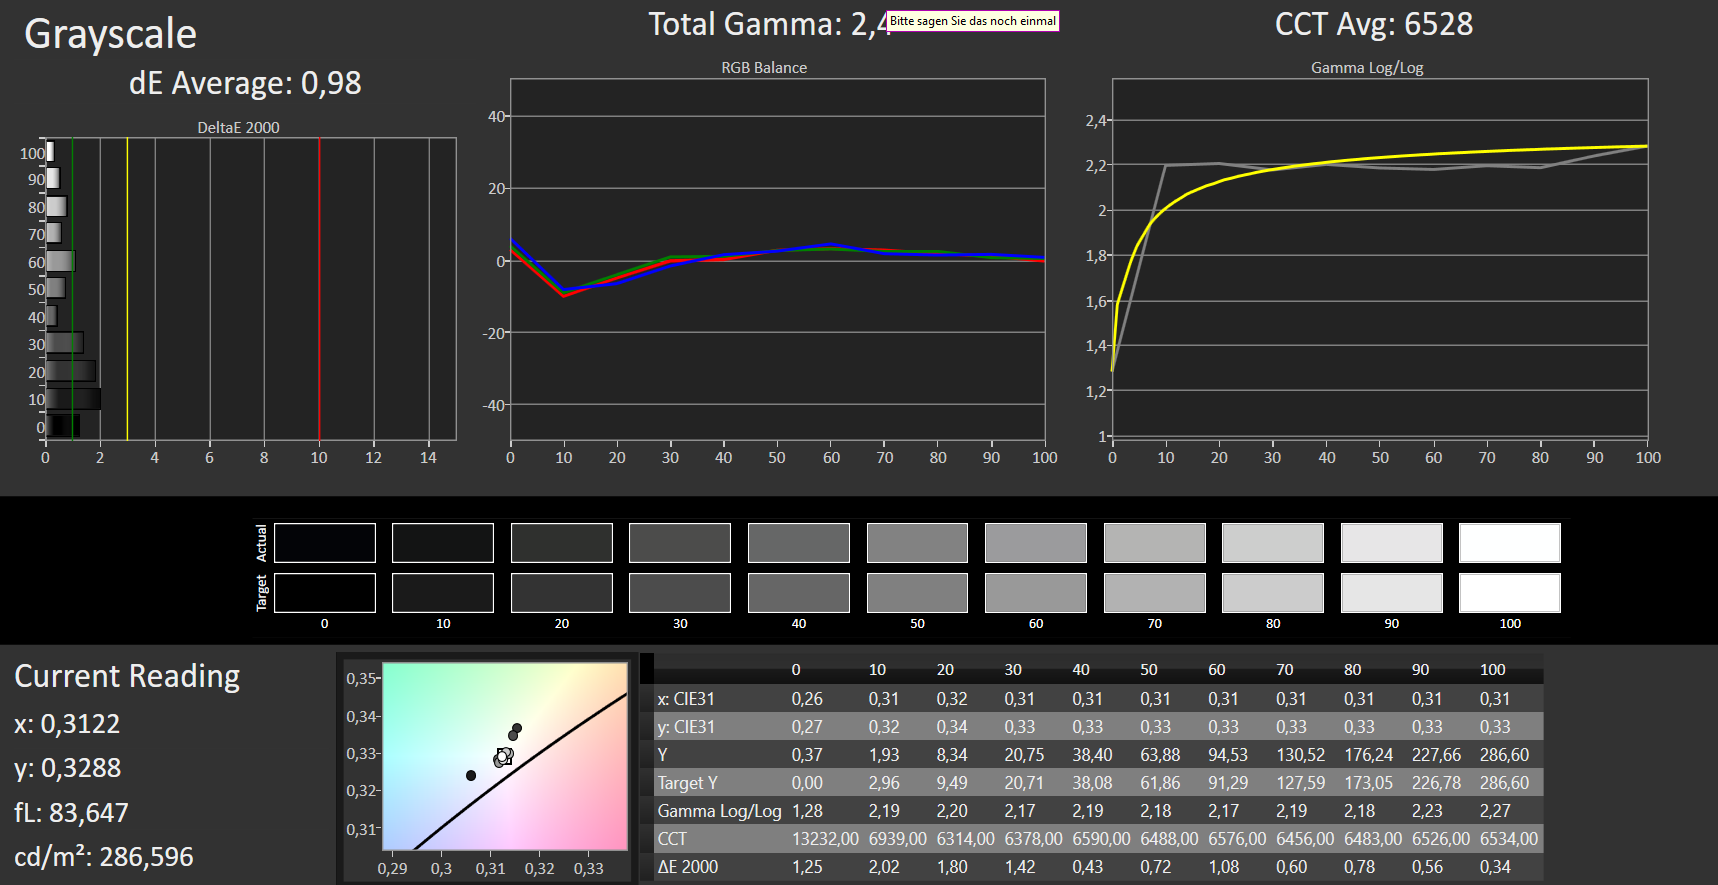
ΔE Greyscale Calman: 4.7 | ∀{0.09-98 Ø4.97}
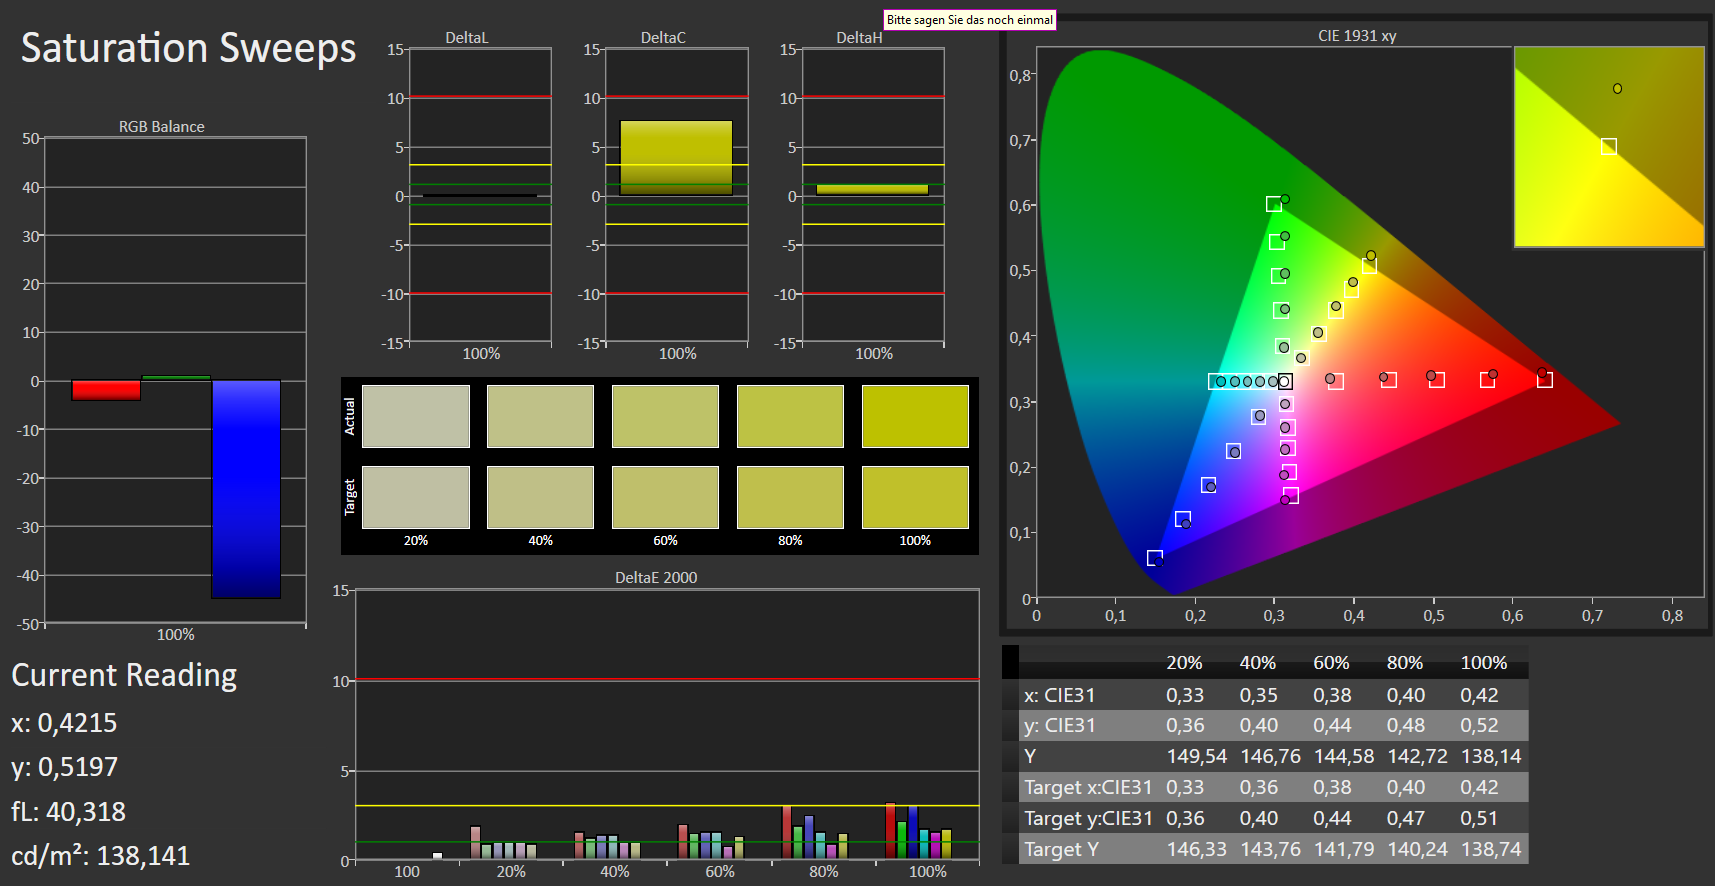
91% sRGB (Argyll 1.6.3 3D)
59% AdobeRGB 1998 (Argyll 1.6.3 3D)
65% AdobeRGB 1998 (Argyll 3D)
91% sRGB (Argyll 3D)
63.8% Display P3 (Argyll 3D)
Gamma: 2.31
CCT: 7537 K
| Schenker XMG Fusion 15 XFU15L19 BOE NV156FHM-N4G, , 1920x1080, 15.6" | Asus Zephyrus S GX502GW AU Optronics B156HAN08.2 (AUO82ED), , 1920x1080, 15.6" | Acer Predator Triton 500 PT515-51-71PZ NV156FHM-N4K (BOE082A), , 1920x1080, 15.6" | Gigabyte Aero 15 Classic-XA Sharp LQ156M1JW03 (SHP14C5), , 1920x1080, 15.6" | Razer Blade 15 RTX 2070 Max-Q LG Philips LGD05C0, , 1920x1080, 15.6" | |
|---|---|---|---|---|---|
| Display | 1% | 2% | 3% | 3% | |
| Display P3 Coverage (%) | 63.8 | 64.9 2% | 64.6 1% | 65.3 2% | 65.3 2% |
| sRGB Coverage (%) | 91 | 91 0% | 92.6 2% | 95.5 5% | 94.9 4% |
| AdobeRGB 1998 Coverage (%) | 65 | 65.9 1% | 66 2% | 66.5 2% | 66.3 2% |
| Response Times | 6% | 6% | -57% | -70% | |
| Response Time Grey 50% / Grey 80% * (ms) | 8 ? | 7.2 ? 10% | 5.2 ? 35% | 15.2 ? -90% | 16.8 ? -110% |
| Response Time Black / White * (ms) | 9 ? | 8.8 ? 2% | 11.2 ? -24% | 11.2 ? -24% | 11.6 ? -29% |
| PWM Frequency (Hz) | 23580 ? | ||||
| Screen | 6% | 12% | 9% | 8% | |
| Brightness middle (cd/m²) | 331 | 286 -14% | 288 -13% | 266 -20% | 314.7 -5% |
| Brightness (cd/m²) | 309 | 275 -11% | 265 -14% | 248 -20% | 312 1% |
| Brightness Distribution (%) | 85 | 90 6% | 84 -1% | 89 5% | 90 6% |
| Black Level * (cd/m²) | 0.32 | 0.37 -16% | 0.22 31% | 0.31 3% | 0.38 -19% |
| Contrast (:1) | 1034 | 773 -25% | 1309 27% | 858 -17% | 828 -20% |
| Colorchecker dE 2000 * | 4.5 | 2.19 51% | 3.22 28% | 2.78 38% | 2.56 43% |
| Colorchecker dE 2000 max. * | 8 | 4.4 45% | 6.26 22% | 5.96 25% | 4.89 39% |
| Colorchecker dE 2000 calibrated * | 1.9 | 2.27 -19% | 1.5 21% | 0.91 52% | 1.71 10% |
| Greyscale dE 2000 * | 4.7 | 2.2 53% | 3.43 27% | 3.58 24% | 3.4 28% |
| Gamma | 2.31 95% | 2.41 91% | 2.41 91% | 2.46 89% | 2.3 96% |
| CCT | 7537 86% | 6405 101% | 7290 89% | 7186 90% | 6435 101% |
| Color Space (Percent of AdobeRGB 1998) (%) | 59 | 59 0% | 60 2% | 62 5% | 60.7 3% |
| Color Space (Percent of sRGB) (%) | 91 | 91 0% | 93 2% | 96 5% | 94.6 4% |
| Média Total (Programa/Configurações) | 4% /
5% | 7% /
9% | -15% /
-0% | -20% /
-3% |
* ... menor é melhor
Exibir tempos de resposta
| ↔ Tempo de resposta preto para branco | ||
|---|---|---|
| 9 ms ... ascensão ↗ e queda ↘ combinadas | ↗ 5 ms ascensão | 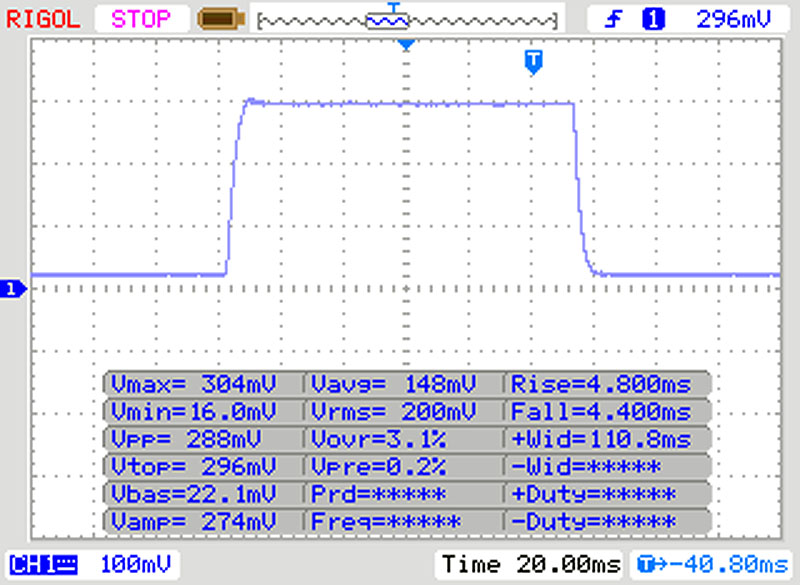 |
| ↘ 4 ms queda | ||
| A tela mostra taxas de resposta rápidas em nossos testes e deve ser adequada para jogos. Em comparação, todos os dispositivos testados variam de 0.1 (mínimo) a 240 (máximo) ms. » 25 % de todos os dispositivos são melhores. Isso significa que o tempo de resposta medido é melhor que a média de todos os dispositivos testados (19.9 ms). | ||
| ↔ Tempo de resposta 50% cinza a 80% cinza | ||
| 8 ms ... ascensão ↗ e queda ↘ combinadas | ↗ 4 ms ascensão | 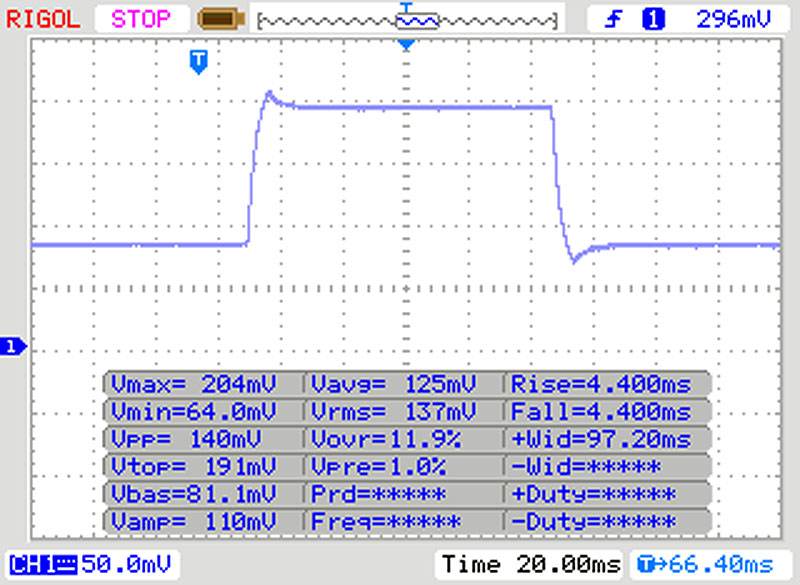 |
| ↘ 4 ms queda | ||
| A tela mostra taxas de resposta rápidas em nossos testes e deve ser adequada para jogos. Em comparação, todos os dispositivos testados variam de 0.165 (mínimo) a 636 (máximo) ms. » 21 % de todos os dispositivos são melhores. Isso significa que o tempo de resposta medido é melhor que a média de todos os dispositivos testados (31.1 ms). | ||
Cintilação da tela / PWM (modulação por largura de pulso)
| Tela tremeluzindo / PWM não detectado | 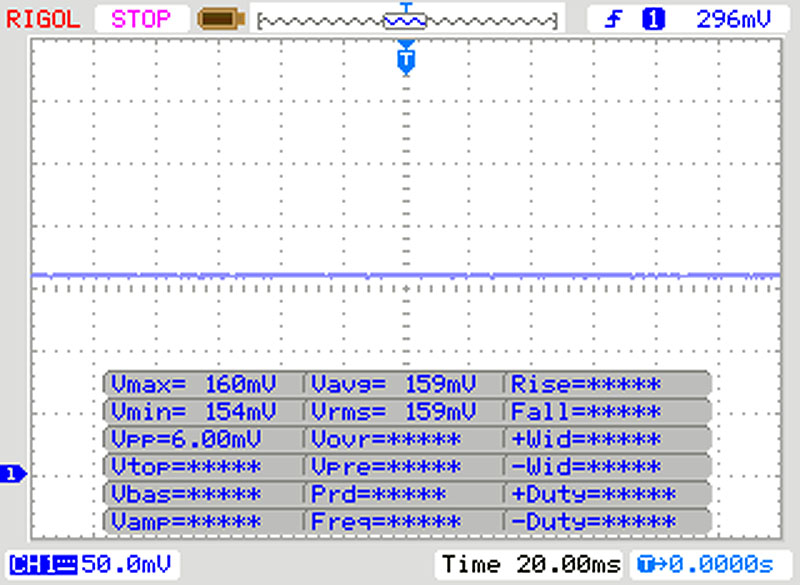 | ||
[pwm_comparison] Em comparação: 52 % de todos os dispositivos testados não usam PWM para escurecer a tela. Se PWM foi detectado, uma média de 7784 (mínimo: 5 - máximo: 343500) Hz foi medida. | |||
| PCMark 8 Home Score Accelerated v2 | 4890 pontos | |
| PCMark 8 Creative Score Accelerated v2 | 5931 pontos | |
| PCMark 8 Work Score Accelerated v2 | 5694 pontos | |
| PCMark 10 Score | 5784 pontos | |
Ajuda | ||
| Schenker XMG Fusion 15 XFU15L19 Samsung SSD 970 EVO Plus 500GB | Asus Zephyrus S GX502GW 2x Intel SSD 660p SSDPEKNW512G8 (RAID 0) | Acer Predator Triton 500 PT515-51-71PZ WDC PC SN720 SDAPNTW-512G | Gigabyte Aero 15 Classic-XA Intel SSD 760p SSDPEKKW512G8 | Razer Blade 15 RTX 2070 Max-Q Samsung SSD PM981 MZVLB512HAJQ | Média Samsung SSD 970 EVO Plus 500GB | |
|---|---|---|---|---|---|---|
| CrystalDiskMark 5.2 / 6 | 7% | 15% | 13% | -8% | 29% | |
| Write 4K (MB/s) | 106.5 | 97 -9% | 108.8 2% | 115.5 8% | 93.9 -12% | 159.2 ? 49% |
| Read 4K (MB/s) | 42.24 | 49.58 17% | 40.31 -5% | 58 37% | 40.56 -4% | 48.5 ? 15% |
| Write Seq (MB/s) | 1466 | 1838 25% | 2488 70% | 1555 6% | 1468 0% | 2114 ? 44% |
| Read Seq (MB/s) | 1337 | 2421 81% | 1916 43% | 2590 94% | 1540 15% | 2044 ? 53% |
| Write 4K Q32T1 (MB/s) | 337.3 | 326.9 -3% | 382.4 13% | 369.3 9% | 293.5 -13% | 435 ? 29% |
| Read 4K Q32T1 (MB/s) | 407.6 | 372.9 -9% | 421.8 3% | 441.7 8% | 346 -15% | 508 ? 25% |
| Write Seq Q32T1 (MB/s) | 2933 | 1894 -35% | 2542 -13% | 1547 -47% | 1941 -34% | 3238 ? 10% |
| Read Seq Q32T1 (MB/s) | 3235 | 2828 -13% | 3320 3% | 2969 -8% | 3266 1% | 3499 ? 8% |
| AS SSD | -28% | -2% | -23% | -7% | 6% | |
| Seq Read (MB/s) | 2438 | 2506 3% | 2888 18% | 2517 3% | 1840 -25% | 2640 ? 8% |
| Seq Write (MB/s) | 2179 | 1712 -21% | 2374 9% | 924 -58% | 1822 -16% | 2500 ? 15% |
| 4K Read (MB/s) | 50.6 | 48.32 -5% | 42.95 -15% | 59.1 17% | 52.3 3% | 54.8 ? 8% |
| 4K Write (MB/s) | 117.2 | 103.6 -12% | 143.6 23% | 126.5 8% | 110.7 -6% | 141.2 ? 20% |
| 4K-64 Read (MB/s) | 1159 | 624 -46% | 1272 10% | 876 -24% | 1126 -3% | 1345 ? 16% |
| 4K-64 Write (MB/s) | 2359 | 1253 -47% | 1546 -34% | 922 -61% | 1717 -27% | 2116 ? -10% |
| Access Time Read * (ms) | 0.063 | 0.08 -27% | 0.042 33% | 0.047 25% | 0.0475 ? 25% | |
| Access Time Write * (ms) | 0.031 | 0.04 -29% | 0.065 -110% | 0.033 -6% | 0.02775 ? 10% | |
| Score Read (Points) | 1454 | 923 -37% | 1604 10% | 1186 -18% | 1362 -6% | 1664 ? 14% |
| Score Write (Points) | 2694 | 1528 -43% | 1927 -28% | 1141 -58% | 2010 -25% | 2507 ? -7% |
| Score Total (Points) | 4886 | 2896 -41% | 4329 -11% | 2870 -41% | 4079 -17% | 5023 ? 3% |
| Copy ISO MB/s (MB/s) | 1998 | 2086 4% | 1975 -1% | 1989 ? 0% | ||
| Copy Program MB/s (MB/s) | 511 | 454.2 -11% | 526 3% | 442 ? -14% | ||
| Copy Game MB/s (MB/s) | 1216 | 1141 -6% | 1200 -1% | 1121 ? -8% | ||
| Média Total (Programa/Configurações) | -11% /
-13% | 7% /
6% | -5% /
-10% | -8% /
-7% | 18% /
14% |
* ... menor é melhor

| 3DMark 11 Performance | 20181 pontos | |
| 3DMark Cloud Gate Standard Score | 39529 pontos | |
| 3DMark Fire Strike Score | 17593 pontos | |
Ajuda | ||
| The Witcher 3 - 1920x1080 Ultra Graphics & Postprocessing (HBAO+) | |
| Média da turma Gaming (95 - 240, n=8, últimos 2 anos) | |
| Asus Zephyrus S GX502GW | |
| Razer Blade 15 RTX 2070 Max-Q | |
| Média NVIDIA GeForce RTX 2070 Max-Q (56 - 83.8, n=31) | |
| Schenker XMG Fusion 15 XFU15L19 | |
| Acer Predator Triton 500 PT515-51-71PZ | |
| Gigabyte Aero 15 Classic-XA | |
| F1 2019 - 1920x1080 Ultra High Preset AA:T AF:16x | |
| Schenker XMG Fusion 15 XFU15L19 | |
| Média NVIDIA GeForce RTX 2070 Max-Q (97 - 112, n=5) | |
| Acer Predator Triton 500 PT515-51-71PZ | |
| Dirt Rally 2.0 - 1920x1080 Ultra Preset AA:T AF:16x | |
| Acer Predator Triton 500 PT515-51-71PZ | |
| Schenker XMG Fusion 15 XFU15L19 | |
| Asus Zephyrus S GX502GW | |
| Média NVIDIA GeForce RTX 2070 Max-Q (68.8 - 79.1, n=4) | |
| Anthem - 1920x1080 Ultra Preset | |
| Asus Zephyrus S GX502GW | |
| Acer Predator Triton 500 PT515-51-71PZ | |
| Média NVIDIA GeForce RTX 2070 Max-Q (67.8 - 75.7, n=4) | |
| Schenker XMG Fusion 15 XFU15L19 | |
| Farming Simulator 19 - 1920x1080 Very High Preset | |
| Schenker XMG Fusion 15 XFU15L19 | |
| Média NVIDIA GeForce RTX 2070 Max-Q (106 - 128.1, n=2) | |
| Shadow of the Tomb Raider - 1920x1080 Highest Preset AA:T | |
| Média da turma Gaming (96 - 116, n=2, últimos 2 anos) | |
| Média NVIDIA GeForce RTX 2070 Max-Q (57 - 89, n=12) | |
| Asus Zephyrus S GX502GW | |
| Schenker XMG Fusion 15 XFU15L19 | |
| The Witcher 3 - 1920x1080 Ultra Graphics & Postprocessing (HBAO+) | |
| Média da turma Gaming (95 - 240, n=8, últimos 2 anos) | |
| Asus Zephyrus S GX502GW | |
| Razer Blade 15 RTX 2070 Max-Q | |
| Média NVIDIA GeForce RTX 2070 Max-Q (56 - 83.8, n=31) | |
| Schenker XMG Fusion 15 XFU15L19 | |
| Acer Predator Triton 500 PT515-51-71PZ | |
| Gigabyte Aero 15 Classic-XA | |
| baixo | média | alto | ultra | |
|---|---|---|---|---|
| The Witcher 3 (2015) | 66 | |||
| Shadow of the Tomb Raider (2018) | 77 | 72 | ||
| Farming Simulator 19 (2018) | 128.1 | |||
| Anthem (2019) | 70.6 | |||
| Dirt Rally 2.0 (2019) | 77.4 | |||
| F1 2019 (2019) | 105 |
Barulho
| Ocioso |
| 30 / 30 / 30 dB |
| Carga |
| 46 / 51.6 dB |
 | ||
30 dB silencioso 40 dB(A) audível 50 dB(A) ruidosamente alto |
||
min: | ||
| Schenker XMG Fusion 15 XFU15L19 GeForce RTX 2070 Max-Q, i7-9750H, Samsung SSD 970 EVO Plus 500GB | Asus Zephyrus S GX502GW GeForce RTX 2070 Mobile, i7-9750H, 2x Intel SSD 660p SSDPEKNW512G8 (RAID 0) | Acer Predator Triton 500 PT515-51-71PZ GeForce RTX 2070 Max-Q, i7-9750H, WDC PC SN720 SDAPNTW-512G | Gigabyte Aero 15 Classic-XA GeForce RTX 2070 Max-Q, i7-9750H, Intel SSD 760p SSDPEKKW512G8 | Razer Blade 15 RTX 2070 Max-Q GeForce RTX 2070 Max-Q, i7-8750H, Samsung SSD PM981 MZVLB512HAJQ | |
|---|---|---|---|---|---|
| Emissions | |||||
| Fan Noise (dB(A)) | 51.6 | ||||
| Noise | -9% | -5% | -8% | 9% | |
| desligado / ambiente * (dB) | 30 | 30 -0% | 30 -0% | 30 -0% | 28.8 4% |
| Idle Minimum * (dB) | 30 | 31 -3% | 30 -0% | 31 -3% | 28.8 4% |
| Idle Average * (dB) | 30 | 33 -10% | 33 -10% | 34 -13% | 28.8 4% |
| Idle Maximum * (dB) | 30 | 38 -27% | 39 -30% | 39 -30% | 29.4 2% |
| Load Average * (dB) | 46 | 50 -9% | 45 2% | 46 -0% | 35.7 22% |
| Witcher 3 ultra * (dB) | 51.5 | 53 -3% | 49 5% | 53 -3% | 42.5 17% |
| Load Maximum * (dB) | 51.6 | 56 -9% | 51 1% | 55 -7% | 45 13% |
| Média Total (Programa/Configurações) | -9% /
-9% | -5% /
-5% | -8% /
-8% | 9% /
9% |
* ... menor é melhor
(-) A temperatura máxima no lado superior é 52.7 °C / 127 F, em comparação com a média de 40.4 °C / 105 F , variando de 21.2 a 68.8 °C para a classe Gaming.
(-) A parte inferior aquece até um máximo de 52.2 °C / 126 F, em comparação com a média de 43.2 °C / 110 F
(±) Em uso inativo, a temperatura média para o lado superior é 32.3 °C / 90 F, em comparação com a média do dispositivo de 33.9 °C / ### class_avg_f### F.
(-) Jogando The Witcher 3, a temperatura média para o lado superior é 42.1 °C / 108 F, em comparação com a média do dispositivo de 33.9 °C / ## #class_avg_f### F.
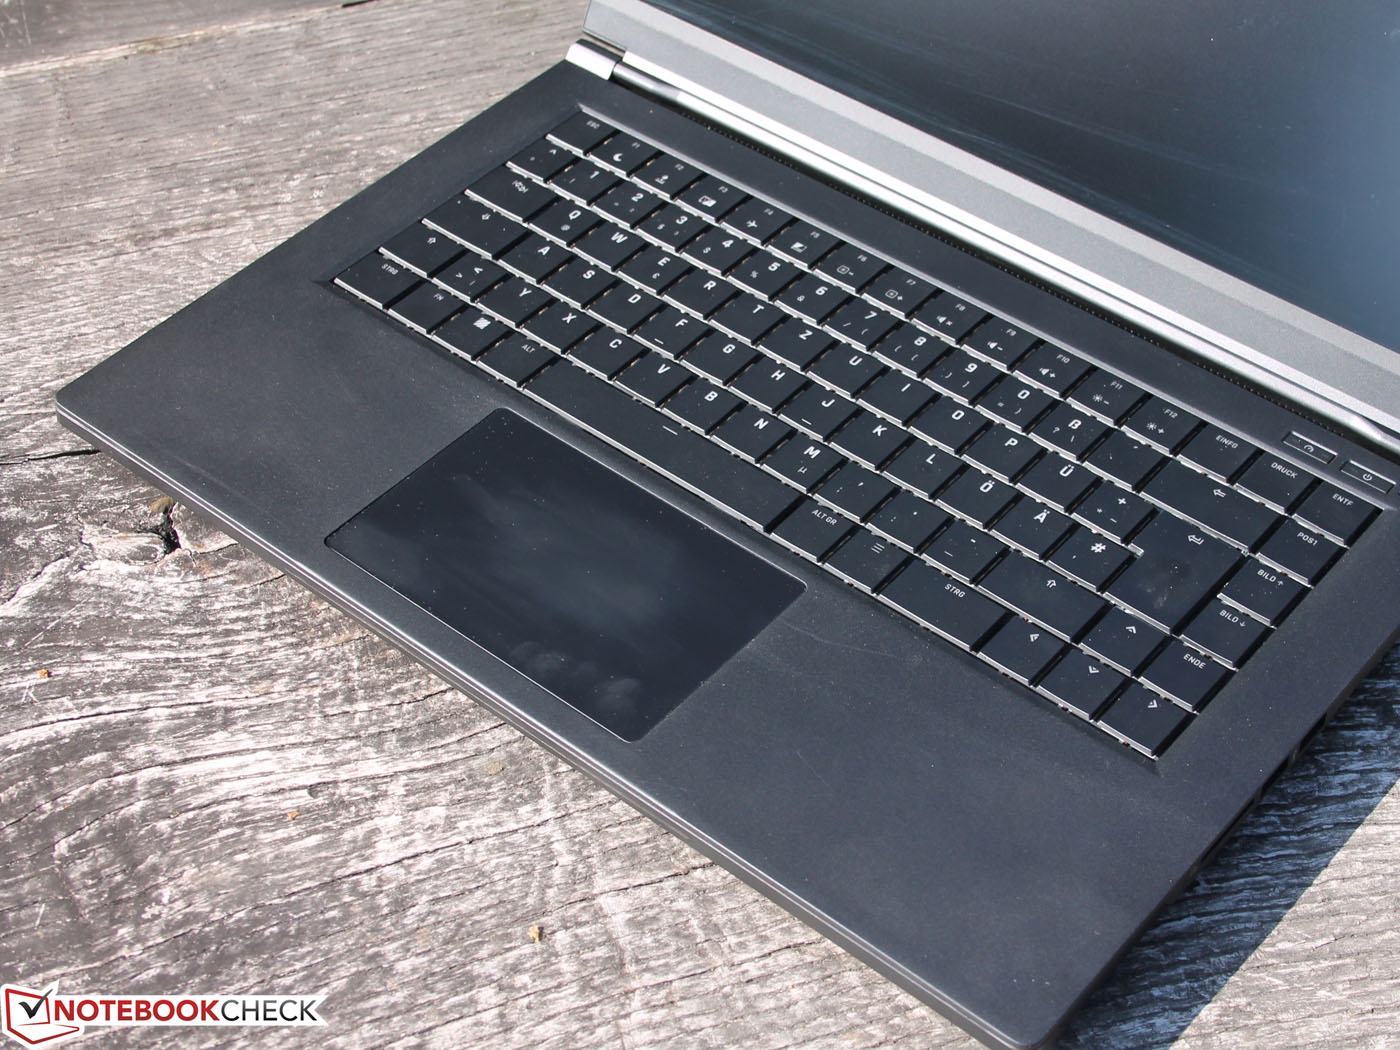
(±) Os apoios para as mãos e o touchpad podem ficar muito quentes ao toque, com um máximo de 37.1 °C / 98.8 F.
(-) A temperatura média da área do apoio para as mãos de dispositivos semelhantes foi 28.8 °C / 83.8 F (-8.3 °C / -15 F).
Schenker XMG Fusion 15 XFU15L19 análise de áudio
(-) | alto-falantes não muito altos (###valor### dB)
Graves 100 - 315Hz
(-) | quase nenhum baixo - em média 17.3% menor que a mediana
(±) | a linearidade dos graves é média (11.3% delta para a frequência anterior)
Médios 400 - 2.000 Hz
(±) | médios mais altos - em média 6% maior que a mediana
(±) | a linearidade dos médios é média (12.9% delta para frequência anterior)
Altos 2 - 16 kHz
(+) | agudos equilibrados - apenas 3.1% longe da mediana
(±) | a linearidade dos máximos é média (12% delta para frequência anterior)
Geral 100 - 16.000 Hz
(±) | a linearidade do som geral é média (26.9% diferença em relação à mediana)
Comparado com a mesma classe
» 93% de todos os dispositivos testados nesta classe foram melhores, 2% semelhantes, 6% piores
» O melhor teve um delta de 6%, a média foi 18%, o pior foi 132%
Comparado com todos os dispositivos testados
» 82% de todos os dispositivos testados foram melhores, 4% semelhantes, 14% piores
» O melhor teve um delta de 4%, a média foi 24%, o pior foi 134%
Asus Zephyrus S GX502GW análise de áudio
(+) | os alto-falantes podem tocar relativamente alto (###valor### dB)
Graves 100 - 315Hz
(±) | graves reduzidos - em média 12.7% menor que a mediana
(±) | a linearidade dos graves é média (8.5% delta para a frequência anterior)
Médios 400 - 2.000 Hz
(+) | médios equilibrados - apenas 4.5% longe da mediana
(+) | médios são lineares (4.1% delta para frequência anterior)
Altos 2 - 16 kHz
(±) | máximos mais altos - em média 6.7% maior que a mediana
(±) | a linearidade dos máximos é média (10.8% delta para frequência anterior)
Geral 100 - 16.000 Hz
(+) | o som geral é linear (14.6% diferença em relação à mediana)
Comparado com a mesma classe
» 28% de todos os dispositivos testados nesta classe foram melhores, 7% semelhantes, 65% piores
» O melhor teve um delta de 6%, a média foi 18%, o pior foi 132%
Comparado com todos os dispositivos testados
» 19% de todos os dispositivos testados foram melhores, 4% semelhantes, 77% piores
» O melhor teve um delta de 4%, a média foi 24%, o pior foi 134%
| desligado | |
| Ocioso | |
| Carga |
|
Key:
min: | |
| Schenker XMG Fusion 15 XFU15L19 i7-9750H, GeForce RTX 2070 Max-Q, Samsung SSD 970 EVO Plus 500GB, IPS, 1920x1080, 15.6" | Asus Zephyrus S GX502GW i7-9750H, GeForce RTX 2070 Mobile, 2x Intel SSD 660p SSDPEKNW512G8 (RAID 0), IPS, 1920x1080, 15.6" | Acer Predator Triton 500 PT515-51-71PZ i7-9750H, GeForce RTX 2070 Max-Q, WDC PC SN720 SDAPNTW-512G, IPS, 1920x1080, 15.6" | Gigabyte Aero 15 Classic-XA i7-9750H, GeForce RTX 2070 Max-Q, Intel SSD 760p SSDPEKKW512G8, IGZO, 1920x1080, 15.6" | Razer Blade 15 RTX 2070 Max-Q i7-8750H, GeForce RTX 2070 Max-Q, Samsung SSD PM981 MZVLB512HAJQ, IPS, 1920x1080, 15.6" | Média NVIDIA GeForce RTX 2070 Max-Q | Média da turma Gaming | |
|---|---|---|---|---|---|---|---|
| Power Consumption | -61% | 15% | -43% | 8% | -28% | -23% | |
| Idle Minimum * (Watt) | 7.5 | 24 -220% | 7 7% | 21 -180% | 10.4 -39% | 15.4 ? -105% | 13.2 ? -76% |
| Idle Average * (Watt) | 14.6 | 27 -85% | 12 18% | 23 -58% | 14.6 -0% | 20 ? -37% | 18.9 ? -29% |
| Idle Maximum * (Watt) | 17 | 33 -94% | 22 -29% | 32 -88% | 16.3 4% | 26.7 ? -57% | 24.3 ? -43% |
| Load Average * (Watt) | 181 | 129 29% | 86 52% | 97 46% | 88.5 51% | 105.2 ? 42% | 108.3 ? 40% |
| Witcher 3 ultra * (Watt) | 170 | 176 -4% | 144 15% | 148 13% | 155.4 9% | ||
| Load Maximum * (Watt) | 243 | 216 11% | 177 27% | 213 12% | 182.4 25% | 201 ? 17% | 254 ? -5% |
* ... menor é melhor
| Schenker XMG Fusion 15 XFU15L19 i7-9750H, GeForce RTX 2070 Max-Q, 93 Wh | Asus Zephyrus S GX502GW i7-9750H, GeForce RTX 2070 Mobile, 76 Wh | Acer Predator Triton 500 PT515-51-71PZ i7-9750H, GeForce RTX 2070 Max-Q, Wh | Gigabyte Aero 15 Classic-XA i7-9750H, GeForce RTX 2070 Max-Q, 94.24 Wh | Razer Blade 15 RTX 2070 Max-Q i7-8750H, GeForce RTX 2070 Max-Q, 80 Wh | Gigabyte Aero 15-X9 i7-8750H, GeForce RTX 2070 Max-Q, 94.24 Wh | Acer Predator Triton 500 i7-8750H, GeForce RTX 2080 Max-Q, 82 Wh | MSI GS65 8RF-019DE Stealth Thin i7-8750H, GeForce GTX 1070 Max-Q, 82 Wh | Média da turma Gaming | |
|---|---|---|---|---|---|---|---|---|---|
| Duração da bateria | -36% | 20% | 38% | 10% | 33% | -31% | -5% | 3% | |
| Reader / Idle (h) | 9.3 | 5.9 -37% | 11.1 19% | 9.1 -2% | 11.4 23% | 9.2 -1% | 5.6 -40% | 8.5 -9% | 8.71 ? -6% |
| WiFi v1.3 (h) | 6 | 3.7 -38% | 8 33% | 7 17% | 6.5 8% | 6.4 7% | 3.2 -47% | 6 0% | 7.04 ? 17% |
| Load (h) | 1.5 | 1 -33% | 1.6 7% | 3 100% | 1.5 0% | 2.9 93% | 1.4 -7% | 1.4 -7% | 1.47 ? -2% |
| H.264 (h) | 6.8 | 6.1 | 5.9 | 8.26 ? |
Pro
Contra
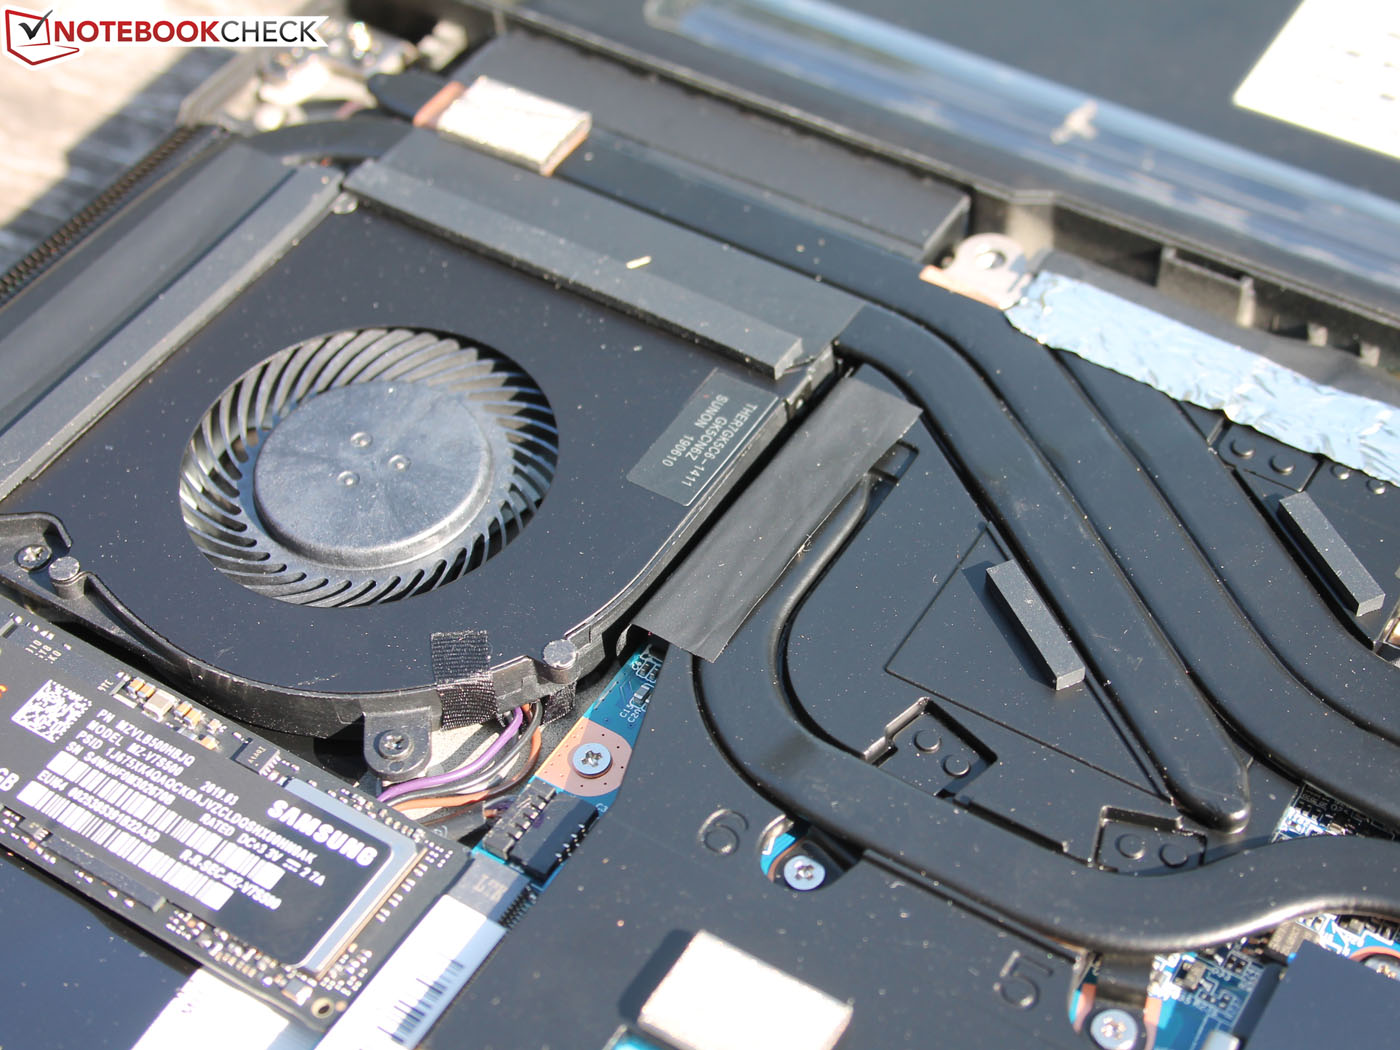
O lado técnico das coisas se beneficiou muito da cooperação Intel-Schenker: O Fusion 15 oferece mais desempenho do que os portáteis de jogos finos concorrentes, apesar de estar equipado com o mesmo hardware. O desempenho da CPU se beneficia mais, enquanto as diferenças nos jogos são marginais. Isso não apenas reflete bem na solução de resfriamento, mas também representa um bom equilíbrio entre os limites de potência do SoC e da GPU.
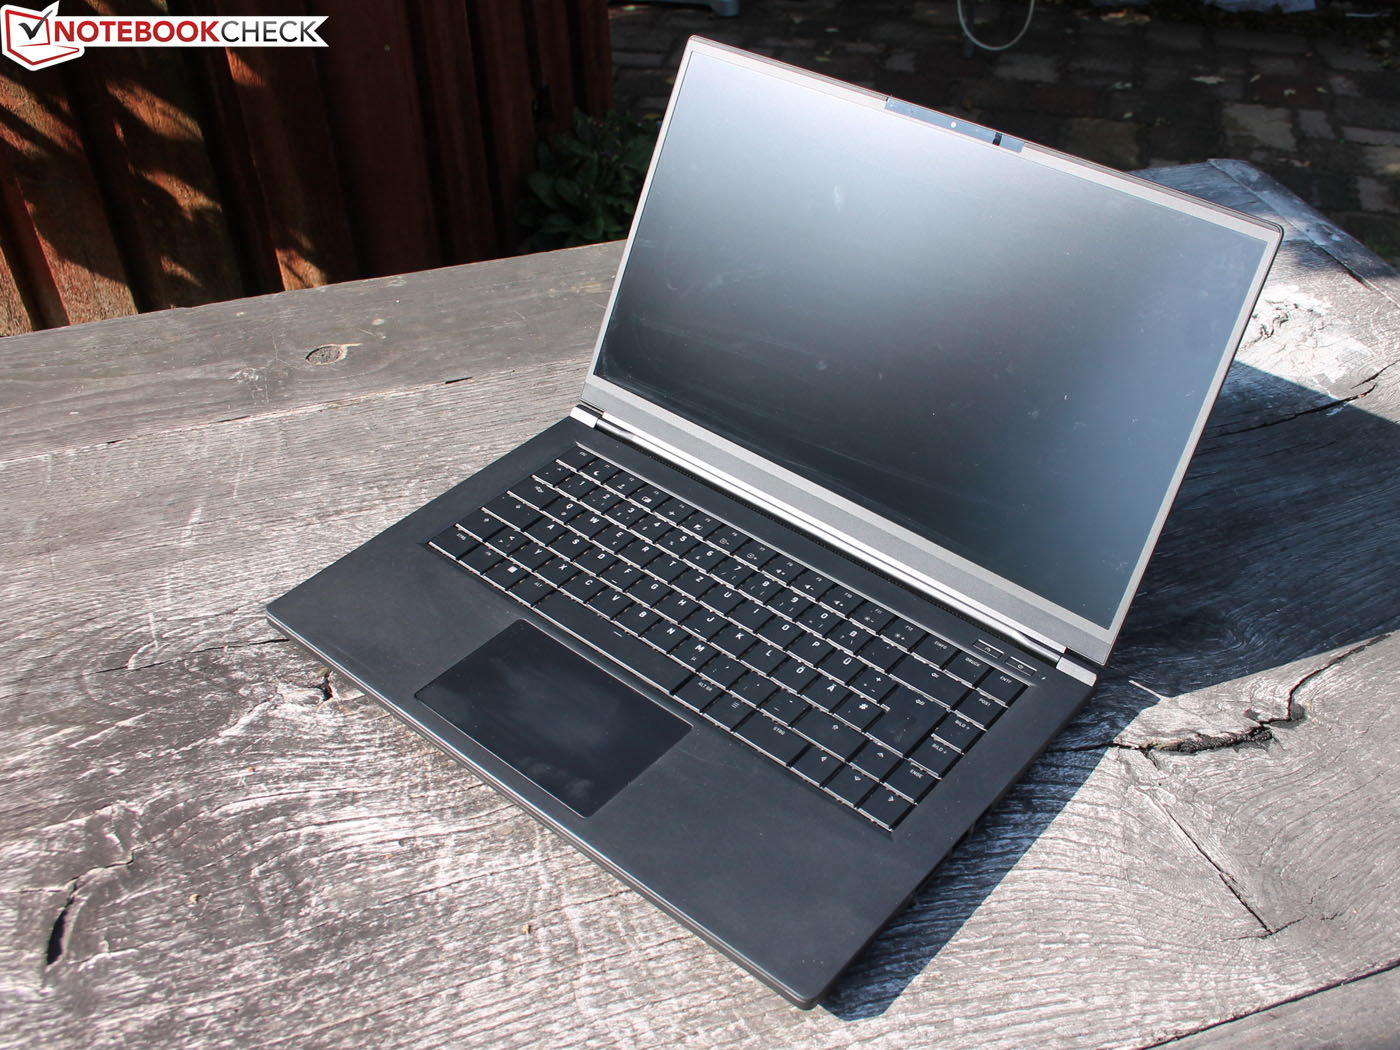
Nossa configuração do Fusion 15 (RTX 2070) combina portabilidade e desempenho, que geralmente são mutuamente exclusivos, como quase nenhum outro dispositivo.
Por outro lado, o fino portátil de 15 polegadas possui uma bateria surpreendentemente boa: Conseguimos registrar tempos de duração de seis e pouco mais de nove horas em nosso teste de Wi-Fi e durante o modo inativo, respectivamente. Embora existam outros dispositivos que podem corresponder a esses números (Acer Predator Triton 500), eles não conseguem obter o mesmo tipo de desempenho dos componentes quando estão conectados na tomada.
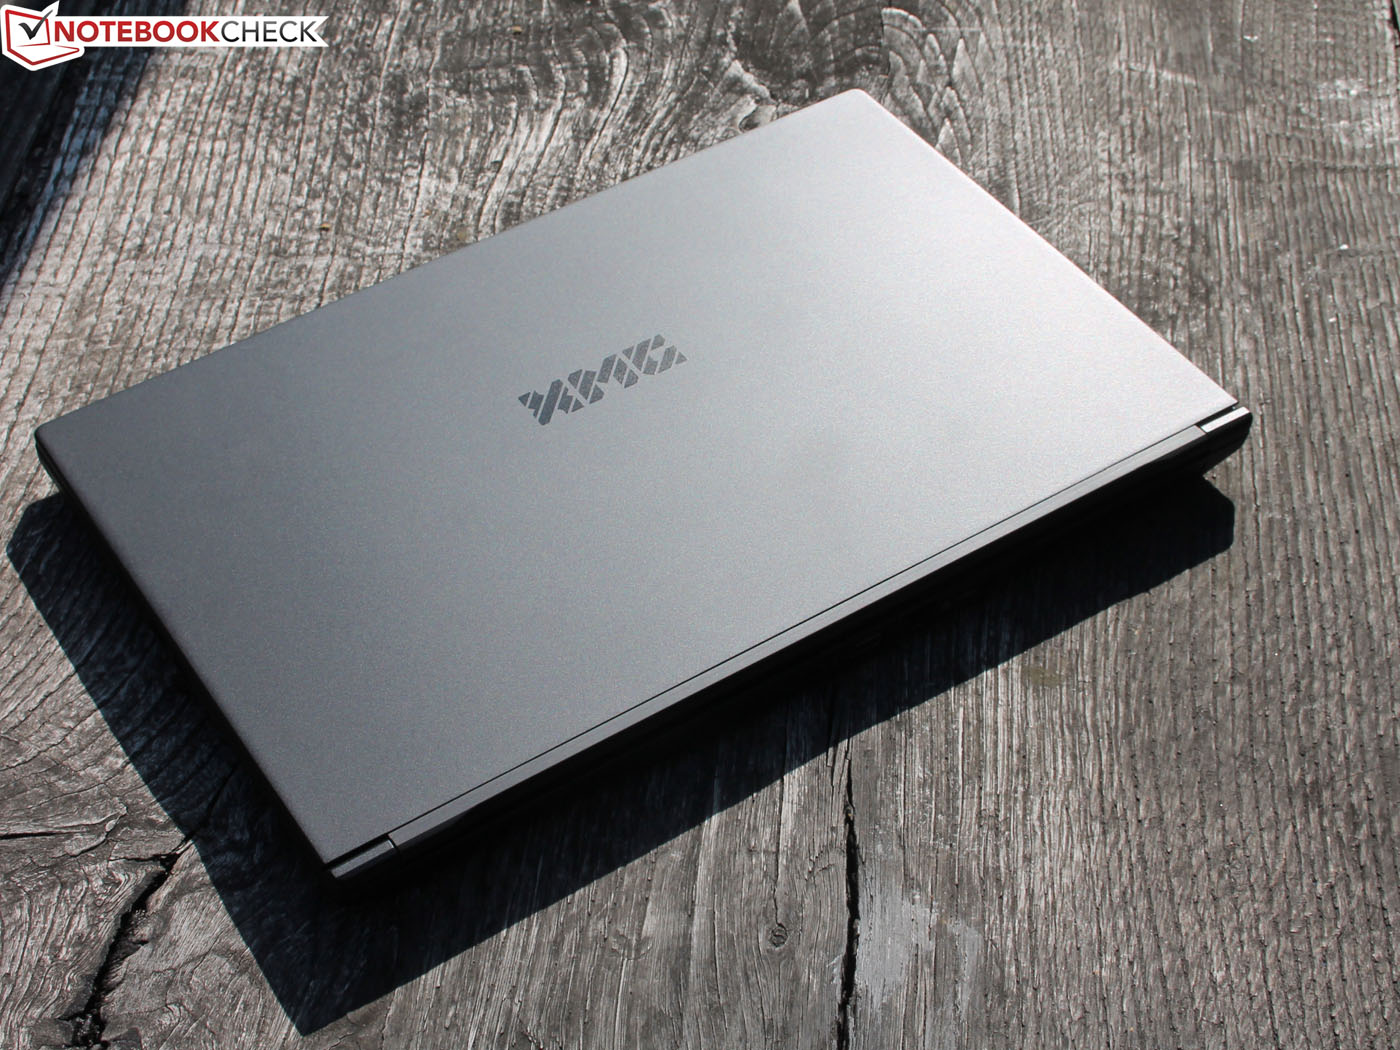
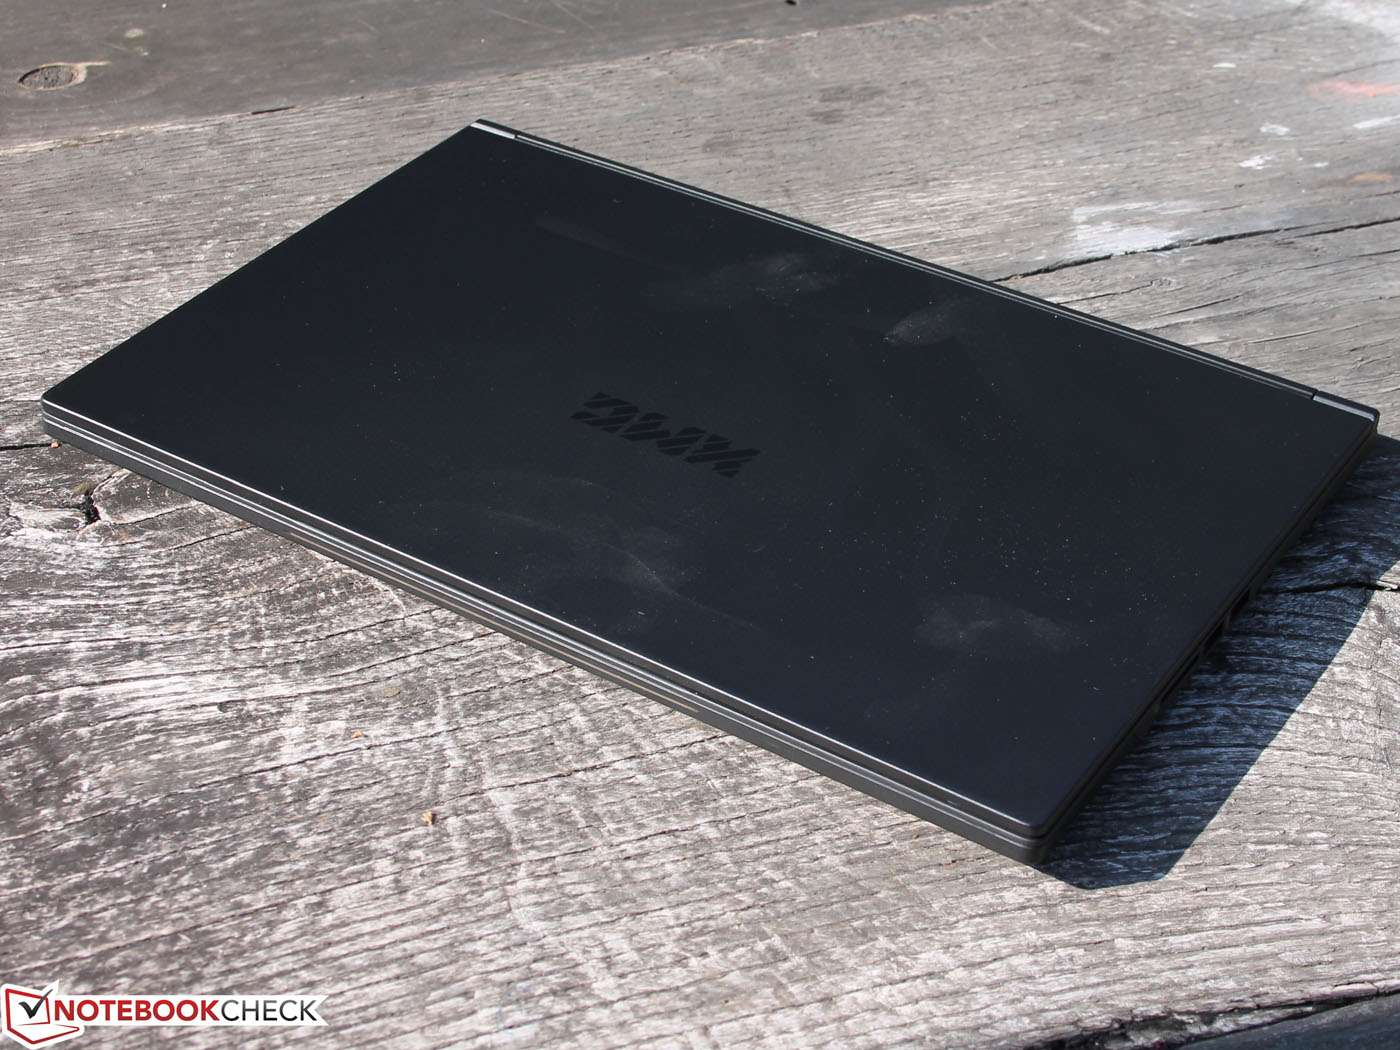
A carcaça de liga de alumínio-magnésio pesa 200 gramas a menos que seus equivalentes de alumínio. Apesar disso, a qualidade de construção da carcaça modesta, mate e fácil de manusear, é boa.
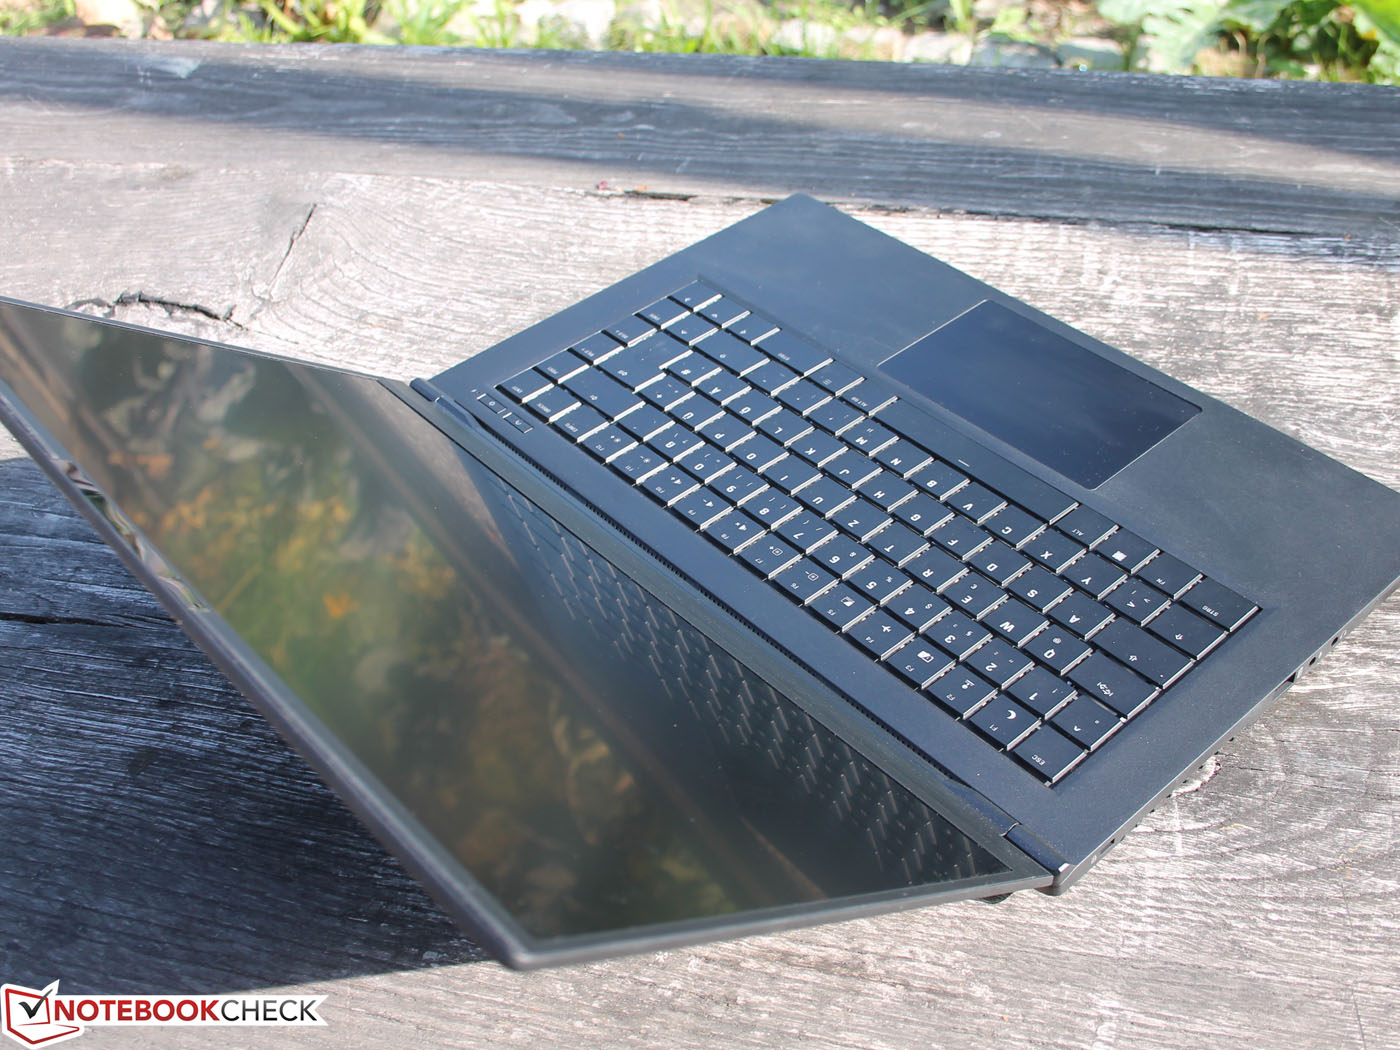
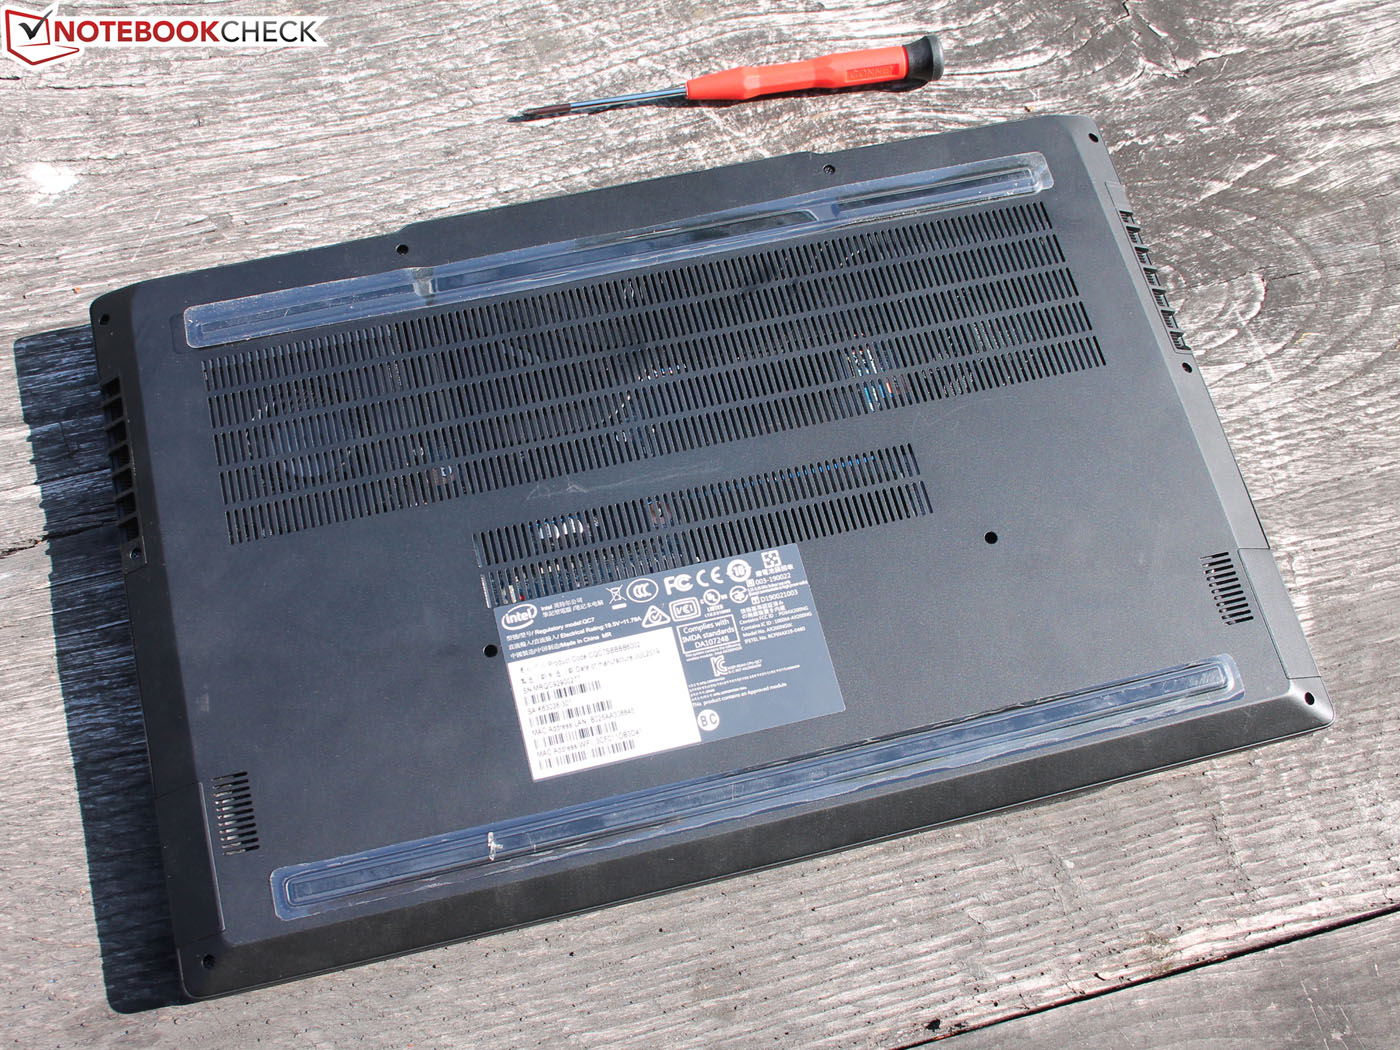
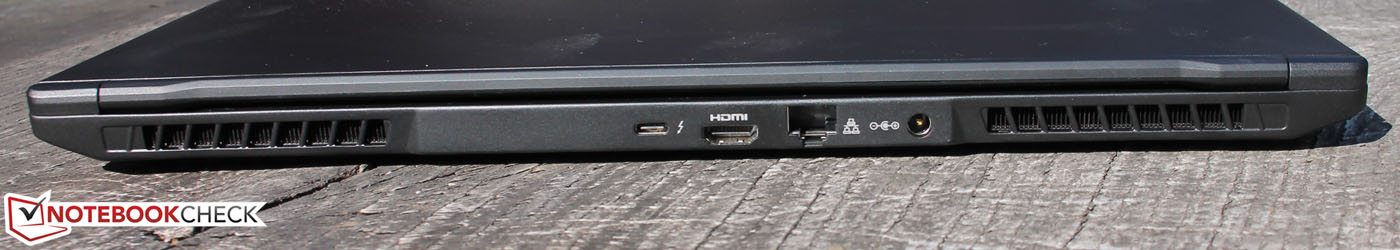
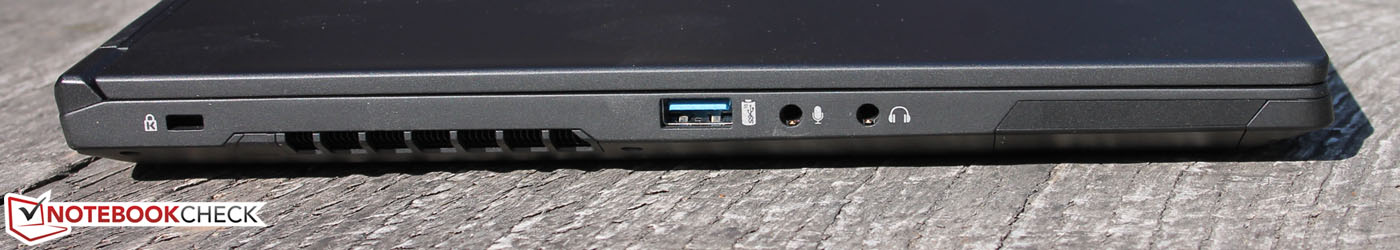
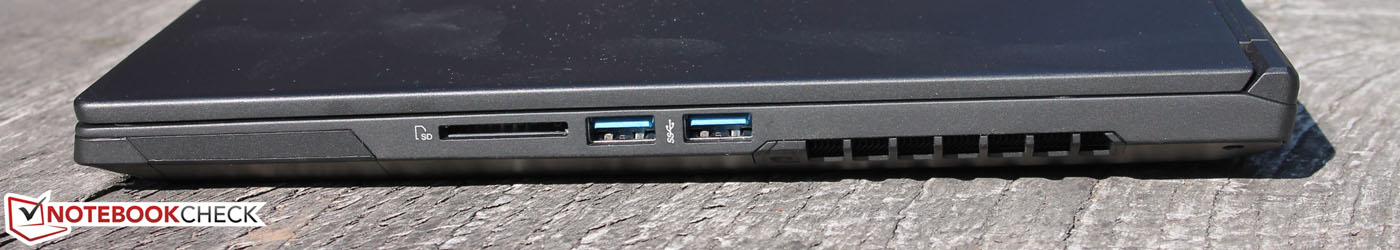
A Schenker também não compromete a conectividade, a manutenção e a capacidade de atualização. O conector Thunderbolt ativado para DisplayPort e os dois slots M.2-2280 são igualmente impressionantes.
As desvantagens incluem, acima de tudo, os altos níveis de ruído durante os jogos e sob uso intenso. Para trabalhos criativos, a falta de cobertura sRGB plena e a baixa taxa de contraste também podem ser um problema. Por outro lado, os gamers serão afetados menos e poderão desfrutar de 144 Hz e tempos de resposta breves. Esses recursos quase compensam o contraste inferior.
Se você procura ainda mais desempenho, fineza e leveza, pode não ser a categoria certa para você. A Schenker e a Intel criaram uma combinação muito boa de portabilidade e desempenho.
Schenker XMG Fusion 15 XFU15L19
- 10/17/2019 v7 (old)
Sebastian Jentsch
Price comparison
