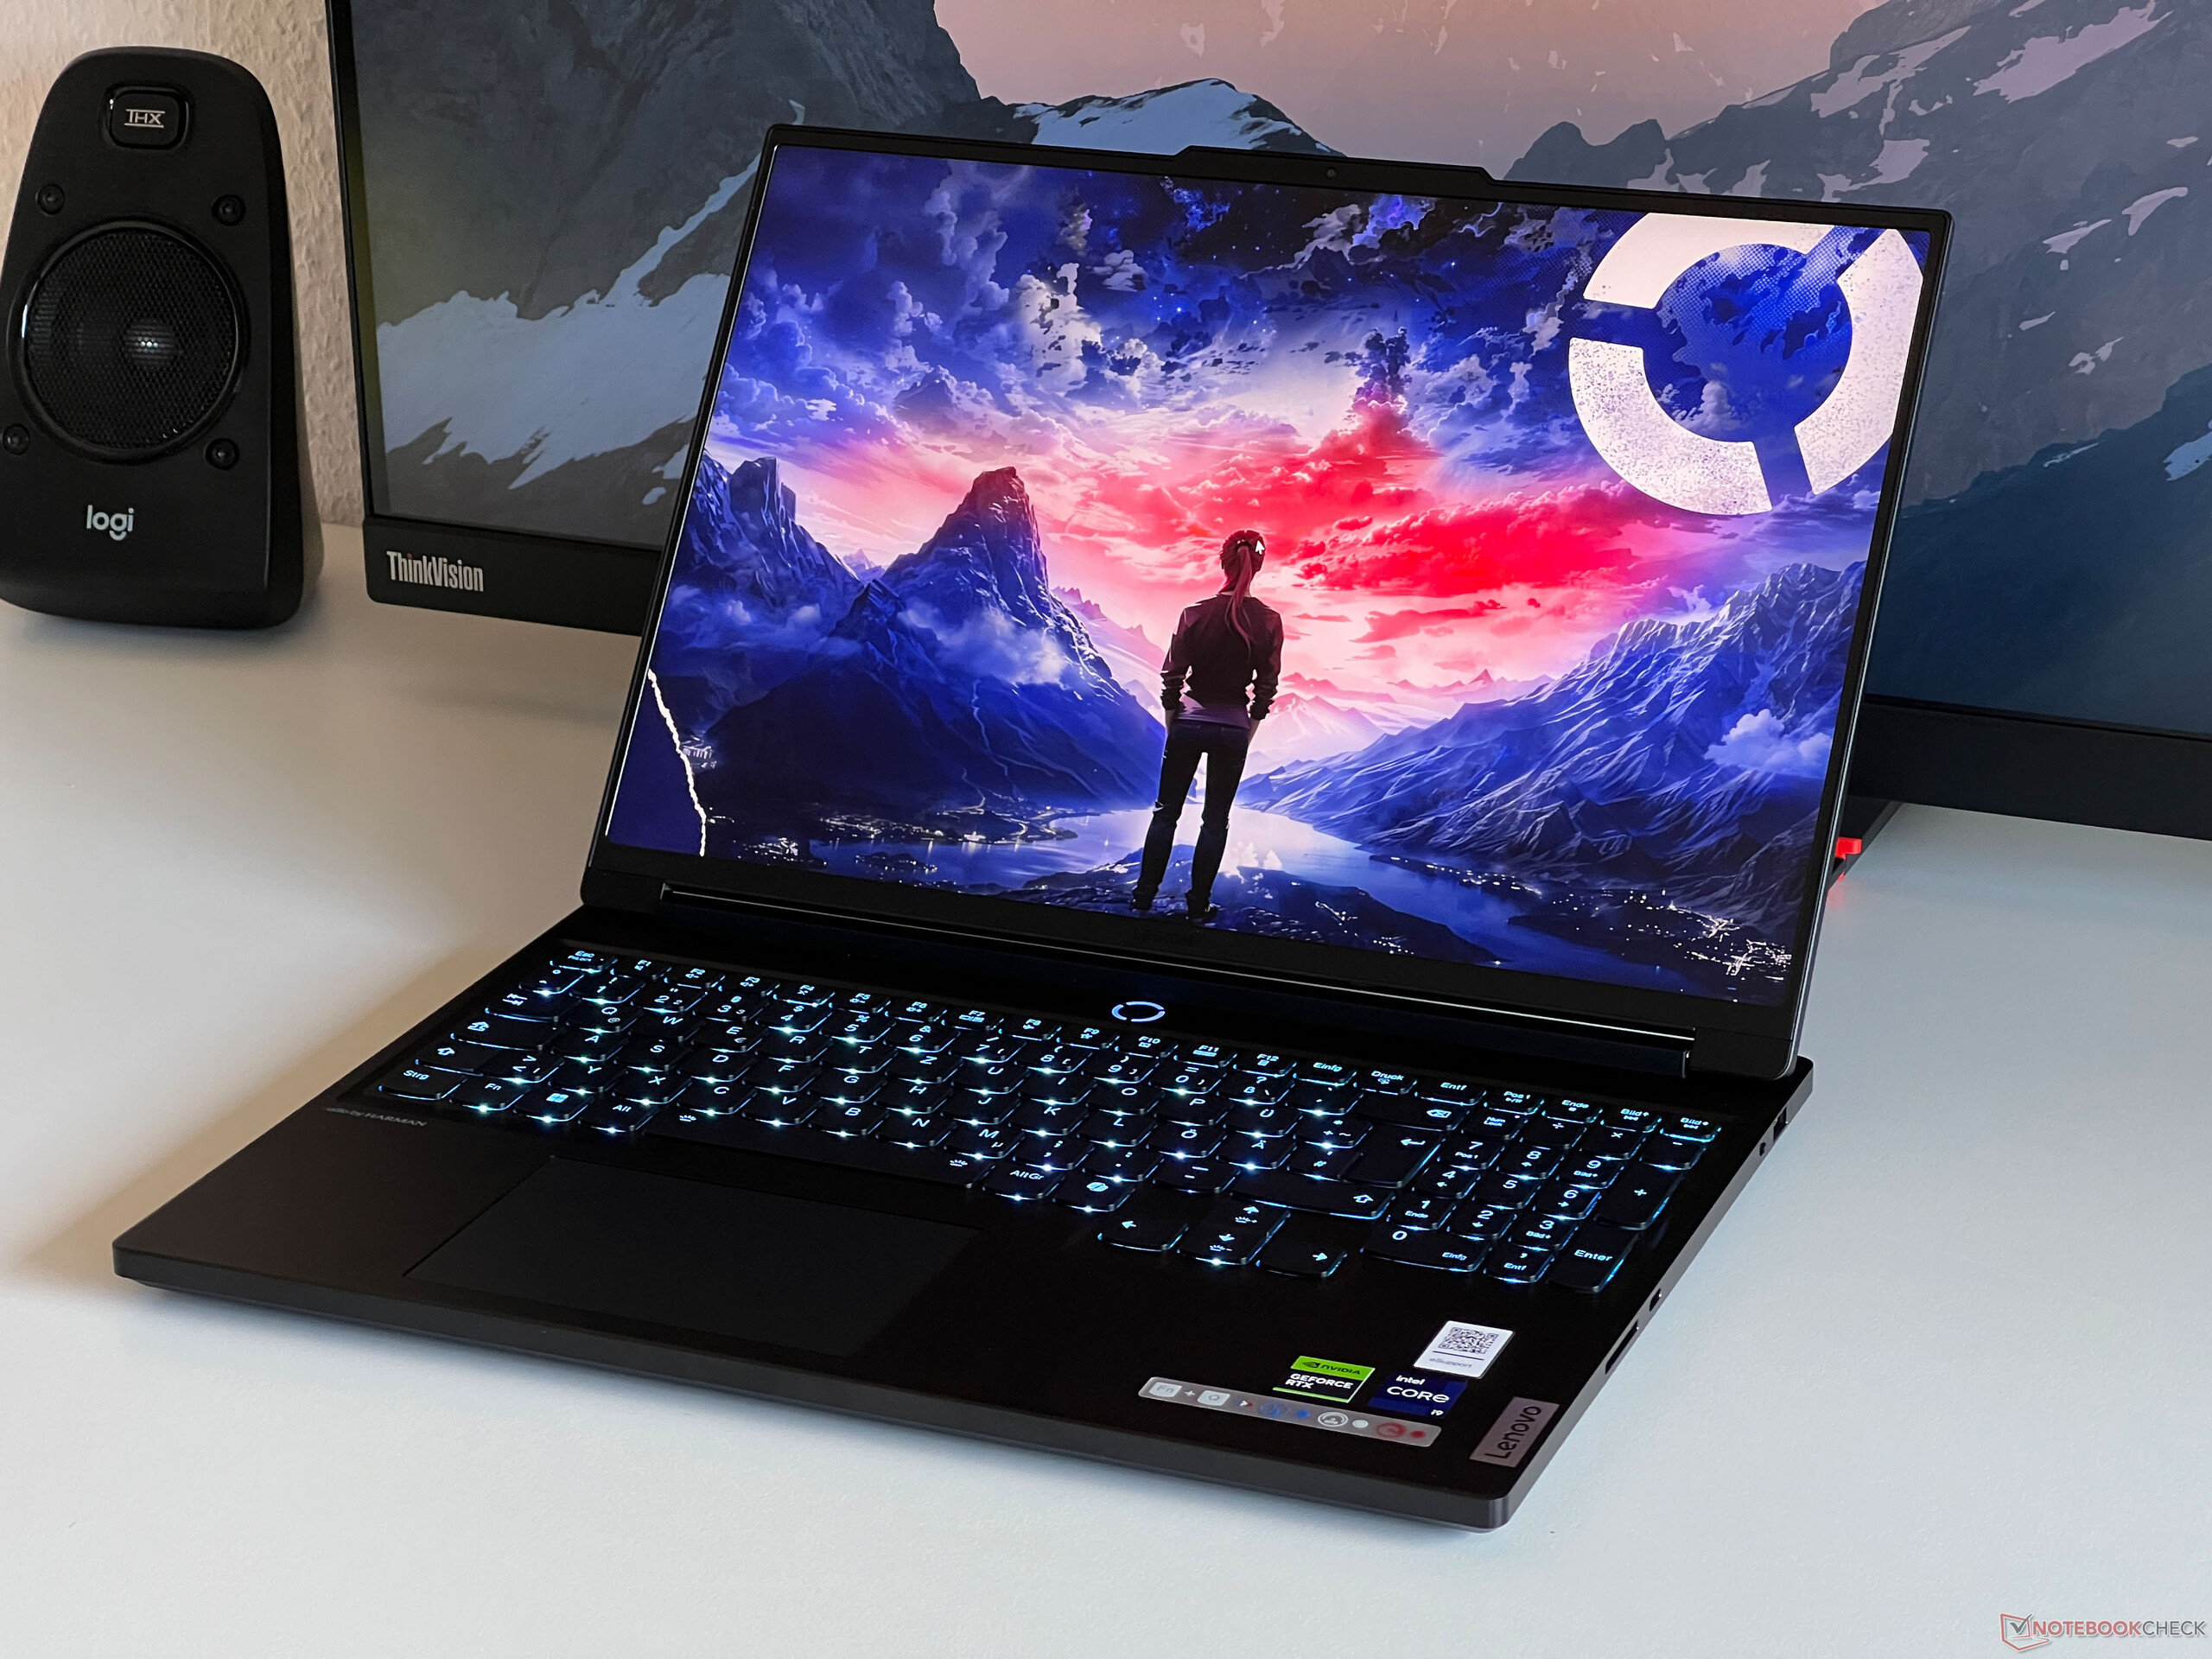
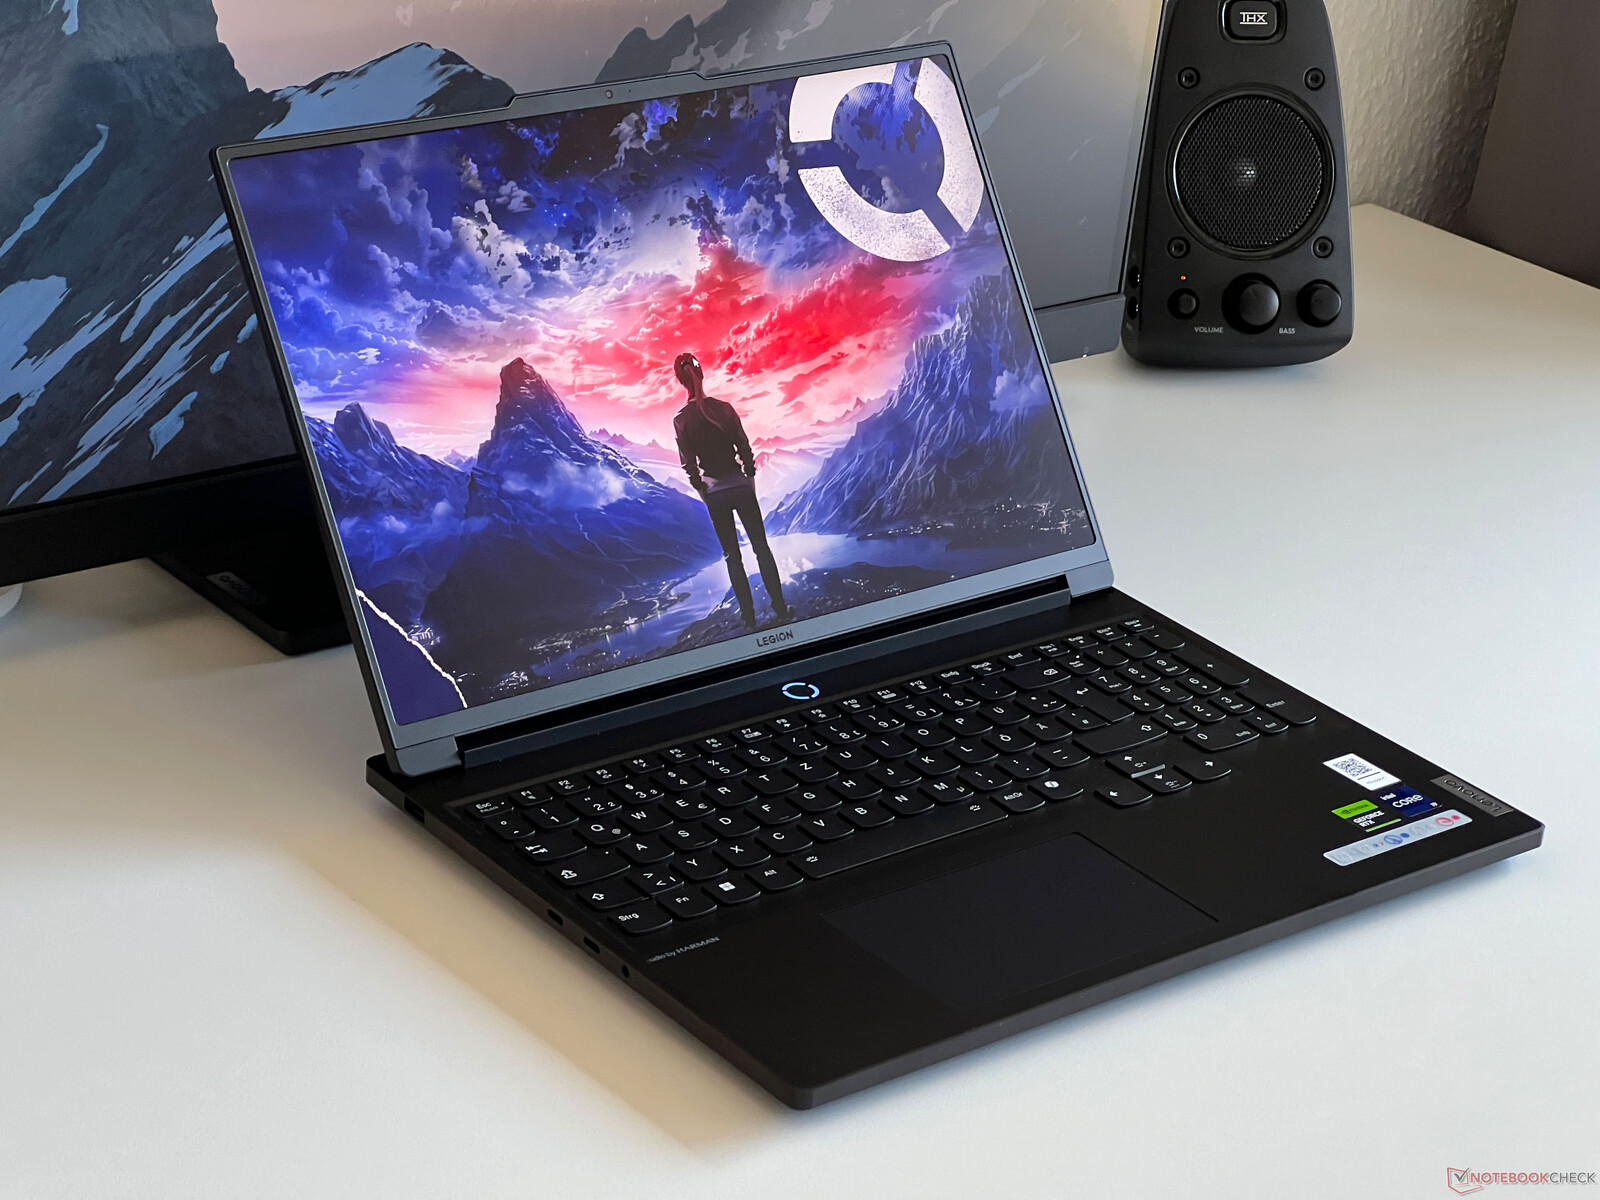
Análise do laptop Lenovo Legion 7 16 G9 - Uma máquina para jogos com tela de 3.2K, CPU HX e um laptop RTX 4070 com overclock
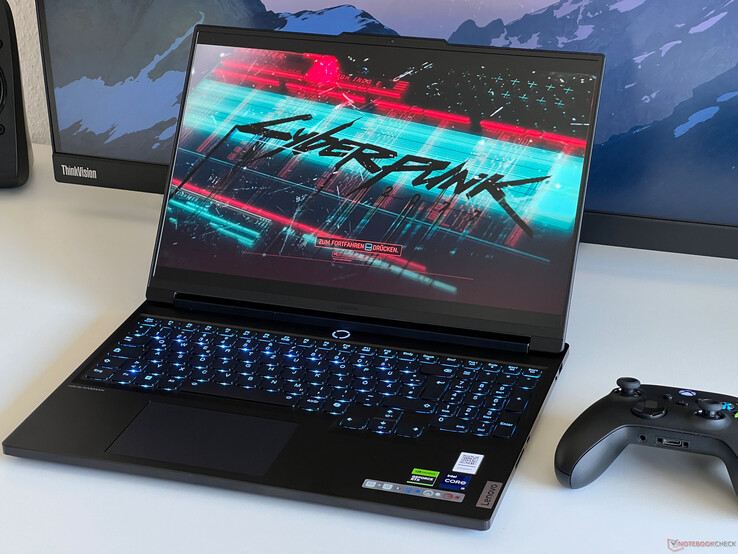
O Legion 7 16 é o Legion Pro 7 16 mais barato e mais fino do Pro 7 16, que analisamos recentemente. Há diferenças, especialmente no que diz respeito às placas de vídeo, sendo que a GPU máxima disponível do Legion 7 normal é o laptop RTX 4070. Entretanto, em termos de processador, são usados os mesmos chips Intel HX e, além dos painéis WQHD, há um painel IPS 3.2K de alta resolução e 165 Hz opcional.
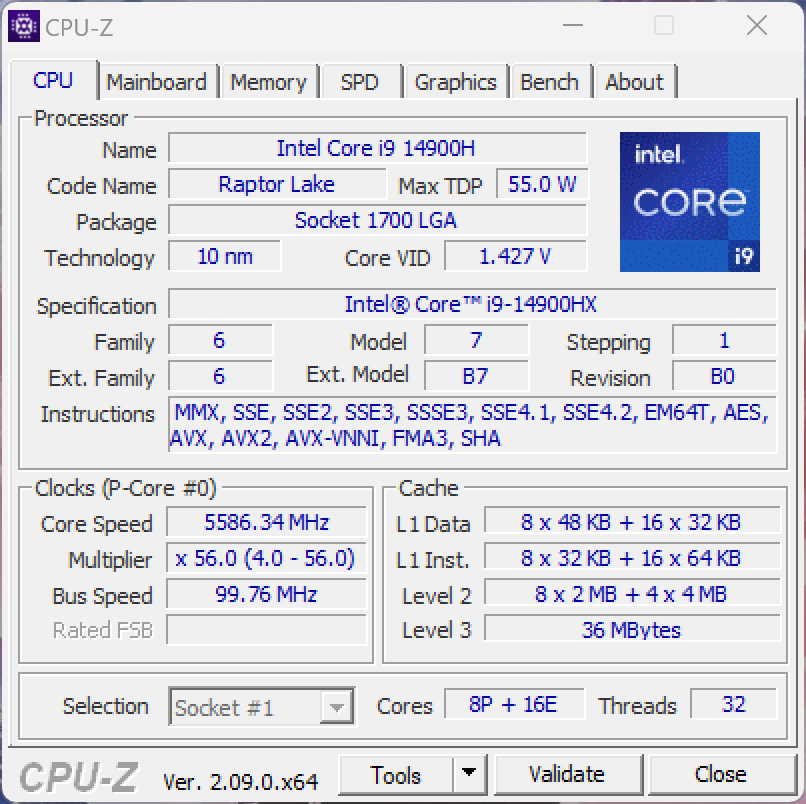
Nosso dispositivo de análise é a variante Campus de US$ 2.249, que vem com um processador Core i9-14900HXGeForce RTX 4070, 32 GB de RAM, um SSD de 1 TB e um painel de 3,2K. Atualmente, ainda não há variantes correspondentes para clientes regulares, mas o preço deve ser cerca de US$ 250-300 mais alto.
Possíveis concorrentes em comparação
Avaliação | Data | Modelo | Peso | Altura | Size | Resolução | Preço |
|---|---|---|---|---|---|---|---|
| 90.8 % v7 (old) | 04/2024 | Lenovo Legion 7 16 IRX G9 i9-14900HX, GeForce RTX 4070 Laptop GPU | 2.3 kg | 19.8 mm | 16.00" | 3200x2000 | |
| 89.3 % v7 (old) | 04/2024 | Lenovo Legion Pro 5 16IRX9 i9-14900HX, GeForce RTX 4070 Laptop GPU | 2.5 kg | 26.95 mm | 16.00" | 2560x1600 | |
| 87.4 % v7 (old) | 04/2024 | Aorus 16X 2024 i9-14900HX, GeForce RTX 4070 Laptop GPU | 2.3 kg | 20 mm | 16.00" | 2560x1600 | |
| 88.4 % v7 (old) | 02/2024 | HP Omen Transcend 16-u1095ng i9-14900HX, GeForce RTX 4070 Laptop GPU | 2.3 kg | 20 mm | 16.00" | 2560x1600 | |
| 90.2 % v7 (old) | 03/2024 | Alienware m16 R2 Ultra 7 155H, GeForce RTX 4070 Laptop GPU | 2.5 kg | 23.5 mm | 16.00" | 2560x1600 | |
| 89.2 % v7 (old) | 10/2023 | Schenker XMG CORE 16 (L23) R7 7840HS, GeForce RTX 4070 Laptop GPU | 2.4 kg | 26.1 mm | 16.00" | 2560x1600 | |
| 89.5 % v7 (old) | 03/2024 | Lenovo Legion Pro 7 16IRX9H i9-14900HX, GeForce RTX 4080 Laptop GPU | 2.7 kg | 21.95 mm | 16.00" | 2560x1600 |
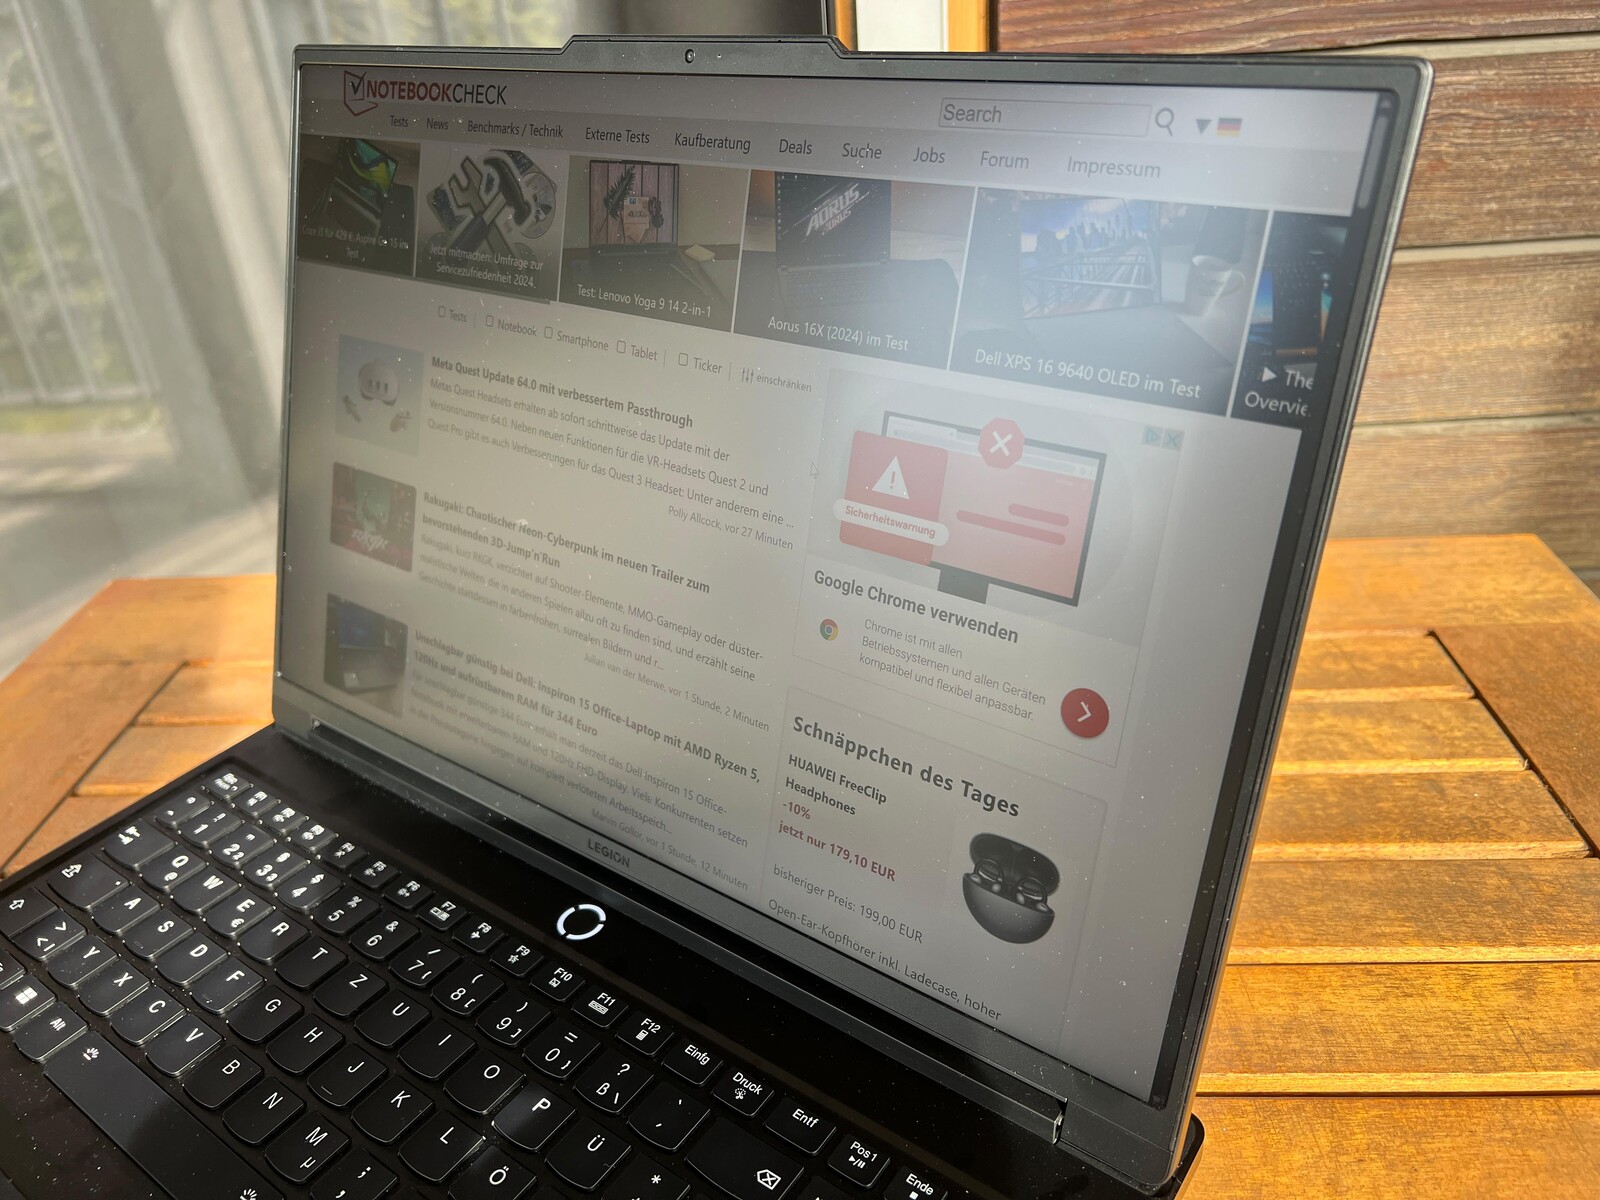
Case - Um ímã de alumínio preto para impressões digitais
O Legion 7 16 é um laptop para jogos comparativamente fino que também é muito discreto devido ao seu gabinete de alumínio preto. Ao contrário do Legion Pro 7, não há elementos de resfriamento salientes nas laterais do dispositivo. Visualmente, o gabinete parece muito bom, mas apenas por um curto período, pois as superfícies lisas atraem magicamente as impressões digitais. Por esse motivo, o senhor deve ter sempre um pano à mão para limpar a capa. As bordas da tela são muito finas e apenas a saliência da câmera prejudica o visual, embora isso facilite a abertura do case.
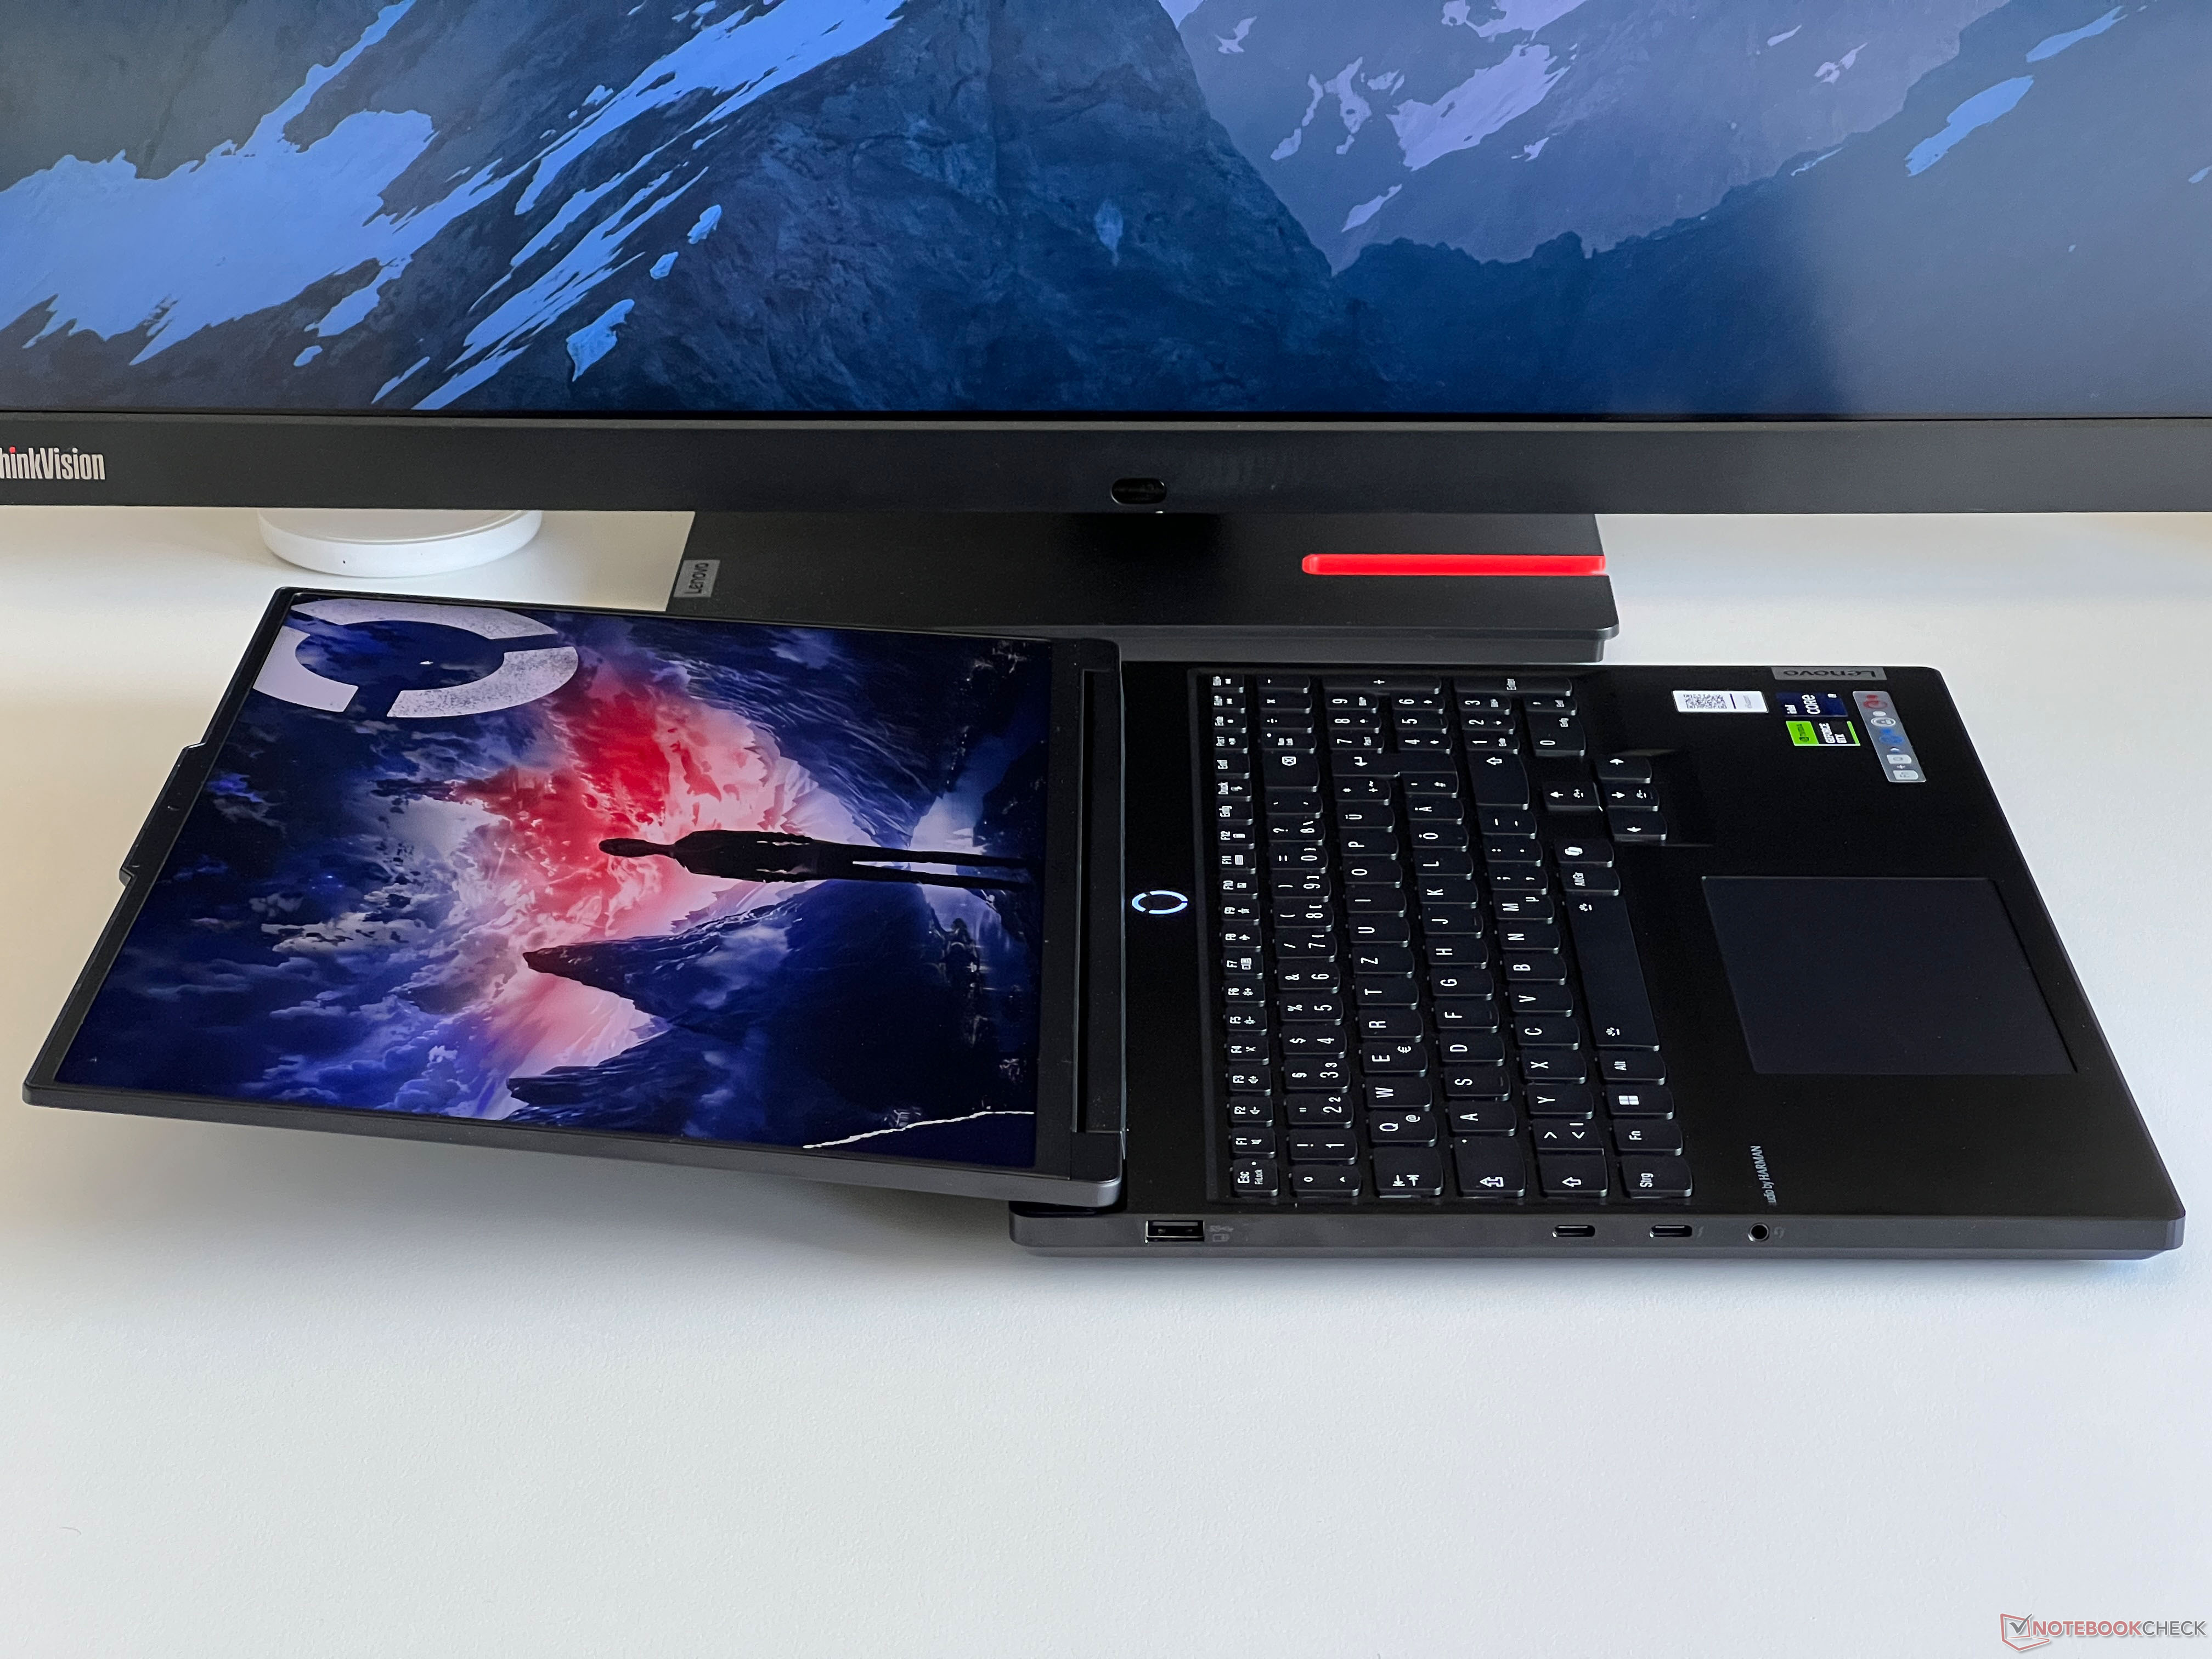
A estabilidade e a qualidade de construção da capa são muito boas e não conseguimos provocar nenhum tipo de ruído de rangido. Além disso, é praticamente impossível flexionar o teclado quando a pressão é aplicada. A fina tampa da tela é um pouco mais flexível, mas essa também é uma área em que não conseguimos causar nenhuma distorção na imagem. Para nosso gosto, as dobradiças poderiam ser um pouco mais firmes, pois há um movimento de balanço visível ao ajustar o ângulo de abertura (máximo de ~170 graus).
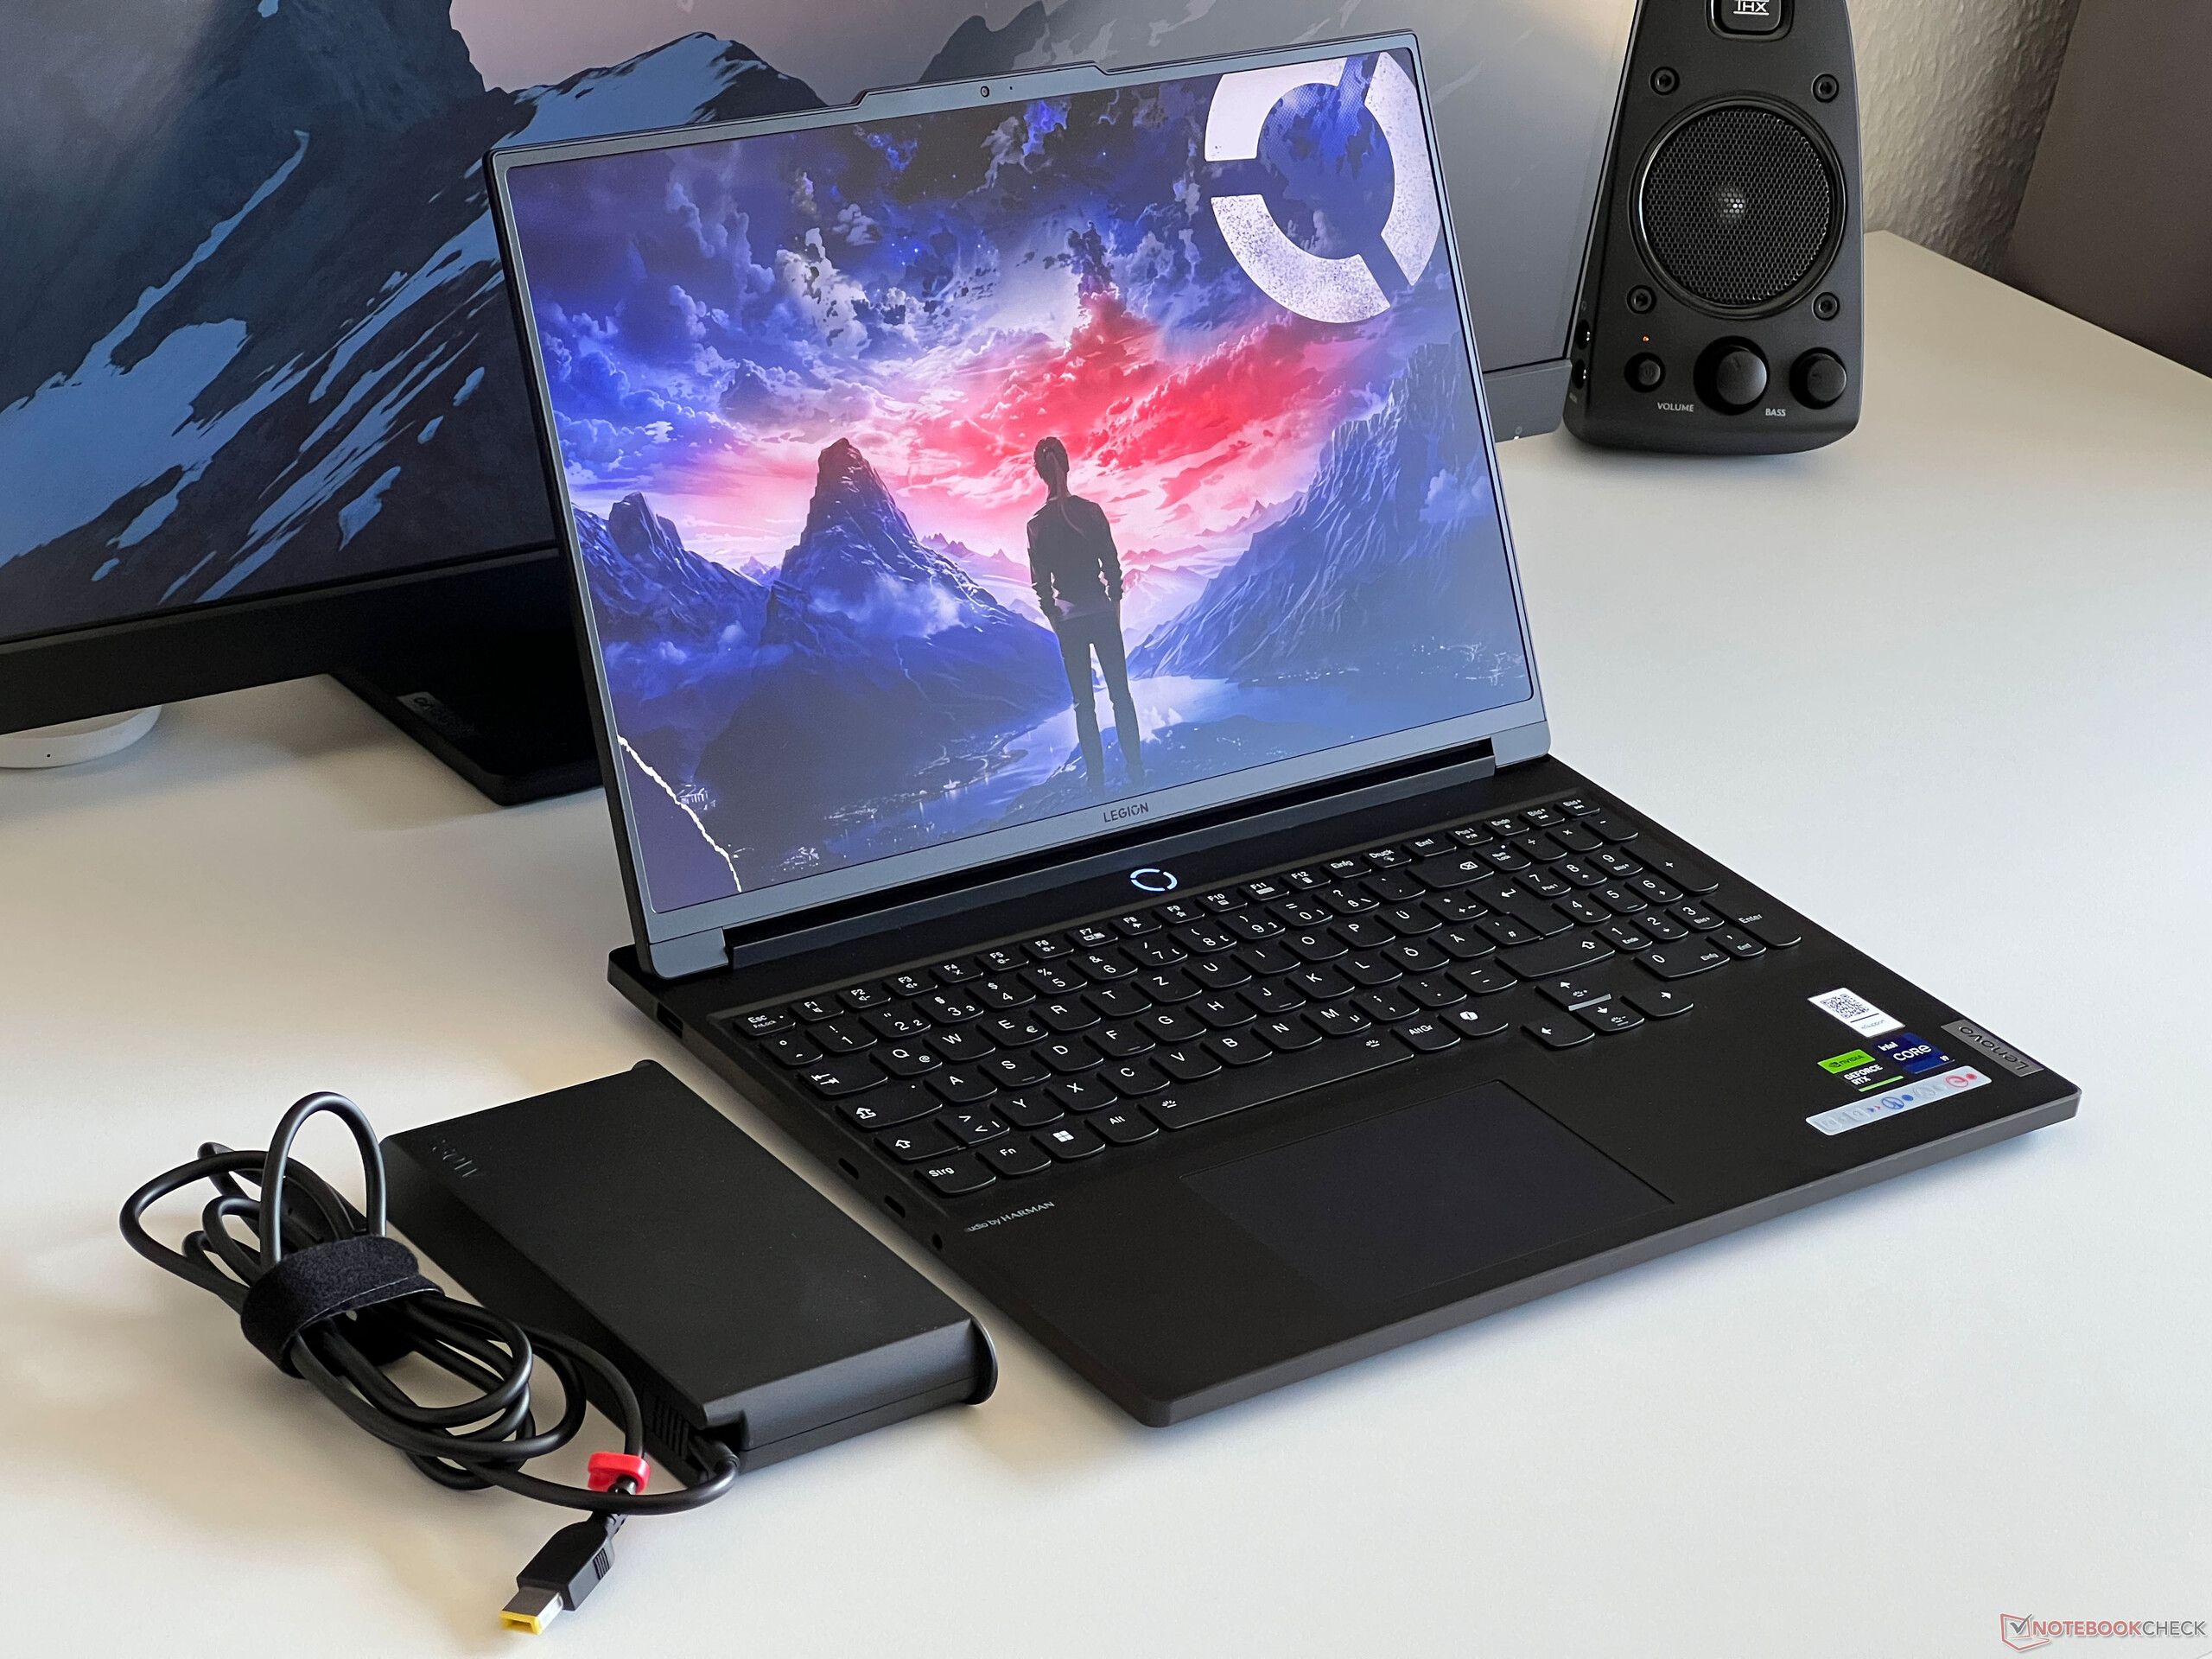
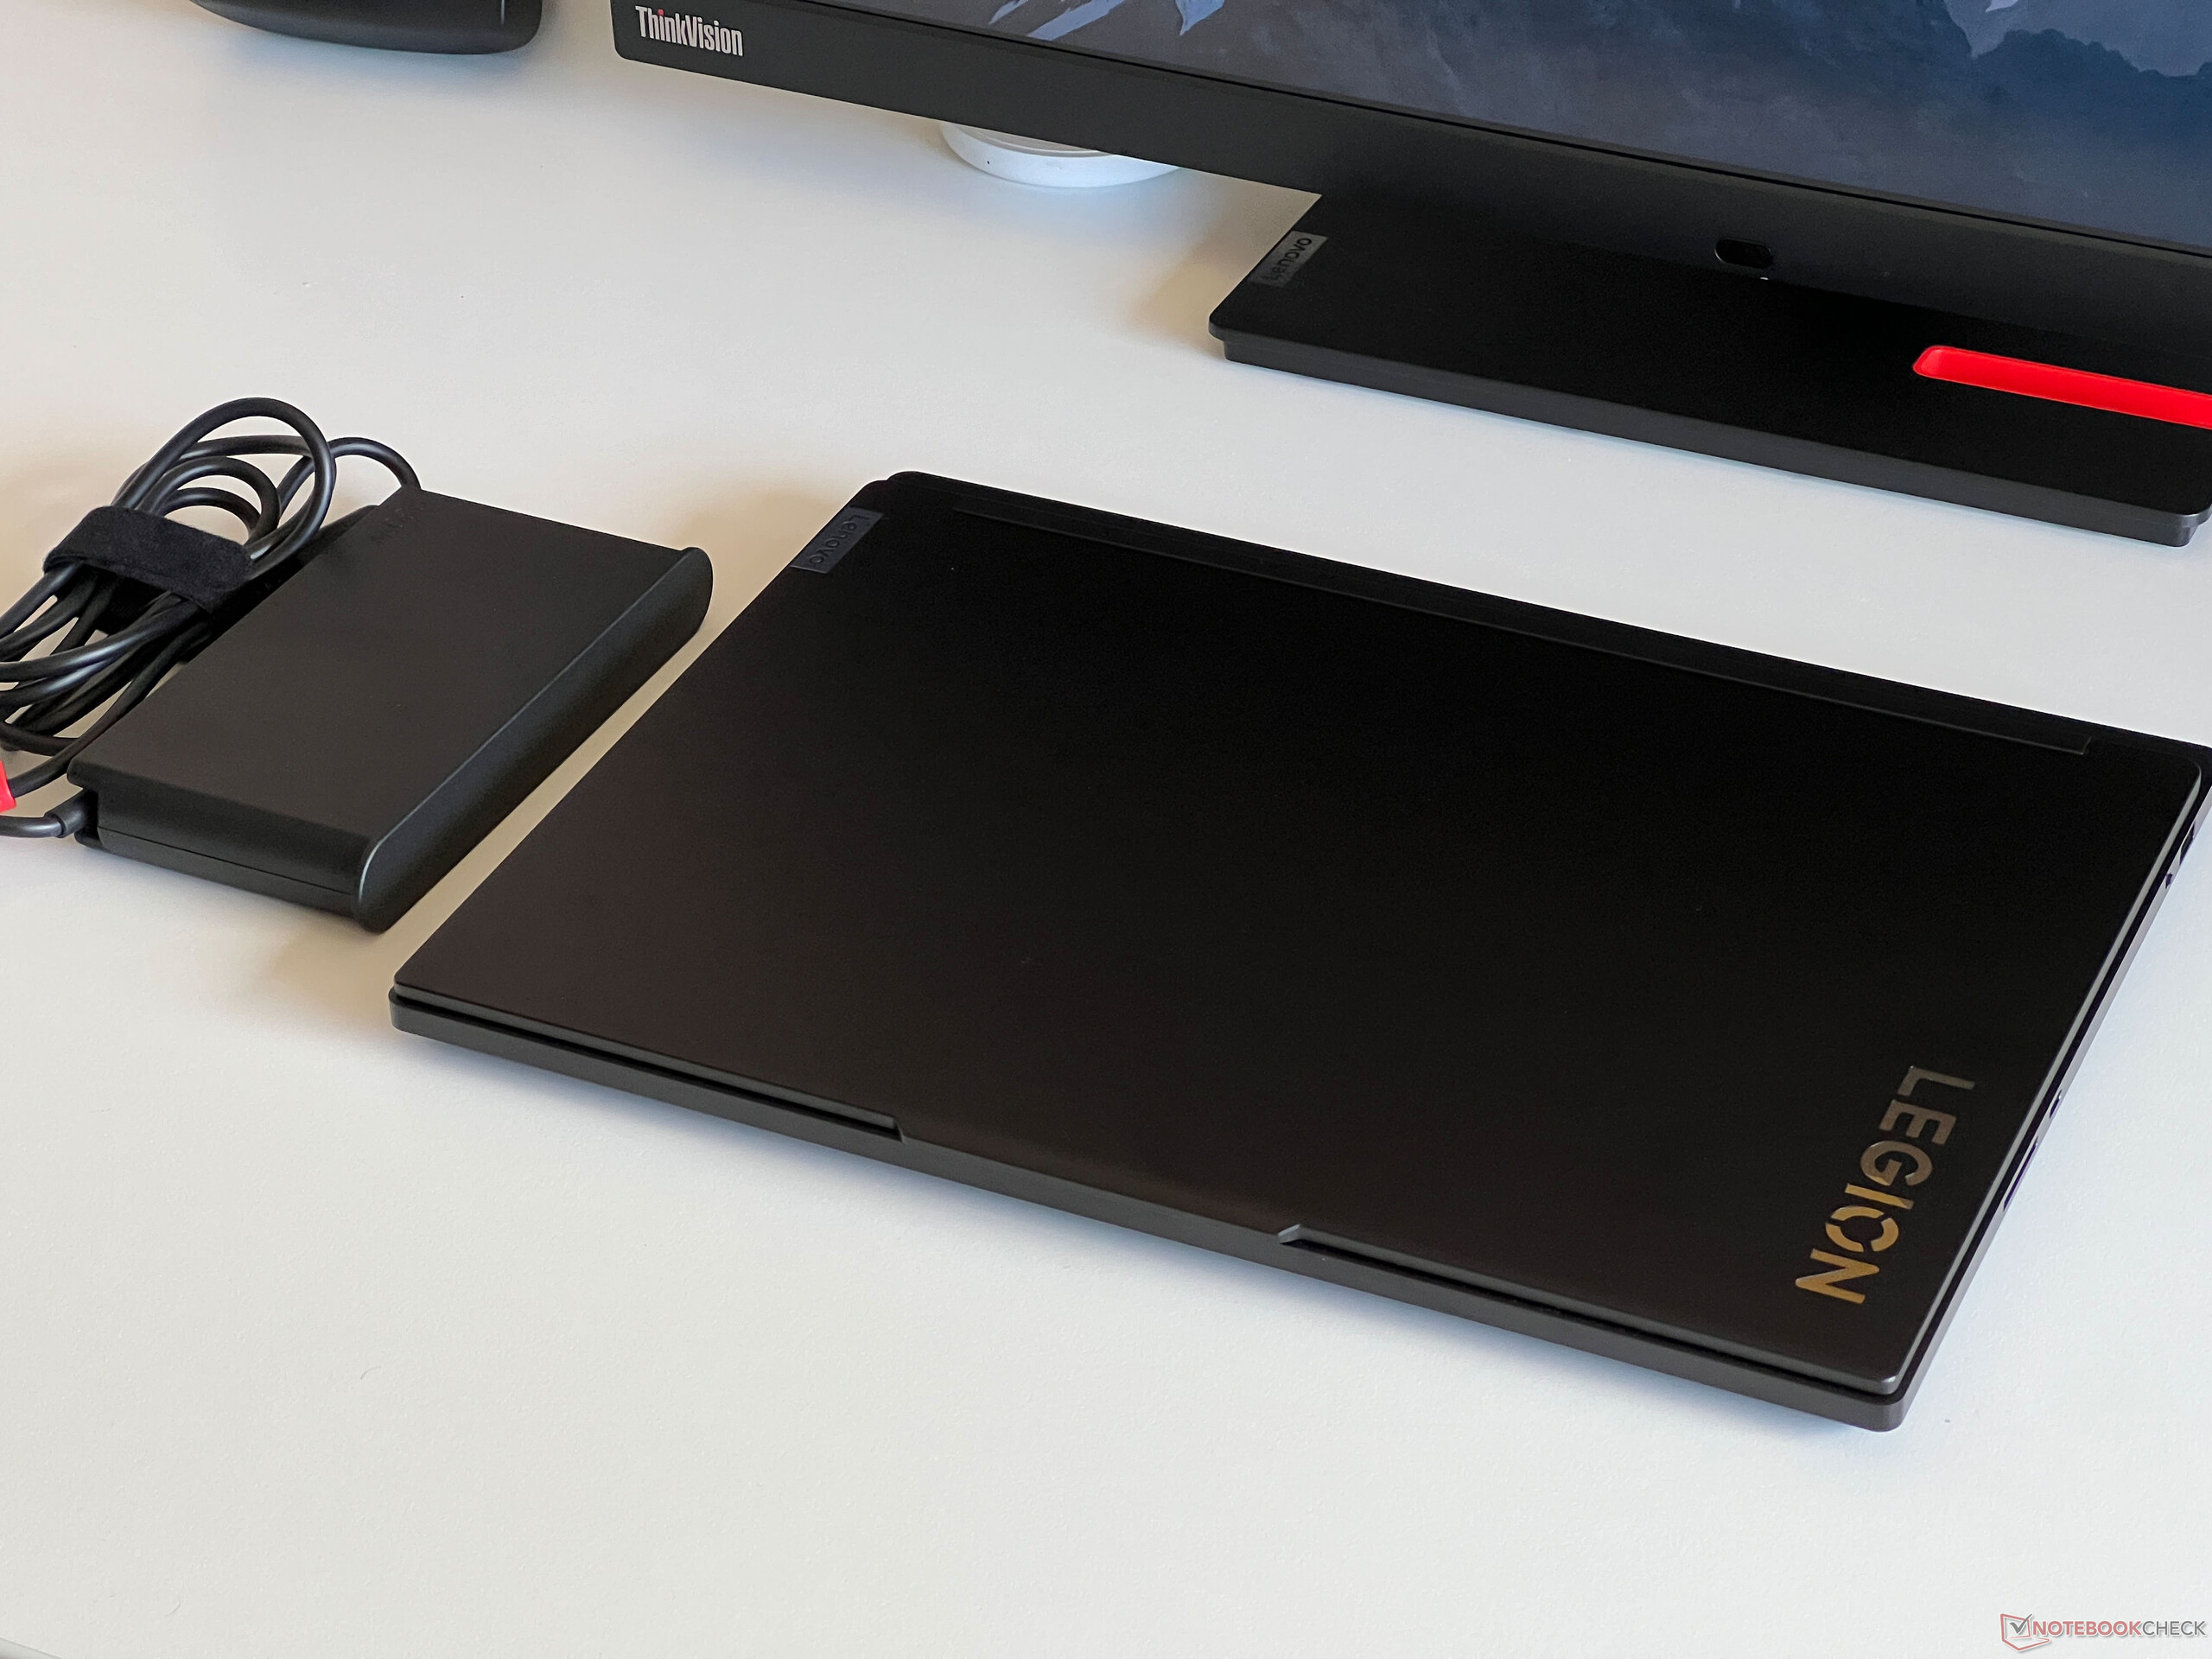
O Legion 7 16 é um dos dispositivos mais finos do nosso grupo de comparação; no entanto, em termos de peso e tamanho geral, não há grandes diferenças. A fonte de alimentação de 230 watts pesa 948 gramas.
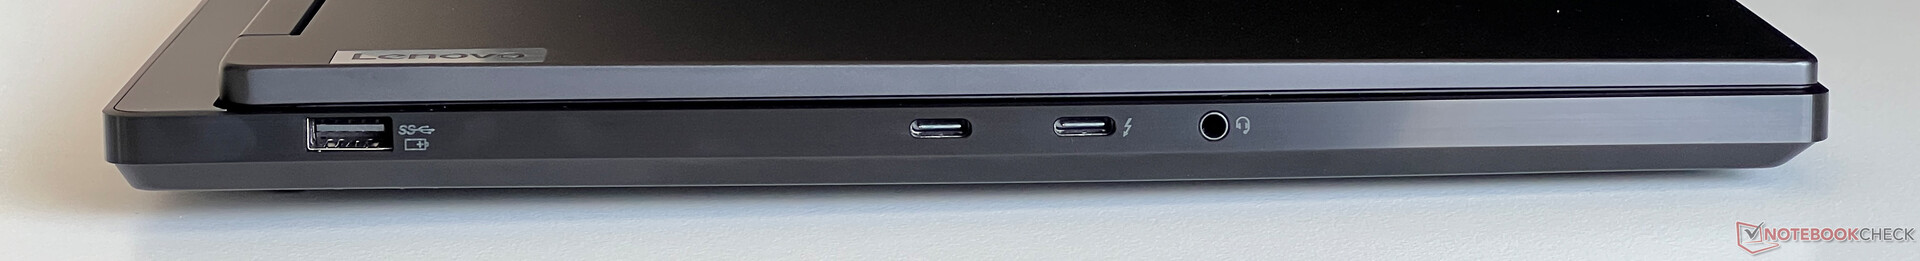
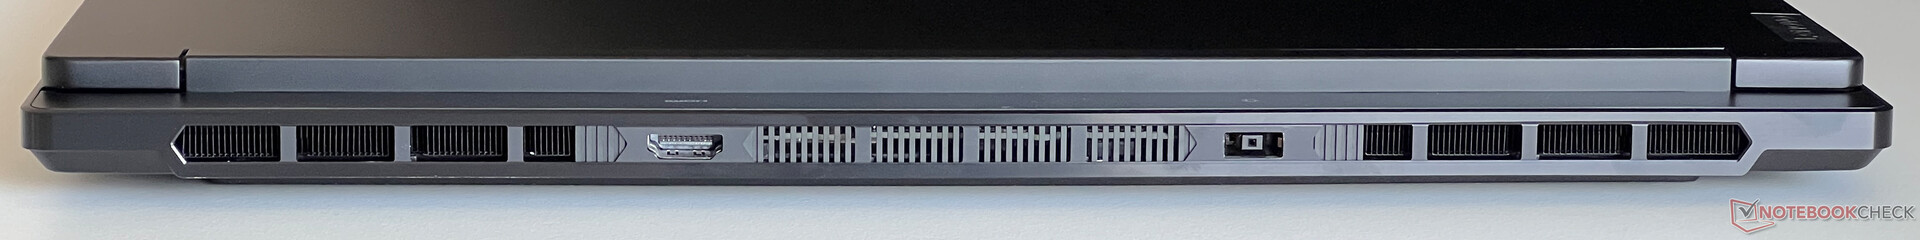
Recursos - Thunderbolt, mas sem Ethernet
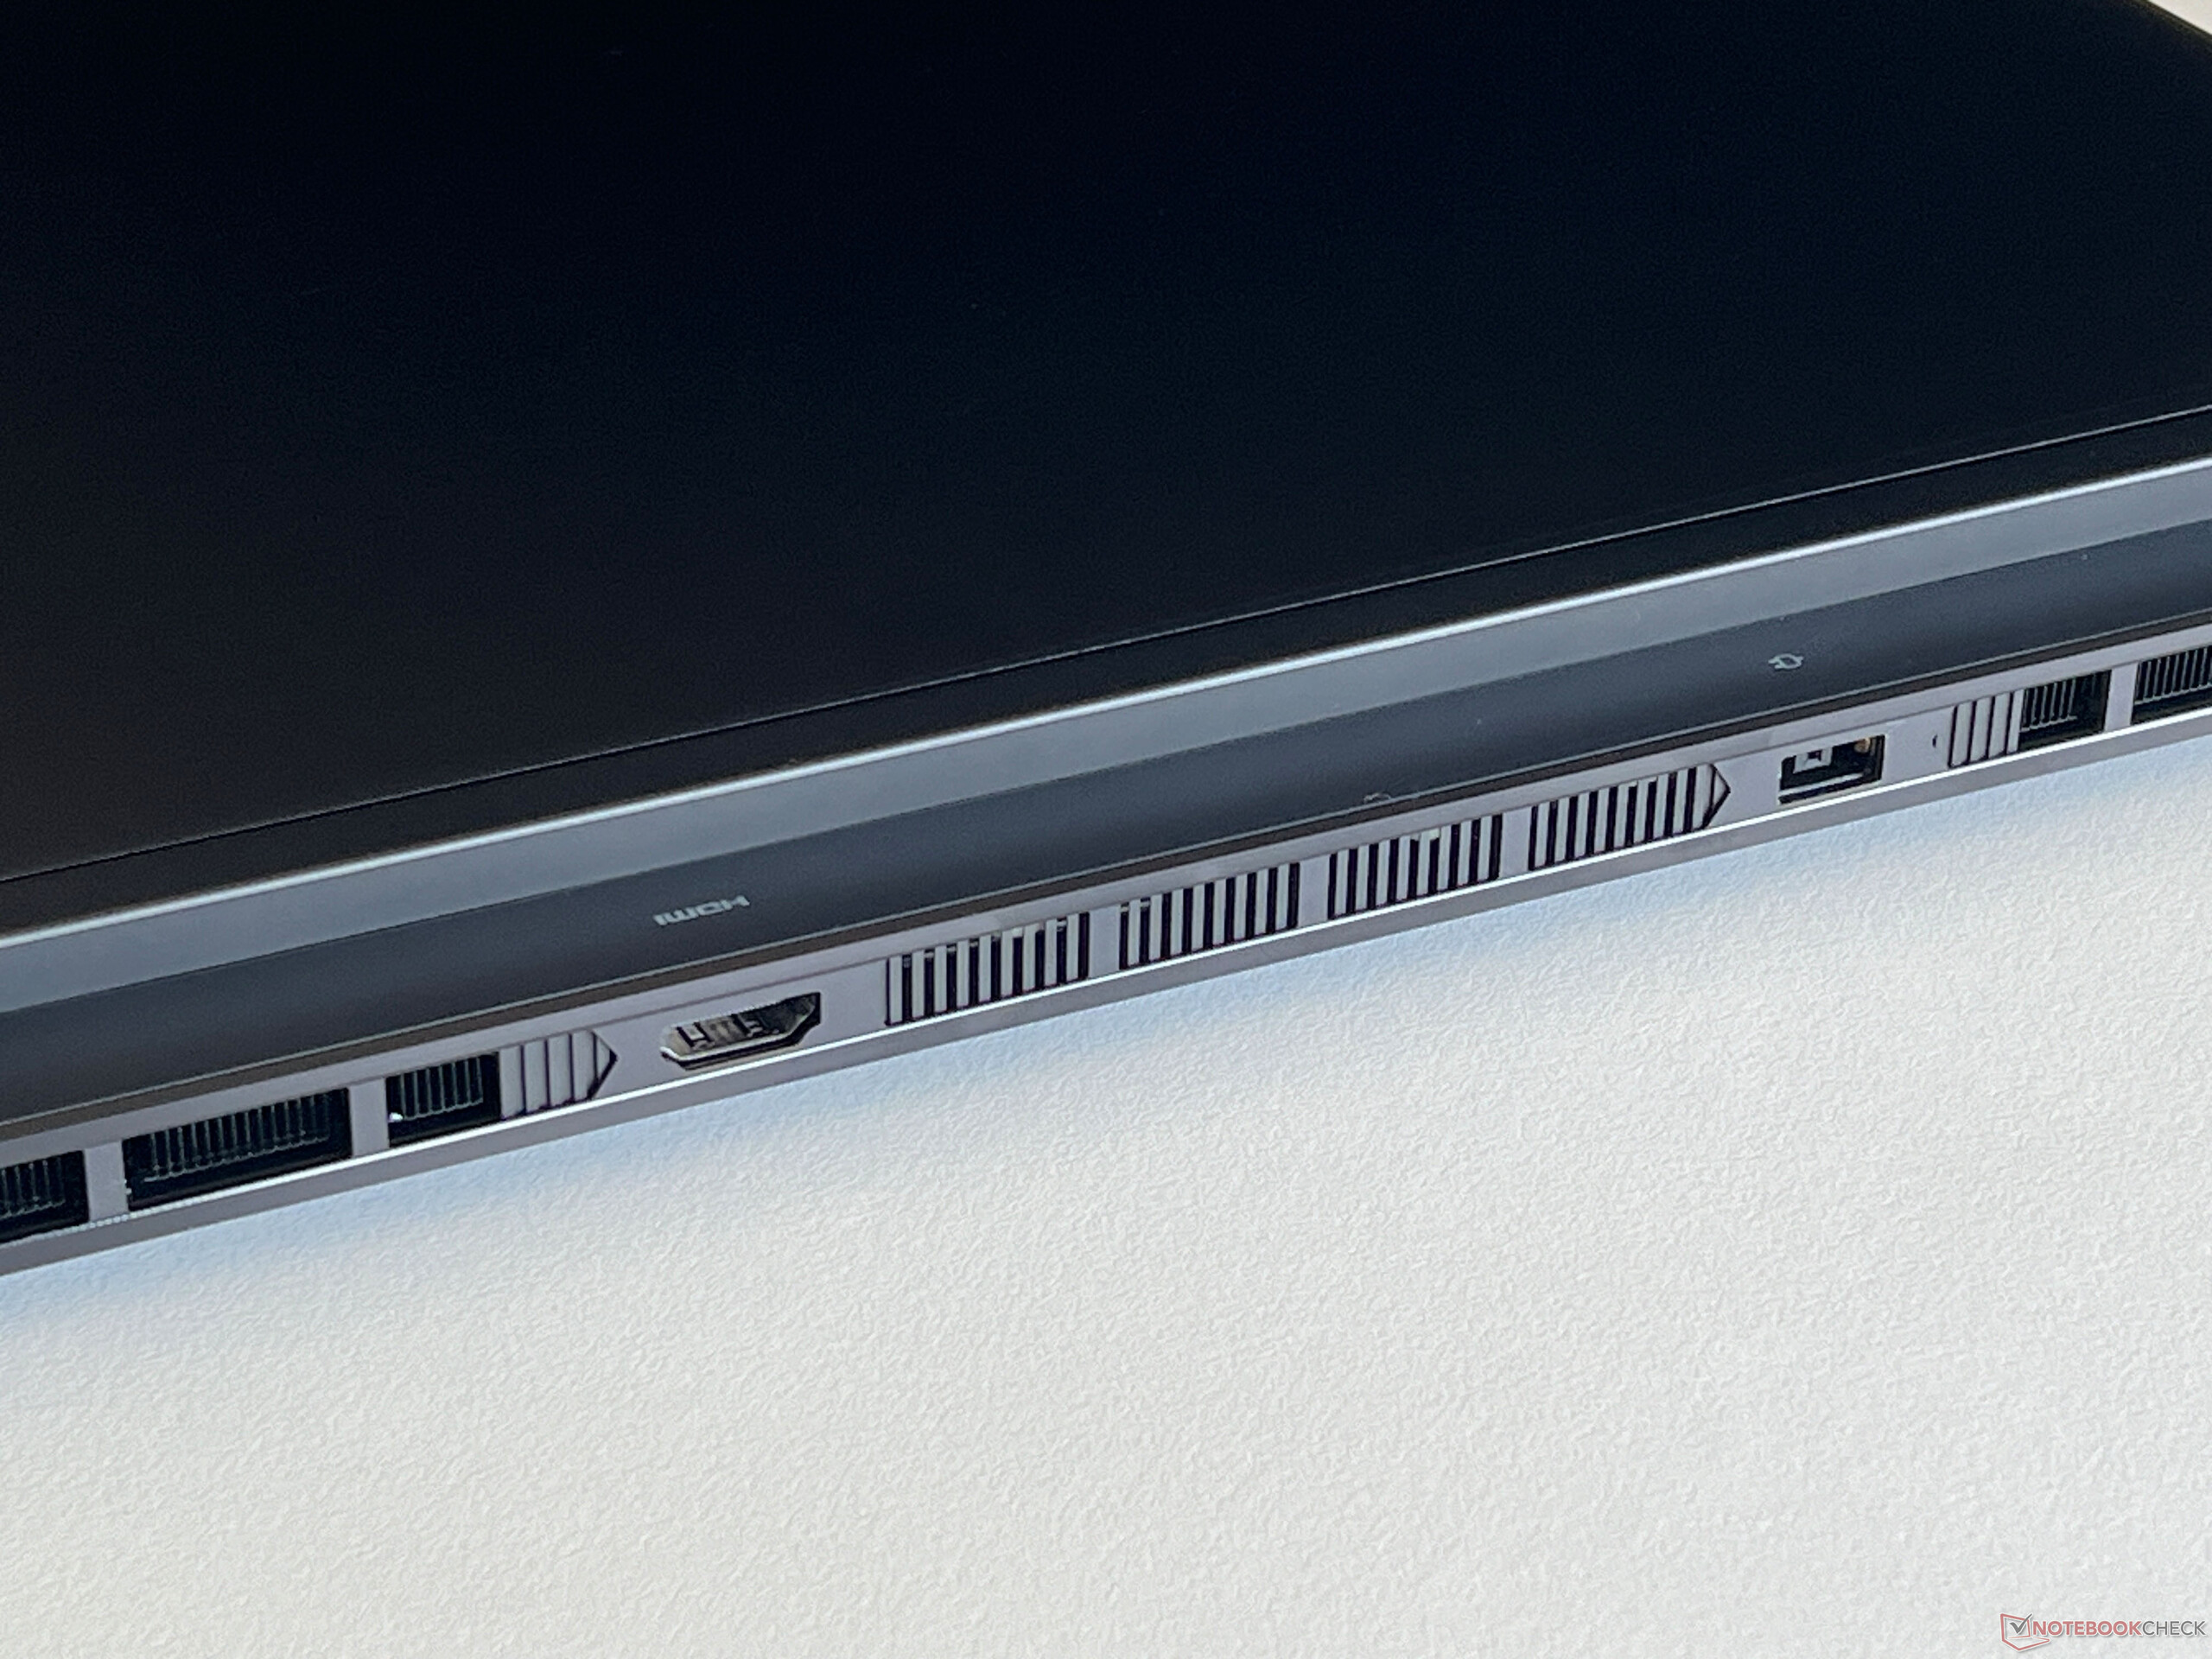
As portas estão distribuídas nas laterais e também na parte traseira do laptop. Nessa área, o Legion 7 normal se sai um pouco melhor do que o Legion Pro 7, mais caro, porque as aberturas de resfriamento estão localizadas apenas na parte traseira. Todos os padrões importantes estão aqui, com exceção de uma porta Ethernet, o que não é ideal para gamers. A porta Thunderbolt é conectada por meio da iGPU e isso significa que, quando o senhor conecta um monitor externo, a GPU da Nvidia não precisa estar sempre ativa. Todas as outras saídas de vídeo são executadas diretamente pela dGPU.
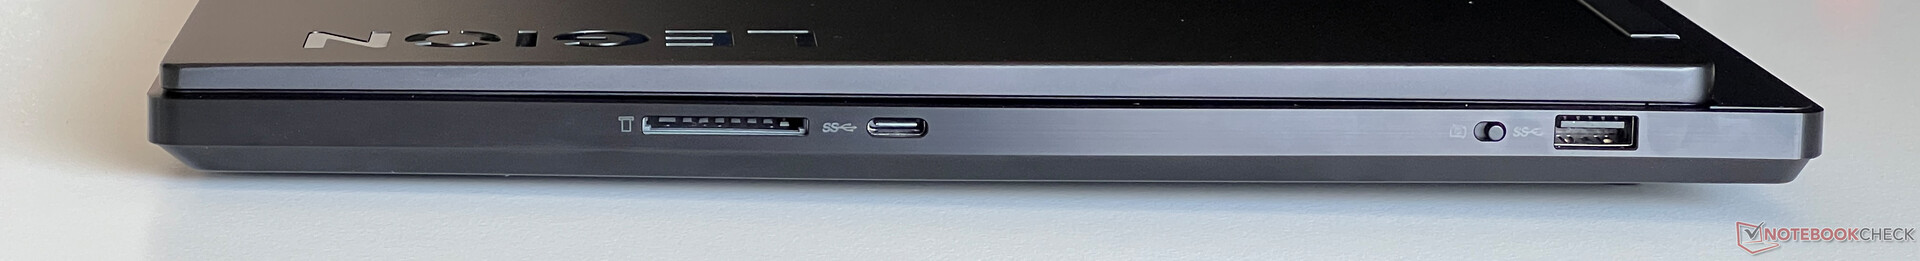
Leitor de cartão SD
Emparelhado com nosso cartão de referência (Angelbird AV Pro V60), o leitor de cartões do lado direito pode atingir velocidades de transferência médias de 75-90 MB/s. No entanto, os cartões inseridos sobressaem claramente do gabinete.
| SD Card Reader | |
| average JPG Copy Test (av. of 3 runs) | |
| Aorus 16X 2024 (AV PRO microSD 128 GB V60) | |
| Média da turma Gaming (20.9 - 210, n=54, últimos 2 anos) | |
| Lenovo Legion 7 16 IRX G9 (Angelbird AV Pro V60) | |
| Alienware m16 R2 (AV PRO microSD 128 GB V60) | |
| Schenker XMG CORE 16 (L23) | |
| maximum AS SSD Seq Read Test (1GB) | |
| Alienware m16 R2 (AV PRO microSD 128 GB V60) | |
| Aorus 16X 2024 (AV PRO microSD 128 GB V60) | |
| Média da turma Gaming (25.5 - 261, n=51, últimos 2 anos) | |
| Lenovo Legion 7 16 IRX G9 (Angelbird AV Pro V60) | |
| Schenker XMG CORE 16 (L23) | |
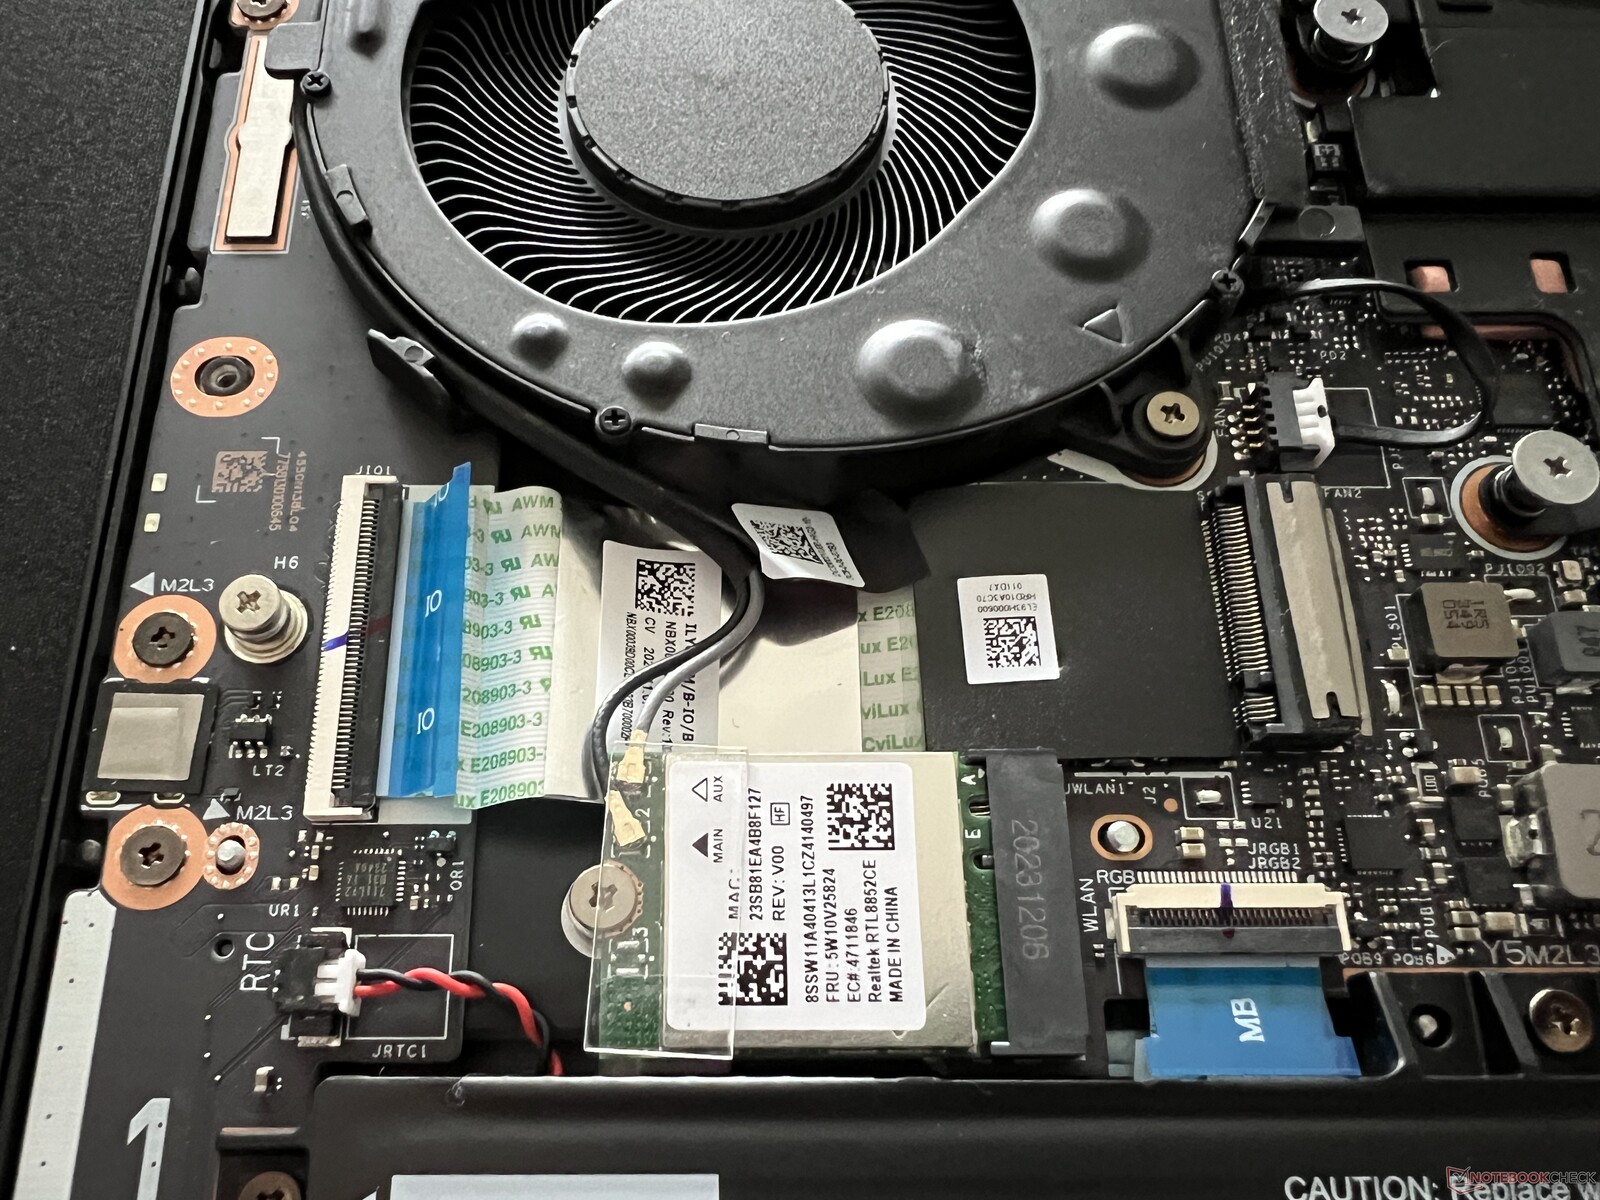
Comunicação
Um módulo Realtek Wi-Fi 6E está instalado dentro do Legion. Ele tem bom desempenho e, combinado com nosso roteador de referência da Asus, conseguiu velocidades de transferência altas e estáveis. O Bluetooth 5.1 é suportado, mas o laptop não oferece uma porta Ethernet.
| Networking | |
| Lenovo Legion 7 16 IRX G9 | |
| iperf3 transmit AXE11000 | |
| iperf3 receive AXE11000 | |
| Lenovo Legion Pro 5 16IRX9 | |
| iperf3 transmit AXE11000 | |
| iperf3 receive AXE11000 | |
| iperf3 transmit AXE11000 6GHz | |
| iperf3 receive AXE11000 6GHz | |
| Aorus 16X 2024 | |
| iperf3 transmit AXE11000 | |
| iperf3 receive AXE11000 | |
| HP Omen Transcend 16-u1095ng | |
| iperf3 transmit AXE11000 | |
| iperf3 receive AXE11000 | |
| Alienware m16 R2 | |
| iperf3 transmit AXE11000 | |
| iperf3 receive AXE11000 | |
| iperf3 transmit AXE11000 6GHz | |
| iperf3 receive AXE11000 6GHz | |
| Schenker XMG CORE 16 (L23) | |
| iperf3 transmit AXE11000 | |
| iperf3 receive AXE11000 | |
| Lenovo Legion Pro 7 16IRX9H | |
| iperf3 transmit AXE11000 | |
| iperf3 receive AXE11000 | |
Webcam
A webcam de 1080p está alojada dentro da moldura superior da tela e oferece um obturador eletrônico (o interruptor está no lado direito), mas, mesmo em boas condições de iluminação, ela captura apenas imagens medianas. A webcam não é compatível com o Windows Studio Effects, ao contrário dos dispositivos Meteor Lake atuais.


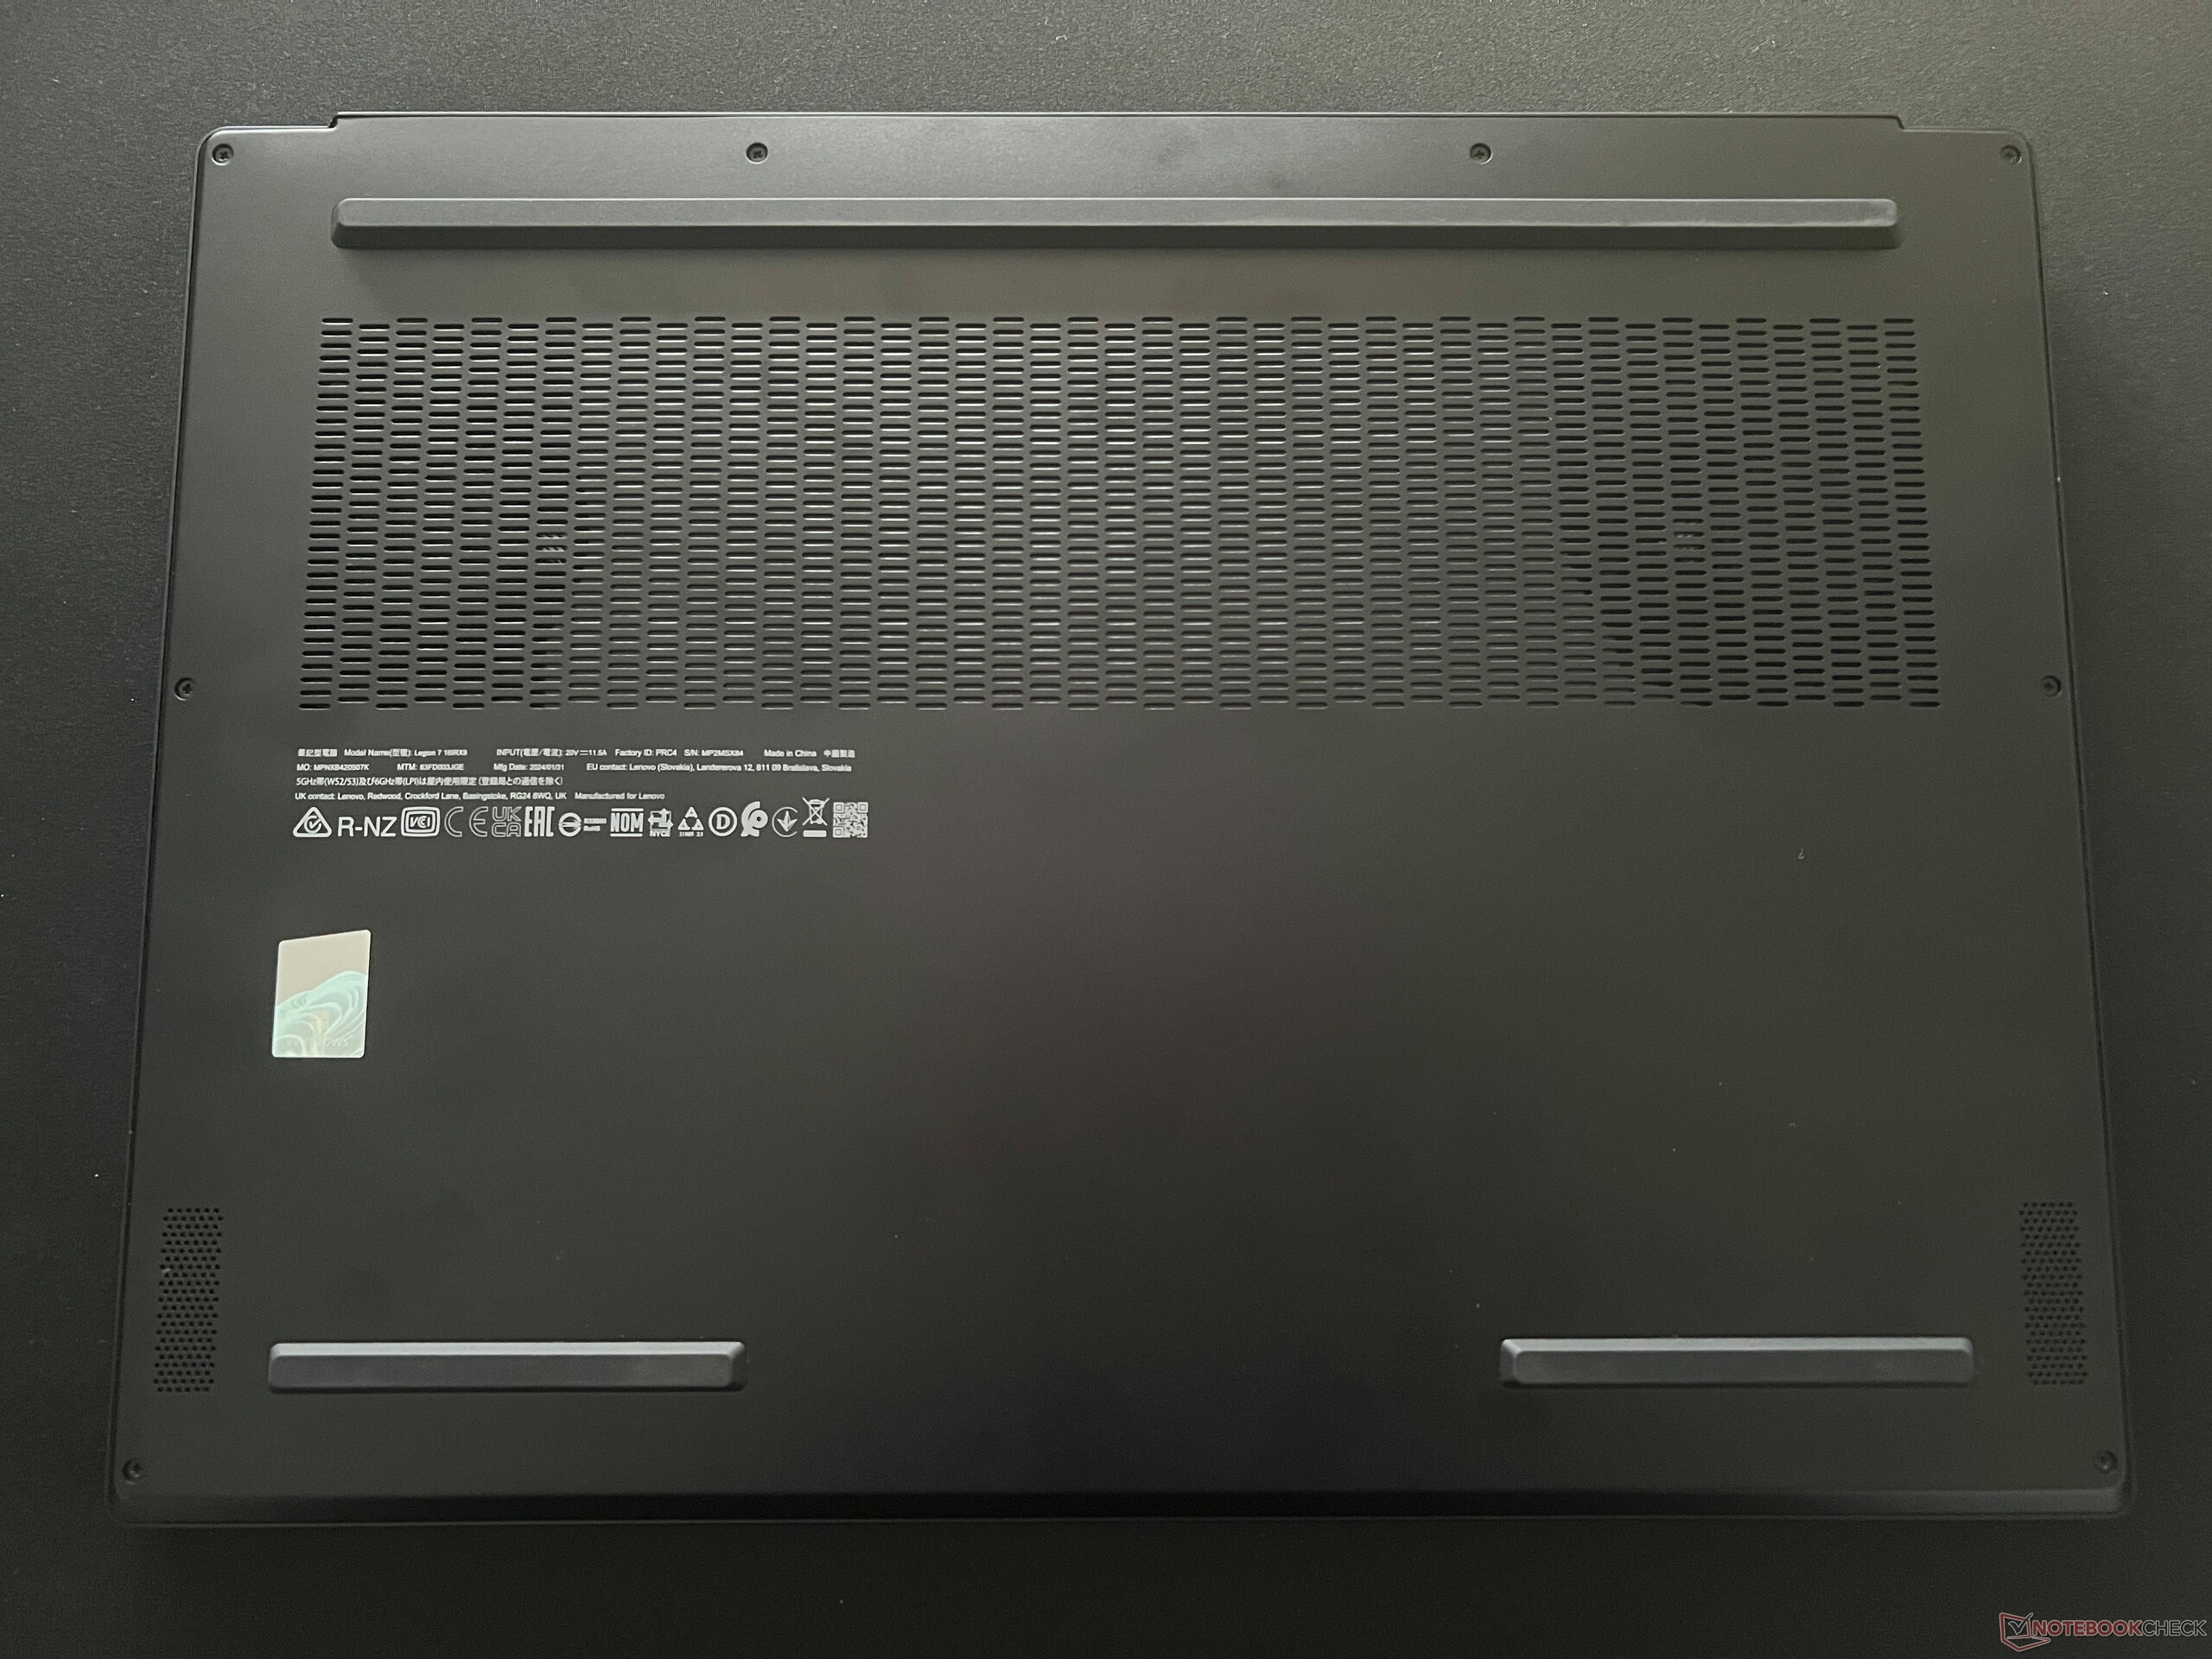
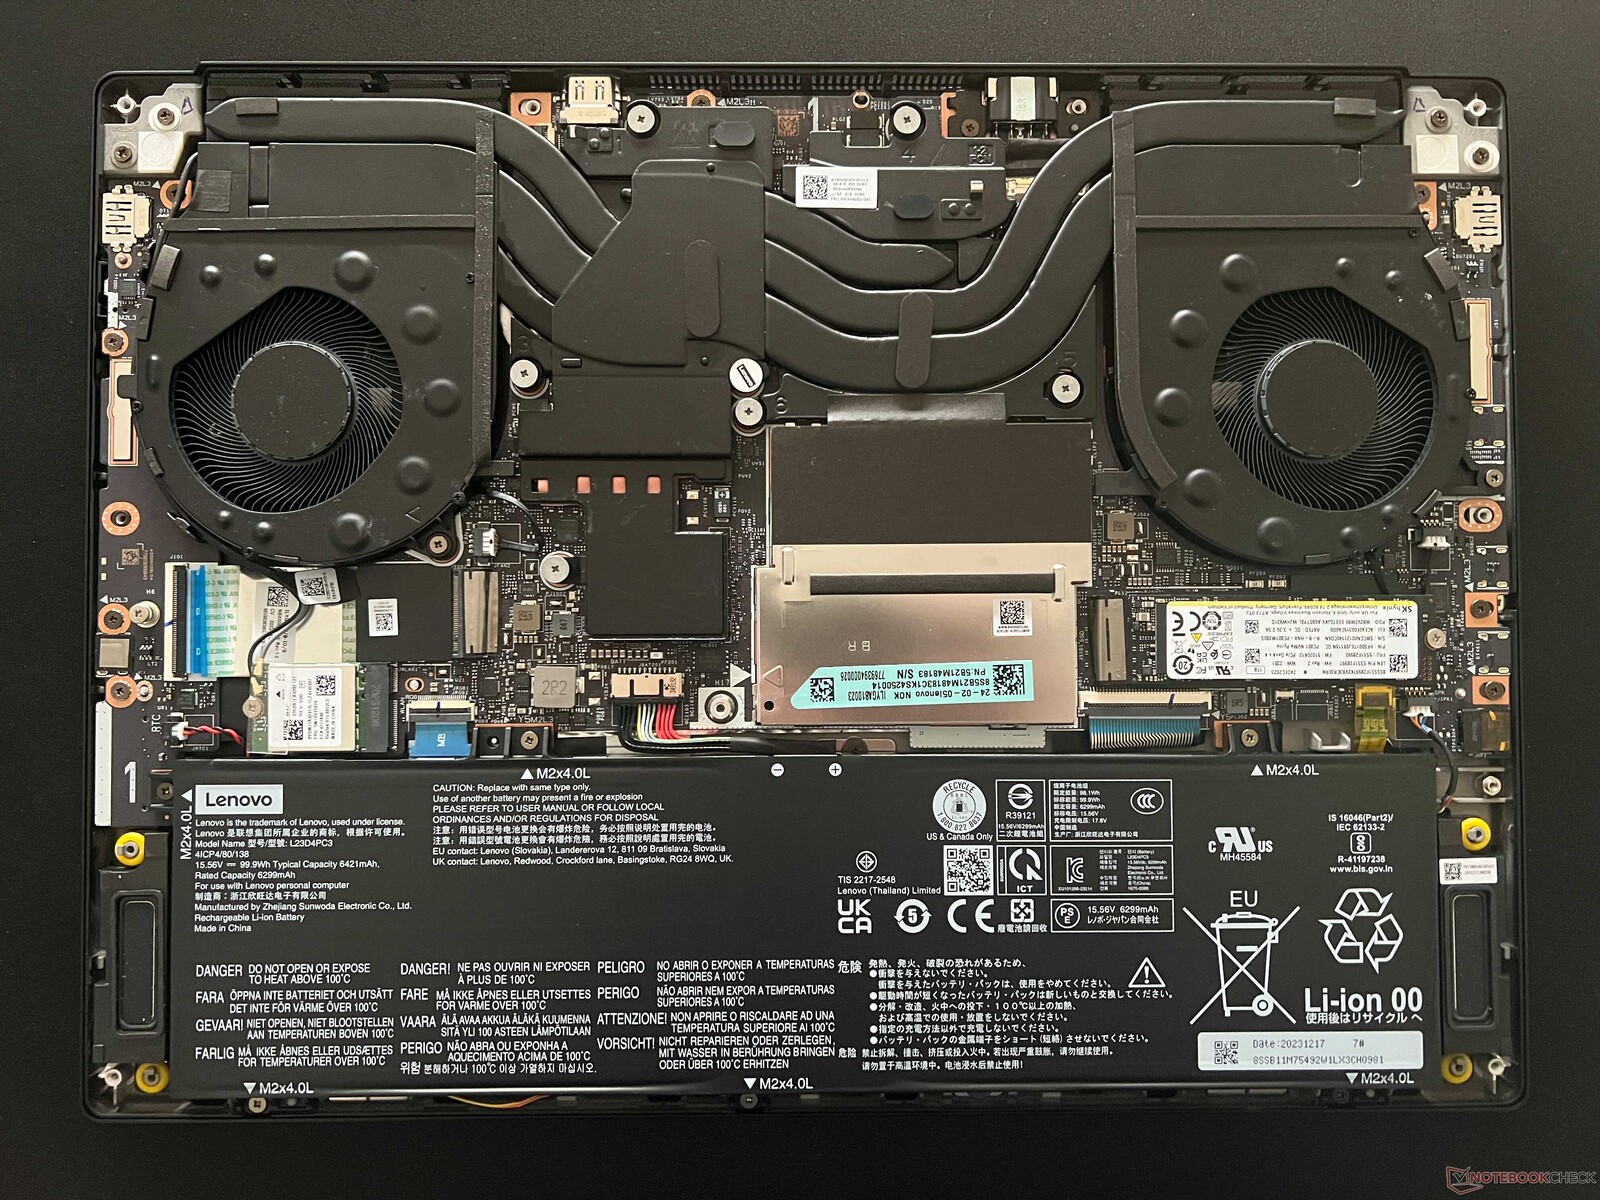
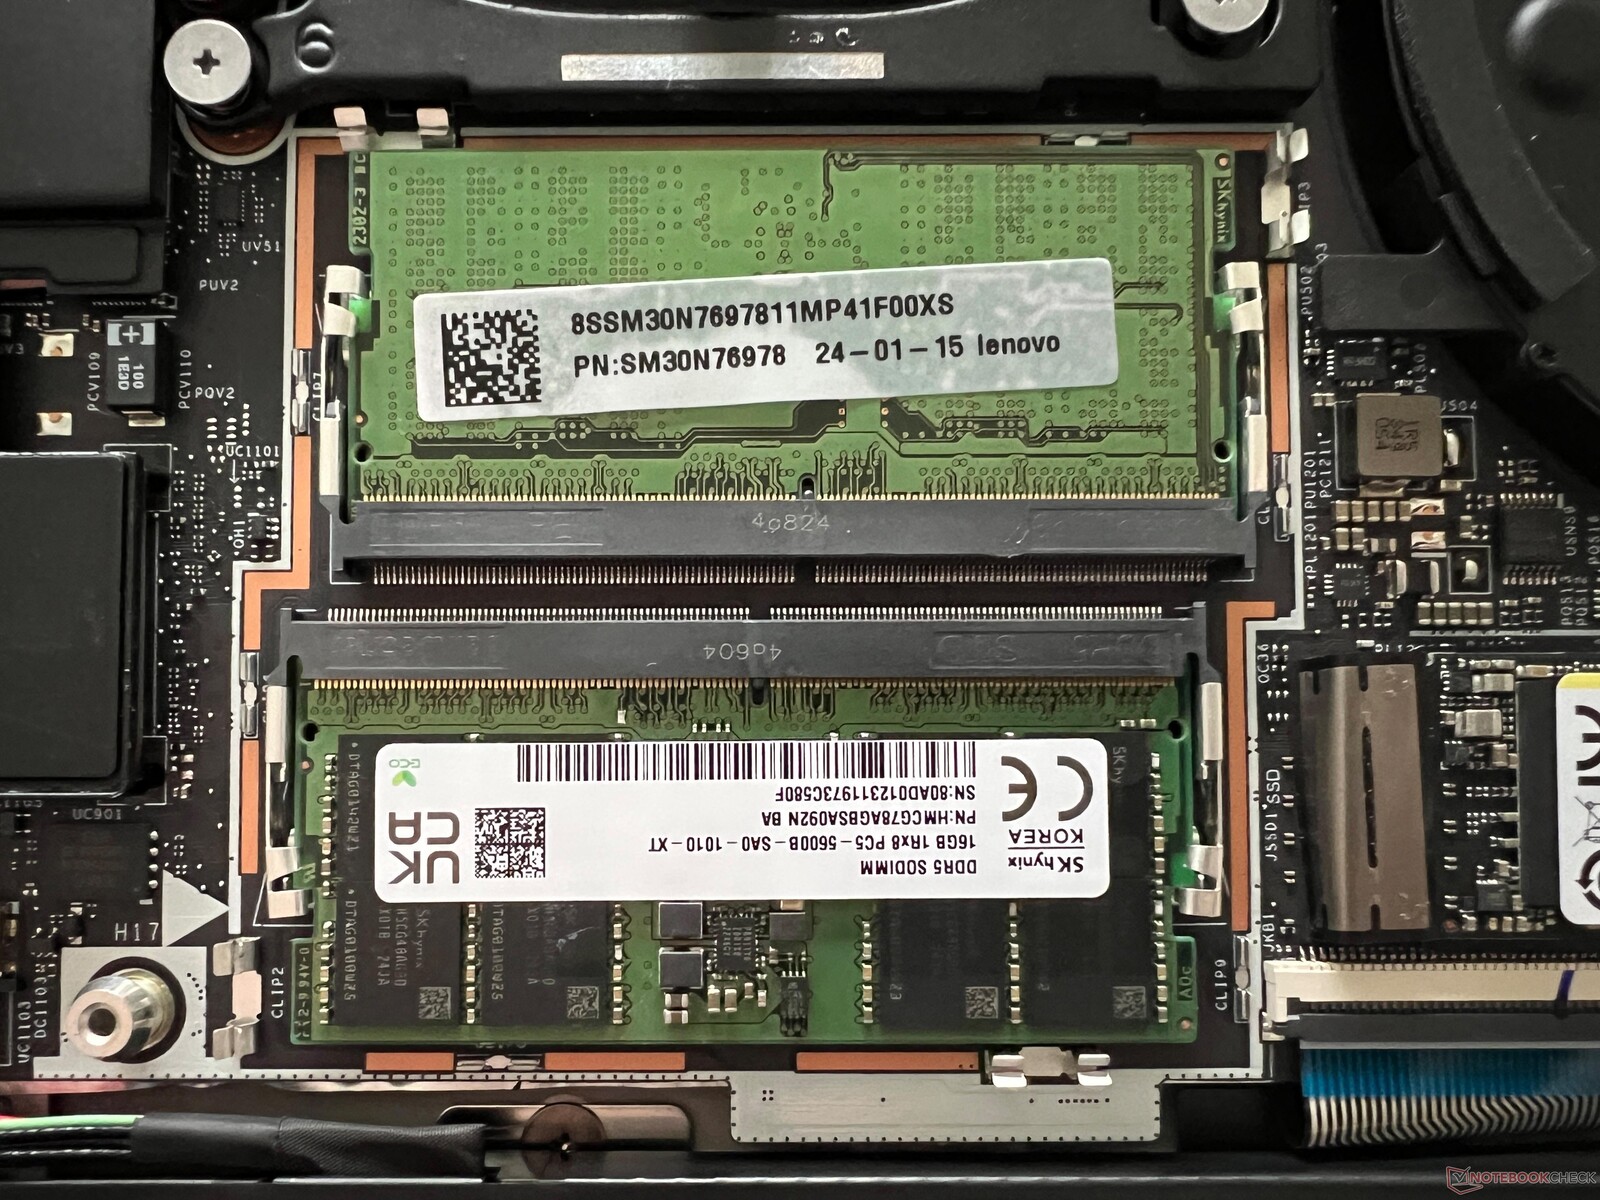
Manutenção
A tampa da base é fixada por parafusos de cabeça cruzada normais e é muito fácil de remover. Além dos dois módulos de RAM, há também dois slots M.2 2280, embora o acesso ao segundo slot seja um pouco impedido pelo cabo Wi-Fi. Da mesma forma, tanto o módulo Wi-Fi quanto a bateria podem ser substituídos.
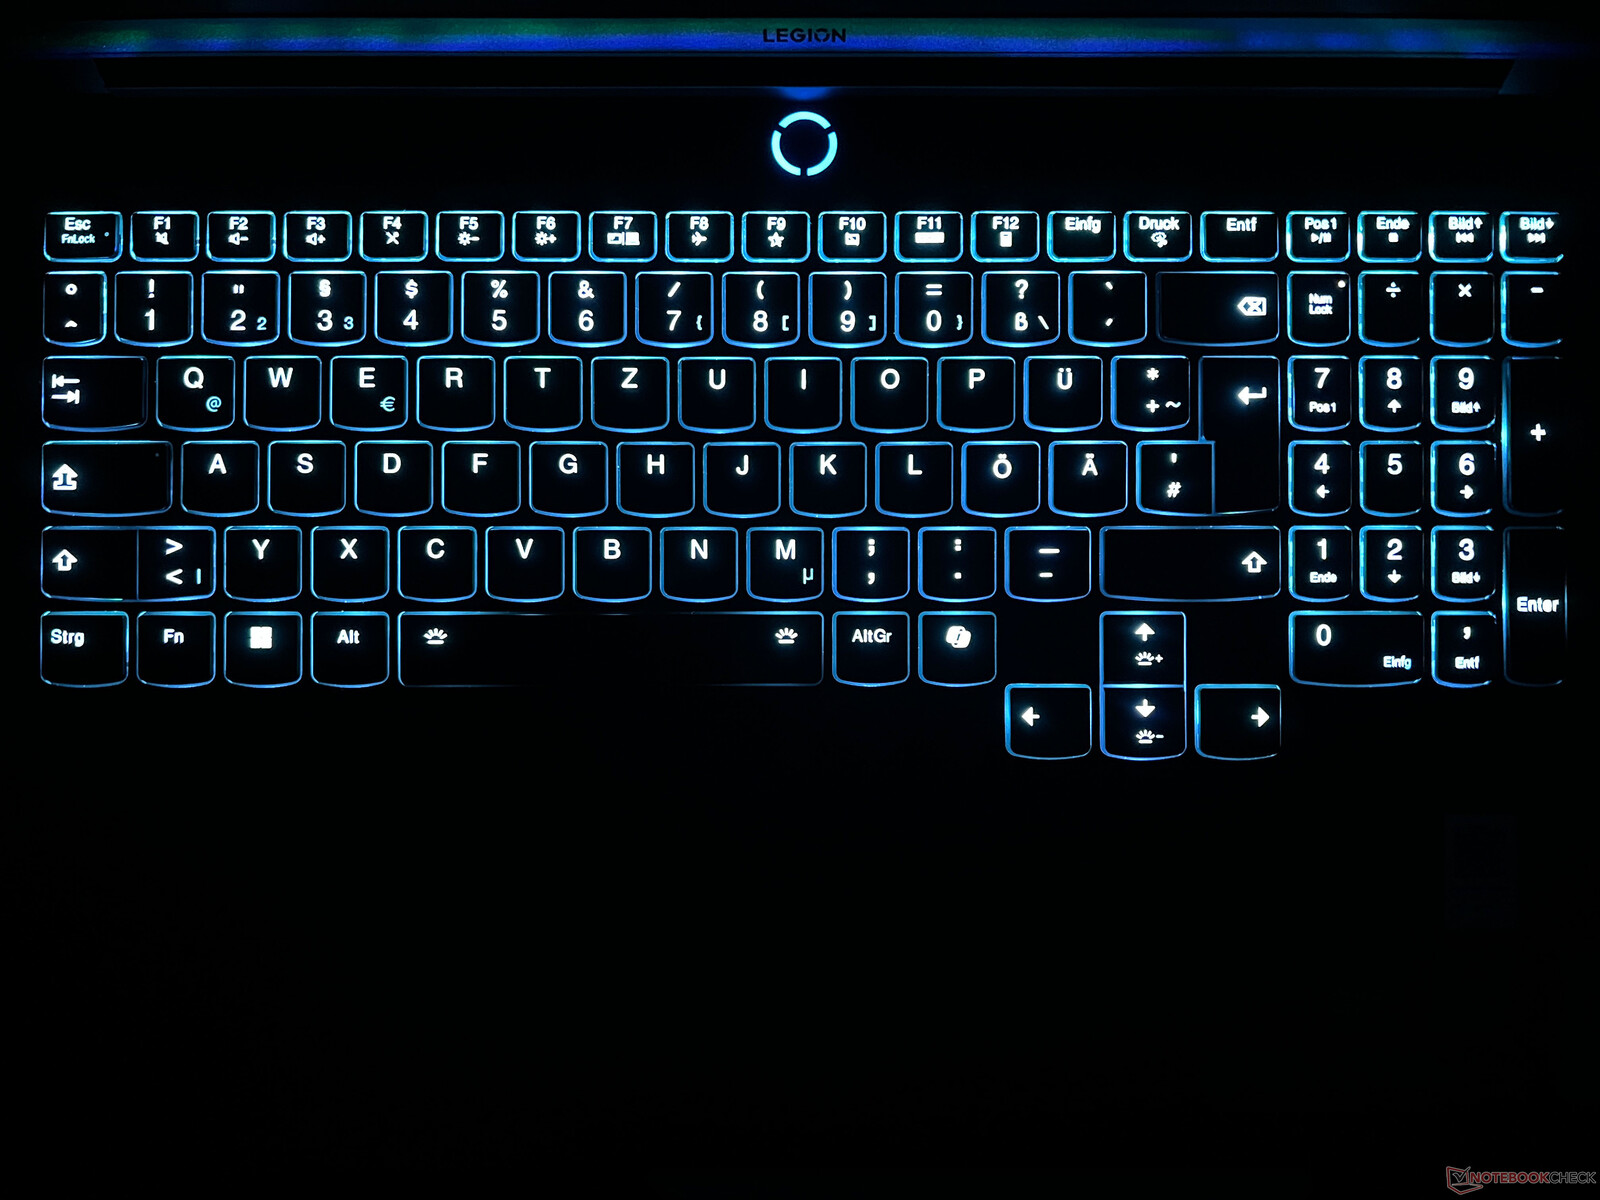
Dispositivos de entrada - teclado numérico e iluminação de teclas individuais
A Lenovo equipou o Legion 7 16 com um teclado de membrana muito confortável que vem completo com um teclado numérico dedicado e iluminação individual das teclas. Em geral, os toques precisos e agradavelmente silenciosos das teclas não dão motivos para reclamações. Até mesmo textos mais longos podem ser digitados sem esforço. As teclas do teclado numérico são um pouco mais estreitas, mas isso não apresenta nenhum problema em situações reais. As teclas de seta são agradavelmente grandes e um scanner de impressões digitais está integrado ao botão liga/desliga.
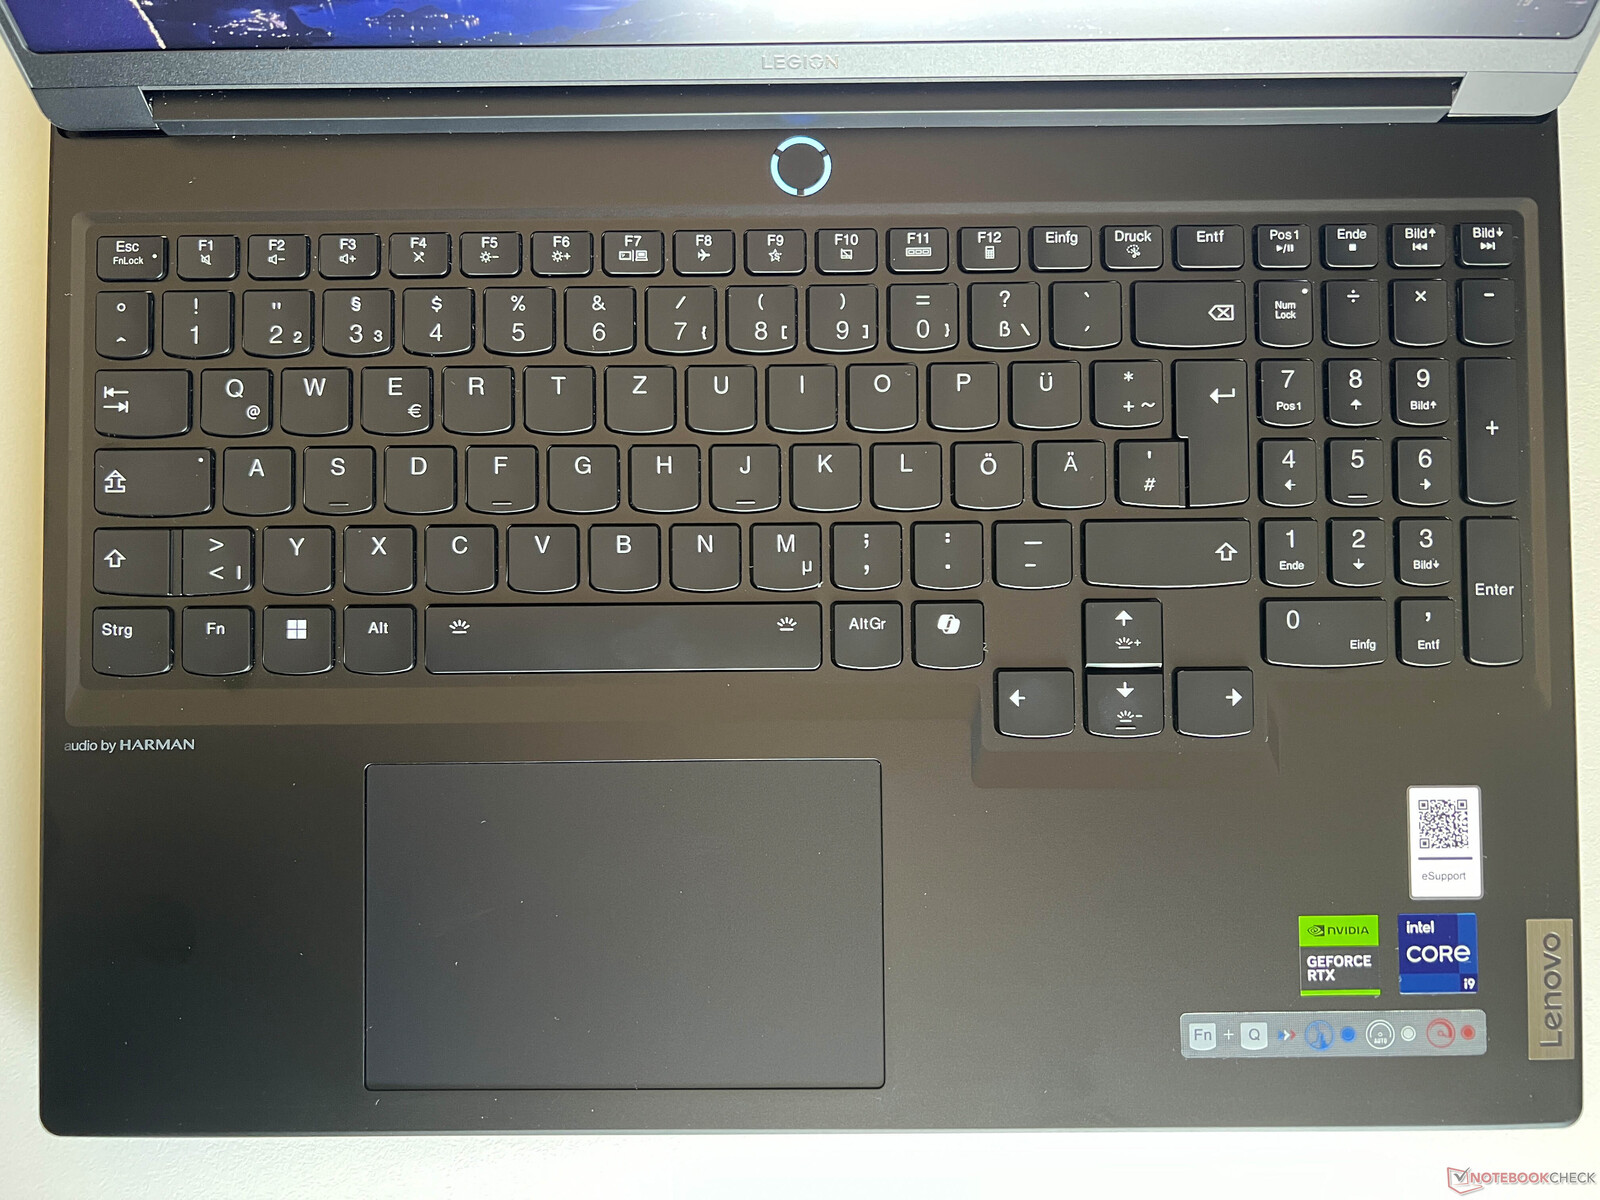
O clickpad está posicionado ligeiramente à esquerda do centro e, com 12 x 7,5 cm, é bem proporcionado. As ações de deslizar são traduzidas muito bem e a área inferior do teclado pode ser clicada, embora com bastante ruído. Por esse motivo, o senhor só deve tocar o mouse levemente. O Legion Speed Mouse Mad M também está incluído.
Tela - Um painel IPS de 3,2K, 165 Hz e G-Sync
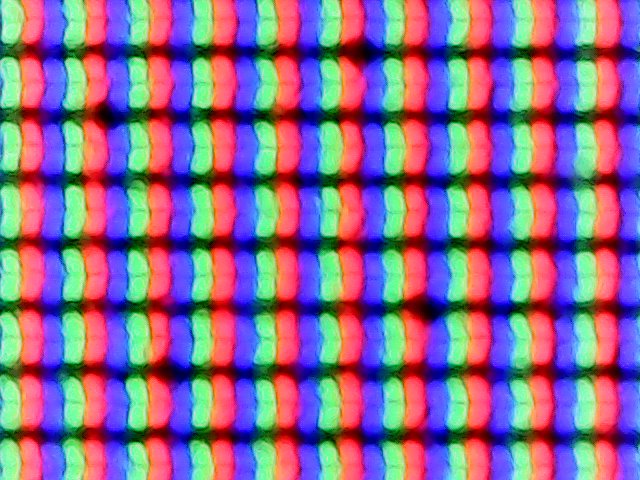
Nosso dispositivo de avaliação Legion 7 16 está equipado com uma tela IPS de alta resolução, com proporção de 16:10 (3.200 x 2.000 pixels). A qualidade subjetiva da imagem é boa e o conteúdo parece muito nítido graças à alta resolução da tela. Da mesma forma, as cores também são vibrantes, mas os painéis OLED atuais oferecem imagens mais vivas. Quando se trata de conteúdo mais brilhante, as superfícies parecem um pouco granuladas, no entanto, a Lenovo consegue evitar esse problema usando o modo escuro do Windows como padrão. Os movimentos são muito suaves graças à taxa de atualização de 165 Hz e os tempos de resposta são rápidos. A oscilação PWM não é usada.
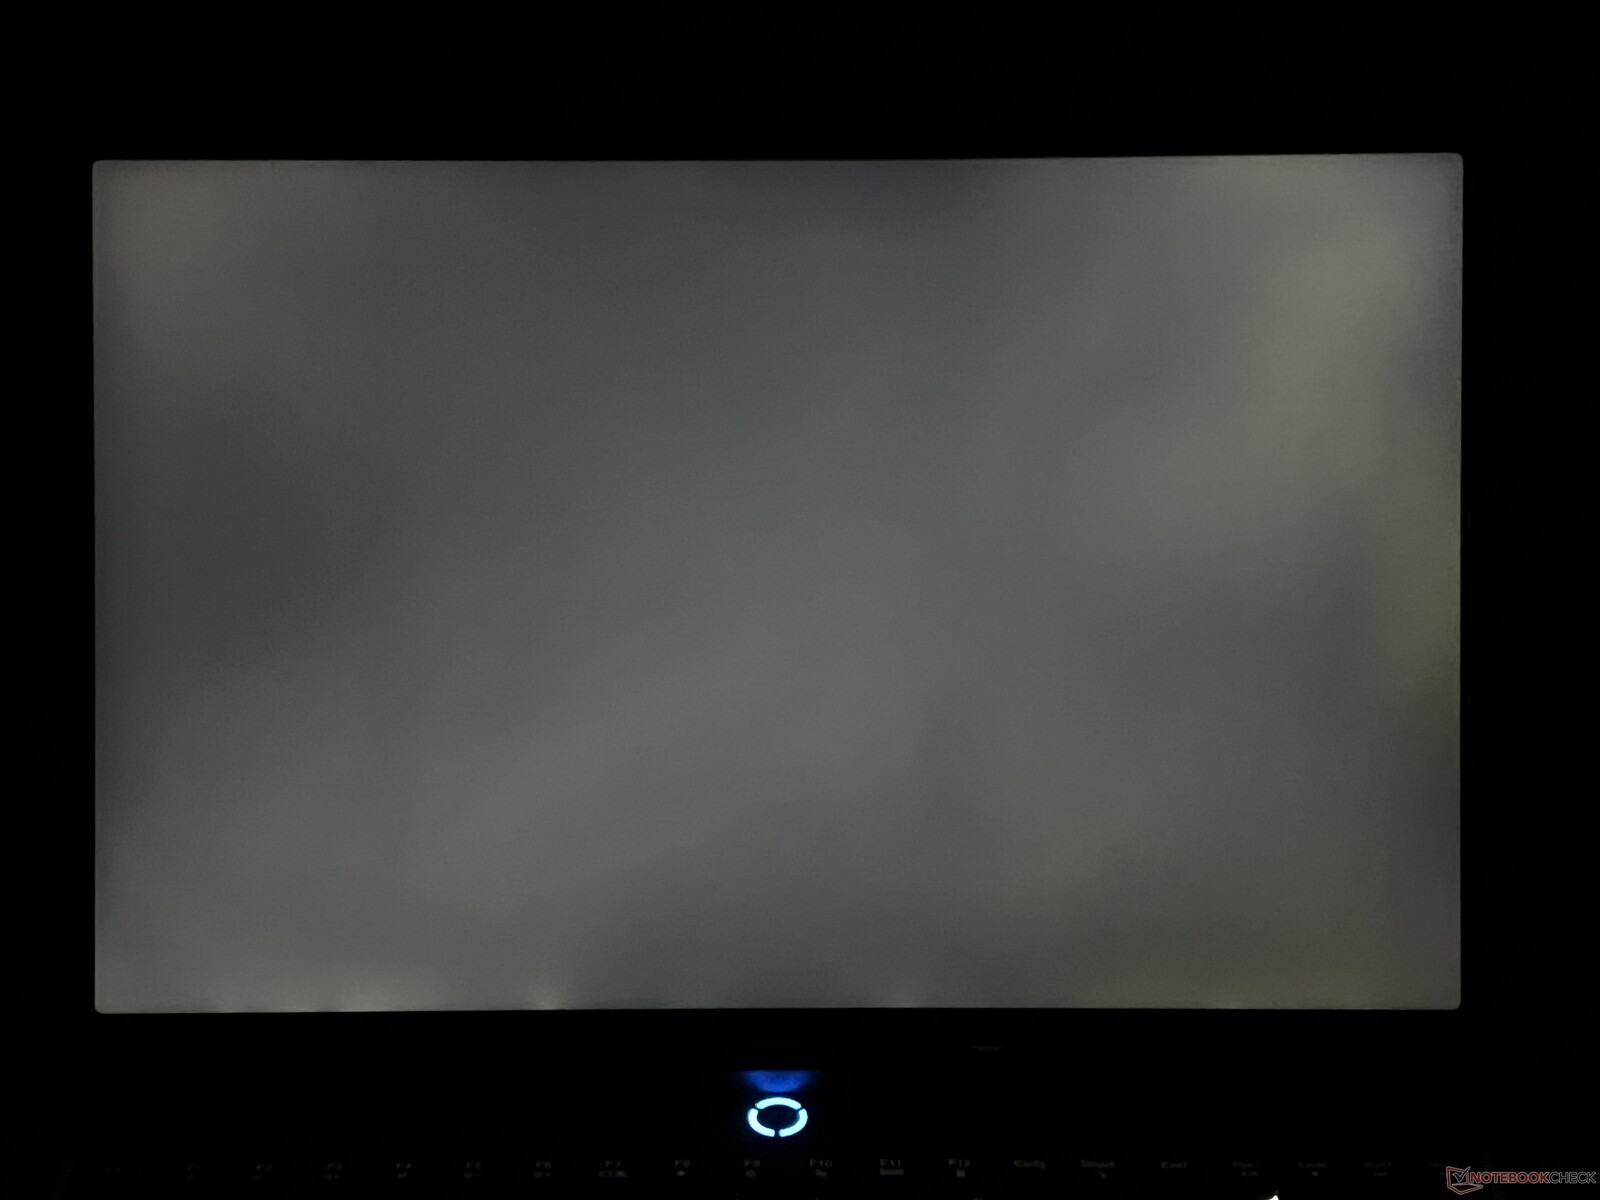
O brilho médio fica em torno de 400 cd/m², mas, com 0,43 cd/m², o valor de preto é bastante alto e explica por que a taxa de contraste máxima é de apenas 1.000:1. Além disso, com brilho total e conteúdo escuro, há um sangramento de luz visível.
| |||||||||||||||||||||||||
iluminação: 89 %
iluminação com acumulador: 412 cd/m²
Contraste: 958:1 (Preto: 0.43 cd/m²)
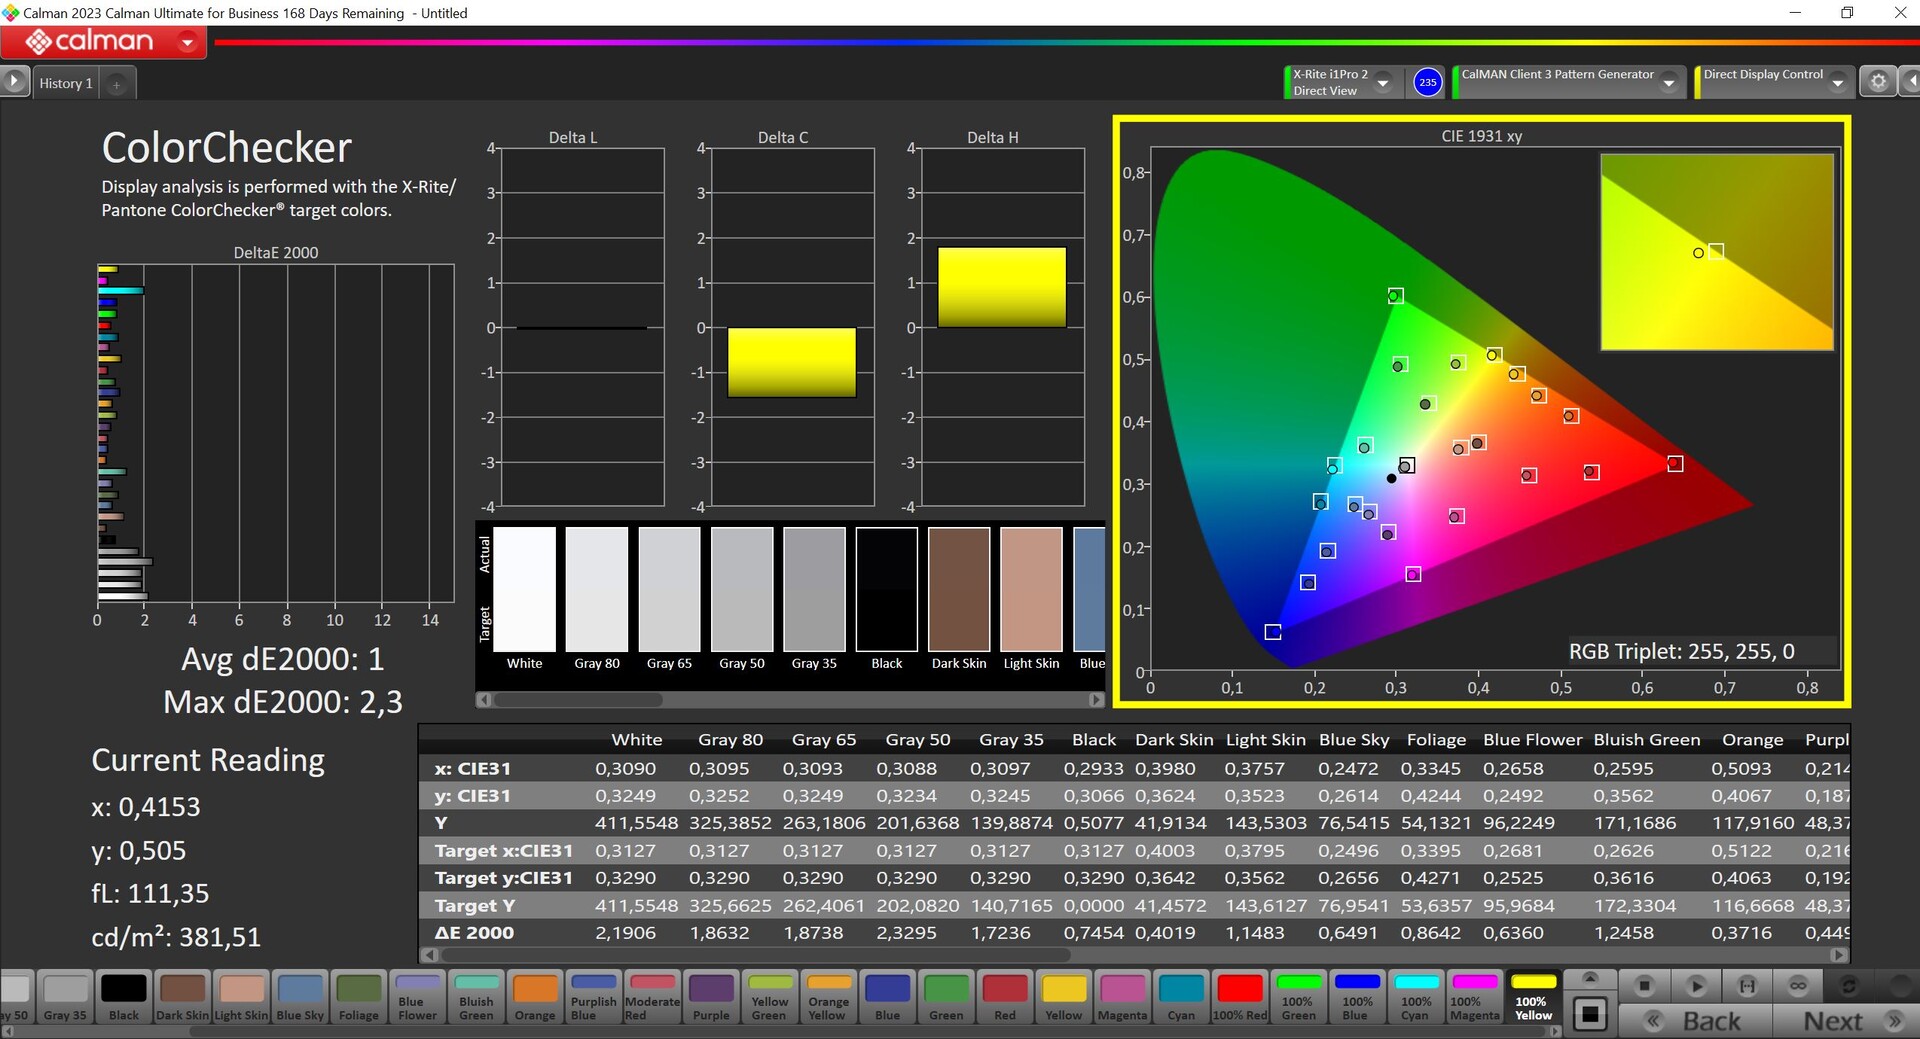
ΔE ColorChecker Calman: 0.9 | ∀{0.5-29.43 Ø4.71}
calibrated: 0.6
ΔE Greyscale Calman: 1.4 | ∀{0.09-98 Ø4.96}
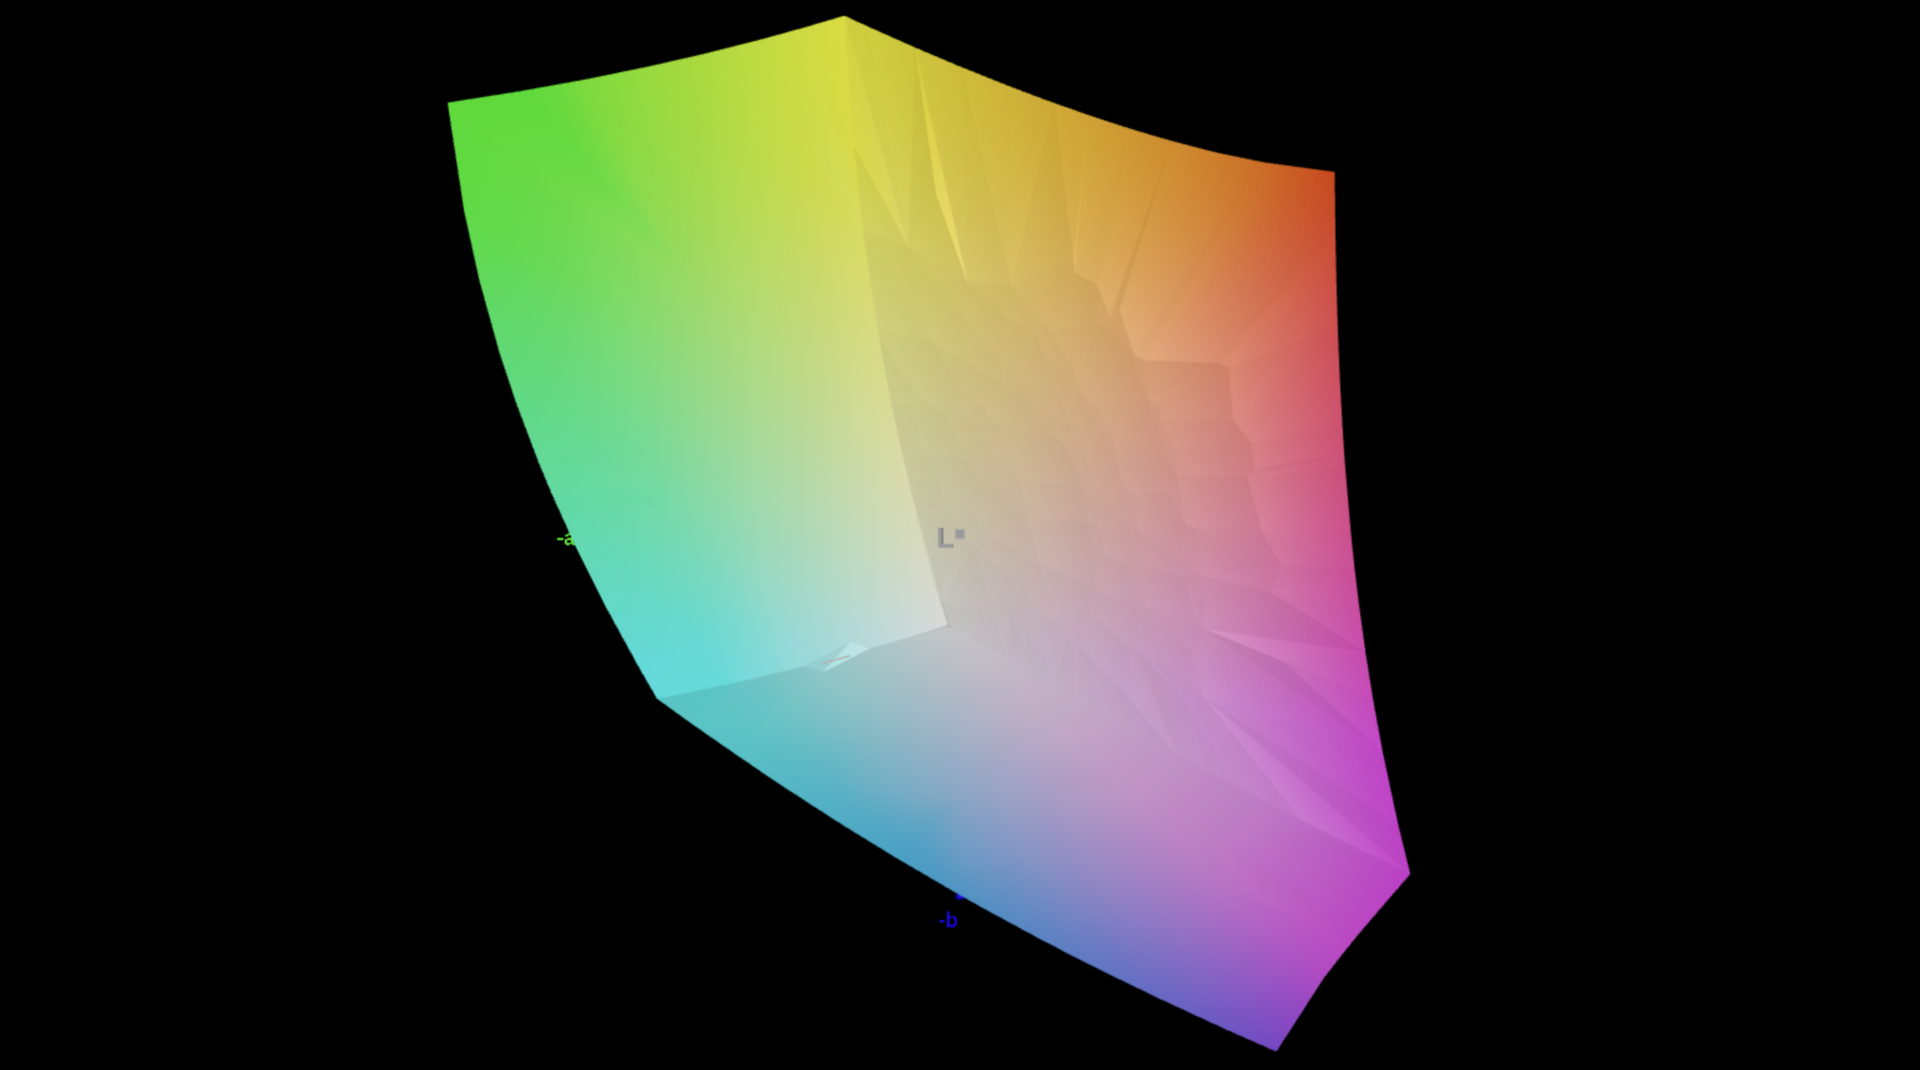
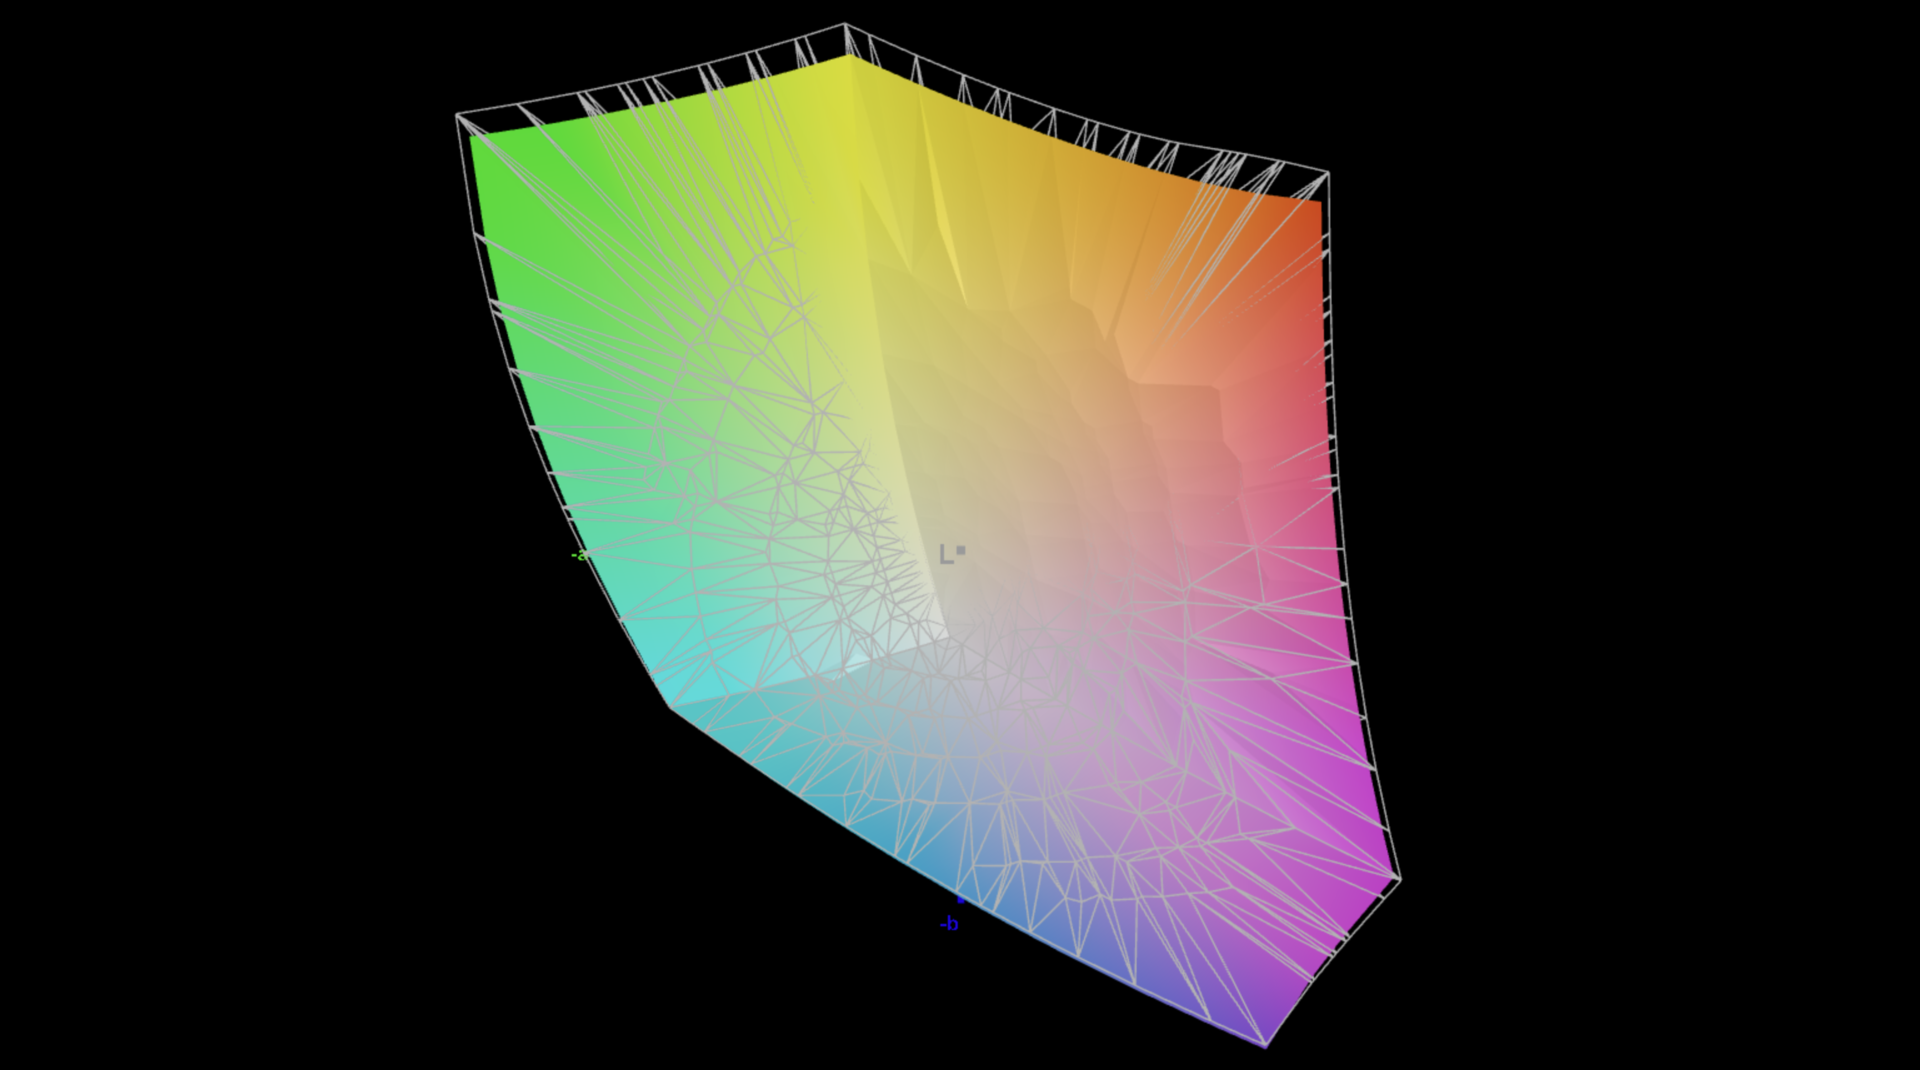
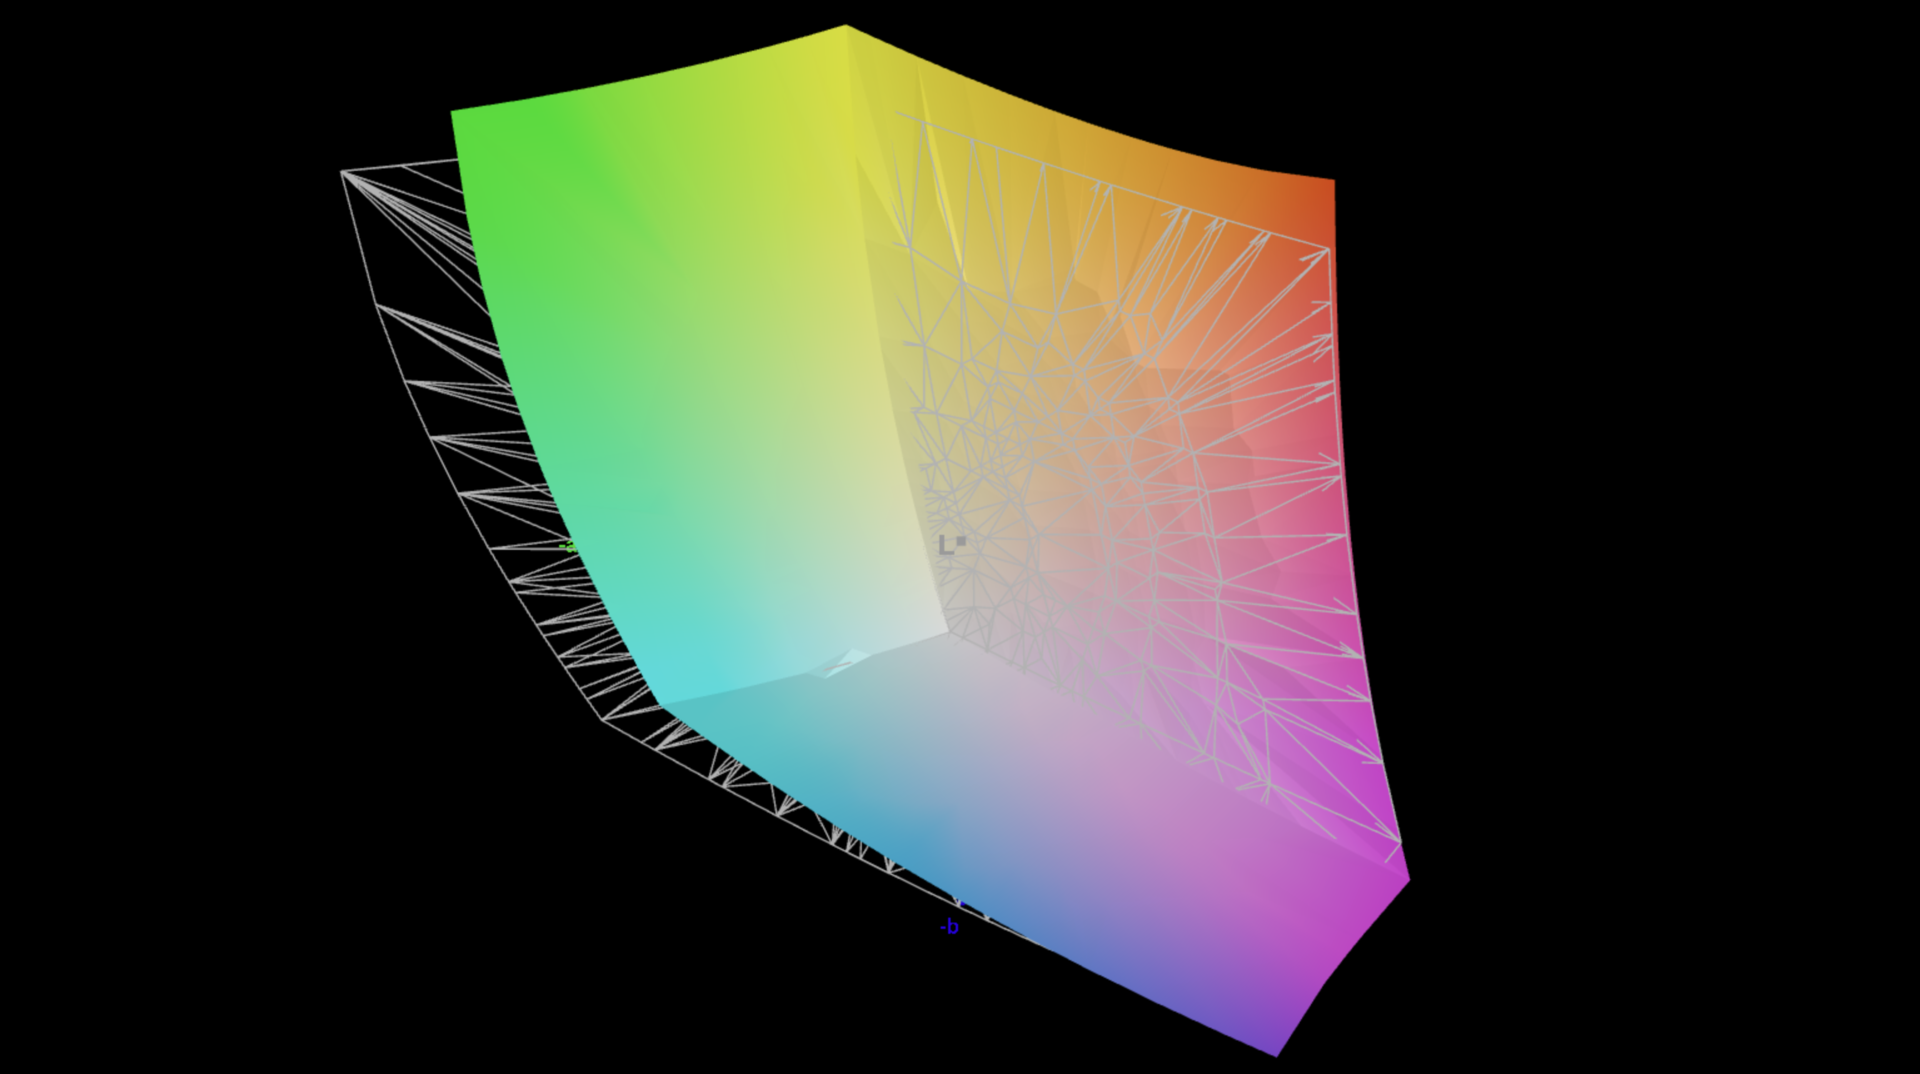
87.2% AdobeRGB 1998 (Argyll 3D)
100% sRGB (Argyll 3D)
95% Display P3 (Argyll 3D)
Gamma: 2.23
CCT: 6731 K
| Lenovo Legion 7 16 IRX G9 MNG007ZA1-2, IPS, 3200x2000, 16" | Lenovo Legion Pro 7 16IRX9H BOE CQ NE16QDM-NZB, IPS, 2560x1600, 16" | Lenovo Legion Pro 5 16IRX9 BOE NE160QDM-NYC, IPS, 2560x1600, 16" | Aorus 16X 2024 BOE CQ NE160QDM-NY1, IPS, 2560x1600, 16" | HP Omen Transcend 16-u1095ng ATNA60DL02-0 (SDC41A4), OLED, 2560x1600, 16" | Alienware m16 R2 BOE NE16NYH, IPS, 2560x1600, 16" | Schenker XMG CORE 16 (L23) BOE0AF0 (), IPS, 2560x1600, 16" | |
|---|---|---|---|---|---|---|---|
| Display | 1% | -16% | -18% | 5% | -14% | -16% | |
| Display P3 Coverage (%) | 95 | 98.5 4% | 69.3 -27% | 67.2 -29% | 99.8 5% | 71 -25% | 68.3 -28% |
| sRGB Coverage (%) | 100 | 99.9 0% | 99.4 -1% | 96.7 -3% | 100 0% | 100 0% | 98.6 -1% |
| AdobeRGB 1998 Coverage (%) | 87.2 | 86.7 -1% | 70.1 -20% | 69.3 -21% | 97 11% | 71.4 -18% | 69.6 -20% |
| Response Times | 16% | -4% | 37% | 98% | 20% | 8% | |
| Response Time Grey 50% / Grey 80% * (ms) | 14.4 ? | 12.6 ? 12% | 11.9 ? 17% | 7.5 ? 48% | 0.2 ? 99% | 5.7 ? 60% | 13.2 ? 8% |
| Response Time Black / White * (ms) | 7.2 ? | 5.8 ? 19% | 8.9 ? -24% | 5.4 ? 25% | 0.2 ? 97% | 8.7 ? -21% | 6.6 ? 8% |
| PWM Frequency (Hz) | 120 ? | ||||||
| Screen | 3% | -11% | -58% | 133% | -26% | -69% | |
| Brightness middle (cd/m²) | 412 | 487 18% | 384 -7% | 542 32% | 390 -5% | 345.8 -16% | 376 -9% |
| Brightness (cd/m²) | 396 | 460 16% | 366 -8% | 504 27% | 392 -1% | 337 -15% | 358 -10% |
| Brightness Distribution (%) | 89 | 88 -1% | 91 2% | 86 -3% | 98 10% | 87 -2% | 88 -1% |
| Black Level * (cd/m²) | 0.43 | 0.42 2% | 0.35 19% | 0.45 -5% | 0.02 95% | 0.3 30% | 0.33 23% |
| Contrast (:1) | 958 | 1160 21% | 1097 15% | 1204 26% | 19500 1935% | 1153 20% | 1139 19% |
| Colorchecker dE 2000 * | 0.9 | 1.12 -24% | 0.97 -8% | 2.73 -203% | 1.94 -116% | 1.99 -121% | 2.74 -204% |
| Colorchecker dE 2000 max. * | 2 | 2.26 -13% | 3.57 -79% | 5.29 -165% | 4.26 -113% | 3.52 -76% | 6.78 -239% |
| Colorchecker dE 2000 calibrated * | 0.6 | 0.54 10% | 0.77 -28% | 1.32 -120% | 4.21 -602% | 0.62 -3% | 0.88 -47% |
| Greyscale dE 2000 * | 1.4 | 1.4 -0% | 1.5 -7% | 2.9 -107% | 1.5 -7% | 2.1 -50% | 3.57 -155% |
| Gamma | 2.23 99% | 2.242 98% | 2.24 98% | 2.192 100% | 2.221 99% | 2.32 95% | 2.4 92% |
| CCT | 6731 97% | 6809 95% | 6709 97% | 6173 105% | 6395 102% | 6369 102% | 7246 90% |
| Média Total (Programa/Configurações) | 7% /
5% | -10% /
-11% | -13% /
-36% | 79% /
101% | -7% /
-17% | -26% /
-47% |
* ... menor é melhor
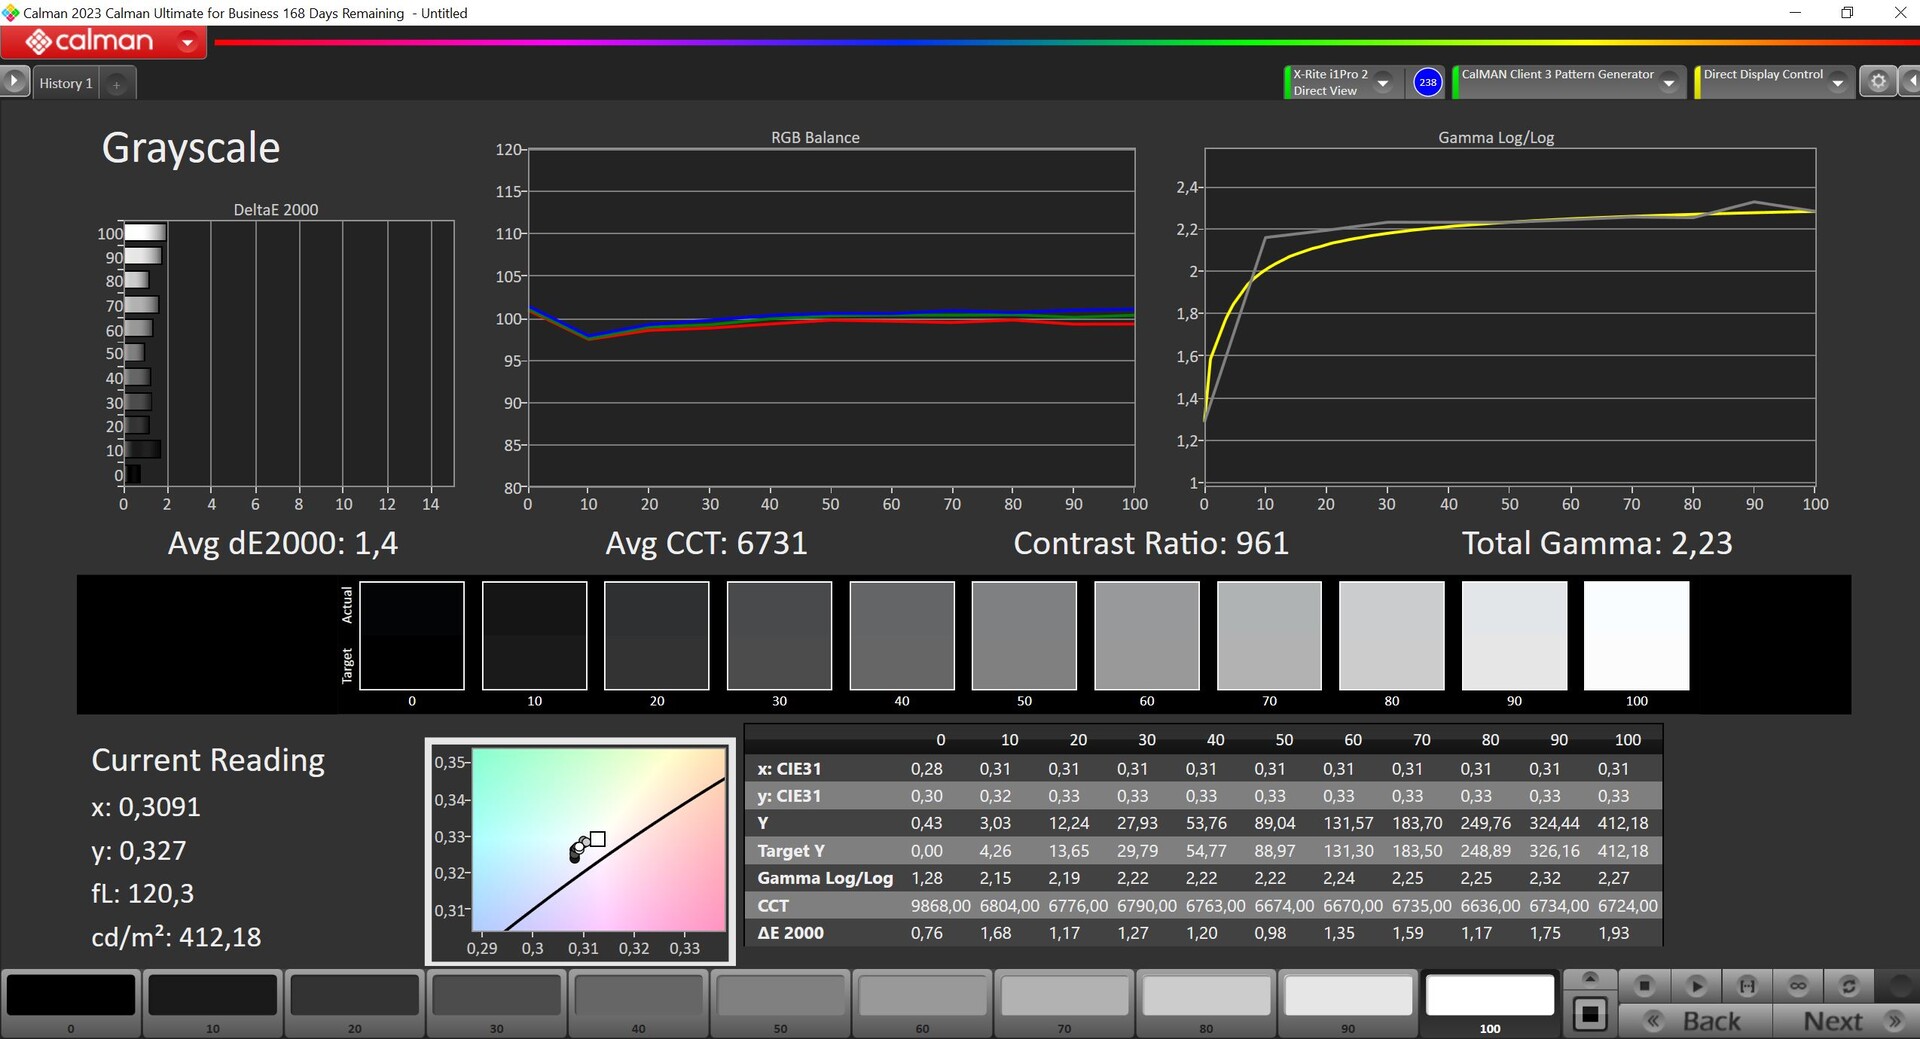
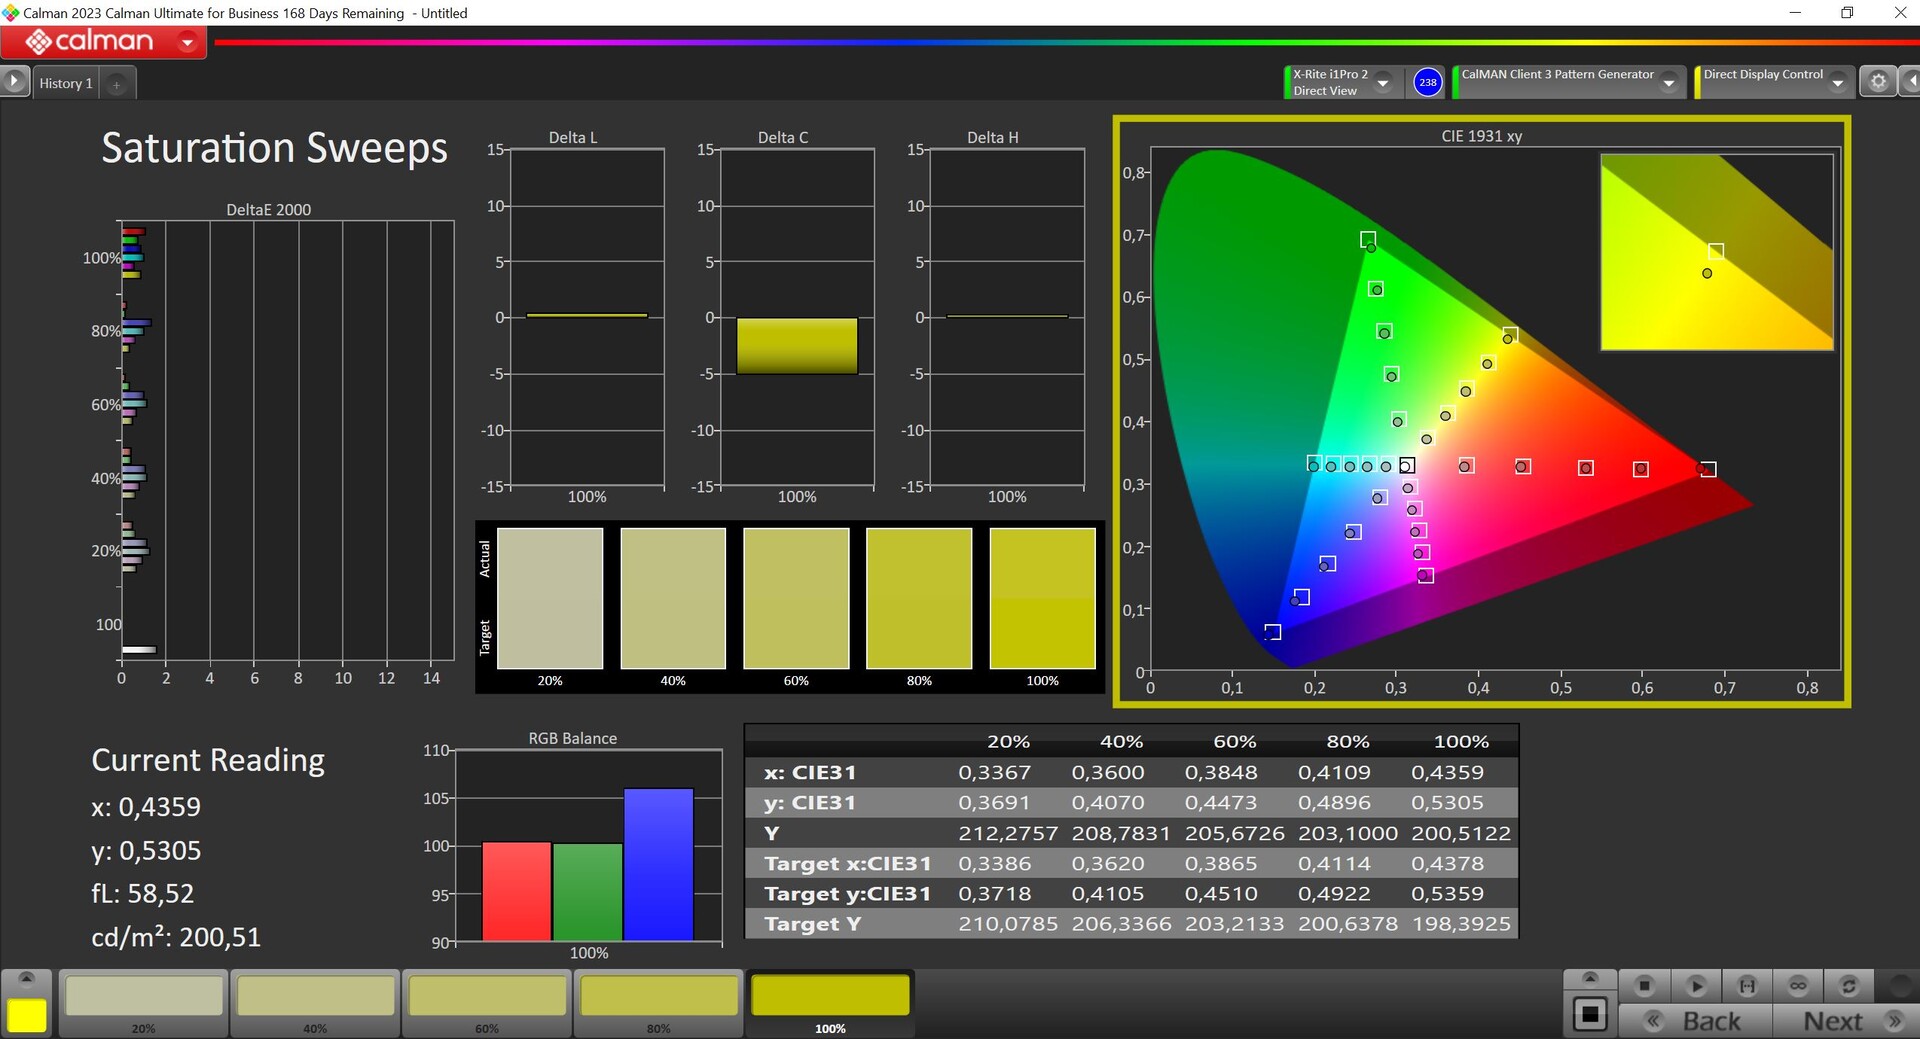
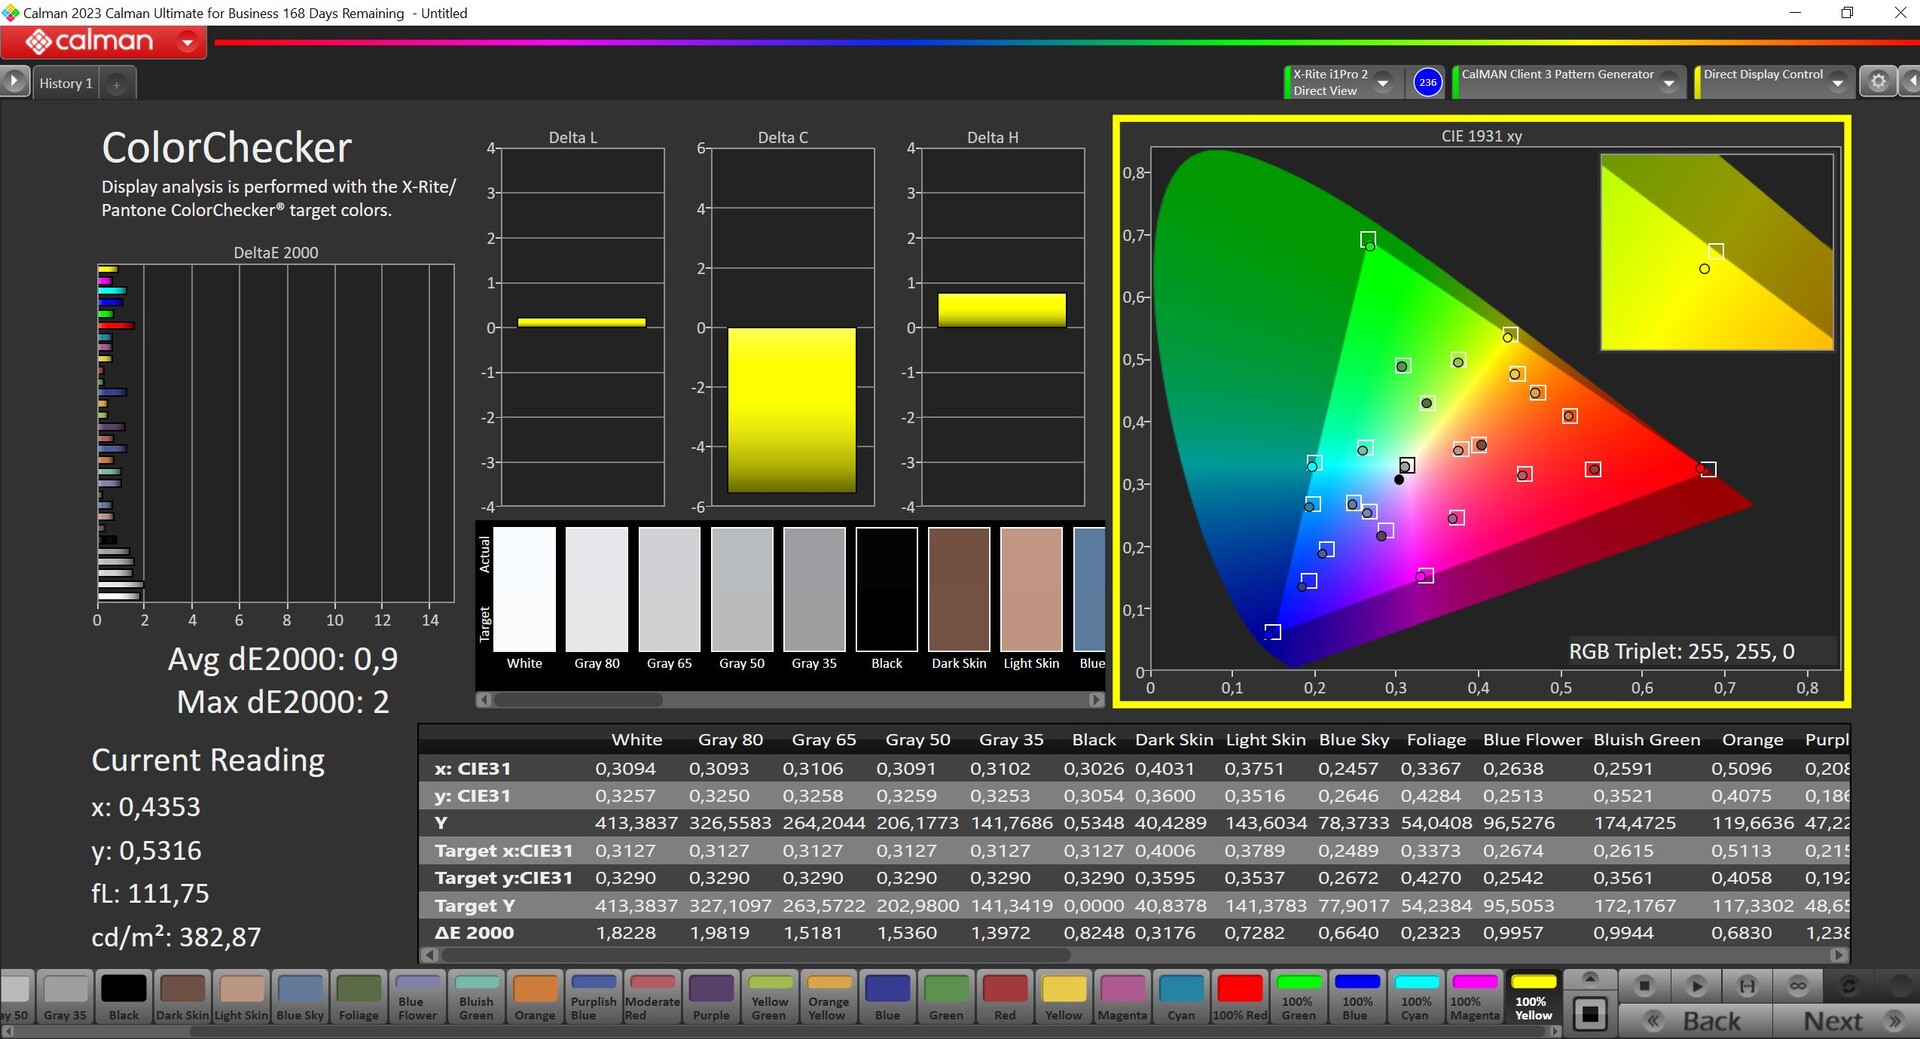
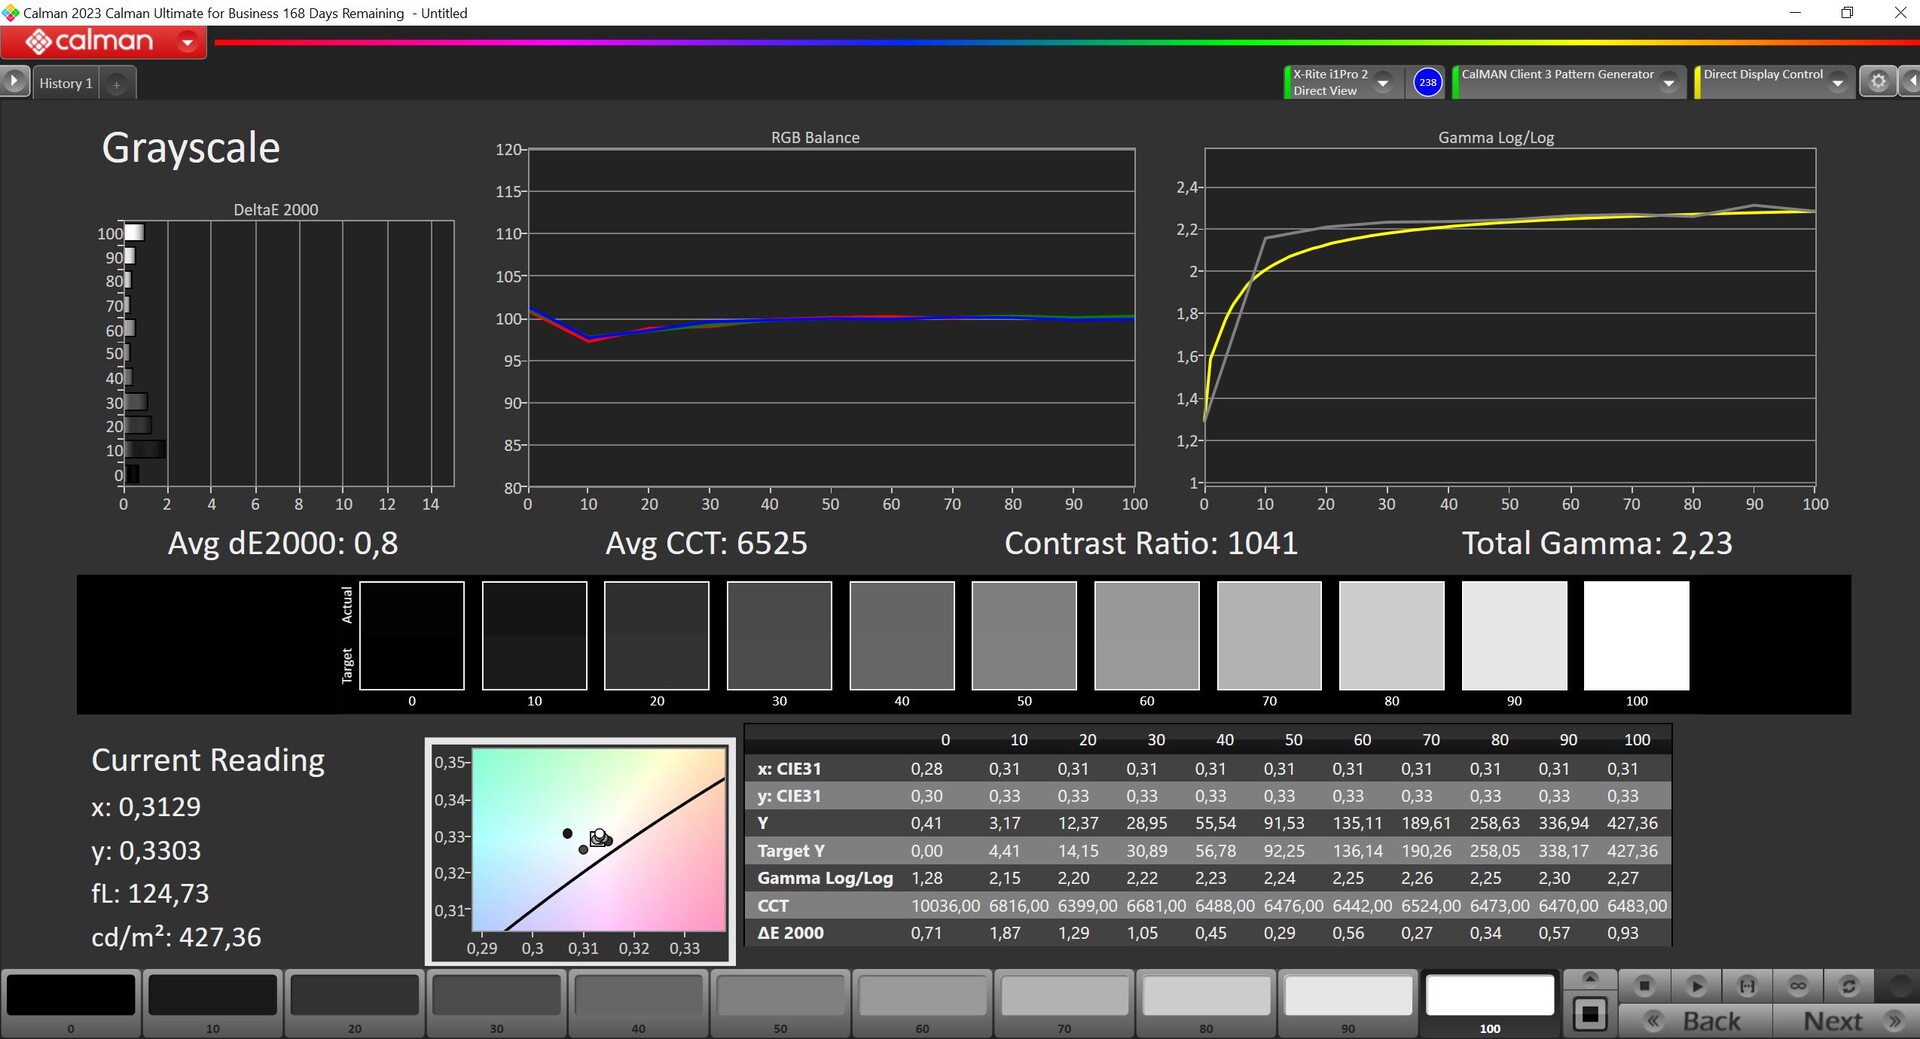

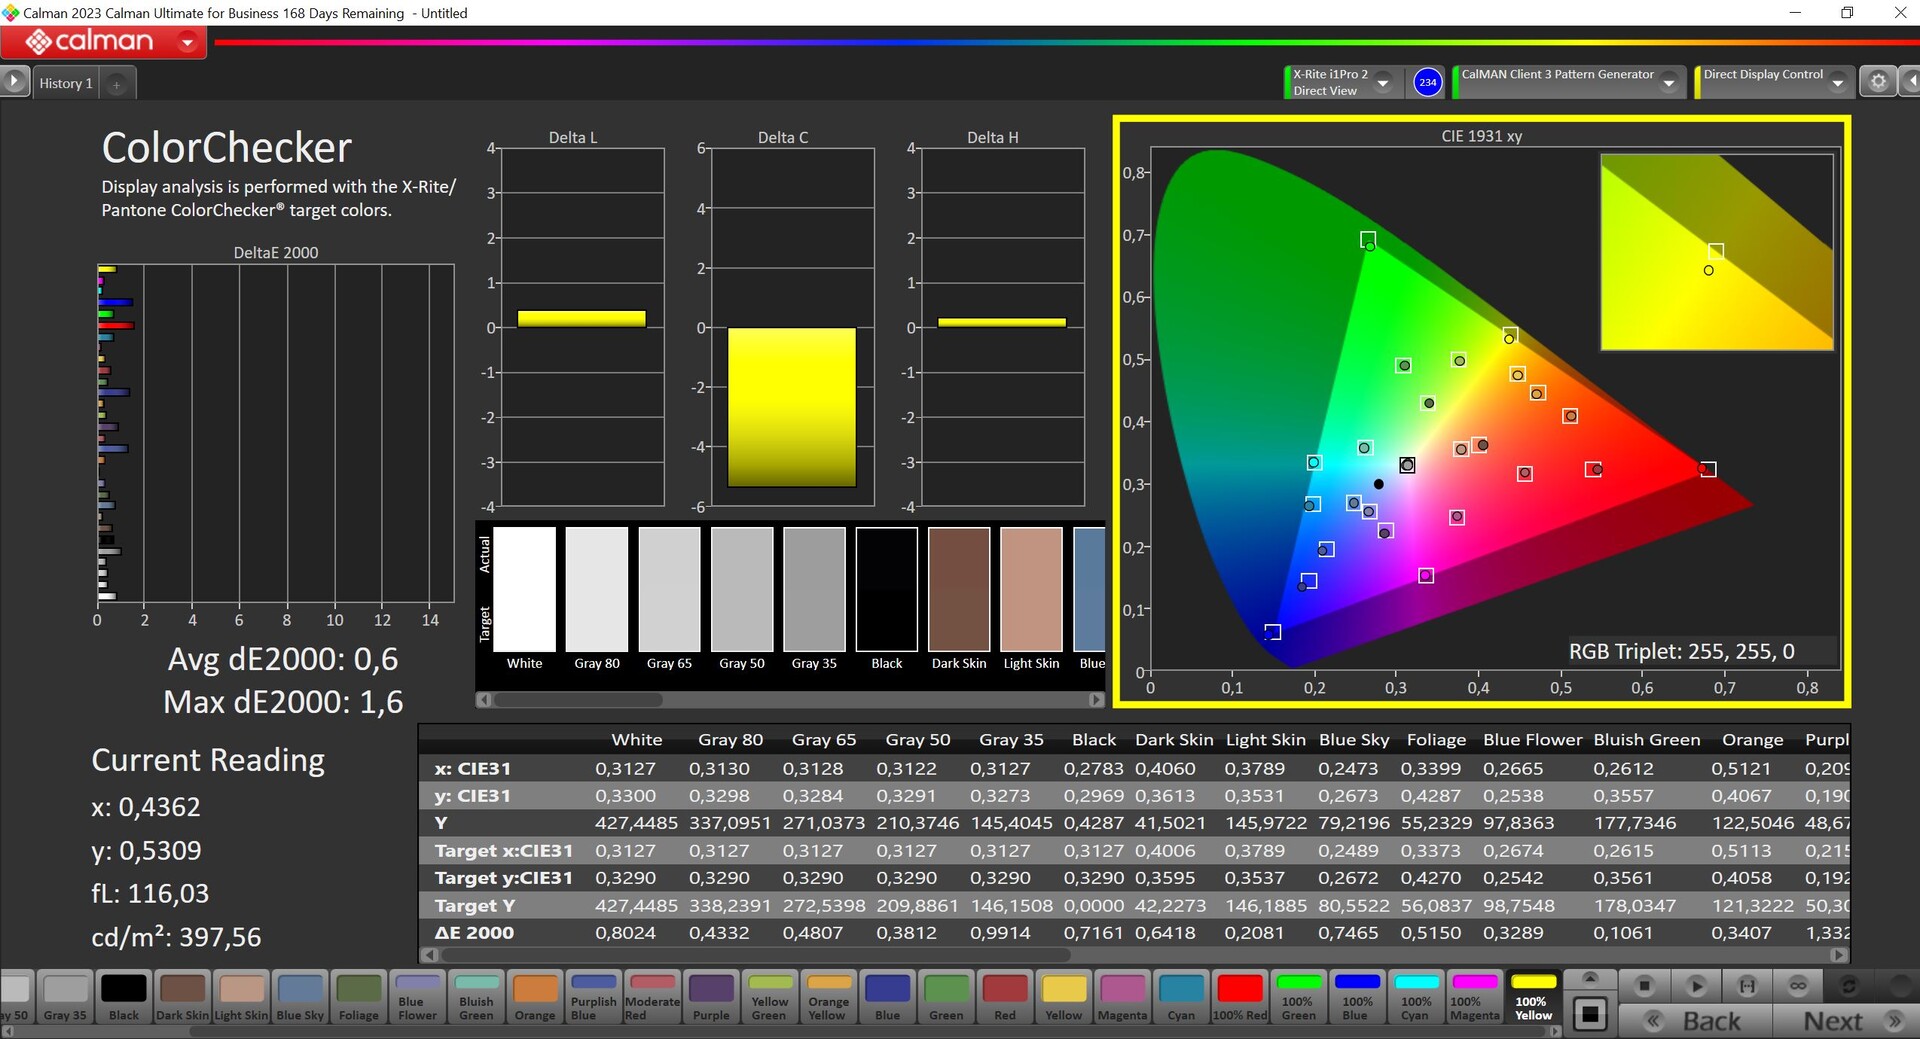
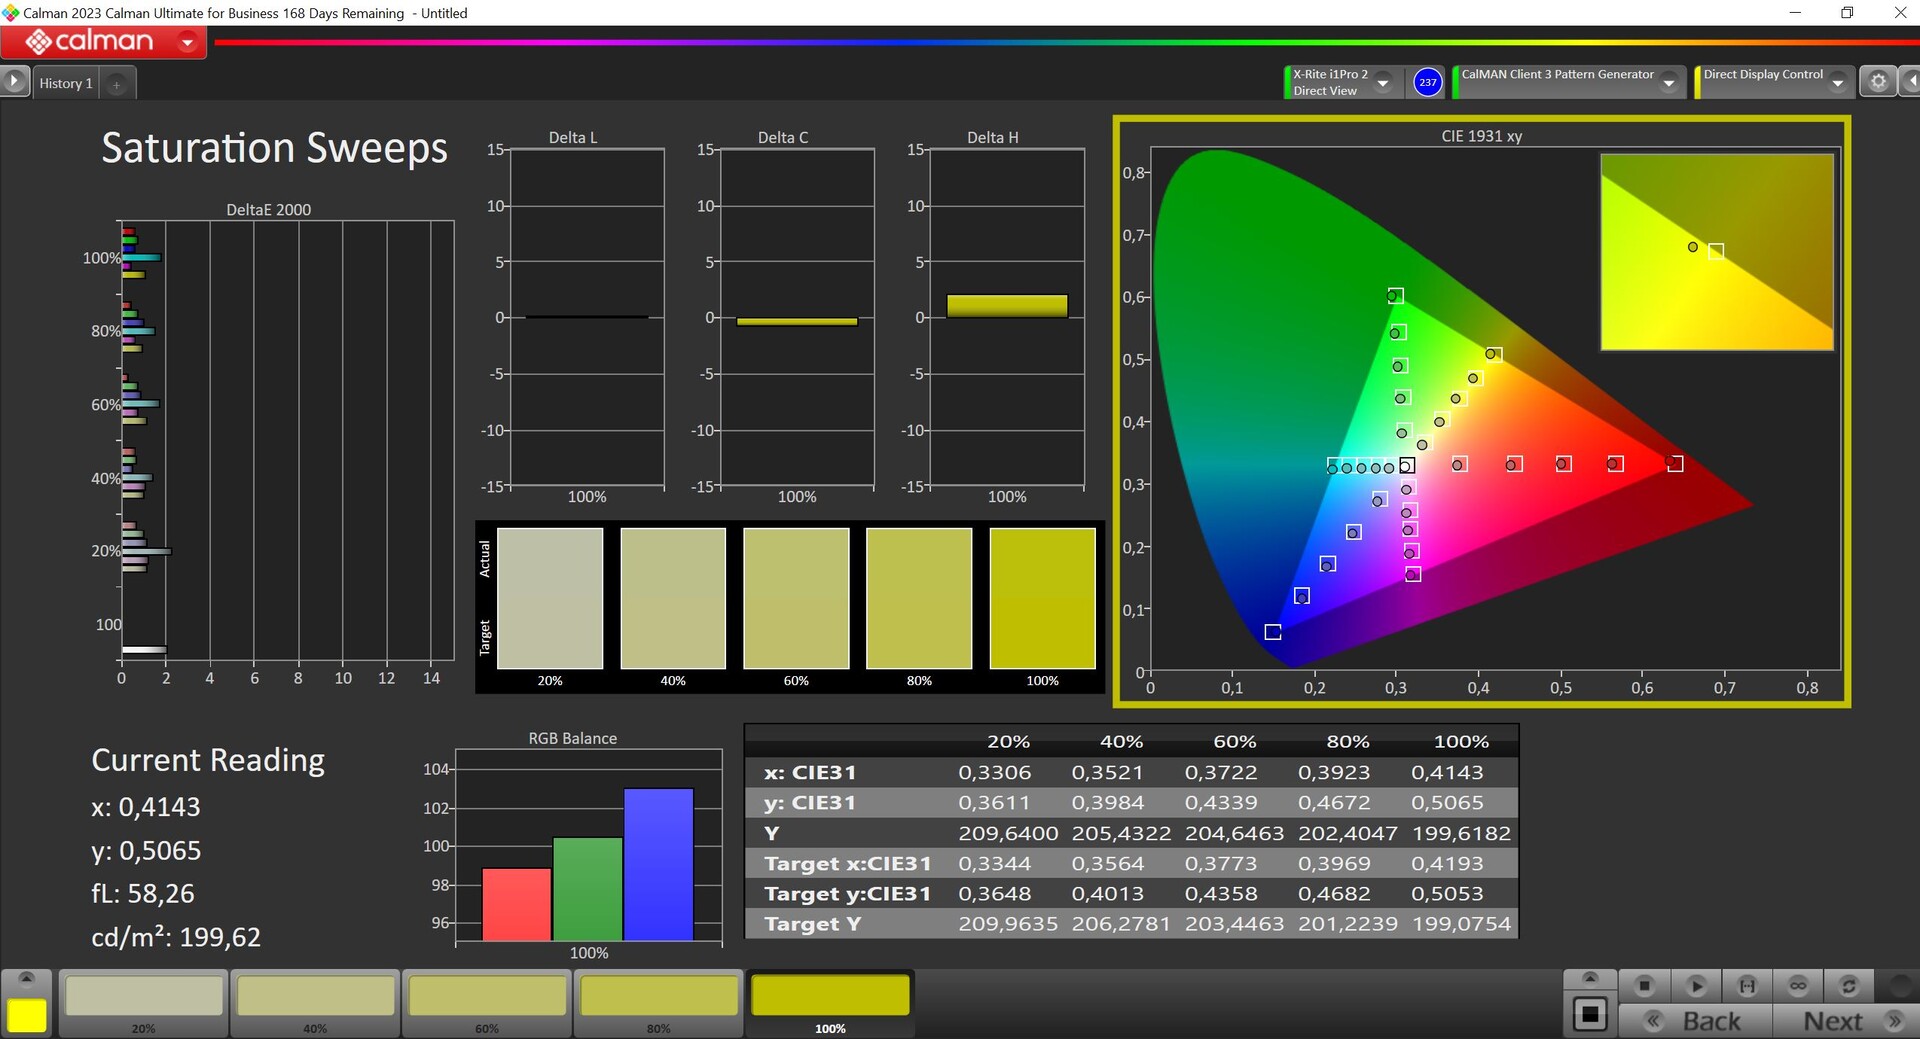
Analisamos o painel usando o software profissional CalMAN (X-Rite i1 Pro 2). A Lenovo oferece vários perfis e, fora da caixa, o perfil padrão oferece imagens precisas. Opcionalmente, há também um perfil nativo com um brilho máximo mais alto (~455 cd/m²), mas também uma temperatura de cor que é muito quente e também tem desvios de cor mais altos. Com nossa calibração, conseguimos melhorar ainda mais as imagens e um download gratuito do perfil correspondente está disponível acima. Da mesma forma, a Lenovo oferece um modo sRGB muito preciso que é particularmente importante para editar imagens. O espaço de cores sRGB é coberto completamente; P3 a 95%.

Exibir tempos de resposta
| ↔ Tempo de resposta preto para branco | ||
|---|---|---|
| 7.2 ms ... ascensão ↗ e queda ↘ combinadas | ↗ 2.9 ms ascensão | 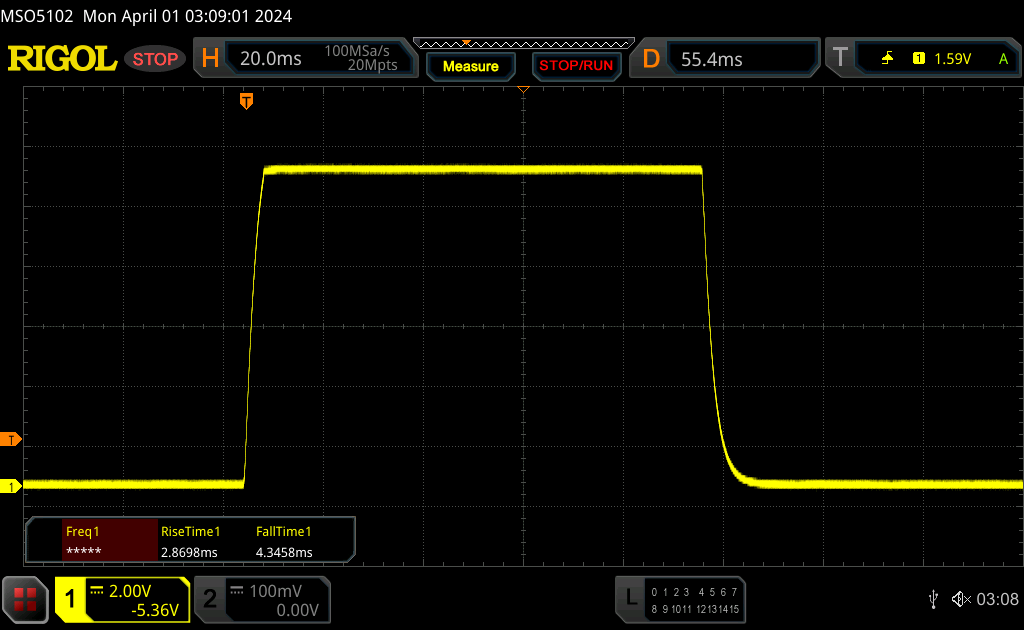 |
| ↘ 4.3 ms queda | ||
| A tela mostra taxas de resposta muito rápidas em nossos testes e deve ser muito adequada para jogos em ritmo acelerado. Em comparação, todos os dispositivos testados variam de 0.1 (mínimo) a 240 (máximo) ms. » 21 % de todos os dispositivos são melhores. Isso significa que o tempo de resposta medido é melhor que a média de todos os dispositivos testados (19.8 ms). | ||
| ↔ Tempo de resposta 50% cinza a 80% cinza | ||
| 14.4 ms ... ascensão ↗ e queda ↘ combinadas | ↗ 6.9 ms ascensão | 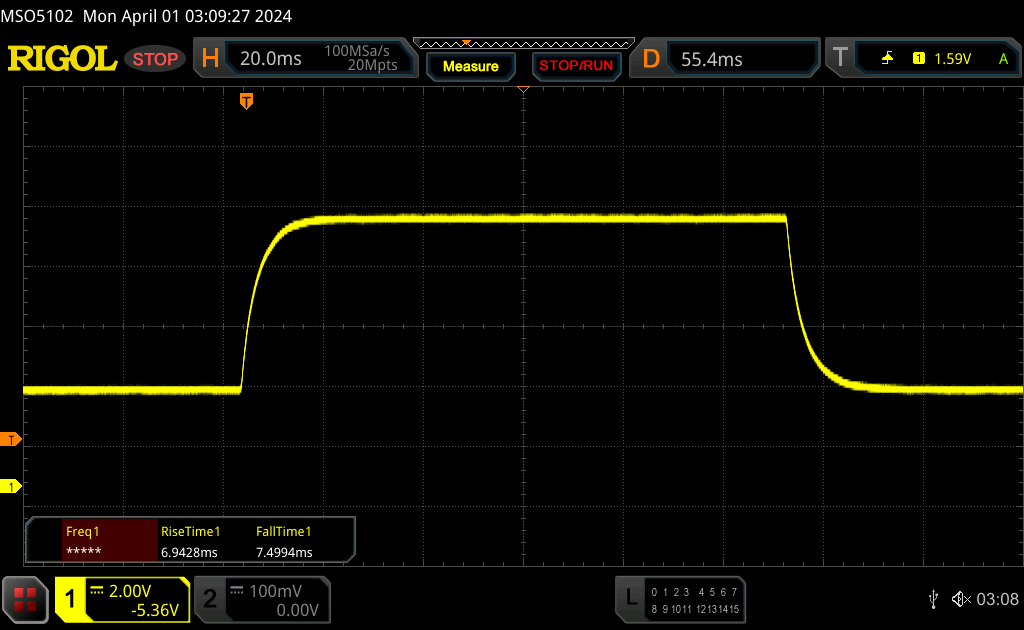 |
| ↘ 7.5 ms queda | ||
| A tela mostra boas taxas de resposta em nossos testes, mas pode ser muito lenta para jogadores competitivos. Em comparação, todos os dispositivos testados variam de 0.165 (mínimo) a 636 (máximo) ms. » 28 % de todos os dispositivos são melhores. Isso significa que o tempo de resposta medido é melhor que a média de todos os dispositivos testados (31 ms). | ||
Cintilação da tela / PWM (modulação por largura de pulso)
| Tela tremeluzindo / PWM não detectado | 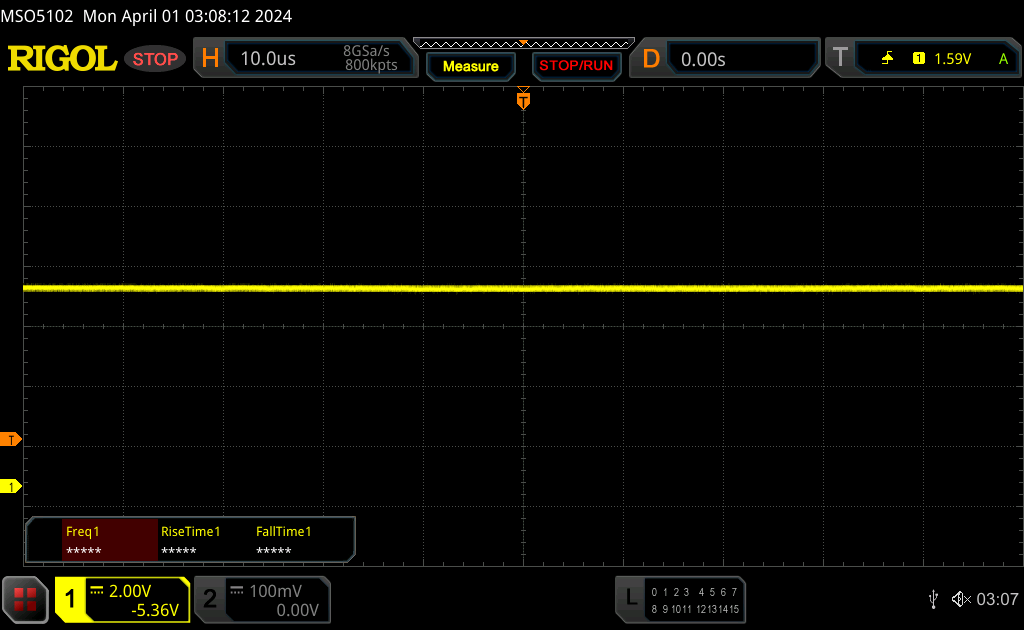 | ||
[pwm_comparison] Em comparação: 52 % de todos os dispositivos testados não usam PWM para escurecer a tela. Se PWM foi detectado, uma média de 7757 (mínimo: 5 - máximo: 343500) Hz foi medida. | |||


Graças à tela fosca, o painel também pode ser usado em ambientes externos, mas, em dias claros, o brilho poderia ser ainda maior. A estabilidade do ângulo de visão do painel IPS é muito boa.

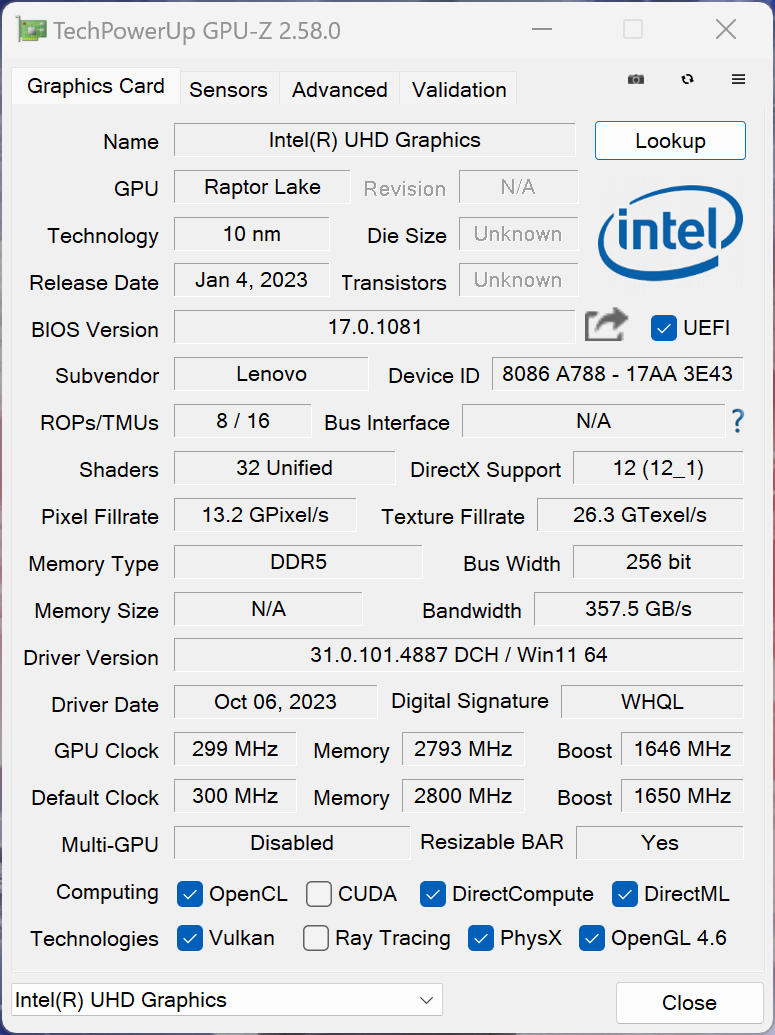
Desempenho - Raptor Lake HX e um laptop RTX 4070 com overclock
Condições de teste
Como de costume, a Lenovo oferece vários perfis de energia e compilamos uma lista resumida dos dados de desempenho correspondentes na tabela a seguir. O perfil atual também é exibido através do LED do botão de energia. Realizamos os benchmarks e as medições no modo de desempenho, no qual a GPU é automaticamente submetida a um leve overclock (núcleo de +100 MHz, VRAM de +200 MHz). O modo de desempenho não está disponível no modo de bateria.
| Perfil de energia | Carga da CPU | CB R23 Multi | Carga da GPU | Time Spy Gráficos | Cyberpunk 2077 QHD Ultra |
Volume máximo de fãs |
|---|---|---|---|---|---|---|
| Modo silencioso | 65 -> 54 watts | 20.203 pontos | 65 watts | 8.239 pontos | 35 FPS | 38,4 dB(A) |
| Equilibrado | 120 -> 85 watts | 24.142 pontos | 95 watts | 9.853 pontos | 41,5 FPS | 50,7 dB(A) |
| Modo de desempenho | 154 -> 90 watts | 31.127 pontos | 115 watts | 12.174 pontos | 51,4 FPS | 54,1 dB(A) |
Observação: Sem sucesso, tentamos atualizar os drivers da Nvidia. O driver oficial encerrou a instalação com um problema de compatibilidade. Até o momento, a própria Lenovo disponibilizou apenas o driver 537.70 pré-instalado e foi esse que inevitavelmente usamos.
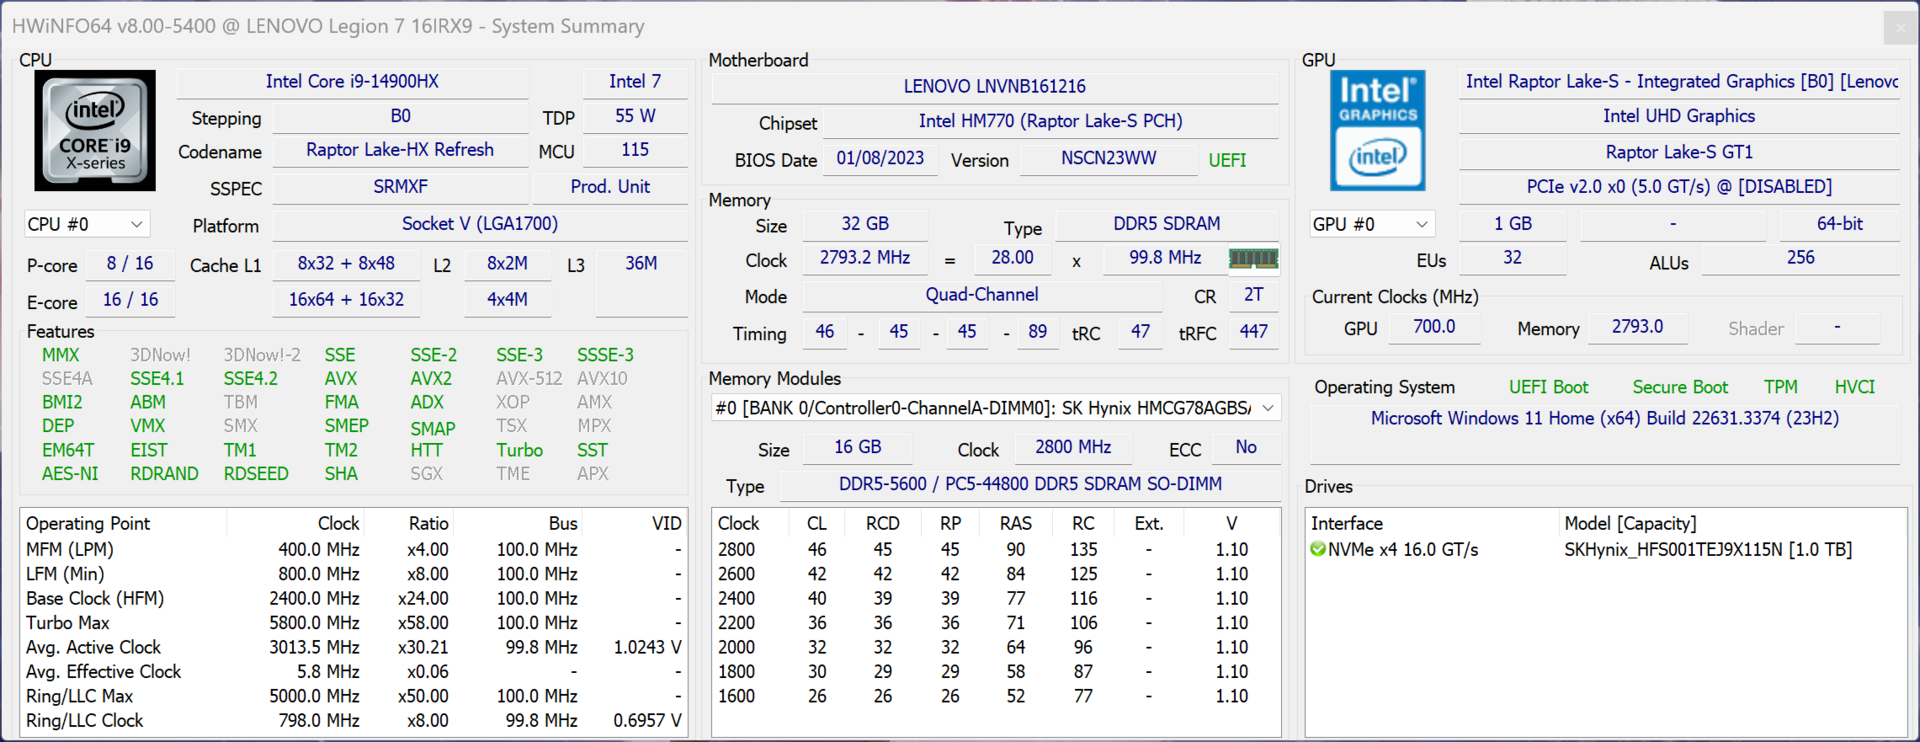
Processador - Core i9-14900HX
A Lenovo também equipou o Legion 7 16 normal com o Core i9-14900HXo mais rápido processador móvel Raptor Lake, que também pode ser encontrado no mais caro Legion Pro 7. Em comparação com os dois modelos mais grossos do Legion Pro 7/5 16, o gabinete mais fino tem um impacto quando se trata dos limites de energia, caindo para 90 watts depois de ter atingido 154 watts por um breve período. Em suma, o desempenho foi excelente nos testes de vários núcleos e de um único núcleo. No modo de bateria, o processador pode consumir um máximo de 60 watts, razão pela qual o desempenho de vários núcleos é cerca de 40% menor aqui. Outros benchmarks de CPU podem ser encontrados em nossa seção de tecnologia.
Cinebench R15 Multi Continuous Test
Cinebench R23: Multi Core | Single Core
Cinebench R20: CPU (Multi Core) | CPU (Single Core)
Cinebench R15: CPU Multi 64Bit | CPU Single 64Bit
Blender: v2.79 BMW27 CPU
7-Zip 18.03: 7z b 4 | 7z b 4 -mmt1
Geekbench 6.7: Multi-Core | Single-Core
Geekbench 5.5: Multi-Core | Single-Core
HWBOT x265 Benchmark v2.2: 4k Preset
LibreOffice : 20 Documents To PDF
R Benchmark 2.5: Overall mean
| CPU Performance rating | |
| Lenovo Legion Pro 7 16IRX9H | |
| Lenovo Legion 7 16 IRX G9 | |
| Lenovo Legion Pro 5 16IRX9 | |
| Aorus 16X 2024 | |
| Média Intel Core i9-14900HX | |
| Média da turma Gaming | |
| HP Omen Transcend 16-u1095ng | |
| Alienware m16 R2 -1! | |
| Schenker XMG CORE 16 (L23) | |
| Cinebench R23 / Multi Core | |
| Lenovo Legion Pro 7 16IRX9H | |
| Lenovo Legion 7 16 IRX G9 | |
| Lenovo Legion Pro 5 16IRX9 | |
| Média Intel Core i9-14900HX (17078 - 36249, n=37) | |
| Aorus 16X 2024 | |
| Média da turma Gaming (10488 - 42661, n=107, últimos 2 anos) | |
| HP Omen Transcend 16-u1095ng | |
| Alienware m16 R2 | |
| Schenker XMG CORE 16 (L23) | |
| Cinebench R23 / Single Core | |
| Lenovo Legion Pro 7 16IRX9H | |
| Lenovo Legion 7 16 IRX G9 | |
| Aorus 16X 2024 | |
| HP Omen Transcend 16-u1095ng | |
| Média Intel Core i9-14900HX (1720 - 2245, n=37) | |
| Lenovo Legion Pro 5 16IRX9 | |
| Média da turma Gaming (1166 - 2415, n=107, últimos 2 anos) | |
| Schenker XMG CORE 16 (L23) | |
| Alienware m16 R2 | |
| Cinebench R20 / CPU (Multi Core) | |
| Lenovo Legion Pro 7 16IRX9H | |
| Lenovo Legion 7 16 IRX G9 | |
| Lenovo Legion Pro 5 16IRX9 | |
| Média Intel Core i9-14900HX (6579 - 13832, n=37) | |
| Aorus 16X 2024 | |
| Média da turma Gaming (4029 - 16433, n=106, últimos 2 anos) | |
| HP Omen Transcend 16-u1095ng | |
| Alienware m16 R2 | |
| Schenker XMG CORE 16 (L23) | |
| Cinebench R20 / CPU (Single Core) | |
| Lenovo Legion 7 16 IRX G9 | |
| Aorus 16X 2024 | |
| HP Omen Transcend 16-u1095ng | |
| Lenovo Legion Pro 7 16IRX9H | |
| Média Intel Core i9-14900HX (657 - 859, n=37) | |
| Lenovo Legion Pro 5 16IRX9 | |
| Média da turma Gaming (442 - 913, n=106, últimos 2 anos) | |
| Schenker XMG CORE 16 (L23) | |
| Alienware m16 R2 | |
| Cinebench R15 / CPU Multi 64Bit | |
| Lenovo Legion Pro 7 16IRX9H | |
| Lenovo Legion 7 16 IRX G9 | |
| Lenovo Legion Pro 5 16IRX9 | |
| Média Intel Core i9-14900HX (3263 - 5589, n=38) | |
| Aorus 16X 2024 | |
| Média da turma Gaming (1578 - 6330, n=105, últimos 2 anos) | |
| HP Omen Transcend 16-u1095ng | |
| Alienware m16 R2 | |
| Schenker XMG CORE 16 (L23) | |
| Cinebench R15 / CPU Single 64Bit | |
| Lenovo Legion Pro 7 16IRX9H | |
| Aorus 16X 2024 | |
| Lenovo Legion 7 16 IRX G9 | |
| Média Intel Core i9-14900HX (247 - 323, n=37) | |
| Lenovo Legion Pro 5 16IRX9 | |
| HP Omen Transcend 16-u1095ng | |
| Média da turma Gaming (188.8 - 350, n=106, últimos 2 anos) | |
| Schenker XMG CORE 16 (L23) | |
| Alienware m16 R2 | |
| Blender / v2.79 BMW27 CPU | |
| Schenker XMG CORE 16 (L23) | |
| HP Omen Transcend 16-u1095ng | |
| Média da turma Gaming (79 - 330, n=104, últimos 2 anos) | |
| Aorus 16X 2024 | |
| Lenovo Legion 7 16 IRX G9 | |
| Média Intel Core i9-14900HX (91 - 206, n=37) | |
| Lenovo Legion Pro 5 16IRX9 | |
| Lenovo Legion Pro 7 16IRX9H | |
| 7-Zip 18.03 / 7z b 4 | |
| Lenovo Legion Pro 7 16IRX9H | |
| Lenovo Legion Pro 5 16IRX9 | |
| Média Intel Core i9-14900HX (66769 - 136645, n=37) | |
| Lenovo Legion 7 16 IRX G9 | |
| Aorus 16X 2024 | |
| Média da turma Gaming (33491 - 148086, n=105, últimos 2 anos) | |
| HP Omen Transcend 16-u1095ng | |
| Schenker XMG CORE 16 (L23) | |
| Alienware m16 R2 | |
| 7-Zip 18.03 / 7z b 4 -mmt1 | |
| Lenovo Legion Pro 7 16IRX9H | |
| Aorus 16X 2024 | |
| Lenovo Legion 7 16 IRX G9 | |
| HP Omen Transcend 16-u1095ng | |
| Média Intel Core i9-14900HX (5452 - 7545, n=37) | |
| Lenovo Legion Pro 5 16IRX9 | |
| Schenker XMG CORE 16 (L23) | |
| Média da turma Gaming (4199 - 7436, n=105, últimos 2 anos) | |
| Alienware m16 R2 | |
| Geekbench 6.7 / Multi-Core | |
| Lenovo Legion Pro 7 16IRX9H | |
| Lenovo Legion Pro 5 16IRX9 | |
| Lenovo Legion 7 16 IRX G9 | |
| Aorus 16X 2024 | |
| Média Intel Core i9-14900HX (13158 - 19665, n=37) | |
| HP Omen Transcend 16-u1095ng | |
| Média da turma Gaming (6625 - 22850, n=106, últimos 2 anos) | |
| Schenker XMG CORE 16 (L23) | |
| Alienware m16 R2 | |
| Geekbench 6.7 / Single-Core | |
| Aorus 16X 2024 | |
| Lenovo Legion Pro 7 16IRX9H | |
| Lenovo Legion 7 16 IRX G9 | |
| Média Intel Core i9-14900HX (2419 - 3129, n=37) | |
| Lenovo Legion Pro 5 16IRX9 | |
| Média da turma Gaming (1490 - 3259, n=106, últimos 2 anos) | |
| HP Omen Transcend 16-u1095ng | |
| Schenker XMG CORE 16 (L23) | |
| Alienware m16 R2 | |
| Geekbench 5.5 / Multi-Core | |
| Lenovo Legion Pro 5 16IRX9 | |
| Lenovo Legion Pro 7 16IRX9H | |
| Lenovo Legion 7 16 IRX G9 | |
| Aorus 16X 2024 | |
| Média Intel Core i9-14900HX (8618 - 23194, n=37) | |
| HP Omen Transcend 16-u1095ng | |
| Média da turma Gaming (6460 - 28263, n=105, últimos 2 anos) | |
| Alienware m16 R2 | |
| Schenker XMG CORE 16 (L23) | |
| Geekbench 5.5 / Single-Core | |
| Aorus 16X 2024 | |
| Lenovo Legion Pro 7 16IRX9H | |
| Lenovo Legion 7 16 IRX G9 | |
| Média Intel Core i9-14900HX (1669 - 2210, n=37) | |
| Média da turma Gaming (986 - 2474, n=105, últimos 2 anos) | |
| HP Omen Transcend 16-u1095ng | |
| Lenovo Legion Pro 5 16IRX9 | |
| Schenker XMG CORE 16 (L23) | |
| Alienware m16 R2 | |
| HWBOT x265 Benchmark v2.2 / 4k Preset | |
| Lenovo Legion Pro 7 16IRX9H | |
| Lenovo Legion Pro 5 16IRX9 | |
| Média Intel Core i9-14900HX (16.8 - 38.9, n=37) | |
| Lenovo Legion 7 16 IRX G9 | |
| Média da turma Gaming (11.5 - 44.4, n=105, últimos 2 anos) | |
| Aorus 16X 2024 | |
| HP Omen Transcend 16-u1095ng | |
| Schenker XMG CORE 16 (L23) | |
| Alienware m16 R2 | |
| LibreOffice / 20 Documents To PDF | |
| Schenker XMG CORE 16 (L23) | |
| HP Omen Transcend 16-u1095ng | |
| Alienware m16 R2 | |
| Média da turma Gaming (33.2 - 88.8, n=105, últimos 2 anos) | |
| Lenovo Legion 7 16 IRX G9 | |
| Média Intel Core i9-14900HX (19 - 85.1, n=37) | |
| Lenovo Legion Pro 5 16IRX9 | |
| Aorus 16X 2024 | |
| Lenovo Legion Pro 7 16IRX9H | |
| R Benchmark 2.5 / Overall mean | |
| Alienware m16 R2 | |
| Schenker XMG CORE 16 (L23) | |
| Média da turma Gaming (0.3439 - 0.759, n=106, últimos 2 anos) | |
| HP Omen Transcend 16-u1095ng | |
| Lenovo Legion 7 16 IRX G9 | |
| Lenovo Legion Pro 5 16IRX9 | |
| Lenovo Legion Pro 7 16IRX9H | |
| Média Intel Core i9-14900HX (0.3604 - 0.4859, n=37) | |
| Aorus 16X 2024 | |
* ... menor é melhor
AIDA64: FP32 Ray-Trace | FPU Julia | CPU SHA3 | CPU Queen | FPU SinJulia | FPU Mandel | CPU AES | CPU ZLib | FP64 Ray-Trace | CPU PhotoWorxx
| Performance rating | |
| Lenovo Legion Pro 7 16IRX9H | |
| Média da turma Gaming | |
| Lenovo Legion Pro 5 16IRX9 | |
| Média Intel Core i9-14900HX | |
| Aorus 16X 2024 | |
| Lenovo Legion 7 16 IRX G9 | |
| Schenker XMG CORE 16 (L23) | |
| HP Omen Transcend 16-u1095ng | |
| Alienware m16 R2 | |
| AIDA64 / FP32 Ray-Trace | |
| Média da turma Gaming (10227 - 85542, n=105, últimos 2 anos) | |
| Lenovo Legion Pro 7 16IRX9H | |
| Schenker XMG CORE 16 (L23) | |
| Lenovo Legion 7 16 IRX G9 | |
| Lenovo Legion Pro 5 16IRX9 | |
| Média Intel Core i9-14900HX (13098 - 33474, n=36) | |
| Aorus 16X 2024 | |
| Alienware m16 R2 | |
| HP Omen Transcend 16-u1095ng | |
| AIDA64 / FPU Julia | |
| Média da turma Gaming (51376 - 238426, n=105, últimos 2 anos) | |
| Lenovo Legion Pro 7 16IRX9H | |
| Lenovo Legion Pro 5 16IRX9 | |
| Média Intel Core i9-14900HX (67573 - 166040, n=36) | |
| Schenker XMG CORE 16 (L23) | |
| Lenovo Legion 7 16 IRX G9 | |
| Aorus 16X 2024 | |
| Alienware m16 R2 | |
| HP Omen Transcend 16-u1095ng | |
| AIDA64 / CPU SHA3 | |
| Lenovo Legion Pro 7 16IRX9H | |
| Média da turma Gaming (2180 - 10115, n=105, últimos 2 anos) | |
| Lenovo Legion Pro 5 16IRX9 | |
| Média Intel Core i9-14900HX (3589 - 7979, n=36) | |
| Aorus 16X 2024 | |
| Lenovo Legion 7 16 IRX G9 | |
| Schenker XMG CORE 16 (L23) | |
| HP Omen Transcend 16-u1095ng | |
| Alienware m16 R2 | |
| AIDA64 / CPU Queen | |
| Lenovo Legion Pro 7 16IRX9H | |
| Lenovo Legion Pro 5 16IRX9 | |
| Lenovo Legion 7 16 IRX G9 | |
| Aorus 16X 2024 | |
| Média Intel Core i9-14900HX (118405 - 148966, n=36) | |
| HP Omen Transcend 16-u1095ng | |
| Média da turma Gaming (49785 - 173351, n=90, últimos 2 anos) | |
| Schenker XMG CORE 16 (L23) | |
| Alienware m16 R2 | |
| AIDA64 / FPU SinJulia | |
| Lenovo Legion Pro 7 16IRX9H | |
| Lenovo Legion Pro 5 16IRX9 | |
| Média Intel Core i9-14900HX (10475 - 18517, n=36) | |
| Schenker XMG CORE 16 (L23) | |
| Aorus 16X 2024 | |
| Média da turma Gaming (4424 - 33636, n=105, últimos 2 anos) | |
| Lenovo Legion 7 16 IRX G9 | |
| HP Omen Transcend 16-u1095ng | |
| Alienware m16 R2 | |
| AIDA64 / FPU Mandel | |
| Média da turma Gaming (25115 - 128721, n=105, últimos 2 anos) | |
| Lenovo Legion Pro 7 16IRX9H | |
| Schenker XMG CORE 16 (L23) | |
| Lenovo Legion Pro 5 16IRX9 | |
| Média Intel Core i9-14900HX (32543 - 83662, n=36) | |
| Aorus 16X 2024 | |
| Alienware m16 R2 | |
| Lenovo Legion 7 16 IRX G9 | |
| HP Omen Transcend 16-u1095ng | |
| AIDA64 / CPU AES | |
| Média Intel Core i9-14900HX (86964 - 241777, n=36) | |
| Lenovo Legion Pro 7 16IRX9H | |
| Lenovo Legion Pro 5 16IRX9 | |
| Aorus 16X 2024 | |
| Lenovo Legion 7 16 IRX G9 | |
| Média da turma Gaming (39258 - 247074, n=105, últimos 2 anos) | |
| Schenker XMG CORE 16 (L23) | |
| HP Omen Transcend 16-u1095ng | |
| Alienware m16 R2 | |
| AIDA64 / CPU ZLib | |
| Lenovo Legion Pro 7 16IRX9H | |
| Lenovo Legion Pro 5 16IRX9 | |
| Média Intel Core i9-14900HX (1054 - 2292, n=36) | |
| Aorus 16X 2024 | |
| Lenovo Legion 7 16 IRX G9 | |
| Média da turma Gaming (574 - 2531, n=105, últimos 2 anos) | |
| HP Omen Transcend 16-u1095ng | |
| Alienware m16 R2 | |
| Schenker XMG CORE 16 (L23) | |
| AIDA64 / FP64 Ray-Trace | |
| Média da turma Gaming (5509 - 45446, n=105, últimos 2 anos) | |
| Lenovo Legion Pro 7 16IRX9H | |
| Schenker XMG CORE 16 (L23) | |
| Lenovo Legion Pro 5 16IRX9 | |
| Média Intel Core i9-14900HX (6809 - 18349, n=36) | |
| Lenovo Legion 7 16 IRX G9 | |
| Aorus 16X 2024 | |
| Alienware m16 R2 | |
| HP Omen Transcend 16-u1095ng | |
| AIDA64 / CPU PhotoWorxx | |
| Lenovo Legion Pro 5 16IRX9 | |
| HP Omen Transcend 16-u1095ng | |
| Aorus 16X 2024 | |
| Lenovo Legion 7 16 IRX G9 | |
| Lenovo Legion Pro 7 16IRX9H | |
| Média Intel Core i9-14900HX (23903 - 54702, n=36) | |
| Média da turma Gaming (12271 - 89891, n=105, últimos 2 anos) | |
| Schenker XMG CORE 16 (L23) | |
| Alienware m16 R2 | |
Desempenho do sistema
A impressão subjetiva de desempenho é excelente e os benchmarks também não destacaram nenhum problema. Houve apenas gagueira ocasional ao alternar entre os modos gráficos, por exemplo, quando um jogo estava sendo inicializado. Essa é a norma para laptops que usam o Advanced Optimus.
CrossMark: Overall | Productivity | Creativity | Responsiveness
WebXPRT 3: Overall
WebXPRT 4: Overall
Mozilla Kraken 1.1: Total
| PCMark 10 / Score | |
| Lenovo Legion Pro 7 16IRX9H | |
| Lenovo Legion Pro 5 16IRX9 | |
| Média da turma Gaming (5828 - 12414, n=93, últimos 2 anos) | |
| Aorus 16X 2024 | |
| Média Intel Core i9-14900HX, NVIDIA GeForce RTX 4070 Laptop GPU (7768 - 8550, n=8) | |
| Schenker XMG CORE 16 (L23) | |
| Lenovo Legion 7 16 IRX G9 | |
| HP Omen Transcend 16-u1095ng | |
| Alienware m16 R2 | |
| PCMark 10 / Essentials | |
| Lenovo Legion Pro 7 16IRX9H | |
| Lenovo Legion Pro 5 16IRX9 | |
| Aorus 16X 2024 | |
| Lenovo Legion 7 16 IRX G9 | |
| Schenker XMG CORE 16 (L23) | |
| Média Intel Core i9-14900HX, NVIDIA GeForce RTX 4070 Laptop GPU (10104 - 11815, n=8) | |
| Média da turma Gaming (8810 - 11935, n=97, últimos 2 anos) | |
| HP Omen Transcend 16-u1095ng | |
| Alienware m16 R2 | |
| PCMark 10 / Productivity | |
| Lenovo Legion Pro 7 16IRX9H | |
| Média da turma Gaming (6845 - 25323, n=95, últimos 2 anos) | |
| Aorus 16X 2024 | |
| Schenker XMG CORE 16 (L23) | |
| Média Intel Core i9-14900HX, NVIDIA GeForce RTX 4070 Laptop GPU (9577 - 11103, n=8) | |
| HP Omen Transcend 16-u1095ng | |
| Lenovo Legion Pro 5 16IRX9 | |
| Lenovo Legion 7 16 IRX G9 | |
| Alienware m16 R2 | |
| PCMark 10 / Digital Content Creation | |
| Lenovo Legion Pro 5 16IRX9 | |
| Lenovo Legion Pro 7 16IRX9H | |
| Média da turma Gaming (7602 - 19954, n=95, últimos 2 anos) | |
| Lenovo Legion 7 16 IRX G9 | |
| Média Intel Core i9-14900HX, NVIDIA GeForce RTX 4070 Laptop GPU (12114 - 14827, n=8) | |
| Aorus 16X 2024 | |
| Alienware m16 R2 | |
| Schenker XMG CORE 16 (L23) | |
| HP Omen Transcend 16-u1095ng | |
| CrossMark / Overall | |
| Lenovo Legion Pro 7 16IRX9H | |
| Aorus 16X 2024 | |
| Lenovo Legion 7 16 IRX G9 | |
| Média Intel Core i9-14900HX, NVIDIA GeForce RTX 4070 Laptop GPU (2002 - 2312, n=7) | |
| Lenovo Legion Pro 5 16IRX9 | |
| Média da turma Gaming (1366 - 2409, n=94, últimos 2 anos) | |
| Alienware m16 R2 | |
| Schenker XMG CORE 16 (L23) | |
| CrossMark / Productivity | |
| Lenovo Legion Pro 7 16IRX9H | |
| Aorus 16X 2024 | |
| Lenovo Legion 7 16 IRX G9 | |
| Média Intel Core i9-14900HX, NVIDIA GeForce RTX 4070 Laptop GPU (1827 - 2191, n=7) | |
| Média da turma Gaming (1386 - 2254, n=94, últimos 2 anos) | |
| Lenovo Legion Pro 5 16IRX9 | |
| Alienware m16 R2 | |
| Schenker XMG CORE 16 (L23) | |
| CrossMark / Creativity | |
| Lenovo Legion Pro 7 16IRX9H | |
| Aorus 16X 2024 | |
| Lenovo Legion 7 16 IRX G9 | |
| Média Intel Core i9-14900HX, NVIDIA GeForce RTX 4070 Laptop GPU (2258 - 2458, n=7) | |
| Lenovo Legion Pro 5 16IRX9 | |
| Média da turma Gaming (1343 - 2786, n=94, últimos 2 anos) | |
| Alienware m16 R2 | |
| Schenker XMG CORE 16 (L23) | |
| CrossMark / Responsiveness | |
| Lenovo Legion 7 16 IRX G9 | |
| Aorus 16X 2024 | |
| Lenovo Legion Pro 7 16IRX9H | |
| Média Intel Core i9-14900HX, NVIDIA GeForce RTX 4070 Laptop GPU (1734 - 2330, n=7) | |
| Lenovo Legion Pro 5 16IRX9 | |
| Média da turma Gaming (1226 - 2334, n=94, últimos 2 anos) | |
| Alienware m16 R2 | |
| Schenker XMG CORE 16 (L23) | |
| WebXPRT 3 / Overall | |
| Lenovo Legion Pro 7 16IRX9H | |
| HP Omen Transcend 16-u1095ng | |
| Lenovo Legion 7 16 IRX G9 | |
| Aorus 16X 2024 | |
| Lenovo Legion Pro 5 16IRX9 | |
| Média Intel Core i9-14900HX, NVIDIA GeForce RTX 4070 Laptop GPU (269 - 342, n=8) | |
| Média da turma Gaming (220 - 532, n=98, últimos 2 anos) | |
| Alienware m16 R2 | |
| Schenker XMG CORE 16 (L23) | |
| WebXPRT 4 / Overall | |
| Lenovo Legion Pro 7 16IRX9H | |
| Média Intel Core i9-14900HX, NVIDIA GeForce RTX 4070 Laptop GPU (291 - 304, n=6) | |
| Lenovo Legion 7 16 IRX G9 | |
| Lenovo Legion Pro 5 16IRX9 | |
| Média da turma Gaming (165 - 354, n=98, últimos 2 anos) | |
| Alienware m16 R2 | |
| Mozilla Kraken 1.1 / Total | |
| Alienware m16 R2 | |
| Schenker XMG CORE 16 (L23) | |
| Média da turma Gaming (391 - 590, n=100, últimos 2 anos) | |
| Lenovo Legion Pro 5 16IRX9 | |
| Média Intel Core i9-14900HX, NVIDIA GeForce RTX 4070 Laptop GPU (431 - 469, n=8) | |
| Lenovo Legion 7 16 IRX G9 | |
| Lenovo Legion Pro 7 16IRX9H | |
| HP Omen Transcend 16-u1095ng | |
| Aorus 16X 2024 | |
* ... menor é melhor
| PCMark 10 Score | 8023 pontos | |
Ajuda | ||
| AIDA64 / Memory Copy | |
| Lenovo Legion Pro 5 16IRX9 | |
| Lenovo Legion 7 16 IRX G9 | |
| Aorus 16X 2024 | |
| Lenovo Legion Pro 7 16IRX9H | |
| HP Omen Transcend 16-u1095ng | |
| Média Intel Core i9-14900HX (38028 - 83392, n=36) | |
| Média da turma Gaming (21750 - 129946, n=105, últimos 2 anos) | |
| Schenker XMG CORE 16 (L23) | |
| Alienware m16 R2 | |
| AIDA64 / Memory Read | |
| Aorus 16X 2024 | |
| Lenovo Legion Pro 5 16IRX9 | |
| Lenovo Legion Pro 7 16IRX9H | |
| Lenovo Legion 7 16 IRX G9 | |
| HP Omen Transcend 16-u1095ng | |
| Média Intel Core i9-14900HX (43306 - 87568, n=36) | |
| Alienware m16 R2 | |
| Média da turma Gaming (22956 - 118858, n=105, últimos 2 anos) | |
| Schenker XMG CORE 16 (L23) | |
| AIDA64 / Memory Write | |
| Schenker XMG CORE 16 (L23) | |
| HP Omen Transcend 16-u1095ng | |
| Aorus 16X 2024 | |
| Lenovo Legion Pro 5 16IRX9 | |
| Média da turma Gaming (22297 - 135096, n=105, últimos 2 anos) | |
| Lenovo Legion 7 16 IRX G9 | |
| Média Intel Core i9-14900HX (37146 - 80589, n=36) | |
| Lenovo Legion Pro 7 16IRX9H | |
| Alienware m16 R2 | |
| AIDA64 / Memory Latency | |
| Alienware m16 R2 | |
| Média da turma Gaming (75.3 - 259, n=105, últimos 2 anos) | |
| Schenker XMG CORE 16 (L23) | |
| HP Omen Transcend 16-u1095ng | |
| Média Intel Core i9-14900HX (76.1 - 105, n=36) | |
| Lenovo Legion 7 16 IRX G9 | |
| Lenovo Legion Pro 5 16IRX9 | |
| Aorus 16X 2024 | |
| Lenovo Legion Pro 7 16IRX9H | |
* ... menor é melhor
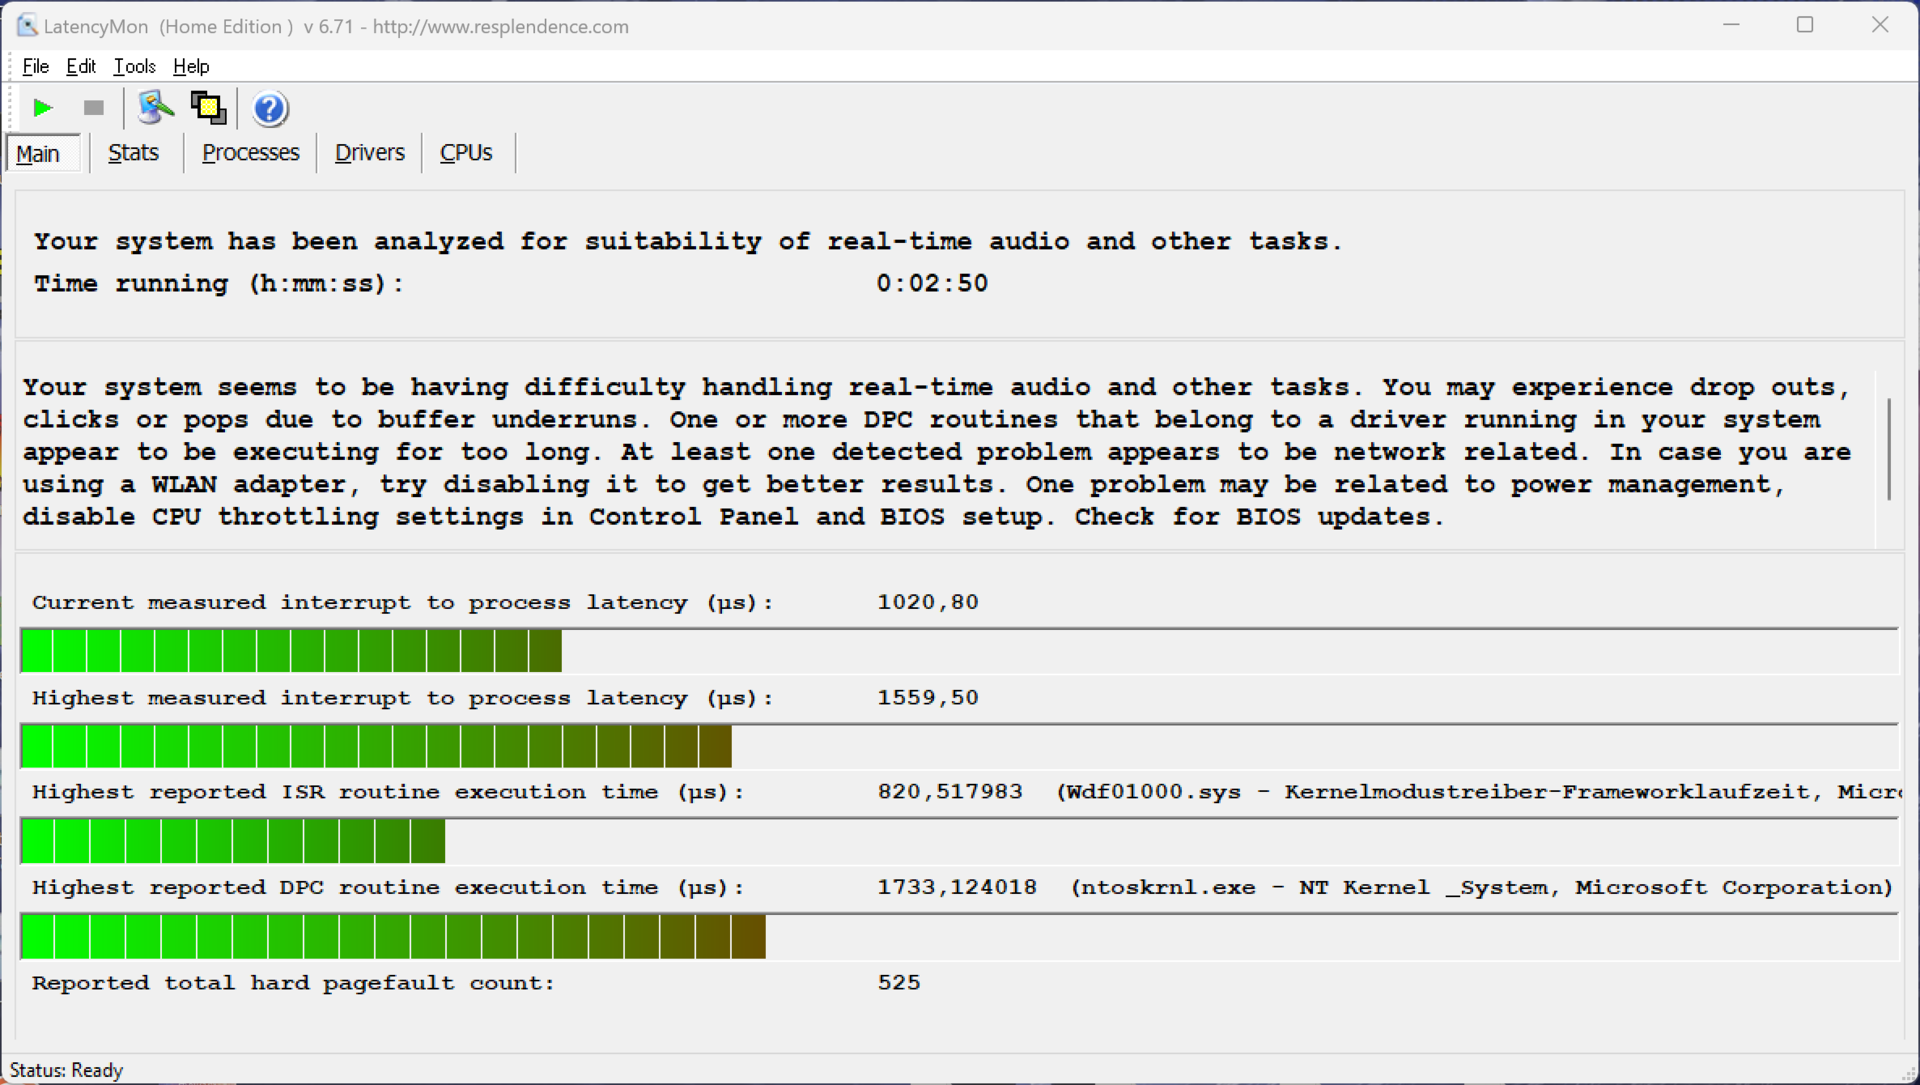
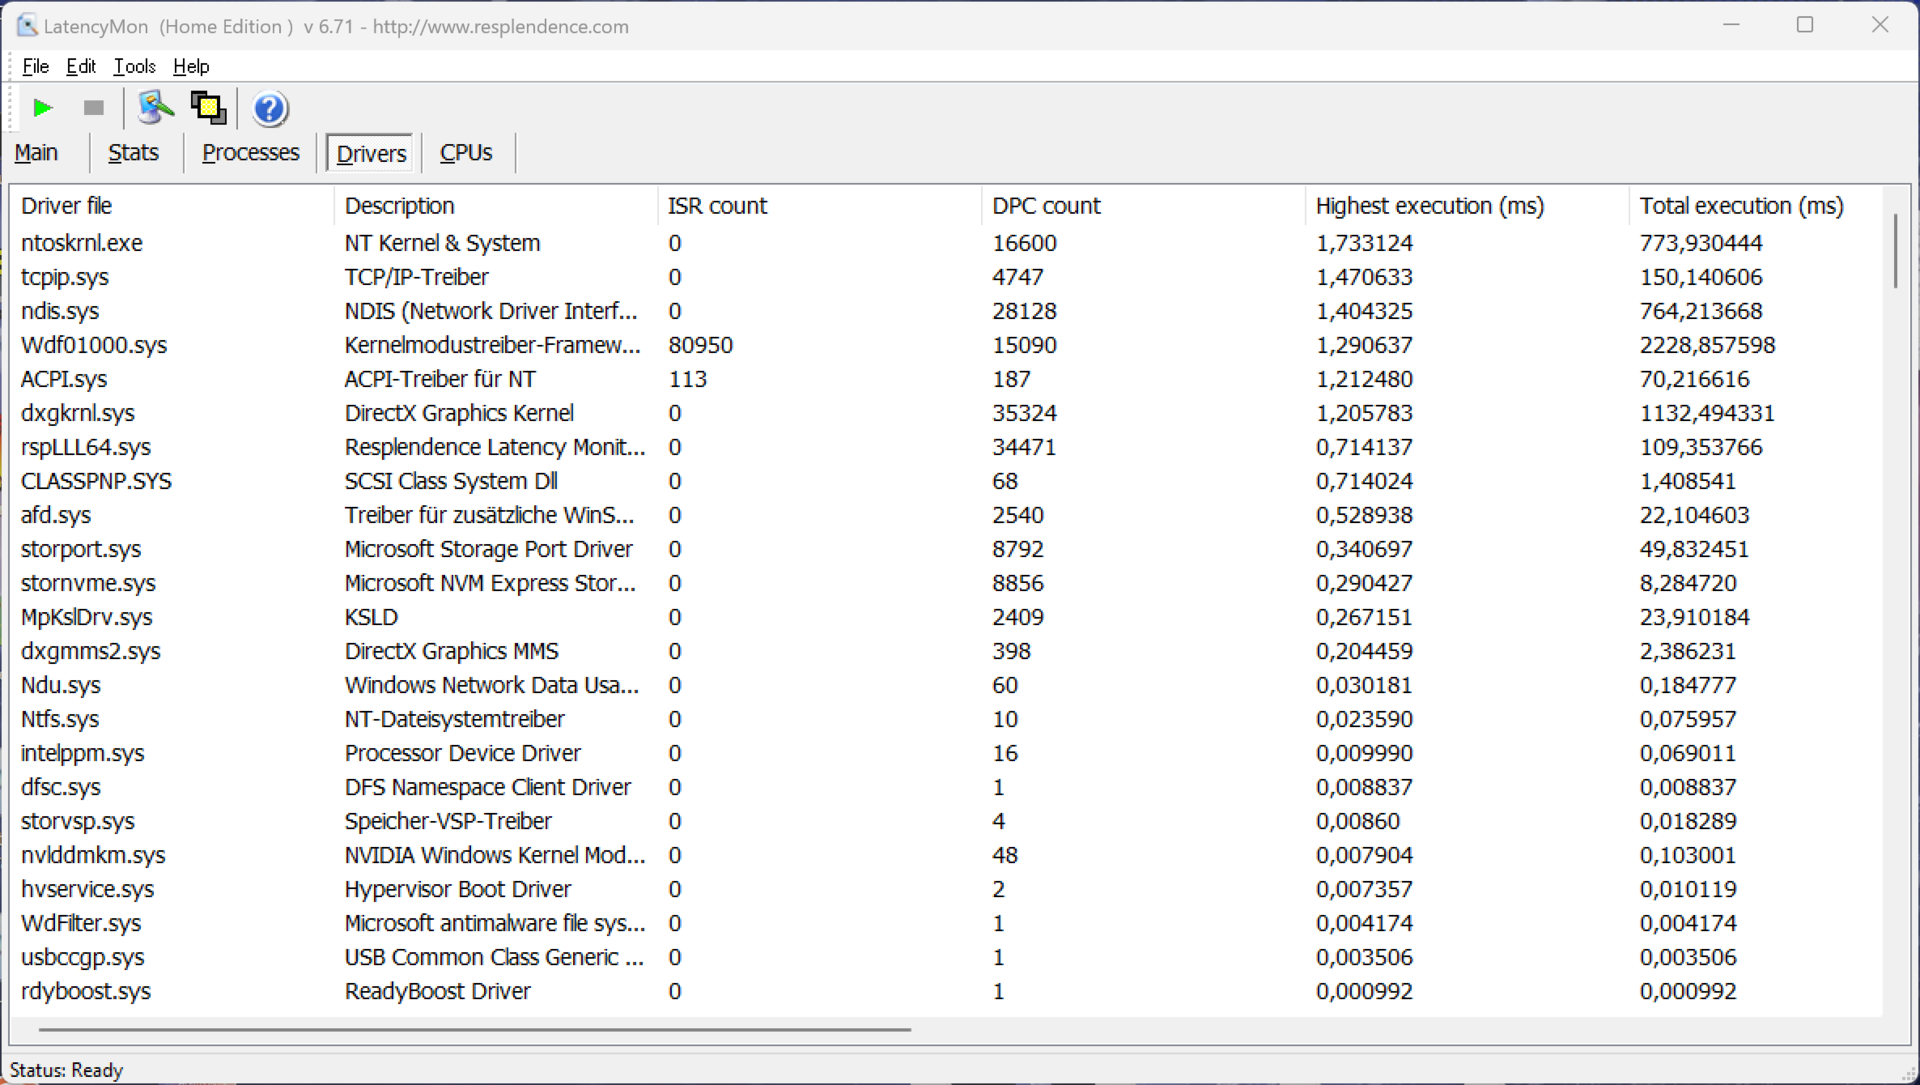
Latências de DPC
Em nosso teste de latência padronizado (navegação na Internet, reprodução de 4K no YouTube, carga da CPU) usando a versão atual do BIOS, o dispositivo de análise mostrou algumas limitações quando se trata de usar aplicativos de áudio em tempo real.
| DPC Latencies / LatencyMon - interrupt to process latency (max), Web, Youtube, Prime95 | |
| Alienware m16 R2 | |
| HP Omen Transcend 16-u1095ng | |
| Lenovo Legion 7 16 IRX G9 | |
| Lenovo Legion Pro 7 16IRX9H | |
| Aorus 16X 2024 | |
| Lenovo Legion Pro 5 16IRX9 | |
| Schenker XMG CORE 16 (L23) | |
* ... menor é melhor
Armazenamento em massa
No dispositivo analisado, a Lenovo instalou um SSD PCIe 4.0 de 1 TB da SK Hynix, mas, após a primeira inicialização, 877 GB estão disponíveis para o usuário. Com até 7 GB/s, as velocidades de transferência são muito altas e, no geral, a SSD é um pouco mais rápida do que a concorrência. Entretanto, embora o desempenho nem sempre permaneça estável sob carga contínua, isso não é algo que o senhor perceberá em situações cotidianas. Outros benchmarks de SSDs estão listados aqui.

* ... menor é melhor
Continuous Performance Read: DiskSpd Read Loop, Queue Depth 8
Placa de vídeo - GeForce RTX 4070 laptop
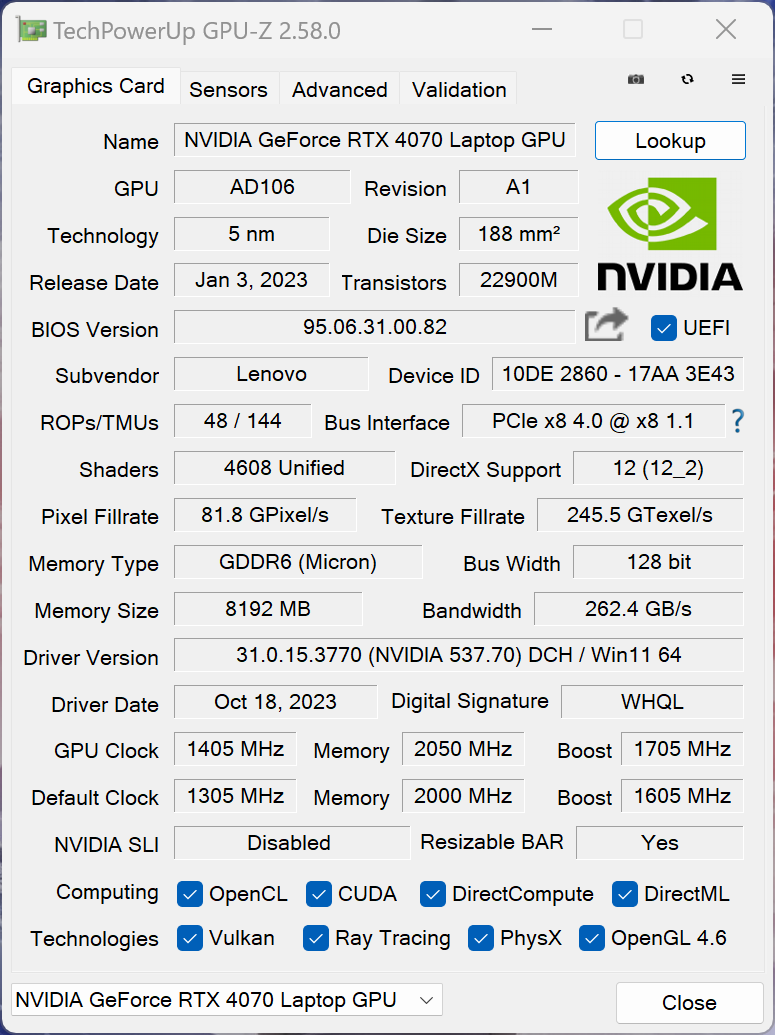
Nosso dispositivo de análise vem com o laptop Laptop RTX 4070 embora, na verdade, estejamos lidando com a versão de 115 watts. Além disso, no modo de desempenho, a GPU tem um leve overclock. Nos benchmarks sintéticos, equipado com sua variante de 140 watts, o Legion 7 16 fica um pouco atrás da concorrência. No entanto, como veremos em breve, isso não é relevante para os benchmarks de jogos, já que o laptop RTX 4070 não consegue consumir todos os 140 watts. O Legion é compatível com o switch gráfico Advanced Optimus.
Sob carga contínua, a GPU permanece completamente estável e, no modo de bateria, o consumo de energia é limitado a 50 watts. É por isso que o desempenho aqui é cerca de 35% menor. Outros benchmarks de GPU estão listados aqui.
| 3DMark 11 Performance | 35070 pontos | |
| 3DMark Fire Strike Score | 25692 pontos | |
| 3DMark Time Spy Score | 12844 pontos | |
Ajuda | ||
| Blender / v3.3 Classroom OPTIX/RTX | |
| HP Omen Transcend 16-u1095ng | |
| Média NVIDIA GeForce RTX 4070 Laptop GPU (18 - 30, n=68) | |
| Schenker XMG CORE 16 (L23) | |
| Alienware m16 R2 | |
| Aorus 16X 2024 | |
| Lenovo Legion 7 16 IRX G9 | |
| Lenovo Legion Pro 5 16IRX9 | |
| Média da turma Gaming (9 - 32, n=106, últimos 2 anos) | |
| Lenovo Legion Pro 7 16IRX9H | |
| Blender / v3.3 Classroom CUDA | |
| HP Omen Transcend 16-u1095ng | |
| Média NVIDIA GeForce RTX 4070 Laptop GPU (32 - 50, n=67) | |
| Alienware m16 R2 | |
| Média da turma Gaming (15 - 228, n=106, últimos 2 anos) | |
| Schenker XMG CORE 16 (L23) | |
| Lenovo Legion Pro 5 16IRX9 | |
| Aorus 16X 2024 | |
| Lenovo Legion 7 16 IRX G9 | |
| Lenovo Legion Pro 7 16IRX9H | |
| Blender / v3.3 Classroom CPU | |
| Schenker XMG CORE 16 (L23) | |
| HP Omen Transcend 16-u1095ng | |
| Alienware m16 R2 | |
| Média NVIDIA GeForce RTX 4070 Laptop GPU (158 - 440, n=67) | |
| Média da turma Gaming (122 - 565, n=102, últimos 2 anos) | |
| Aorus 16X 2024 | |
| Lenovo Legion 7 16 IRX G9 | |
| Lenovo Legion Pro 5 16IRX9 | |
| Lenovo Legion Pro 7 16IRX9H | |
* ... menor é melhor
Desempenho em jogos
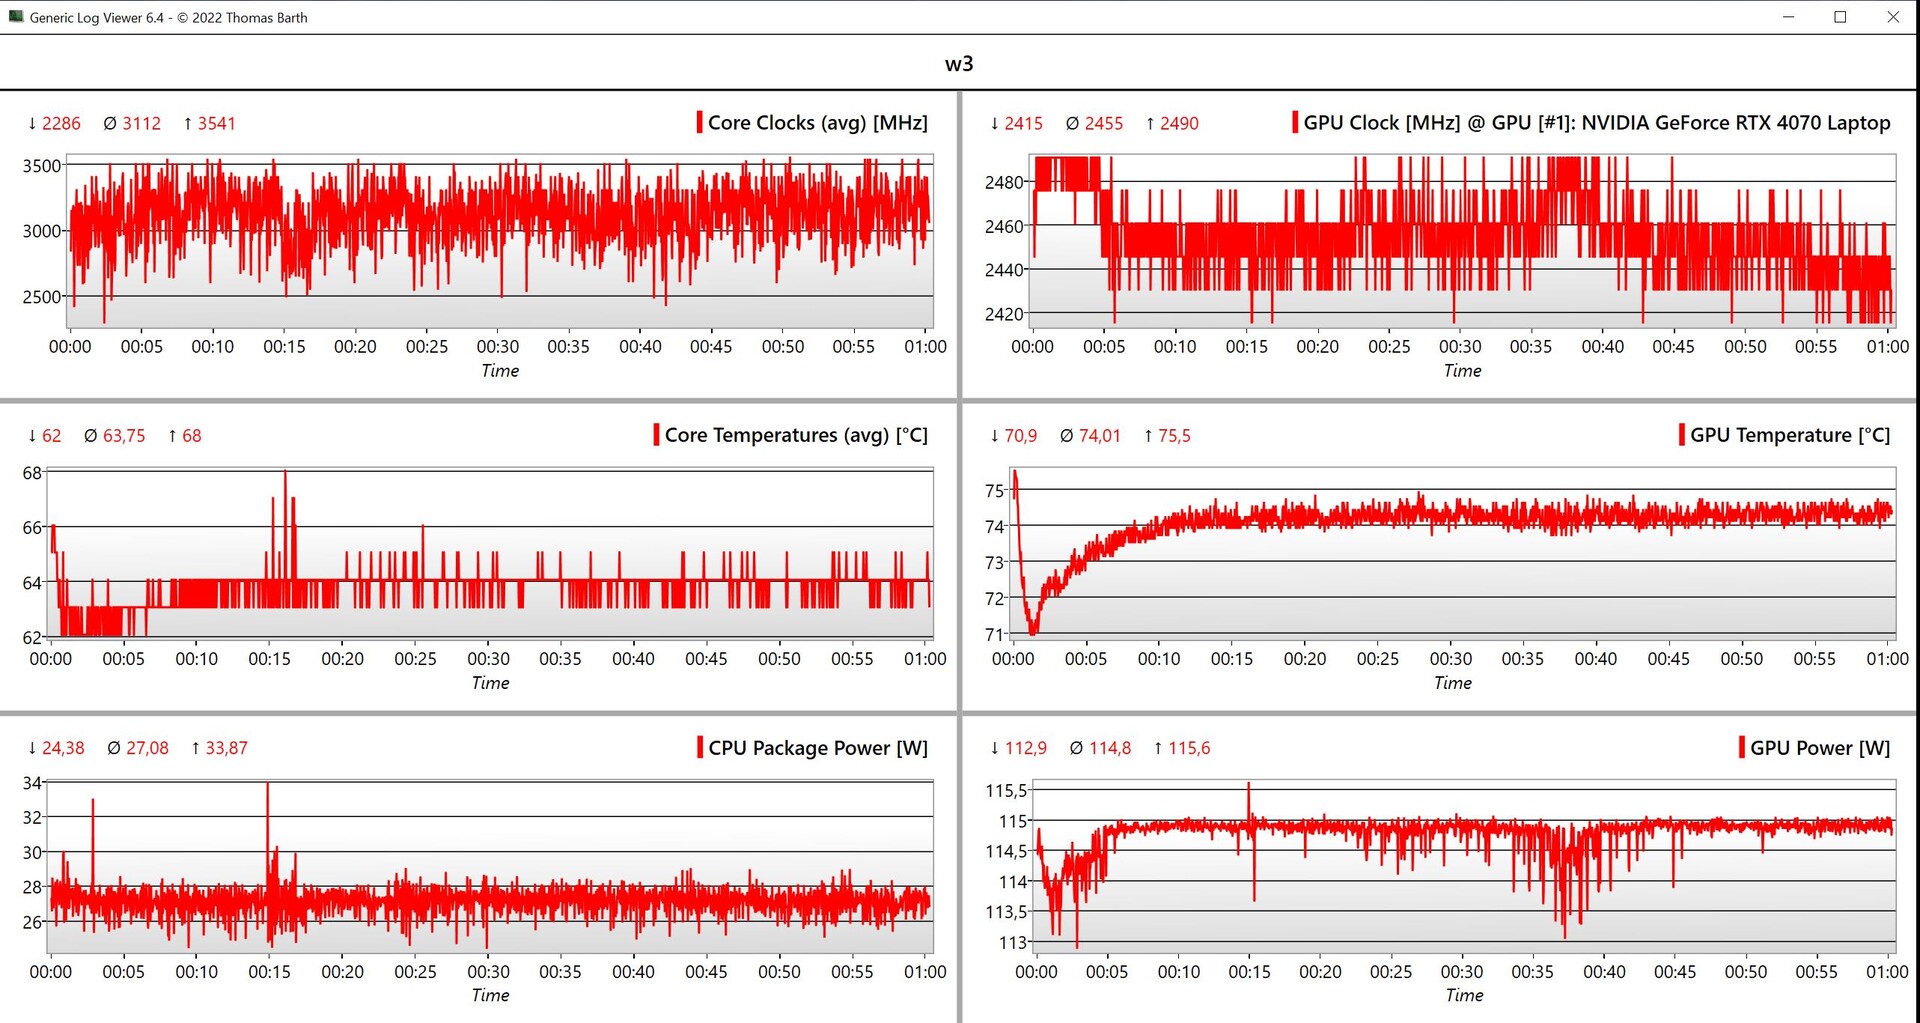
O desempenho do Legion 7 16 em jogos é muito bom e todos os títulos modernos podem ser reproduzidos sem problemas com resolução QHD e o máximo de detalhes. Mesmo na resolução nativa, o desempenho deve ser suficiente e, se o senhor desejar, é possível ativar o upscaling DLSS. Na comparação de testes de jogos, o dispositivo analisado obteve uma pontuação um pouco melhor do que nos testes sintéticos e o desempenho permaneceu totalmente estável, mesmo durante sessões de jogos mais longas. Outros benchmarks de jogos podem ser encontrados aqui.
| The Witcher 3 - 1920x1080 Ultra Graphics & Postprocessing (HBAO+) | |
| Média da turma Gaming (104.7 - 240, n=7, últimos 2 anos) | |
| Lenovo Legion Pro 7 16IRX9H | |
| Lenovo Legion Pro 5 16IRX9 | |
| Aorus 16X 2024 | |
| Alienware m16 R2 | |
| Schenker XMG CORE 16 (L23) | |
| HP Omen Transcend 16-u1095ng | |
| Lenovo Legion 7 16 IRX G9 | |
| GTA V - 1920x1080 Highest AA:4xMSAA + FX AF:16x | |
| Lenovo Legion Pro 7 16IRX9H | |
| Média da turma Gaming (48.3 - 186.9, n=94, últimos 2 anos) | |
| Lenovo Legion Pro 5 16IRX9 | |
| Lenovo Legion 7 16 IRX G9 | |
| Schenker XMG CORE 16 (L23) | |
| HP Omen Transcend 16-u1095ng | |
| Aorus 16X 2024 | |
| Final Fantasy XV Benchmark - 1920x1080 High Quality | |
| Lenovo Legion Pro 7 16IRX9H | |
| Média da turma Gaming (41 - 215, n=95, últimos 2 anos) | |
| Lenovo Legion Pro 5 16IRX9 | |
| Schenker XMG CORE 16 (L23) | |
| Lenovo Legion 7 16 IRX G9 | |
| Alienware m16 R2 | |
| Aorus 16X 2024 | |
| HP Omen Transcend 16-u1095ng | |
| Dota 2 Reborn - 1920x1080 ultra (3/3) best looking | |
| Lenovo Legion Pro 5 16IRX9 | |
| Lenovo Legion Pro 7 16IRX9H | |
| Aorus 16X 2024 | |
| Lenovo Legion 7 16 IRX G9 | |
| HP Omen Transcend 16-u1095ng | |
| Média da turma Gaming (84.8 - 248, n=107, últimos 2 anos) | |
| Alienware m16 R2 | |
| Schenker XMG CORE 16 (L23) | |
| Horizon Forbidden West | |
| 1920x1080 Very High Preset AA:T | |
| Lenovo Legion Pro 7 16IRX9H | |
| Média da turma Gaming (14.7 - 140.3, n=12, últimos 2 anos) | |
| Aorus 16X 2024 | |
| Lenovo Legion 7 16 IRX G9 | |
| Média NVIDIA GeForce RTX 4070 Laptop GPU (53.2 - 76.7, n=10) | |
| 2560x1440 Very High Preset AA:T | |
| Lenovo Legion Pro 7 16IRX9H | |
| Média da turma Gaming (45.7 - 100.9, n=9, últimos 2 anos) | |
| Aorus 16X 2024 | |
| Média NVIDIA GeForce RTX 4070 Laptop GPU (40.3 - 59.1, n=9) | |
| Lenovo Legion 7 16 IRX G9 | |
Witcher 3 FPS diagram
| baixo | média | alto | ultra | QHD | |
|---|---|---|---|---|---|
| GTA V (2015) | 182.4 | 124.1 | 94.2 | ||
| The Witcher 3 (2015) | 246 | 113.1 | 92 | ||
| Dota 2 Reborn (2015) | 230 | 205 | 193.4 | 179.5 | |
| Final Fantasy XV Benchmark (2018) | 223 | 166.8 | 119.8 | 89.1 | |
| X-Plane 11.11 (2018) | 198 | 180.6 | 138.2 | ||
| Far Cry 5 (2018) | 193 | 166 | 157 | 146 | 115 |
| Strange Brigade (2018) | 436 | 311 | 250 | 220 | 143 |
| F1 23 (2023) | 287 | 284 | 222 | 70.1 | 43.9 |
| Baldur's Gate 3 (2023) | 155.6 | 127.9 | 115.7 | 115 | 71.9 |
| Cyberpunk 2077 (2023) | 129.7 | 117.1 | 99.6 | 85.2 | 51.4 |
| Horizon Forbidden West (2024) | 107.1 | 103.4 | 73.2 | 64.4 | 49.9 |
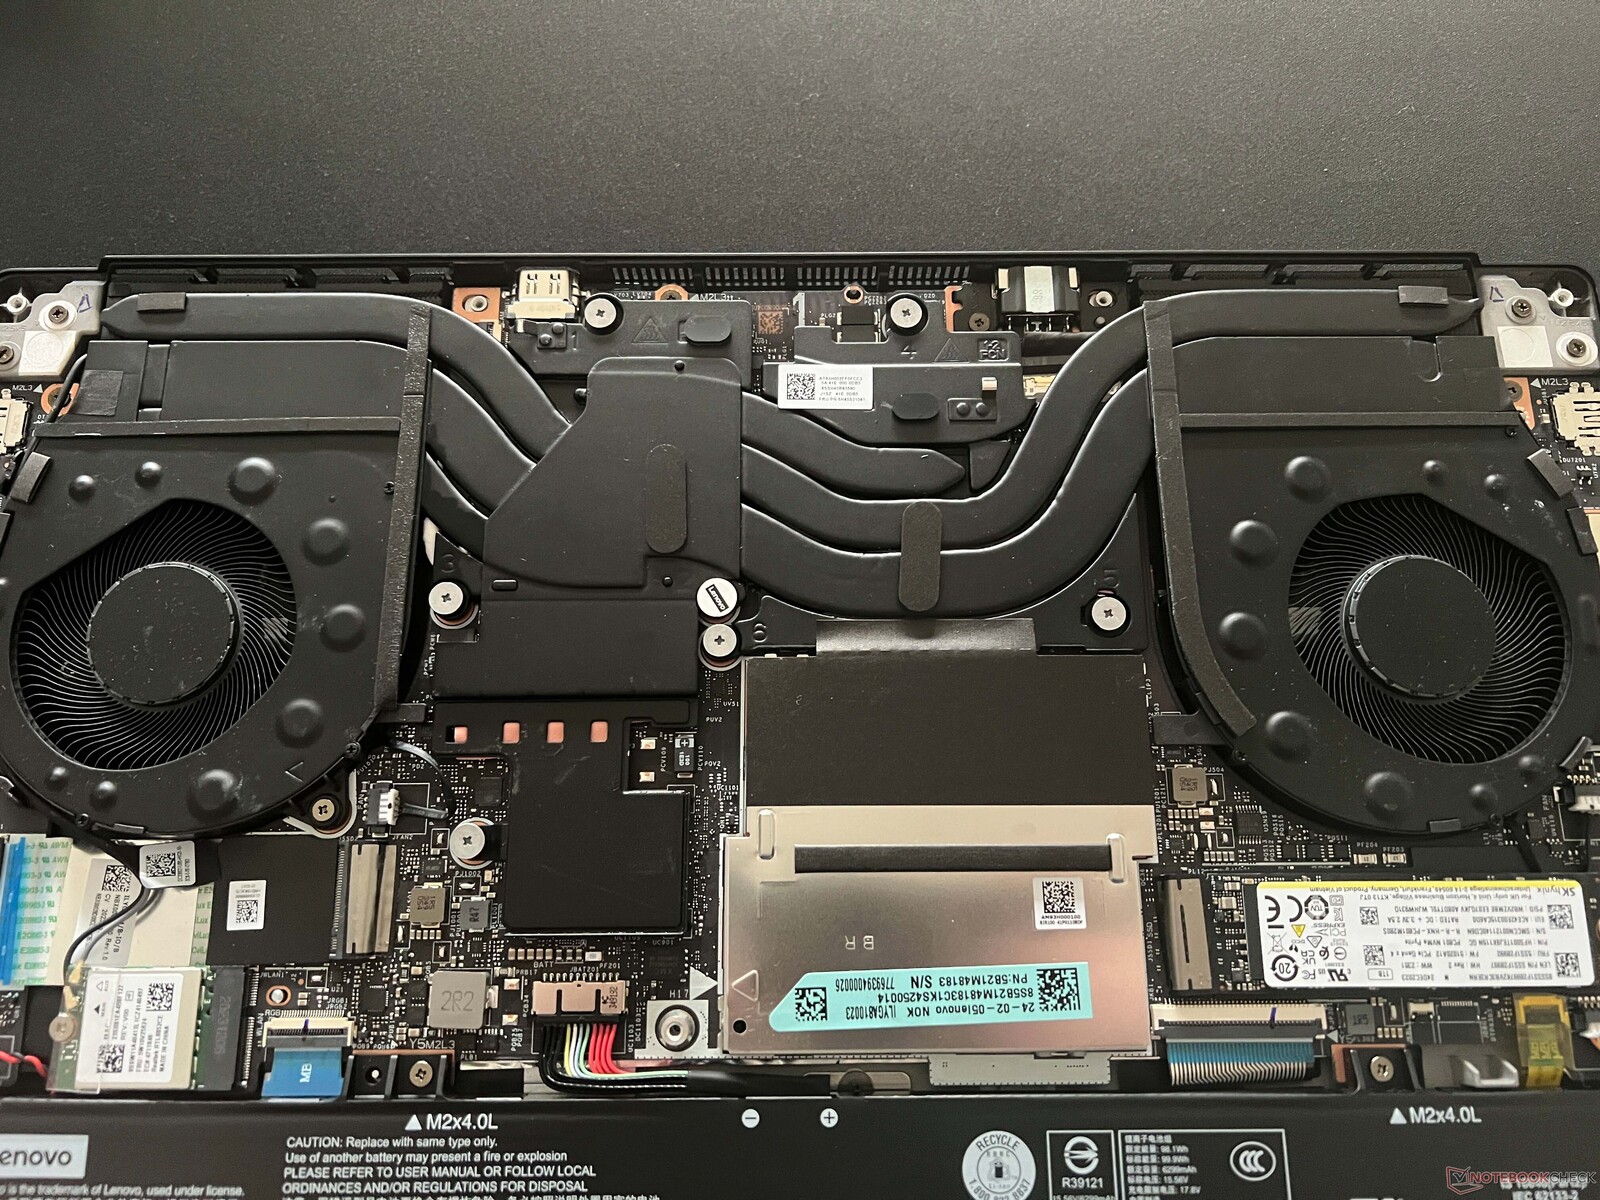
Emissões - Resfriamento alto, mas eficaz
Emissões de ruído
Quando se trata de tarefas simples, o resfriamento do Legion 7 16 geralmente permanece desativado, mesmo no modo de desempenho e, em situações cotidianas, o senhor pode usar com segurança o modo silencioso para minimizar o ruído da ventoinha. Com um máximo de 38,4 dB(A) no modo silencioso, também é possível jogar sem fones de ouvido; no entanto, em ambos os outros modos, 50 e 54 dB(A) são muito altos. Apesar disso, tanto o Legion Pro 5 e o Legion Pro 7 são ainda um pouco mais altos. Após períodos de carga, as ventoinhas também reduzem rapidamente sua velocidade. Nenhum outro ruído eletrônico estava presente no dispositivo analisado.
Barulho
| Ocioso |
| 24.5 / 24.5 / 24.5 dB |
| Carga |
| 34.8 / 54.1 dB |
 | ||
30 dB silencioso 40 dB(A) audível 50 dB(A) ruidosamente alto |
||
min: | ||
| Lenovo Legion 7 16 IRX G9 GeForce RTX 4070 Laptop GPU, i9-14900HX, SK Hynix HFS001TEJ9X115N | Lenovo Legion Pro 5 16IRX9 GeForce RTX 4070 Laptop GPU, i9-14900HX, Samsung PM9A1 MZVL21T0HCLR | Aorus 16X 2024 GeForce RTX 4070 Laptop GPU, i9-14900HX, Gigabyte AG450E1024-SI | HP Omen Transcend 16-u1095ng GeForce RTX 4070 Laptop GPU, i9-14900HX, Kioxia XG8 KXG80ZNV1T02 | Alienware m16 R2 GeForce RTX 4070 Laptop GPU, Ultra 7 155H, Samsung PM9A1 MZVL21T0HCLR | Schenker XMG CORE 16 (L23) GeForce RTX 4070 Laptop GPU, R7 7840HS, Samsung 990 Pro 1 TB | Lenovo Legion Pro 7 16IRX9H GeForce RTX 4080 Laptop GPU, i9-14900HX, SK Hynix HFS001TEJ9X115N | |
|---|---|---|---|---|---|---|---|
| Noise | -6% | -21% | -9% | -2% | -1% | -22% | |
| desligado / ambiente * (dB) | 24.5 | 23.9 2% | 26 -6% | 24 2% | 24.7 -1% | 23 6% | 24 2% |
| Idle Minimum * (dB) | 24.5 | 24.3 1% | 26 -6% | 29 -18% | 25.3 -3% | 23 6% | 25 -2% |
| Idle Average * (dB) | 24.5 | 24.3 1% | 32 -31% | 30 -22% | 25.3 -3% | 28.48 -16% | 30 -22% |
| Idle Maximum * (dB) | 24.5 | 28.9 -18% | 38 -55% | 31 -27% | 25.3 -3% | 28.48 -16% | 45 -84% |
| Load Average * (dB) | 34.8 | 45.8 -32% | 54 -55% | 45 -29% | 31.7 9% | 30 14% | 50 -44% |
| Witcher 3 ultra * (dB) | 54.1 | 51 6% | 50 8% | 44 19% | 53.8 1% | 54.12 -0% | 54 -0% |
| Load Maximum * (dB) | 54.1 | 56.6 -5% | 55 -2% | 47 13% | 62 -15% | 54.12 -0% | 56 -4% |
* ... menor é melhor
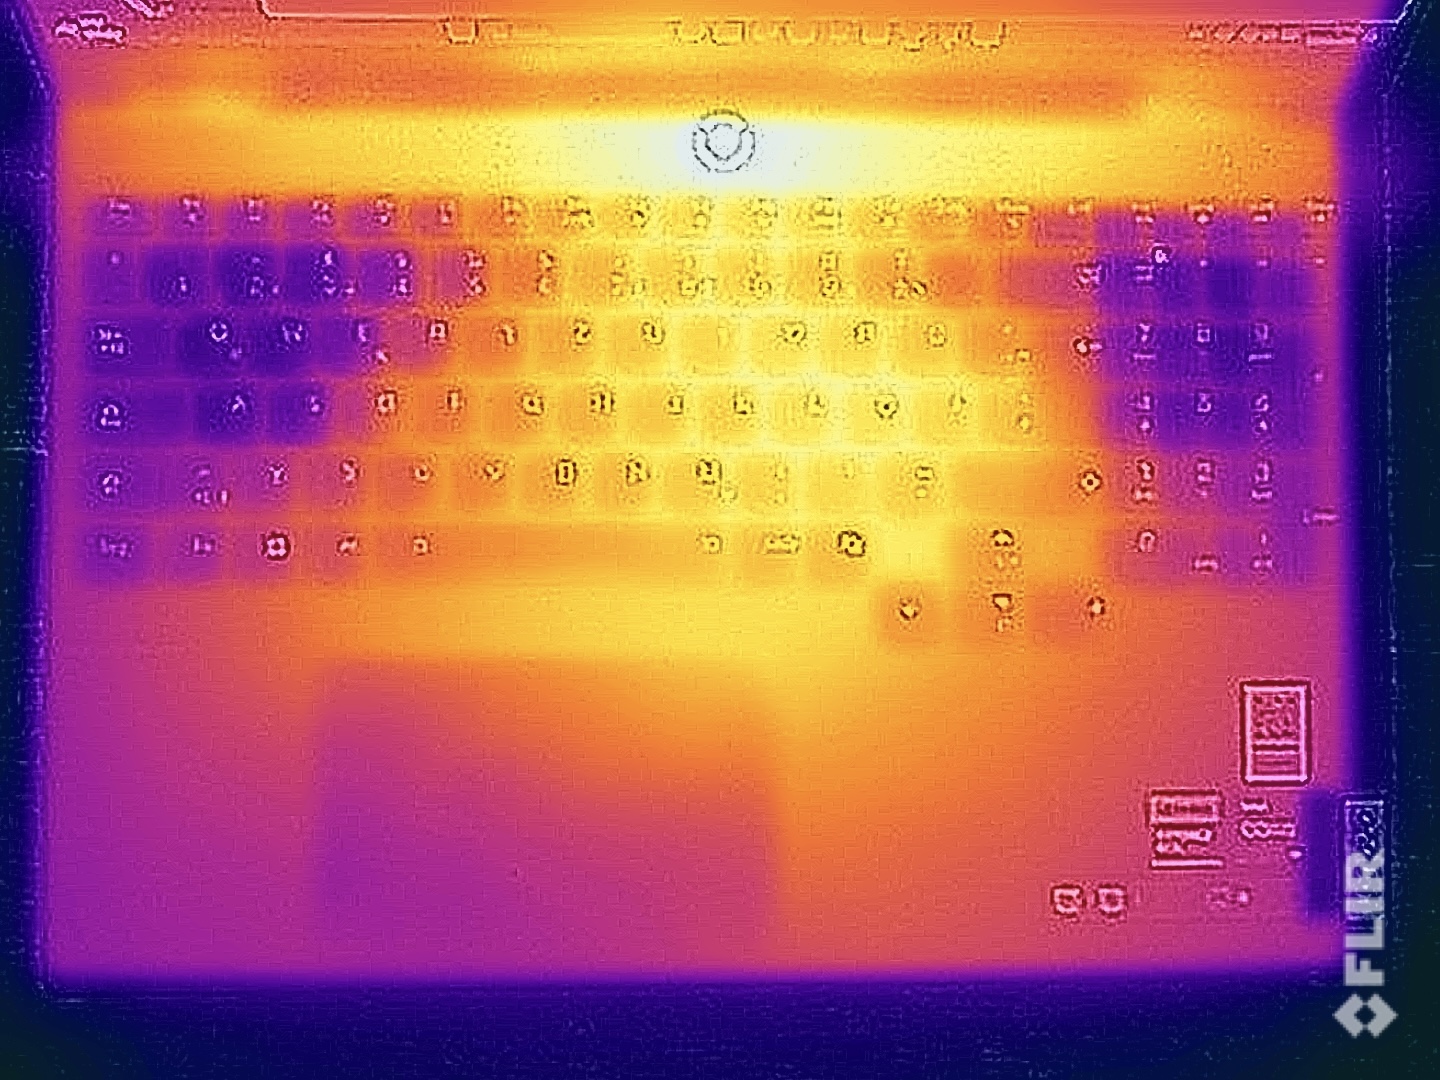
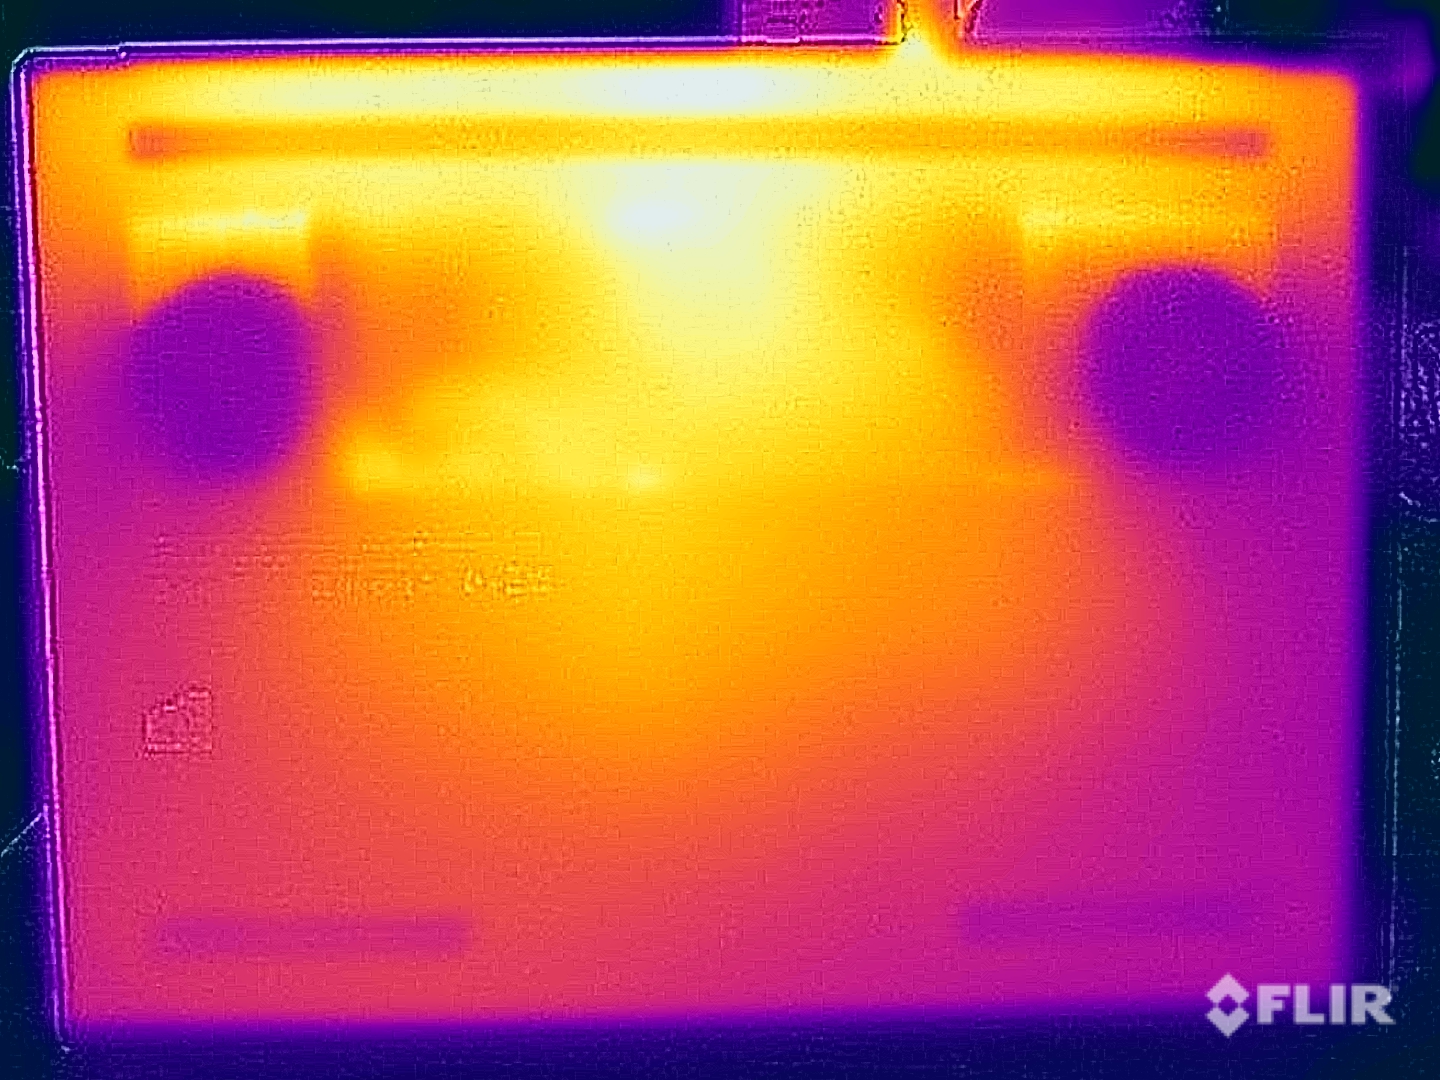
Temperatura
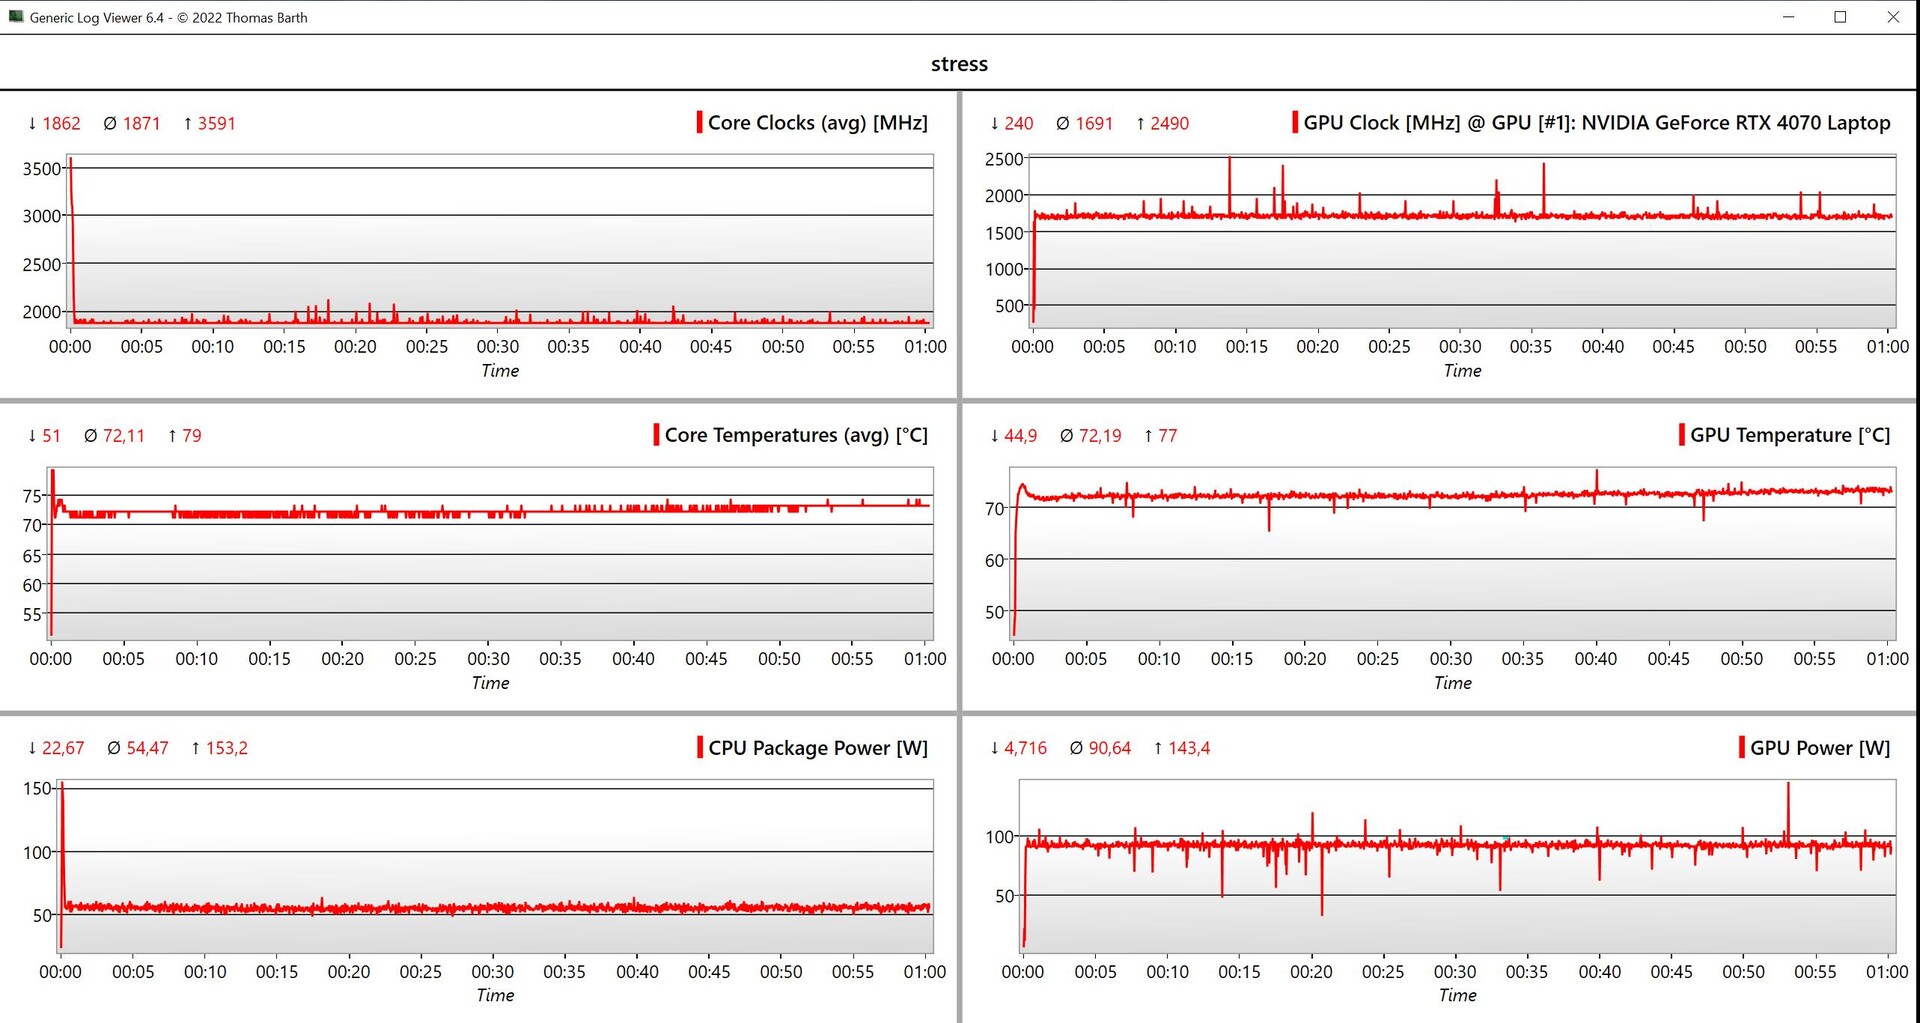
Em modo inativo e com pouca carga, o gabinete de alumínio permanece agradavelmente frio e, mesmo em jogos, o desempenho é melhor do que o esperado. Em alguns lugares, medimos valores que variaram de 42 a 43 °C e, embora isso seja algo que também se nota ao usar o teclado, não resulta em uma experiência de usuário restrita e, mais uma vez, o Legion 7 tem um desempenho melhor do que os dois modelos profissionais concorrentes, apesar de sua unidade básica mais fina. No teste de estresse com carga combinada de CPU/GPU, a GPU funciona com 90 watts e a CPU com cerca de 54 watts.
(±) A temperatura máxima no lado superior é 43.7 °C / 111 F, em comparação com a média de 40.4 °C / 105 F , variando de 21.2 a 68.8 °C para a classe Gaming.
(±) A parte inferior aquece até um máximo de 42.9 °C / 109 F, em comparação com a média de 43.2 °C / 110 F
(+) Em uso inativo, a temperatura média para o lado superior é 27 °C / 81 F, em comparação com a média do dispositivo de 33.9 °C / ### class_avg_f### F.
(±) Jogando The Witcher 3, a temperatura média para o lado superior é 37.2 °C / 99 F, em comparação com a média do dispositivo de 33.9 °C / ## #class_avg_f### F.
(±) Os apoios para as mãos e o touchpad podem ficar muito quentes ao toque, com um máximo de 38.7 °C / 101.7 F.
(-) A temperatura média da área do apoio para as mãos de dispositivos semelhantes foi 28.8 °C / 83.8 F (-9.9 °C / -17.9 F).
| Lenovo Legion 7 16 IRX G9 Intel Core i9-14900HX, NVIDIA GeForce RTX 4070 Laptop GPU | Lenovo Legion Pro 5 16IRX9 Intel Core i9-14900HX, NVIDIA GeForce RTX 4070 Laptop GPU | Aorus 16X 2024 Intel Core i9-14900HX, NVIDIA GeForce RTX 4070 Laptop GPU | HP Omen Transcend 16-u1095ng Intel Core i9-14900HX, NVIDIA GeForce RTX 4070 Laptop GPU | Alienware m16 R2 Intel Core Ultra 7 155H, NVIDIA GeForce RTX 4070 Laptop GPU | Schenker XMG CORE 16 (L23) AMD Ryzen 7 7840HS, NVIDIA GeForce RTX 4070 Laptop GPU | Lenovo Legion Pro 7 16IRX9H Intel Core i9-14900HX, NVIDIA GeForce RTX 4080 Laptop GPU | |
|---|---|---|---|---|---|---|---|
| Heat | -15% | -10% | -14% | -20% | -7% | -18% | |
| Maximum Upper Side * (°C) | 43.7 | 43.8 -0% | 41 6% | 49 -12% | 44.8 -3% | 46 -5% | 46 -5% |
| Maximum Bottom * (°C) | 42.9 | 55.4 -29% | 41 4% | 63 -47% | 48 -12% | 44 -3% | 49 -14% |
| Idle Upper Side * (°C) | 29.1 | 32.8 -13% | 37 -27% | 30 -3% | 37.2 -28% | 32 -10% | 38 -31% |
| Idle Bottom * (°C) | 30.6 | 36 -18% | 38 -24% | 29 5% | 42 -37% | 33 -8% | 37 -21% |
* ... menor é melhor
Alto-falantes
Ambos os alto-falantes estéreo fazem um trabalho decente, mas há uma diferença notável entre eles e o mais caro Legion Pro 7 16. No entanto, os módulos são bons o suficiente para filmes/séries ocasionais ou música de fundo. Ao jogar, recomendamos o uso de um fone de ouvido devido ao alto volume das ventoinhas.
Lenovo Legion 7 16 IRX G9 análise de áudio
(+) | os alto-falantes podem tocar relativamente alto (###valor### dB)
Graves 100 - 315Hz
(±) | graves reduzidos - em média 13.1% menor que a mediana
(±) | a linearidade dos graves é média (9.7% delta para a frequência anterior)
Médios 400 - 2.000 Hz
(+) | médios equilibrados - apenas 2.8% longe da mediana
(+) | médios são lineares (3.7% delta para frequência anterior)
Altos 2 - 16 kHz
(+) | agudos equilibrados - apenas 4.7% longe da mediana
(±) | a linearidade dos máximos é média (7% delta para frequência anterior)
Geral 100 - 16.000 Hz
(+) | o som geral é linear (12.6% diferença em relação à mediana)
Comparado com a mesma classe
» 16% de todos os dispositivos testados nesta classe foram melhores, 4% semelhantes, 81% piores
» O melhor teve um delta de 6%, a média foi 18%, o pior foi 132%
Comparado com todos os dispositivos testados
» 11% de todos os dispositivos testados foram melhores, 3% semelhantes, 86% piores
» O melhor teve um delta de 4%, a média foi 23%, o pior foi 134%
Lenovo Legion Pro 7 16IRX9H análise de áudio
(+) | os alto-falantes podem tocar relativamente alto (###valor### dB)
Graves 100 - 315Hz
(±) | graves reduzidos - em média 8.9% menor que a mediana
(±) | a linearidade dos graves é média (7.4% delta para a frequência anterior)
Médios 400 - 2.000 Hz
(+) | médios equilibrados - apenas 2.8% longe da mediana
(+) | médios são lineares (4% delta para frequência anterior)
Altos 2 - 16 kHz
(+) | agudos equilibrados - apenas 3% longe da mediana
(+) | os máximos são lineares (5% delta da frequência anterior)
Geral 100 - 16.000 Hz
(+) | o som geral é linear (8.4% diferença em relação à mediana)
Comparado com a mesma classe
» 2% de todos os dispositivos testados nesta classe foram melhores, 1% semelhantes, 97% piores
» O melhor teve um delta de 6%, a média foi 18%, o pior foi 132%
Comparado com todos os dispositivos testados
» 2% de todos os dispositivos testados foram melhores, 1% semelhantes, 97% piores
» O melhor teve um delta de 4%, a média foi 23%, o pior foi 134%
Gerenciamento de energia - Tempo médio de duração da bateria
Consumo de energia
Nas medições de consumo, o dispositivo de análise não nos surpreendeu e, em uso inativo, registramos um máximo de quase 22 watts. No modo de desempenho, a PSU de 230 watts é, por um breve período, o fator limitante, mas ela se estabilizou rapidamente e o consumo se estabilizou rapidamente em 200 watts. Em suma, a PSU de 230 watts está bem dimensionada. No entanto, a Lenovo poderia melhorar o consumo em espera de mais de 1,1 watts.
| desligado | |
| Ocioso | |
| Carga |
|
Key:
min: | |
| Lenovo Legion 7 16 IRX G9 i9-14900HX, GeForce RTX 4070 Laptop GPU, SK Hynix HFS001TEJ9X115N, IPS, 3200x2000, 16" | Aorus 16X 2024 i9-14900HX, GeForce RTX 4070 Laptop GPU, Gigabyte AG450E1024-SI, IPS, 2560x1600, 16" | HP Omen Transcend 16-u1095ng i9-14900HX, GeForce RTX 4070 Laptop GPU, Kioxia XG8 KXG80ZNV1T02, OLED, 2560x1600, 16" | Alienware m16 R2 Ultra 7 155H, GeForce RTX 4070 Laptop GPU, Samsung PM9A1 MZVL21T0HCLR, IPS, 2560x1600, 16" | Schenker XMG CORE 16 (L23) R7 7840HS, GeForce RTX 4070 Laptop GPU, Samsung 990 Pro 1 TB, IPS, 2560x1600, 16" | Lenovo Legion Pro 7 16IRX9H i9-14900HX, GeForce RTX 4080 Laptop GPU, SK Hynix HFS001TEJ9X115N, IPS, 2560x1600, 16" | Média NVIDIA GeForce RTX 4070 Laptop GPU | Média da turma Gaming | |
|---|---|---|---|---|---|---|---|---|
| Power Consumption | -4% | 4% | 6% | 20% | -27% | 10% | 4% | |
| Idle Minimum * (Watt) | 15.4 | 13 16% | 10 35% | 8.1 47% | 11 29% | 16 -4% | 13.2 ? 14% | 13 ? 16% |
| Idle Average * (Watt) | 21.2 | 18 15% | 18 15% | 13 39% | 15.2 28% | 21 1% | 18.2 ? 14% | 19 ? 10% |
| Idle Maximum * (Watt) | 21.9 | 35 -60% | 32 -46% | 40.3 -84% | 16 27% | 36 -64% | 24.6 ? -12% | 24.6 ? -12% |
| Load Average * (Watt) | 128.5 | 138 -7% | 128 -0% | 79 39% | 64 50% | 132 -3% | 97 ? 25% | 110.7 ? 14% |
| Witcher 3 ultra * (Watt) | 188.4 | 172.6 8% | 148.4 21% | 188.1 -0% | 179 5% | 267 -42% | ||
| Load Maximum * (Watt) | 239.1 | 222 7% | 242 -1% | 254.9 -7% | 280 -17% | 360 -51% | 221 ? 8% | 259 ? -8% |
* ... menor é melhor
Power consumption Witcher 3 / stress test
Power consumption with an external monitor
Duração da bateria
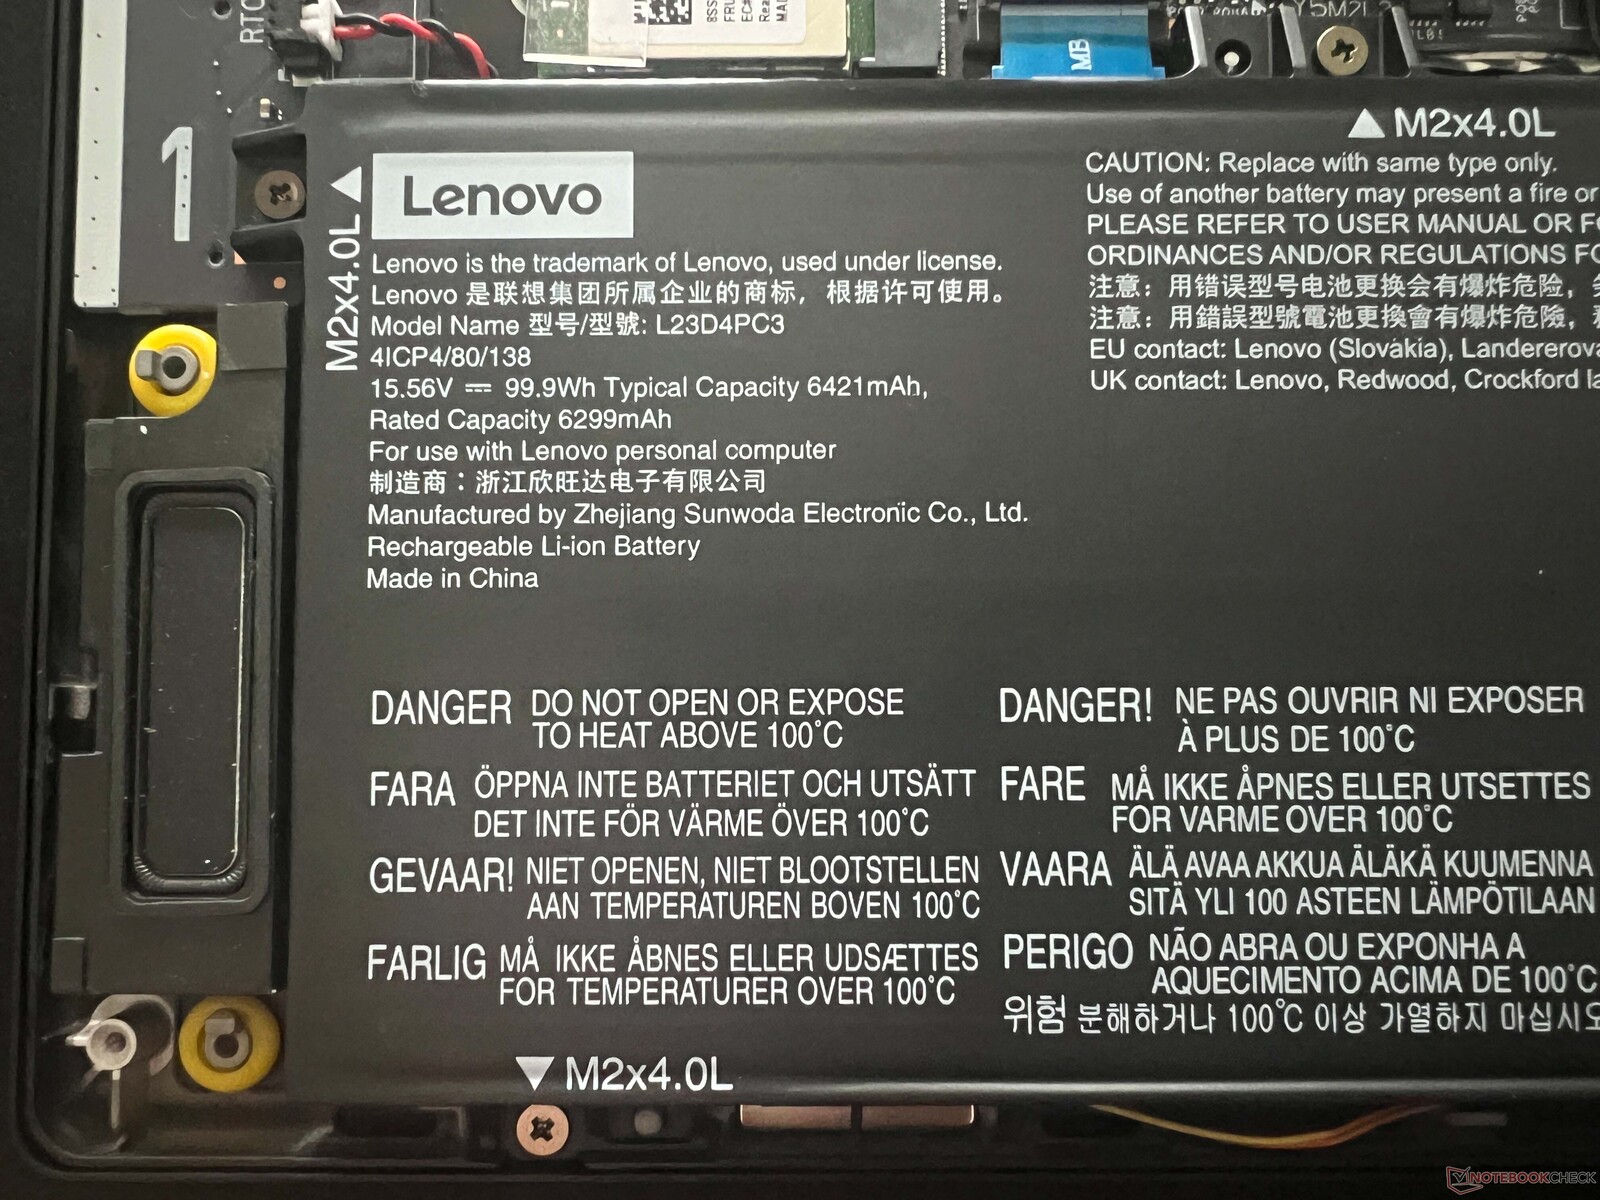
A Lenovo instalou uma bateria de 99,9 Wh em seu Legion 7 16 e, no geral, os tempos de execução podem ser considerados bastante médios. Com 150 cd/m² (representando 63% do brilho máximo do dispositivo de análise) e 60 Hz, nosso teste de Wi-Fi durou mais de 7 horas (~6,5 horas a 165 Hz) e cerca de 5,5 horas com brilho total e 60 Hz (~5 horas a 165 Hz). No teste de vídeo a 150 cd/m², registramos um pouco mais de 10 horas e, sob carga, na pior das hipóteses, as luzes se apagam após 50 minutos.
O Legion oferece dois modos de carregamento com um ciclo de carregamento completo que leva 97 minutos (80% após ~64 minutos) usando o modo normal. Com o modo expresso, leva 79 minutos (80% após apenas 34 minutos).
| Lenovo Legion 7 16 IRX G9 i9-14900HX, GeForce RTX 4070 Laptop GPU, 99.9 Wh | Lenovo Legion Pro 5 16IRX9 i9-14900HX, GeForce RTX 4070 Laptop GPU, 80 Wh | Aorus 16X 2024 i9-14900HX, GeForce RTX 4070 Laptop GPU, 99 Wh | HP Omen Transcend 16-u1095ng i9-14900HX, GeForce RTX 4070 Laptop GPU, 97 Wh | Alienware m16 R2 Ultra 7 155H, GeForce RTX 4070 Laptop GPU, 90 Wh | Schenker XMG CORE 16 (L23) R7 7840HS, GeForce RTX 4070 Laptop GPU, 99 Wh | Lenovo Legion Pro 7 16IRX9H i9-14900HX, GeForce RTX 4080 Laptop GPU, 99.9 Wh | Média da turma Gaming | |
|---|---|---|---|---|---|---|---|---|
| Duração da bateria | 3% | 37% | -32% | 19% | 72% | -14% | 23% | |
| H.264 (h) | 10.3 | 9 -13% | 10.2 -1% | 8.32 ? -19% | ||||
| WiFi v1.3 (h) | 7.2 | 4.8 -33% | 8 11% | 4.9 -32% | 8.1 13% | 8.4 17% | 6.2 -14% | 7.11 ? -1% |
| Load (h) | 0.8 | 1.1 38% | 1.7 113% | 1 25% | 2.4 200% | 1.502 ? 88% | ||
| Reader / Idle (h) | 6.7 | 12.6 | 12.6 | 8.27 ? |
Pro
Contra
Veredicto - Um laptop para jogos discreto e de alto desempenho

Com o novo Legion 7i 16 G9, a Lenovo está oferecendo um laptop para jogos relativamente fino que não revelou nenhum ponto fraco durante os testes. Em comparação com o mais caro Legion Pro 7mais caro, o senhor tem que aceitar as limitações quando se trata de longos períodos de desempenho da CPU, bem como da GPU equipada (o Legion 7 atinge o máximo no laptop RTX 4070), mas, em comparação com o Pro, o gabinete de alumínio permanece mais frio e, no geral, o resfriamento faz um trabalho muito bom. As ventoinhas ainda são problemáticas porque o senhor precisará de um fone de ouvido ao jogar, usando qualquer um dos modos de energia rápida. No entanto, isso também se aplica à concorrência e, usando o modo silencioso, é possível ter níveis de som toleráveis às custas de algum desempenho.
Além disso, o gabinete mais fino se destaca muito menos do que o Legion Pro. Qualquer pessoa que esteja em busca de opções de iluminação extensas ficará desapontada, mas, por outro lado, isso também torna o Legion 7 16 adequado para outros grupos-alvo. A única coisa irritante são as superfícies sensíveis a impressões digitais. Com exceção da porta Ethernet ausente, todos os conectores importantes estão integrados e não há problemas quando se trata de dispositivos de entrada.
O novo Lenovo Legion 7i 16 G9 é um laptop para jogos atraente, com muito desempenho e um bom conjunto de recursos. A tela IPS de alta resolução também é adequada para visualizar e editar imagens e não há PWM implementado.
De modo geral, a tela IPS opcional e sua resolução de 3.200 x 2.000 pixels fazem um bom trabalho, embora a impressão subjetiva da imagem e os tempos de resposta não consigam acompanhar o ritmo dos painéis OLED. O lado positivo é a falta de PWM e a ausência de reflexos incômodos. Da mesma forma, a duração da bateria é apenas mediana, com a plataforma e seu processador HX simplesmente exigindo muita energia.
O novo Legion 7 16 também tem um bom desempenho quando comparado a seus pares. Em particular, o Legion Pro 7 é adequado se o senhor quiser uma GPU mais rápida do que o laptop RTX 4070. Com potência comparável, o Legion Pro 5 é, por outro lado, significativamente mais volumoso e também oferece uma tela mais fraca. O HP Omen Transcend vem com uma tela OLED de 240 Hz, mas também oferece um desempenho um pouco inferior e um preço mais alto.
Preço e disponibilidade
O Legion 7i 16 G9 pode ser comprado diretamente da Lenovo por cerca de US$ 2.099.
Lenovo Legion 7 16 IRX G9
- 04/13/2024 v7 (old)
Andreas Osthoff
Transparência
A seleção dos dispositivos a serem analisados é feita pela nossa equipe editorial. A amostra de teste foi fornecida ao autor como empréstimo pelo fabricante ou varejista para fins desta revisão. O credor não teve influência nesta revisão, nem o fabricante recebeu uma cópia desta revisão antes da publicação. Não houve obrigação de publicar esta revisão. Como empresa de mídia independente, a Notebookcheck não está sujeita à autoridade de fabricantes, varejistas ou editores.
É assim que o Notebookcheck está testando
Todos os anos, o Notebookcheck analisa de forma independente centenas de laptops e smartphones usando procedimentos padronizados para garantir que todos os resultados sejam comparáveis. Desenvolvemos continuamente nossos métodos de teste há cerca de 20 anos e definimos padrões da indústria no processo. Em nossos laboratórios de teste, equipamentos de medição de alta qualidade são utilizados por técnicos e editores experientes. Esses testes envolvem um processo de validação em vários estágios. Nosso complexo sistema de classificação é baseado em centenas de medições e benchmarks bem fundamentados, o que mantém a objetividade.Price comparison

