Análise do laptop Ninkear A15 Plus: Surpreendentemente bom e econômico

É difícil acompanhar o número de fabricantes chineses de laptops. A Ninkear é uma delas, oferecendo principalmente notebooks de baixo custo com uma carcaça de alta qualidade. Os laptops oferecidos geralmente não têm o hardware mais recente em seu interior, mas, como nosso teste mostrará, até mesmo um AMD Ryzen 7 5700U de 2021 tem potência suficiente para o uso diário em 2024.
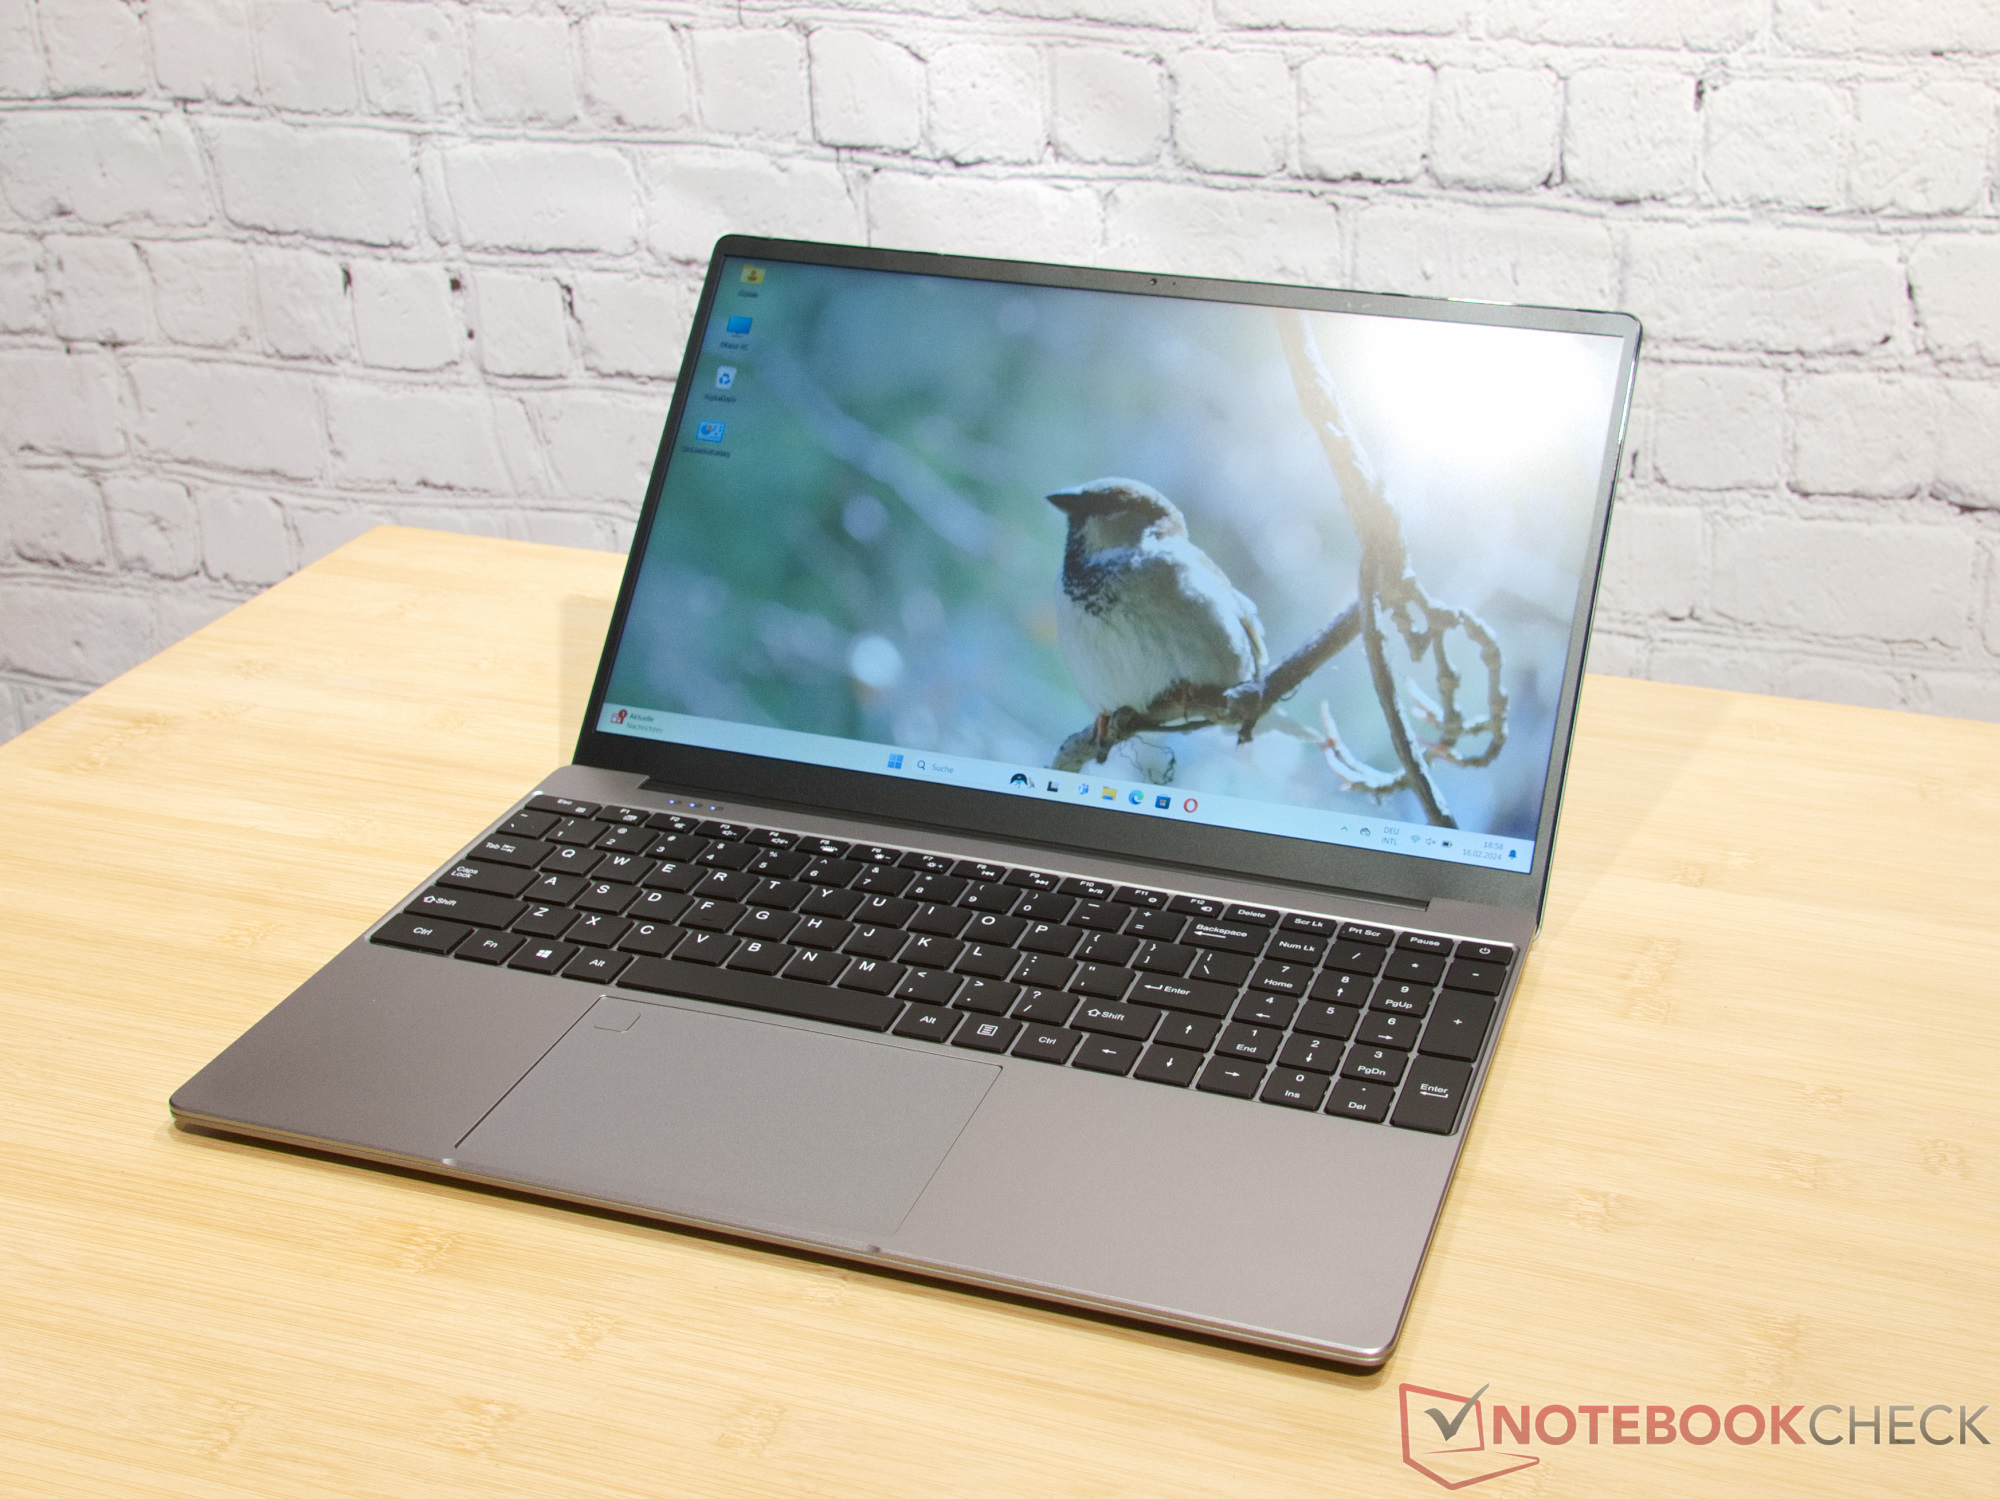
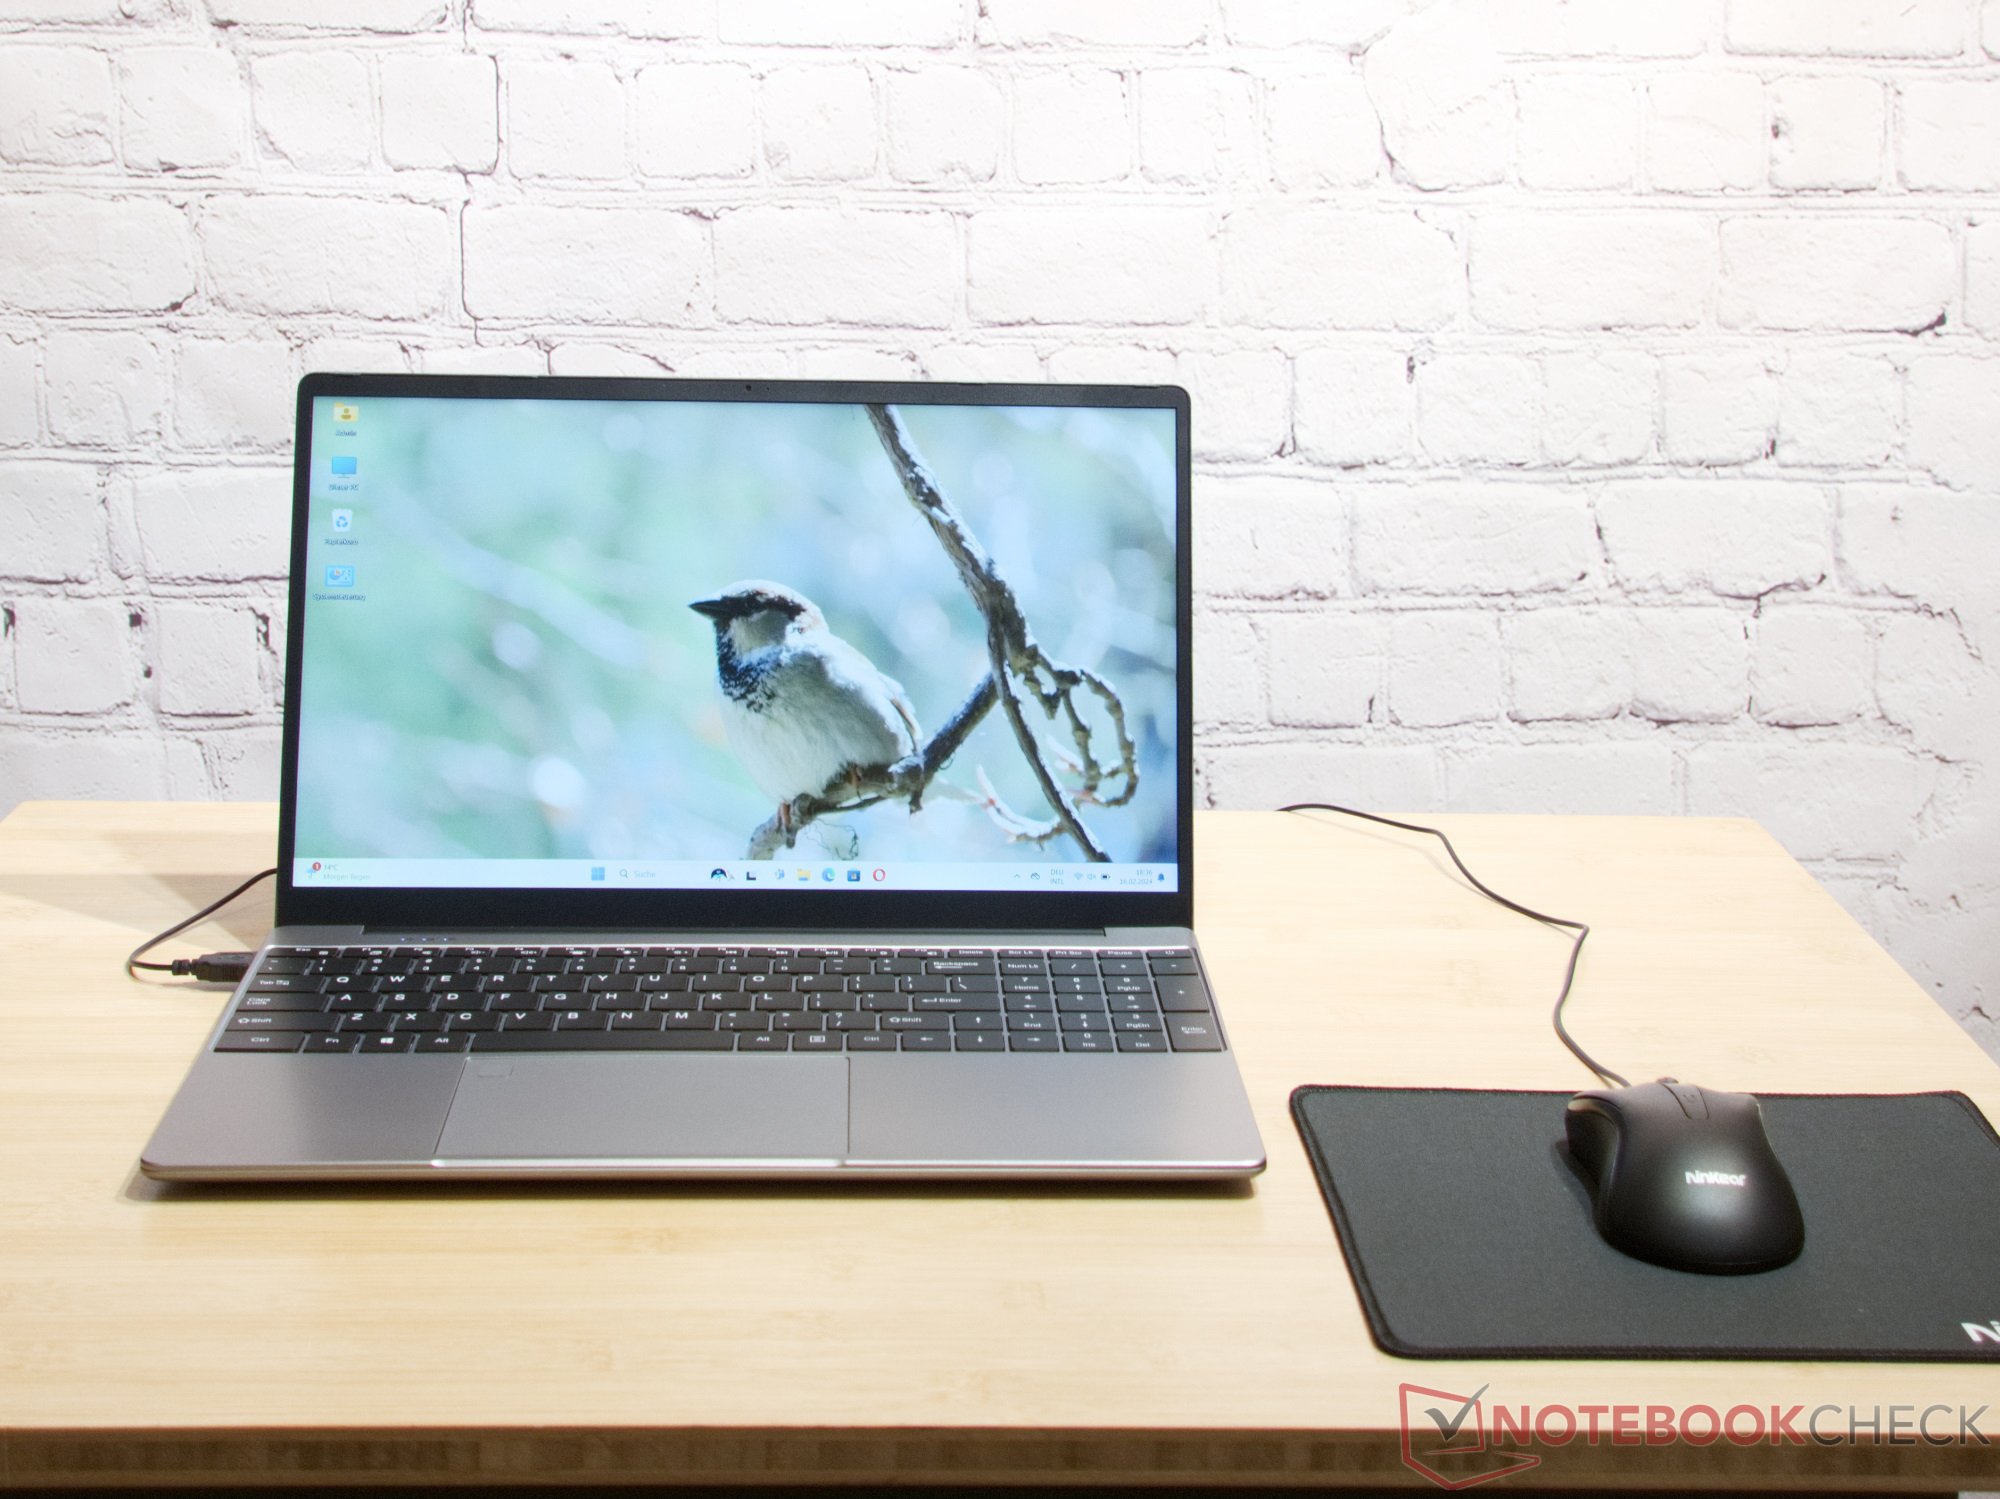
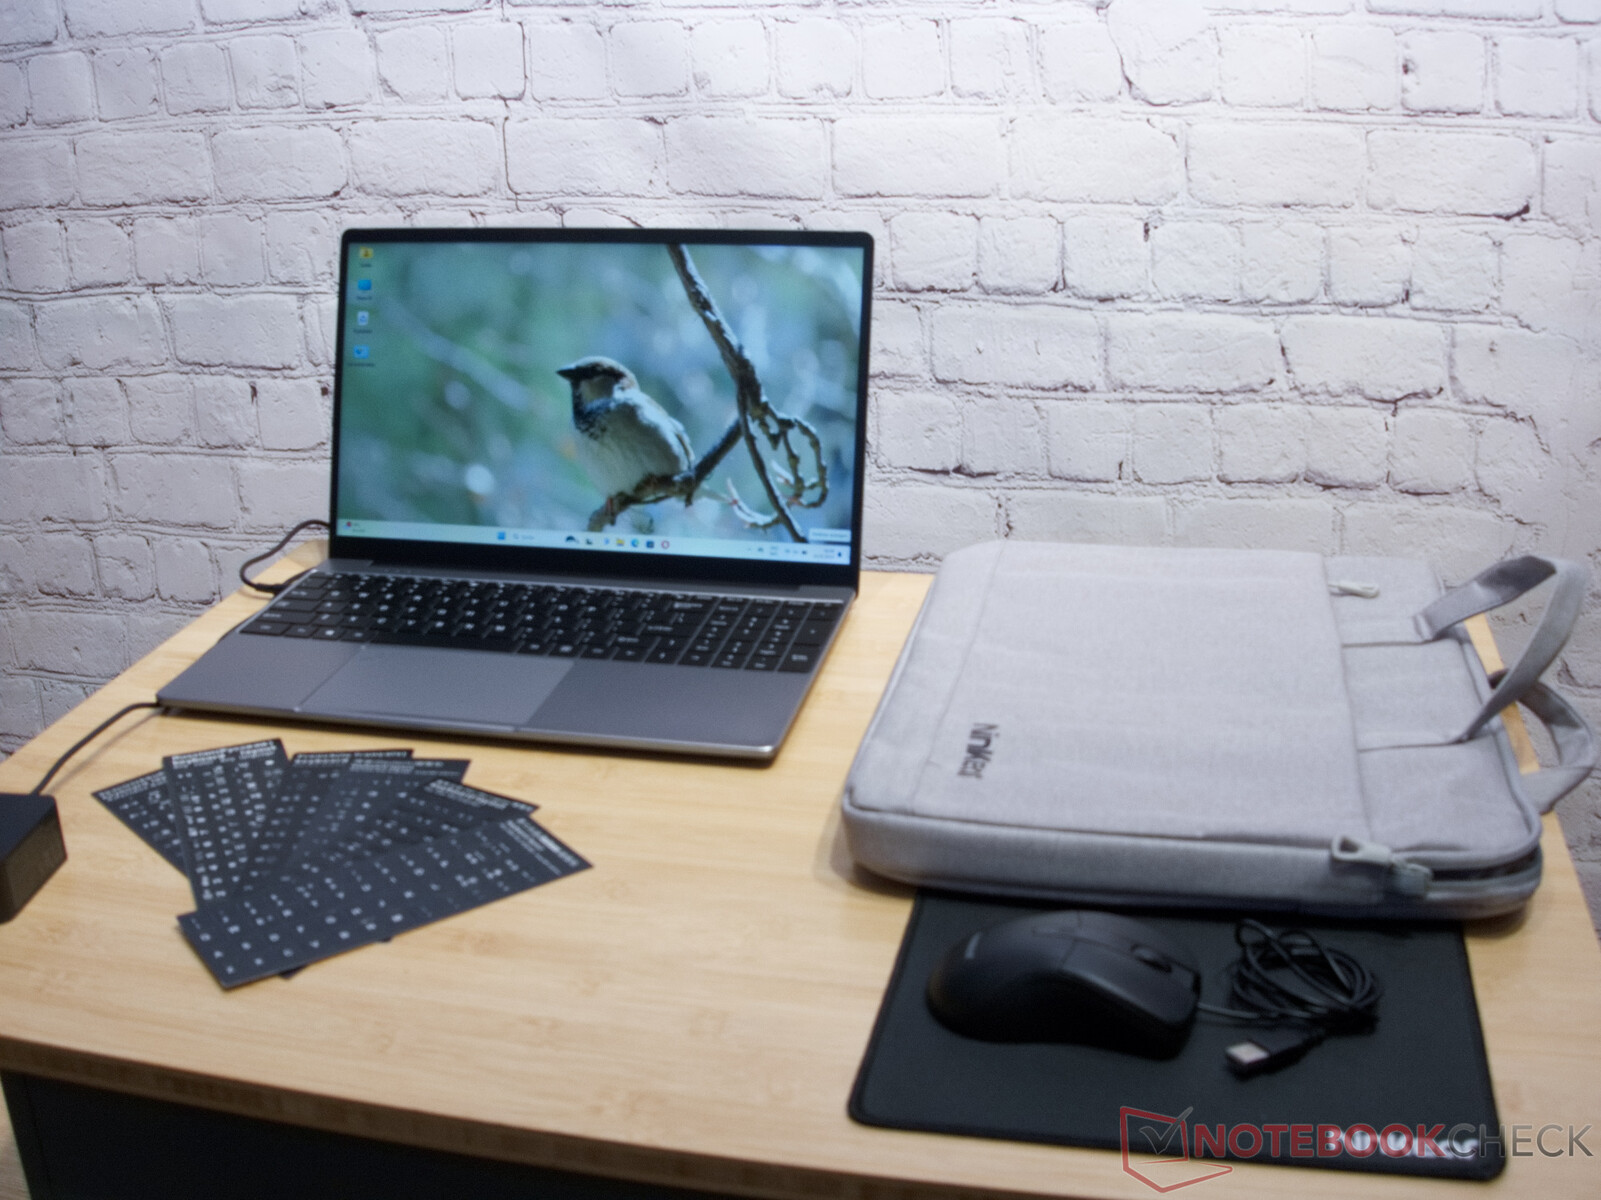
O Ninkear A15 Plus vem com 16 GB ou 32 GB de RAM, um painel IPS de 15,6 polegadas, teclado QWERTY e muitos acessórios. Esse laptop acessível da China também vem com uma bolsa para laptop, mouse e mouse pad na caixa.
Possíveis concorrentes em comparação
Selecionamos laptops de dois grupos diferentes como concorrentes - o Asus P1511CEA e o HP 250 G9 que também têm preços na casa dos 500 euros, e o Schenker VIA 15 Pro e o Eurocom C315 Blitz que são significativamente mais caros, mas têm recursos semelhantes aos do nosso dispositivo de teste.
Possíveis concorrentes em comparação
Avaliação | Data | Modelo | Peso | Altura | Size | Resolução | Preço |
|---|---|---|---|---|---|---|---|
| 83.6 % v7 (old) | 03/2024 | Ninkear A15 Plus (16+512) R7 5700U, Vega 8 | 1.8 kg | 18.2 mm | 15.60" | 1920x1080 | |
| 85.7 % v7 (old) | 09/2022 | Lenovo IdeaPad 5 Pro 16ARH7 R5 6600HS, Radeon 660M | 1.9 kg | 18.4 mm | 16.00" | 2560x1600 | |
| 83.4 % v7 (old) | 11/2023 | Eurocom C315 Blitz i7-1360P, Iris Xe G7 96EUs | 1.7 kg | 19.9 mm | 15.60" | 3840x2160 | |
| 87.1 % v7 (old) | Schenker VIA 15 Pro M22 R7 5700U, Vega 8 | 1.4 kg | 16.8 mm | 15.60" | 2560x1440 | ||
| 75.2 % v7 (old) | 12/2023 | HP 250 G9 7N029ES i3-1215U, UHD Graphics 64EUs | 1.7 kg | 19.9 mm | 15.60" | 1920x1080 | |
| 77.5 % v7 (old) | 01/2023 | Asus P1511CEA-BQ753R i3-1115G4, UHD Graphics Xe G4 48EUs | 1.8 kg | 19.9 mm | 15.60" | 1920x1080 |
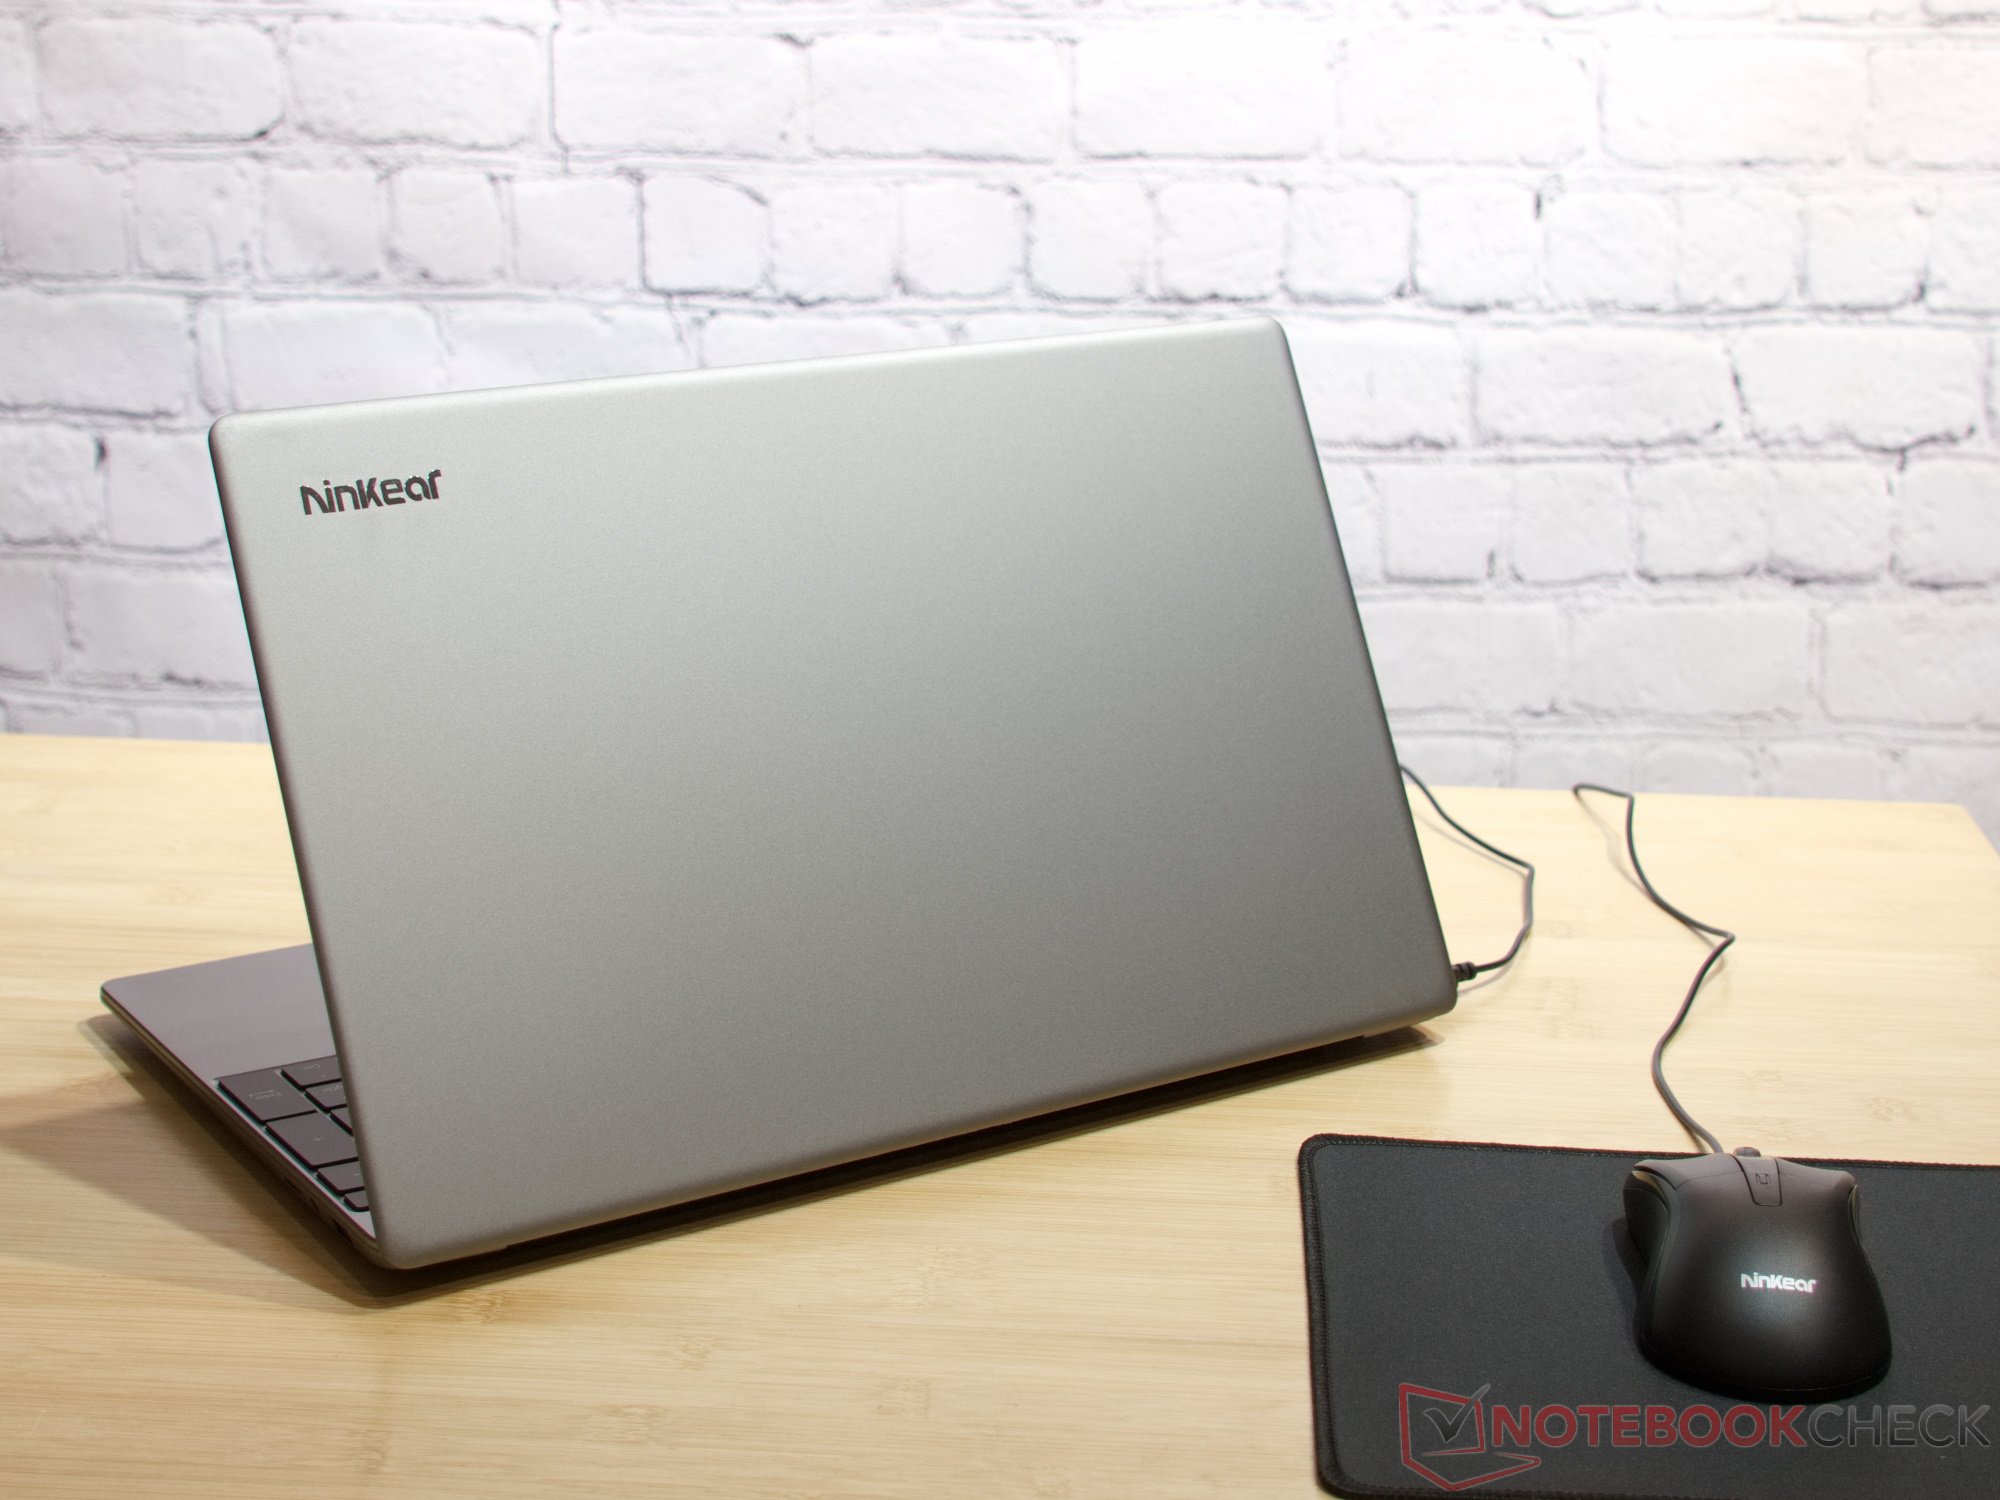
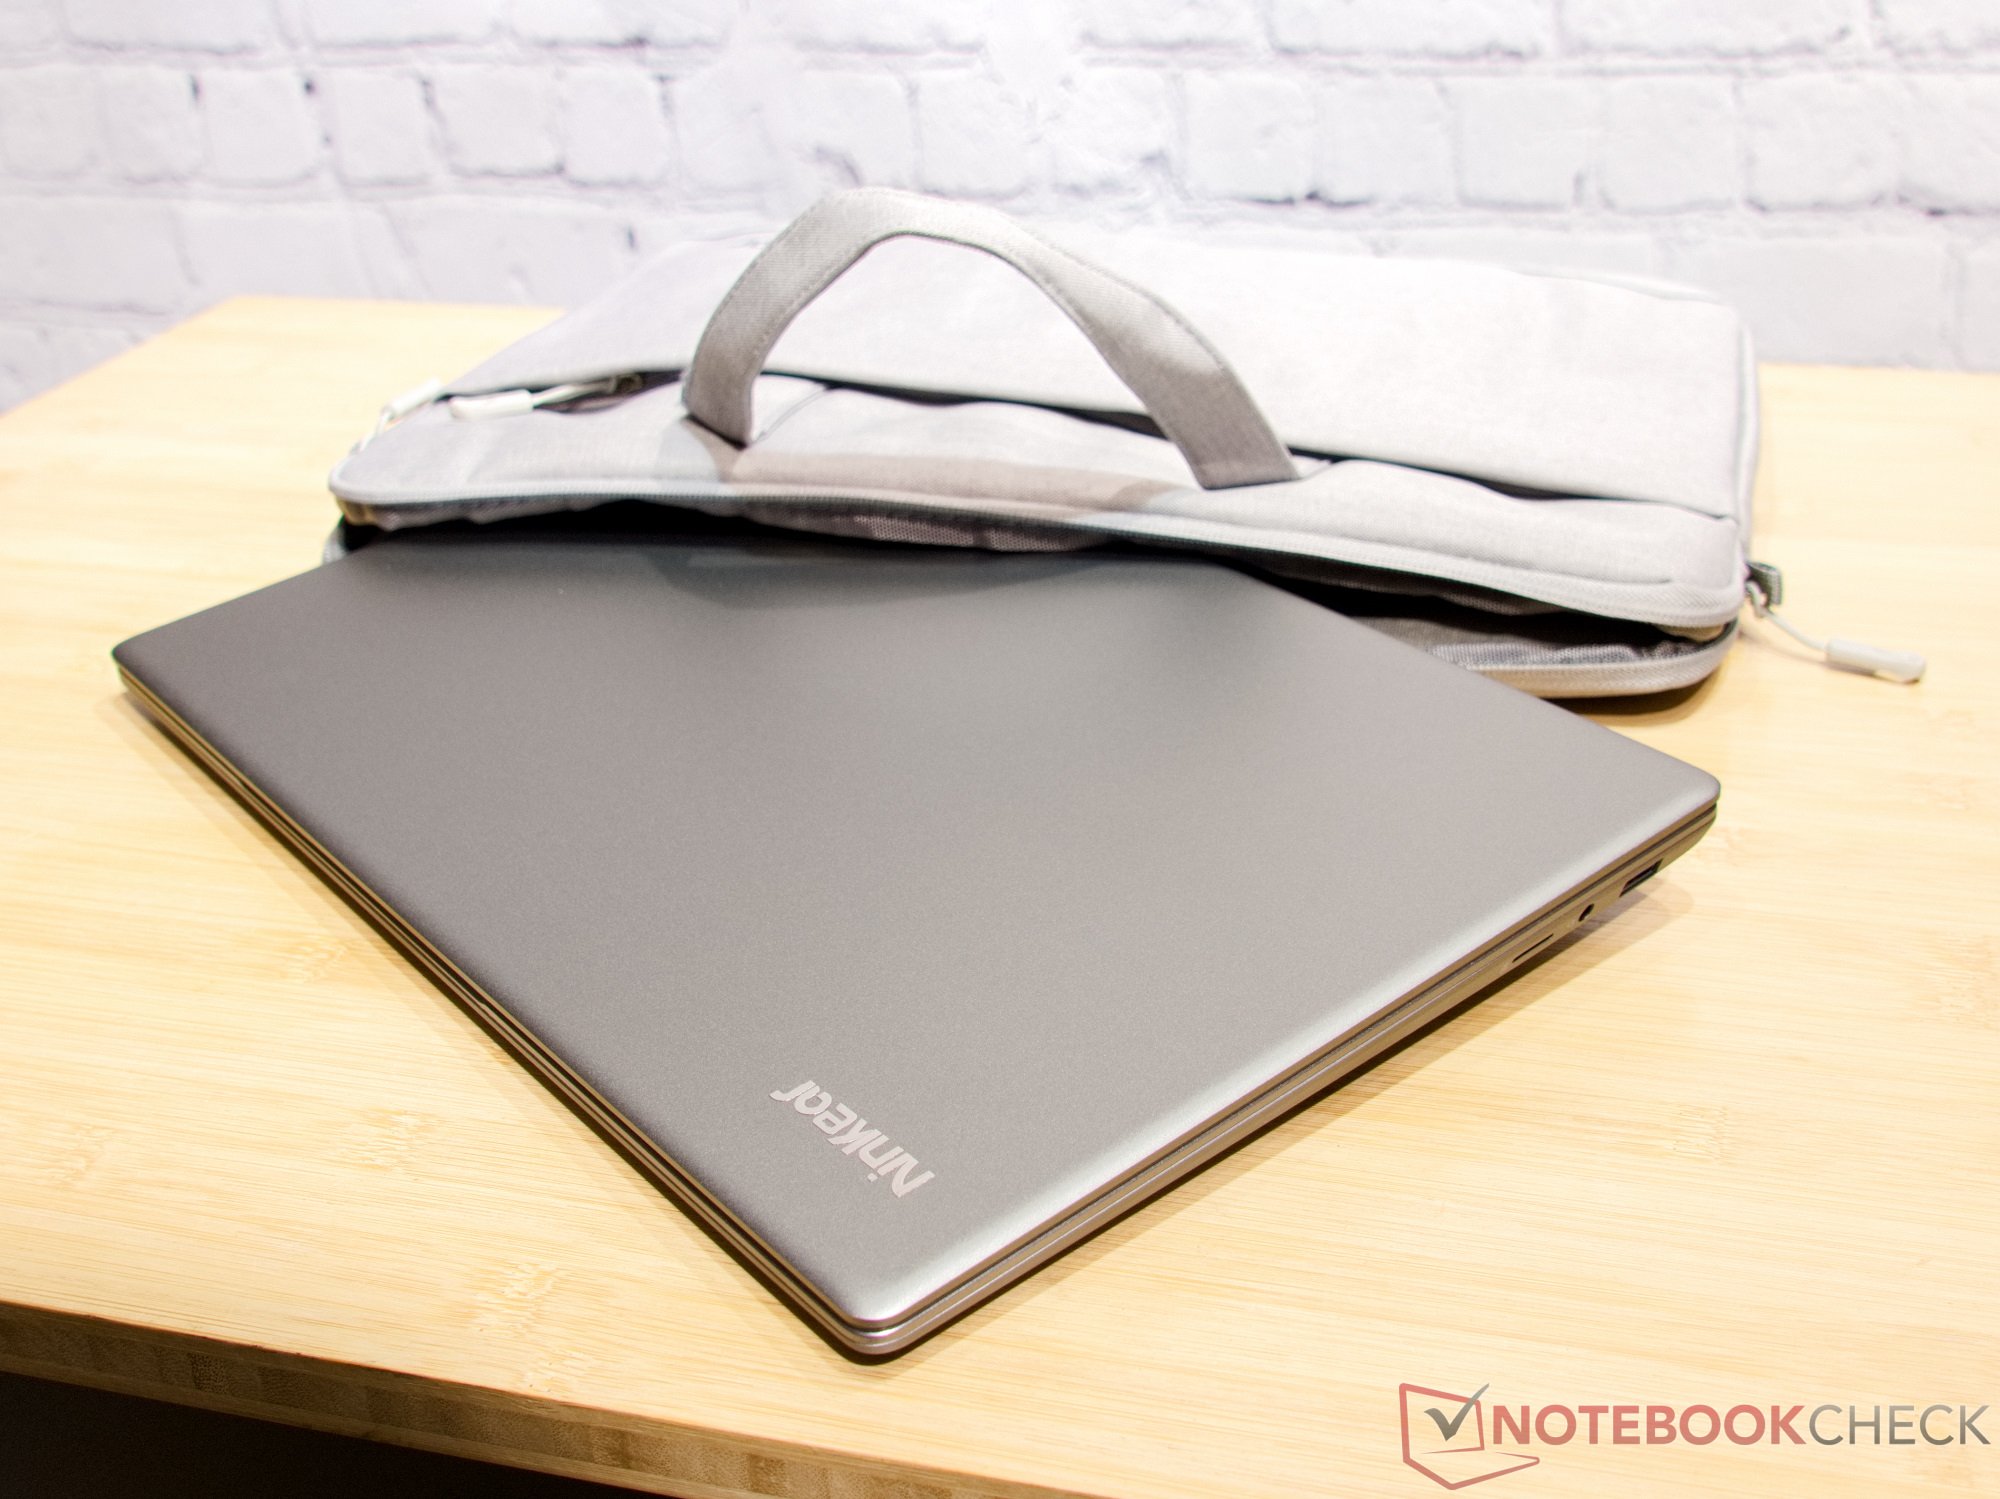
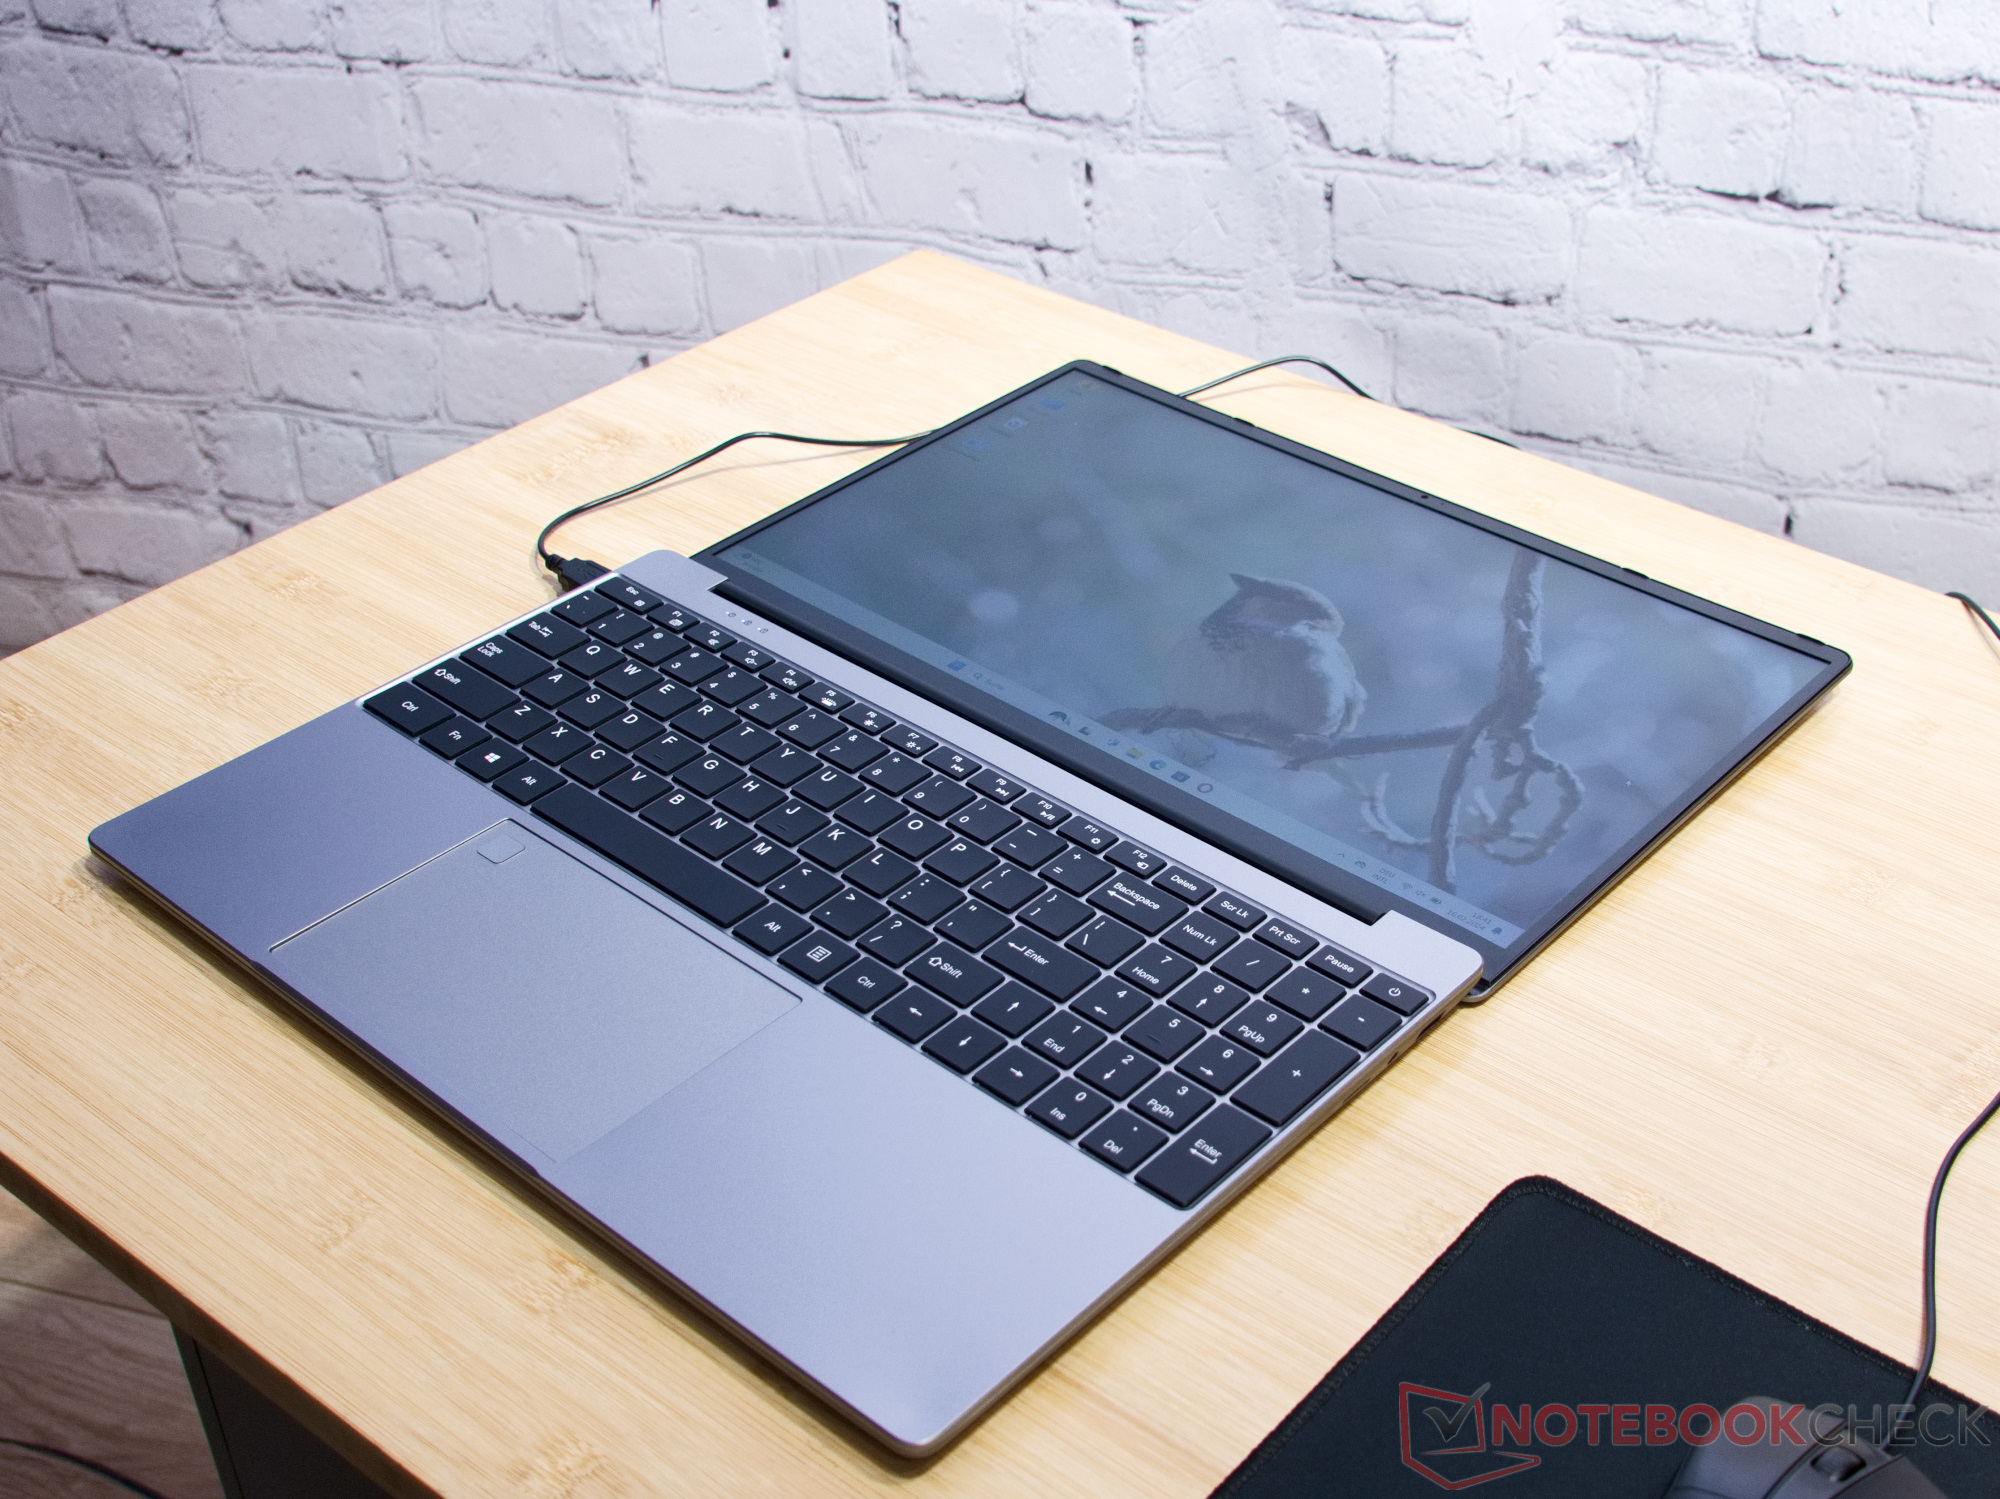
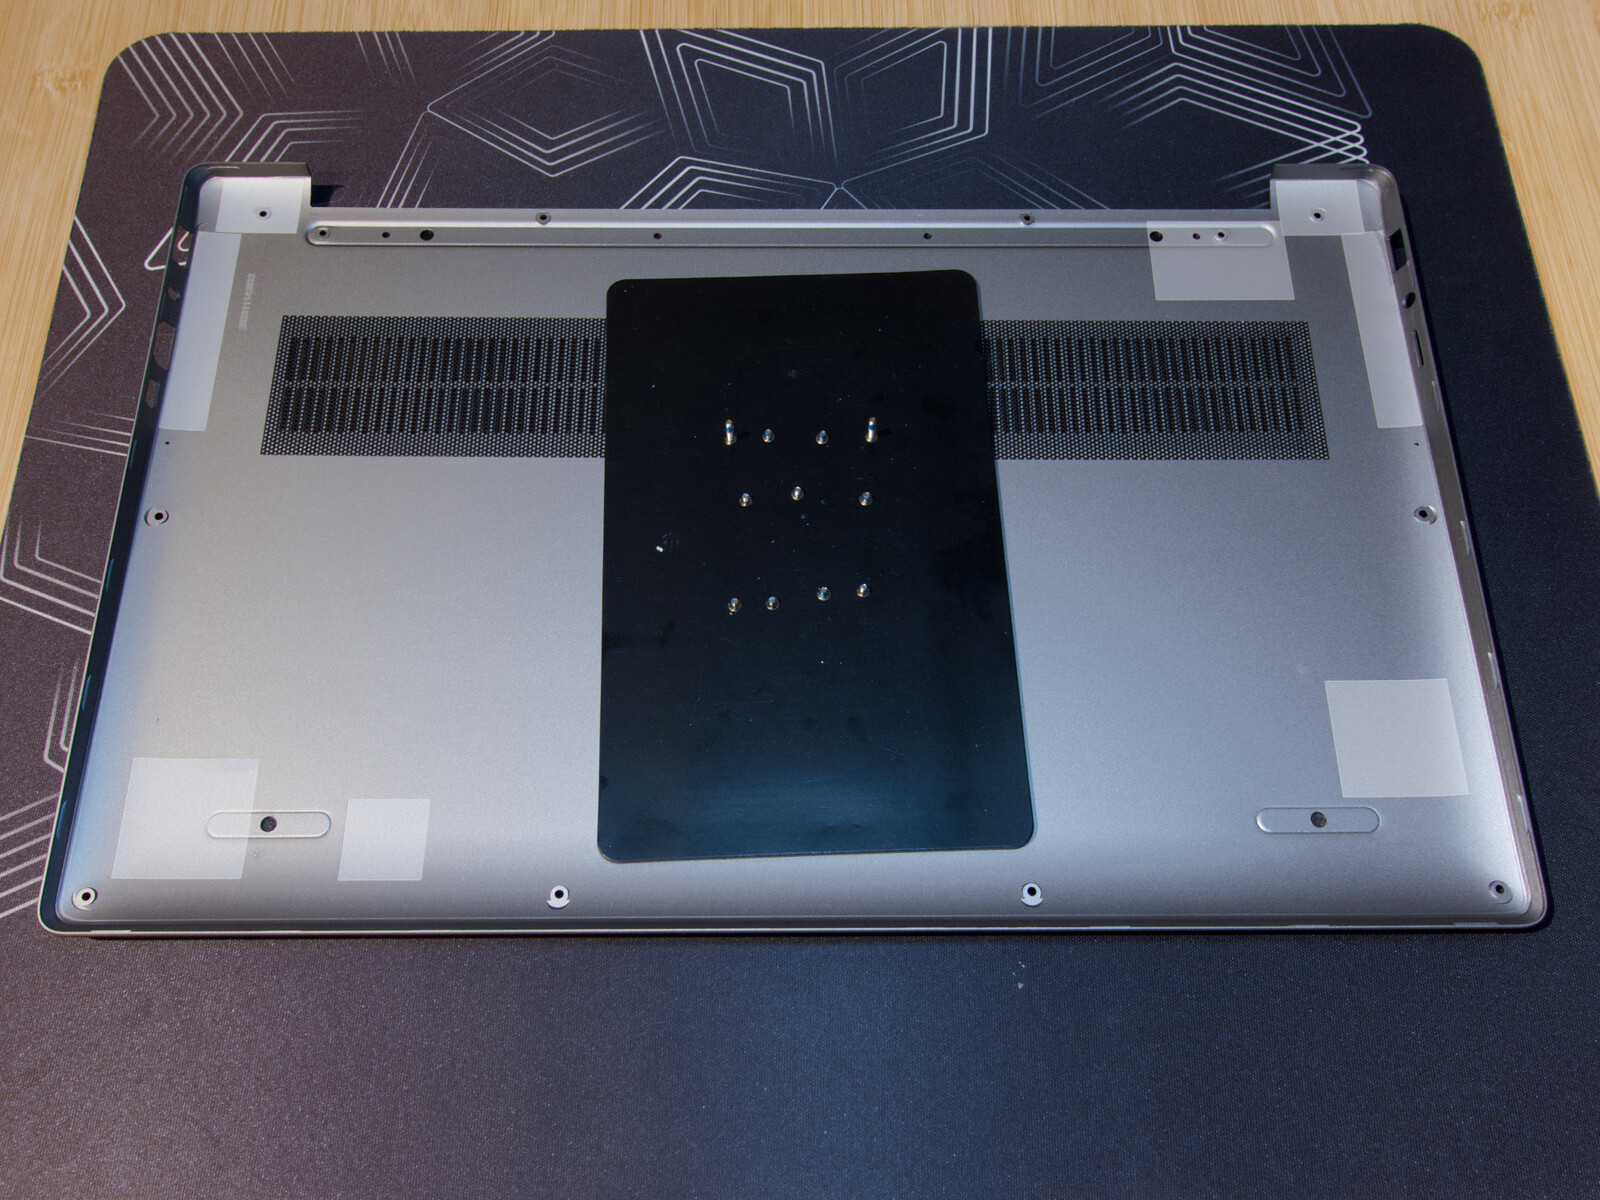
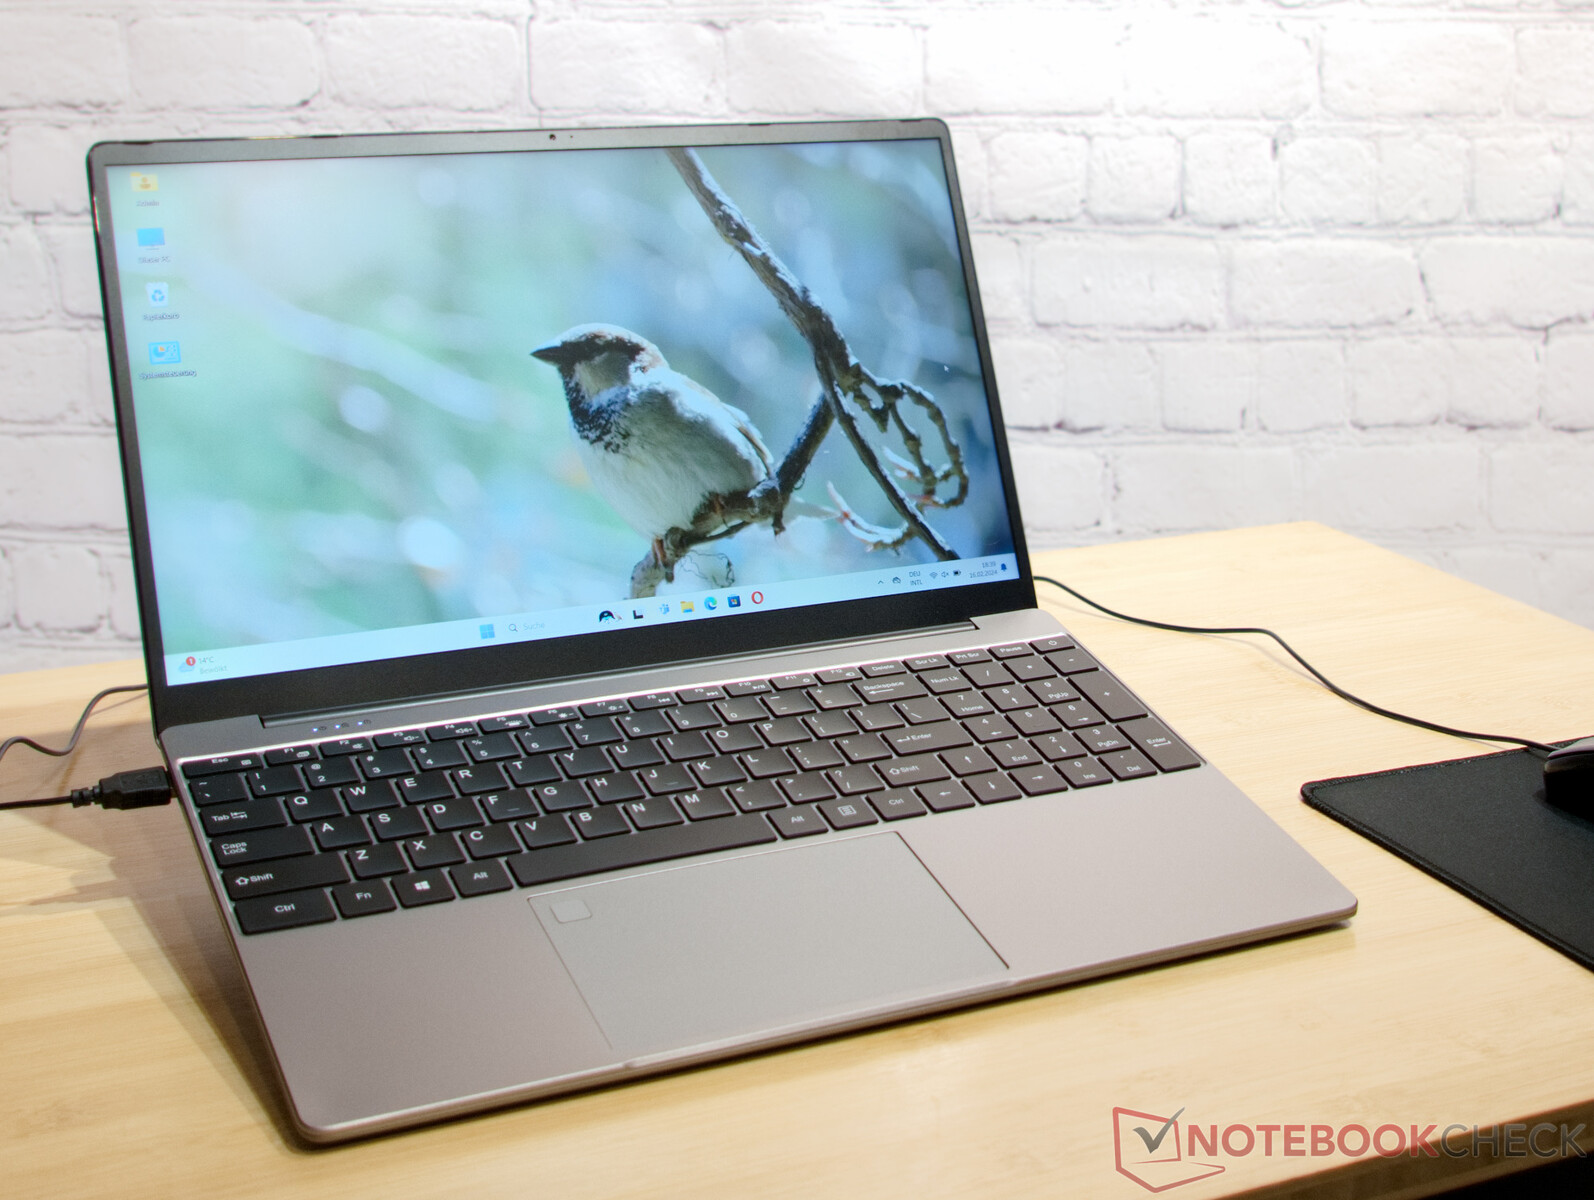
Estojo e equipamentos: Tampa e base de alumínio
À primeira vista, a carcaça do Ninkear A15 Plus parece ser de alta qualidade. A tampa e a base do laptop são feitas de alumínio, enquanto a tampa do teclado é feita de plástico pintado. No entanto, o fabricante combinou a cor com tanta precisão que não é possível perceber a diferença de material só de olhar para ele. O fato de os apoios para as mãos e a tampa B legal serem feitos de plástico também tem algumas vantagens.
As superfícies não esquentam tão rapidamente quanto o alumínio e são muito mais agradáveis ao toque, mesmo quando quentes. A desvantagem aqui é mais provável que seja a durabilidade. Até mesmo a melhor pintura se desgasta com o tempo.
No geral, a qualidade da caixa é boa. A tela pode ser aberta suavemente em até 180° sem que as dobradiças fiquem instáveis. O teclado só pode ser pressionado minimamente e o laptop também tem boa estabilidade em outros aspectos. O fabricante sabe como ocultar o fato de que os espaços na caixa às vezes não são perfeitos com espaços de sombra deliberadamente escolhidos.
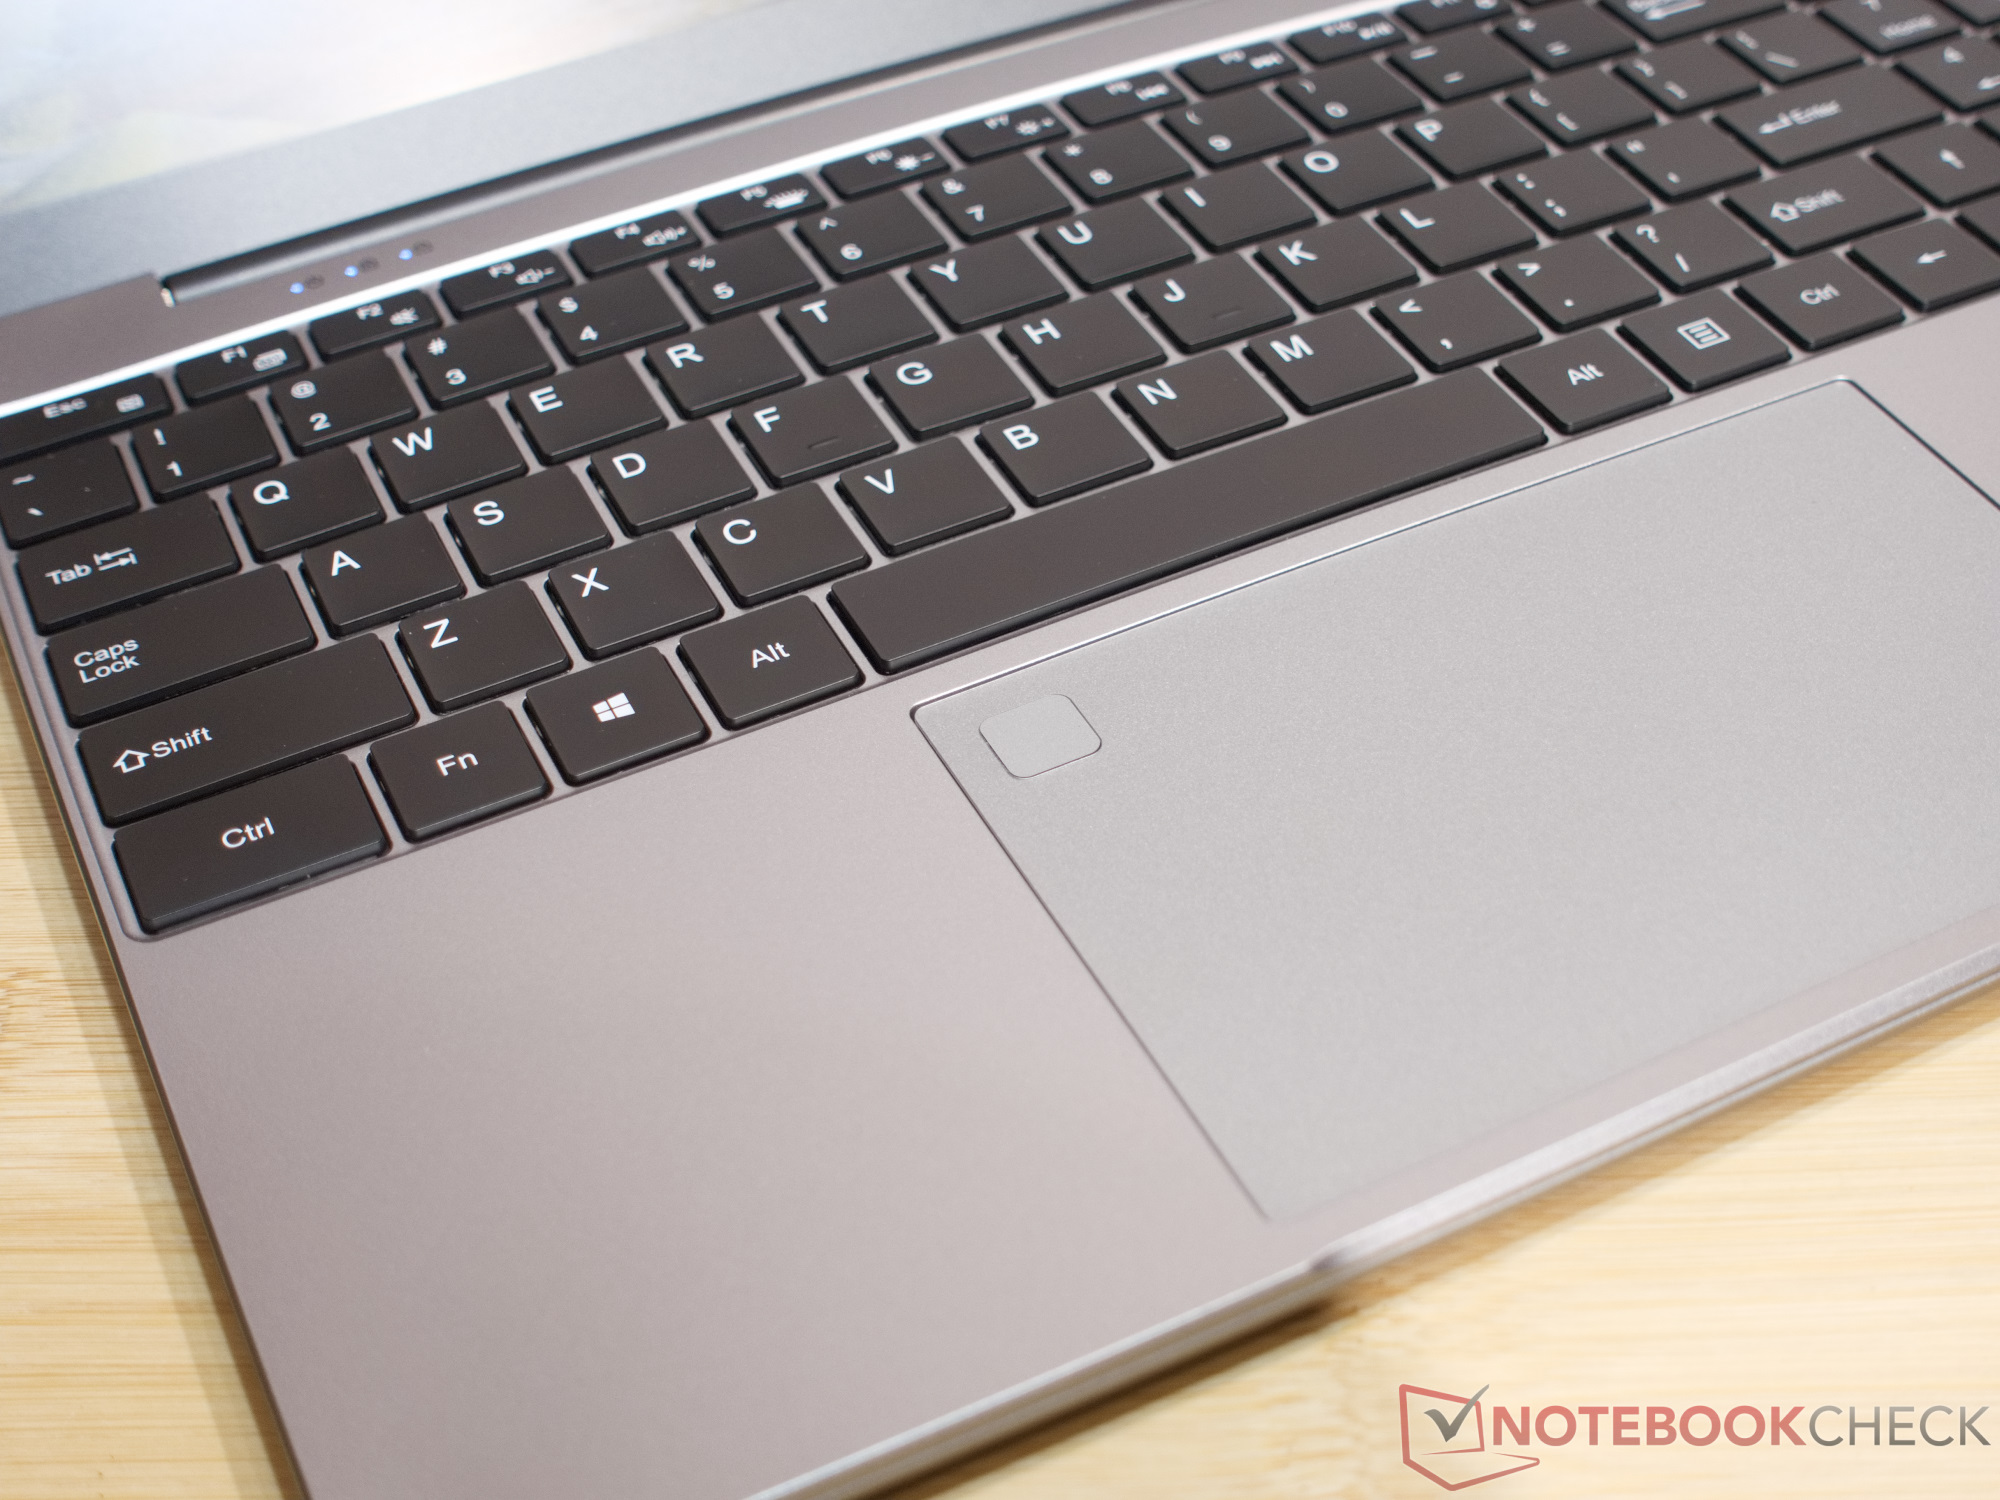
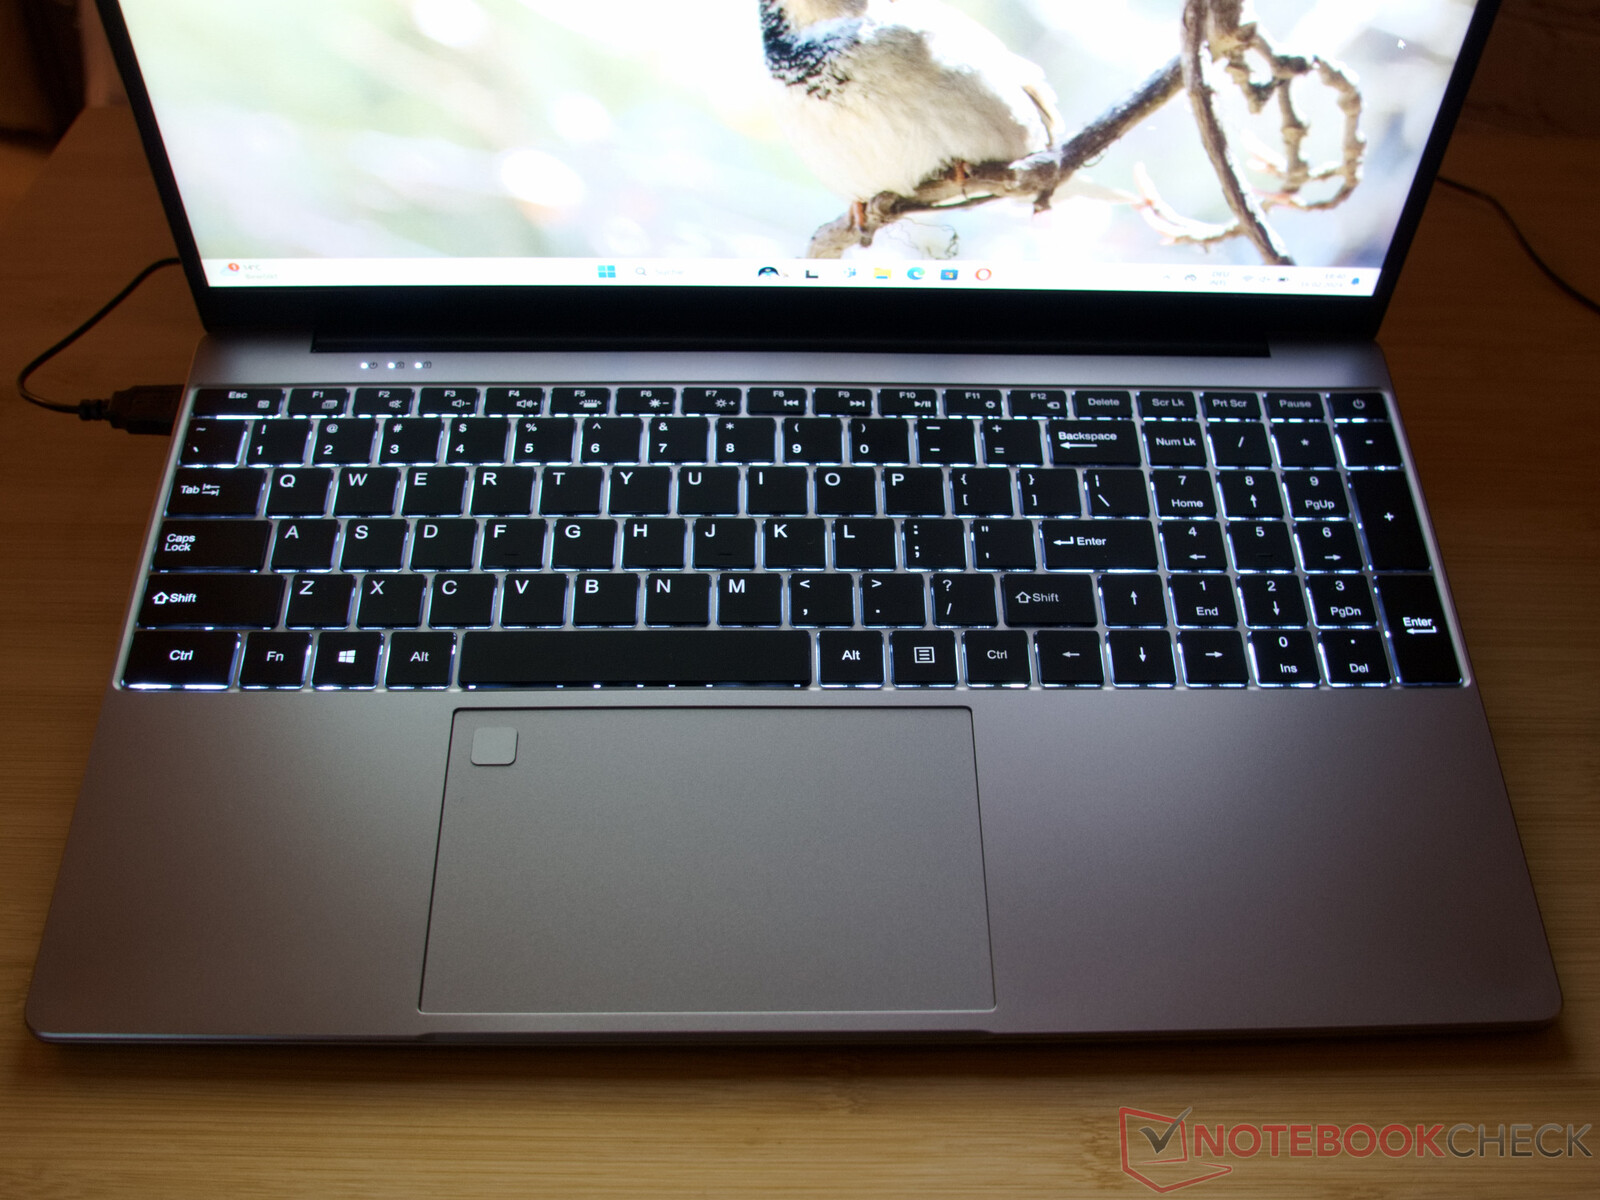
A tela grande e o teclado grande chamam a atenção imediatamente quando o laptop é aberto. A Ninkear aproveita ao máximo o espaço no gabinete e inclui um teclado com um bloco NUM e teclas de tamanho normal.
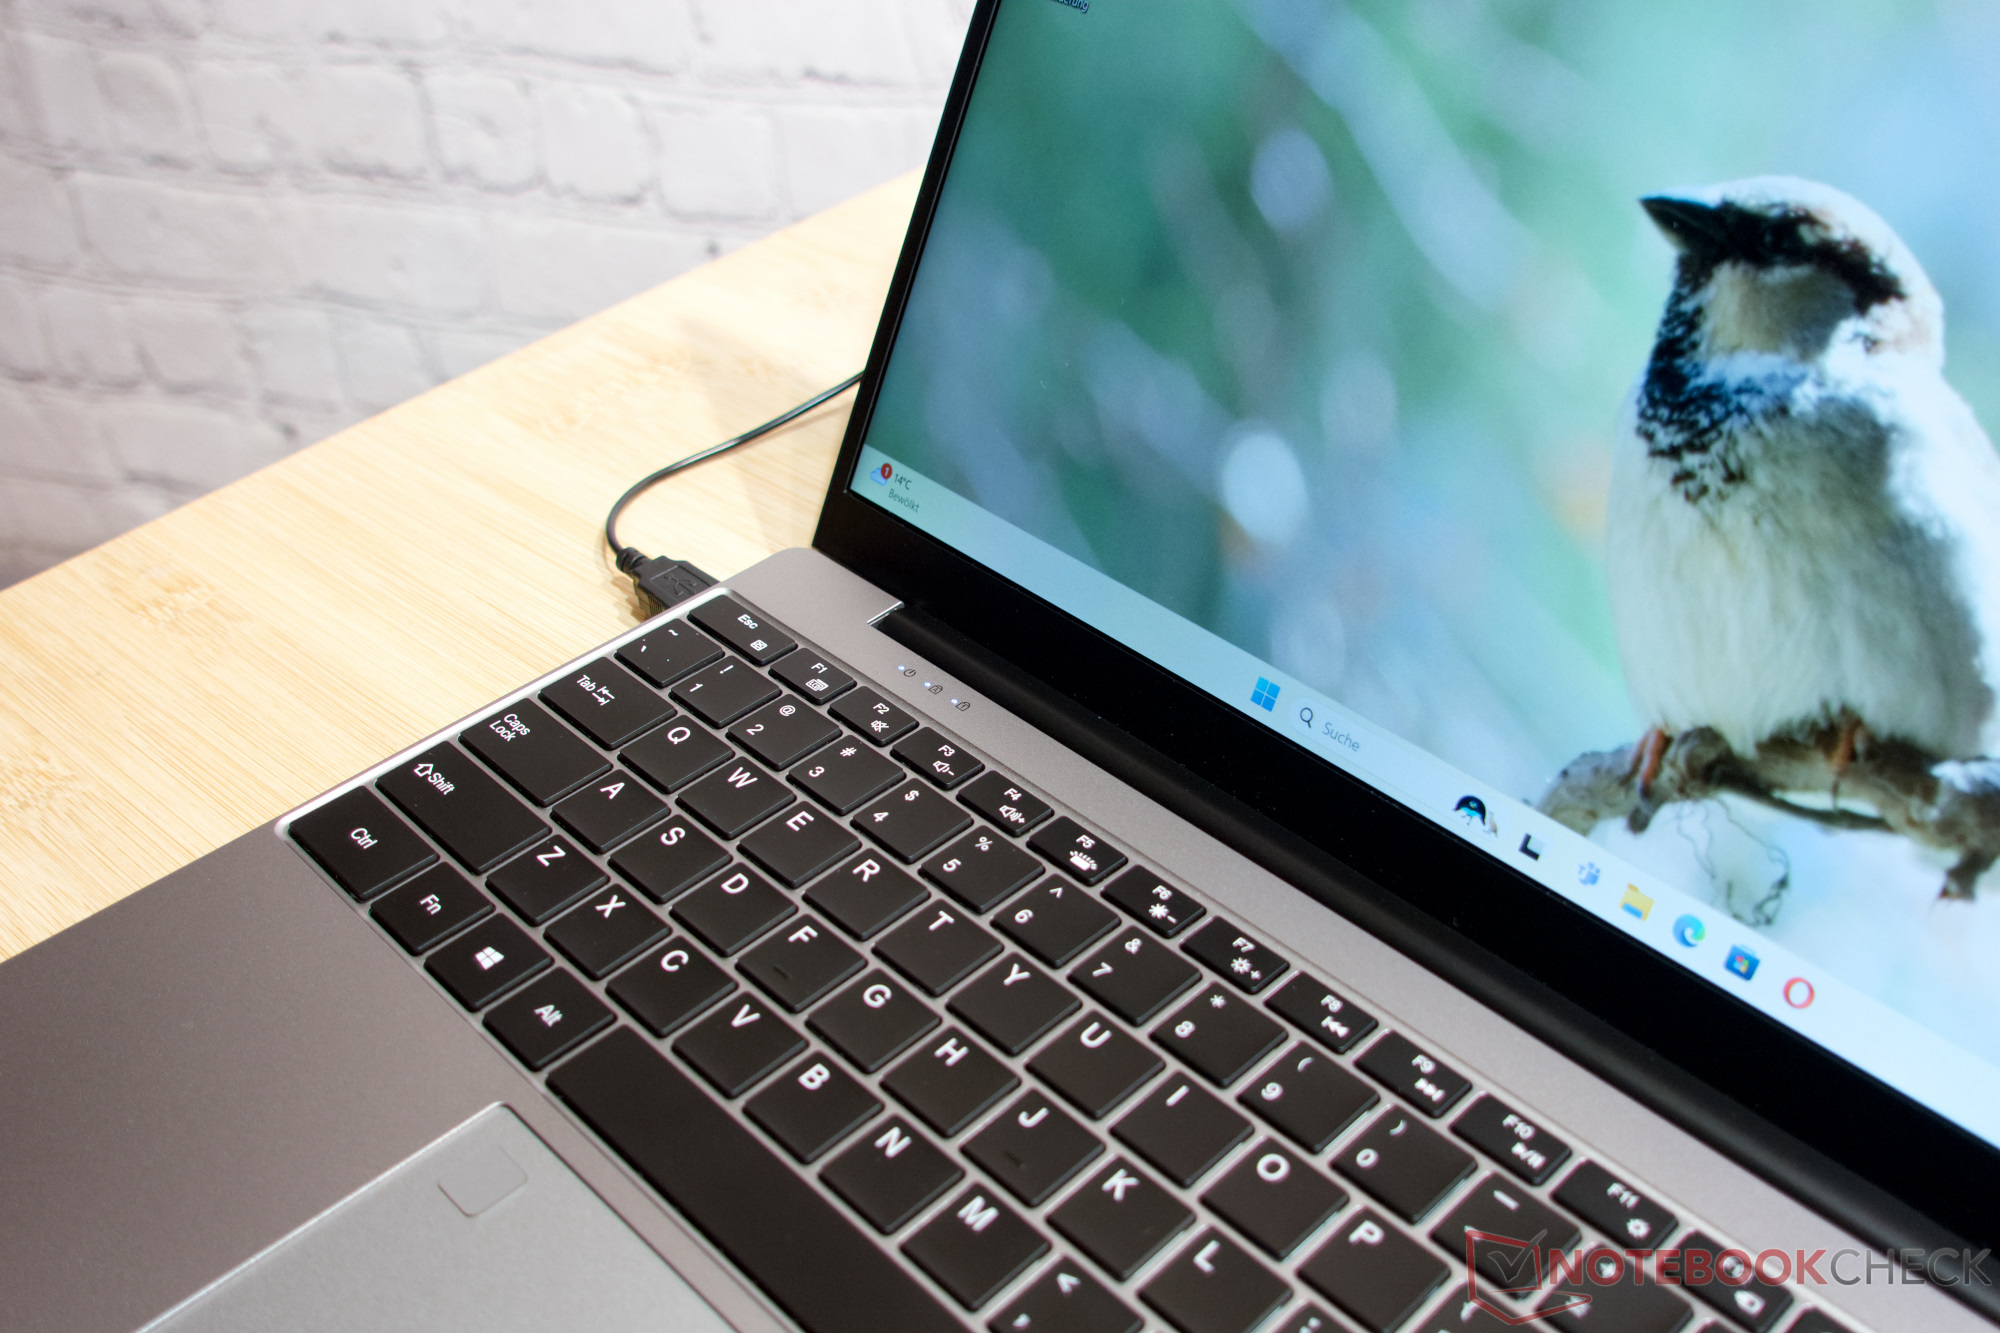
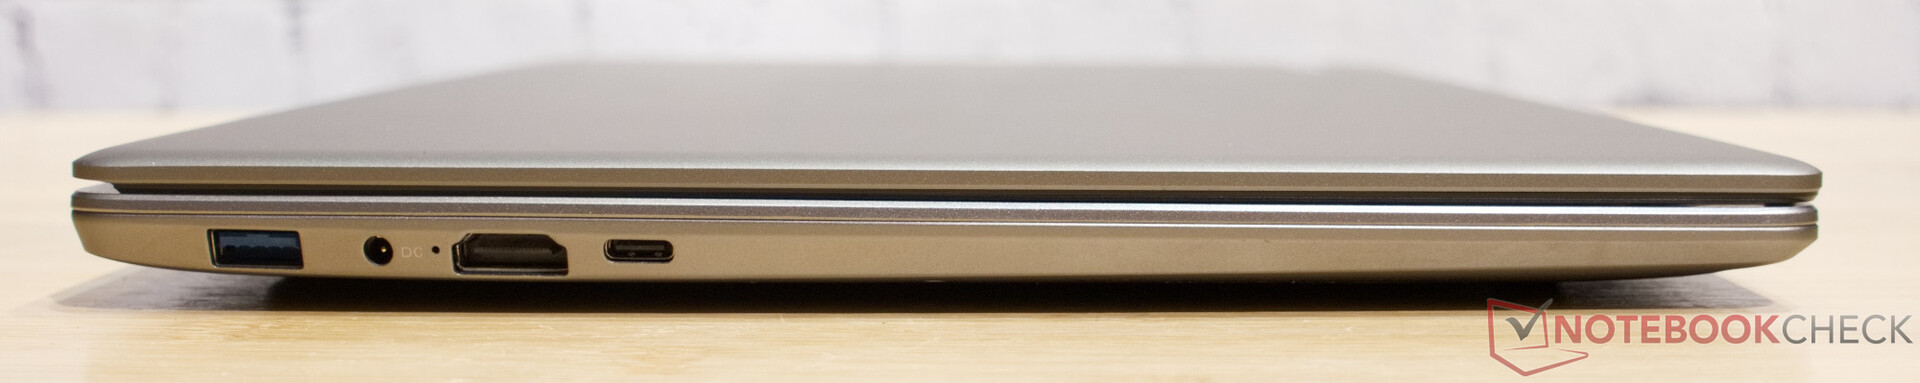
A conectividade do laptop é adequada. Ao contrário do guia rápido em alemão, a porta USB Type-C no lado esquerdo oferece todas as comodidades, incluindo DisplayPort e Power Delivery.
O motivo pelo qual o fabricante não menciona a função Power Delivery não está claro para nós. O Power Delivery pode ser útil, pois permite operar o Ninkear A15 Plus em uma estação de acoplamento, e a fonte de alimentação do laptop com plugue redondo também pode ser deixada em casa.
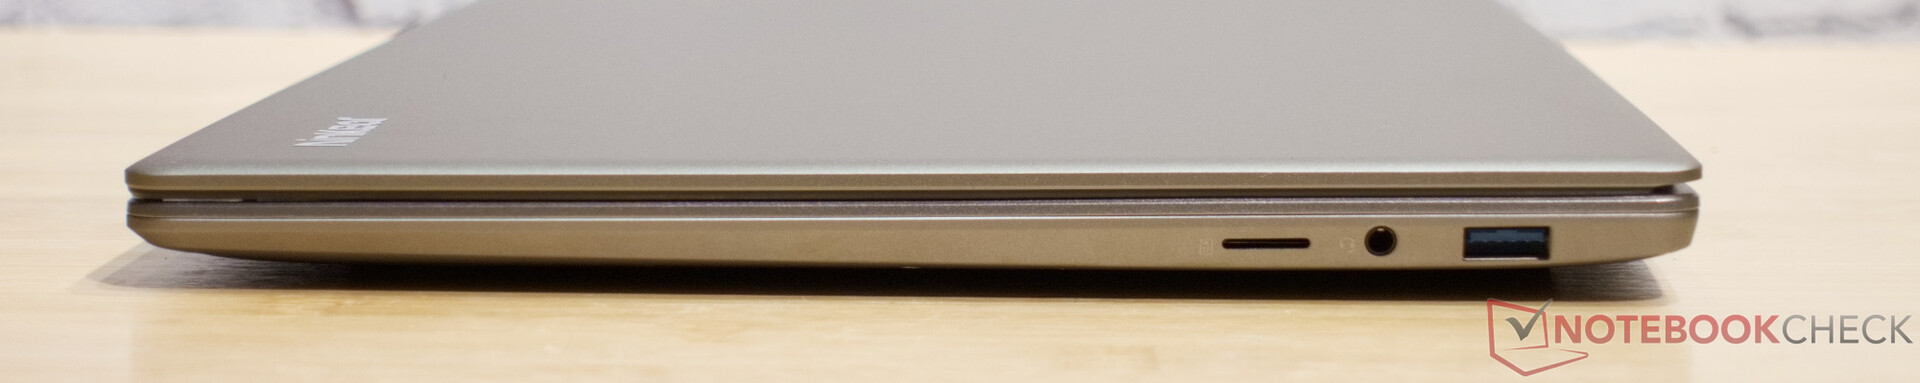
Infelizmente, vemos alguns problemas com o leitor de cartão microSD e o Wi-Fi. Assim como o processador, o chip Wi-Fi do Ninkear A15 Plus é um silício bastante antigo. Ele não é compatível com Wi-Fi 6 ou 6E. Como resultado, as velocidades de transmissão aqui são correspondentemente ruins.
A taxa de transferência do Wi-Fi é suficiente para navegar, mas é preciso ter paciência se o senhor quiser mover arquivos grandes na rede. O mesmo se aplica ao lento leitor de cartão microSD. Esse leitor também tem o problema de que é possível empurrar o cartão de memória para dentro do compartimento além do slot. Na pior das hipóteses, o senhor terá que desparafusar o laptop para recuperá-lo!
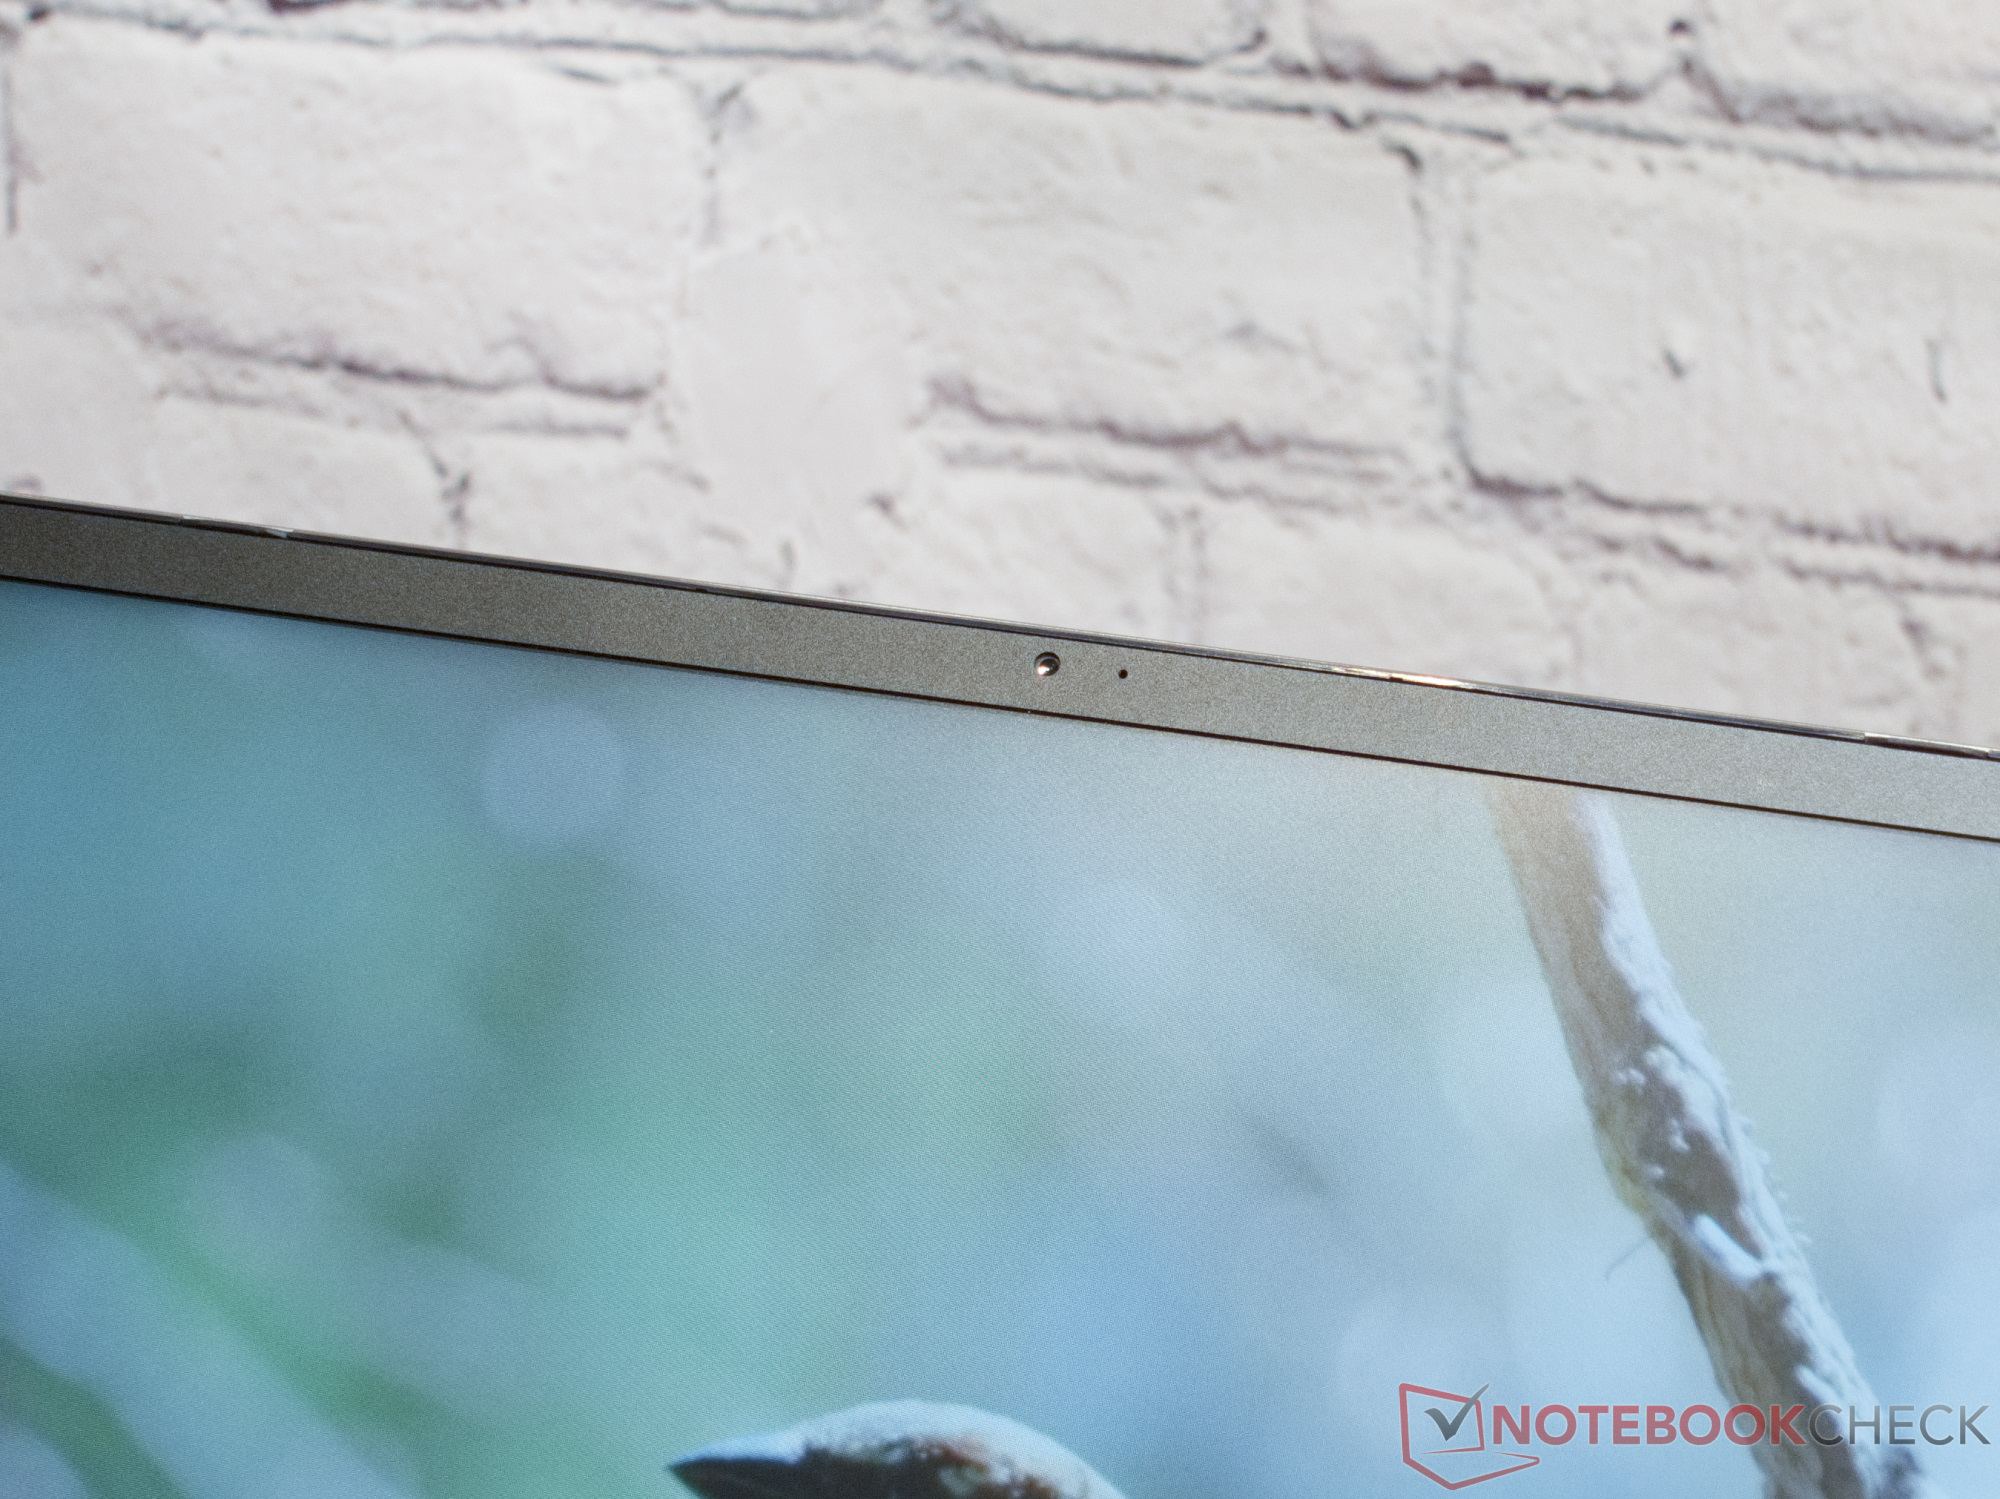
A webcam de 720p e o microfone mono podem ser usados, mas não têm a melhor qualidade. Eles podem ser usados para uma chamada de vídeo rápida em casa, mas é melhor usar uma webcam externa se o senhor costuma participar de videoconferências.
De modo geral, o desempenho do leitor de cartões, da webcam e do módulo WLAN é praticamente adequado. Os dispositivos na faixa de preço de 500 euros também não são muito diferentes.
| SD Card Reader | |
| average JPG Copy Test (av. of 3 runs) | |
| Lenovo IdeaPad 5 Pro 16ARH7 (AV PRO microSD 128 GB V60) | |
| Eurocom C315 Blitz (Angelbird AV Pro V60) | |
| Média da turma Office (19.8 - 198.5, n=22, últimos 2 anos) | |
| Ninkear A15 Plus (16+512) | |
| HP 250 G9 7N029ES (Angelbird AV Pro V60) | |
| Schenker VIA 15 Pro M22 (Angelbird AV Pro V60) | |
| maximum AS SSD Seq Read Test (1GB) | |
| Eurocom C315 Blitz (Angelbird AV Pro V60) | |
| Média da turma Office (27.4 - 249, n=21, últimos 2 anos) | |
| Ninkear A15 Plus (16+512) | |
| HP 250 G9 7N029ES (Angelbird AV Pro V60) | |
| Schenker VIA 15 Pro M22 (Angelbird AV Pro V60) | |
| Networking | |
| iperf3 transmit AXE11000 | |
| Schenker VIA 15 Pro M22 | |
| Média da turma Office (507 - 1911, n=59, últimos 2 anos) | |
| Eurocom C315 Blitz | |
| Lenovo IdeaPad 5 Pro 16ARH7 | |
| HP 250 G9 7N029ES | |
| Ninkear A15 Plus (16+512) | |
| Média Qualcomm Atheros QCA9377 Wireless Network Adapter (332 - 335, n=2) | |
| Asus P1511CEA-BQ753R | |
| iperf3 receive AXE11000 | |
| Schenker VIA 15 Pro M22 | |
| Média da turma Office (530 - 1775, n=60, últimos 2 anos) | |
| Eurocom C315 Blitz | |
| Lenovo IdeaPad 5 Pro 16ARH7 | |
| HP 250 G9 7N029ES | |
| Asus P1511CEA-BQ753R | |
| Média Qualcomm Atheros QCA9377 Wireless Network Adapter (350 - 351, n=2) | |
| Ninkear A15 Plus (16+512) | |
| iperf3 transmit AXE11000 6GHz | |
| Média da turma Office (417 - 2341, n=37, últimos 2 anos) | |
| Eurocom C315 Blitz | |
| iperf3 receive AXE11000 6GHz | |
| Média da turma Office (508 - 2328, n=39, últimos 2 anos) | |
| Eurocom C315 Blitz | |

 Vega 8, R7 5700U, GOFATOO P110E-512GB")
 Vega 8, R7 5700U, GOFATOO P110E-512GB")
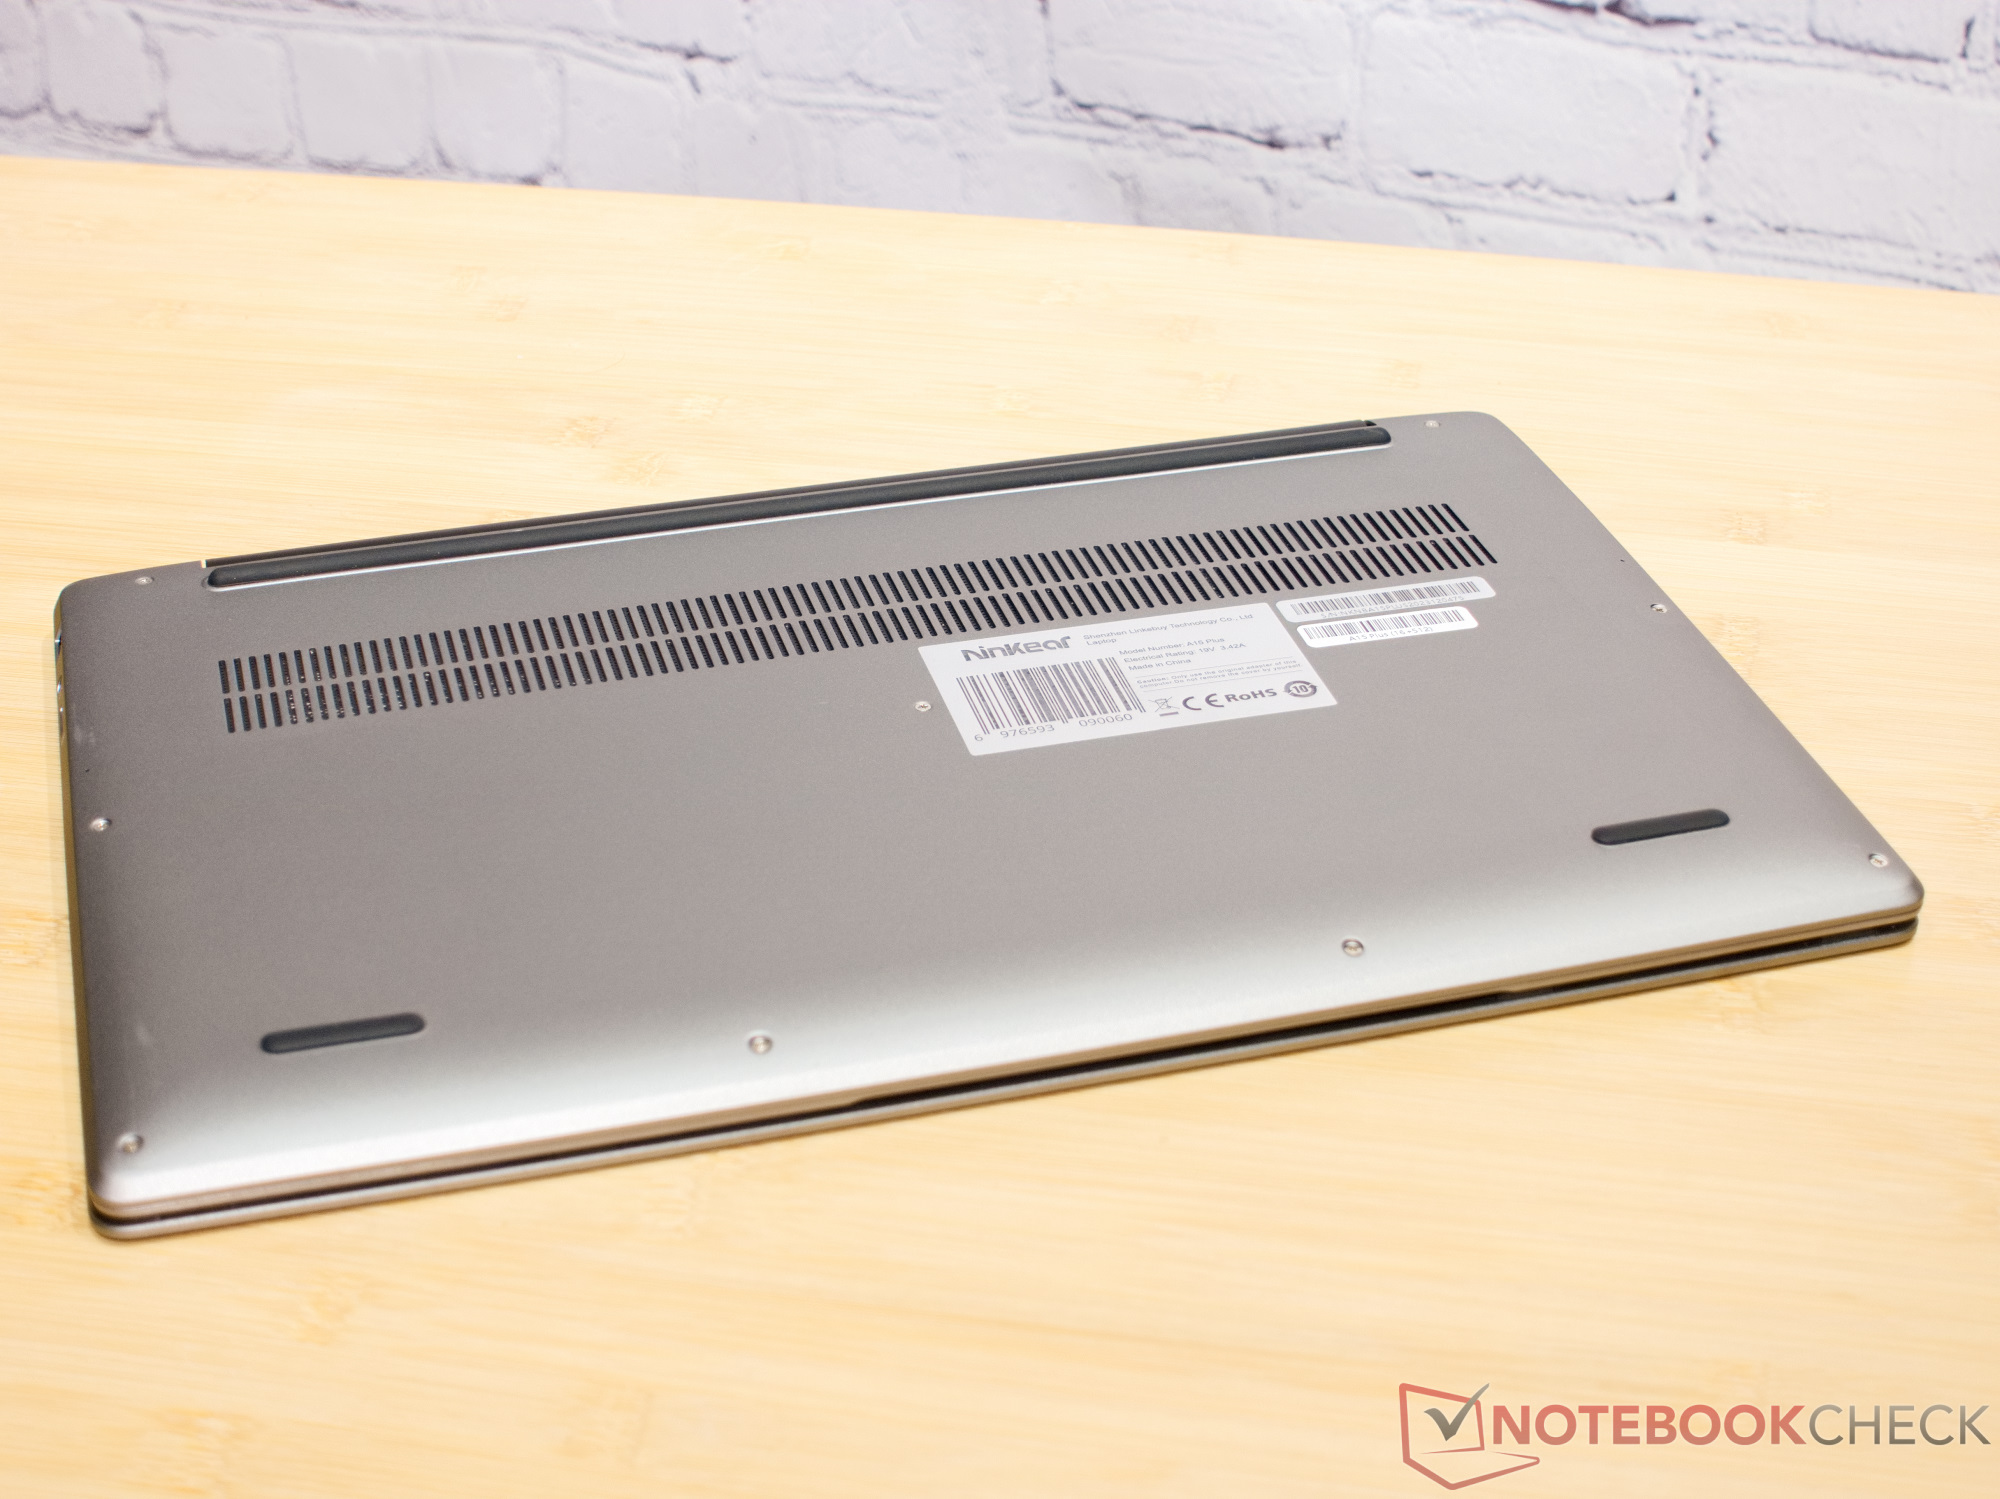
Manutenção, garantia e escopo de fornecimento
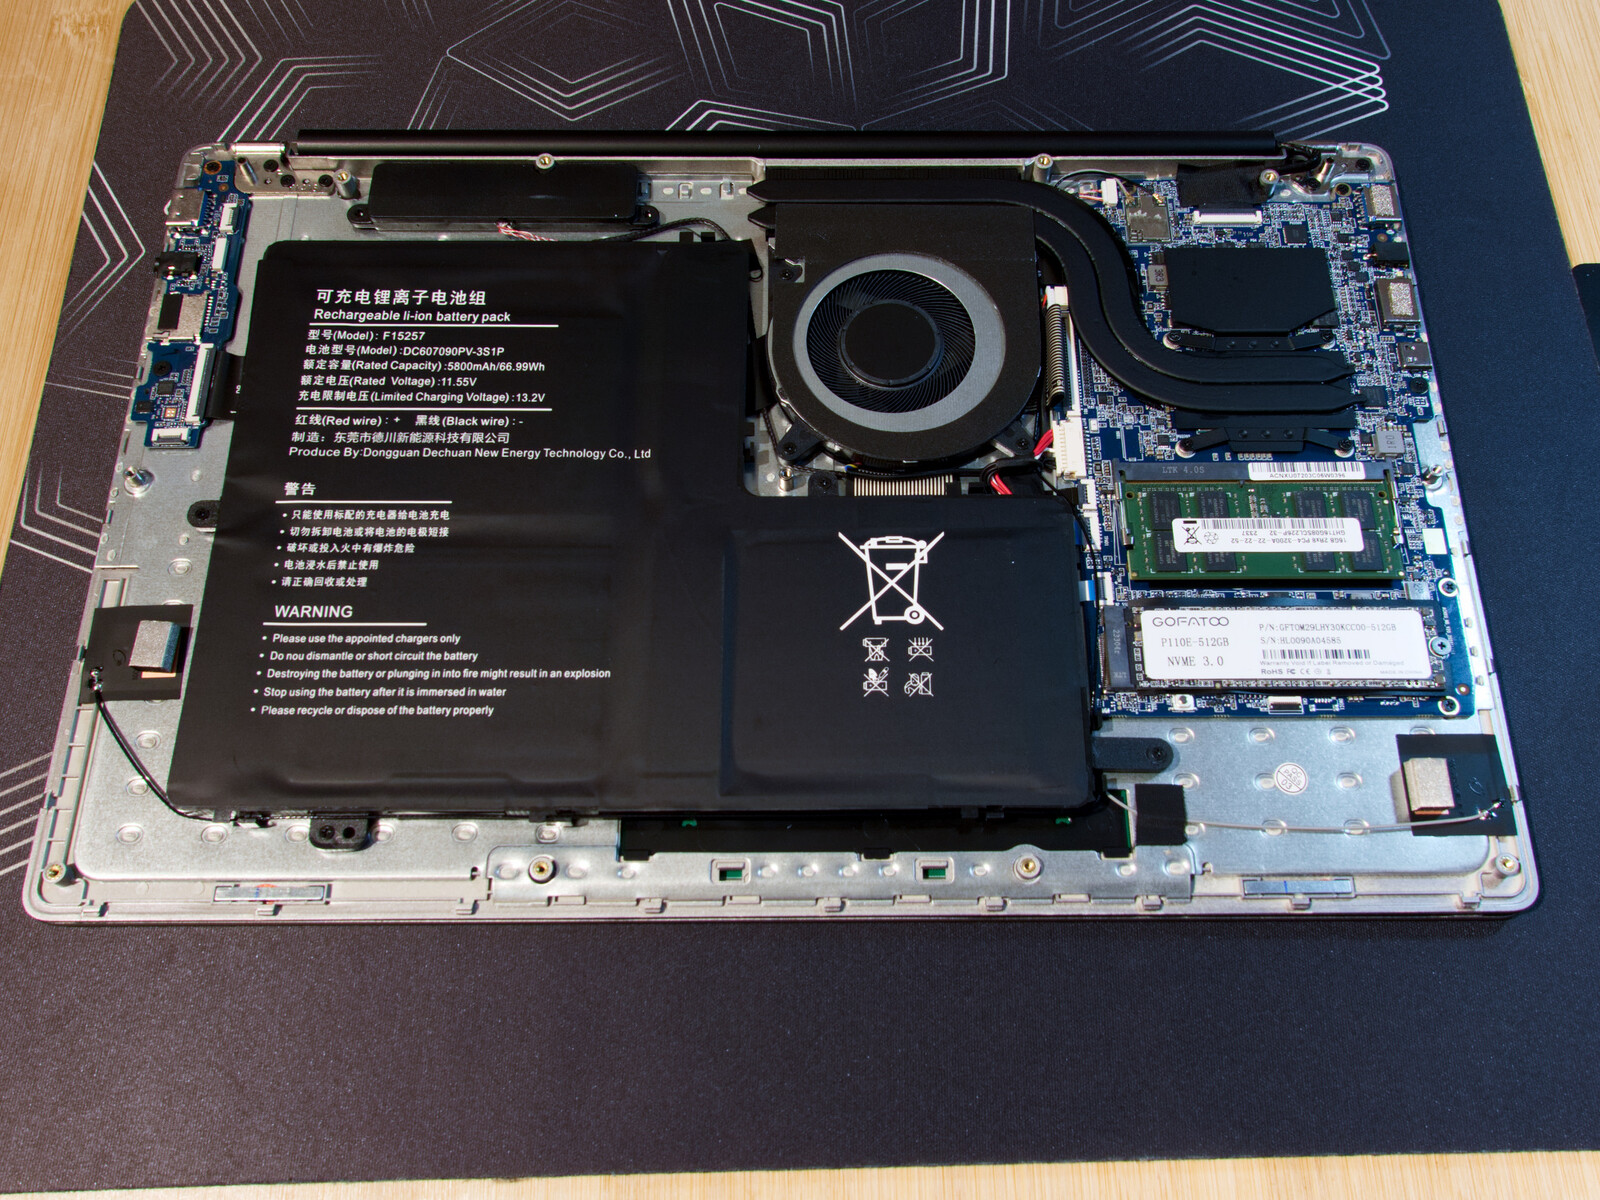
Onze parafusos Phillips prendem a base de alumínio e podem ser facilmente removidos. Embaixo, encontramos RAM conectada e um SSD M.2 NVMe. Infelizmente, o lento módulo WLAN vem soldado. Dependendo do revendedor, o laptop vem com uma garantia de doze meses ou de dois anos.
Nosso Ninkear A15 Plus veio com uma bolsa para laptop, um mouse USB e um mouse pad. Também foram incluídos adesivos para diferentes layouts de teclado.
Dispositivos de entrada: Ótimo teclado, touchpad ruim
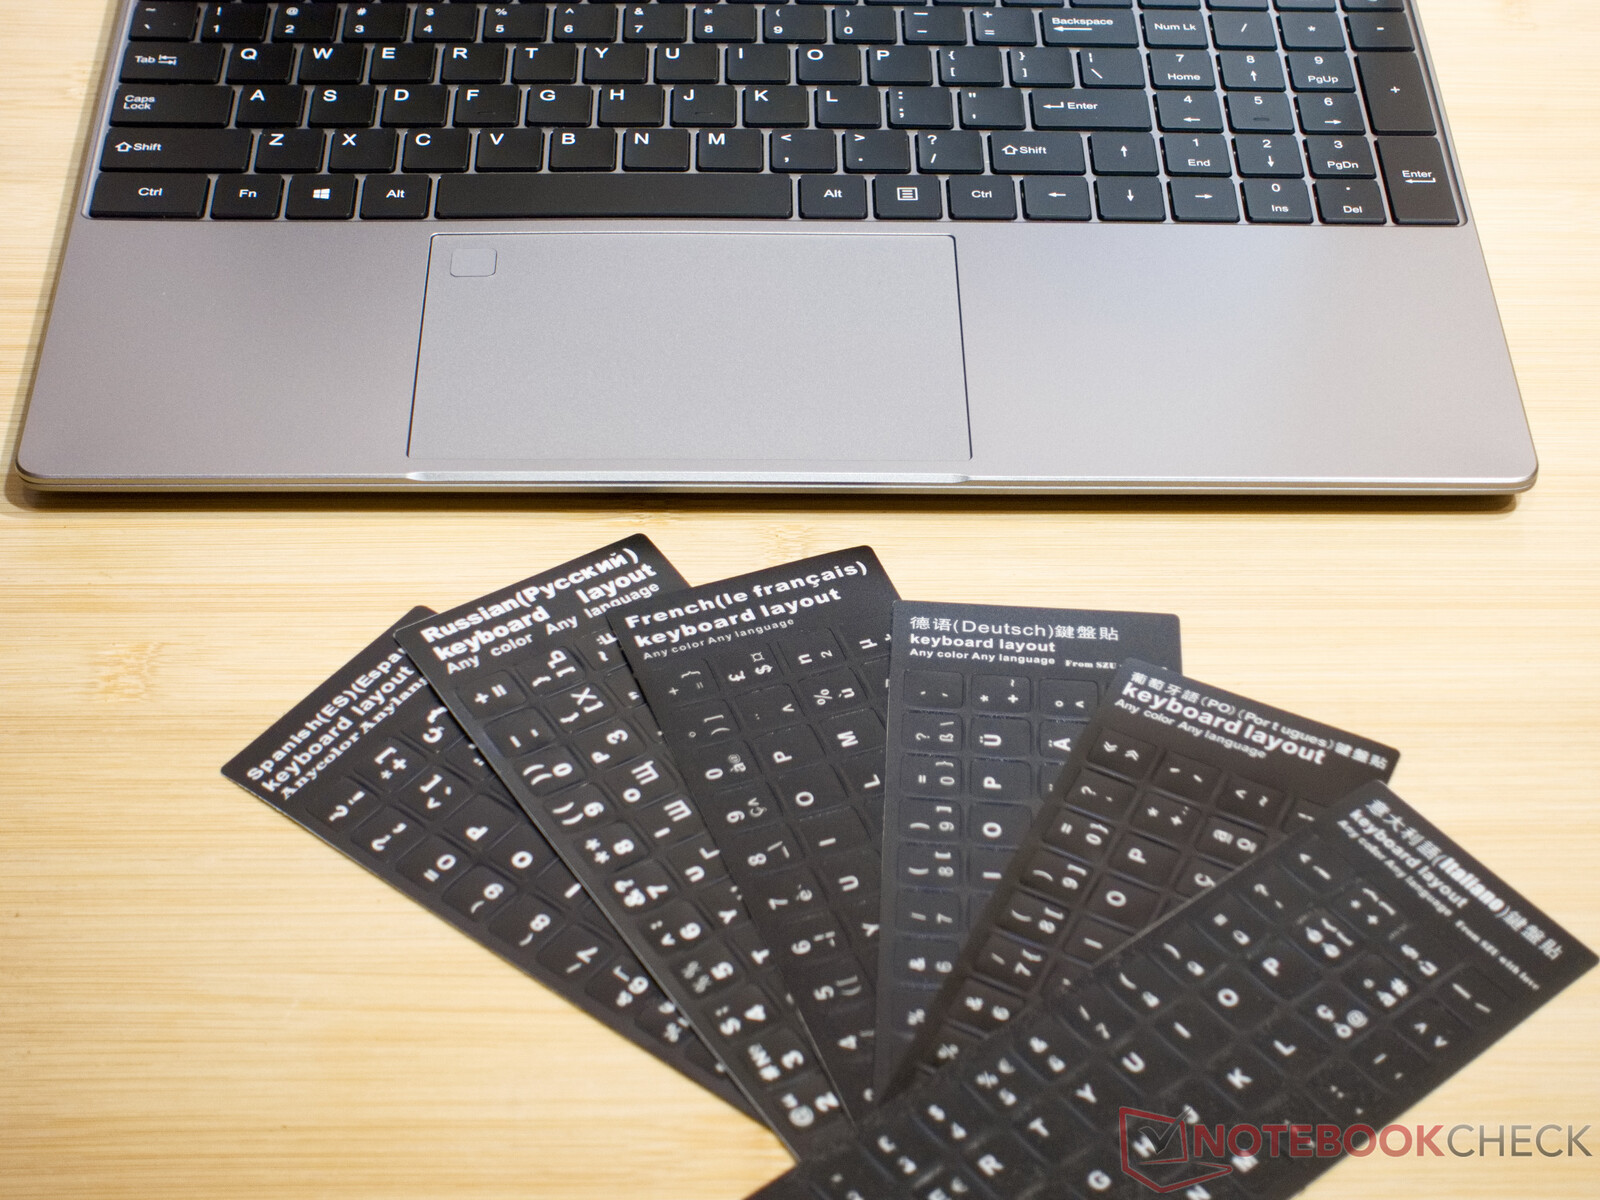
O teclado iluminado do Ninkear A15 Plus é muito bom. Ele vem com teclas de tamanho normal, inclusive o teclado numérico. O deslocamento das teclas de 1,4 mm é adequado e parece nítido. Infelizmente, o laptop só está disponível com um layout americano, ou seja, um teclado QWERTY no formato ANSI.
Isso significa que não é fácil mudar para o layout QWERTY no formato ISO. Embora o fabricante forneça adesivos de teclado para vários idiomas, o layout de teclado alemão tem uma tecla a mais do que o laptop oferece. Isso torna mais fácil se acostumar com o layout US International.
Embora o touchpad grande ofereça entrada multitoque, ele teve seus problemas com o pressionamento de teclas em nosso teste. Pode acontecer de o ponteiro do mouse saltar. Felizmente, o fabricante também oferece um mouse como alternativa. Além disso, o problema desapareceu após algumas atualizações, como descobrimos pouco antes da publicação da análise. O touchpad grande agora funciona perfeitamente.
Tela: IPS Full HD

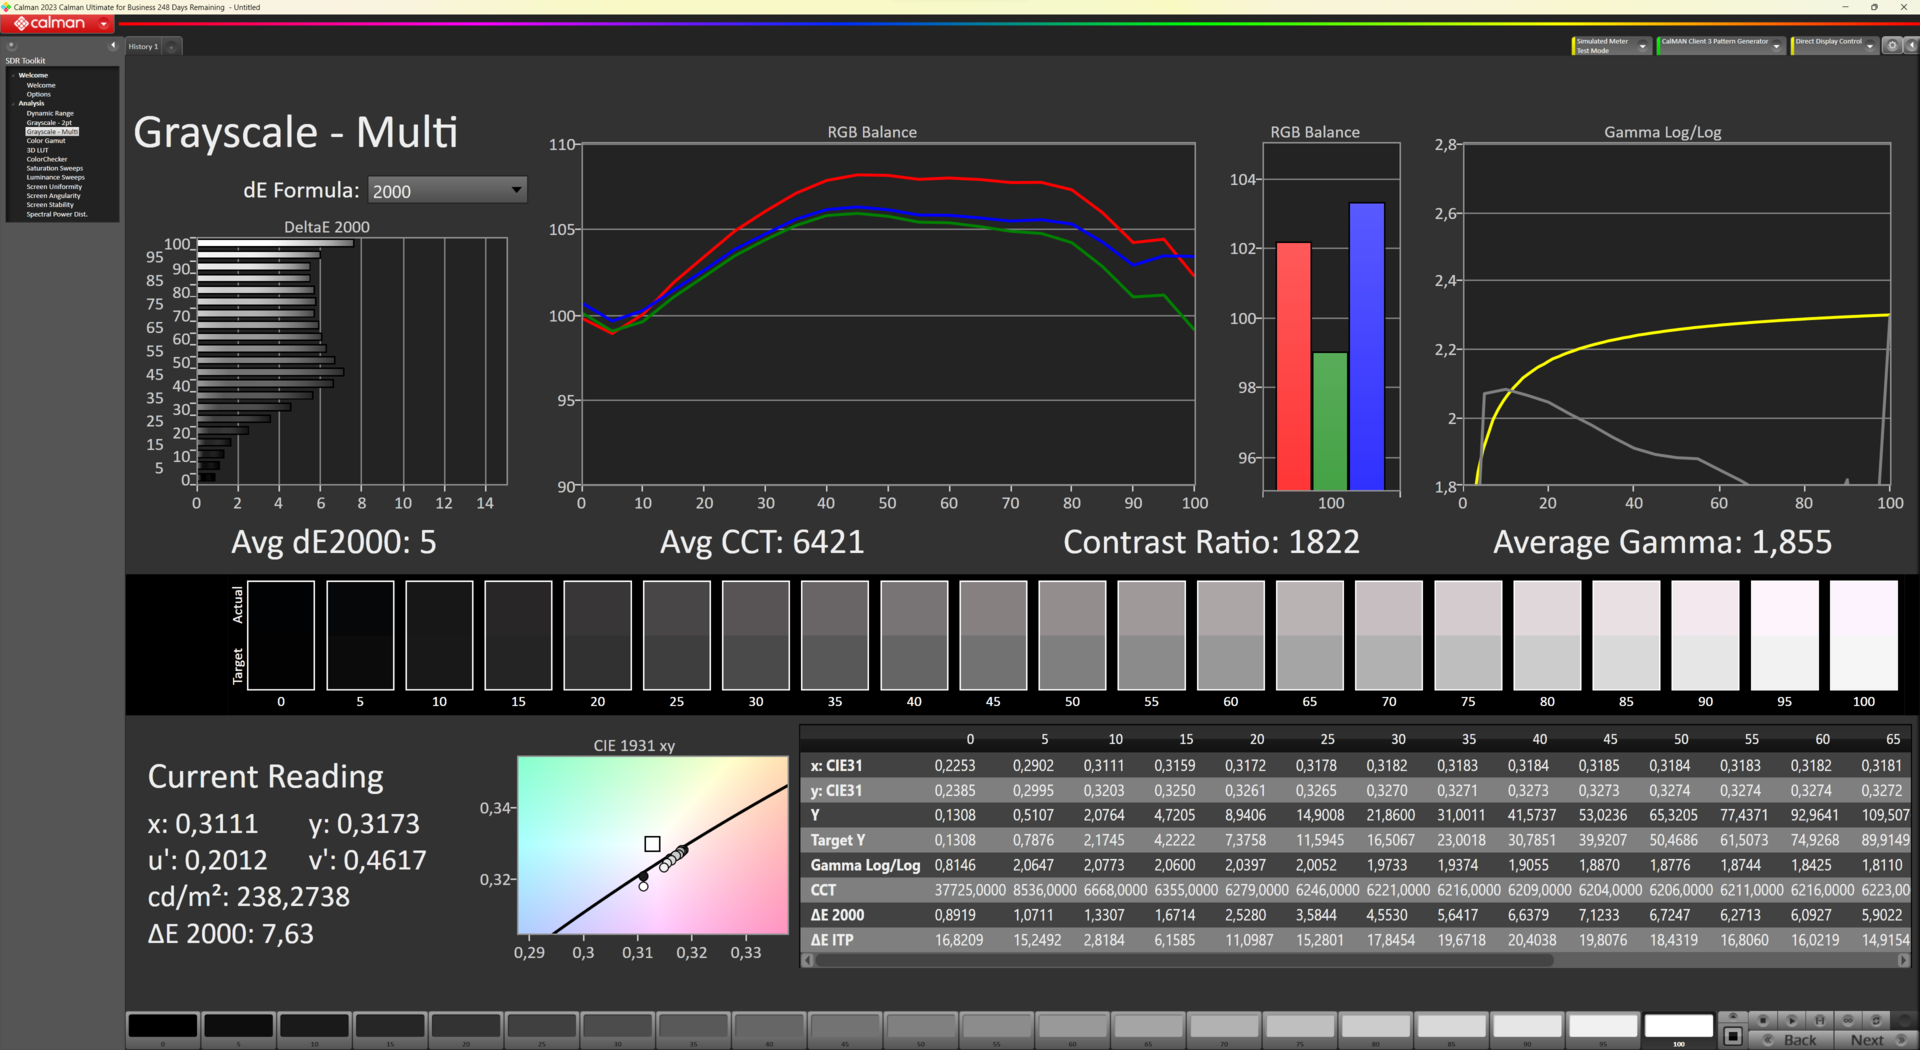
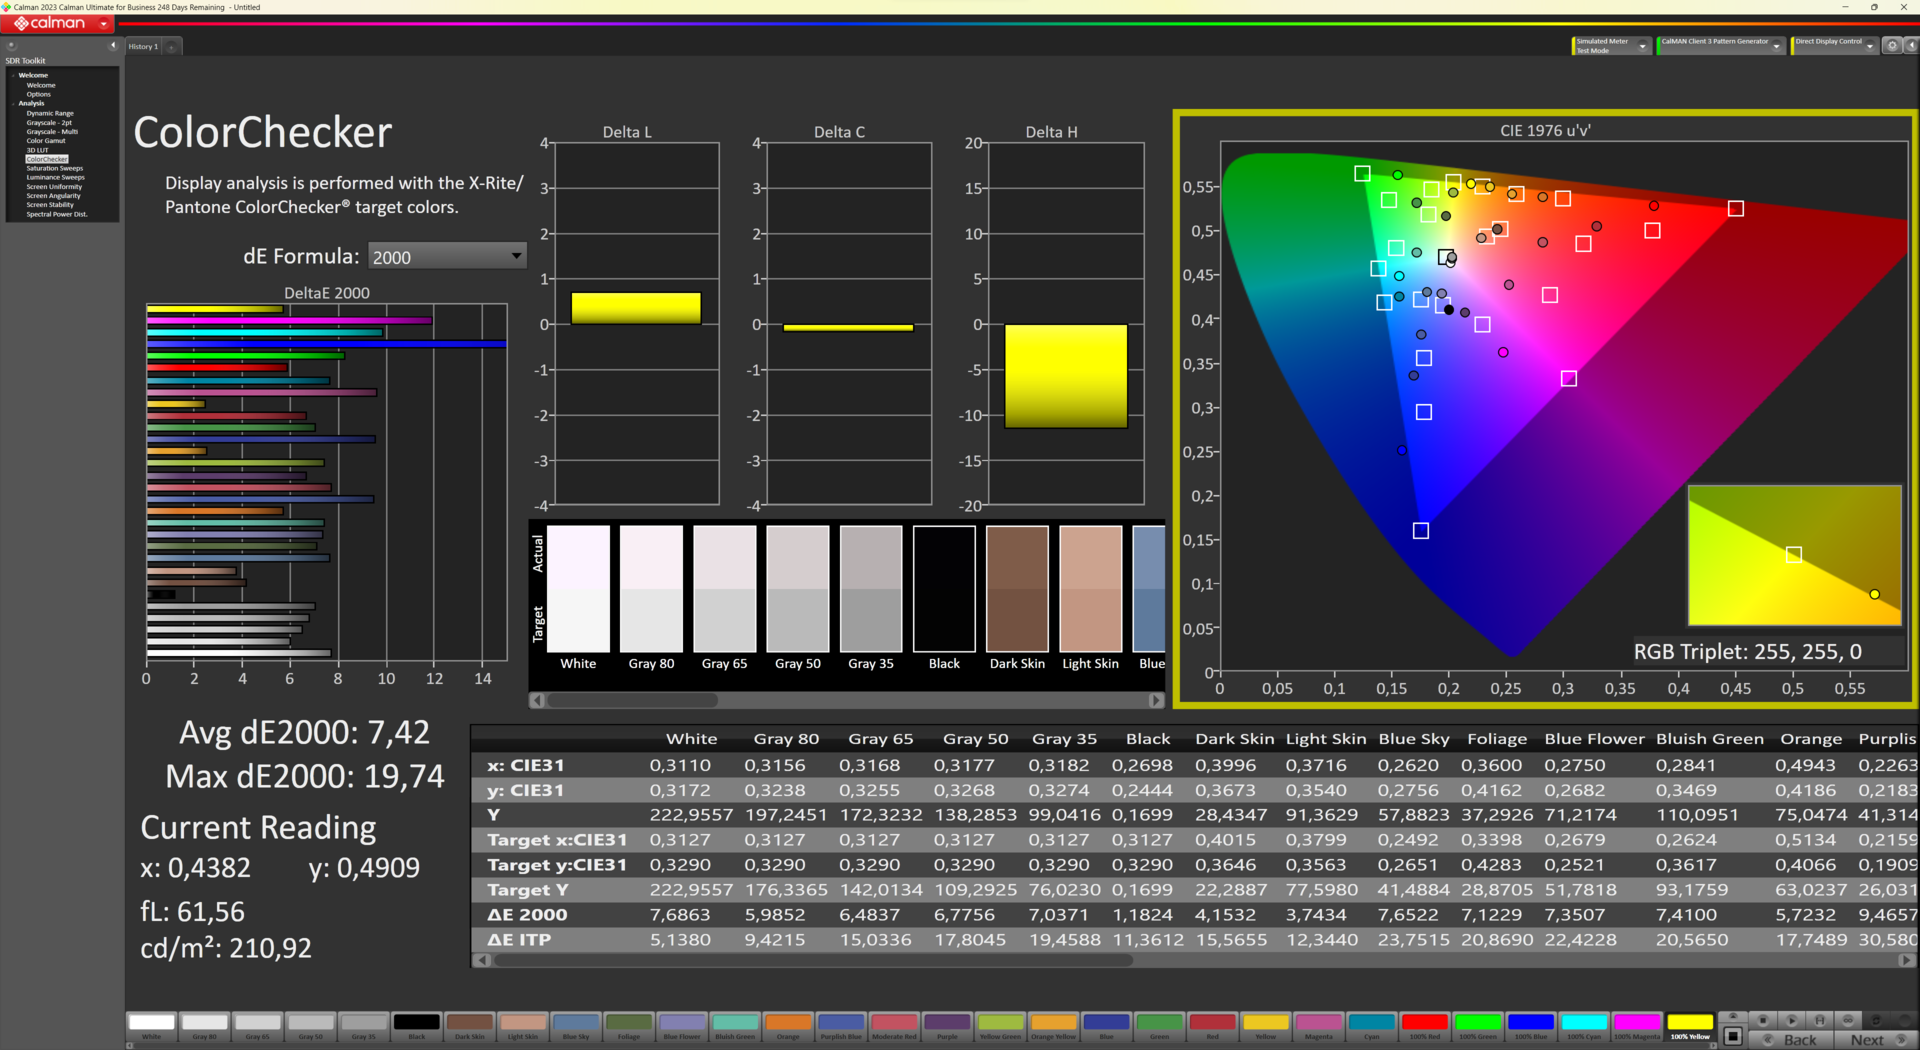
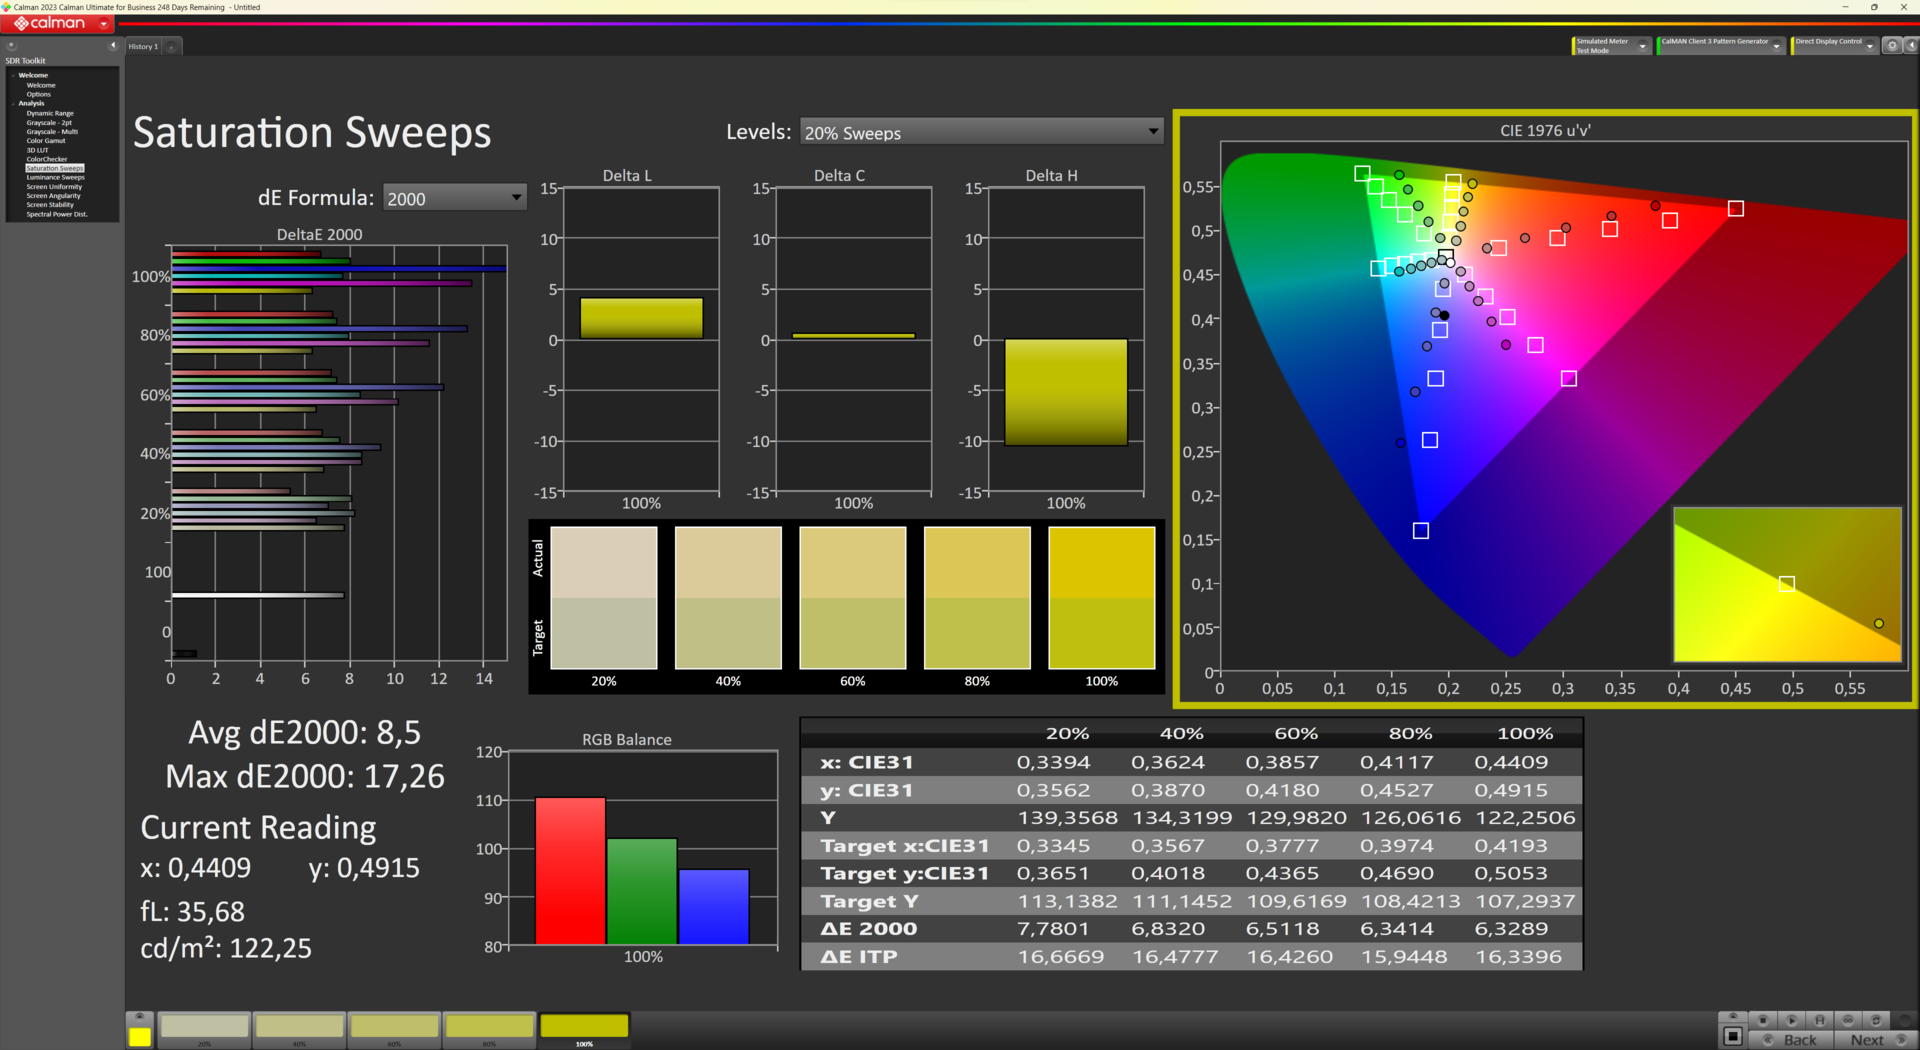
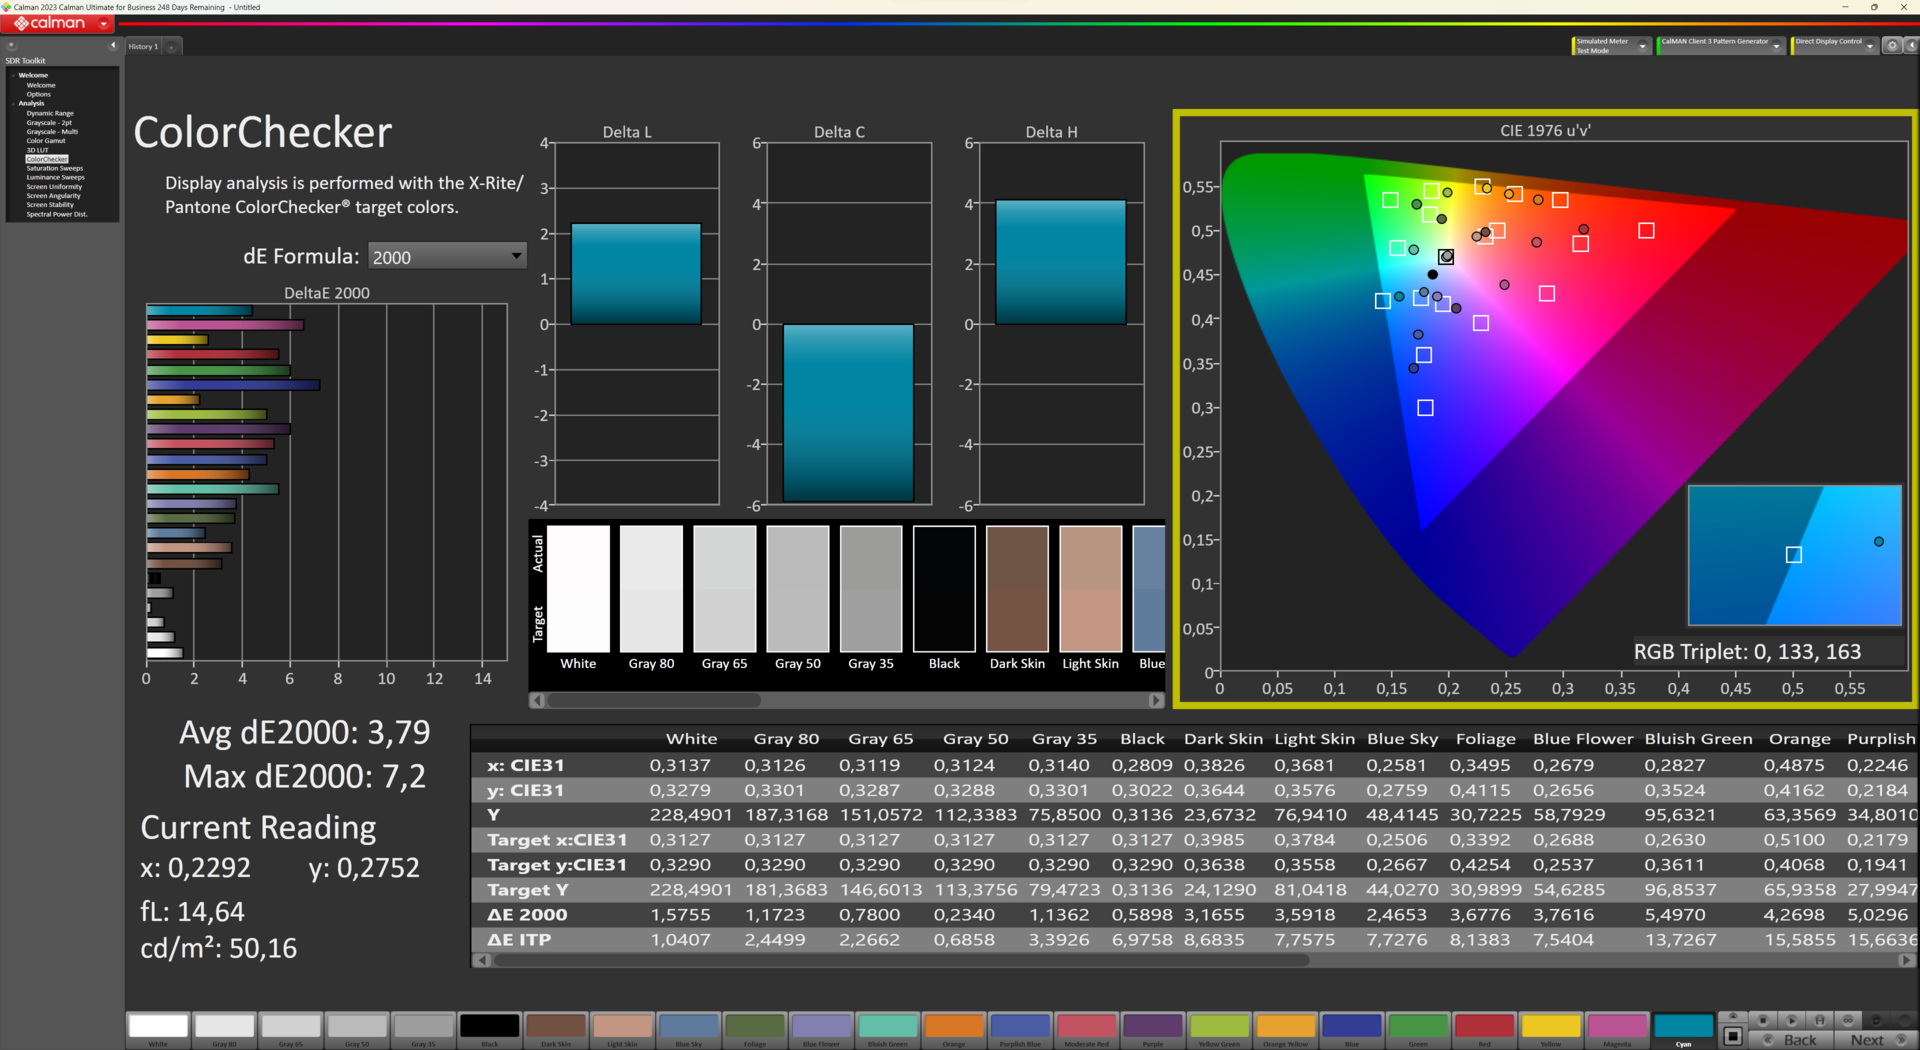
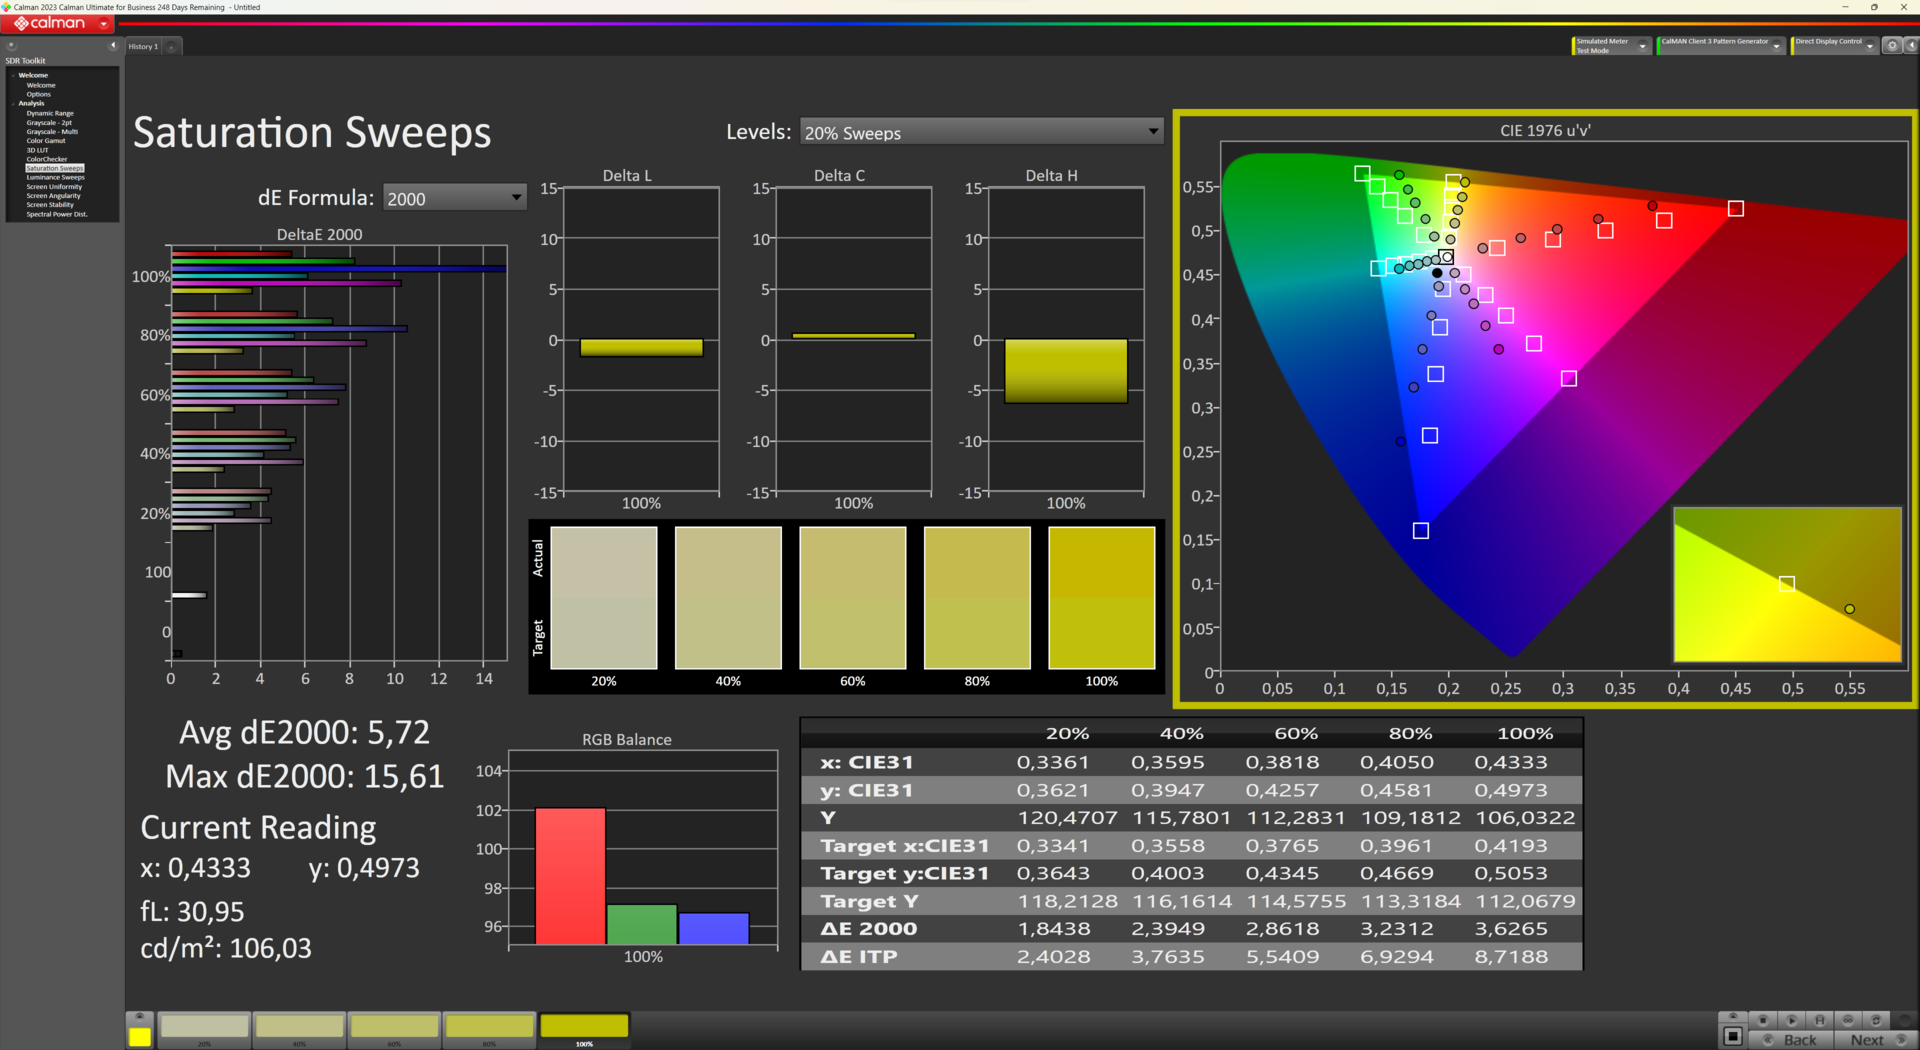
Com sua resolução Full HD a 60 Hz, a tela do Ninkear A15 Plus infelizmente não é adequada para nada além do uso básico em escritórios. A tela com pouca luz azul não é muito precisa em termos de cores e também deixa muito a desejar em termos de brilho. Não é possível atingir um brilho superior a 250 cd/m².
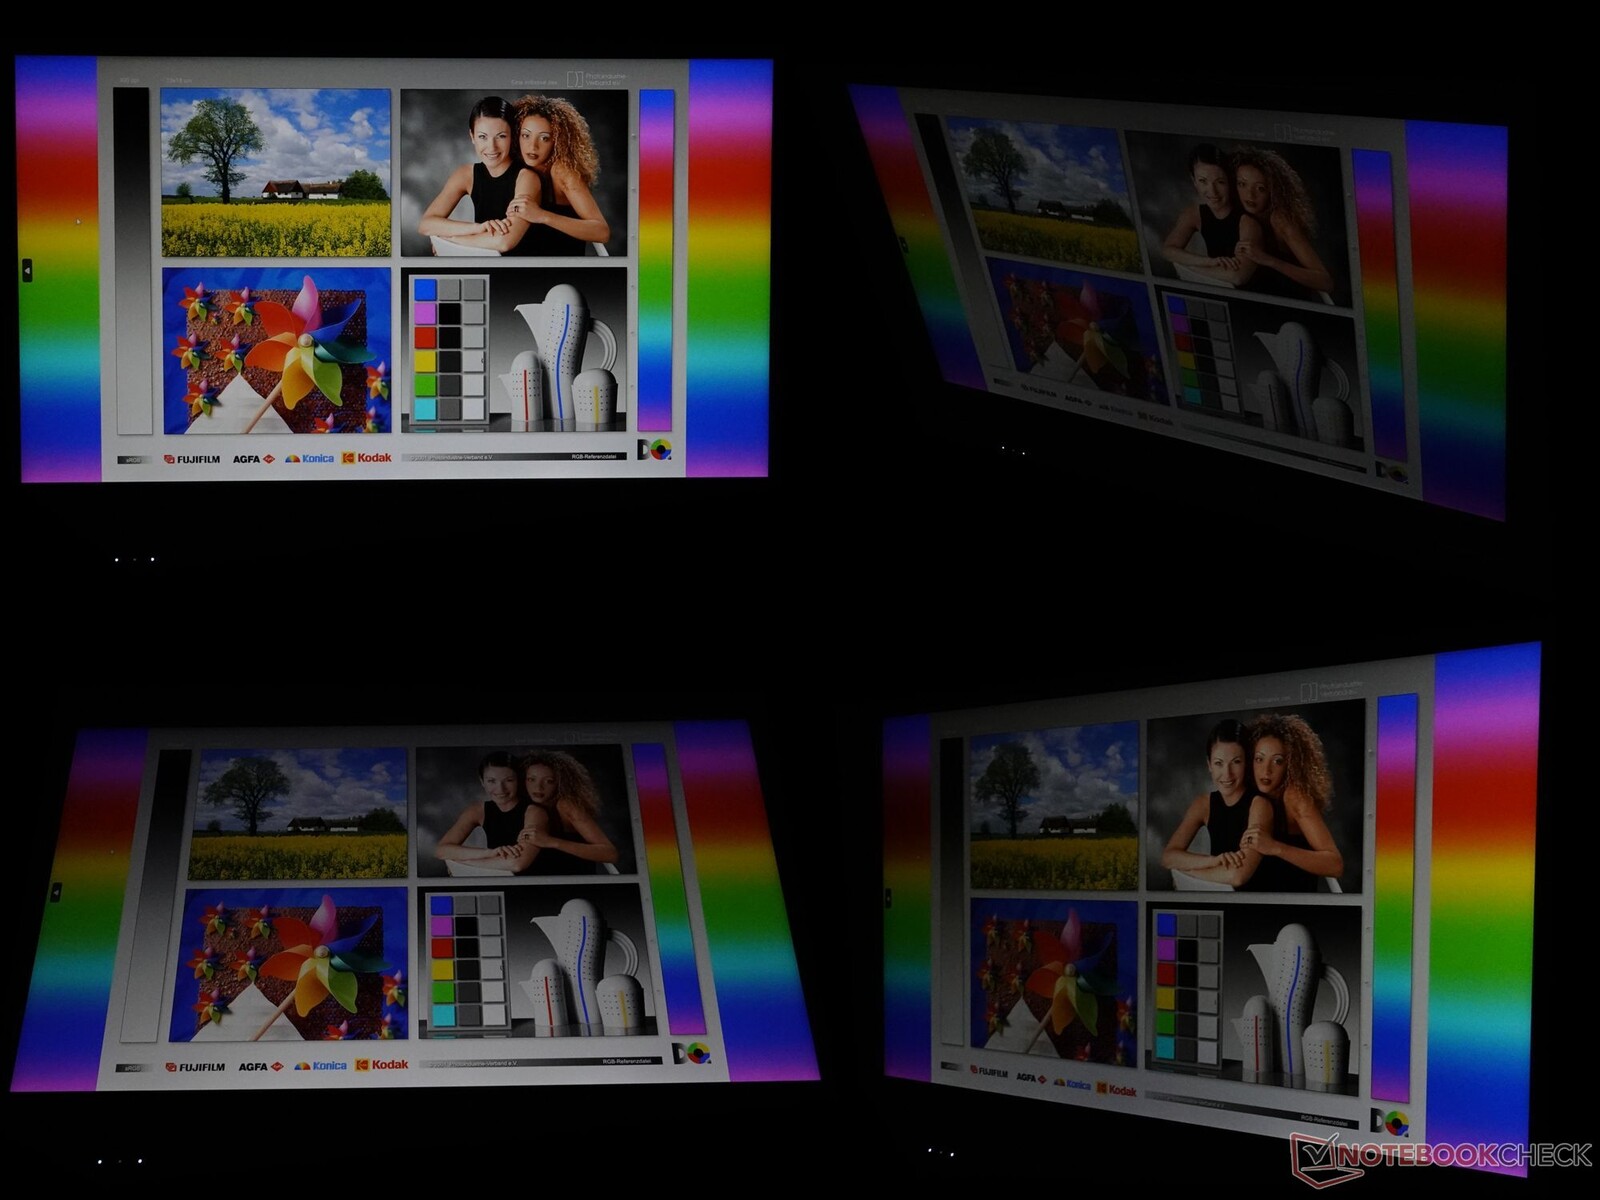
Entretanto, a tela não pisca, os tempos de resposta são bons e a iluminação do painel IPS com ângulo de visão estável é relativamente uniforme. Subjetivamente, a qualidade da imagem da tela do laptop é boa. No entanto, o dispositivo não é indubitavelmente adequado para uso profissional como designer gráfico.
| |||||||||||||||||||||||||
iluminação: 89 %
iluminação com acumulador: 250 cd/m²
Contraste: 1601:1 (Preto: 0.1587 cd/m²)
ΔE ColorChecker Calman: 7.42 | ∀{0.5-29.43 Ø4.71}
calibrated: 5.72
ΔE Greyscale Calman: 5 | ∀{0.09-98 Ø4.96}
40.34% AdobeRGB 1998 (Argyll 3D)
58.06% sRGB (Argyll 3D)
39.04% Display P3 (Argyll 3D)
Gamma: 1.855
CCT: 6421 K
| Ninkear A15 Plus (16+512) HKC023D, IPS, 1920x1080, 15.6" | Lenovo IdeaPad 5 Pro 16ARH7 AUO B160QAN02.H, IPS, 2560x1600, 16" | Eurocom C315 Blitz BOE HF NE156QUM-N64, IPS, 3840x2160, 15.6" | Schenker VIA 15 Pro M22 NE156QHM-NY2, IPS, 2560x1440, 15.6" | HP 250 G9 7N029ES CMN1538, IPS, 1920x1080, 15.6" | Asus P1511CEA-BQ753R Chi Mei N156HCA-EAB, IPS, 1920x1080, 15.6" | |
|---|---|---|---|---|---|---|
| Display | 67% | 71% | 70% | 11% | 10% | |
| Display P3 Coverage (%) | 39.04 | 65 66% | 67.7 73% | 67.5 73% | 43.3 11% | 42.8 10% |
| sRGB Coverage (%) | 58.06 | 98 69% | 96.5 66% | 97.1 67% | 64.8 12% | 64.1 10% |
| AdobeRGB 1998 Coverage (%) | 40.34 | 67.2 67% | 69.8 73% | 68.5 70% | 44.7 11% | 44.3 10% |
| Response Times | 47% | -134% | 38% | -41% | -48% | |
| Response Time Grey 50% / Grey 80% * (ms) | 25 ? | 14.1 ? 44% | 54.4 ? -118% | 13.8 ? 45% | 31.9 ? -28% | 33 ? -32% |
| Response Time Black / White * (ms) | 14 ? | 7.1 ? 49% | 34.8 ? -149% | 9.8 ? 30% | 21.6 ? -54% | 23 ? -64% |
| PWM Frequency (Hz) | ||||||
| Screen | 30% | 12% | 12% | 14% | -22% | |
| Brightness middle (cd/m²) | 254 | 415 63% | 262.5 3% | 354 39% | 281 11% | 269 6% |
| Brightness (cd/m²) | 244 | 409 68% | 260 7% | 331 36% | 257 5% | 250 2% |
| Brightness Distribution (%) | 89 | 91 2% | 85 -4% | 80 -10% | 82 -8% | 85 -4% |
| Black Level * (cd/m²) | 0.1587 | 0.32 -102% | 0.25 -58% | 0.41 -158% | 0.16 -1% | 0.67 -322% |
| Contrast (:1) | 1601 | 1297 -19% | 1050 -34% | 863 -46% | 1756 10% | 401 -75% |
| Colorchecker dE 2000 * | 7.42 | 1.92 74% | 3.34 55% | 2.4 68% | 4.7 37% | 3.81 49% |
| Colorchecker dE 2000 max. * | 19.74 | 5.71 71% | 7.72 61% | 6.4 68% | 18 9% | 7.34 63% |
| Colorchecker dE 2000 calibrated * | 5.72 | 0.58 90% | 0.91 84% | 1.4 76% | 3.7 35% | 3.91 32% |
| Greyscale dE 2000 * | 5 | 3.7 26% | 5.3 -6% | 3.2 36% | 3.6 28% | 2.46 51% |
| Gamma | 1.855 119% | 2.272 97% | 2.25 98% | 2.08 106% | 2.2 100% | 6451 0% |
| CCT | 6421 101% | 7132 91% | 7387 88% | 6786 96% | 7267 89% | 6451 101% |
| Média Total (Programa/Configurações) | 48% /
41% | -17% /
4% | 40% /
28% | -5% /
6% | -20% /
-19% |
* ... menor é melhor
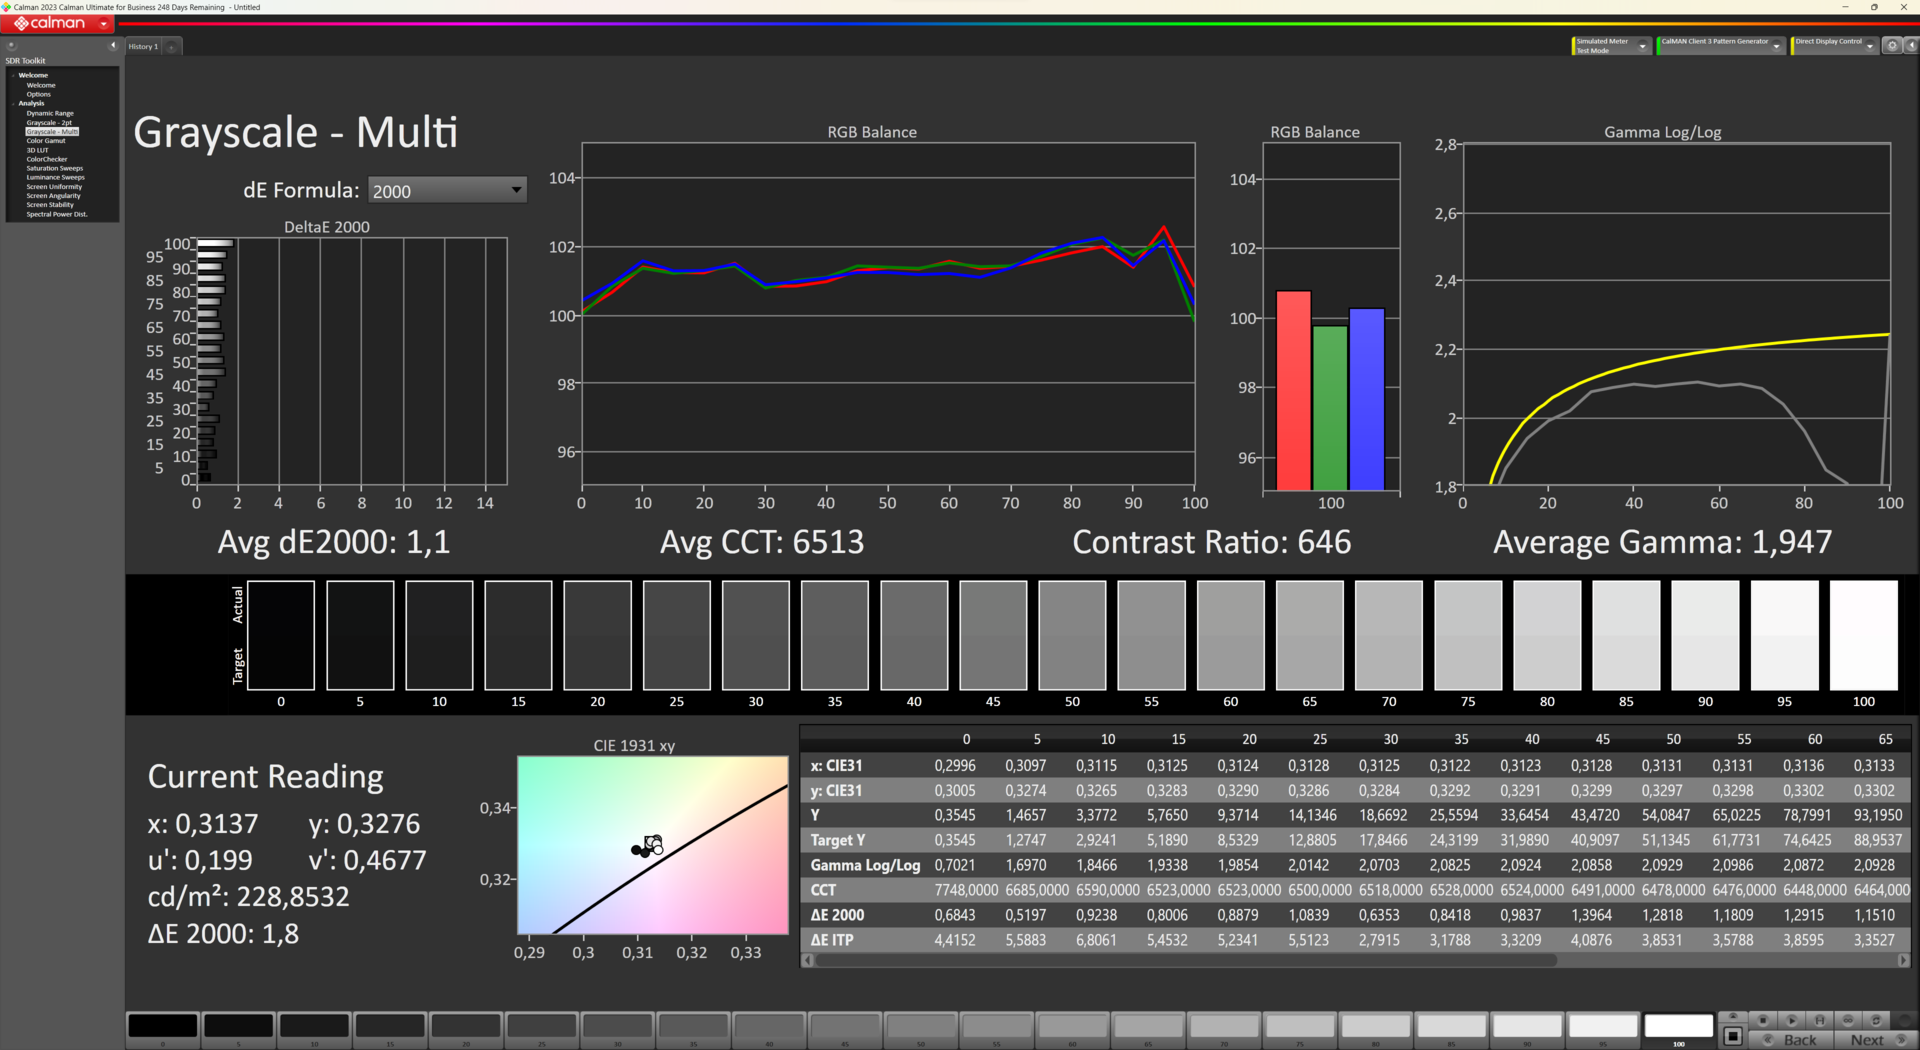
A tela do Ninkear A15 Plus tem baixa emissão de luz azul, mas, por isso, apresenta uma leve tonalidade vermelha quando sai da caixa. Os valores médios do ColorChecker DeltaE 2000 melhoram um pouco após a calibração com nosso espectrofotômetro X-Rite i1Pro 3 e o software de calibração de cores Calman Ultimate da Portrait Displays.
Exibir tempos de resposta
| ↔ Tempo de resposta preto para branco | ||
|---|---|---|
| 14 ms ... ascensão ↗ e queda ↘ combinadas | ↗ 6.5 ms ascensão |  |
| ↘ 7.5 ms queda | ||
| A tela mostra boas taxas de resposta em nossos testes, mas pode ser muito lenta para jogadores competitivos. Em comparação, todos os dispositivos testados variam de 0.1 (mínimo) a 240 (máximo) ms. » 34 % de todos os dispositivos são melhores. Isso significa que o tempo de resposta medido é melhor que a média de todos os dispositivos testados (19.8 ms). | ||
| ↔ Tempo de resposta 50% cinza a 80% cinza | ||
| 25 ms ... ascensão ↗ e queda ↘ combinadas | ↗ 15.5 ms ascensão |  |
| ↘ 9.5 ms queda | ||
| A tela mostra taxas de resposta relativamente lentas em nossos testes e pode ser muito lenta para os jogadores. Em comparação, todos os dispositivos testados variam de 0.165 (mínimo) a 636 (máximo) ms. » 35 % de todos os dispositivos são melhores. Isso significa que o tempo de resposta medido é melhor que a média de todos os dispositivos testados (31 ms). | ||
Cintilação da tela / PWM (modulação por largura de pulso)
| Tela tremeluzindo / PWM não detectado |  | ||
[pwm_comparison] Em comparação: 52 % de todos os dispositivos testados não usam PWM para escurecer a tela. Se PWM foi detectado, uma média de 7754 (mínimo: 5 - máximo: 343500) Hz foi medida. | |||
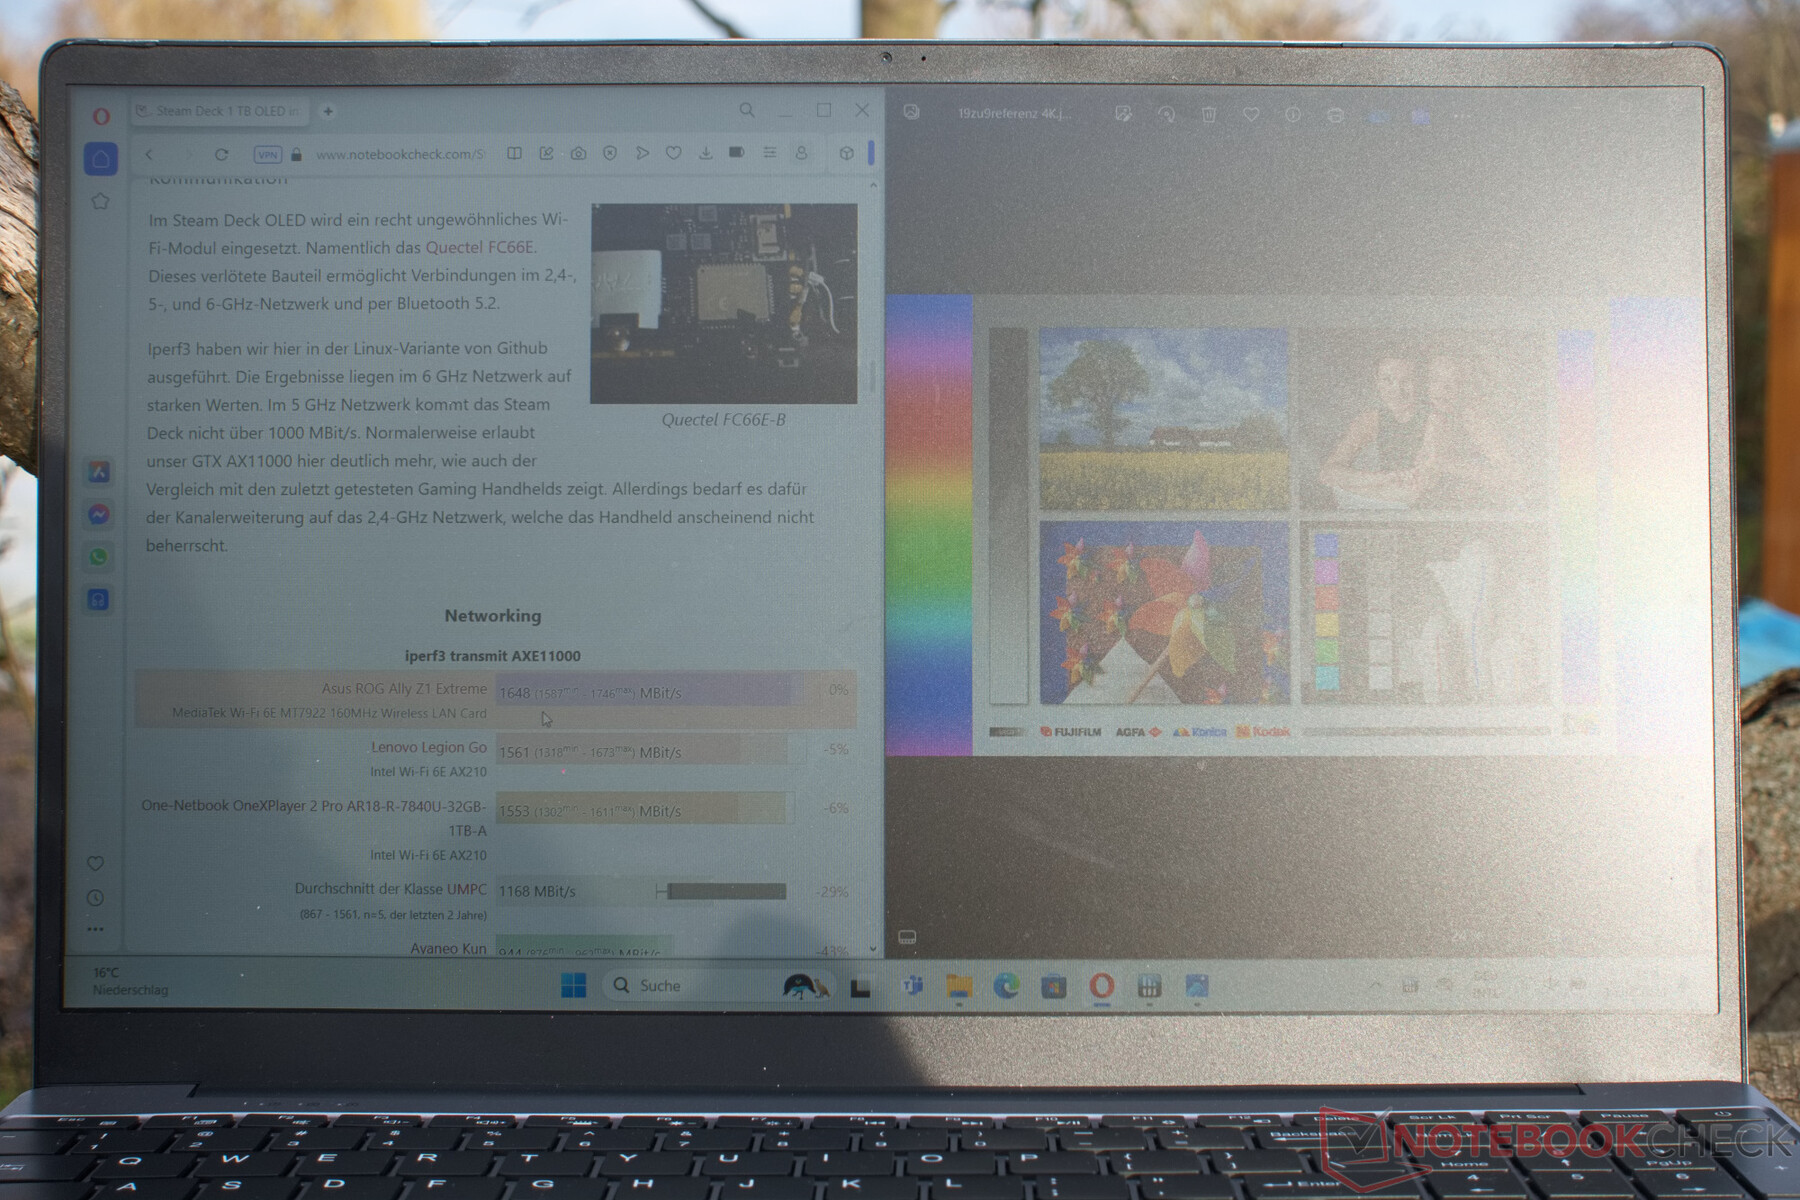
Graças à superfície fosca da tela e ao bom contraste, o laptop pode ser usado em ambientes externos até certo ponto.
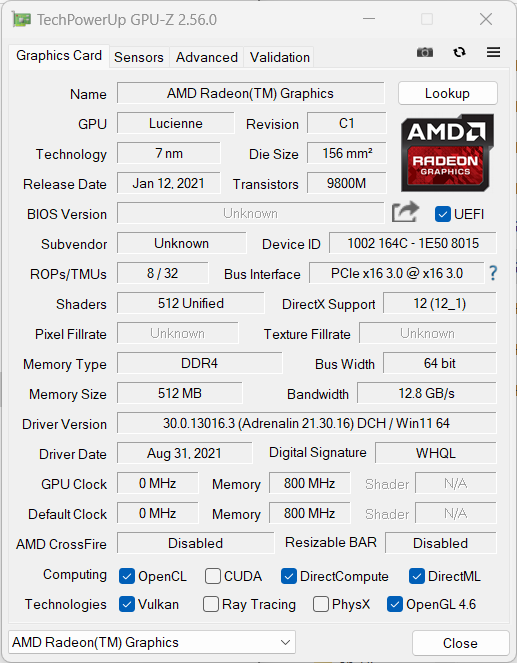
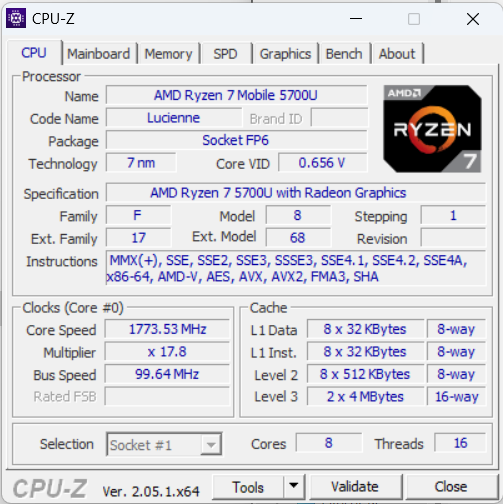
Desempenho: Adequado para uso diário, apesar do Ryzen 7 de baixa potência
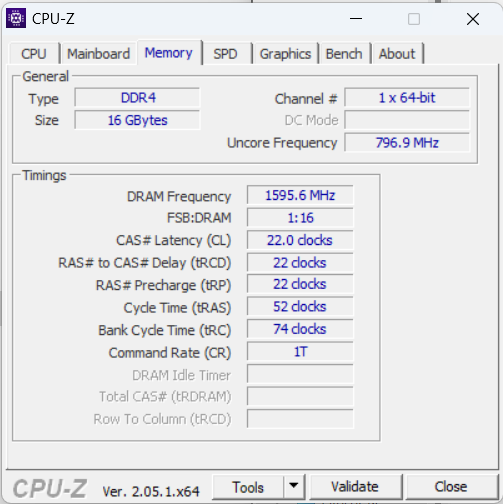
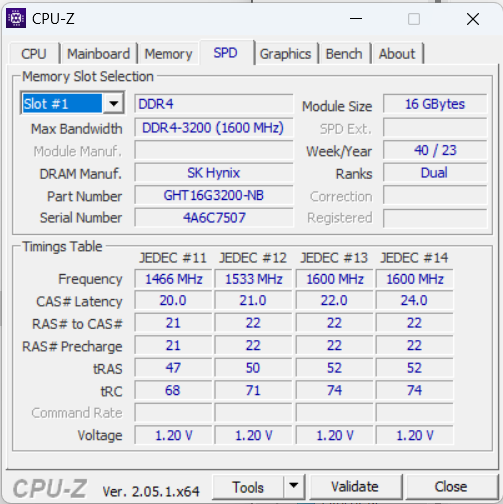
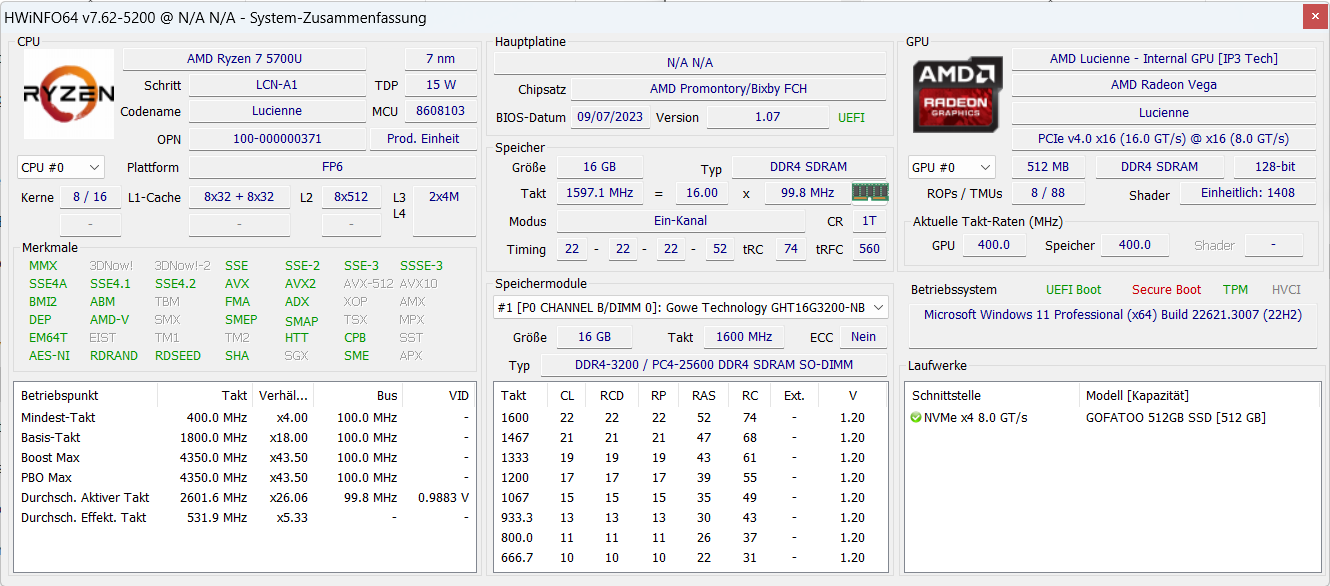
O AMD Ryzen 7 5700U é mais um silício antigo, mas com 8 núcleos Zen 2 e 16 threads, o processador ainda pode oferecer um desempenho impressionante. Nosso dispositivo de teste também vem com 16 GB de RAM.
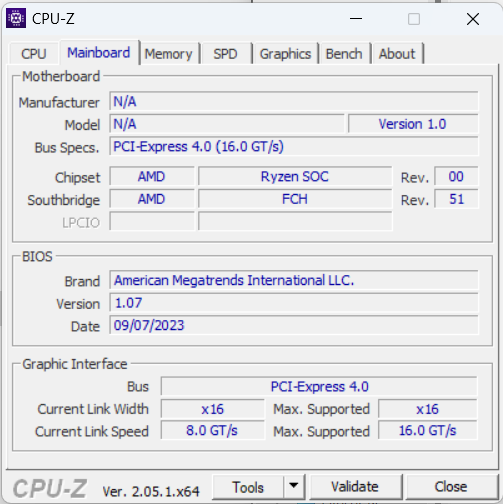
O Ninkear A15 Plus também está disponível em uma configuração com 32 GB de RAM DDR 4. Ele está conectado. No entanto, o dispositivo de teste só tem espaço para um SO-DIMM. Portanto, trata-se de uma configuração de canal único.
Condições de teste
A Ninkear não instala nenhum software de controle de desempenho, portanto, o único controle de desempenho possível é por meio dos níveis oferecidos pelo Windows. Testamos o laptop no modo "Melhor desempenho". O Ryzen 7 5700U é fornecido com 30 W de potência de impulso e 15 W de potência contínua. Ambos os valores são relativamente baixos em comparação. Mas, devido ao baixo TDP, o laptop geralmente pode funcionar silenciosamente ou muito silenciosamente.
Processador
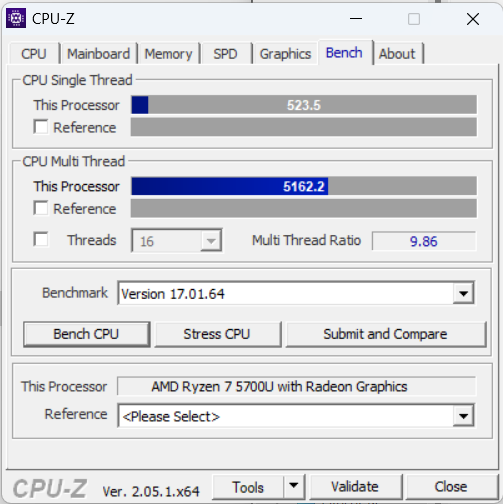
Os notebooks na faixa de preço de 500 euros geralmente vêm com um processador Intel Core i3 ou Ryzen 3. Alguns até vêm apenas com um processador Intel série N. O Ryzen 7 5700U no Ninkear A15 Plus é, portanto, significativamente mais potente, embora funcione com um TDP comparativamente baixo.
Por outro lado, o laptop permanece muito silencioso e o desempenho do processador é mais do que suficiente para o uso diário com navegação, streaming e trabalho de escritório. O desempenho de vários núcleos do processador AMD ainda é muito relevante e também pode competir com outros processadores como o Intel Core i7-1360Pembora fique muito atrás do novo Intel Core Ultra 7 155H.
Cinebench R15 Multi Loop test
Cinebench R23: Multi Core | Single Core
Cinebench R20: CPU (Multi Core) | CPU (Single Core)
Cinebench R15: CPU Multi 64Bit | CPU Single 64Bit
Blender: v2.79 BMW27 CPU
7-Zip 18.03: 7z b 4 | 7z b 4 -mmt1
Geekbench 6.7: Multi-Core | Single-Core
Geekbench 5.5: Multi-Core | Single-Core
HWBOT x265 Benchmark v2.2: 4k Preset
LibreOffice : 20 Documents To PDF
R Benchmark 2.5: Overall mean
| CPU Performance rating | |
| Asus ZenBook 14 UX3405MA | |
| Média da turma Office | |
| Lenovo IdeaPad 5 Pro 16ARH7 -2! | |
| Eurocom C315 Blitz | |
| Schenker VIA 15 Pro M22 -2! | |
| Ninkear A15 Plus (16+512) | |
| Média AMD Ryzen 7 5700U | |
| HP 250 G9 7N029ES | |
| Asus P1511CEA-BQ753R -2! | |
| Cinebench R23 / Multi Core | |
| Asus ZenBook 14 UX3405MA | |
| Média da turma Office (1673 - 22808, n=76, últimos 2 anos) | |
| Schenker VIA 15 Pro M22 | |
| Lenovo IdeaPad 5 Pro 16ARH7 | |
| Ninkear A15 Plus (16+512) | |
| Média AMD Ryzen 7 5700U (4861 - 10139, n=20) | |
| Eurocom C315 Blitz | |
| HP 250 G9 7N029ES | |
| Asus P1511CEA-BQ753R | |
| Cinebench R23 / Single Core | |
| Asus ZenBook 14 UX3405MA | |
| Média da turma Office (708 - 2130, n=76, últimos 2 anos) | |
| Eurocom C315 Blitz | |
| Lenovo IdeaPad 5 Pro 16ARH7 | |
| HP 250 G9 7N029ES | |
| Asus P1511CEA-BQ753R | |
| Ninkear A15 Plus (16+512) | |
| Schenker VIA 15 Pro M22 | |
| Média AMD Ryzen 7 5700U (1177 - 1268, n=20) | |
| Cinebench R20 / CPU (Multi Core) | |
| Asus ZenBook 14 UX3405MA | |
| Média da turma Office (648 - 8840, n=75, últimos 2 anos) | |
| Lenovo IdeaPad 5 Pro 16ARH7 | |
| Schenker VIA 15 Pro M22 | |
| Ninkear A15 Plus (16+512) | |
| Média AMD Ryzen 7 5700U (1887 - 3877, n=21) | |
| Eurocom C315 Blitz | |
| HP 250 G9 7N029ES | |
| Asus P1511CEA-BQ753R | |
| Cinebench R20 / CPU (Single Core) | |
| Asus ZenBook 14 UX3405MA | |
| Média da turma Office (345 - 816, n=75, últimos 2 anos) | |
| Eurocom C315 Blitz | |
| Lenovo IdeaPad 5 Pro 16ARH7 | |
| HP 250 G9 7N029ES | |
| Asus P1511CEA-BQ753R | |
| Ninkear A15 Plus (16+512) | |
| Schenker VIA 15 Pro M22 | |
| Média AMD Ryzen 7 5700U (471 - 495, n=21) | |
| Cinebench R15 / CPU Multi 64Bit | |
| Asus ZenBook 14 UX3405MA | |
| Média da turma Office (250 - 3380, n=77, últimos 2 anos) | |
| Schenker VIA 15 Pro M22 | |
| Lenovo IdeaPad 5 Pro 16ARH7 | |
| Ninkear A15 Plus (16+512) | |
| Média AMD Ryzen 7 5700U (856 - 1691, n=20) | |
| Eurocom C315 Blitz | |
| HP 250 G9 7N029ES | |
| Asus P1511CEA-BQ753R | |
| Cinebench R15 / CPU Single 64Bit | |
| Asus ZenBook 14 UX3405MA | |
| Média da turma Office (99.5 - 316, n=77, últimos 2 anos) | |
| Lenovo IdeaPad 5 Pro 16ARH7 | |
| Eurocom C315 Blitz | |
| HP 250 G9 7N029ES | |
| Ninkear A15 Plus (16+512) | |
| Schenker VIA 15 Pro M22 | |
| Asus P1511CEA-BQ753R | |
| Média AMD Ryzen 7 5700U (181 - 190, n=19) | |
| Blender / v2.79 BMW27 CPU | |
| Asus P1511CEA-BQ753R | |
| HP 250 G9 7N029ES | |
| Eurocom C315 Blitz | |
| Ninkear A15 Plus (16+512) | |
| Média AMD Ryzen 7 5700U (292 - 557, n=20) | |
| Média da turma Office (158 - 1940, n=76, últimos 2 anos) | |
| Lenovo IdeaPad 5 Pro 16ARH7 | |
| Schenker VIA 15 Pro M22 | |
| Asus ZenBook 14 UX3405MA | |
| 7-Zip 18.03 / 7z b 4 | |
| Asus ZenBook 14 UX3405MA | |
| Schenker VIA 15 Pro M22 | |
| Lenovo IdeaPad 5 Pro 16ARH7 | |
| Média da turma Office (7098 - 76886, n=77, últimos 2 anos) | |
| Média AMD Ryzen 7 5700U (29095 - 47501, n=20) | |
| Ninkear A15 Plus (16+512) | |
| Eurocom C315 Blitz | |
| HP 250 G9 7N029ES | |
| Asus P1511CEA-BQ753R | |
| 7-Zip 18.03 / 7z b 4 -mmt1 | |
| Eurocom C315 Blitz | |
| Asus ZenBook 14 UX3405MA | |
| Média da turma Office (3387 - 6469, n=77, últimos 2 anos) | |
| Lenovo IdeaPad 5 Pro 16ARH7 | |
| HP 250 G9 7N029ES | |
| Ninkear A15 Plus (16+512) | |
| Schenker VIA 15 Pro M22 | |
| Média AMD Ryzen 7 5700U (4402 - 4620, n=20) | |
| Asus P1511CEA-BQ753R | |
| Geekbench 6.7 / Multi-Core | |
| Asus ZenBook 14 UX3405MA | |
| Eurocom C315 Blitz | |
| Média da turma Office (757 - 17846, n=82, últimos 2 anos) | |
| Ninkear A15 Plus (16+512) | |
| Ninkear A15 Plus (16+512) | |
| Média AMD Ryzen 7 5700U (4983 - 6260, n=5) | |
| HP 250 G9 7N029ES | |
| Geekbench 6.7 / Single-Core | |
| Eurocom C315 Blitz | |
| Asus ZenBook 14 UX3405MA | |
| Média da turma Office (462 - 2988, n=83, últimos 2 anos) | |
| HP 250 G9 7N029ES | |
| Ninkear A15 Plus (16+512) | |
| Ninkear A15 Plus (16+512) | |
| Média AMD Ryzen 7 5700U (1550 - 1625, n=5) | |
| Geekbench 5.5 / Multi-Core | |
| Asus ZenBook 14 UX3405MA | |
| Média da turma Office (1483 - 16999, n=73, últimos 2 anos) | |
| Schenker VIA 15 Pro M22 | |
| Eurocom C315 Blitz | |
| Lenovo IdeaPad 5 Pro 16ARH7 | |
| Média AMD Ryzen 7 5700U (4254 - 7635, n=19) | |
| Ninkear A15 Plus (16+512) | |
| HP 250 G9 7N029ES | |
| Asus P1511CEA-BQ753R | |
| Geekbench 5.5 / Single-Core | |
| Eurocom C315 Blitz | |
| Média da turma Office (811 - 2175, n=73, últimos 2 anos) | |
| Asus ZenBook 14 UX3405MA | |
| HP 250 G9 7N029ES | |
| Lenovo IdeaPad 5 Pro 16ARH7 | |
| Asus P1511CEA-BQ753R | |
| Schenker VIA 15 Pro M22 | |
| Ninkear A15 Plus (16+512) | |
| Média AMD Ryzen 7 5700U (1105 - 1205, n=19) | |
| HWBOT x265 Benchmark v2.2 / 4k Preset | |
| Asus ZenBook 14 UX3405MA | |
| Média da turma Office (2.21 - 26, n=76, últimos 2 anos) | |
| Schenker VIA 15 Pro M22 | |
| Lenovo IdeaPad 5 Pro 16ARH7 | |
| Média AMD Ryzen 7 5700U (6.08 - 12.1, n=20) | |
| Ninkear A15 Plus (16+512) | |
| Eurocom C315 Blitz | |
| HP 250 G9 7N029ES | |
| Asus P1511CEA-BQ753R | |
| LibreOffice / 20 Documents To PDF | |
| Ninkear A15 Plus (16+512) | |
| Lenovo IdeaPad 5 Pro 16ARH7 | |
| Schenker VIA 15 Pro M22 | |
| Média AMD Ryzen 7 5700U (52.4 - 75.5, n=20) | |
| Asus P1511CEA-BQ753R | |
| Média da turma Office (39.9 - 102.3, n=76, últimos 2 anos) | |
| HP 250 G9 7N029ES | |
| Asus ZenBook 14 UX3405MA | |
| Eurocom C315 Blitz | |
| R Benchmark 2.5 / Overall mean | |
| Asus P1511CEA-BQ753R | |
| Ninkear A15 Plus (16+512) | |
| Média AMD Ryzen 7 5700U (0.567 - 0.641, n=20) | |
| Schenker VIA 15 Pro M22 | |
| HP 250 G9 7N029ES | |
| Lenovo IdeaPad 5 Pro 16ARH7 | |
| Média da turma Office (0.393 - 0.888, n=76, últimos 2 anos) | |
| Asus ZenBook 14 UX3405MA | |
| Eurocom C315 Blitz | |
* ... menor é melhor
AIDA64: FP32 Ray-Trace | FPU Julia | CPU SHA3 | CPU Queen | FPU SinJulia | FPU Mandel | CPU AES | CPU ZLib | FP64 Ray-Trace | CPU PhotoWorxx
| Performance rating | |
| Schenker VIA 15 Pro M22 | |
| Média da turma Office | |
| Lenovo IdeaPad 5 Pro 16ARH7 | |
| Ninkear A15 Plus (16+512) | |
| Média AMD Ryzen 7 5700U | |
| Eurocom C315 Blitz | |
| HP 250 G9 7N029ES | |
| Asus P1511CEA-BQ753R | |
| AIDA64 / FP32 Ray-Trace | |
| Média da turma Office (2083 - 31245, n=83, últimos 2 anos) | |
| Schenker VIA 15 Pro M22 | |
| Lenovo IdeaPad 5 Pro 16ARH7 | |
| Ninkear A15 Plus (16+512) | |
| Média AMD Ryzen 7 5700U (5679 - 12346, n=20) | |
| Eurocom C315 Blitz | |
| HP 250 G9 7N029ES | |
| Asus P1511CEA-BQ753R | |
| AIDA64 / FPU Julia | |
| Lenovo IdeaPad 5 Pro 16ARH7 | |
| Schenker VIA 15 Pro M22 | |
| Média da turma Office (8191 - 125394, n=83, últimos 2 anos) | |
| Média AMD Ryzen 7 5700U (39042 - 69580, n=20) | |
| Ninkear A15 Plus (16+512) | |
| Eurocom C315 Blitz | |
| HP 250 G9 7N029ES | |
| Asus P1511CEA-BQ753R | |
| AIDA64 / CPU SHA3 | |
| Média da turma Office (433 - 5755, n=83, últimos 2 anos) | |
| Lenovo IdeaPad 5 Pro 16ARH7 | |
| Schenker VIA 15 Pro M22 | |
| Ninkear A15 Plus (16+512) | |
| Média AMD Ryzen 7 5700U (1103 - 2231, n=20) | |
| Eurocom C315 Blitz | |
| Asus P1511CEA-BQ753R | |
| HP 250 G9 7N029ES | |
| AIDA64 / CPU Queen | |
| Ninkear A15 Plus (16+512) | |
| Schenker VIA 15 Pro M22 | |
| Média AMD Ryzen 7 5700U (57016 - 99178, n=20) | |
| Eurocom C315 Blitz | |
| Lenovo IdeaPad 5 Pro 16ARH7 | |
| Média da turma Office (22784 - 115197, n=67, últimos 2 anos) | |
| HP 250 G9 7N029ES | |
| Asus P1511CEA-BQ753R | |
| AIDA64 / FPU SinJulia | |
| Schenker VIA 15 Pro M22 | |
| Ninkear A15 Plus (16+512) | |
| Média AMD Ryzen 7 5700U (6837 - 14169, n=20) | |
| Lenovo IdeaPad 5 Pro 16ARH7 | |
| Média da turma Office (1378 - 18321, n=83, últimos 2 anos) | |
| Eurocom C315 Blitz | |
| HP 250 G9 7N029ES | |
| Asus P1511CEA-BQ753R | |
| AIDA64 / FPU Mandel | |
| Lenovo IdeaPad 5 Pro 16ARH7 | |
| Schenker VIA 15 Pro M22 | |
| Média da turma Office (4601 - 66922, n=83, últimos 2 anos) | |
| Média AMD Ryzen 7 5700U (20179 - 36523, n=20) | |
| Ninkear A15 Plus (16+512) | |
| Eurocom C315 Blitz | |
| HP 250 G9 7N029ES | |
| Asus P1511CEA-BQ753R | |
| AIDA64 / CPU AES | |
| Ninkear A15 Plus (16+512) | |
| Média AMD Ryzen 7 5700U (26066 - 64646, n=20) | |
| Média da turma Office (4854 - 155900, n=83, últimos 2 anos) | |
| Schenker VIA 15 Pro M22 | |
| Lenovo IdeaPad 5 Pro 16ARH7 | |
| Asus P1511CEA-BQ753R | |
| Eurocom C315 Blitz | |
| HP 250 G9 7N029ES | |
| AIDA64 / CPU ZLib | |
| Schenker VIA 15 Pro M22 | |
| Média da turma Office (114.6 - 1366, n=83, últimos 2 anos) | |
| Média AMD Ryzen 7 5700U (440 - 776, n=20) | |
| Lenovo IdeaPad 5 Pro 16ARH7 | |
| Ninkear A15 Plus (16+512) | |
| Eurocom C315 Blitz | |
| HP 250 G9 7N029ES | |
| Asus P1511CEA-BQ753R | |
| AIDA64 / FP64 Ray-Trace | |
| Média da turma Office (1109 - 17834, n=83, últimos 2 anos) | |
| Schenker VIA 15 Pro M22 | |
| Lenovo IdeaPad 5 Pro 16ARH7 | |
| Ninkear A15 Plus (16+512) | |
| Média AMD Ryzen 7 5700U (2985 - 6784, n=20) | |
| Eurocom C315 Blitz | |
| HP 250 G9 7N029ES | |
| Asus P1511CEA-BQ753R | |
| AIDA64 / CPU PhotoWorxx | |
| Média da turma Office (11090 - 65229, n=83, últimos 2 anos) | |
| Eurocom C315 Blitz | |
| Lenovo IdeaPad 5 Pro 16ARH7 | |
| Schenker VIA 15 Pro M22 | |
| Asus P1511CEA-BQ753R | |
| Média AMD Ryzen 7 5700U (6903 - 25066, n=20) | |
| HP 250 G9 7N029ES | |
| Ninkear A15 Plus (16+512) | |
Desempenho do sistema
O desempenho do sistema do Ninkear A15 Plus parece suficiente no uso diário. A navegação, o streaming e o Office funcionam sem problemas.
Nos benchmarks com PCMark, CrossMark e WebXPRT 4, nosso dispositivo de teste está apenas um pouco atrás de seus concorrentes com Core i7 ou Ryzen 7.
CrossMark: Overall | Productivity | Creativity | Responsiveness
WebXPRT 4: Overall
| PCMark 10 / Score | |
| Média da turma Office (2601 - 9298, n=68, últimos 2 anos) | |
| Asus ZenBook 14 UX3405MA | |
| Lenovo IdeaPad 5 Pro 16ARH7 | |
| Eurocom C315 Blitz | |
| Média AMD Ryzen 7 5700U, AMD Radeon RX Vega 8 (Ryzen 4000/5000) (4325 - 5518, n=15) | |
| Schenker VIA 15 Pro M22 | |
| Ninkear A15 Plus (16+512) | |
| HP 250 G9 7N029ES | |
| Asus P1511CEA-BQ753R | |
| PCMark 10 / Essentials | |
| Asus ZenBook 14 UX3405MA | |
| Eurocom C315 Blitz | |
| Lenovo IdeaPad 5 Pro 16ARH7 | |
| Média da turma Office (3245 - 11594, n=68, últimos 2 anos) | |
| HP 250 G9 7N029ES | |
| Média AMD Ryzen 7 5700U, AMD Radeon RX Vega 8 (Ryzen 4000/5000) (8025 - 10091, n=15) | |
| Schenker VIA 15 Pro M22 | |
| Ninkear A15 Plus (16+512) | |
| Asus P1511CEA-BQ753R | |
| PCMark 10 / Productivity | |
| Média da turma Office (5336 - 17243, n=68, últimos 2 anos) | |
| Asus ZenBook 14 UX3405MA | |
| Lenovo IdeaPad 5 Pro 16ARH7 | |
| Média AMD Ryzen 7 5700U, AMD Radeon RX Vega 8 (Ryzen 4000/5000) (7001 - 8457, n=15) | |
| Ninkear A15 Plus (16+512) | |
| Schenker VIA 15 Pro M22 | |
| Eurocom C315 Blitz | |
| Asus P1511CEA-BQ753R | |
| HP 250 G9 7N029ES | |
| PCMark 10 / Digital Content Creation | |
| Média da turma Office (2049 - 13541, n=68, últimos 2 anos) | |
| Asus ZenBook 14 UX3405MA | |
| Lenovo IdeaPad 5 Pro 16ARH7 | |
| Schenker VIA 15 Pro M22 | |
| Eurocom C315 Blitz | |
| Média AMD Ryzen 7 5700U, AMD Radeon RX Vega 8 (Ryzen 4000/5000) (3738 - 5964, n=15) | |
| Ninkear A15 Plus (16+512) | |
| HP 250 G9 7N029ES | |
| Asus P1511CEA-BQ753R | |
| CrossMark / Overall | |
| Eurocom C315 Blitz | |
| Asus ZenBook 14 UX3405MA | |
| Média da turma Office (381 - 2010, n=75, últimos 2 anos) | |
| HP 250 G9 7N029ES | |
| Schenker VIA 15 Pro M22 | |
| Ninkear A15 Plus (16+512) | |
| Asus P1511CEA-BQ753R | |
| Média AMD Ryzen 7 5700U, AMD Radeon RX Vega 8 (Ryzen 4000/5000) (866 - 1183, n=8) | |
| CrossMark / Productivity | |
| Eurocom C315 Blitz | |
| Asus ZenBook 14 UX3405MA | |
| Média da turma Office (464 - 1880, n=75, últimos 2 anos) | |
| HP 250 G9 7N029ES | |
| Asus P1511CEA-BQ753R | |
| Schenker VIA 15 Pro M22 | |
| Ninkear A15 Plus (16+512) | |
| Média AMD Ryzen 7 5700U, AMD Radeon RX Vega 8 (Ryzen 4000/5000) (931 - 1191, n=8) | |
| CrossMark / Creativity | |
| Eurocom C315 Blitz | |
| Asus ZenBook 14 UX3405MA | |
| Média da turma Office (319 - 2361, n=75, últimos 2 anos) | |
| Schenker VIA 15 Pro M22 | |
| HP 250 G9 7N029ES | |
| Ninkear A15 Plus (16+512) | |
| Média AMD Ryzen 7 5700U, AMD Radeon RX Vega 8 (Ryzen 4000/5000) (907 - 1197, n=8) | |
| Asus P1511CEA-BQ753R | |
| CrossMark / Responsiveness | |
| Eurocom C315 Blitz | |
| Média da turma Office (360 - 1820, n=75, últimos 2 anos) | |
| Asus ZenBook 14 UX3405MA | |
| Asus P1511CEA-BQ753R | |
| Schenker VIA 15 Pro M22 | |
| HP 250 G9 7N029ES | |
| Ninkear A15 Plus (16+512) | |
| Média AMD Ryzen 7 5700U, AMD Radeon RX Vega 8 (Ryzen 4000/5000) (605 - 1159, n=8) | |
| WebXPRT 4 / Overall | |
| HP 250 G9 7N029ES | |
| Asus ZenBook 14 UX3405MA | |
| Média da turma Office (104.2 - 313, n=77, últimos 2 anos) | |
| Ninkear A15 Plus (16+512) | |
| Média AMD Ryzen 7 5700U, AMD Radeon RX Vega 8 (Ryzen 4000/5000) (158.5 - 225, n=5) | |
| Schenker VIA 15 Pro M22 | |
| Asus P1511CEA-BQ753R | |
| PCMark 10 Score | 4953 pontos | |
Ajuda | ||
| AIDA64 / Memory Copy | |
| Eurocom C315 Blitz | |
| Média da turma Office (20075 - 110930, n=80, últimos 2 anos) | |
| Lenovo IdeaPad 5 Pro 16ARH7 | |
| Schenker VIA 15 Pro M22 | |
| Asus P1511CEA-BQ753R | |
| Média AMD Ryzen 7 5700U (15867 - 39326, n=20) | |
| HP 250 G9 7N029ES | |
| Ninkear A15 Plus (16+512) | |
| AIDA64 / Memory Read | |
| Média da turma Office (10084 - 128030, n=81, últimos 2 anos) | |
| Eurocom C315 Blitz | |
| Schenker VIA 15 Pro M22 | |
| Lenovo IdeaPad 5 Pro 16ARH7 | |
| Média AMD Ryzen 7 5700U (17632 - 47190, n=20) | |
| Asus P1511CEA-BQ753R | |
| Ninkear A15 Plus (16+512) | |
| HP 250 G9 7N029ES | |
| AIDA64 / Memory Write | |
| Lenovo IdeaPad 5 Pro 16ARH7 | |
| Eurocom C315 Blitz | |
| Média da turma Office (20073 - 119858, n=81, últimos 2 anos) | |
| Schenker VIA 15 Pro M22 | |
| Asus P1511CEA-BQ753R | |
| Média AMD Ryzen 7 5700U (11554 - 47048, n=20) | |
| Ninkear A15 Plus (16+512) | |
| HP 250 G9 7N029ES | |
| AIDA64 / Memory Latency | |
| Lenovo IdeaPad 5 Pro 16ARH7 | |
| Média da turma Office (7.6 - 162.9, n=76, últimos 2 anos) | |
| Schenker VIA 15 Pro M22 | |
| Média AMD Ryzen 7 5700U (84.9 - 113, n=20) | |
| Ninkear A15 Plus (16+512) | |
| Asus P1511CEA-BQ753R | |
| Eurocom C315 Blitz | |
| HP 250 G9 7N029ES | |
* ... menor é melhor
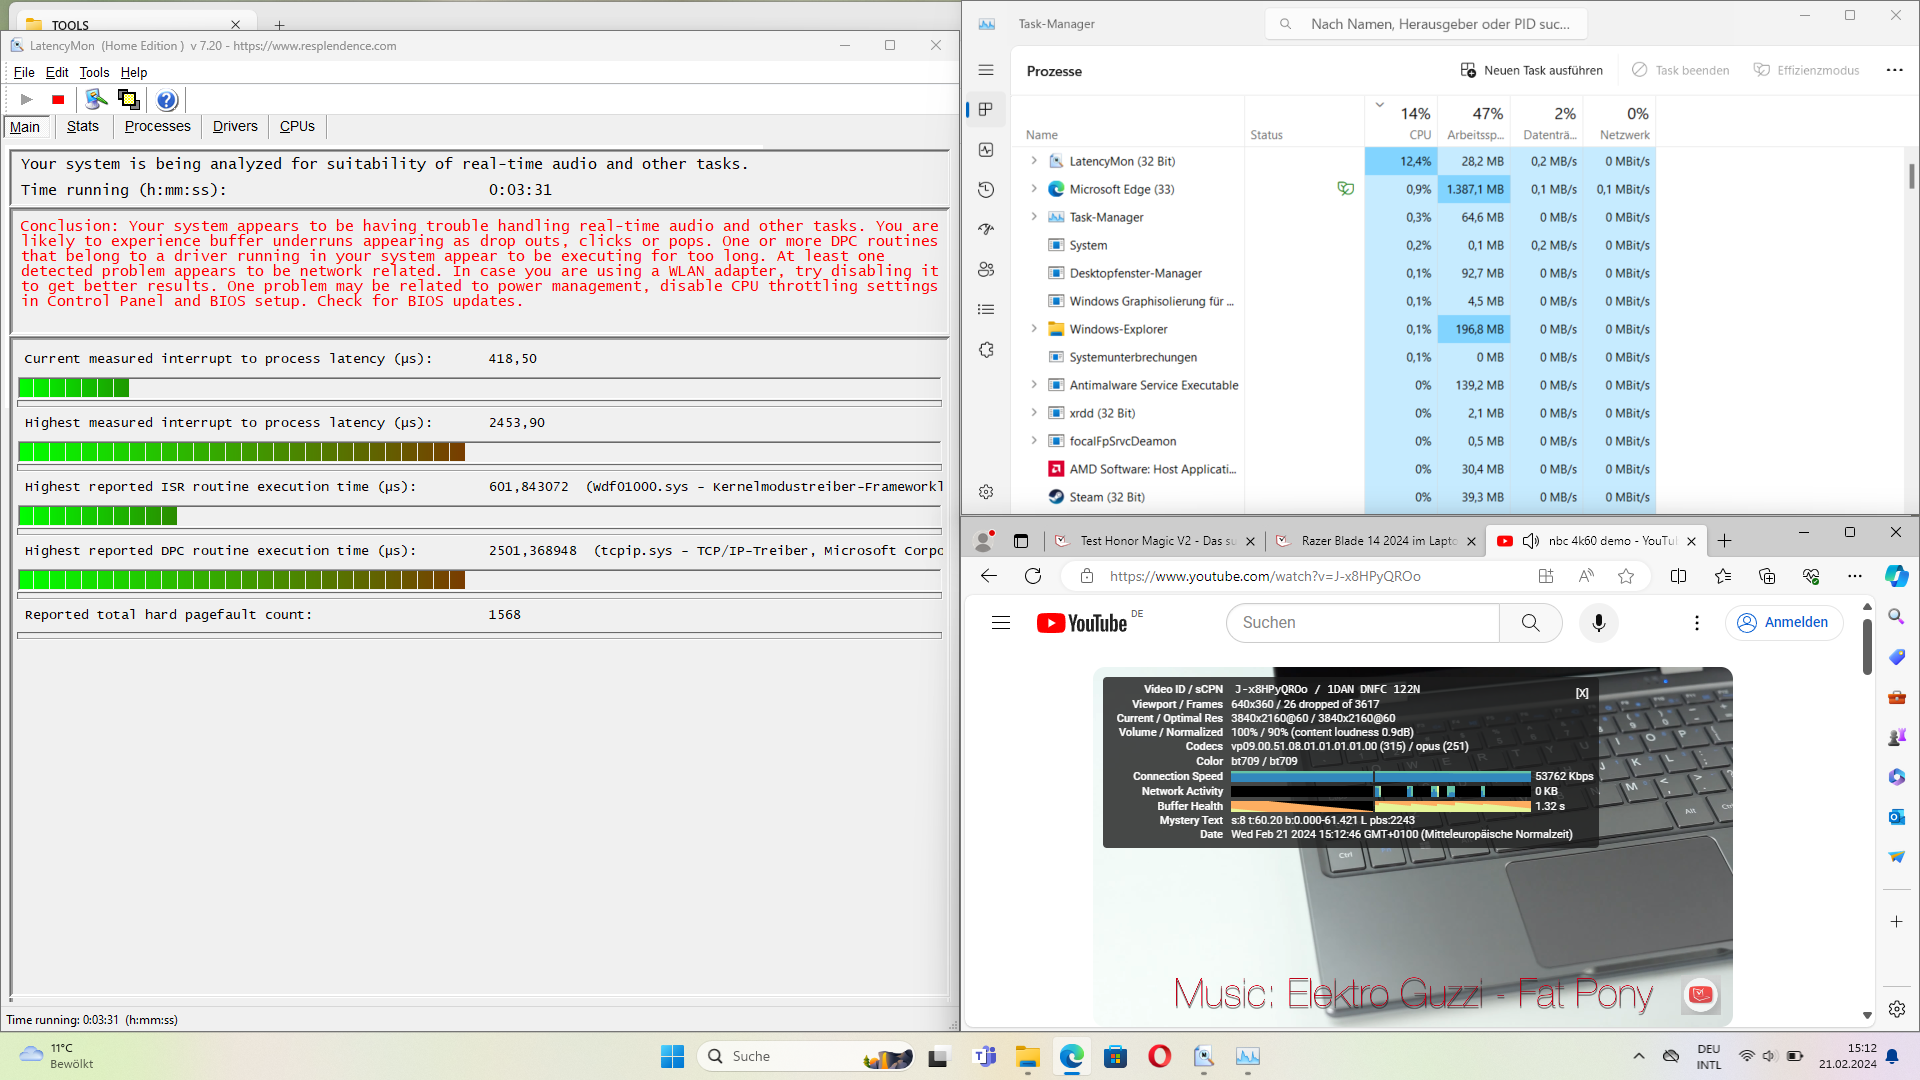
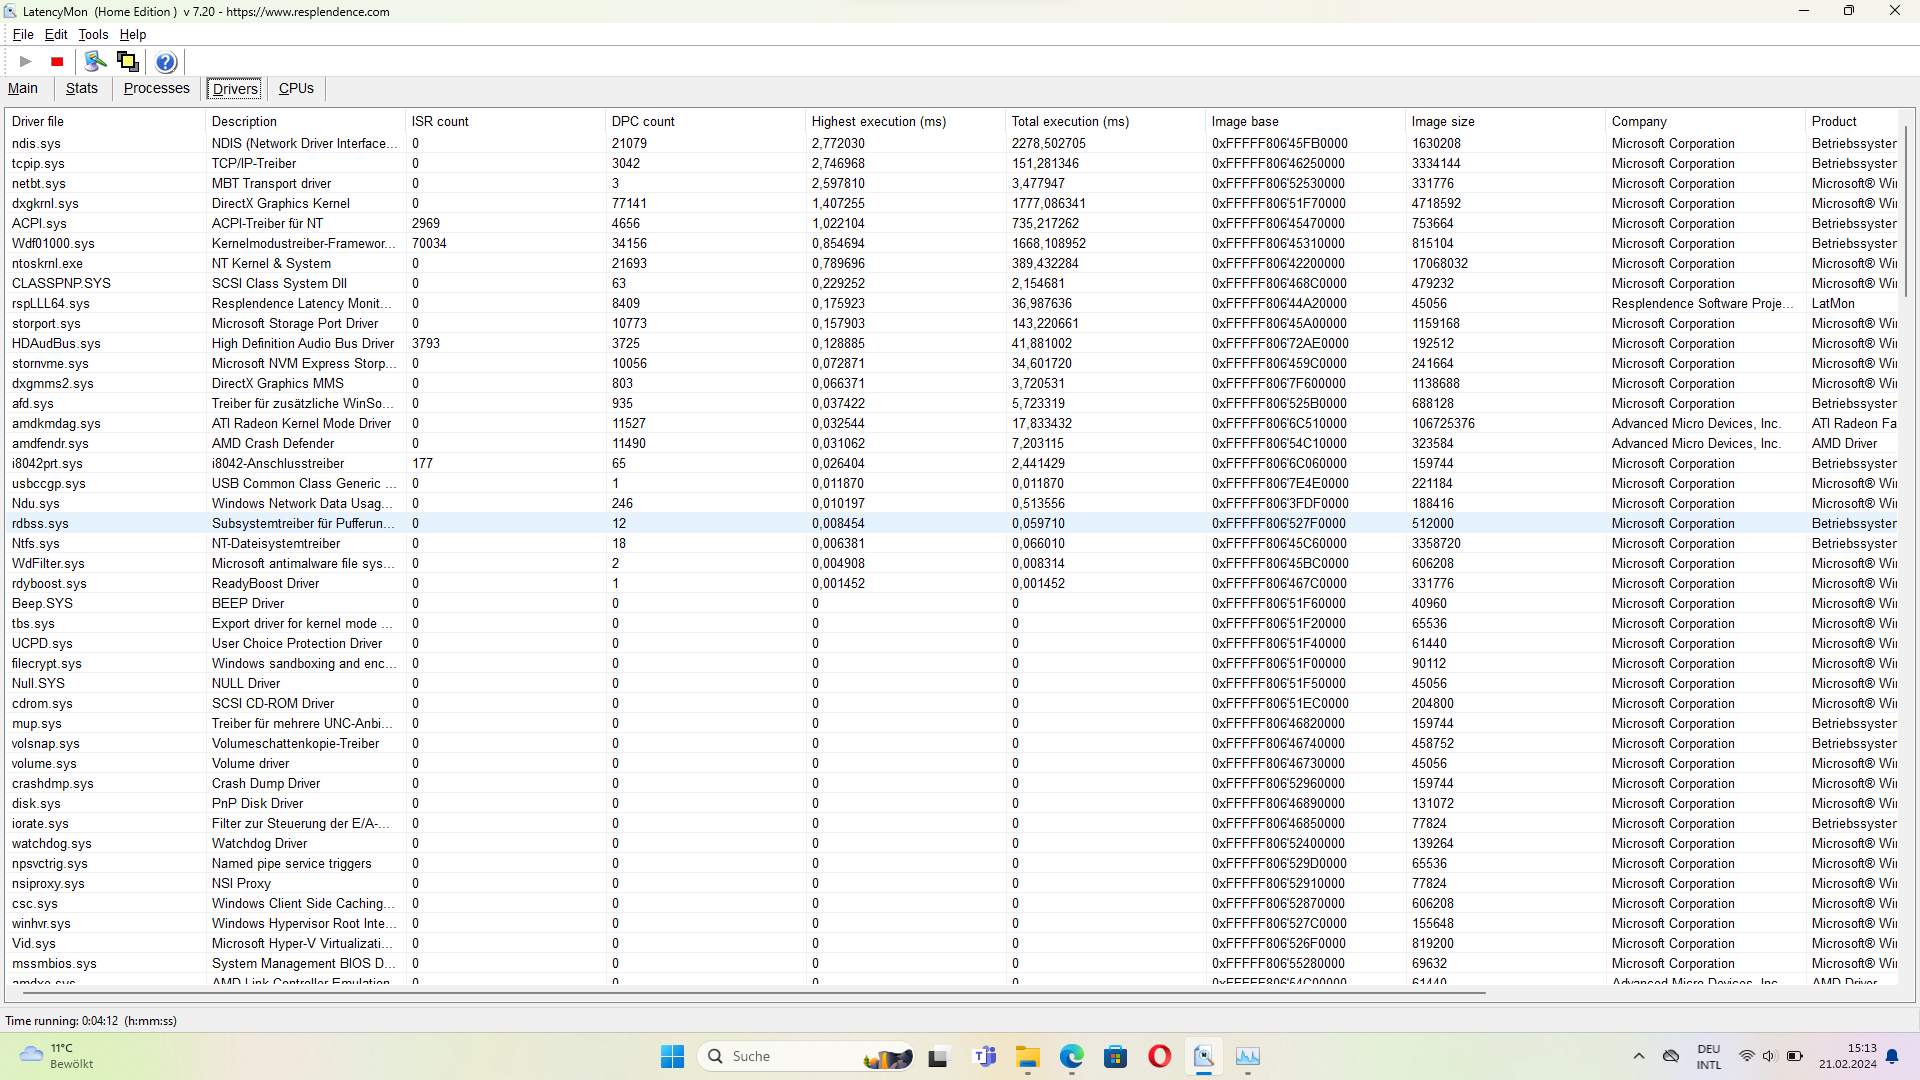
Latência DPC
A latência do DPC é bastante alta, de 2.453 µs, na configuração do driver disponível no momento do teste. Portanto, o LatencyMon considera que o laptop não é adequado para aplicativos em tempo real.
| DPC Latencies / LatencyMon - interrupt to process latency (max), Web, Youtube, Prime95 | |
| Ninkear A15 Plus (16+512) | |
| Schenker VIA 15 Pro M22 | |
| HP 250 G9 7N029ES | |
| Asus P1511CEA-BQ753R | |
| Eurocom C315 Blitz | |
| Lenovo IdeaPad 5 Pro 16ARH7 | |
* ... menor é melhor
Dispositivos de armazenamento
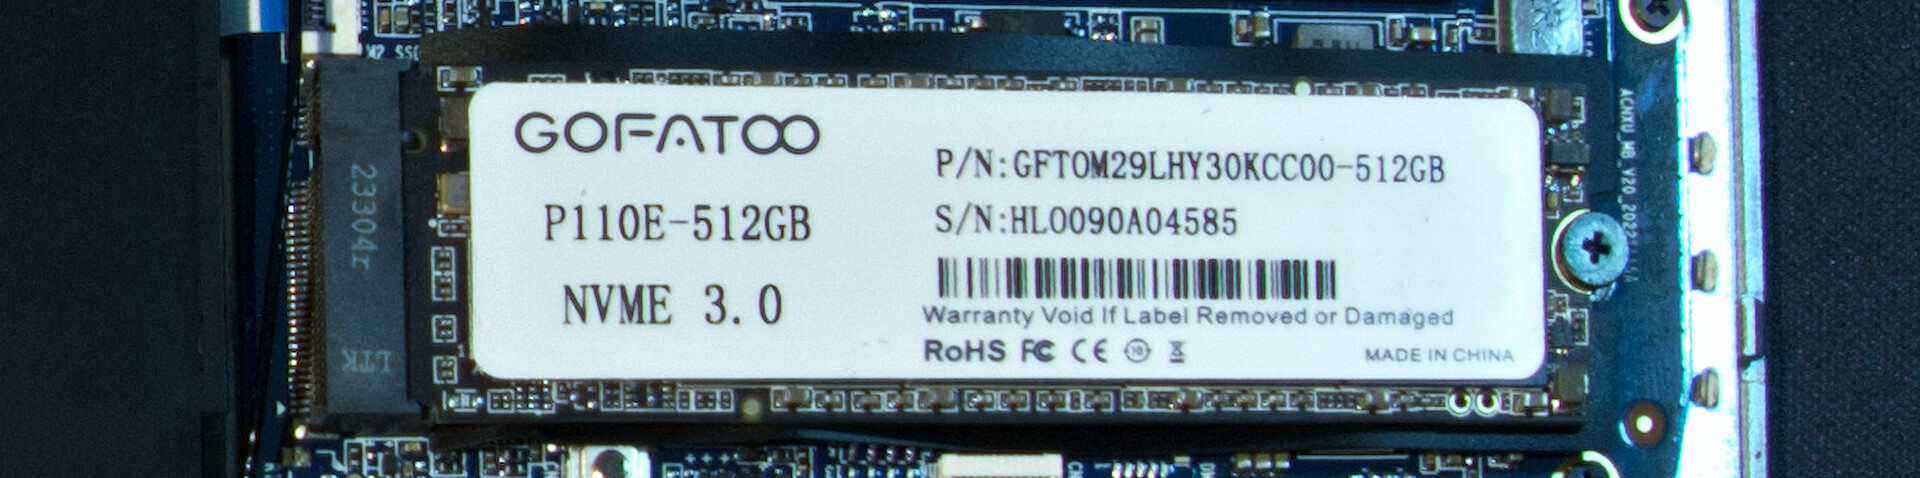
O SSD NVMe da Gofatoo instalado no dispositivo de teste é conectado por meio de uma interface PCI Gen 3.0. Ele tem as velocidades de transferência de dados correspondentes, mas elas são mais do que suficientes para um laptop de escritório.
Em termos de velocidade de leitura, o SSD está praticamente no mesmo nível do Samsung SSD 970 EVO Plus, que pode ser encontrado no Schenker Via 15 Pro, entre outros.

| Drive Performance rating - Percent | |
| Eurocom C315 Blitz | |
| Schenker VIA 15 Pro M22 | |
| Lenovo IdeaPad 5 Pro 16ARH7 | |
| Média da turma Office | |
| Ninkear A15 Plus (16+512) | |
| Média GOFATOO P110E-512GB | |
| HP 250 G9 7N029ES | |
| Asus P1511CEA-BQ753R | |
* ... menor é melhor
Disk throttling: DiskSpd Read Loop, Queue Depth 8
Placa de vídeo
Não há dGPU no fino Ninkear A15 Plus, portanto, a iGPU do AMD Ryzen 7 5700U tem que lidar com todas as tarefas gráficas. Infelizmente, o Vega 8 não pode fazer muito com a RAM de canal único e o baixo TDP. Como resultado, o desempenho da iGPU, que de outra forma seria utilizável, cai proporcionalmente.
Em comparação, o Ninkear A15 é consideravelmente mais potente do que seus concorrentes com processadores i3, mas nosso dispositivo de teste não está nem perto do desempenho médio de uma RX Vega 8. O Schenker VIA 15 Pro tem um desempenho significativamente melhor em todos os benchmarks de desempenho gráfico.
O desempenho nos jogos testados também é correspondentemente fraco. É possível jogar um pouco no laptop, mas é mais provável que os títulos AAA atuais causem frustração.
| 3DMark Performance rating - Percent | |
| Média da turma Office | |
| Lenovo IdeaPad 5 Pro 16ARH7 | |
| Eurocom C315 Blitz | |
| Schenker VIA 15 Pro M22 -1! | |
| Média AMD Radeon RX Vega 8 (Ryzen 4000/5000) | |
| Ninkear A15 Plus (16+512) | |
| HP 250 G9 7N029ES -1! | |
| Asus P1511CEA-BQ753R | |
| 3DMark 11 - 1280x720 Performance GPU | |
| Média da turma Office (2551 - 18313, n=72, últimos 2 anos) | |
| Lenovo IdeaPad 5 Pro 16ARH7 | |
| Schenker VIA 15 Pro M22 | |
| Média AMD Radeon RX Vega 8 (Ryzen 4000/5000) (3459 - 7591, n=57) | |
| Eurocom C315 Blitz | |
| Ninkear A15 Plus (16+512) | |
| HP 250 G9 7N029ES | |
| Asus P1511CEA-BQ753R | |
| 3DMark | |
| 1280x720 Cloud Gate Standard Graphics | |
| Média da turma Office (11640 - 118515, n=38, últimos 2 anos) | |
| Lenovo IdeaPad 5 Pro 16ARH7 | |
| Média AMD Radeon RX Vega 8 (Ryzen 4000/5000) (13941 - 36134, n=49) | |
| Eurocom C315 Blitz | |
| Ninkear A15 Plus (16+512) | |
| Asus P1511CEA-BQ753R | |
| 1920x1080 Fire Strike Graphics | |
| Média da turma Office (736 - 21871, n=75, últimos 2 anos) | |
| Lenovo IdeaPad 5 Pro 16ARH7 | |
| Eurocom C315 Blitz | |
| Schenker VIA 15 Pro M22 | |
| Média AMD Radeon RX Vega 8 (Ryzen 4000/5000) (1694 - 5041, n=57) | |
| Ninkear A15 Plus (16+512) | |
| HP 250 G9 7N029ES | |
| Asus P1511CEA-BQ753R | |
| 2560x1440 Time Spy Graphics | |
| Média da turma Office (493 - 6679, n=70, últimos 2 anos) | |
| Lenovo IdeaPad 5 Pro 16ARH7 | |
| Eurocom C315 Blitz | |
| Schenker VIA 15 Pro M22 | |
| Média AMD Radeon RX Vega 8 (Ryzen 4000/5000) (540 - 1557, n=57) | |
| Ninkear A15 Plus (16+512) | |
| HP 250 G9 7N029ES | |
| Asus P1511CEA-BQ753R | |
| 3DMark 11 Performance | 4600 pontos | |
| 3DMark Cloud Gate Standard Score | 16817 pontos | |
| 3DMark Fire Strike Score | 2378 pontos | |
| 3DMark Time Spy Score | 1009 pontos | |
Ajuda | ||
| Performance rating - Percent | |
| Média da turma Office | |
| Lenovo IdeaPad 5 Pro 16ARH7 | |
| Schenker VIA 15 Pro M22 | |
| Eurocom C315 Blitz | |
| Ninkear A15 Plus (16+512) | |
| The Witcher 3 - 1920x1080 Ultra Graphics & Postprocessing (HBAO+) | |
| Média da turma Office (14.8 - 28.1, n=3, últimos 2 anos) | |
| Lenovo IdeaPad 5 Pro 16ARH7 | |
| Schenker VIA 15 Pro M22 | |
| Eurocom C315 Blitz | |
| Ninkear A15 Plus (16+512) | |
| GTA V - 1920x1080 Highest AA:4xMSAA + FX AF:16x | |
| Média da turma Office (5.77 - 45.3, n=69, últimos 2 anos) | |
| Lenovo IdeaPad 5 Pro 16ARH7 | |
| Schenker VIA 15 Pro M22 | |
| Eurocom C315 Blitz | |
| Ninkear A15 Plus (16+512) | |
| Final Fantasy XV Benchmark - 1920x1080 High Quality | |
| Média da turma Office (8.09 - 79.5, n=71, últimos 2 anos) | |
| Lenovo IdeaPad 5 Pro 16ARH7 | |
| Eurocom C315 Blitz | |
| Schenker VIA 15 Pro M22 | |
| Ninkear A15 Plus (16+512) | |
| Strange Brigade - 1920x1080 ultra AA:ultra AF:16 | |
| Média da turma Office (12.9 - 142.1, n=53, últimos 2 anos) | |
| Lenovo IdeaPad 5 Pro 16ARH7 | |
| Schenker VIA 15 Pro M22 | |
| Eurocom C315 Blitz | |
| Ninkear A15 Plus (16+512) | |
| Dota 2 Reborn - 1920x1080 ultra (3/3) best looking | |
| Média da turma Office (14.6 - 135, n=77, últimos 2 anos) | |
| Lenovo IdeaPad 5 Pro 16ARH7 | |
| Schenker VIA 15 Pro M22 | |
| Eurocom C315 Blitz | |
| Ninkear A15 Plus (16+512) | |
| X-Plane 11.11 - 1920x1080 high (fps_test=3) | |
| Lenovo IdeaPad 5 Pro 16ARH7 | |
| Média da turma Office (12 - 82.4, n=69, últimos 2 anos) | |
| Eurocom C315 Blitz | |
| Schenker VIA 15 Pro M22 | |
| Ninkear A15 Plus (16+512) | |
| baixo | média | alto | ultra | QHD | |
|---|---|---|---|---|---|
| GTA V (2015) | 65.3 | 58.3 | 16.9 | 7.71 | |
| The Witcher 3 (2015) | 10.3 | ||||
| Dota 2 Reborn (2015) | 89.9 | 68 | 36.5 | 35.5 | |
| Final Fantasy XV Benchmark (2018) | 13 | 8.72 | 6.33 | ||
| X-Plane 11.11 (2018) | 36.5 | 28.6 | 26.3 | ||
| Far Cry 5 (2018) | 28 | 14 | 13 | 12 | |
| Strange Brigade (2018) | 48.3 | 19.4 | 16.4 | 14.3 | |
| F1 23 (2023) | 23.4 | 20.9 | 15.8 | 11.5 | |
| Cyberpunk 2077 (2023) | 11 | 5.71 |
Emissões e energia - Economia de energia e silêncio
Emissões de ruído
Graças ao baixo consumo de energia do processador, a ventoinha do Ninkear também não precisa dissipar muito calor. Com um máximo de 35 dB(A), o laptop permanece significativamente mais silencioso do que seus concorrentes.
Barulho
| Ocioso |
| 24.78 / 27.6 / 26.5 dB |
| Carga |
| 34.38 / 34.58 dB |
 | ||
30 dB silencioso 40 dB(A) audível 50 dB(A) ruidosamente alto |
||
min: | ||
| Ninkear A15 Plus (16+512) Vega 8, R7 5700U, GOFATOO P110E-512GB | Lenovo IdeaPad 5 Pro 16ARH7 Radeon 660M, R5 6600HS, Samsung PM9A1 MZVL2512HCJQ | Eurocom C315 Blitz Iris Xe G7 96EUs, i7-1360P, Samsung 990 Pro 1 TB | Schenker VIA 15 Pro M22 Vega 8, R7 5700U, Samsung SSD 970 EVO Plus 1TB | HP 250 G9 7N029ES UHD Graphics 64EUs, i3-1215U, SK hynix HFS512GEJ9X125N | Asus P1511CEA-BQ753R UHD Graphics Xe G4 48EUs, i3-1115G4, Kingston OM8PDP3256B | |
|---|---|---|---|---|---|---|
| Noise | -5% | -11% | -1% | -9% | -14% | |
| desligado / ambiente * (dB) | 24.78 | 25 -1% | 22.5 9% | 24 3% | 24.3 2% | 26 -5% |
| Idle Minimum * (dB) | 24.78 | 25 -1% | 25.1 -1% | 24 3% | 24.3 2% | 26 -5% |
| Idle Average * (dB) | 27.6 | 26 6% | 25.1 9% | 24 13% | 24.3 12% | 29.5 -7% |
| Idle Maximum * (dB) | 26.5 | 28 -6% | 34.9 -32% | 27.5 -4% | 28.2 -6% | 29.5 -11% |
| Load Average * (dB) | 34.38 | 44 -28% | 42.1 -22% | 33.7 2% | 45.2 -31% | 43.1 -25% |
| Load Maximum * (dB) | 34.58 | 35 -1% | 44.2 -28% | 42.4 -23% | 45.2 -31% | 46 -33% |
| Witcher 3 ultra * (dB) | 35 | 44.5 | 33.7 | 45.2 |
* ... menor é melhor
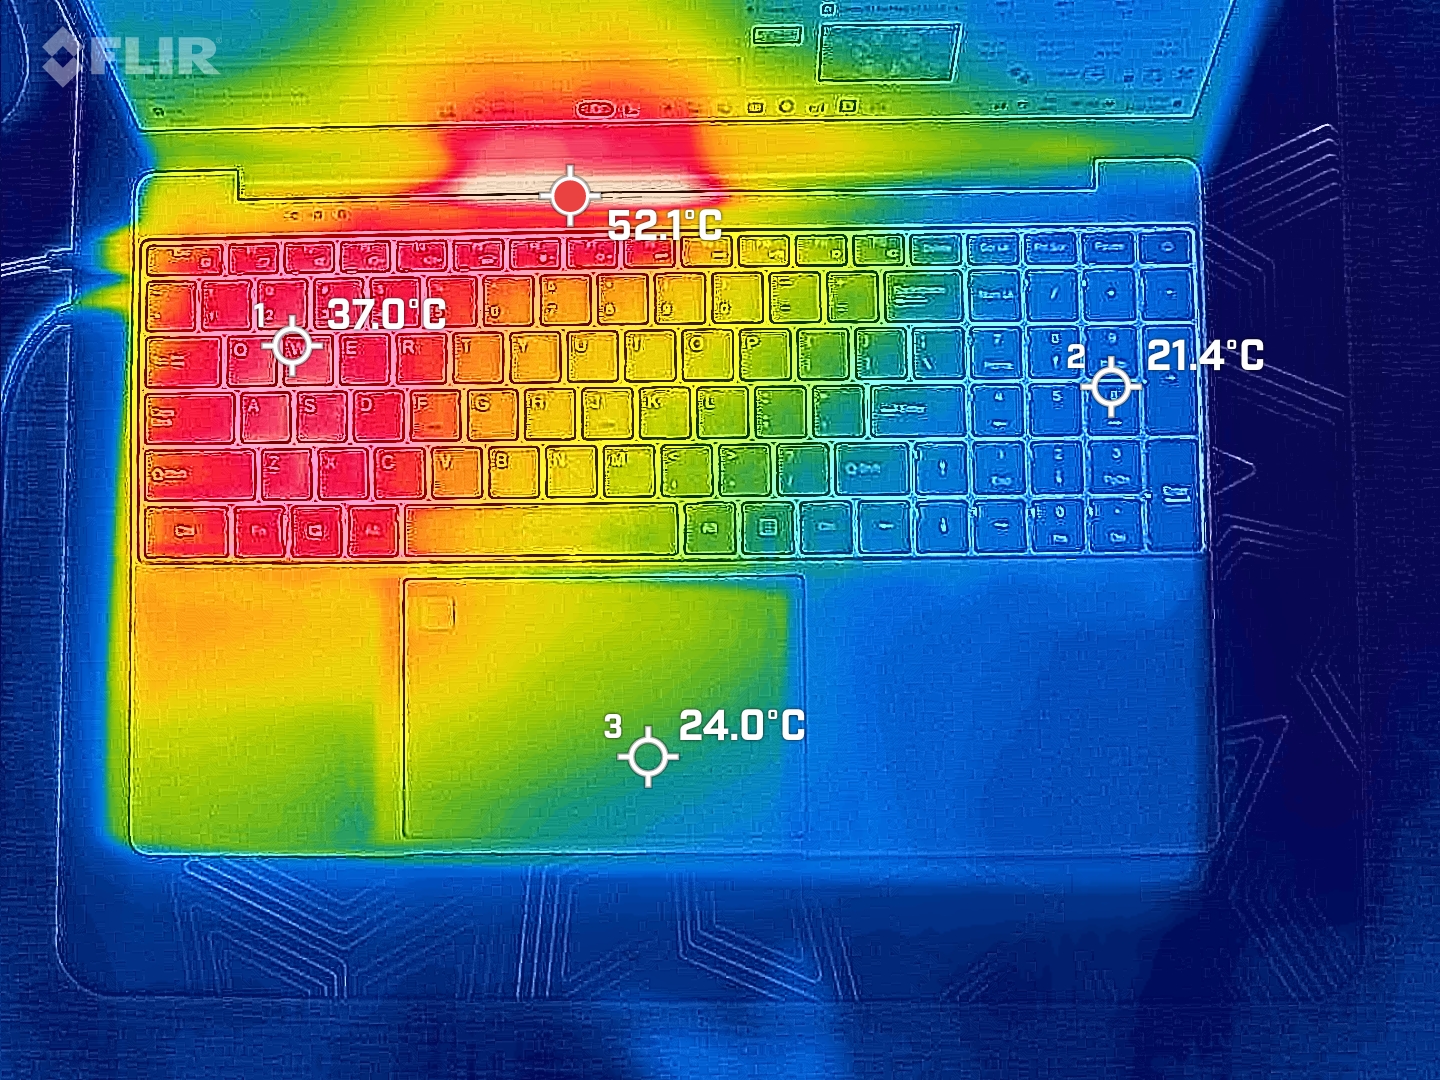
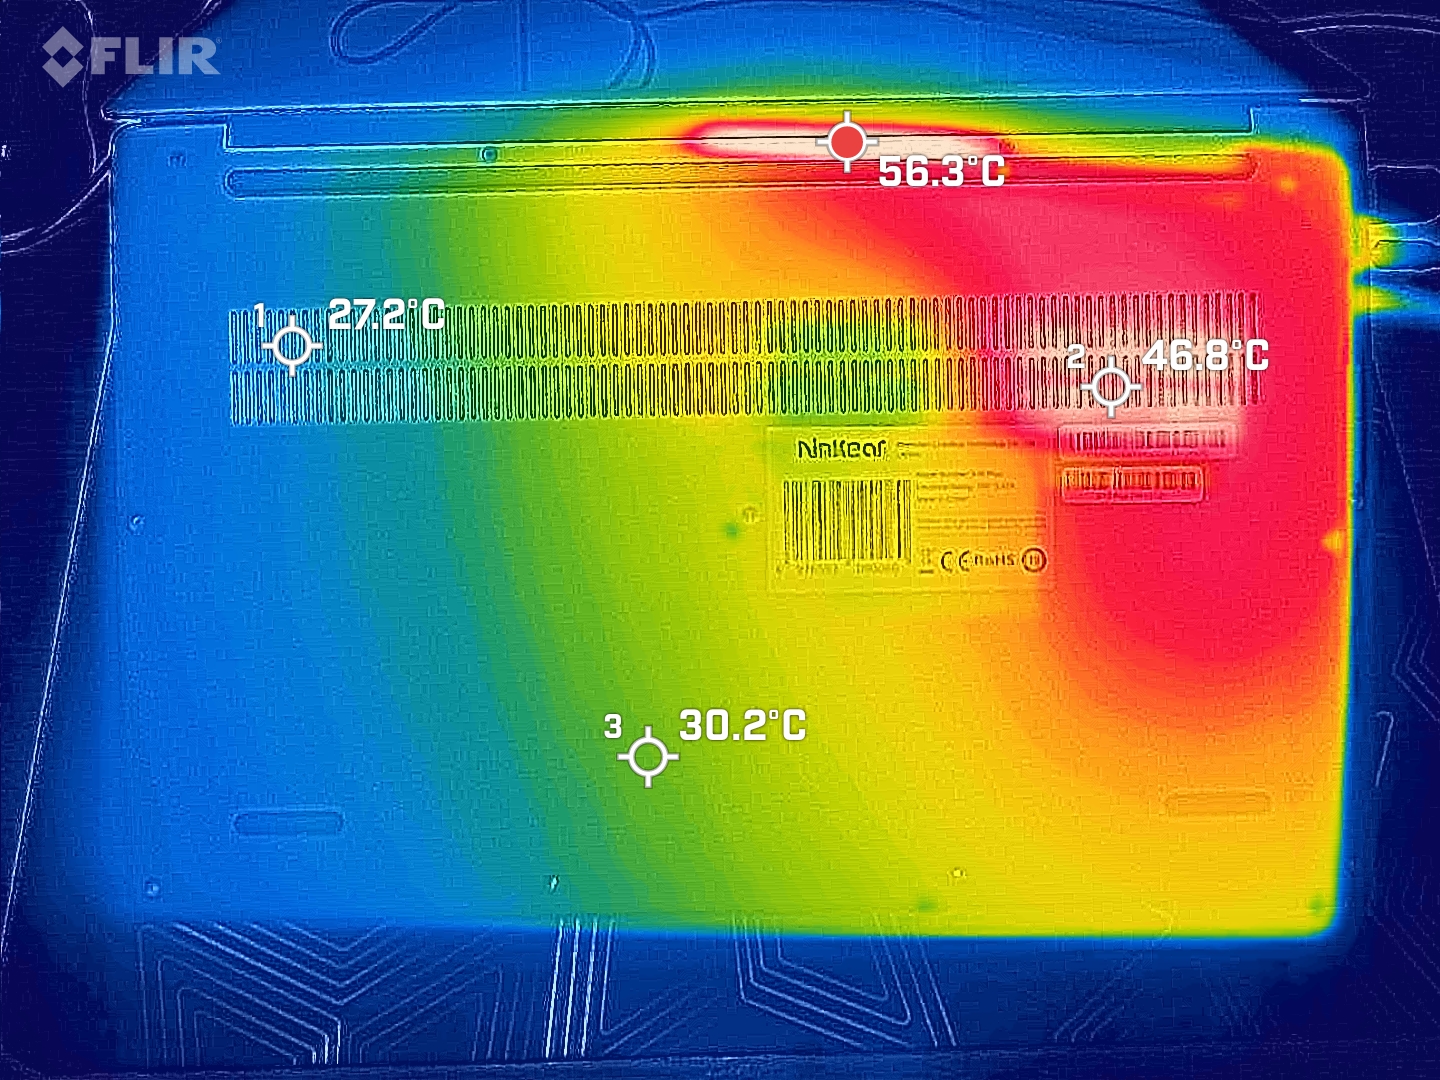
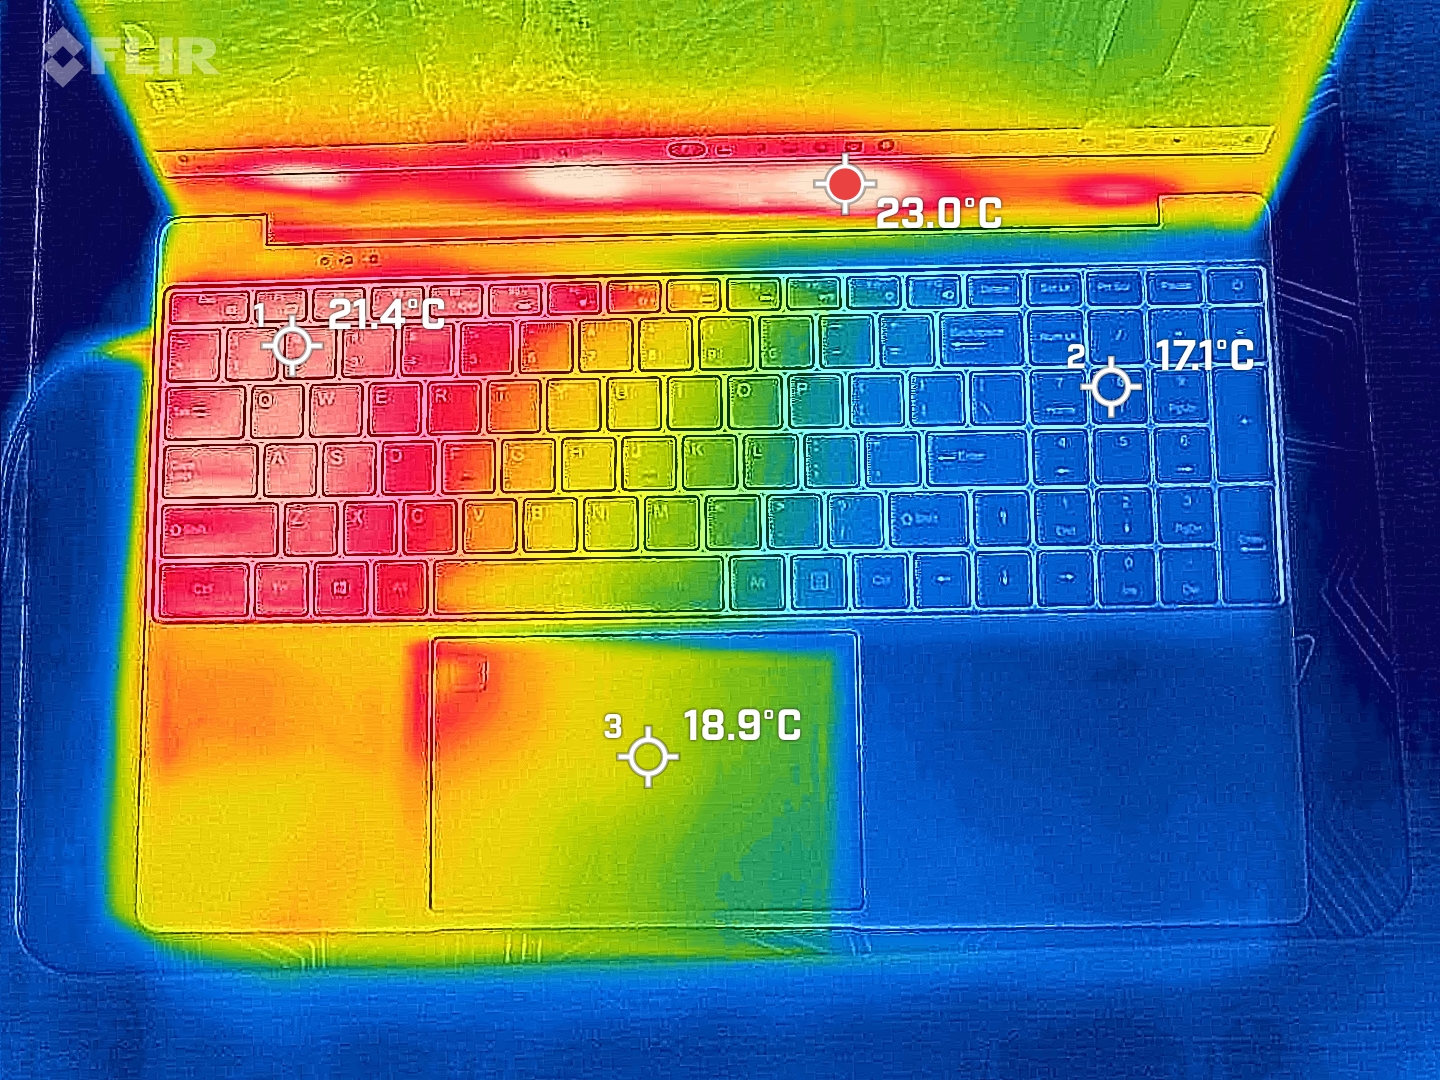
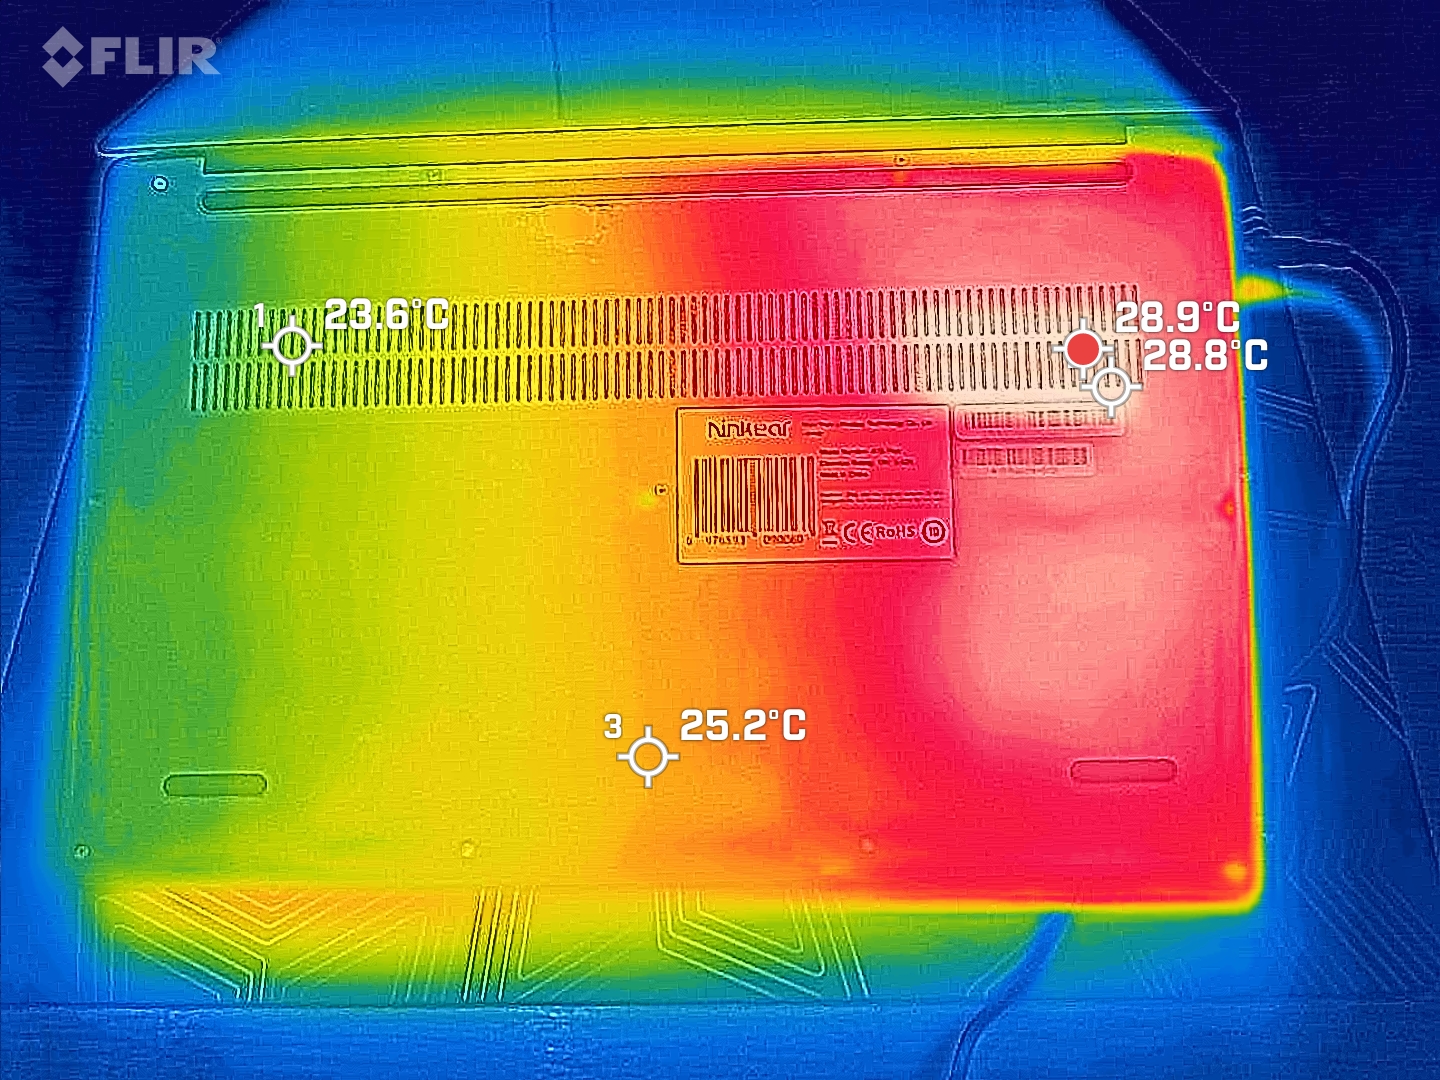
Temperatura
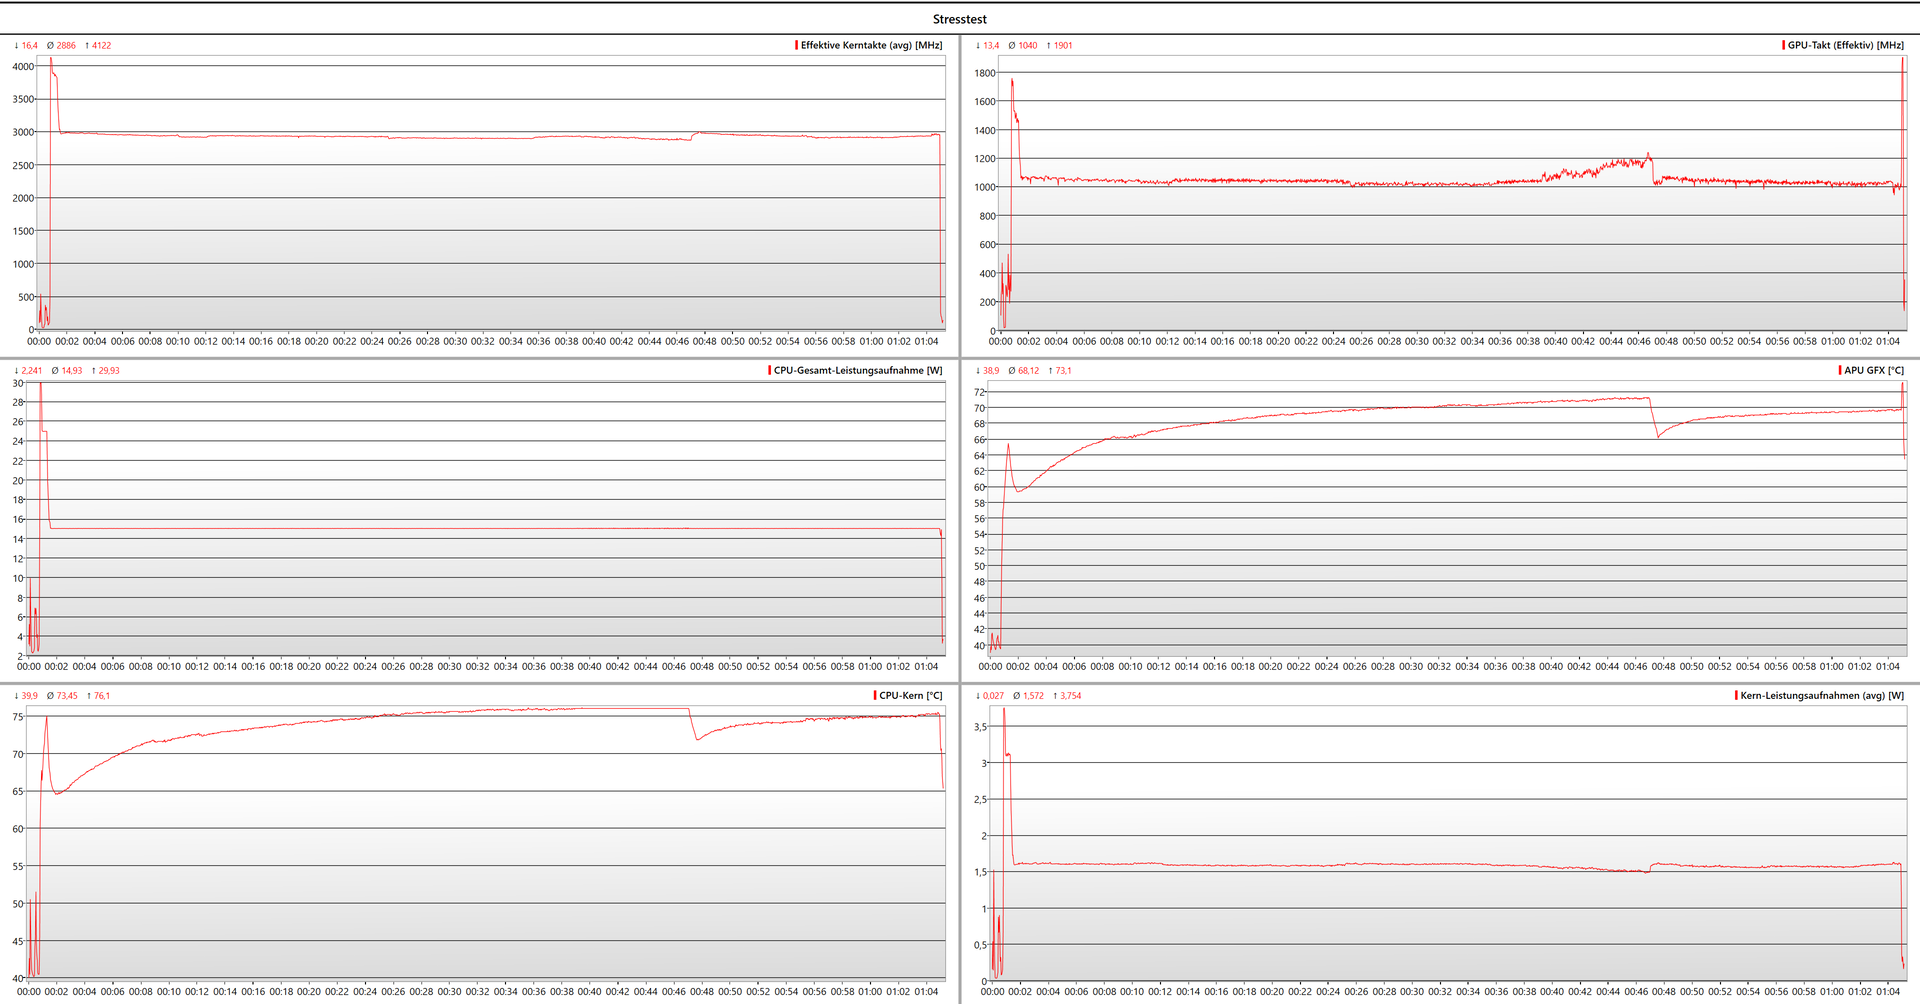
As temperaturas da superfície, tanto na operação normal quanto no teste de estresse, também são mantidas dentro dos limites em nosso dispositivo de teste. O dispositivo aquece mais do que a temperatura corporal; o laptop só atinge temperaturas de superfície de 50 °C em determinados pontos próximos à saída de ar do dissipador de calor.
Nosso dispositivo de teste resistiu ao teste de estresse com o desempenho já discutido. O senhor não deve esperar mais do que 15 W de potência contínua do Ryzen 7 5700U do Ninkear A15 Plus.
(+) A temperatura máxima no lado superior é 37 °C / 99 F, em comparação com a média de 34.3 °C / 94 F , variando de 21.2 a 62.5 °C para a classe Office.
(+) A parte inferior aquece até um máximo de 33 °C / 91 F, em comparação com a média de 36.8 °C / 98 F
(+) Em uso inativo, a temperatura média para o lado superior é 22.3 °C / 72 F, em comparação com a média do dispositivo de 29.5 °C / ### class_avg_f### F.
(+) Os apoios para as mãos e o touchpad são mais frios que a temperatura da pele, com um máximo de 27 °C / 80.6 F e, portanto, são frios ao toque.
(±) A temperatura média da área do apoio para as mãos de dispositivos semelhantes foi 27.5 °C / 81.5 F (+0.5 °C / 0.9 F).
| Ninkear A15 Plus (16+512) AMD Ryzen 7 5700U, AMD Radeon RX Vega 8 (Ryzen 4000/5000) | Lenovo IdeaPad 5 Pro 16ARH7 AMD Ryzen 5 6600HS, AMD Radeon 660M | Eurocom C315 Blitz Intel Core i7-1360P, Intel Iris Xe Graphics G7 96EUs | Schenker VIA 15 Pro M22 AMD Ryzen 7 5700U, AMD Radeon RX Vega 8 (Ryzen 4000/5000) | HP 250 G9 7N029ES Intel Core i3-1215U, Intel UHD Graphics 64EUs (Alder Lake 12th Gen) | Asus P1511CEA-BQ753R Intel Core i3-1115G4, Intel UHD Graphics Xe G4 48EUs | |
|---|---|---|---|---|---|---|
| Heat | -21% | -2% | -16% | -9% | -11% | |
| Maximum Upper Side * (°C) | 37 | 46 -24% | 35.6 4% | 41.2 -11% | 35.1 5% | 40.3 -9% |
| Maximum Bottom * (°C) | 33 | 48 -45% | 37.8 -15% | 43.5 -32% | 44.8 -36% | 39.2 -19% |
| Idle Upper Side * (°C) | 23.5 | 28 -19% | 24.2 -3% | 28.4 -21% | 25.7 -9% | 27.3 -16% |
| Idle Bottom * (°C) | 28.1 | 27 4% | 26 7% | 28.1 -0% | 26.5 6% | 28.5 -1% |
* ... menor é melhor
Alto-falante
Agora chegamos ao aspecto mais fraco do Ninkear A15 Plus - o alto-falante. O módulo de alto-falante estéreo acima da bateria grande do nosso dispositivo de teste não é particularmente alto nem pode ser descrito como sonoro de forma alguma.
Entretanto, mesmo o muito mais caro Schenker Via 15 Pro muito mais caro, não tem um som melhor. Somente o econômico HP 250 G9 de baixo custo, consegue fazer uma diferença nos dispositivos de escritório e produzir um som razoavelmente bom.
Ninkear A15 Plus (16+512) análise de áudio
(±) | o volume do alto-falante é médio, mas bom (###valor### dB)
Graves 100 - 315Hz
(-) | quase nenhum baixo - em média 20% menor que a mediana
(±) | a linearidade dos graves é média (8.1% delta para a frequência anterior)
Médios 400 - 2.000 Hz
(±) | médios mais altos - em média 8% maior que a mediana
(±) | a linearidade dos médios é média (11.9% delta para frequência anterior)
Altos 2 - 16 kHz
(±) | máximos mais altos - em média 7.2% maior que a mediana
(±) | a linearidade dos máximos é média (8.2% delta para frequência anterior)
Geral 100 - 16.000 Hz
(-) | o som geral não é linear (30.8% diferença em relação à mediana)
Comparado com a mesma classe
» 92% de todos os dispositivos testados nesta classe foram melhores, 3% semelhantes, 5% piores
» O melhor teve um delta de 7%, a média foi 21%, o pior foi 53%
Comparado com todos os dispositivos testados
» 89% de todos os dispositivos testados foram melhores, 3% semelhantes, 8% piores
» O melhor teve um delta de 4%, a média foi 23%, o pior foi 134%
Schenker VIA 15 Pro M22 análise de áudio
(±) | o volume do alto-falante é médio, mas bom (###valor### dB)
Graves 100 - 315Hz
(-) | quase nenhum baixo - em média 22.2% menor que a mediana
(±) | a linearidade dos graves é média (12% delta para a frequência anterior)
Médios 400 - 2.000 Hz
(±) | médios mais altos - em média 5.1% maior que a mediana
(±) | a linearidade dos médios é média (10.2% delta para frequência anterior)
Altos 2 - 16 kHz
(+) | agudos equilibrados - apenas 4.3% longe da mediana
(+) | os máximos são lineares (6.6% delta da frequência anterior)
Geral 100 - 16.000 Hz
(±) | a linearidade do som geral é média (22.8% diferença em relação à mediana)
Comparado com a mesma classe
» 63% de todos os dispositivos testados nesta classe foram melhores, 8% semelhantes, 29% piores
» O melhor teve um delta de 7%, a média foi 21%, o pior foi 53%
Comparado com todos os dispositivos testados
» 68% de todos os dispositivos testados foram melhores, 5% semelhantes, 27% piores
» O melhor teve um delta de 4%, a média foi 23%, o pior foi 134%
HP 250 G9 7N029ES análise de áudio
(±) | o volume do alto-falante é médio, mas bom (###valor### dB)
Graves 100 - 315Hz
(-) | quase nenhum baixo - em média 21.3% menor que a mediana
(±) | a linearidade dos graves é média (10.2% delta para a frequência anterior)
Médios 400 - 2.000 Hz
(+) | médios equilibrados - apenas 4.3% longe da mediana
(+) | médios são lineares (5.9% delta para frequência anterior)
Altos 2 - 16 kHz
(+) | agudos equilibrados - apenas 1.5% longe da mediana
(+) | os máximos são lineares (4% delta da frequência anterior)
Geral 100 - 16.000 Hz
(±) | a linearidade do som geral é média (16% diferença em relação à mediana)
Comparado com a mesma classe
» 19% de todos os dispositivos testados nesta classe foram melhores, 6% semelhantes, 76% piores
» O melhor teve um delta de 7%, a média foi 21%, o pior foi 53%
Comparado com todos os dispositivos testados
» 25% de todos os dispositivos testados foram melhores, 5% semelhantes, 69% piores
» O melhor teve um delta de 4%, a média foi 23%, o pior foi 134%
Consumo de energia
A Ninkear fornece uma fonte de alimentação de 65 W para o A15 Plus. Isso é perfeitamente adequado, pois o laptop quase não consome o conversor de tensão, mesmo durante fases curtas de aumento.
| desligado | |
| Ocioso | |
| Carga |
|
Key:
min: | |
Power consumption: Integrated display
Power consumption: External monitor
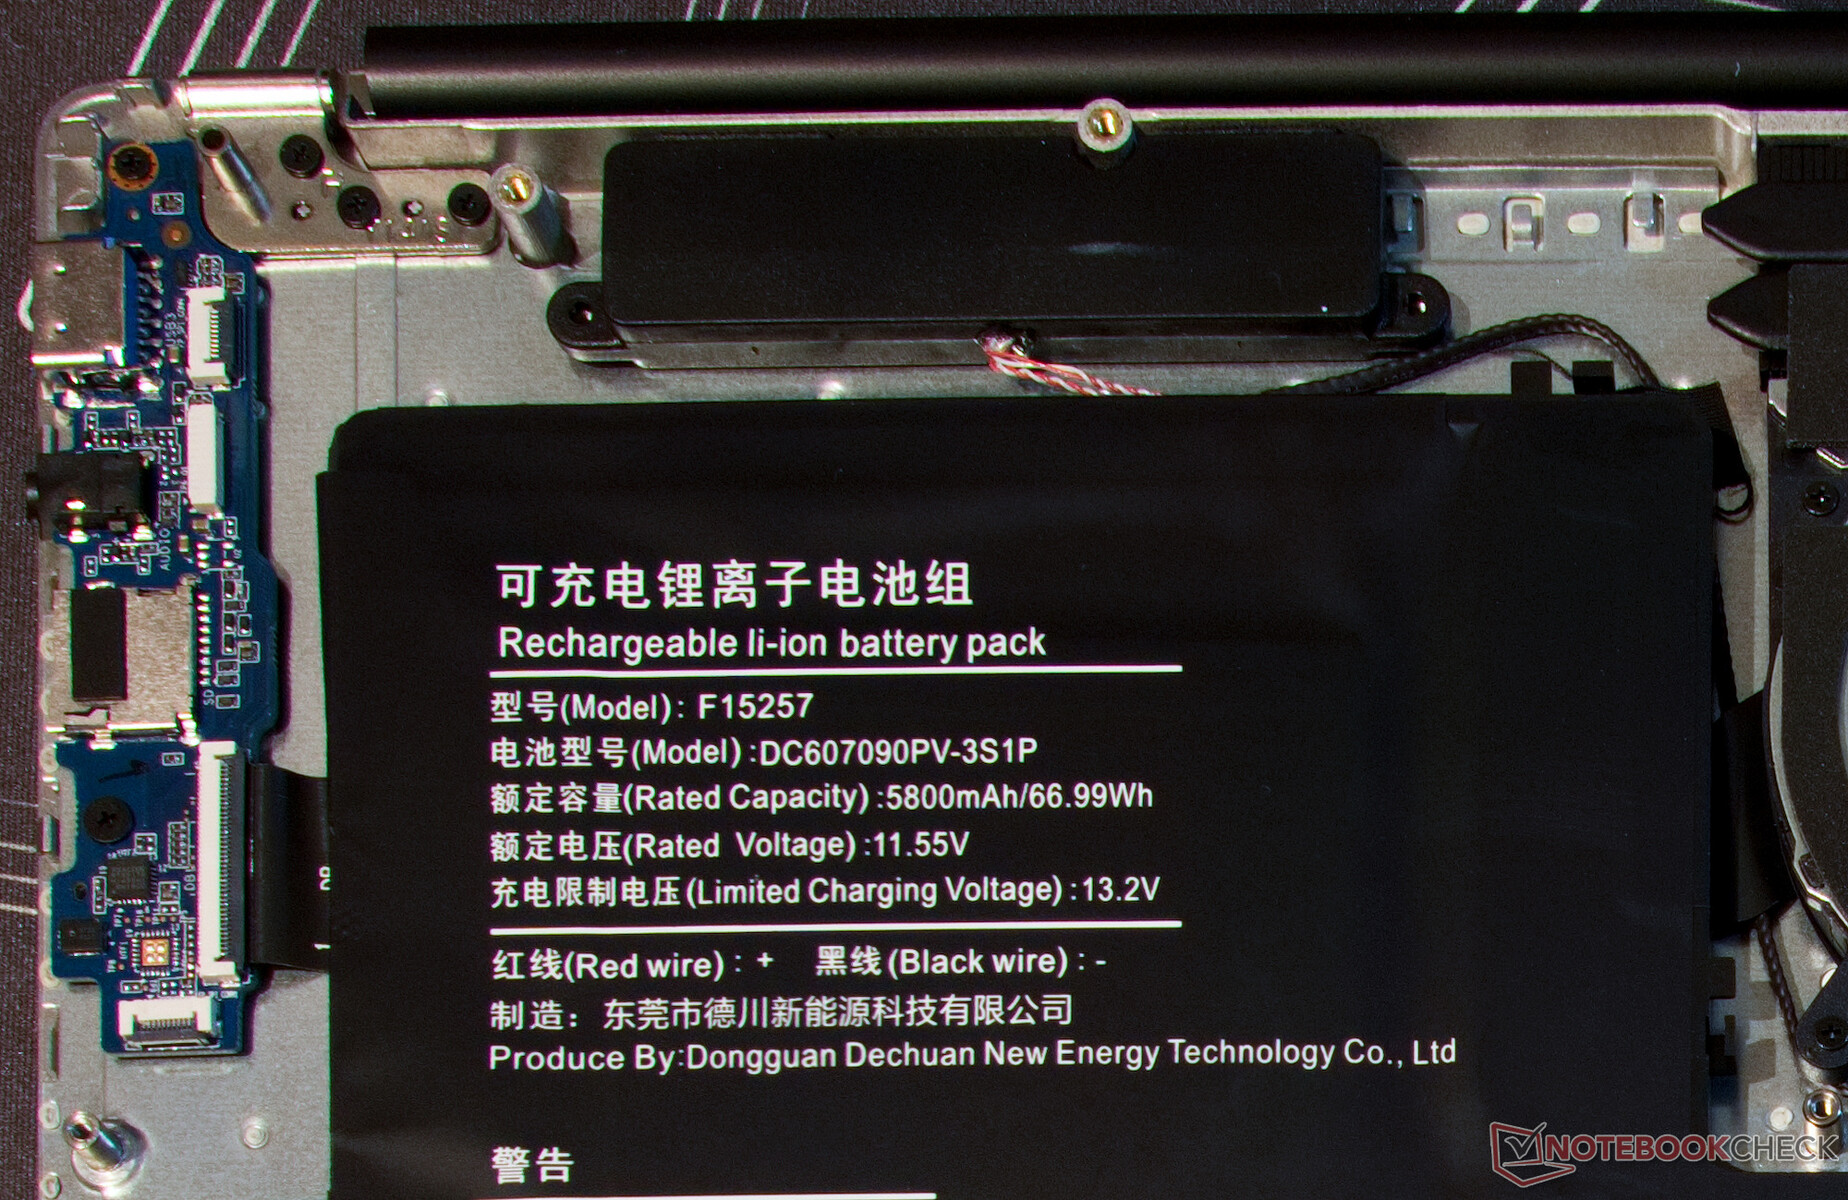
Duração da bateria
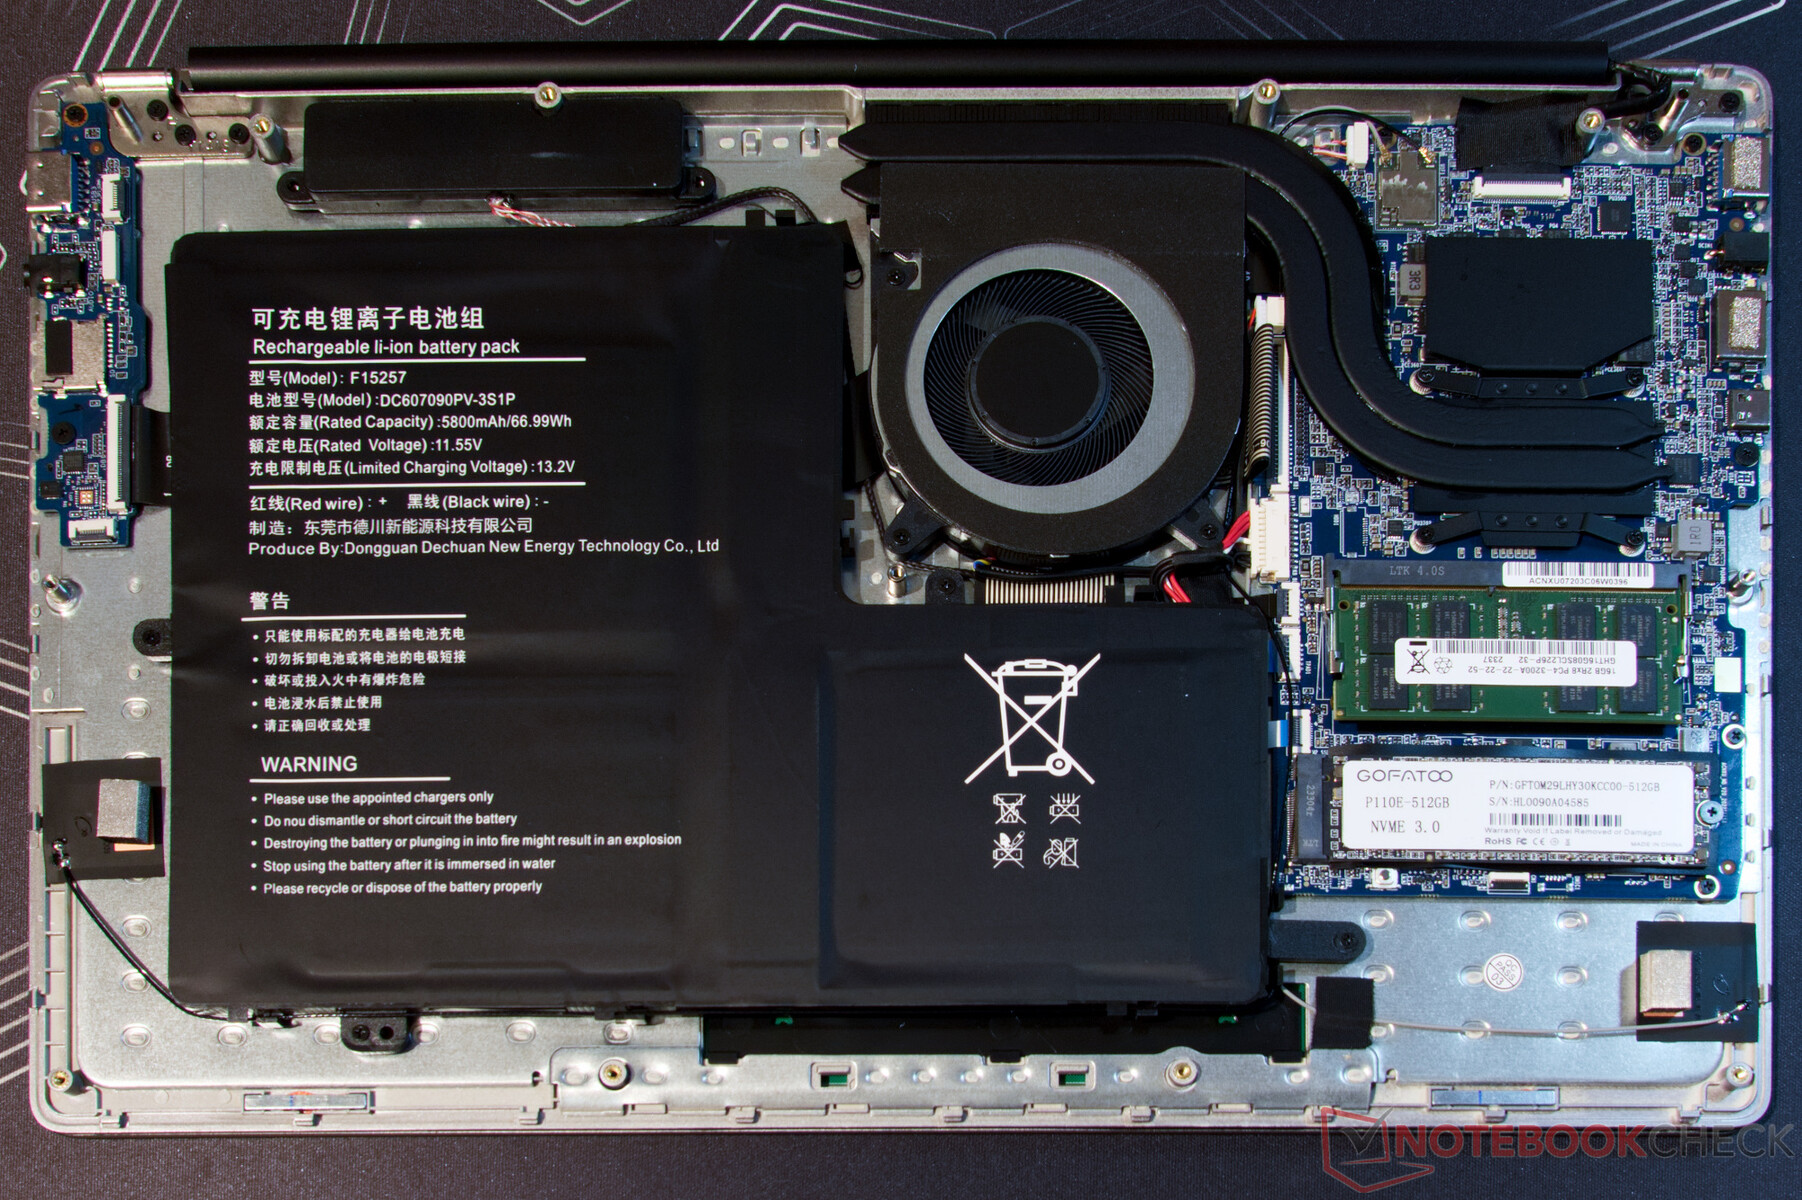
Mais de um terço do espaço ocupado pelo dispositivo de teste é ocupado pela bateria, que tem uma capacidade de quase 67 Whr. Em conjunto com o processador econômico e os requisitos de energia geralmente baixos do nosso dispositivo de teste, isso resulta em uma longa duração da bateria.
O Ninkear A15 Plus dura mais de 10 horas sem uma fonte de alimentação ao navegar. Isso coloca o laptop de escritório quase no mesmo nível do Schenker Via 15 Pro, que tem a maior duração de bateria na comparação.
| Ninkear A15 Plus (16+512) R7 5700U, Vega 8, 64.9 Wh | Lenovo IdeaPad 5 Pro 16ARH7 R5 6600HS, Radeon 660M, 75 Wh | Eurocom C315 Blitz i7-1360P, Iris Xe G7 96EUs, 73 Wh | Schenker VIA 15 Pro M22 R7 5700U, Vega 8, 91 Wh | HP 250 G9 7N029ES i3-1215U, UHD Graphics 64EUs, 41 Wh | Asus P1511CEA-BQ753R i3-1115G4, UHD Graphics Xe G4 48EUs, 37 Wh | Média da turma Office | |
|---|---|---|---|---|---|---|---|
| Duração da bateria | |||||||
| WiFi v1.3 (h) | 10.6 | 9.8 -8% | 8 -25% | 11 4% | 6 -43% | 5.2 -51% | 13.2 ? 25% |
Pro
Contra
Veredicto: Definitivamente não é sucata chinesa

O Ninkear A15 Plus tem potência mais do que suficiente para o uso diário, é silencioso, tem um teclado forte e uma caixa de metal leve e atraente que custará de 500 a 550 euros. Comparativamente, isso é pouco. Comparativamente, o Schenker Via 15 Pro M22 é um pouco mais bem equipado em muitas áreas do que o nosso dispositivo de teste, mas, no final das contas, é duas vezes mais caro.
Para conseguir o preço baixo, a Ninkear explorou agressivamente as oportunidades de economia em algumas áreas. A RAM de canal único e o módulo WLAN relativamente lento provavelmente serão os menos perceptíveis no uso normal. Os alto-falantes fracos e a tela não exatamente brilhante provavelmente serão muito mais irritantes.
Entretanto, os notebooks mais baratos de fabricantes conhecidos, como HP ou Asus, geralmente não são mais bem equipados nessa área e também têm processadores significativamente mais fracos. Dito isso, a bateria grande e a licença do Windows 11 Pro também são incomuns para essa faixa de preço.
O Ninkear A15 Plus prova ser um laptop útil para o escritório doméstico no teste. O bom desempenho encontra um design atraente. No entanto, aspectos como os alto-falantes, a WLAN e o brilho da tela precisam ser comprometidos.
Na verdade, o Ninkear A15 Plus demonstra ser um forte concorrente dos nossos dispositivos de comparação. O notebook de escritório tem uma caixa atraente e é mais do que utilizável no geral. Para HP 250 G9 ou Asus P1511CEA as coisas podem ficar competitivas se os fabricantes chineses de notebooks continuarem a entrar no mercado europeu.
O Ninkear A15 Plus mostra que é tudo menos lixo chinês. Ficamos agradavelmente surpresos com o dispositivo e teríamos esperado muito menos por esse preço baixo. O único ponto negativo do Ninkear é provavelmente a garantia. Às vezes, é difícil reivindicar ambas com dispositivos e revendedores do Extremo Oriente.
Preço e disponibilidade
Infelizmente, nossa configuração 16+512 do Ninkear A15 Plus está atualmente fora de estoque em quase todos os lugares. Com 32 GB de RAM e um SSD NVMe de um TB, o laptop custa atualmente €617 na Tomtop com frete de um depósito alemão. Isso significa que não há taxas alfandegárias ou encargos semelhantes na UE.
Ninkear A15 Plus (16+512)
- 02/22/2024 v7 (old)
Marc Herter
Transparência
A seleção dos dispositivos a serem analisados é feita pela nossa equipe editorial. A amostra de teste foi fornecida gratuitamente ao autor pelo fabricante para fins de revisão. Não houve influência de terceiros nesta revisão, nem o fabricante recebeu uma cópia desta revisão antes da publicação. Não houve obrigação de publicar esta revisão. Como empresa de mídia independente, a Notebookcheck não está sujeita à autoridade de fabricantes, varejistas ou editores.
É assim que o Notebookcheck está testando
Todos os anos, o Notebookcheck analisa de forma independente centenas de laptops e smartphones usando procedimentos padronizados para garantir que todos os resultados sejam comparáveis. Desenvolvemos continuamente nossos métodos de teste há cerca de 20 anos e definimos padrões da indústria no processo. Em nossos laboratórios de teste, equipamentos de medição de alta qualidade são utilizados por técnicos e editores experientes. Esses testes envolvem um processo de validação em vários estágios. Nosso complexo sistema de classificação é baseado em centenas de medições e benchmarks bem fundamentados, o que mantém a objetividade.Price comparison
