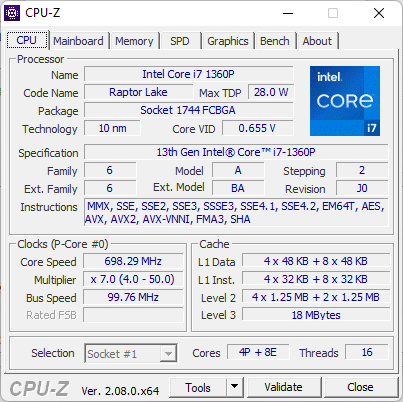
Análise do laptop Eurocom C315 Blitz: O Core i7-1360P é uma mistura

O C315 Blitz é um laptop multimídia fino e leve, de nível básico a médio, da Eurocom, baseado no design do chassi Clevo X170KM. As SKUs variam entre o Core i5-1340P ou Core i7-1360P com uma tela de 1080p ou 2160p (4K). Nossa unidade de análise específica é uma configuração de ponta com as opções Core i7 e 4K.
As alternativas ao C315 Blitz incluem outros notebooks multimídia ou de escritório de 15,6 polegadas, como oAcer Aspire 5 A515 ouAsus VivoBook S15.
Mais análises da Eurocom:
Possíveis concorrentes em comparação
Avaliação | Data | Modelo | Peso | Altura | Size | Resolução | Preço |
|---|---|---|---|---|---|---|---|
| 83.4 % v7 (old) | 11/2023 | Eurocom C315 Blitz i7-1360P, Iris Xe G7 96EUs | 1.7 kg | 19.9 mm | 15.60" | 3840x2160 | |
| 84.3 % v7 (old) | 02/2022 | Schenker Work 15 Tiger Lake-H i7-11370H, Iris Xe G7 96EUs | 1.7 kg | 19.9 mm | 15.60" | 1920x1080 | |
| 86.6 % v7 (old) | 12/2023 | Lenovo ThinkPad L15 Gen 4 21H70021GE R7 PRO 7730U, Vega 8 | 1.9 kg | 19.93 mm | 15.60" | 1920x1080 | |
| 82 % v7 (old) | 09/2023 | Acer Aspire 5 A515-58GM-76S8 i7-1355U, GeForce RTX 2050 Mobile | 1.8 kg | 19.7 mm | 15.60" | 1920x1080 | |
| 83.2 % v7 (old) | 02/2023 | Asus VivoBook S15 M3502RA-L1029W R7 6800H, Radeon 680M | 1.9 kg | 18.8 mm | 15.60" | 1920x1080 | |
| 79.8 % v7 (old) | 08/2022 | Samsung Galaxy Book2 15 i7-1260P, A350M | 1.6 kg | 15 mm | 15.60" | 1920x1080 |
Caso
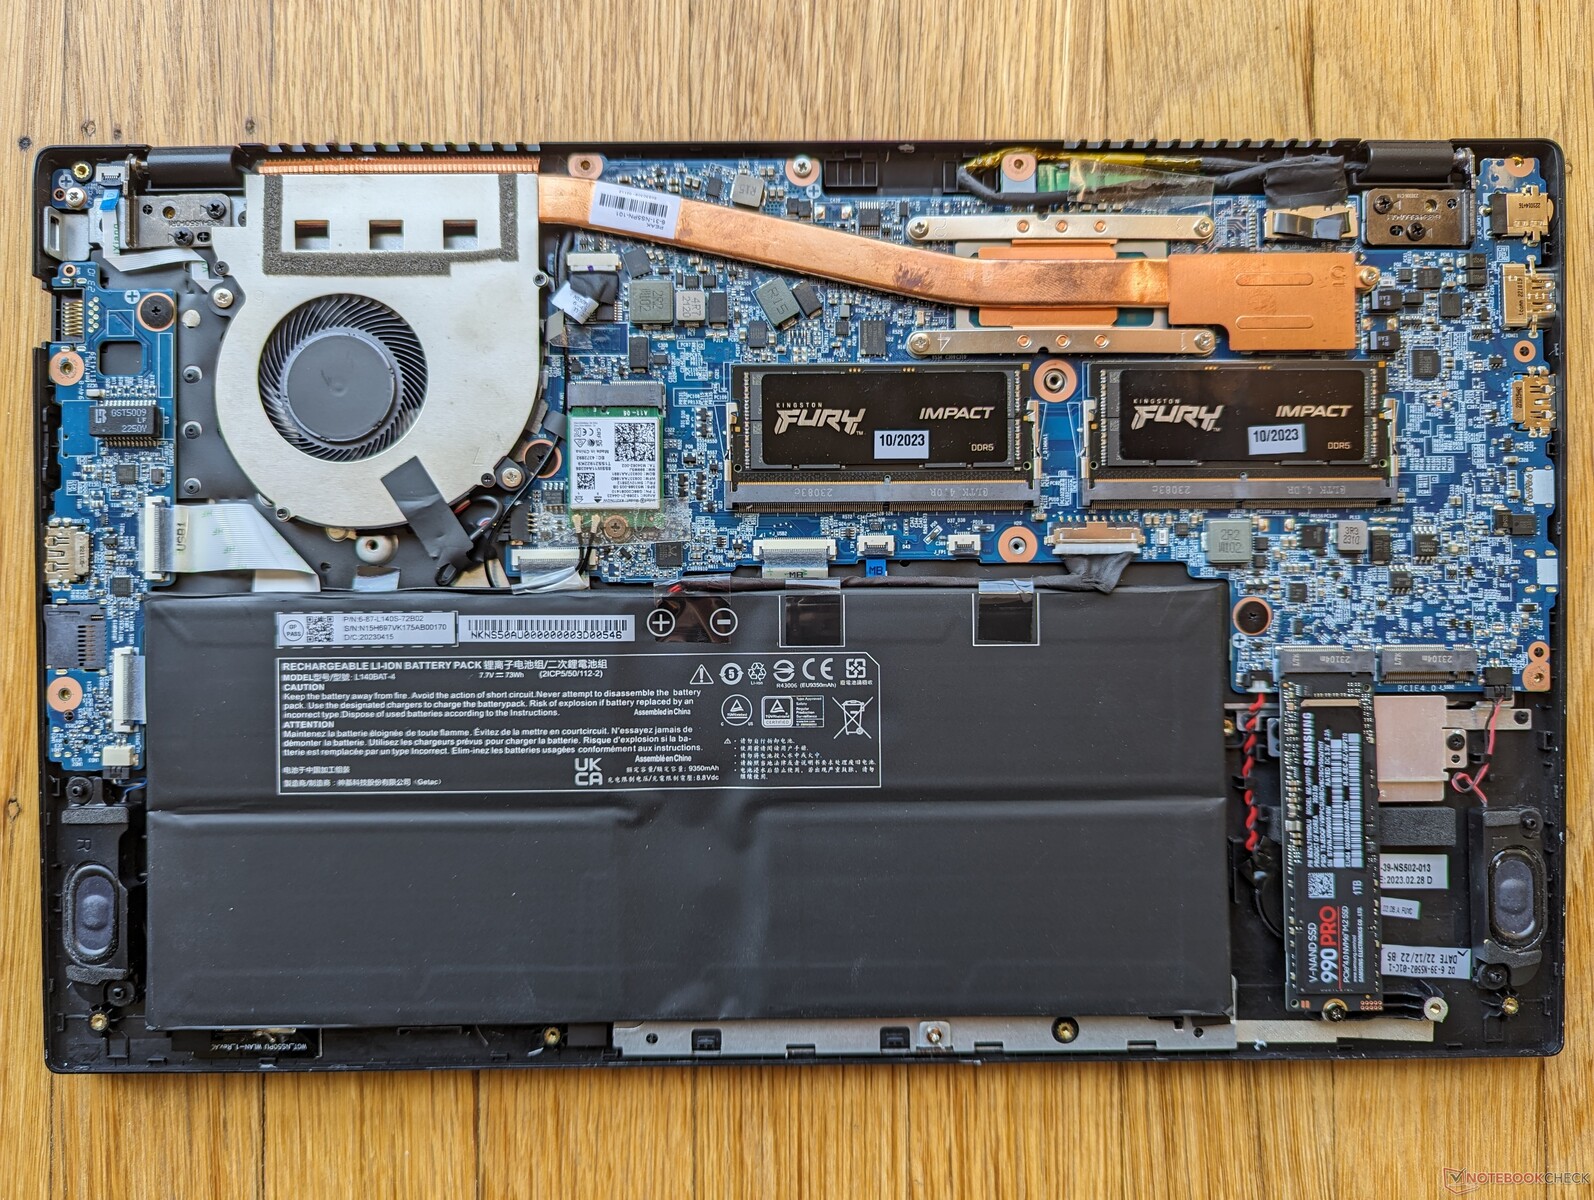
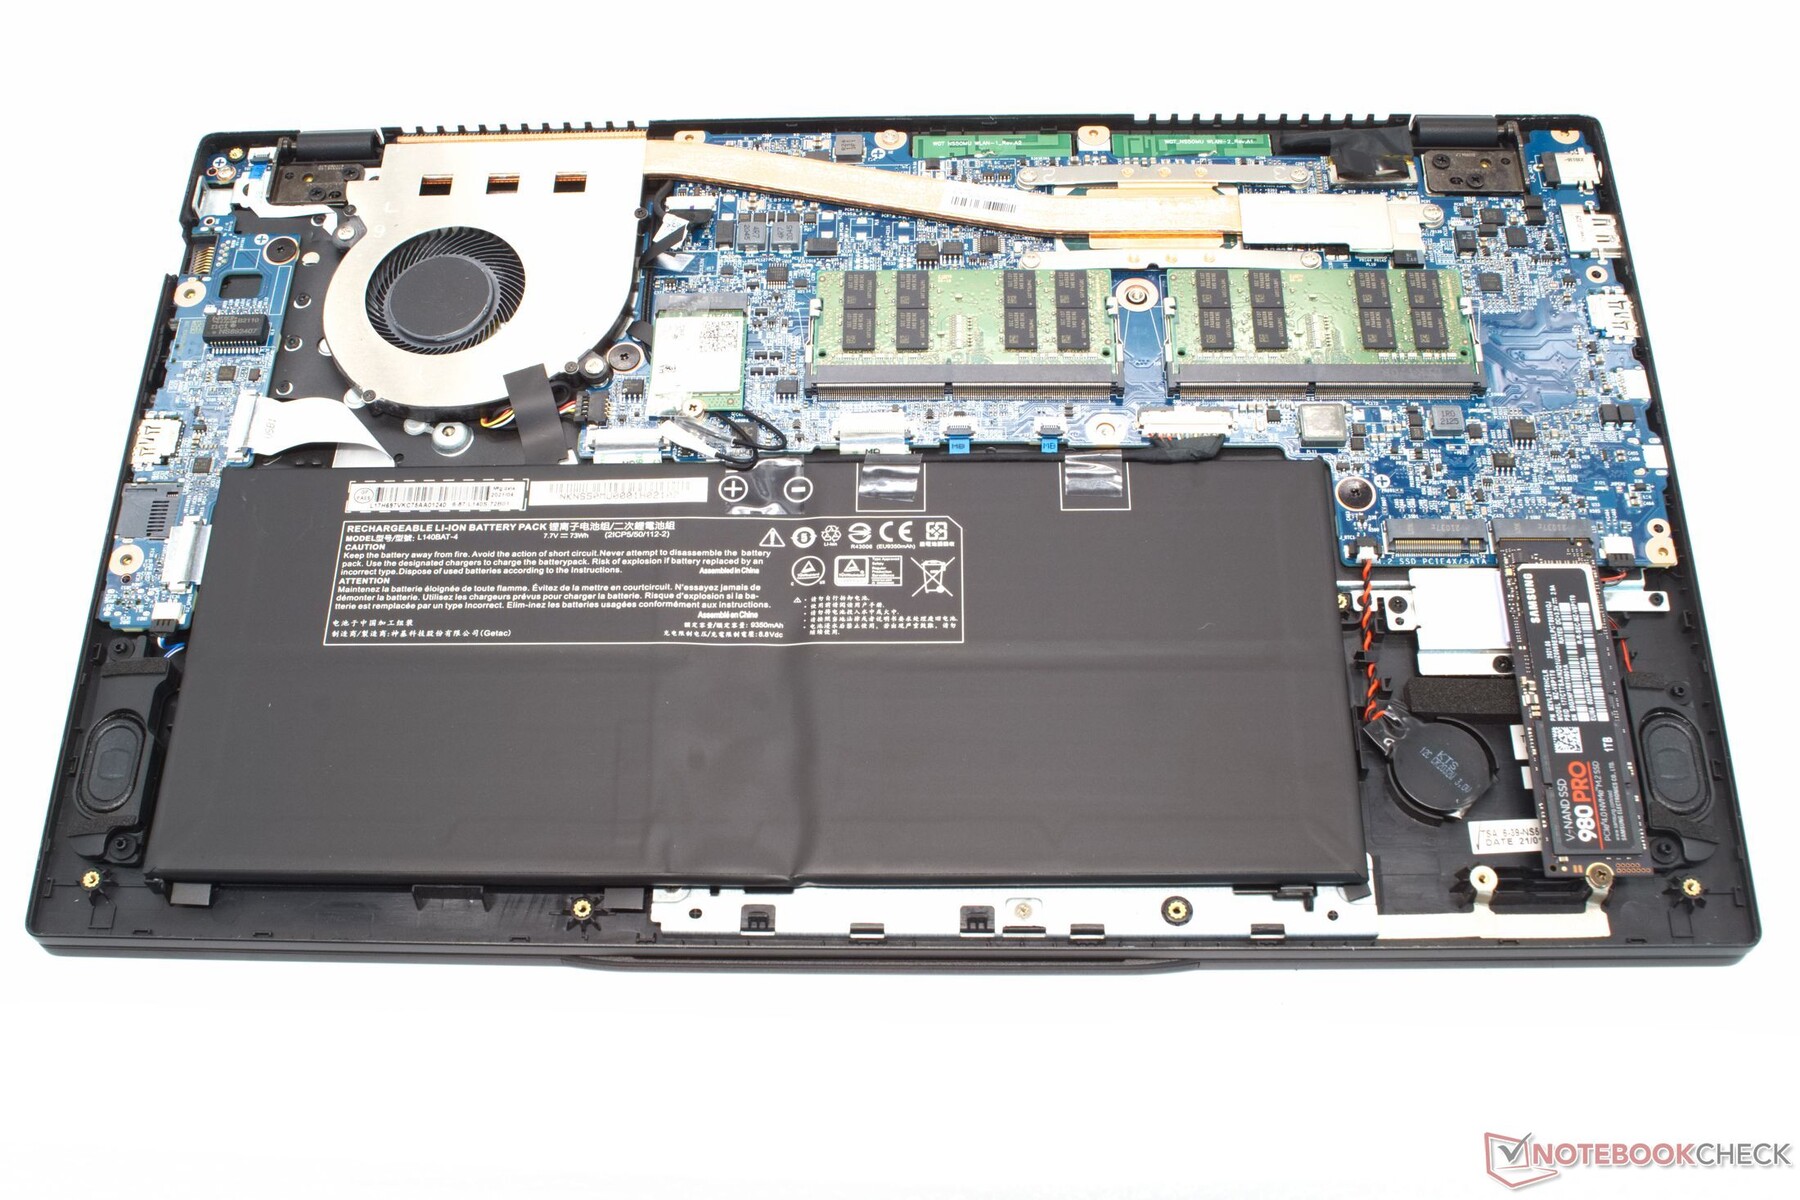
O chassi permanece idêntico ao do ano passado Schenker Work 15 do ano passado, já que ambos são baseados no mesmo chassi X170KM. Observe que apenas uma das duas portas USB-C suporta Thunderbolt, carregamento USB-C e DisplayPort-out.

Leitor de cartão SD
| SD Card Reader | |
| average JPG Copy Test (av. of 3 runs) | |
| Schenker Work 15 Tiger Lake-H (Angelbird AV Pro V60) | |
| Eurocom C315 Blitz (Angelbird AV Pro V60) | |
| Lenovo ThinkPad L15 Gen 4 21H70021GE | |
| Samsung Galaxy Book2 15 (Angelbird AV Pro V60) | |
| maximum AS SSD Seq Read Test (1GB) | |
| Lenovo ThinkPad L15 Gen 4 21H70021GE | |
| Eurocom C315 Blitz (Angelbird AV Pro V60) | |
| Schenker Work 15 Tiger Lake-H (Angelbird AV Pro V60) | |
| Samsung Galaxy Book2 15 (Angelbird AV Pro V60) | |
Comunicação
| Networking | |
| iperf3 transmit AX12 | |
| Schenker Work 15 Tiger Lake-H | |
| iperf3 receive AX12 | |
| Schenker Work 15 Tiger Lake-H | |
| iperf3 transmit AXE11000 | |
| Samsung Galaxy Book2 15 | |
| Lenovo ThinkPad L15 Gen 4 21H70021GE | |
| Eurocom C315 Blitz | |
| Acer Aspire 5 A515-58GM-76S8 | |
| Asus VivoBook S15 M3502RA-L1029W | |
| iperf3 receive AXE11000 | |
| Lenovo ThinkPad L15 Gen 4 21H70021GE | |
| Samsung Galaxy Book2 15 | |
| Eurocom C315 Blitz | |
| Acer Aspire 5 A515-58GM-76S8 | |
| Asus VivoBook S15 M3502RA-L1029W | |
| iperf3 transmit AXE11000 6GHz | |
| Acer Aspire 5 A515-58GM-76S8 | |
| Lenovo ThinkPad L15 Gen 4 21H70021GE | |
| Eurocom C315 Blitz | |
| iperf3 receive AXE11000 6GHz | |
| Lenovo ThinkPad L15 Gen 4 21H70021GE | |
| Acer Aspire 5 A515-58GM-76S8 | |
| Eurocom C315 Blitz | |
Webcam
Embora a Eurocom anuncie uma webcam de 2 MP, o aplicativo de câmera do Windows só permite selecionar até 1 MP ou gravação de 720p30 no máximo.


Manutenção
Garantia
A garantia limitada padrão de um ano se aplica se o produto for adquirido nos EUA. A Eurocom oferece planos de extensão opcionais de até três anos.
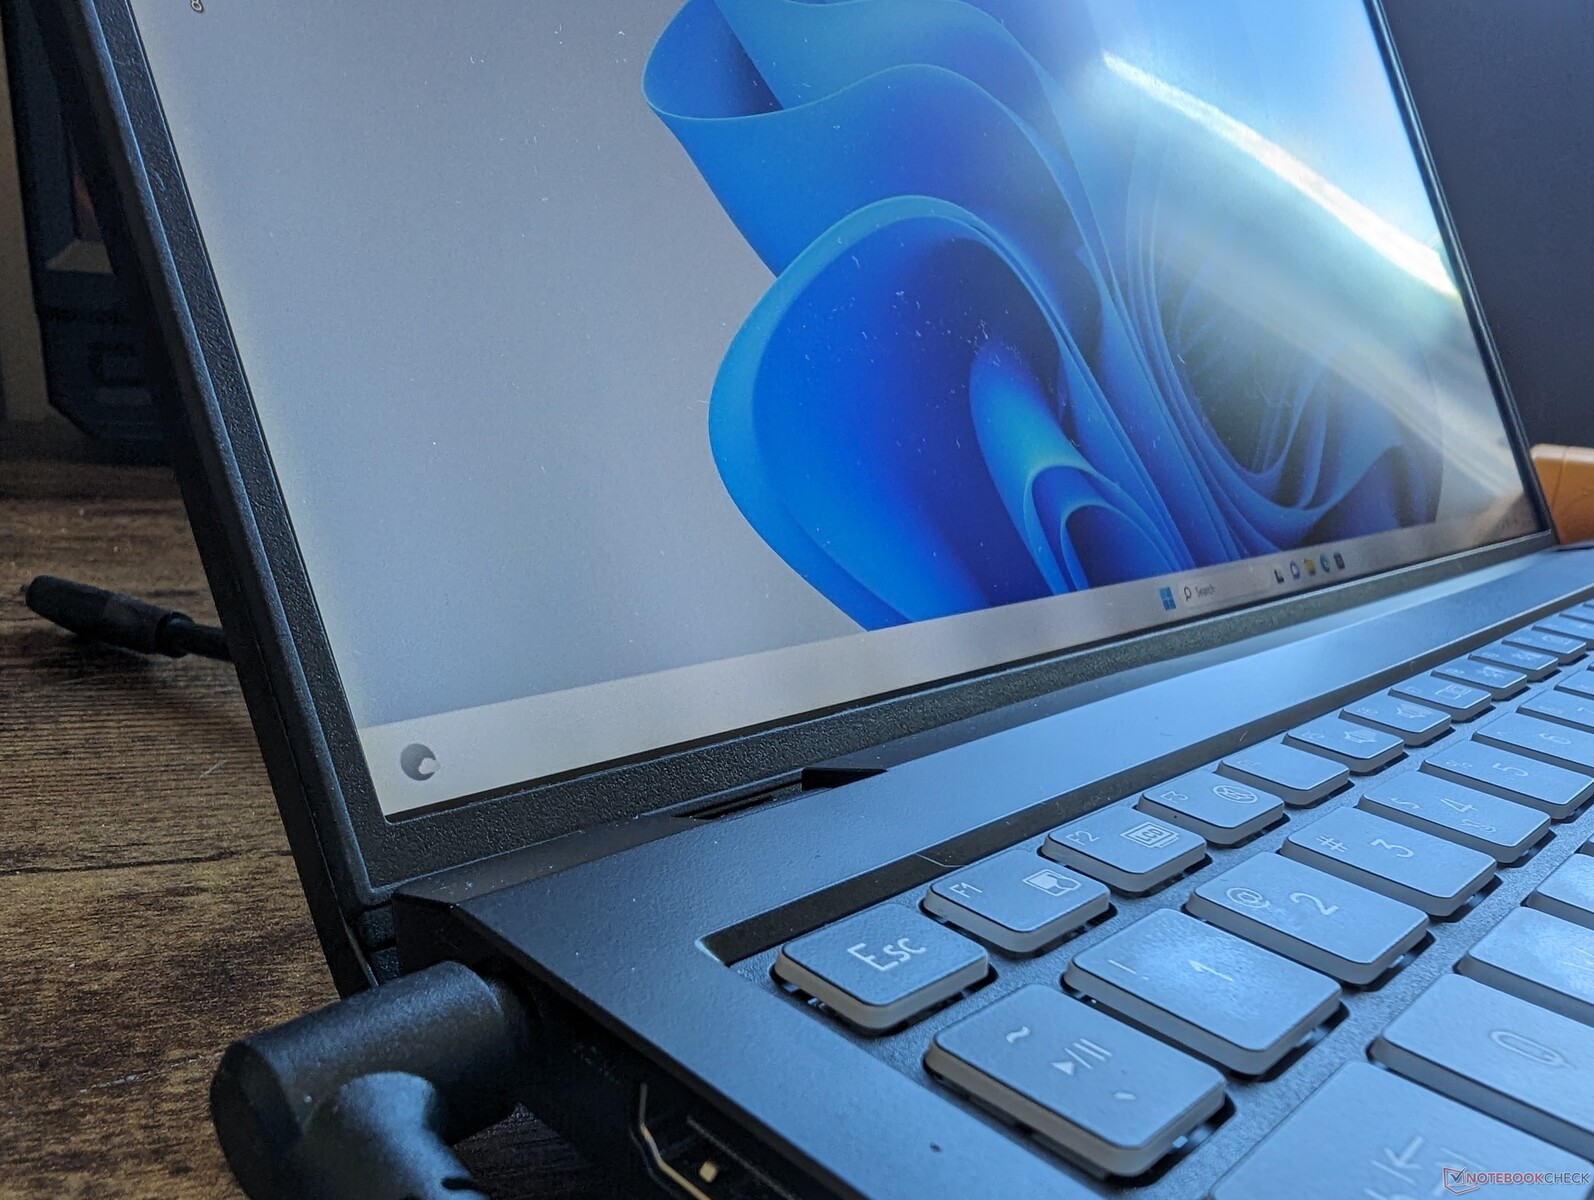
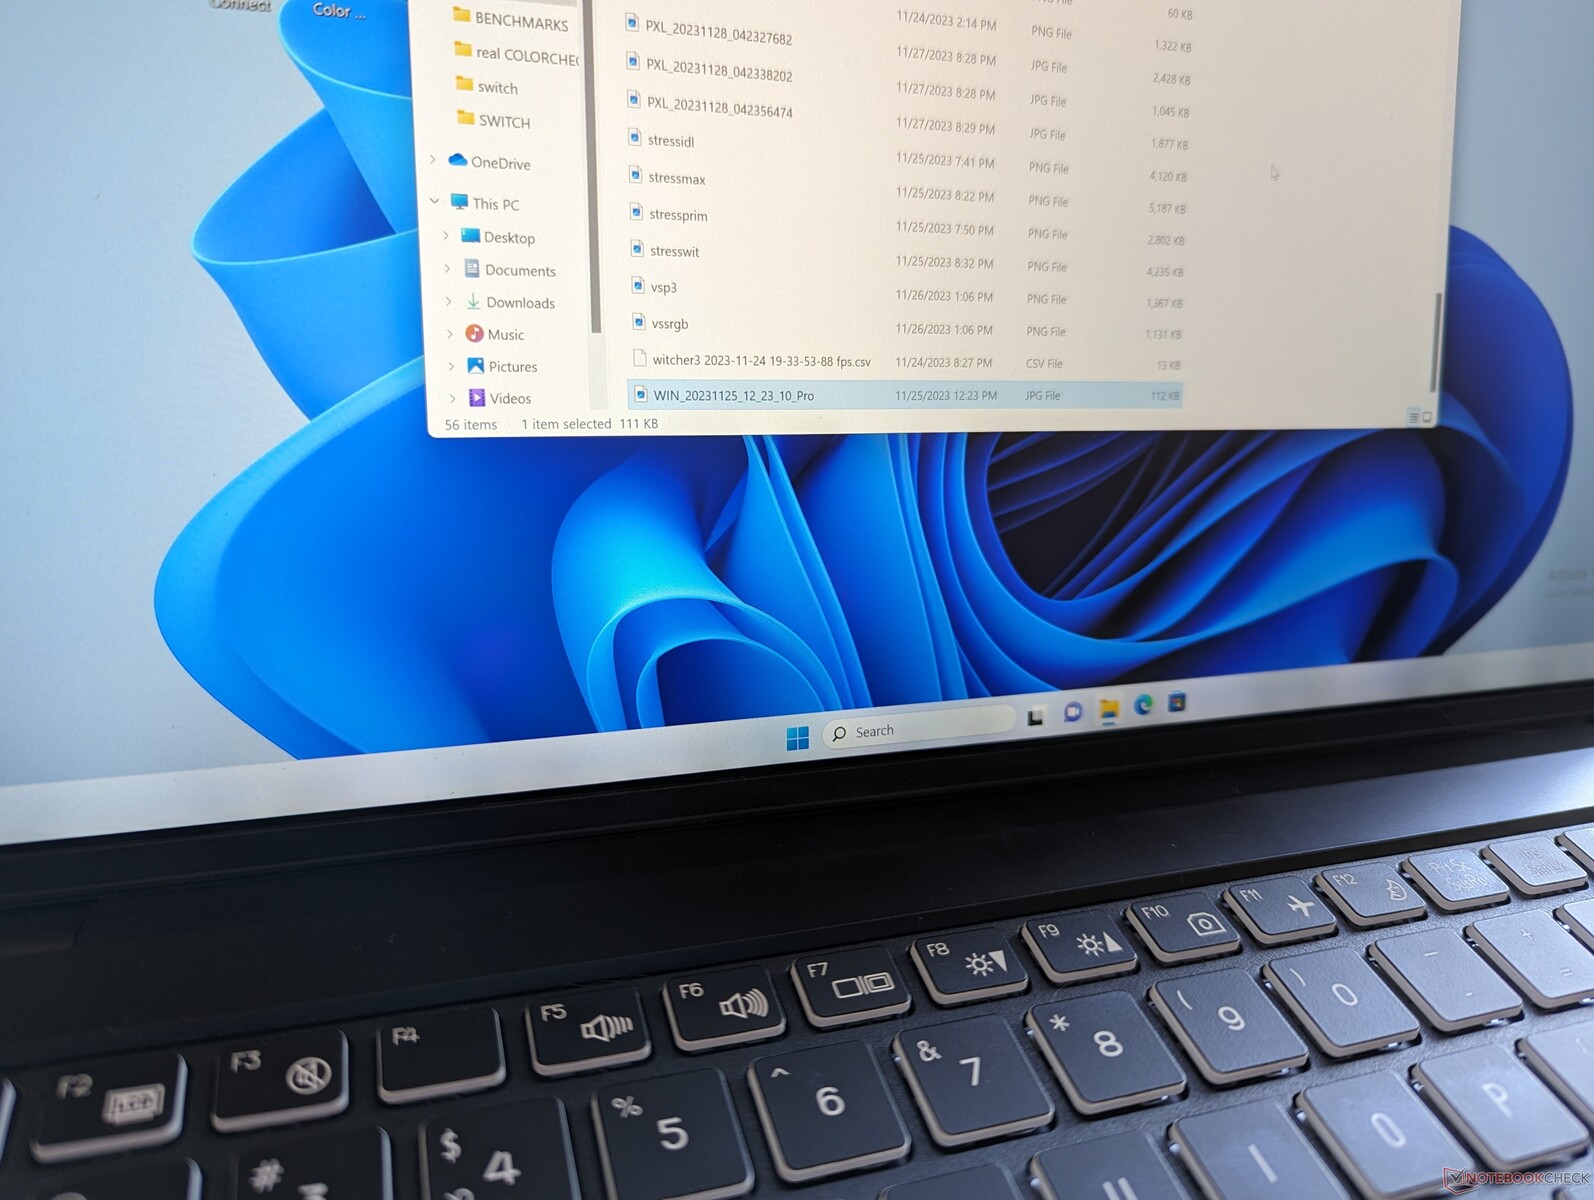
Tela
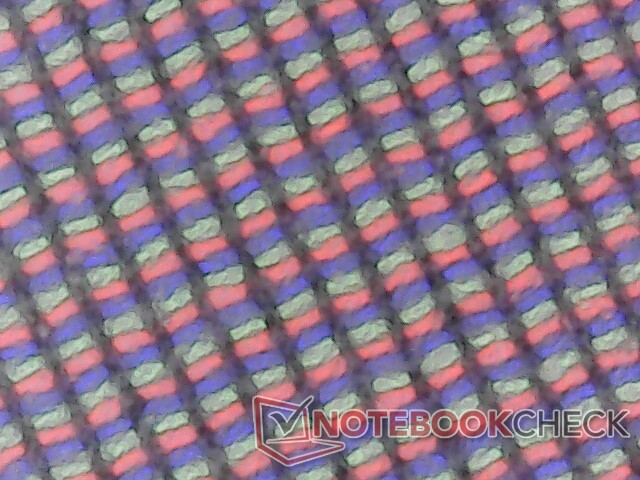
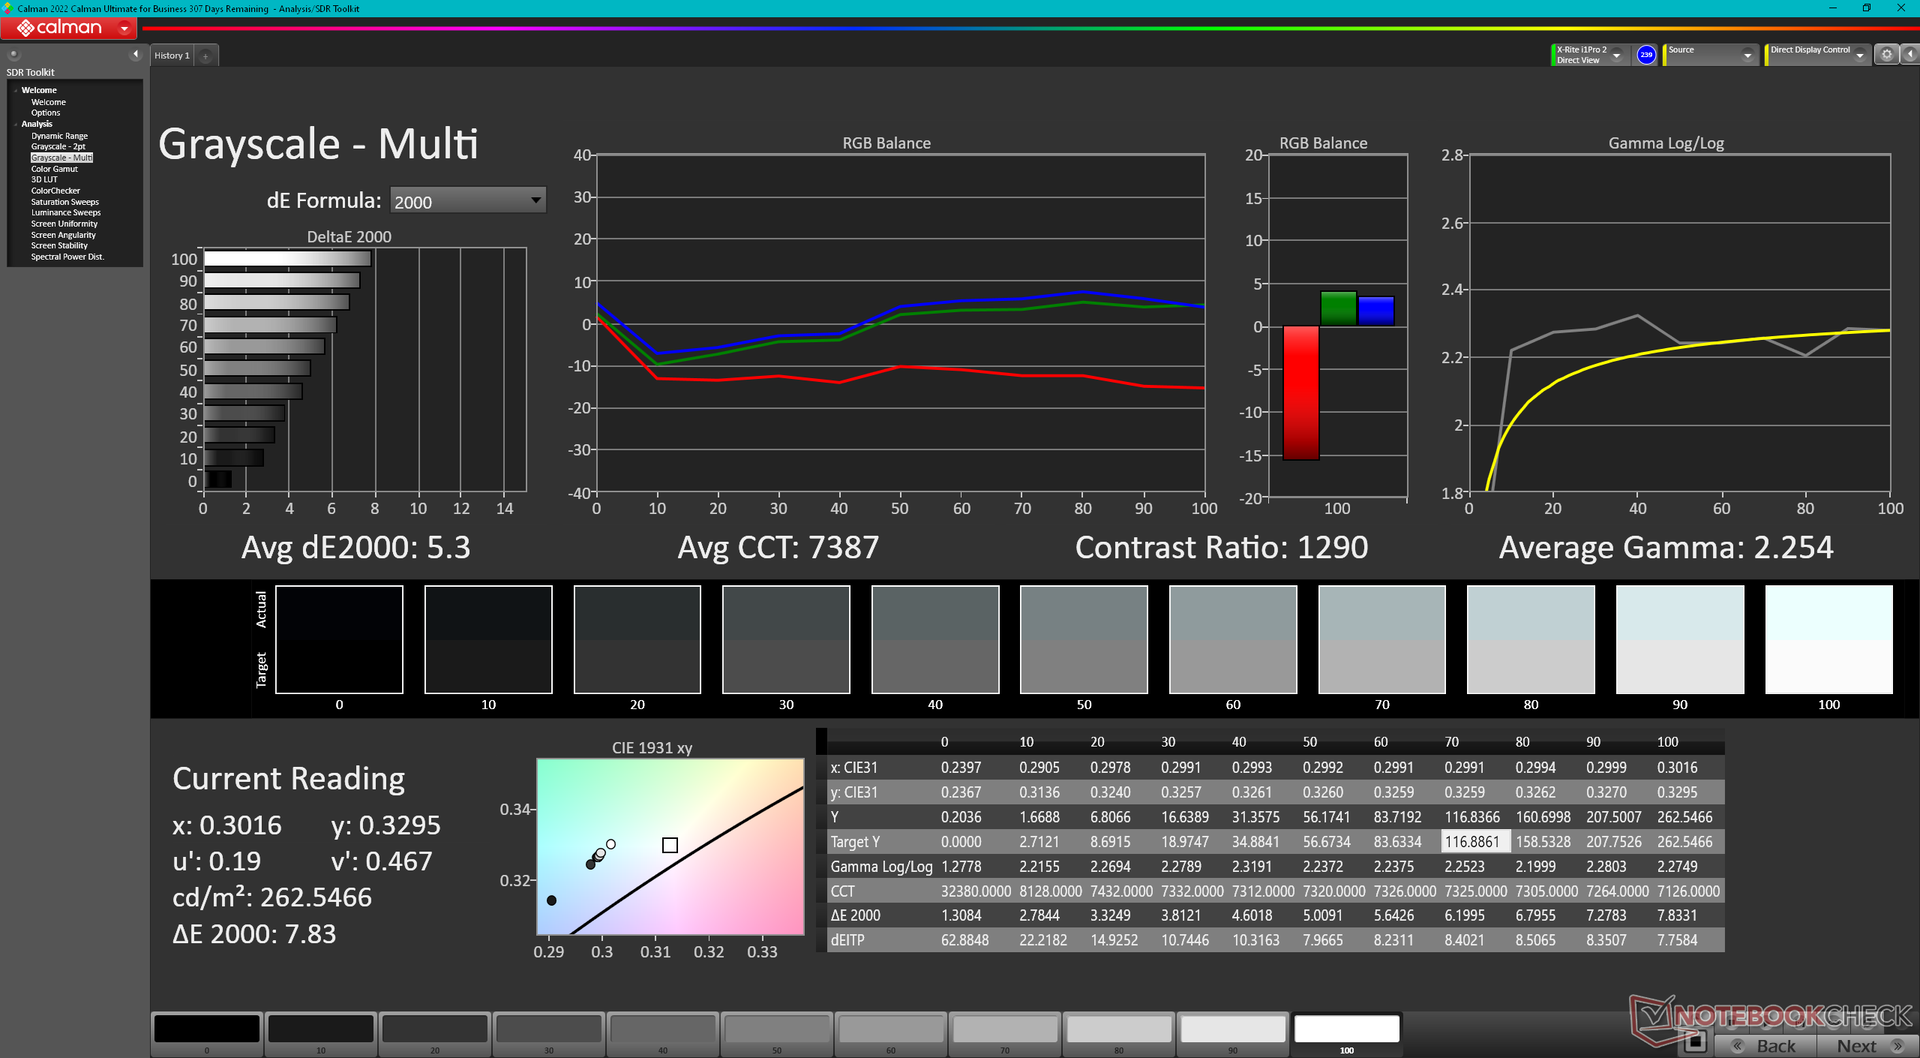
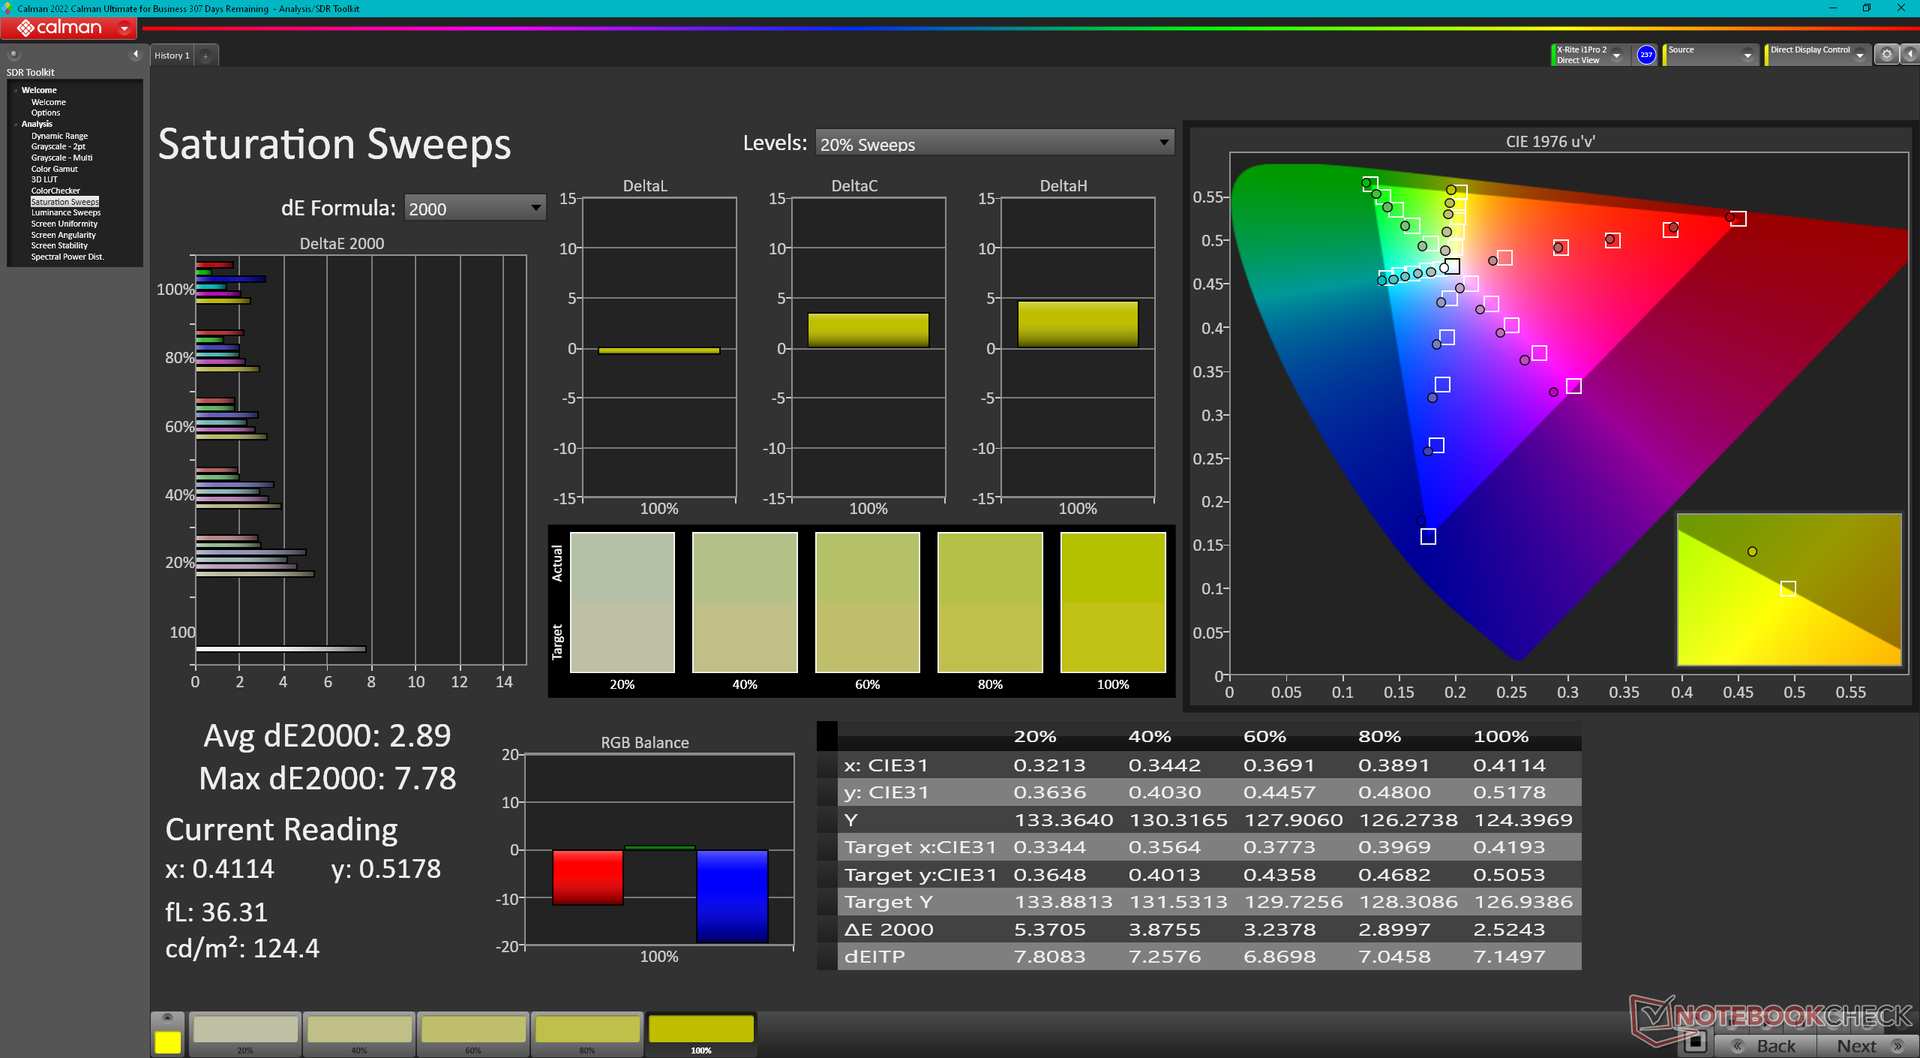
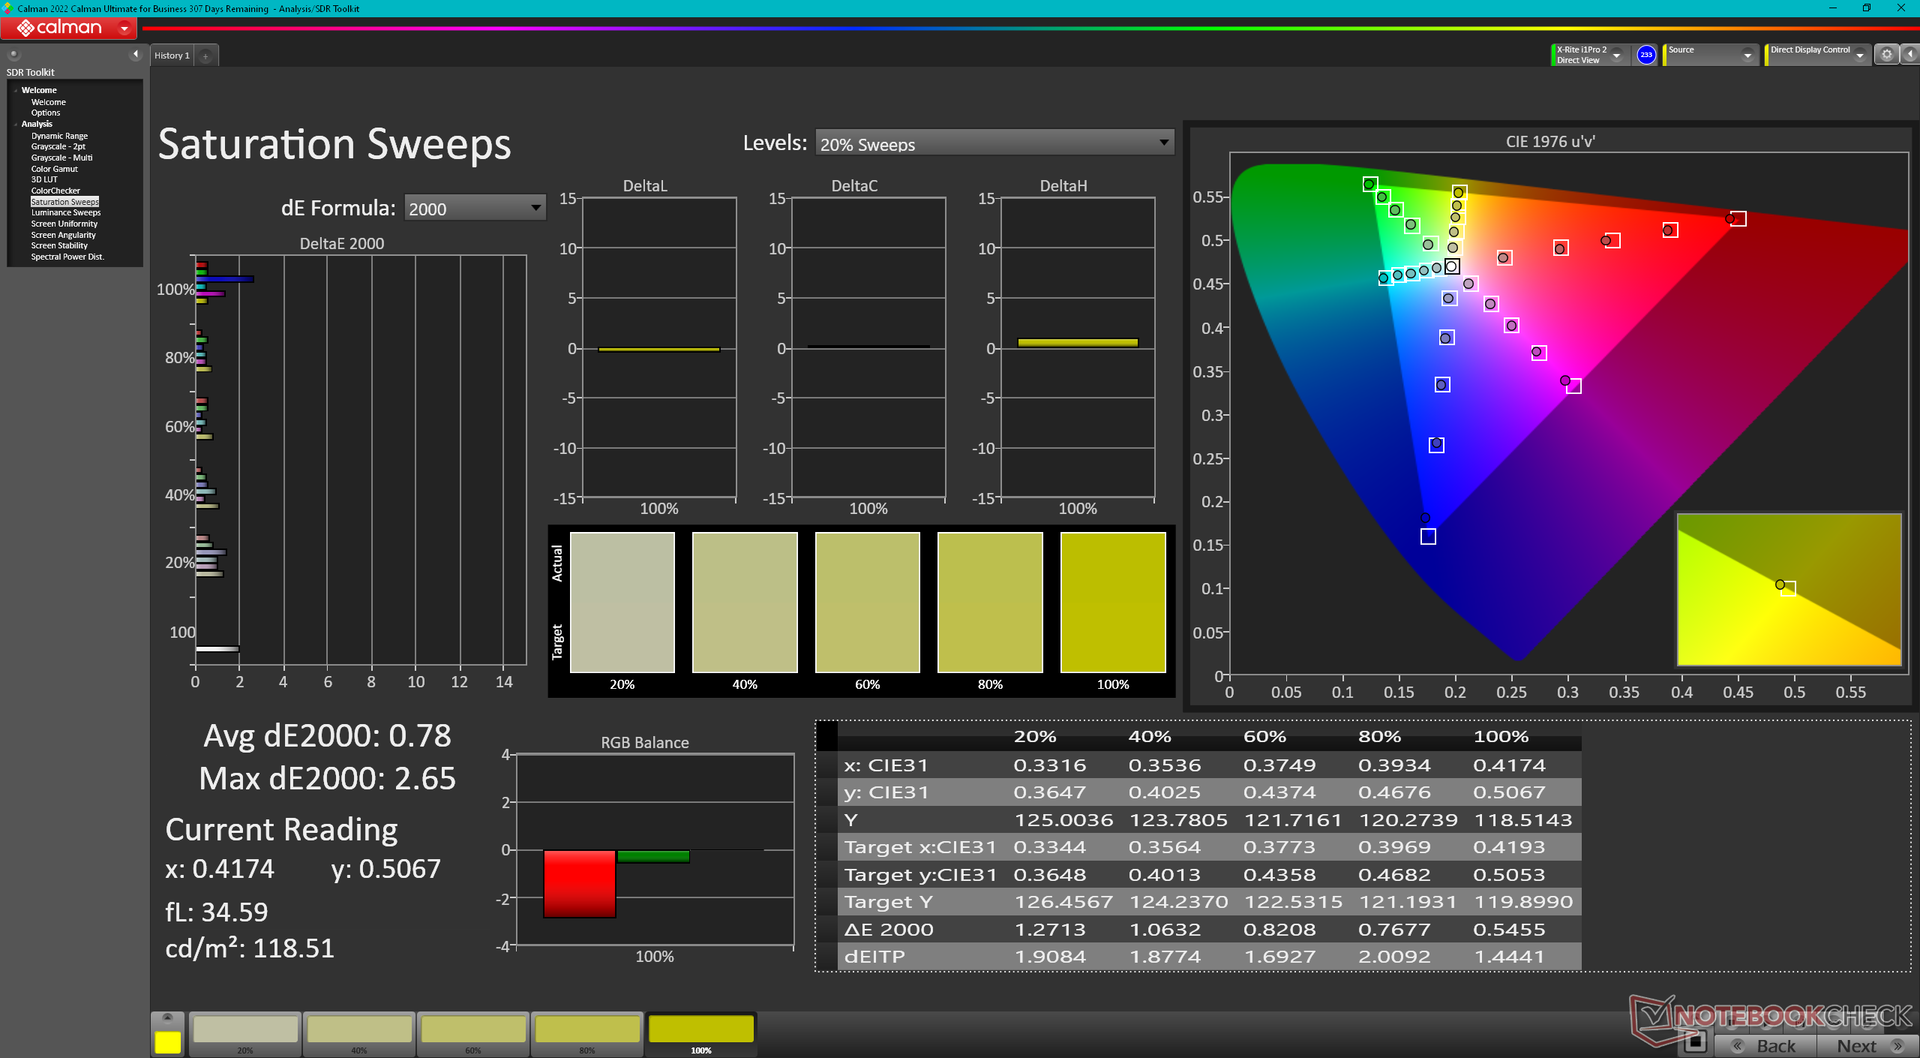
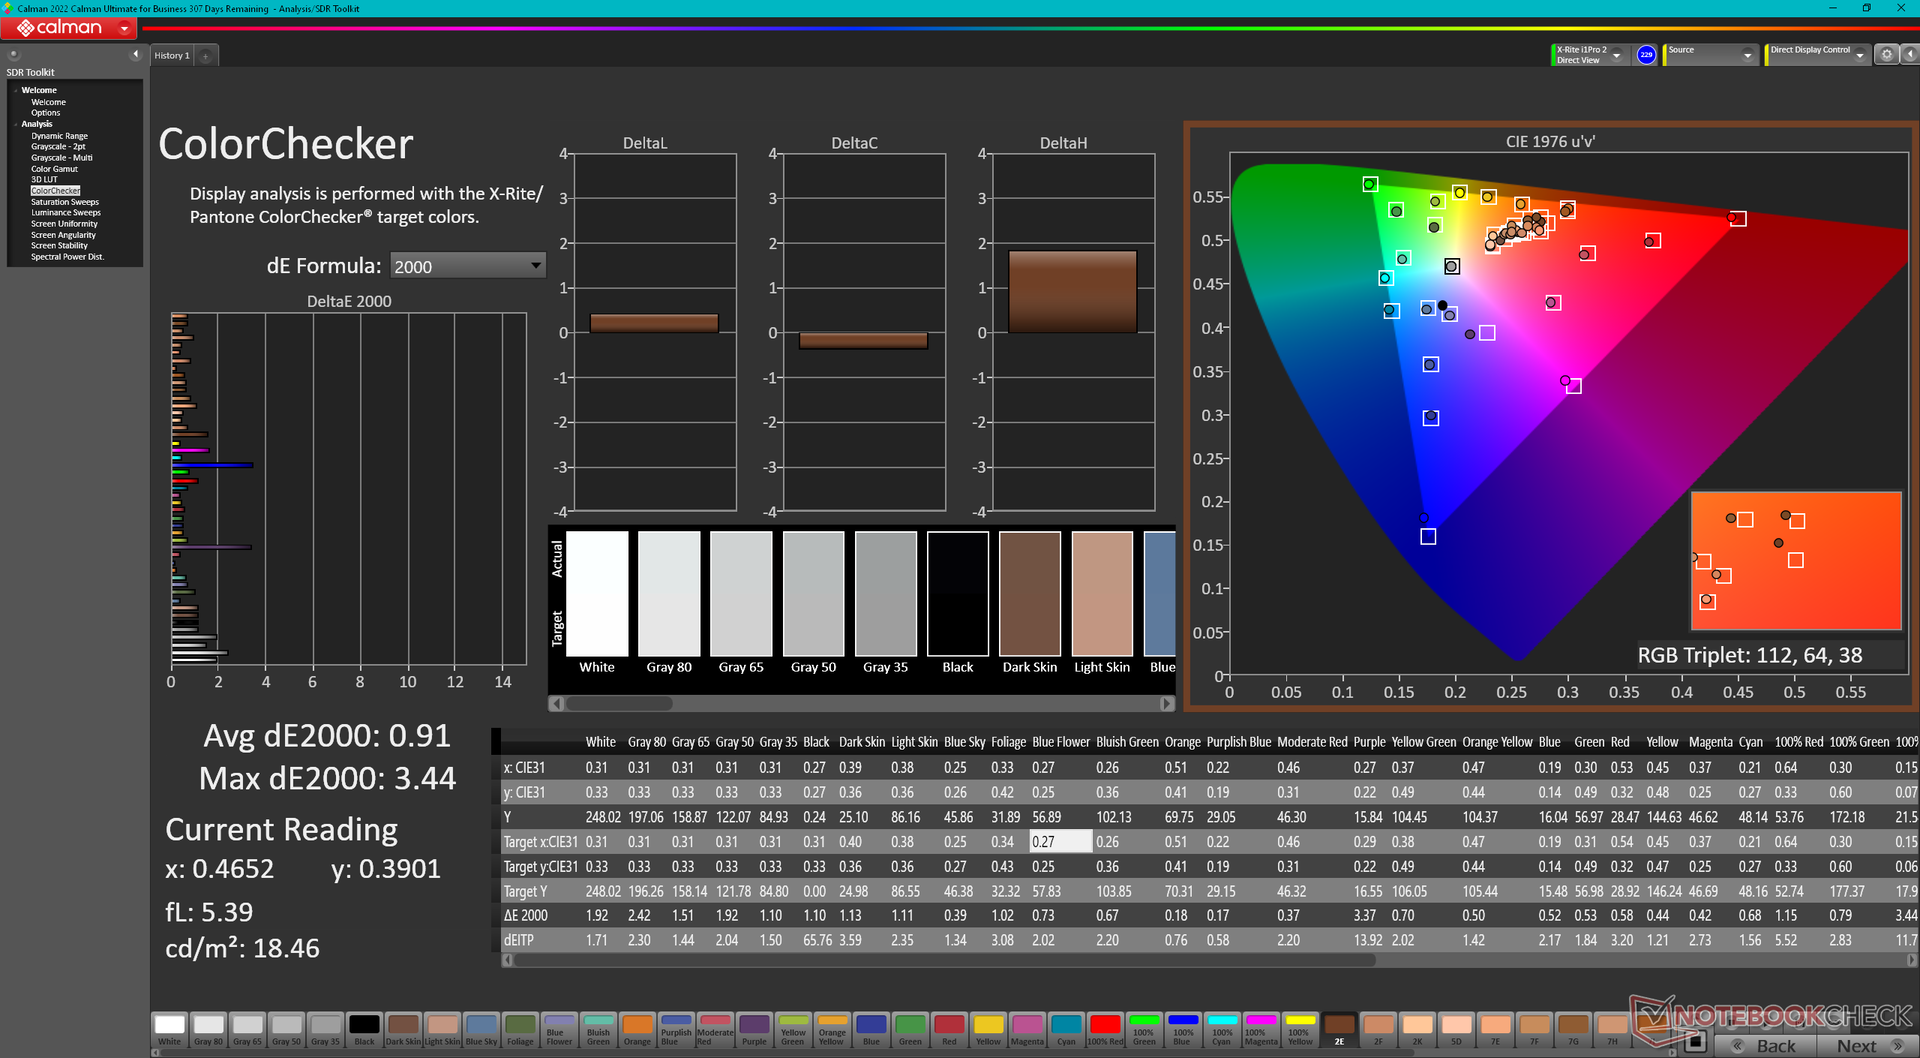
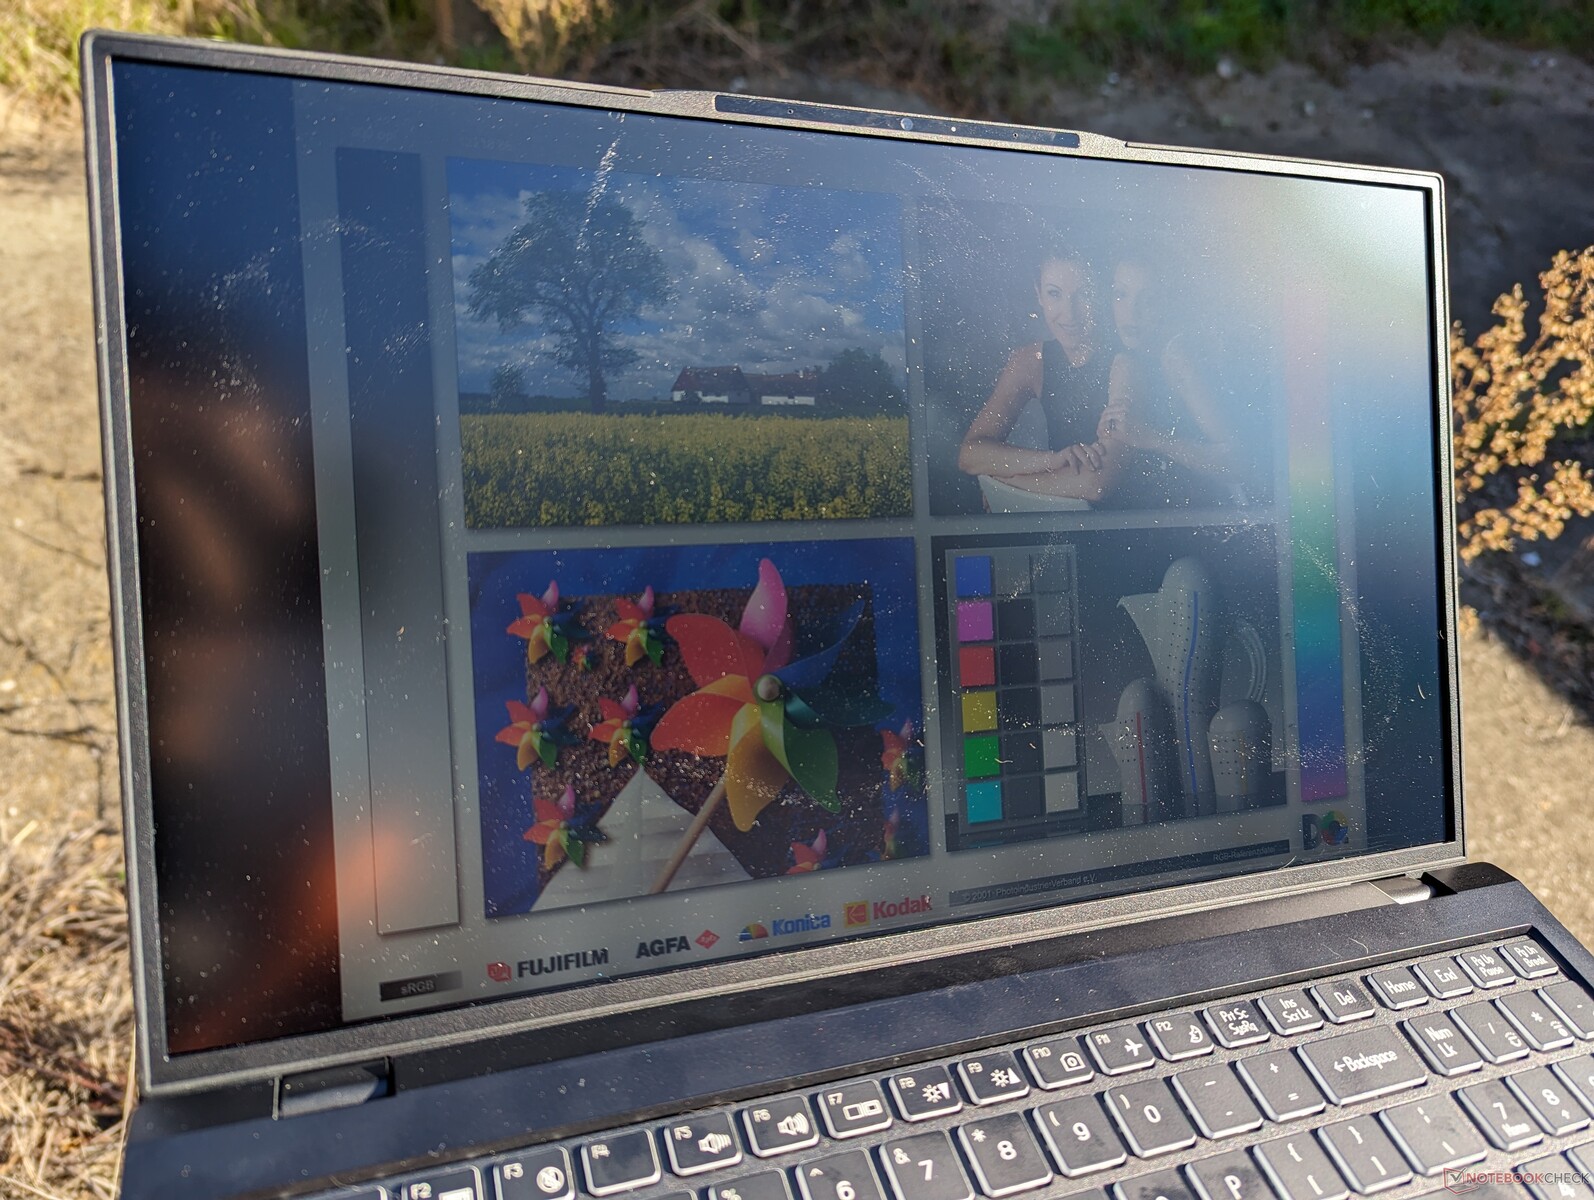
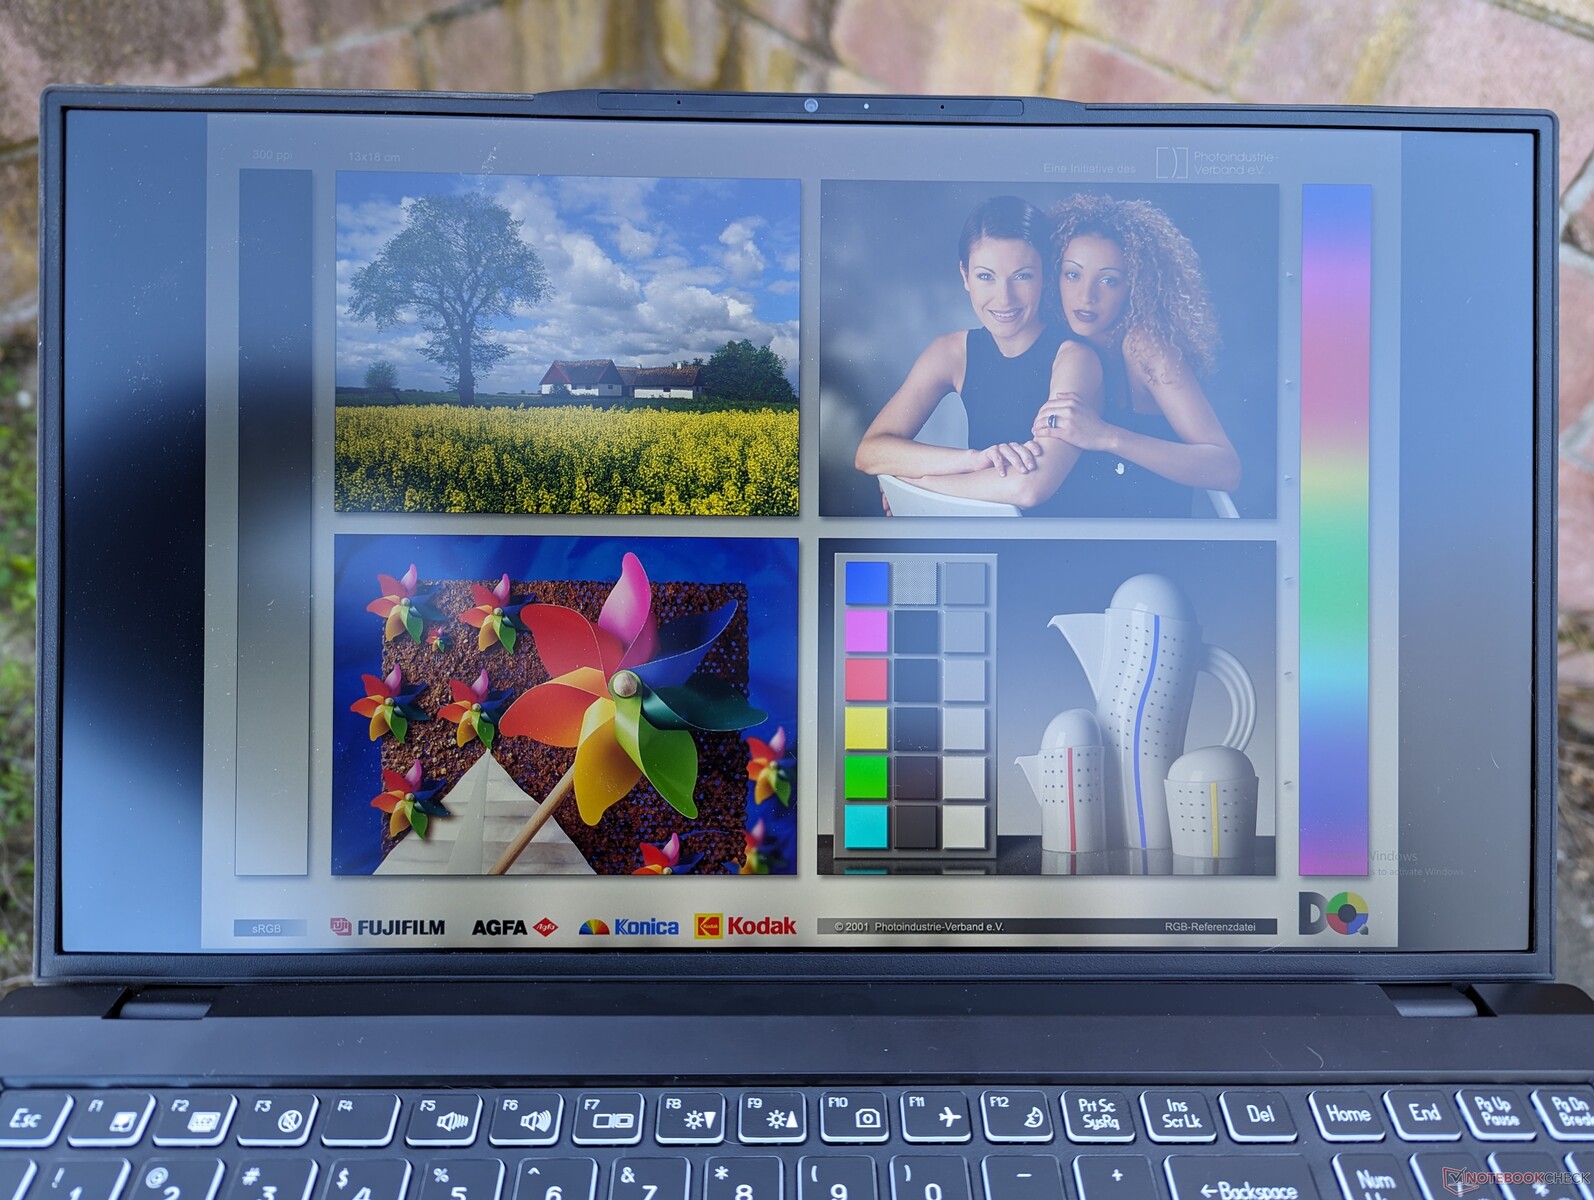
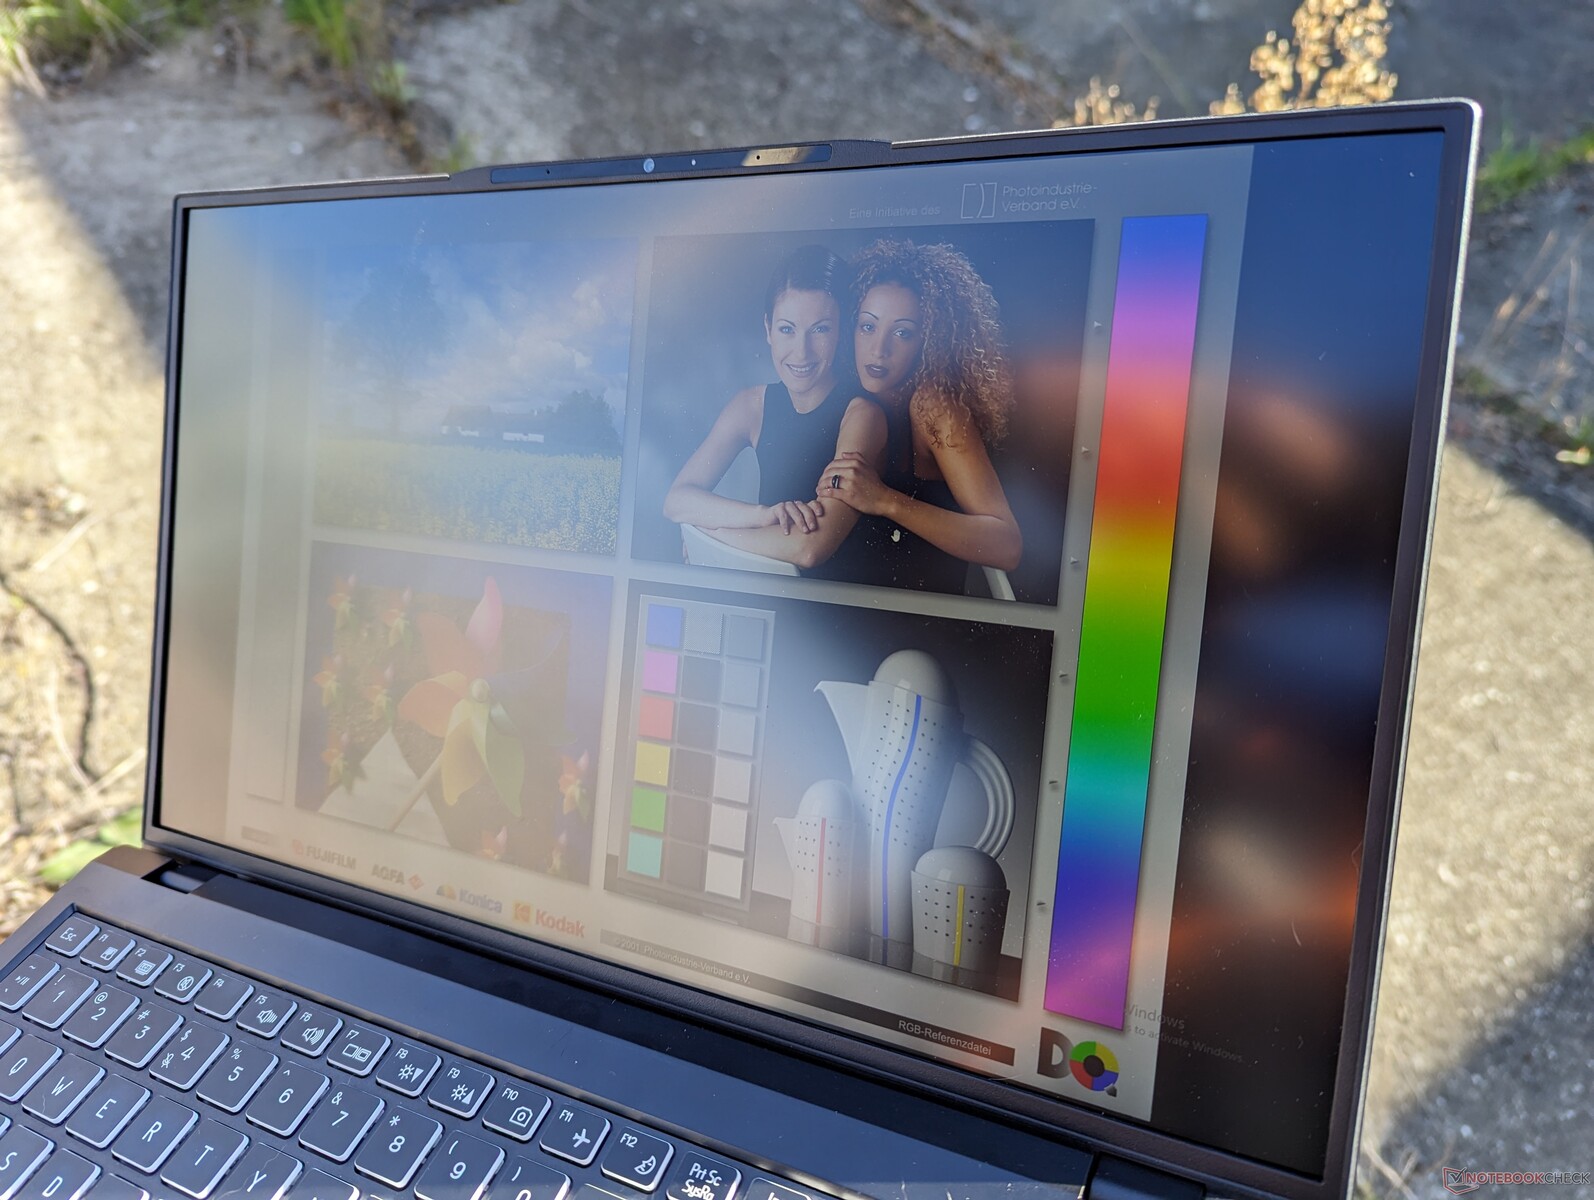
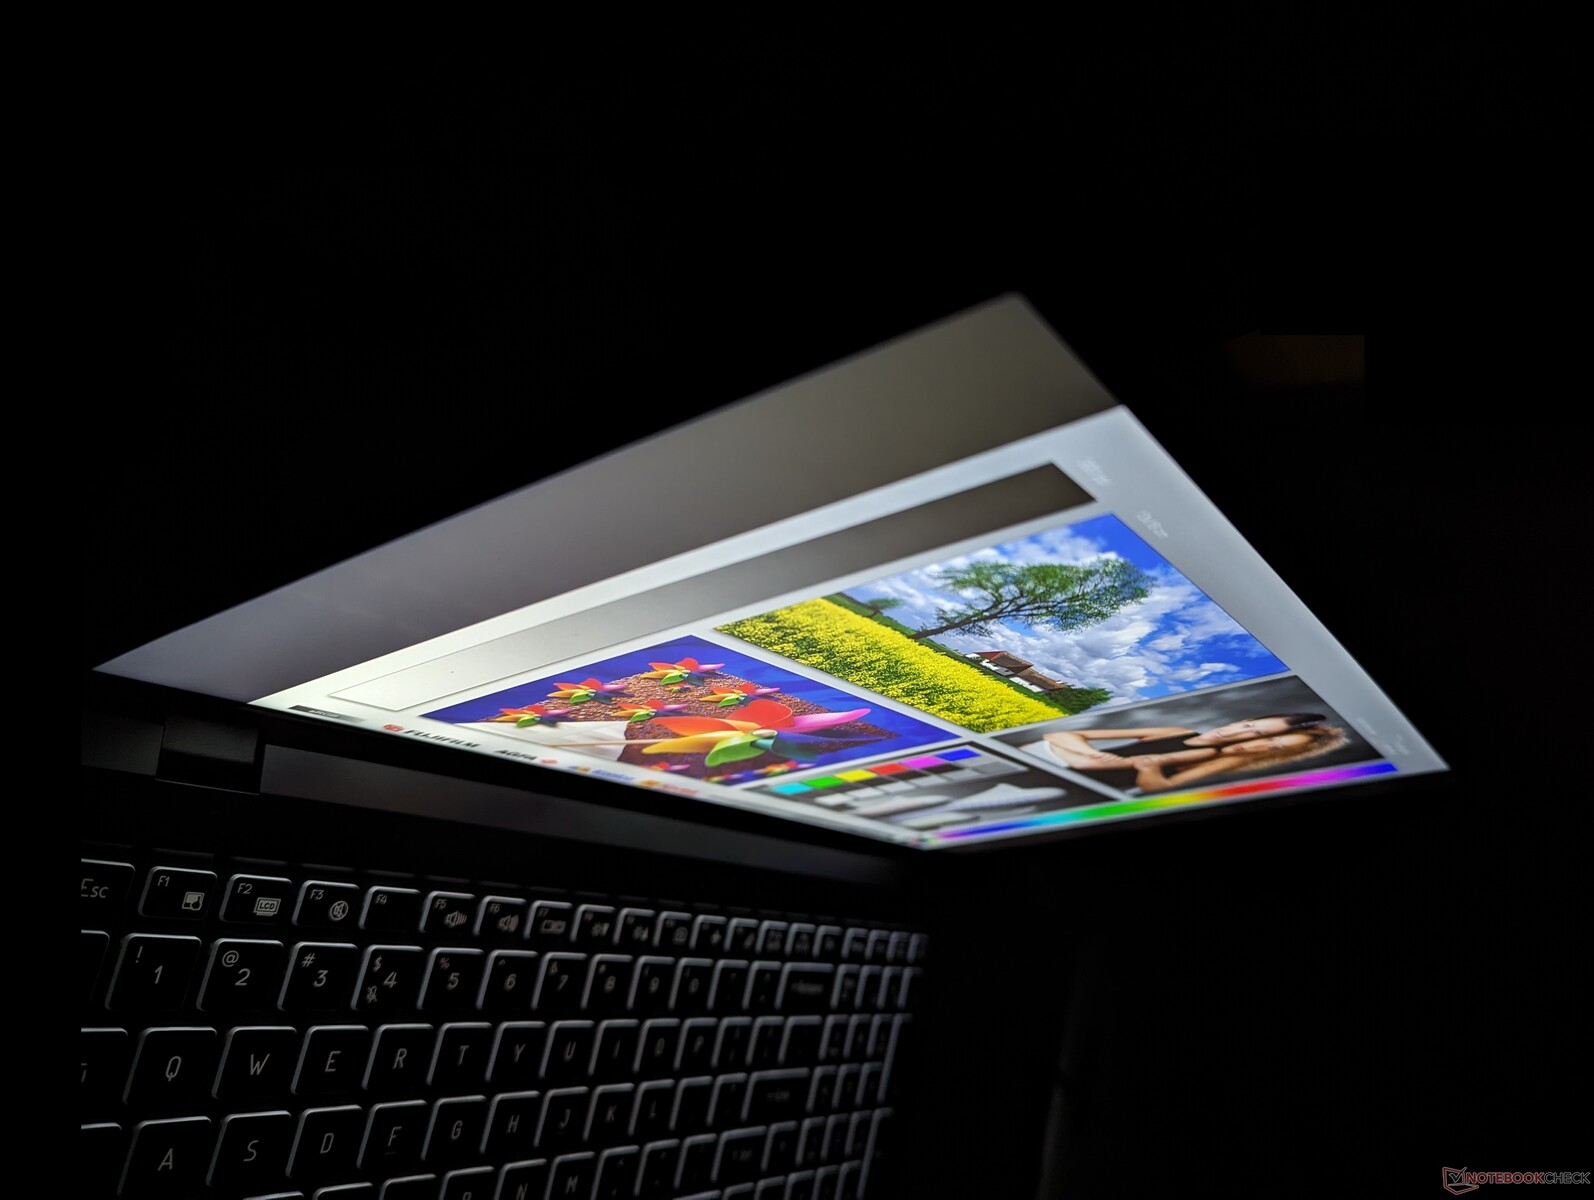
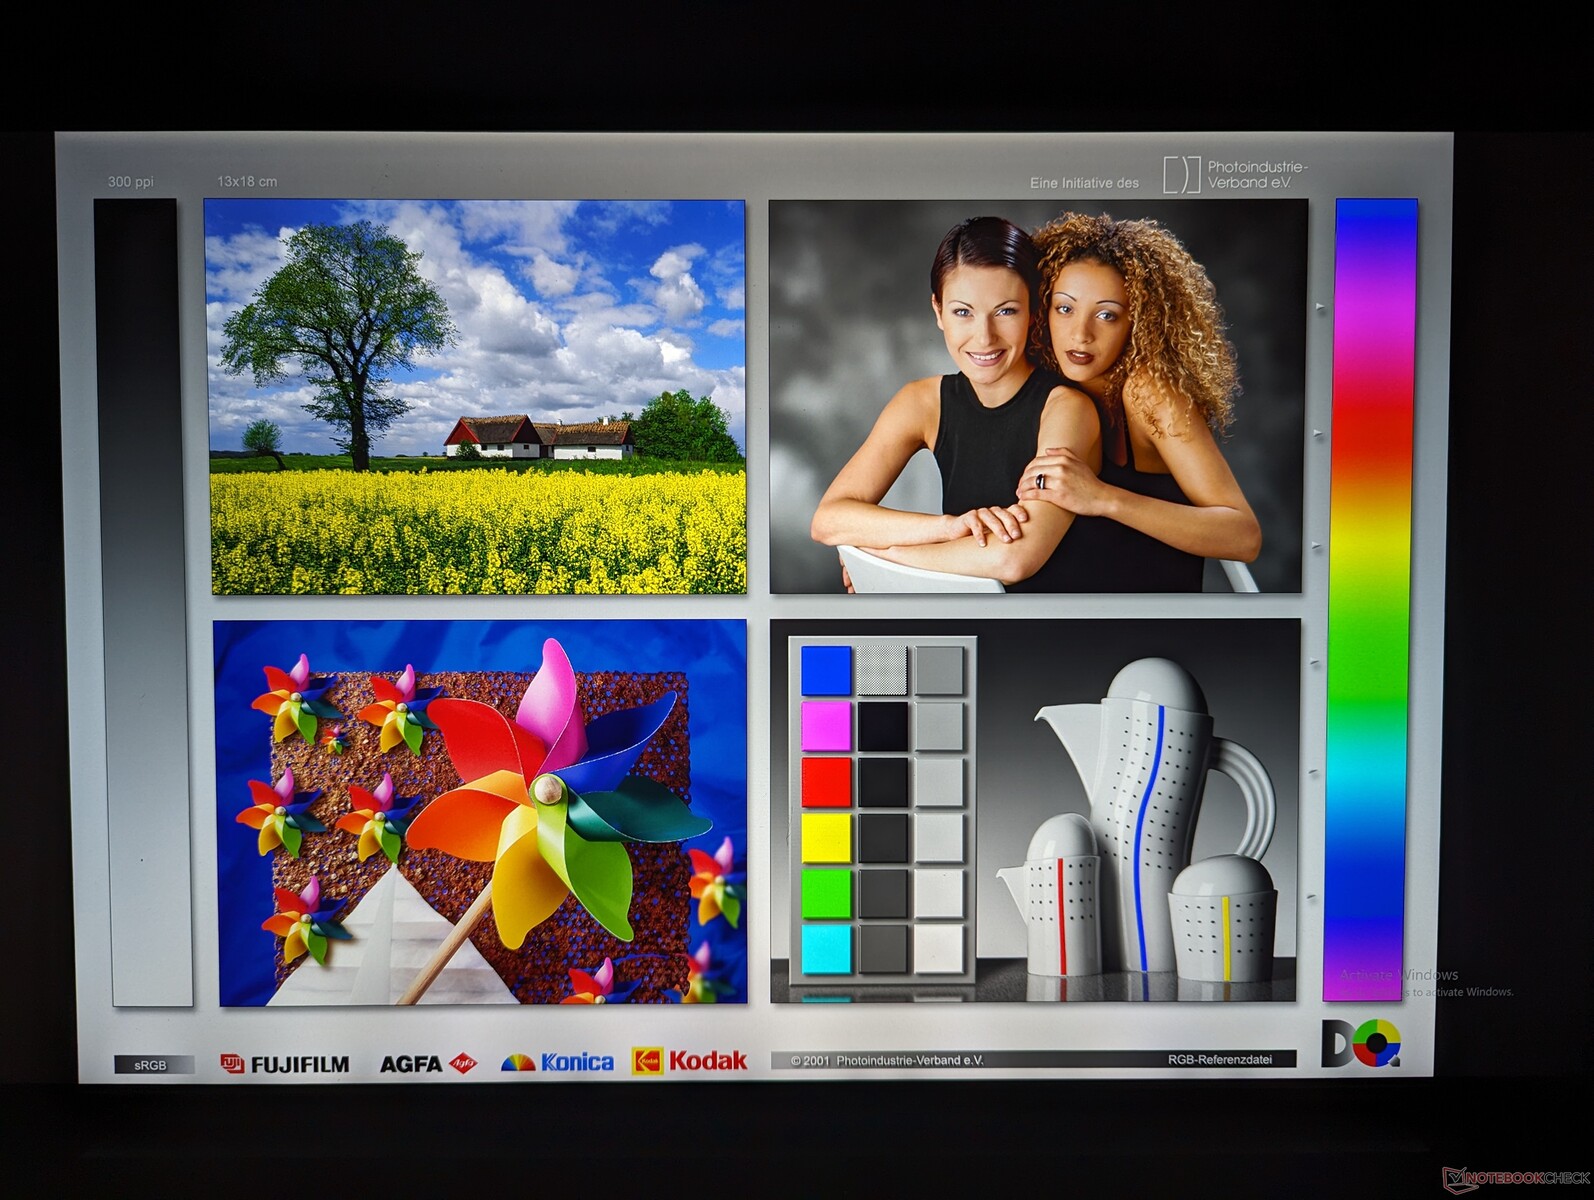
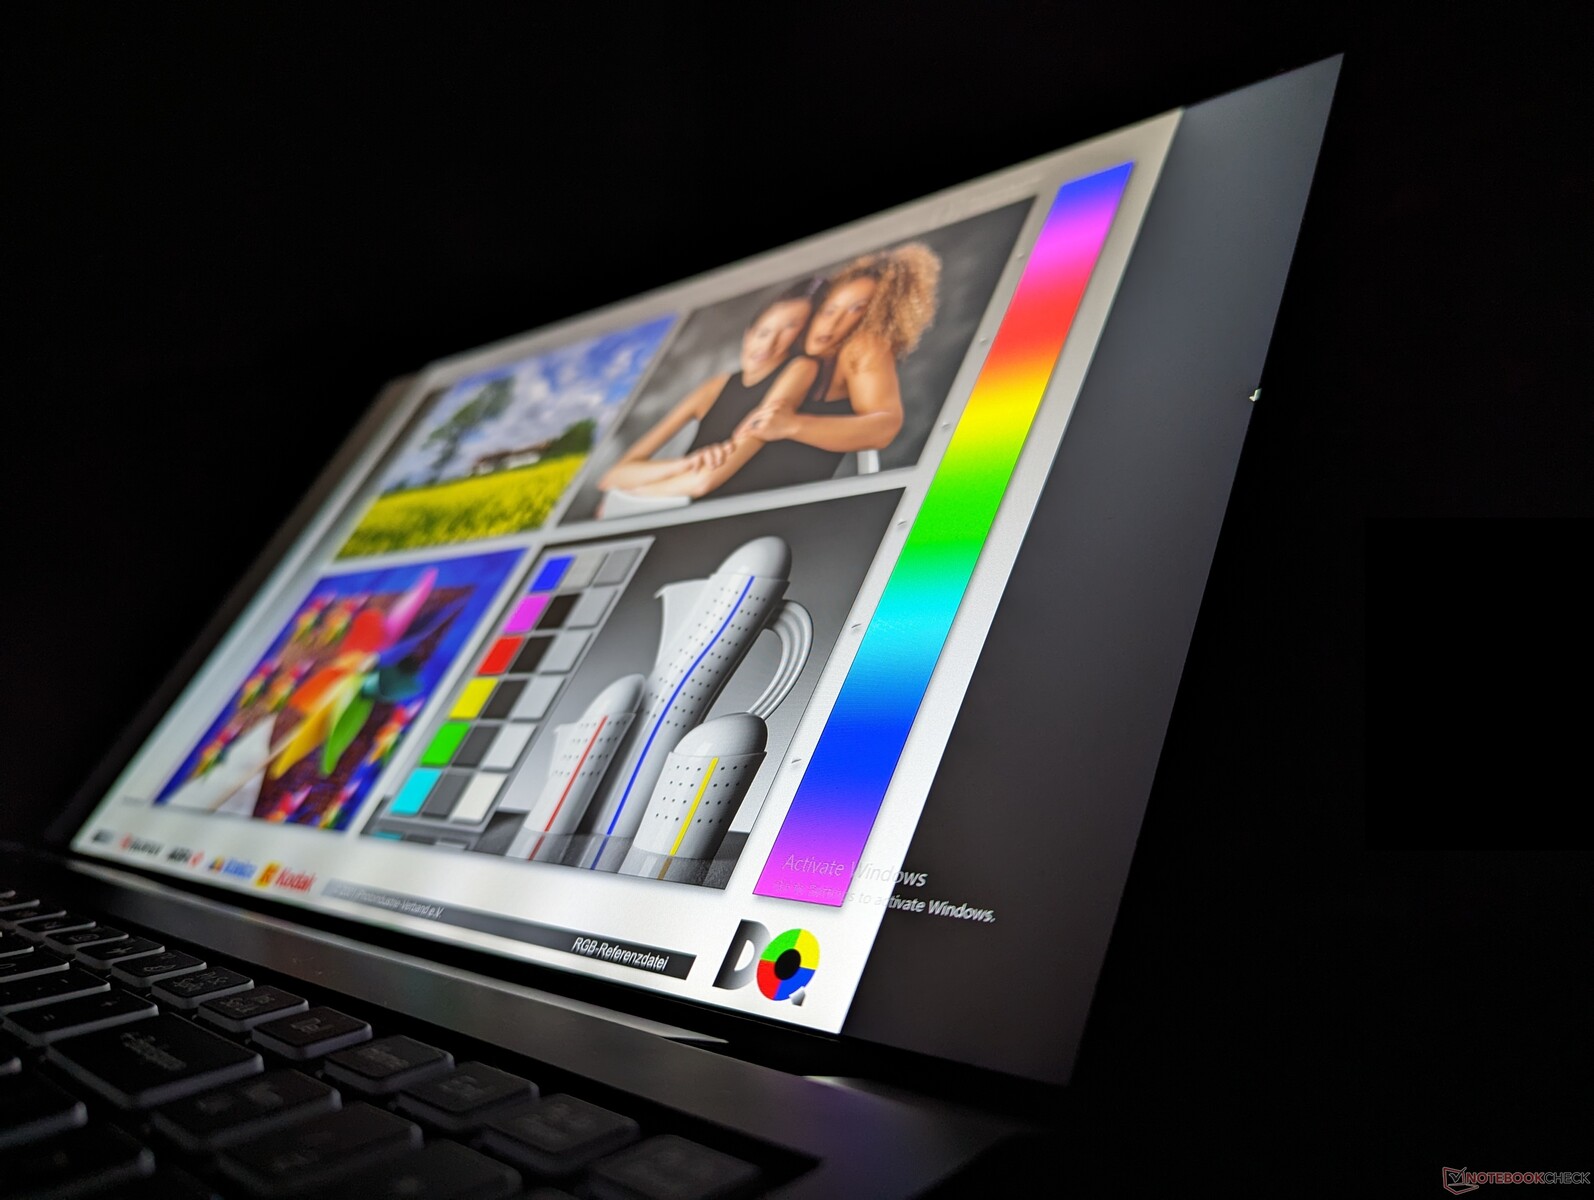
Nossa configuração Eurocom apresenta um painel 4K de resolução mais alta do que o painel de 1080p do nosso Schenker. No entanto, os tempos de resposta de preto e branco não melhoraram e, portanto, o efeito fantasma continua sendo perceptível. Infelizmente, o C315 Blitz não oferece opções com HDR, DCI-P3 completo, cobertura AdobeRGB ou painéis com taxas de atualização mais altas.
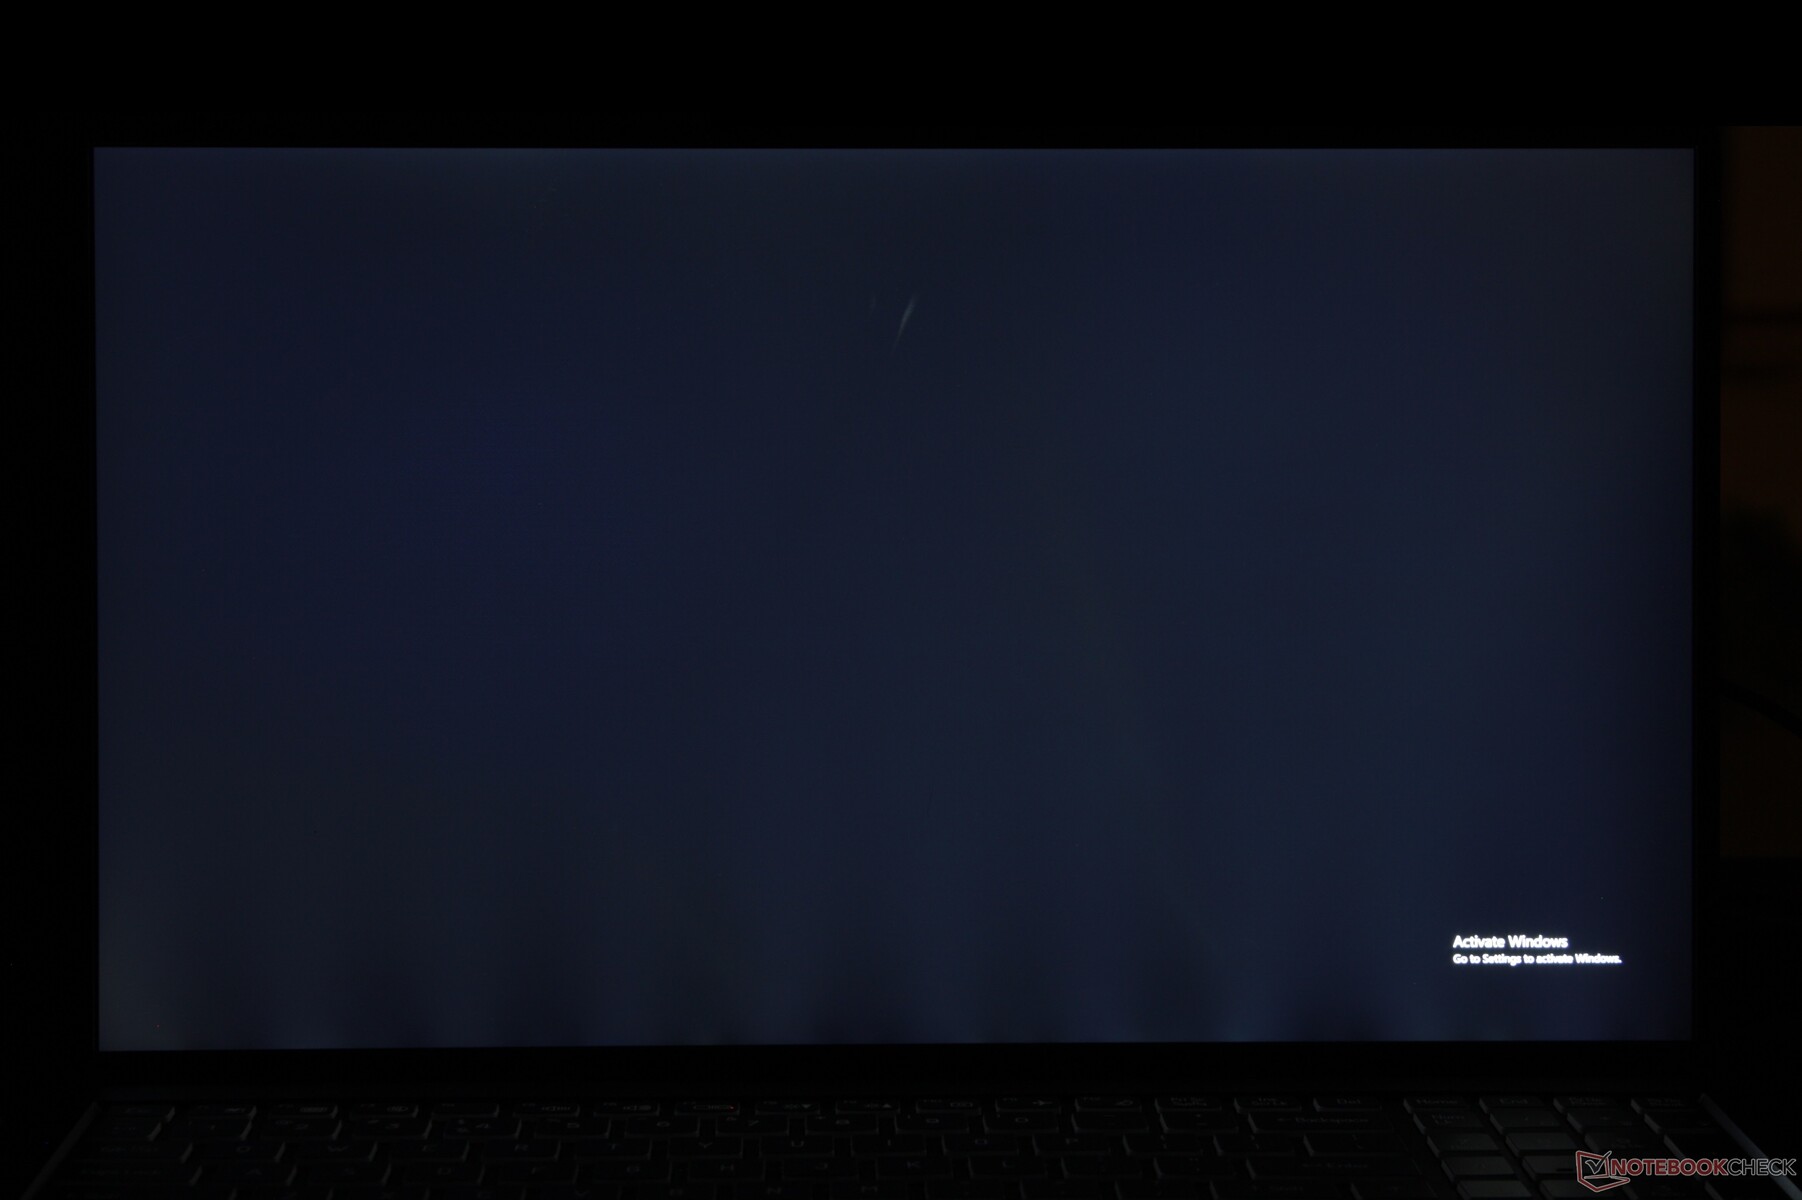
A tela da nossa unidade de análise específica apresenta um sangramento extremo da luz de fundo ao longo da borda inferior, conforme mostrado nas imagens abaixo. Recomendamos verificar novamente suas compras para garantir que não haja problemas com a tela.
| |||||||||||||||||||||||||
iluminação: 85 %
iluminação com acumulador: 262.5 cd/m²
Contraste: 1050:1 (Preto: 0.25 cd/m²)
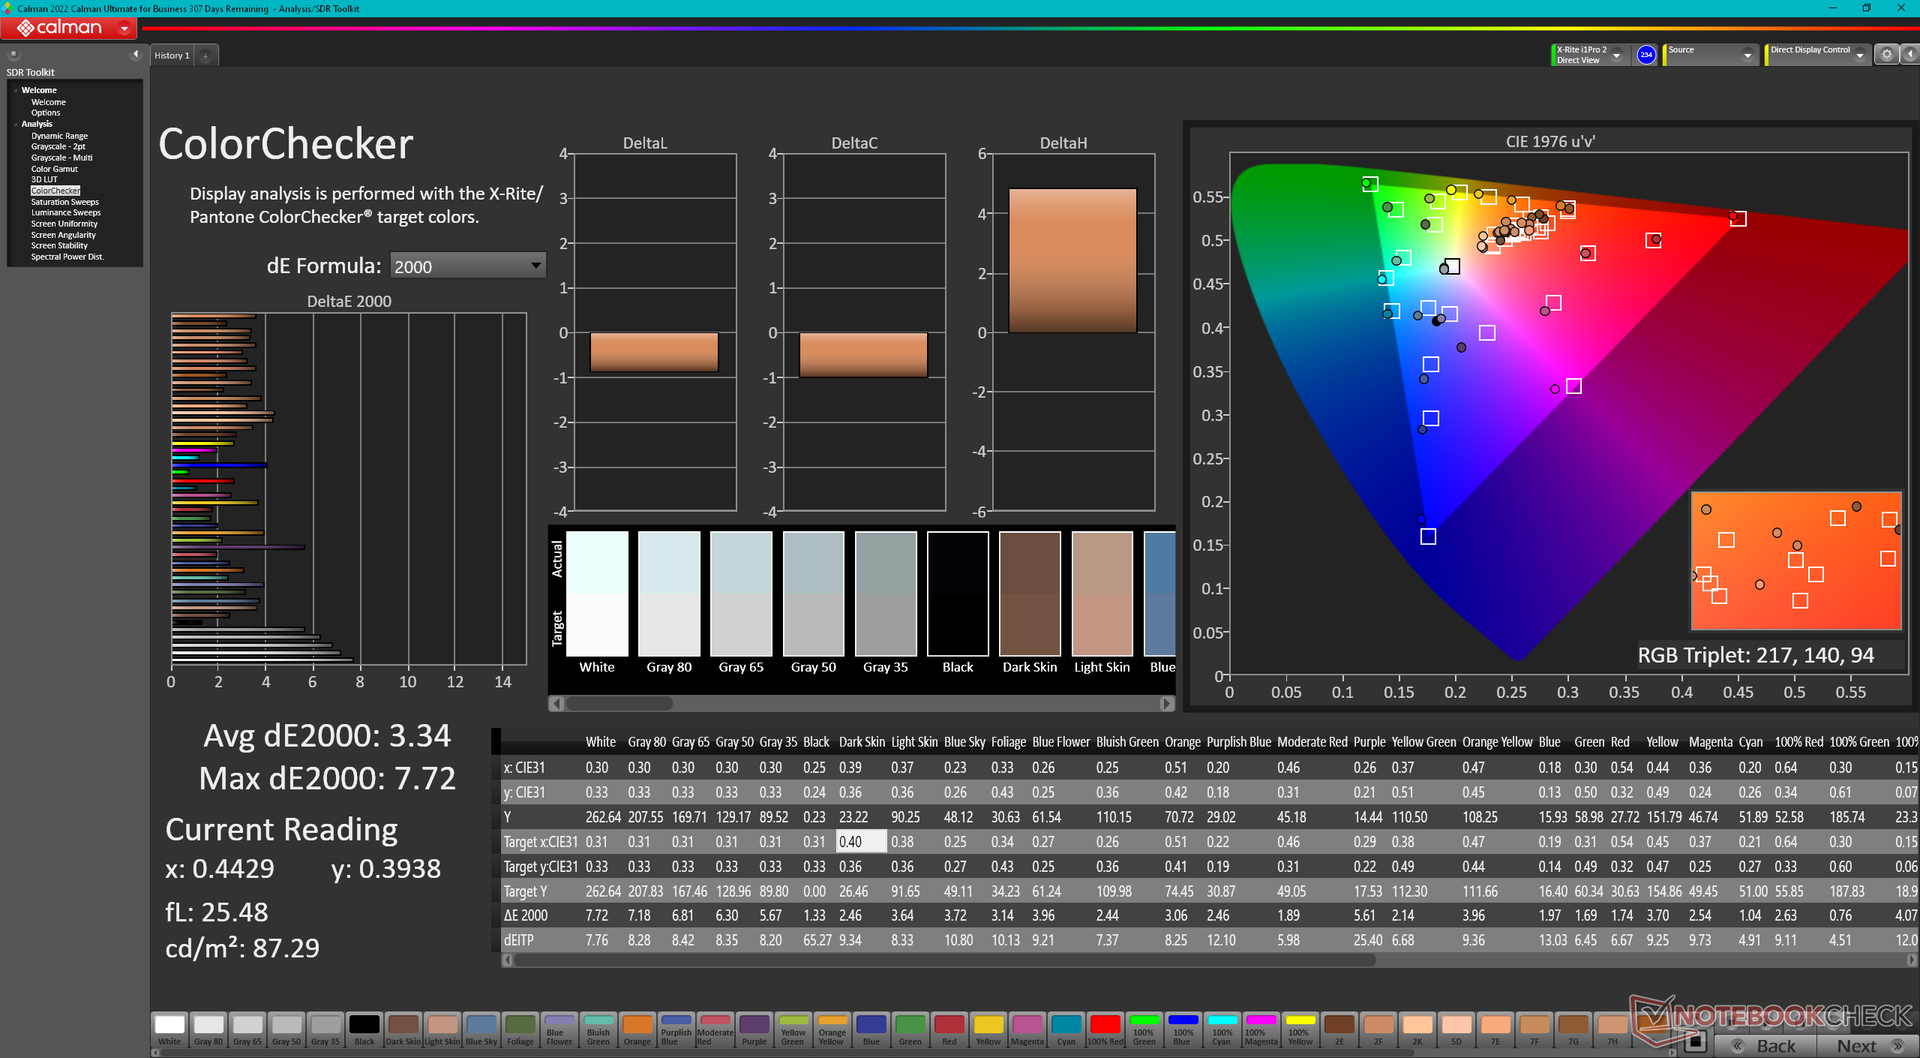
ΔE ColorChecker Calman: 3.34 | ∀{0.5-29.43 Ø4.71}
calibrated: 0.91
ΔE Greyscale Calman: 5.3 | ∀{0.09-98 Ø4.96}
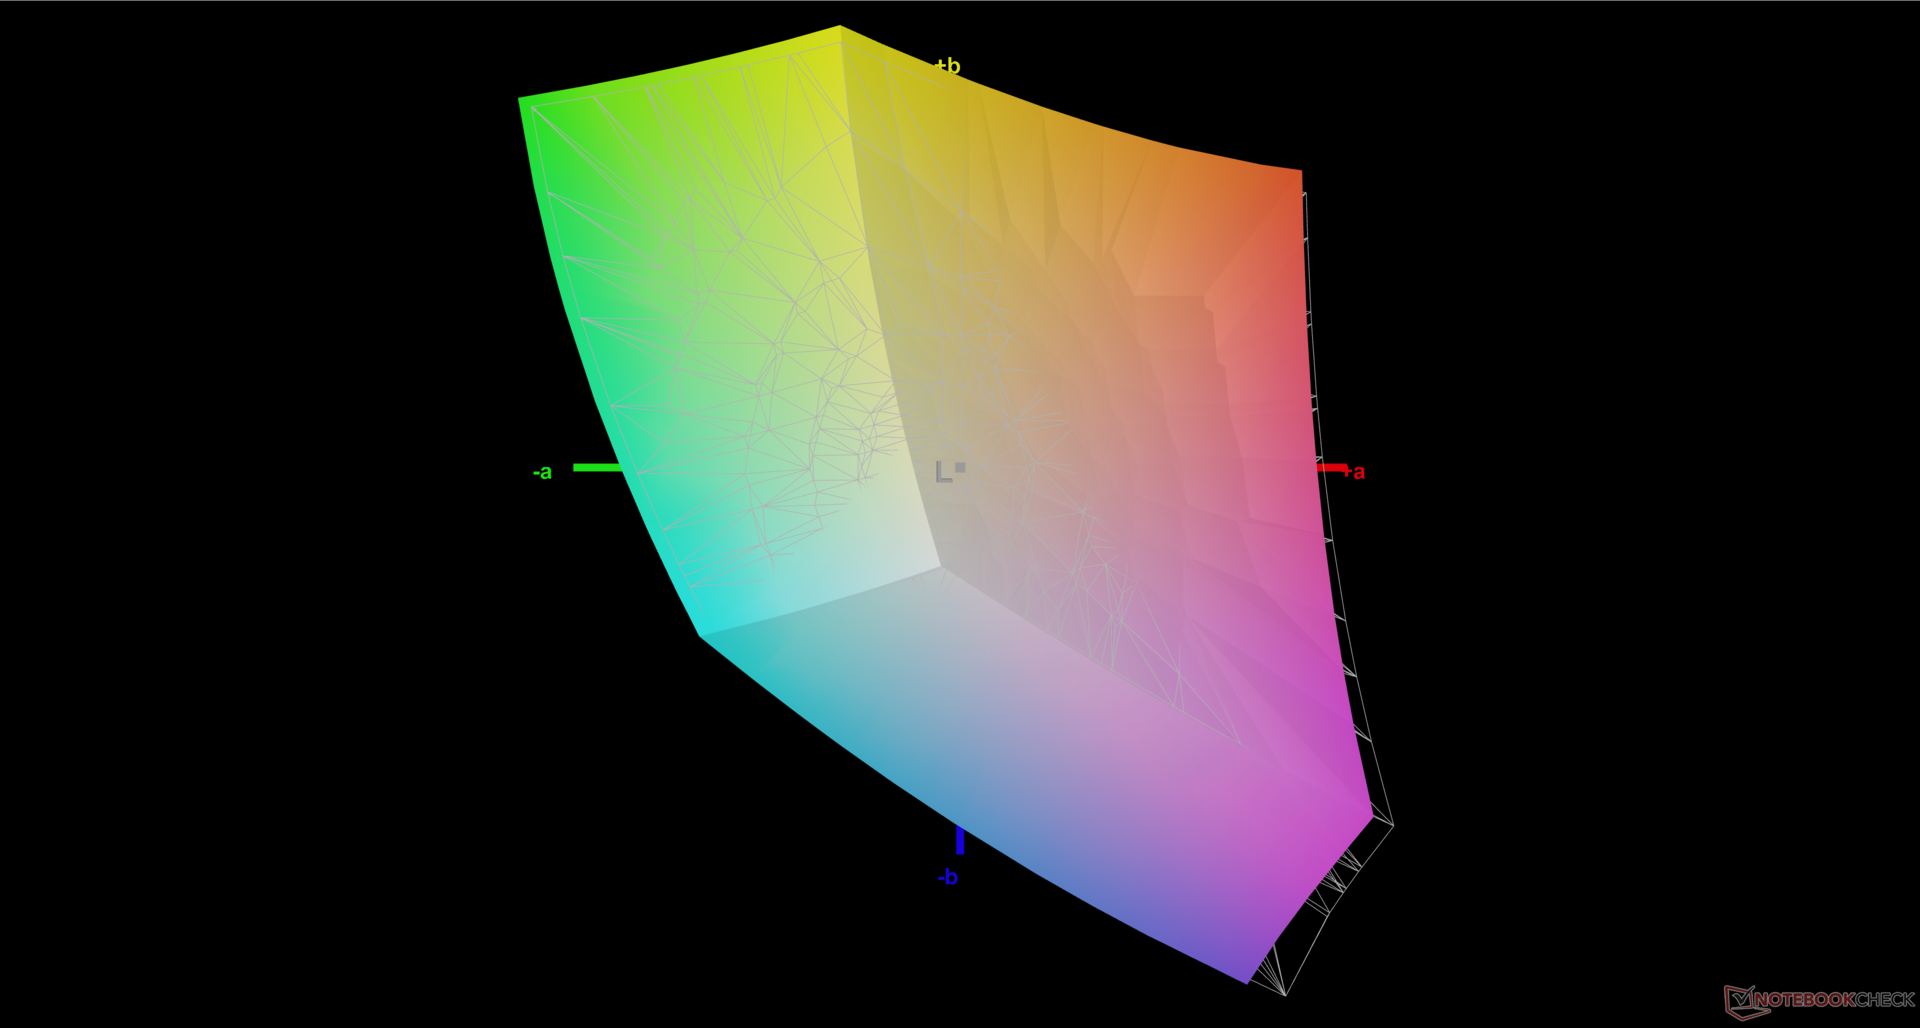
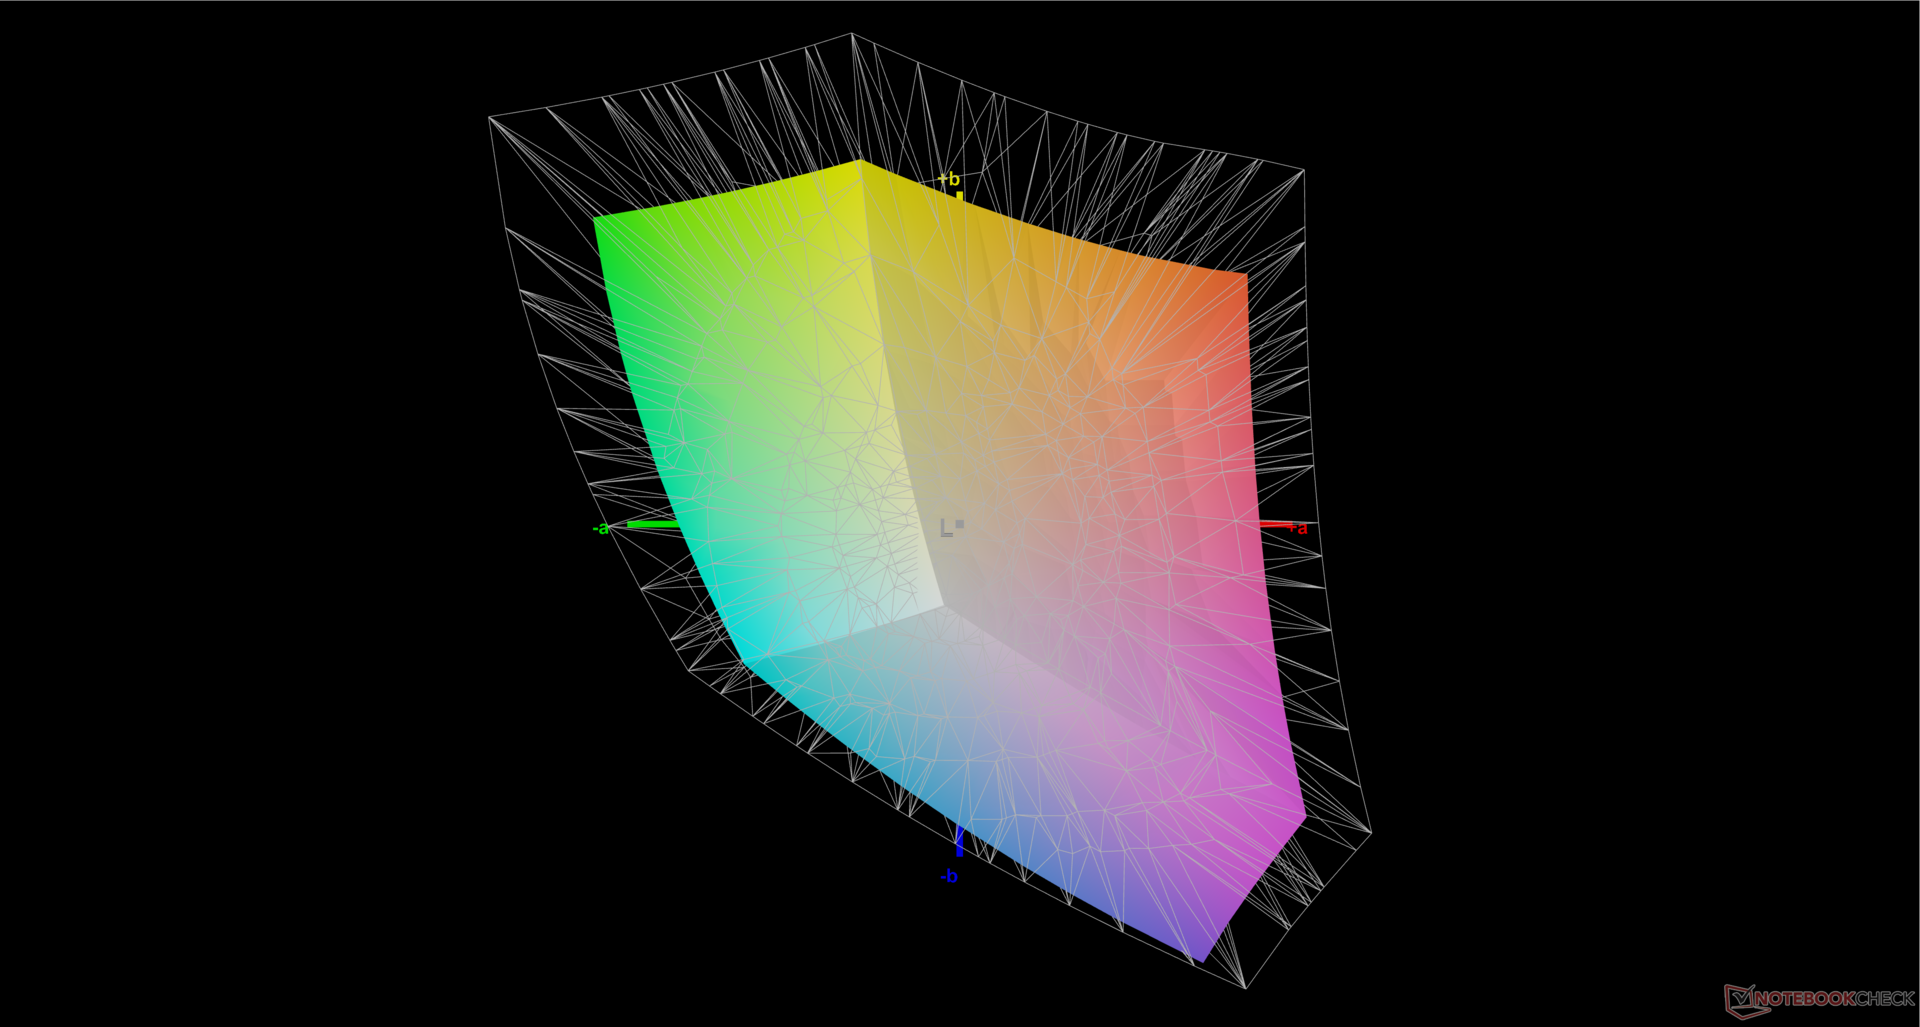
69.8% AdobeRGB 1998 (Argyll 3D)
96.5% sRGB (Argyll 3D)
67.7% Display P3 (Argyll 3D)
Gamma: 2.25
CCT: 7387 K
| Eurocom C315 Blitz BOE HF NE156QUM-N64, IPS, 3840x2160, 15.6" | Schenker Work 15 Tiger Lake-H BOE07D8, IPS, 1920x1080, 15.6" | Lenovo ThinkPad L15 Gen 4 21H70021GE N156HCA-E5B, IPS, 1920x1080, 15.6" | Acer Aspire 5 A515-58GM-76S8 LP156WFH-SPD5, IPS, 1920x1080, 15.6" | Asus VivoBook S15 M3502RA-L1029W Samsung SDC4161, OLED, 1920x1080, 15.6" | Samsung Galaxy Book2 15 NE156FHM-NS0, IPS, 1920x1080, 15.6" | |
|---|---|---|---|---|---|---|
| Display | -9% | -37% | -43% | 31% | -25% | |
| Display P3 Coverage (%) | 67.7 | 64.5 -5% | 41.8 -38% | 38.11 -44% | 99.9 48% | 49.6 -27% |
| sRGB Coverage (%) | 96.5 | 86.2 -11% | 62.5 -35% | 57.7 -40% | 100 4% | 74.8 -22% |
| AdobeRGB 1998 Coverage (%) | 69.8 | 62.9 -10% | 43.2 -38% | 39.41 -44% | 98.6 41% | 51.3 -27% |
| Response Times | -4% | 49% | 34% | 97% | 35% | |
| Response Time Grey 50% / Grey 80% * (ms) | 54.4 ? | 58.4 ? -7% | 24.4 ? 55% | 33.6 ? 38% | 0.74 99% | 32.3 ? 41% |
| Response Time Black / White * (ms) | 34.8 ? | 35.2 ? -1% | 19.7 ? 43% | 24.8 ? 29% | 2 ? 94% | 25 ? 28% |
| PWM Frequency (Hz) | 59 ? | |||||
| Screen | -25% | -53% | -77% | 8% | -42% | |
| Brightness middle (cd/m²) | 262.5 | 329 25% | 275 5% | 257.4 -2% | 378 44% | 337 28% |
| Brightness (cd/m²) | 260 | 316 22% | 252 -3% | 248 -5% | 378 45% | 325 25% |
| Brightness Distribution (%) | 85 | 92 8% | 84 -1% | 88 4% | 98 15% | 89 5% |
| Black Level * (cd/m²) | 0.25 | 0.3 -20% | 0.16 36% | 0.3209 -28% | 0.4 -60% | |
| Contrast (:1) | 1050 | 1097 4% | 1719 64% | 802 -24% | 843 -20% | |
| Colorchecker dE 2000 * | 3.34 | 5.4 -62% | 6.2 -86% | 6.26 -87% | 2.2 34% | 4.7 -41% |
| Colorchecker dE 2000 max. * | 7.72 | 10.1 -31% | 19.2 -149% | 18.28 -137% | 4.87 37% | 15.7 -103% |
| Colorchecker dE 2000 calibrated * | 0.91 | 2.5 -175% | 4.2 -362% | 4.99 -448% | 2.68 -195% | 2.8 -208% |
| Greyscale dE 2000 * | 5.3 | 5.1 4% | 4.1 23% | 3.7 30% | 1.43 73% | 5.4 -2% |
| Gamma | 2.25 98% | 2.1 105% | 1.91 115% | 2.186 101% | 2.47 89% | 2.07 106% |
| CCT | 7387 88% | 7609 85% | 6352 102% | 6606 98% | 6464 101% | 7727 84% |
| Média Total (Programa/Configurações) | -13% /
-19% | -14% /
-35% | -29% /
-54% | 45% /
28% | -11% /
-27% |
* ... menor é melhor
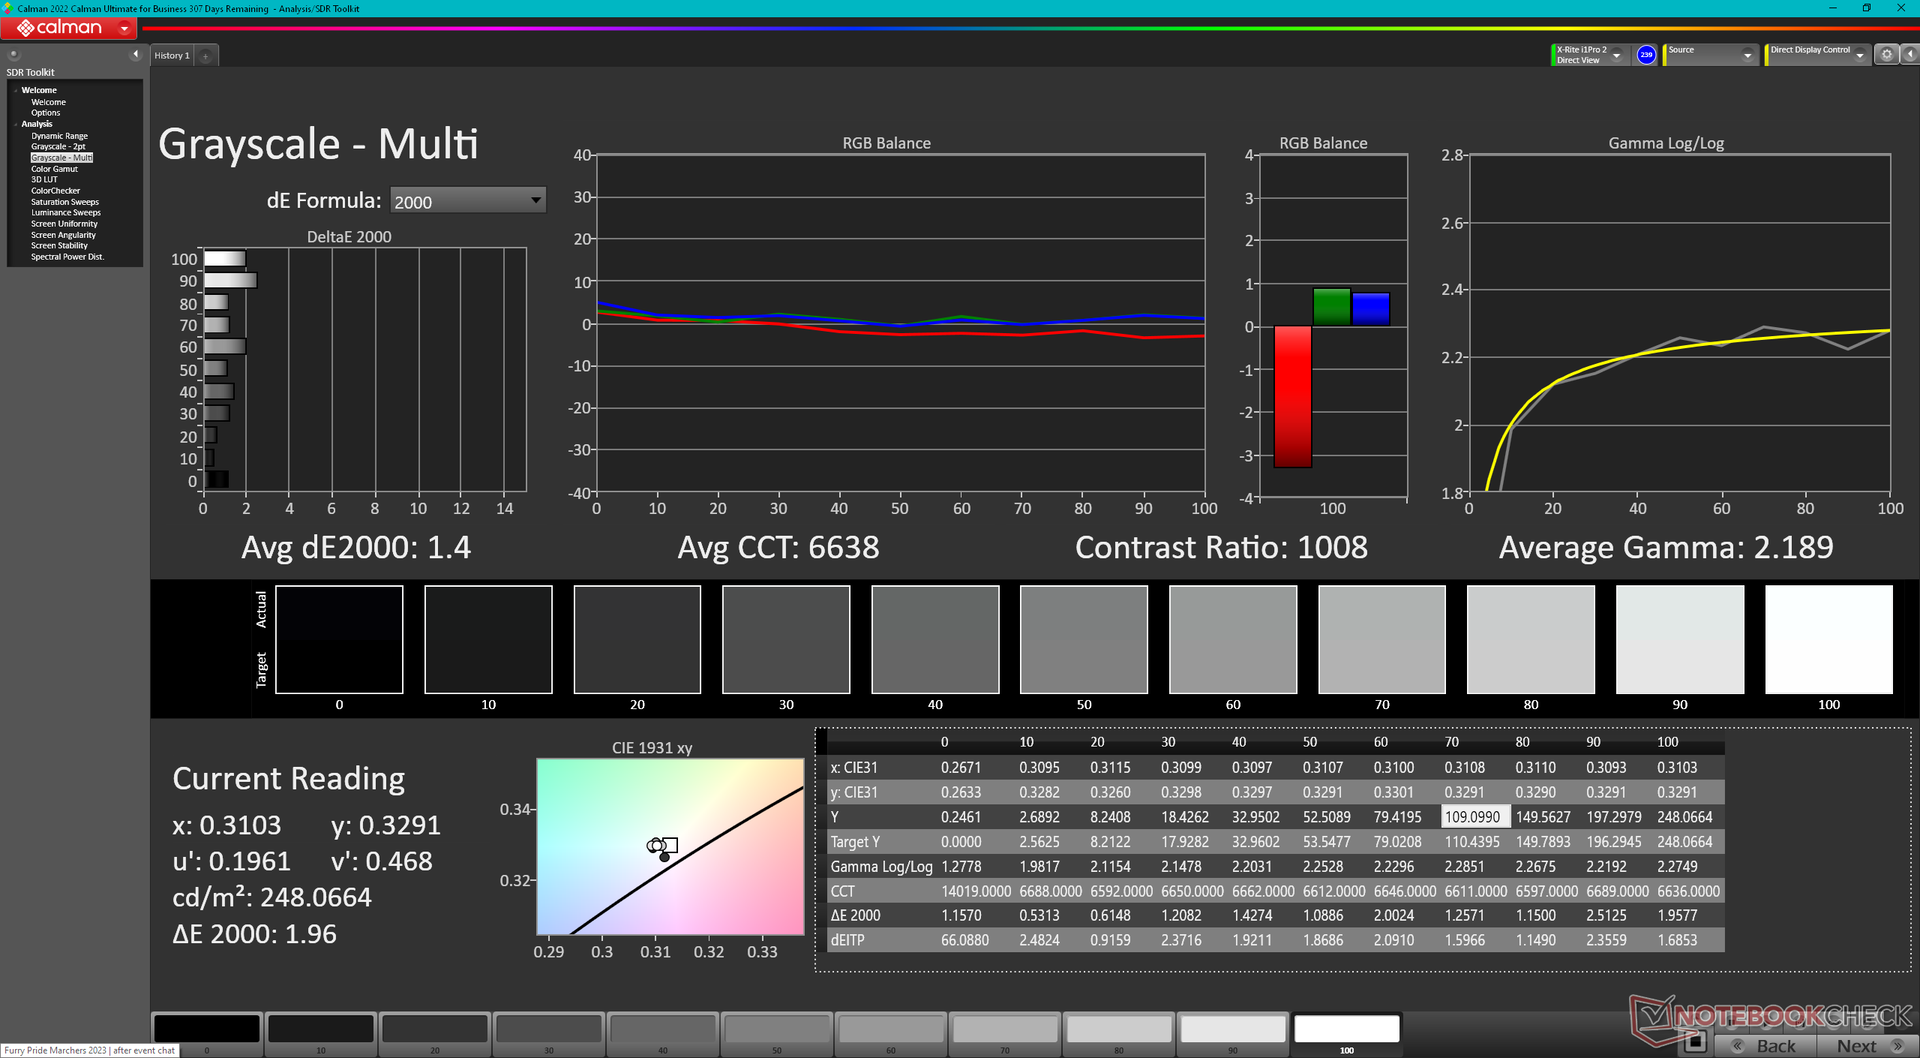
O monitor não vem pré-calibrado. No entanto, a Eurocom oferece serviços de calibração como opcional para usuários que não têm acesso a colorímetros. Conseguimos obter valores médios de deltaE inferiores a <2 com nosso próprio colorímetro X-Rite.
Exibir tempos de resposta
| ↔ Tempo de resposta preto para branco | ||
|---|---|---|
| 34.8 ms ... ascensão ↗ e queda ↘ combinadas | ↗ 16.8 ms ascensão | 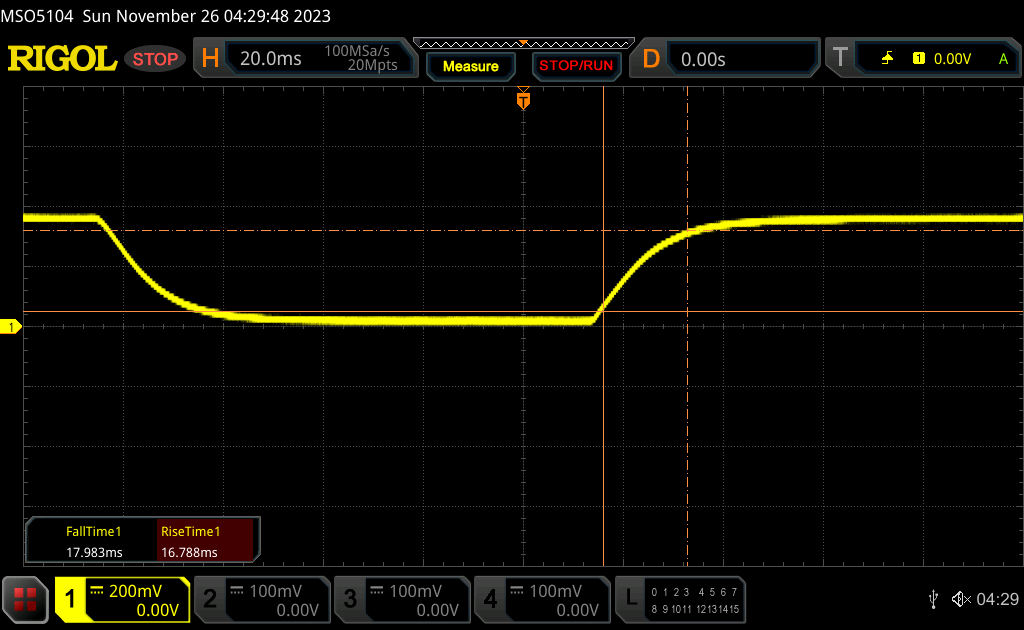 |
| ↘ 18 ms queda | ||
| A tela mostra taxas de resposta lentas em nossos testes e será insatisfatória para os jogadores. Em comparação, todos os dispositivos testados variam de 0.1 (mínimo) a 240 (máximo) ms. » 92 % de todos os dispositivos são melhores. Isso significa que o tempo de resposta medido é pior que a média de todos os dispositivos testados (19.8 ms). | ||
| ↔ Tempo de resposta 50% cinza a 80% cinza | ||
| 54.4 ms ... ascensão ↗ e queda ↘ combinadas | ↗ 25.3 ms ascensão | 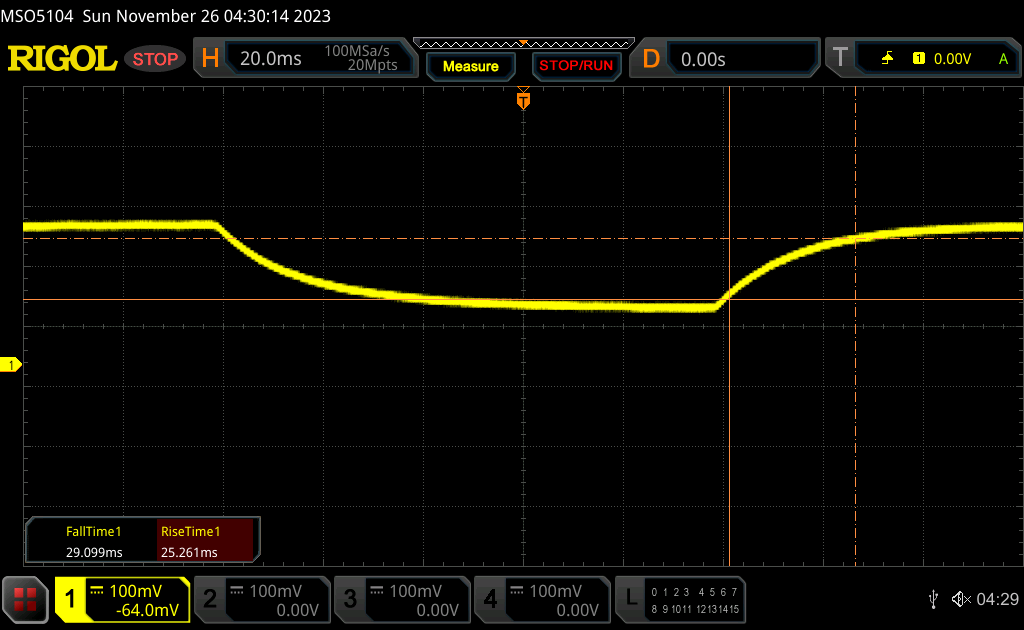 |
| ↘ 29.1 ms queda | ||
| A tela mostra taxas de resposta lentas em nossos testes e será insatisfatória para os jogadores. Em comparação, todos os dispositivos testados variam de 0.165 (mínimo) a 636 (máximo) ms. » 91 % de todos os dispositivos são melhores. Isso significa que o tempo de resposta medido é pior que a média de todos os dispositivos testados (30.9 ms). | ||
Cintilação da tela / PWM (modulação por largura de pulso)
| Tela tremeluzindo / PWM não detectado | 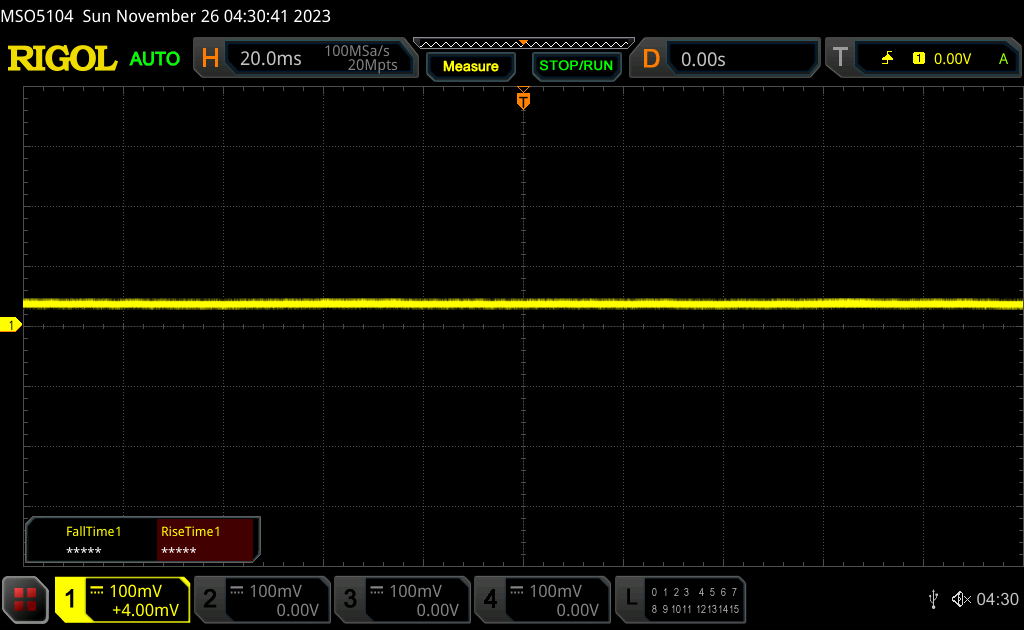 | ||
[pwm_comparison] Em comparação: 52 % de todos os dispositivos testados não usam PWM para escurecer a tela. Se PWM foi detectado, uma média de 7748 (mínimo: 5 - máximo: 343500) Hz foi medida. | |||
Desempenho
Condições de teste
Colocamos o Windows no modo Desempenho antes de executar os benchmarks abaixo. O sistema não inclui nenhum software especializado de "centro de controle" para ajustar quaisquer recursos auxiliares ou perfis de energia adicionais.
Processador
O Core i7-1360P é um pouco confuso. Por um lado, ele oferece desempenho semelhante ao do antigo e mais exigenteCore i7-11370H no Schenker Work 15. Mas, por outro lado, ele fica aquém de alternativas como oCore i7-1355U ou oRyzen 7 5700U. Ele também sofre de estrangulamento, pois nossa pontuação inicial no CineBench R15 xT de 1.079 pontos cairia em cerca de 21% ao executar o benchmark em um loop.
Definitivamente, a CPU Core i7 tem um desempenho inferior em nosso Eurocom. OCore i5-1340P noSamsung Galaxy Book3 Pro 360 16por exemplo, funcionaria de 50 a 70% mais rápido de acordo com vários benchmarks multi-thread.
Cinebench R15 Multi Loop
Cinebench R23: Multi Core | Single Core
Cinebench R20: CPU (Multi Core) | CPU (Single Core)
Cinebench R15: CPU Multi 64Bit | CPU Single 64Bit
Blender: v2.79 BMW27 CPU
7-Zip 18.03: 7z b 4 | 7z b 4 -mmt1
Geekbench 5.5: Multi-Core | Single-Core
HWBOT x265 Benchmark v2.2: 4k Preset
LibreOffice : 20 Documents To PDF
R Benchmark 2.5: Overall mean
* ... menor é melhor
AIDA64: FP32 Ray-Trace | FPU Julia | CPU SHA3 | CPU Queen | FPU SinJulia | FPU Mandel | CPU AES | CPU ZLib | FP64 Ray-Trace | CPU PhotoWorxx
| Performance rating | |
| Asus VivoBook S15 M3502RA-L1029W | |
| Lenovo ThinkPad L15 Gen 4 21H70021GE | |
| Média Intel Core i7-1360P | |
| Acer Aspire 5 A515-58GM-76S8 | |
| Schenker Work 15 Tiger Lake-H | |
| Samsung Galaxy Book2 15 | |
| Eurocom C315 Blitz | |
| AIDA64 / FP32 Ray-Trace | |
| Asus VivoBook S15 M3502RA-L1029W | |
| Lenovo ThinkPad L15 Gen 4 21H70021GE | |
| Média Intel Core i7-1360P (5610 - 11188, n=17) | |
| Acer Aspire 5 A515-58GM-76S8 | |
| Schenker Work 15 Tiger Lake-H | |
| Samsung Galaxy Book2 15 | |
| Eurocom C315 Blitz | |
| AIDA64 / FPU Julia | |
| Asus VivoBook S15 M3502RA-L1029W | |
| Lenovo ThinkPad L15 Gen 4 21H70021GE | |
| Média Intel Core i7-1360P (29251 - 56942, n=16) | |
| Acer Aspire 5 A515-58GM-76S8 | |
| Schenker Work 15 Tiger Lake-H | |
| Eurocom C315 Blitz | |
| Samsung Galaxy Book2 15 | |
| AIDA64 / CPU SHA3 | |
| Asus VivoBook S15 M3502RA-L1029W | |
| Lenovo ThinkPad L15 Gen 4 21H70021GE | |
| Média Intel Core i7-1360P (1444 - 2728, n=16) | |
| Acer Aspire 5 A515-58GM-76S8 | |
| Schenker Work 15 Tiger Lake-H | |
| Eurocom C315 Blitz | |
| Samsung Galaxy Book2 15 | |
| AIDA64 / CPU Queen | |
| Asus VivoBook S15 M3502RA-L1029W | |
| Lenovo ThinkPad L15 Gen 4 21H70021GE | |
| Média Intel Core i7-1360P (65324 - 89266, n=16) | |
| Eurocom C315 Blitz | |
| Samsung Galaxy Book2 15 | |
| Acer Aspire 5 A515-58GM-76S8 | |
| Schenker Work 15 Tiger Lake-H | |
| AIDA64 / FPU SinJulia | |
| Asus VivoBook S15 M3502RA-L1029W | |
| Lenovo ThinkPad L15 Gen 4 21H70021GE | |
| Samsung Galaxy Book2 15 | |
| Média Intel Core i7-1360P (4370 - 7269, n=16) | |
| Acer Aspire 5 A515-58GM-76S8 | |
| Schenker Work 15 Tiger Lake-H | |
| Eurocom C315 Blitz | |
| AIDA64 / FPU Mandel | |
| Asus VivoBook S15 M3502RA-L1029W | |
| Lenovo ThinkPad L15 Gen 4 21H70021GE | |
| Média Intel Core i7-1360P (14104 - 28019, n=16) | |
| Acer Aspire 5 A515-58GM-76S8 | |
| Schenker Work 15 Tiger Lake-H | |
| Eurocom C315 Blitz | |
| Samsung Galaxy Book2 15 | |
| AIDA64 / CPU ZLib | |
| Asus VivoBook S15 M3502RA-L1029W | |
| Lenovo ThinkPad L15 Gen 4 21H70021GE | |
| Samsung Galaxy Book2 15 | |
| Média Intel Core i7-1360P (420 - 807, n=16) | |
| Acer Aspire 5 A515-58GM-76S8 | |
| Eurocom C315 Blitz | |
| Schenker Work 15 Tiger Lake-H | |
| AIDA64 / FP64 Ray-Trace | |
| Asus VivoBook S15 M3502RA-L1029W | |
| Lenovo ThinkPad L15 Gen 4 21H70021GE | |
| Média Intel Core i7-1360P (2906 - 5957, n=16) | |
| Acer Aspire 5 A515-58GM-76S8 | |
| Schenker Work 15 Tiger Lake-H | |
| Samsung Galaxy Book2 15 | |
| Eurocom C315 Blitz | |
| AIDA64 / CPU PhotoWorxx | |
| Média Intel Core i7-1360P (29108 - 49328, n=16) | |
| Samsung Galaxy Book2 15 | |
| Eurocom C315 Blitz | |
| Schenker Work 15 Tiger Lake-H | |
| Asus VivoBook S15 M3502RA-L1029W | |
| Acer Aspire 5 A515-58GM-76S8 | |
| Lenovo ThinkPad L15 Gen 4 21H70021GE | |
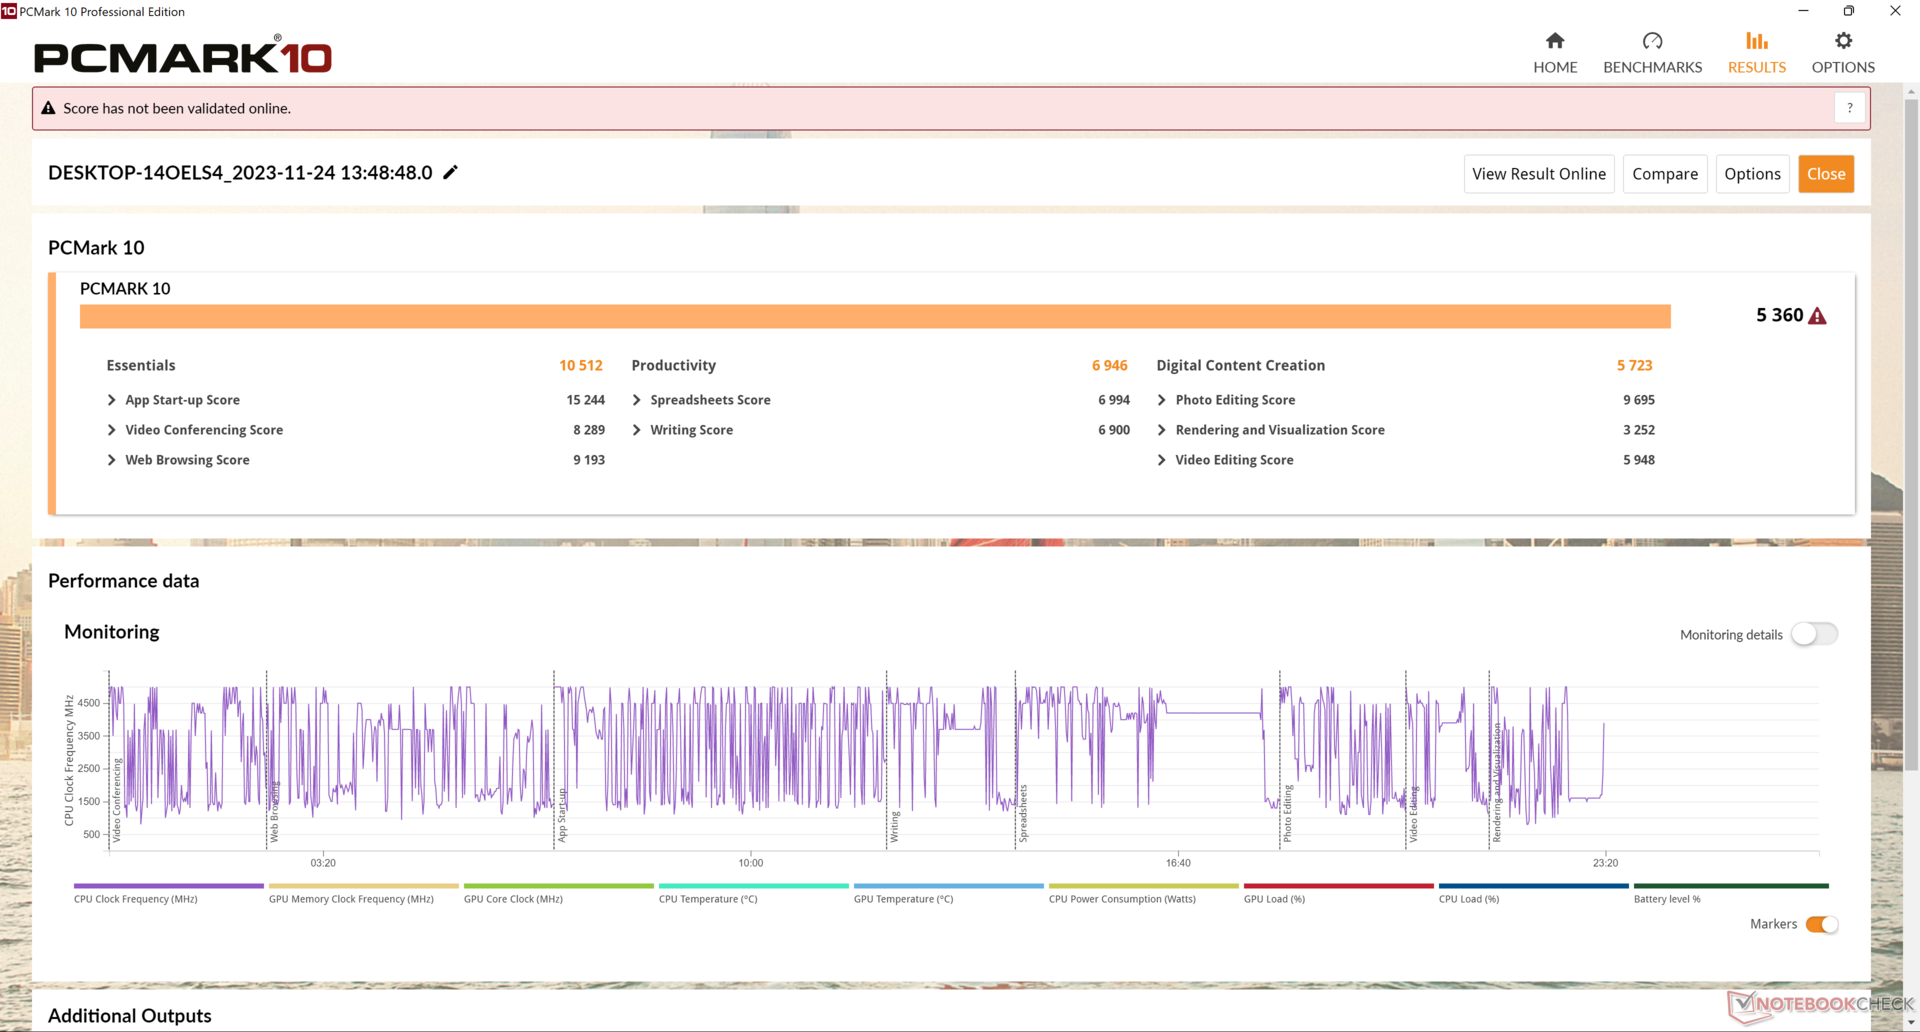
Desempenho do sistema
Os resultados do PCMark são essencialmente idênticos aos do Schenker Work 15 executado com o Core i7-11370H mais antigo e mais exigente em termos de energia.
CrossMark: Overall | Productivity | Creativity | Responsiveness
| PCMark 10 / Score | |
| Asus VivoBook S15 M3502RA-L1029W | |
| Acer Aspire 5 A515-58GM-76S8 | |
| Média Intel Core i7-1360P, Intel Iris Xe Graphics G7 96EUs (5360 - 6281, n=14) | |
| Samsung Galaxy Book2 15 | |
| Schenker Work 15 Tiger Lake-H | |
| Lenovo ThinkPad L15 Gen 4 21H70021GE | |
| Eurocom C315 Blitz | |
| PCMark 10 / Essentials | |
| Acer Aspire 5 A515-58GM-76S8 | |
| Média Intel Core i7-1360P, Intel Iris Xe Graphics G7 96EUs (9883 - 12059, n=14) | |
| Schenker Work 15 Tiger Lake-H | |
| Eurocom C315 Blitz | |
| Asus VivoBook S15 M3502RA-L1029W | |
| Lenovo ThinkPad L15 Gen 4 21H70021GE | |
| Samsung Galaxy Book2 15 | |
| PCMark 10 / Productivity | |
| Asus VivoBook S15 M3502RA-L1029W | |
| Lenovo ThinkPad L15 Gen 4 21H70021GE | |
| Acer Aspire 5 A515-58GM-76S8 | |
| Média Intel Core i7-1360P, Intel Iris Xe Graphics G7 96EUs (6572 - 8161, n=14) | |
| Schenker Work 15 Tiger Lake-H | |
| Eurocom C315 Blitz | |
| Samsung Galaxy Book2 15 | |
| PCMark 10 / Digital Content Creation | |
| Asus VivoBook S15 M3502RA-L1029W | |
| Acer Aspire 5 A515-58GM-76S8 | |
| Média Intel Core i7-1360P, Intel Iris Xe Graphics G7 96EUs (5723 - 7612, n=14) | |
| Samsung Galaxy Book2 15 | |
| Schenker Work 15 Tiger Lake-H | |
| Eurocom C315 Blitz | |
| Lenovo ThinkPad L15 Gen 4 21H70021GE | |
| CrossMark / Overall | |
| Eurocom C315 Blitz | |
| Acer Aspire 5 A515-58GM-76S8 | |
| Média Intel Core i7-1360P, Intel Iris Xe Graphics G7 96EUs (1527 - 1891, n=15) | |
| Asus VivoBook S15 M3502RA-L1029W | |
| Lenovo ThinkPad L15 Gen 4 21H70021GE | |
| CrossMark / Productivity | |
| Acer Aspire 5 A515-58GM-76S8 | |
| Eurocom C315 Blitz | |
| Média Intel Core i7-1360P, Intel Iris Xe Graphics G7 96EUs (1503 - 1842, n=15) | |
| Asus VivoBook S15 M3502RA-L1029W | |
| Lenovo ThinkPad L15 Gen 4 21H70021GE | |
| CrossMark / Creativity | |
| Eurocom C315 Blitz | |
| Média Intel Core i7-1360P, Intel Iris Xe Graphics G7 96EUs (1558 - 2003, n=15) | |
| Asus VivoBook S15 M3502RA-L1029W | |
| Acer Aspire 5 A515-58GM-76S8 | |
| Lenovo ThinkPad L15 Gen 4 21H70021GE | |
| CrossMark / Responsiveness | |
| Acer Aspire 5 A515-58GM-76S8 | |
| Eurocom C315 Blitz | |
| Média Intel Core i7-1360P, Intel Iris Xe Graphics G7 96EUs (1311 - 1899, n=15) | |
| Asus VivoBook S15 M3502RA-L1029W | |
| Lenovo ThinkPad L15 Gen 4 21H70021GE | |
| PCMark 10 Score | 5360 pontos | |
Ajuda | ||
| AIDA64 / Memory Copy | |
| Eurocom C315 Blitz | |
| Samsung Galaxy Book2 15 | |
| Média Intel Core i7-1360P (44299 - 72748, n=16) | |
| Asus VivoBook S15 M3502RA-L1029W | |
| Schenker Work 15 Tiger Lake-H | |
| Acer Aspire 5 A515-58GM-76S8 | |
| Lenovo ThinkPad L15 Gen 4 21H70021GE | |
| AIDA64 / Memory Read | |
| Eurocom C315 Blitz | |
| Samsung Galaxy Book2 15 | |
| Média Intel Core i7-1360P (44751 - 68945, n=16) | |
| Asus VivoBook S15 M3502RA-L1029W | |
| Schenker Work 15 Tiger Lake-H | |
| Acer Aspire 5 A515-58GM-76S8 | |
| Lenovo ThinkPad L15 Gen 4 21H70021GE | |
| AIDA64 / Memory Write | |
| Eurocom C315 Blitz | |
| Média Intel Core i7-1360P (45887 - 93331, n=16) | |
| Samsung Galaxy Book2 15 | |
| Asus VivoBook S15 M3502RA-L1029W | |
| Schenker Work 15 Tiger Lake-H | |
| Acer Aspire 5 A515-58GM-76S8 | |
| Lenovo ThinkPad L15 Gen 4 21H70021GE | |
| AIDA64 / Memory Latency | |
| Lenovo ThinkPad L15 Gen 4 21H70021GE | |
| Média Intel Core i7-1360P (85 - 110.5, n=16) | |
| Asus VivoBook S15 M3502RA-L1029W | |
| Eurocom C315 Blitz | |
| Schenker Work 15 Tiger Lake-H | |
| Acer Aspire 5 A515-58GM-76S8 | |
| Samsung Galaxy Book2 15 | |
* ... menor é melhor
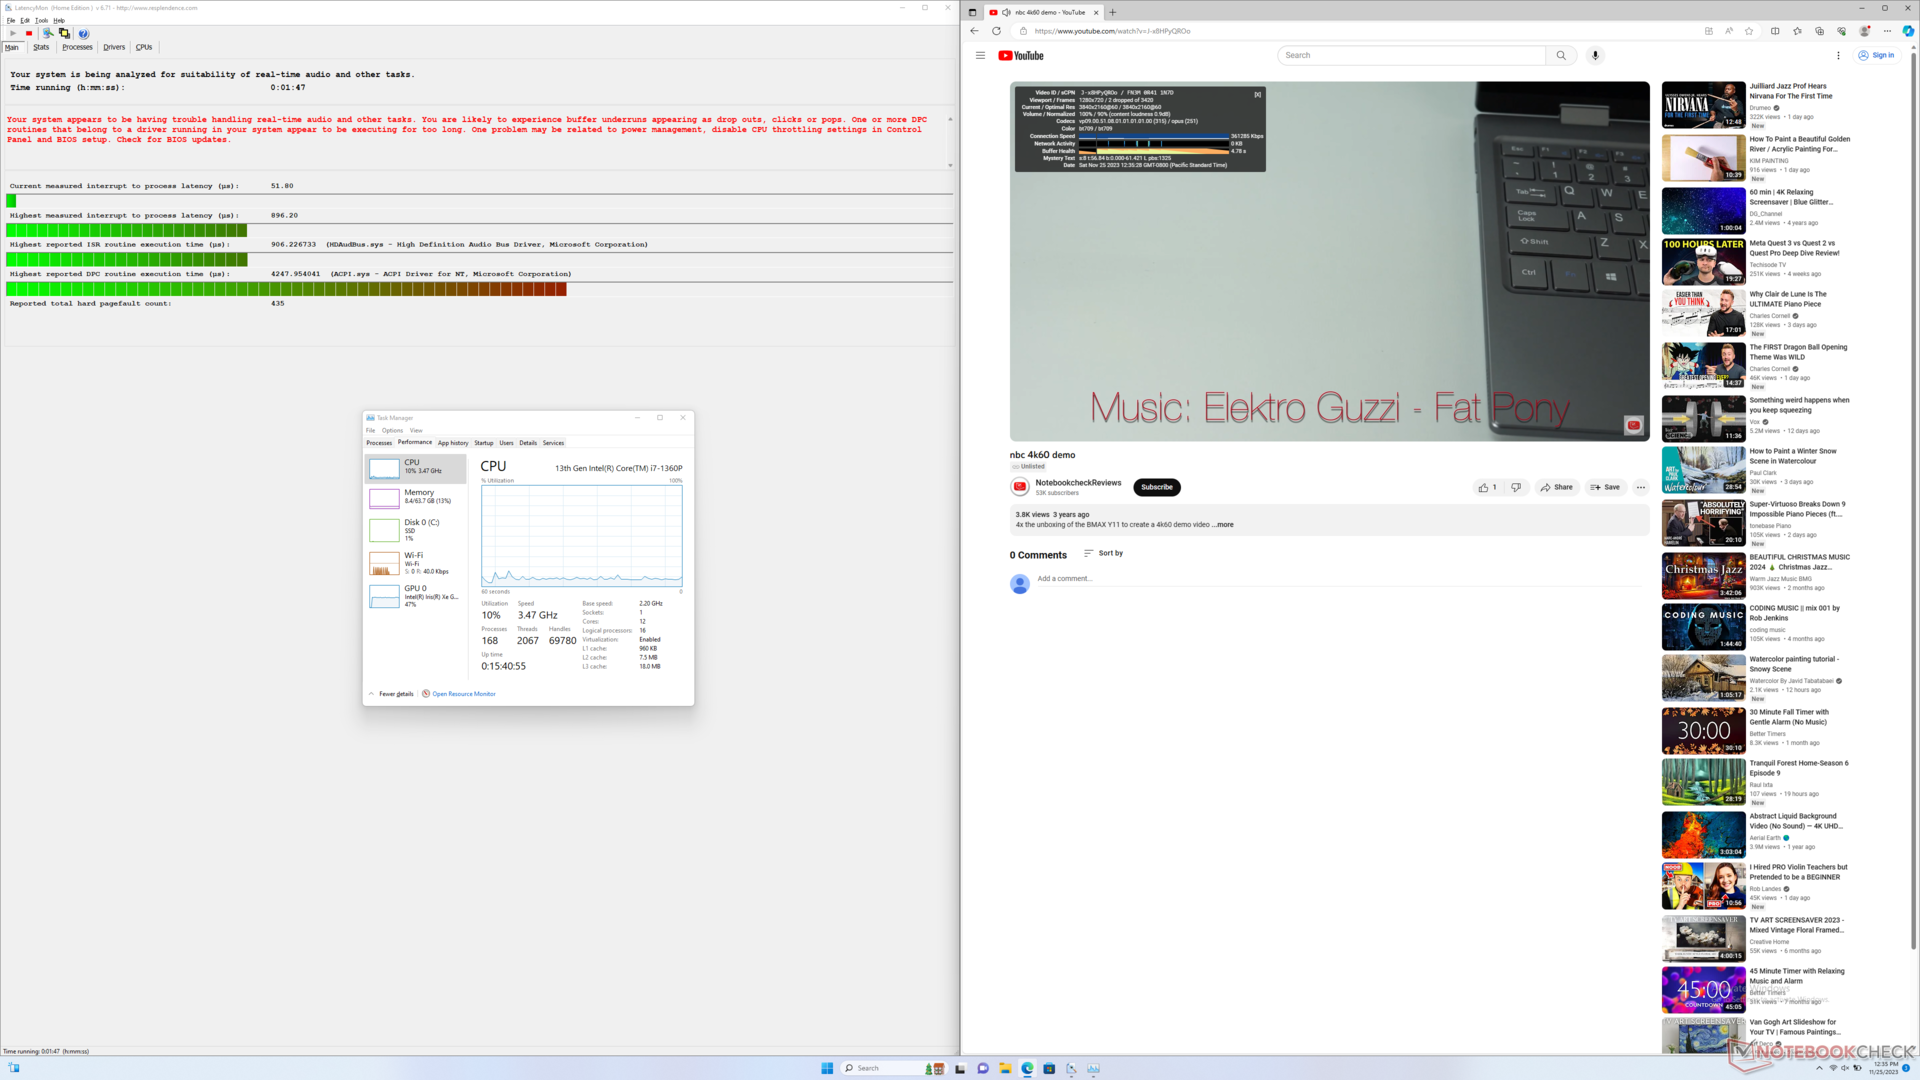
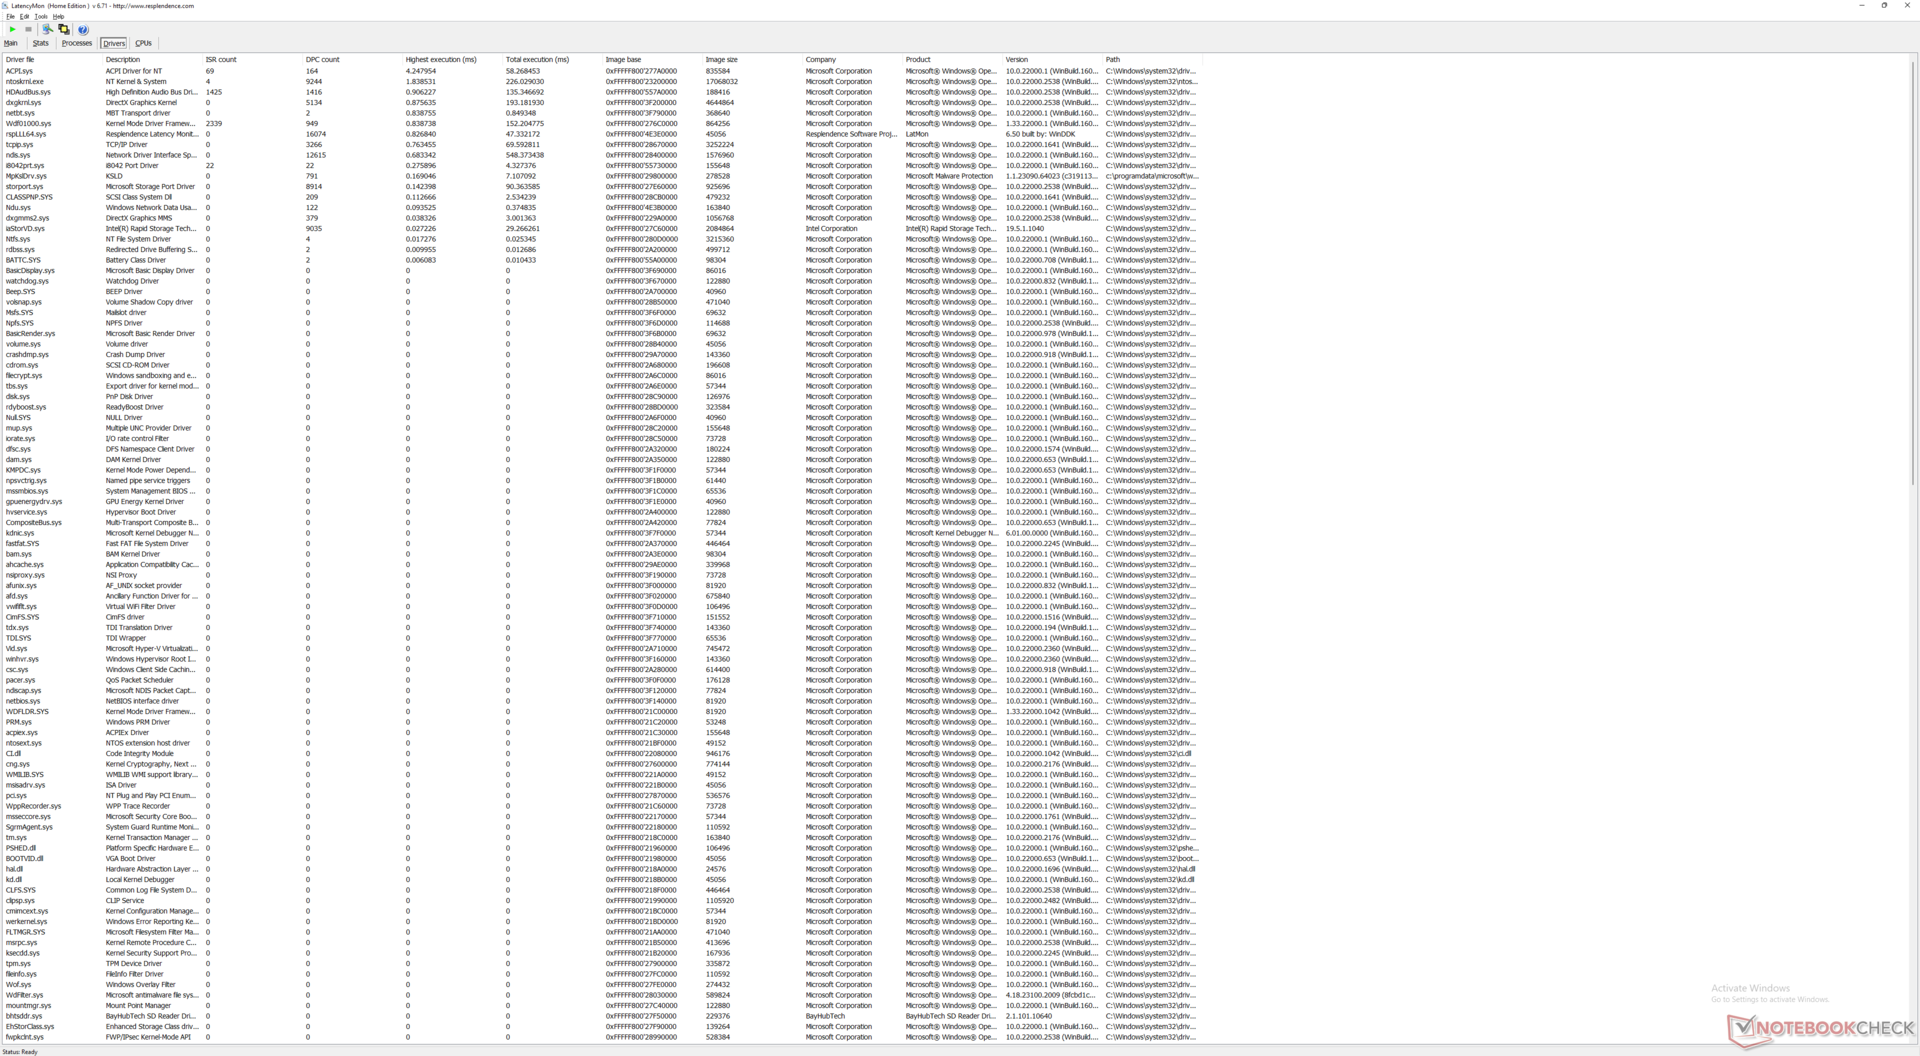
Latência DPC
O LatencyMon revela problemas de DPC ao abrir várias guias do navegador em nossa página inicial. a reprodução de vídeo 4K a 60 FPS é excelente, com apenas dois quadros perdidos registrados durante um período de um minuto.
| DPC Latencies / LatencyMon - interrupt to process latency (max), Web, Youtube, Prime95 | |
| Lenovo ThinkPad L15 Gen 4 21H70021GE | |
| Schenker Work 15 Tiger Lake-H | |
| Acer Aspire 5 A515-58GM-76S8 | |
| Eurocom C315 Blitz | |
| Samsung Galaxy Book2 15 | |
| Asus VivoBook S15 M3502RA-L1029W | |
* ... menor é melhor
Dispositivos de armazenamento
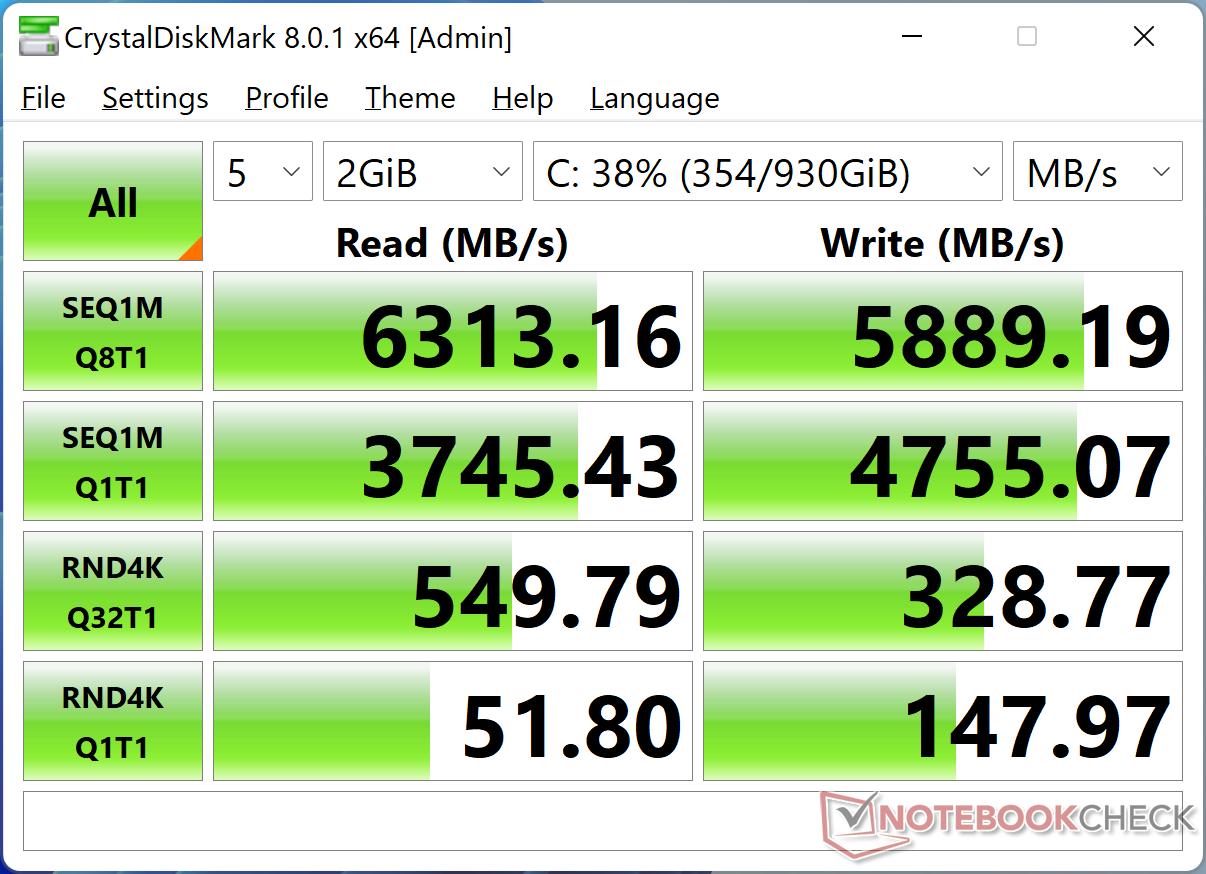
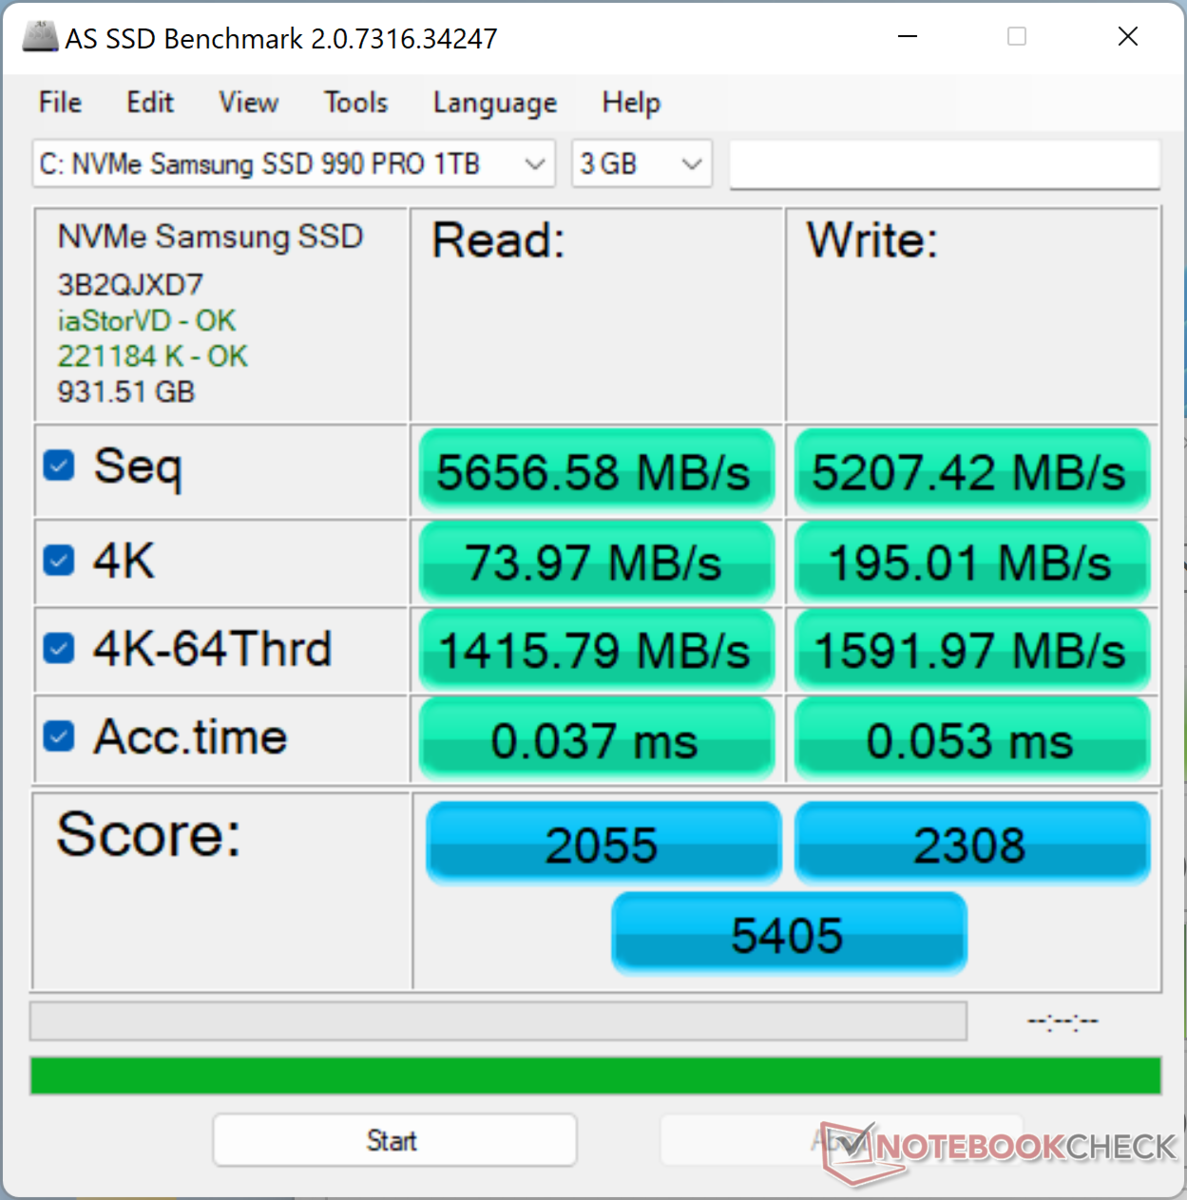
Nossa unidade é fornecida com um Samsung 990 Pro que promete taxas de leitura e gravação sequenciais de até 7450 MB/s e 6900 MB/s, respectivamente. A unidade em nossa unidade é capaz de sustentar um máximo de 7100 MB/s sem problemas de estrangulamento. A almofada térmica incluída no SSD permite que o calor seja dissipado na placa inferior de metal.

* ... menor é melhor
Disk Throttling: DiskSpd Read Loop, Queue Depth 8
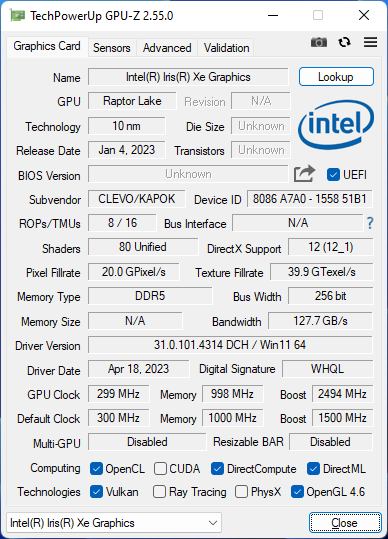
Desempenho da GPU
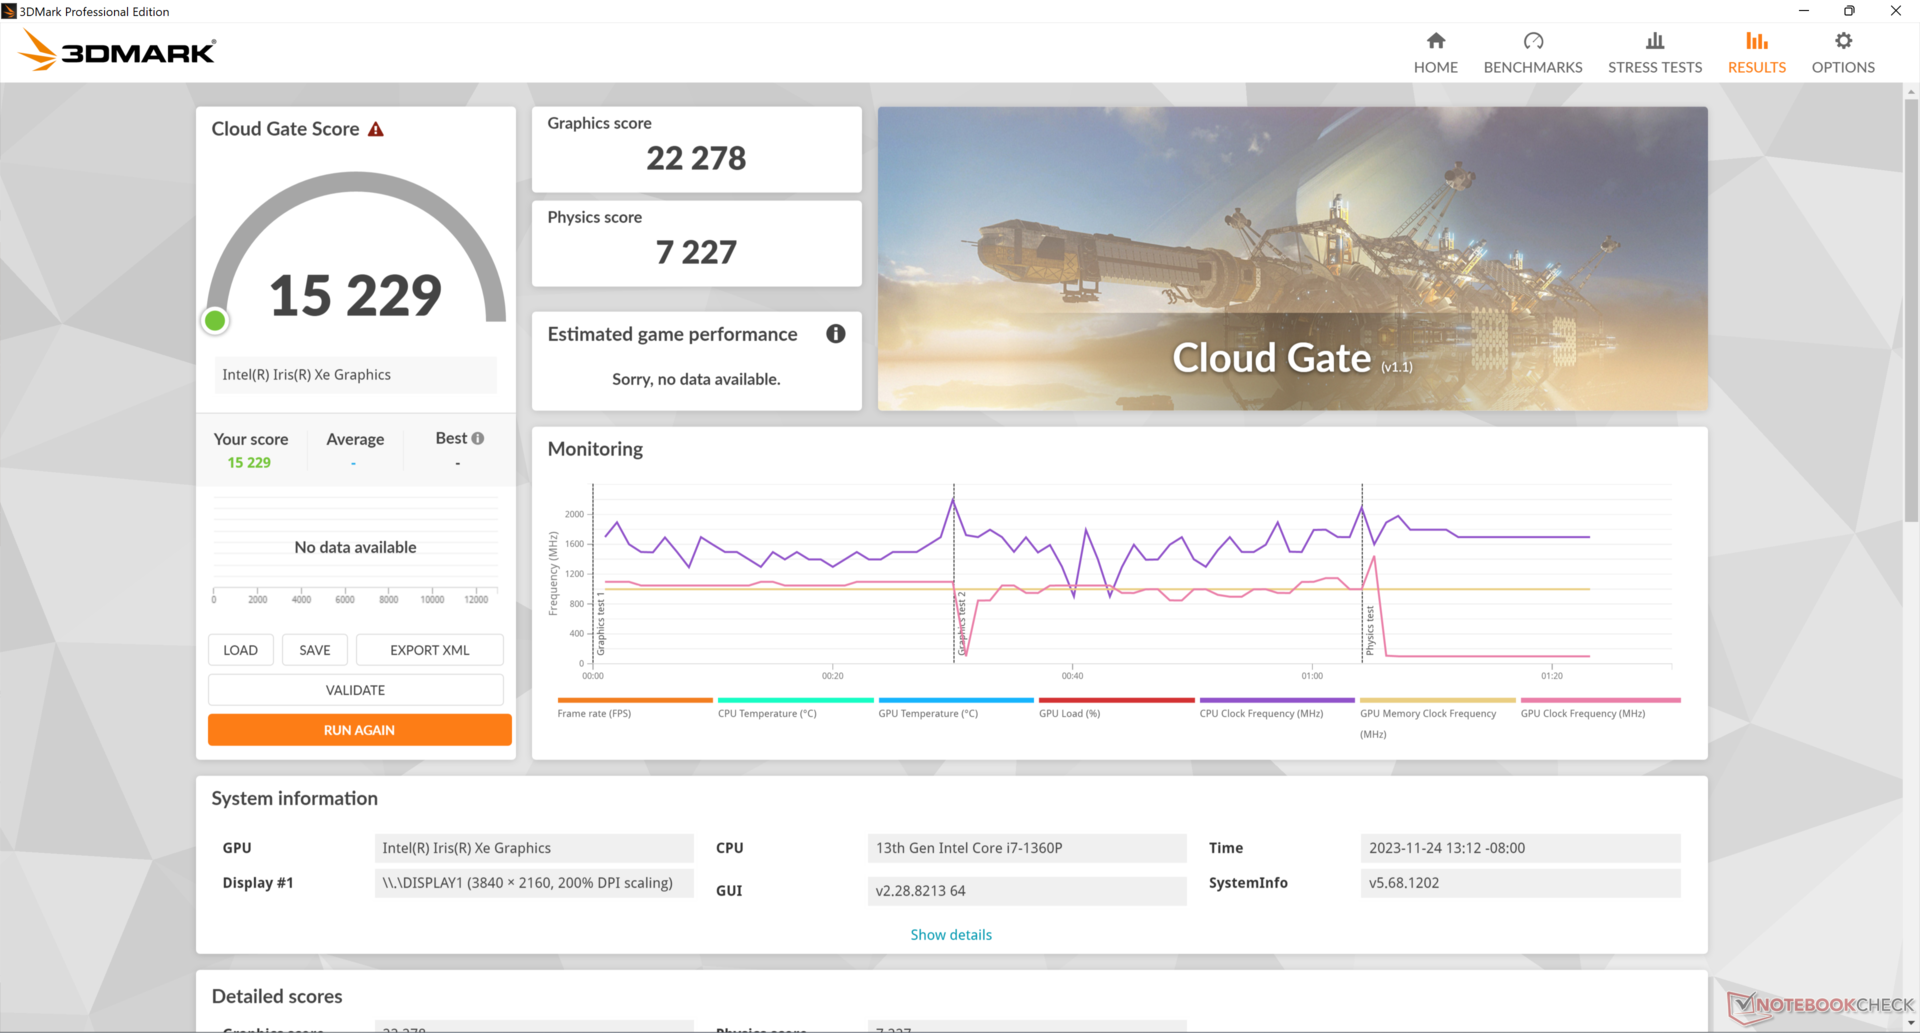
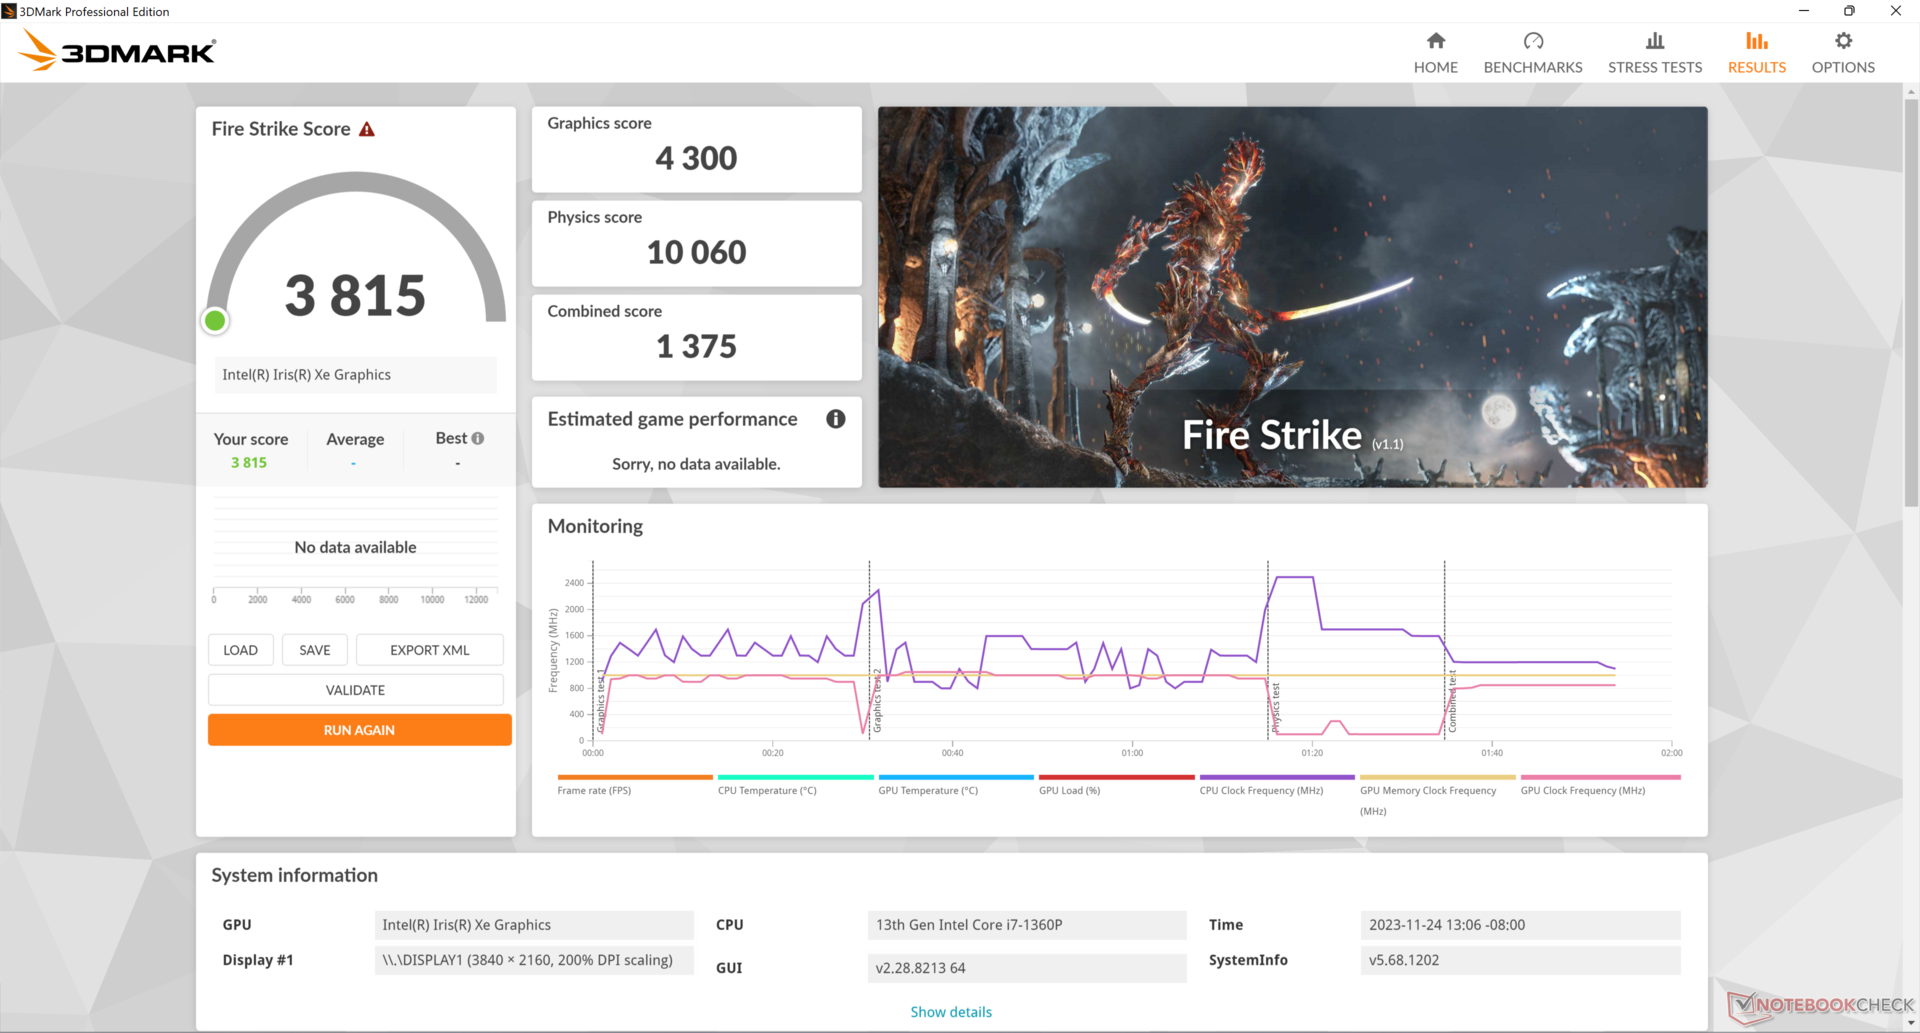
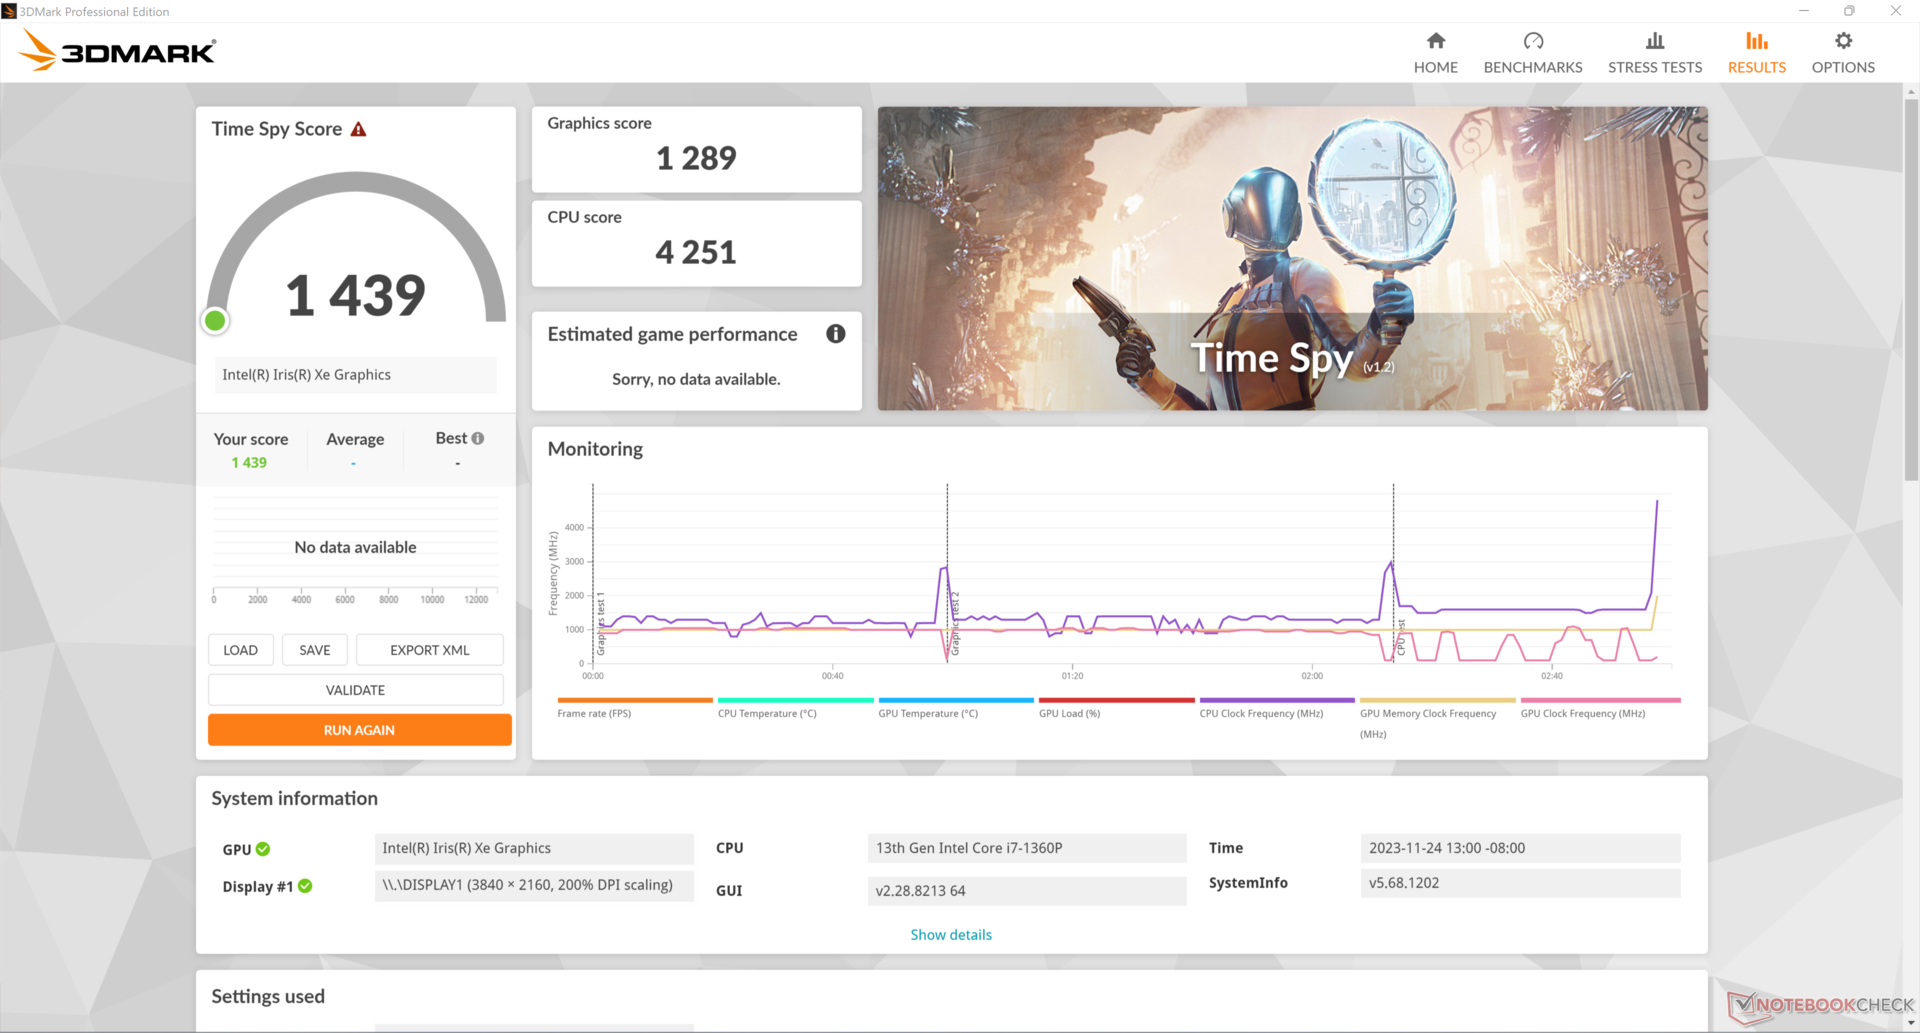
O sistema integrado Iris Xe 96 EUs integrada tem um desempenho ligeiramente abaixo da média quando comparada a outros notebooks com a mesma GPU. Na verdade, o nosso Schenker Work 15 com o antigo Core i7-11370H teria pontuações mais altas no 3DMark do que o nosso Eurocom, apesar de suas GPUs semelhantes.
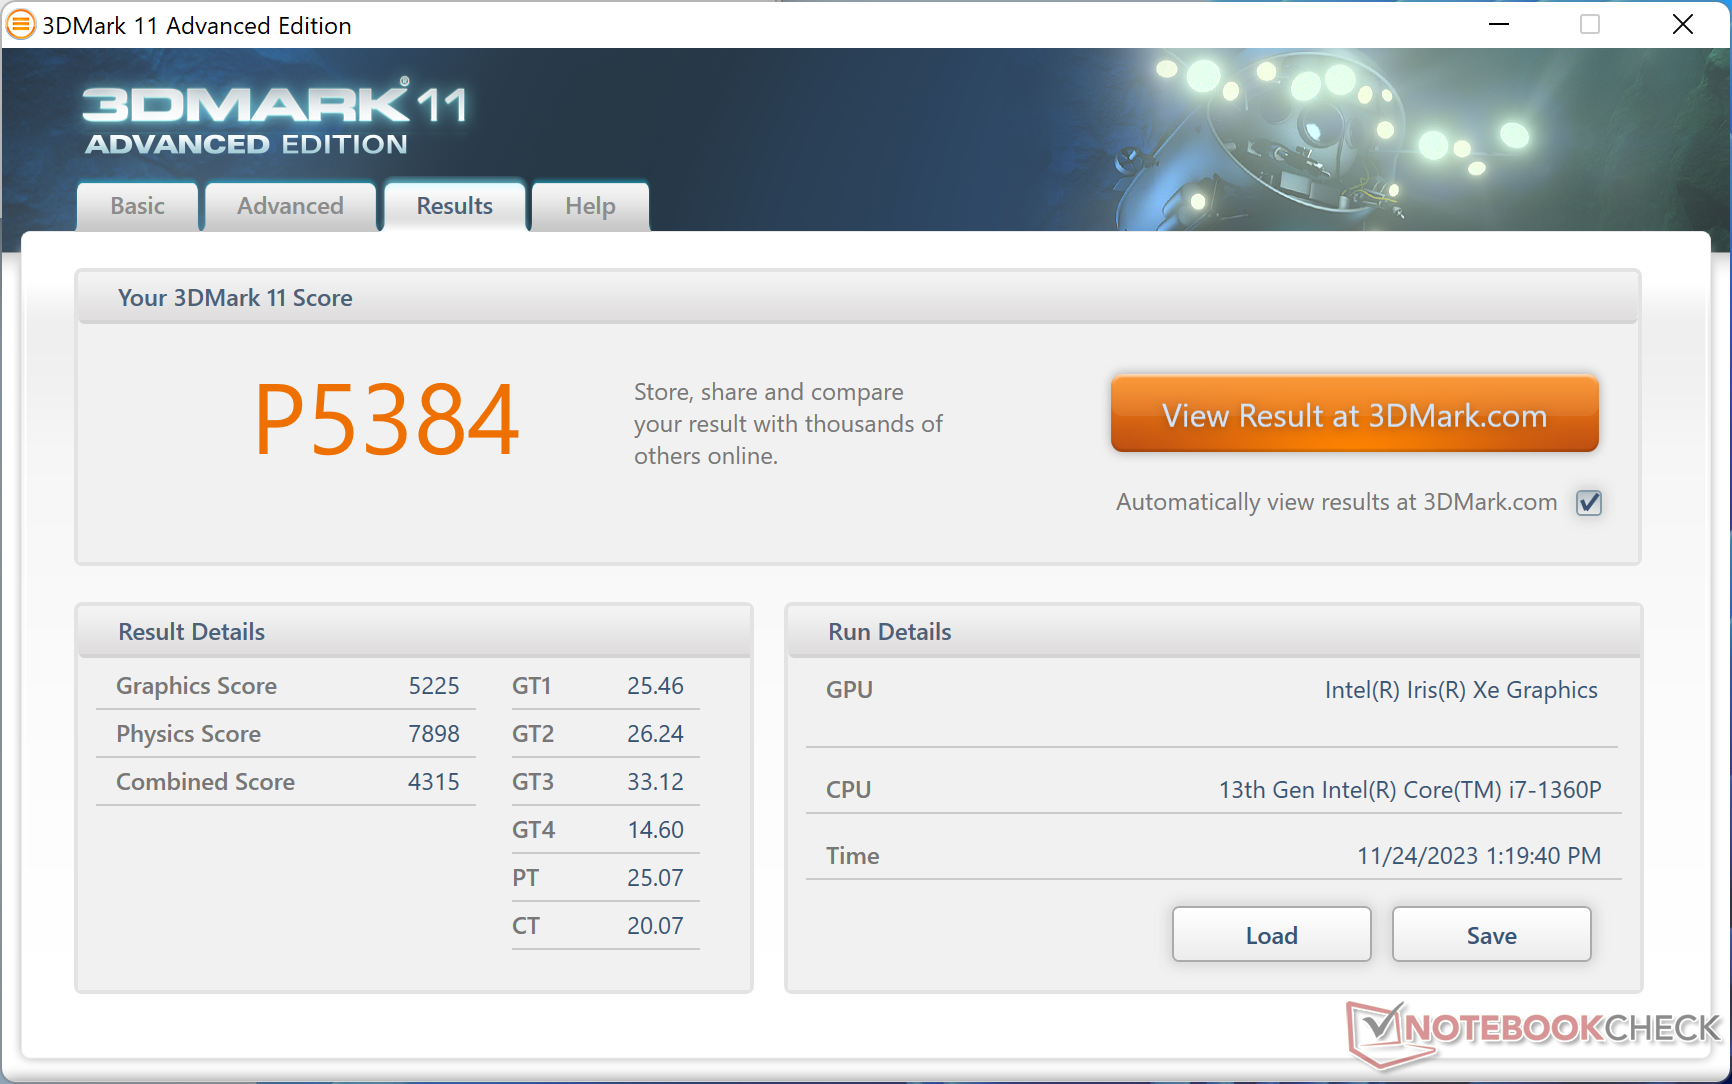
| 3DMark 11 Performance | 5384 pontos | |
| 3DMark Cloud Gate Standard Score | 15229 pontos | |
| 3DMark Fire Strike Score | 3815 pontos | |
| 3DMark Time Spy Score | 1439 pontos | |
Ajuda | ||
* ... menor é melhor
| Tiny Tina's Wonderlands - 1280x720 Lowest Preset (DX12) | |
| Média Intel Iris Xe Graphics G7 96EUs (25.9 - 67.3, n=32) | |
| Eurocom C315 Blitz | |
Witcher 3 FPS Chart
| baixo | média | alto | ultra | |
|---|---|---|---|---|
| GTA V (2015) | 84.7 | 72.7 | 22.5 | 9.68 |
| The Witcher 3 (2015) | 66.7 | 46.9 | 26.3 | 13 |
| Dota 2 Reborn (2015) | 96.8 | 66.3 | 48.6 | 40.9 |
| Final Fantasy XV Benchmark (2018) | 33.4 | 18.8 | 14 | |
| X-Plane 11.11 (2018) | 43.4 | 32.2 | 29.3 | |
| Far Cry 5 (2018) | 36 | 23 | 21 | 20 |
| Strange Brigade (2018) | 76.8 | 34.7 | 28.2 | 23.3 |
| Cyberpunk 2077 1.6 (2022) | 14.1 | |||
| Tiny Tina's Wonderlands (2022) | ||||
| F1 22 (2022) | 38.5 | 34.5 | 25.3 | 19.2 |
Emissões
Ruído do sistema
O comportamento do ruído do ventilador precisa de ajustes adicionais. Quando conectado à rede elétrica, o ventilador pulsava ocasionalmente entre o silêncio e 35 dB(A), mesmo quando estava no modo de economia de energia no desktop. Somente quando estiver funcionando com a energia da bateria, a ventoinha permanecerá silenciosa, sem pulsação desnecessária. Caso contrário, o ruído da ventoinha ao executar cargas exigentes, como jogos, é quase idêntico ao que observamos no Schenker Work 15 com a CPU Core H-series mais antiga.
Barulho
| Ocioso |
| 25.1 / 25.1 / 34.9 dB |
| Carga |
| 42.1 / 44.2 dB |
 | ||
30 dB silencioso 40 dB(A) audível 50 dB(A) ruidosamente alto |
||
min: | ||
| Eurocom C315 Blitz Iris Xe G7 96EUs, i7-1360P, Samsung 990 Pro 1 TB | Schenker Work 15 Tiger Lake-H Iris Xe G7 96EUs, i7-11370H, Samsung SSD 980 Pro 1TB MZ-V8P1T0BW | Lenovo ThinkPad L15 Gen 4 21H70021GE Vega 8, R7 PRO 7730U, SK hynix HFS512GEJ4X113N | Acer Aspire 5 A515-58GM-76S8 GeForce RTX 2050 Mobile, i7-1355U, Micron 2450 1TB MTFDKBA1T0TFK | Asus VivoBook S15 M3502RA-L1029W Radeon 680M, R7 6800H, WD PC SN735 SDBPNHH-512G | Samsung Galaxy Book2 15 A350M, i7-1260P, Samsung PM991 MZVLQ512HBLU | |
|---|---|---|---|---|---|---|
| Noise | 3% | 18% | 2% | -14% | -2% | |
| desligado / ambiente * (dB) | 22.5 | 24.4 -8% | 23.5 -4% | 25.04 -11% | 26 -16% | 24.3 -8% |
| Idle Minimum * (dB) | 25.1 | 24.4 3% | 23.5 6% | 26.3 -5% | 26 -4% | 24.3 3% |
| Idle Average * (dB) | 25.1 | 24.4 3% | 23.5 6% | 26.3 -5% | 26 -4% | 24.3 3% |
| Idle Maximum * (dB) | 34.9 | 26.7 23% | 23.5 33% | 26.3 25% | 28.1 19% | 29.8 15% |
| Load Average * (dB) | 42.1 | 43.8 -4% | 27.5 35% | 32.5 23% | 56.9 -35% | 47.5 -13% |
| Witcher 3 ultra * (dB) | 44.5 | 43.8 2% | 32.7 27% | 46.7 -5% | 47.5 -7% | |
| Load Maximum * (dB) | 44.2 | 44.8 -1% | 32.7 26% | 49 -11% | 62.6 -42% | 47.5 -7% |
* ... menor é melhor
Temperatura
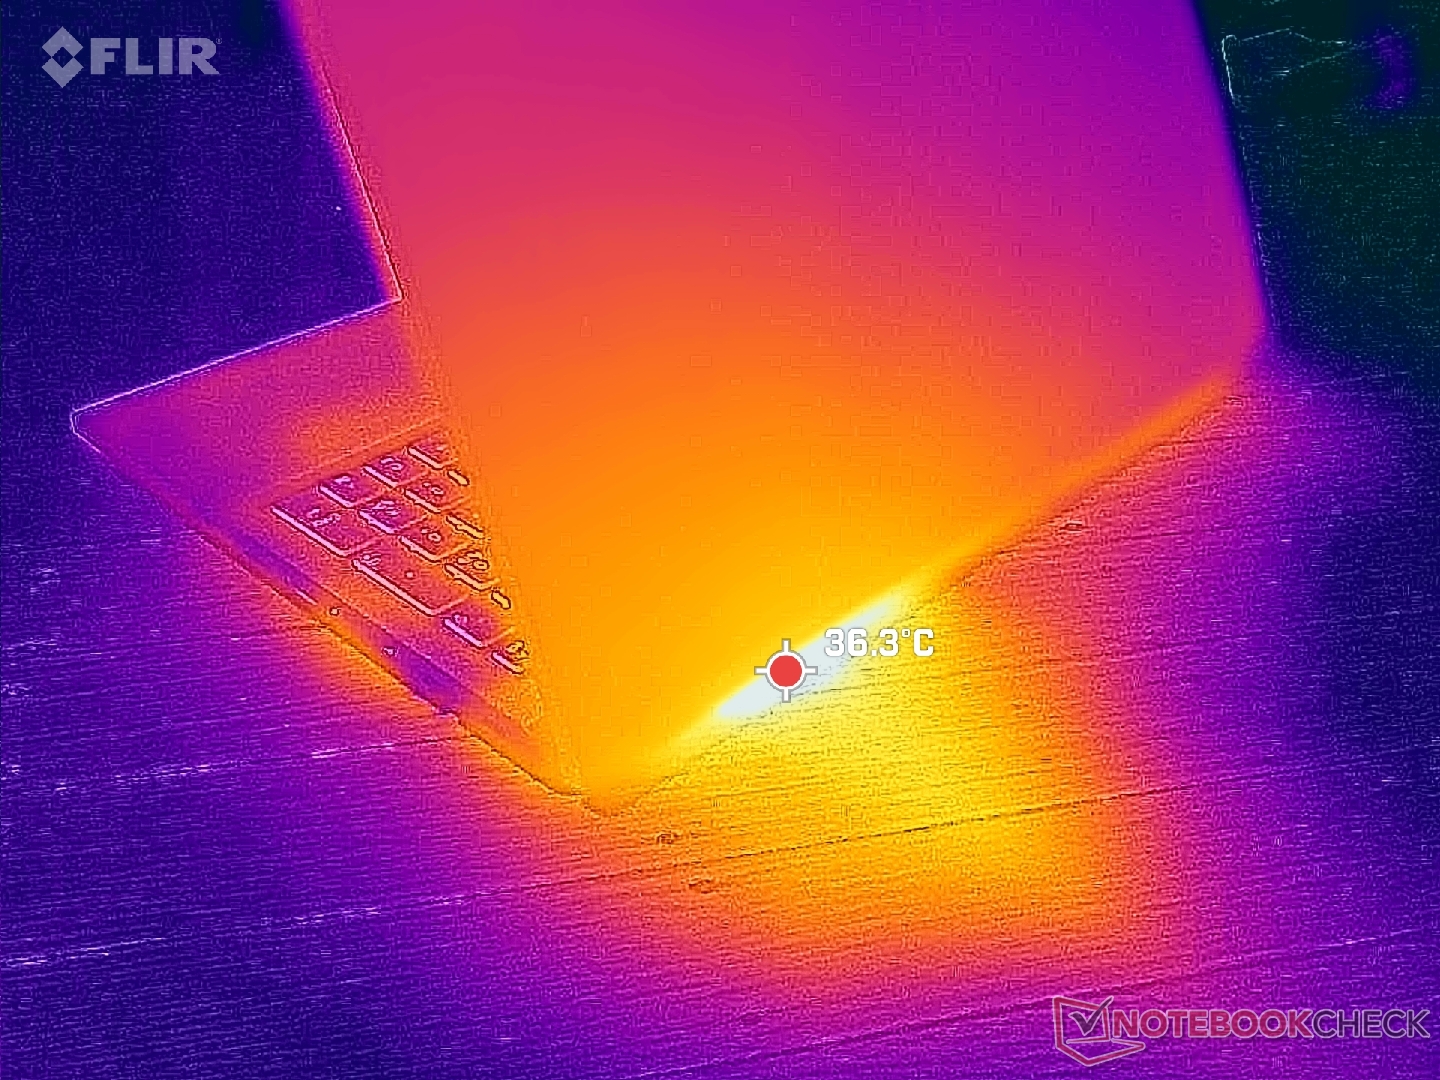
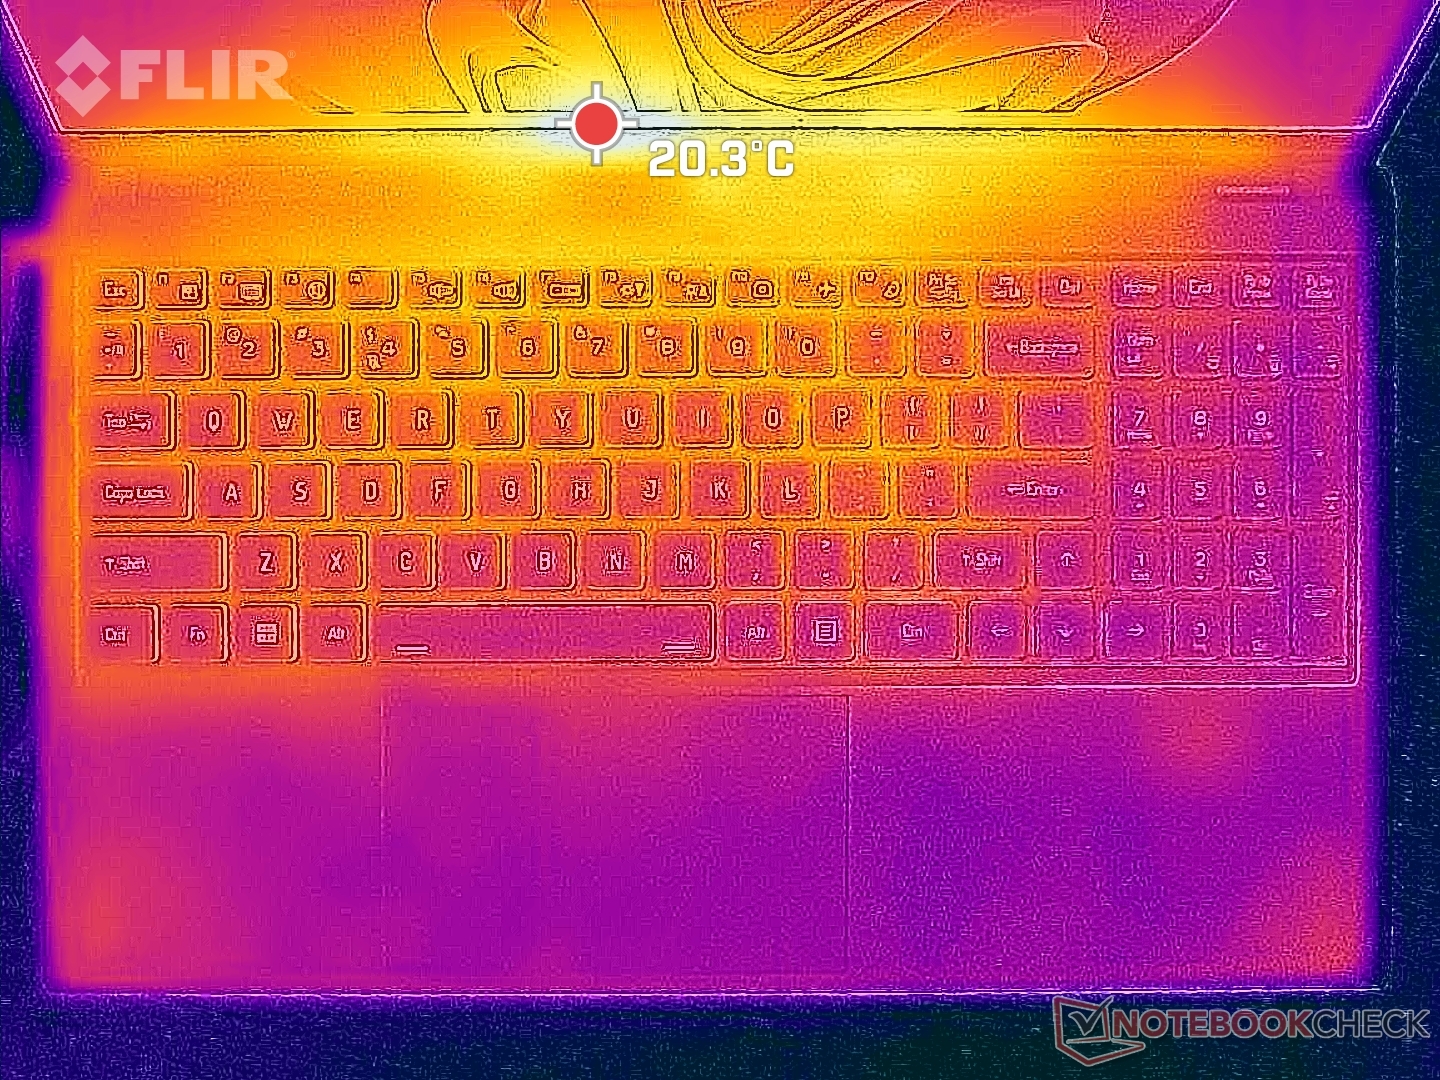
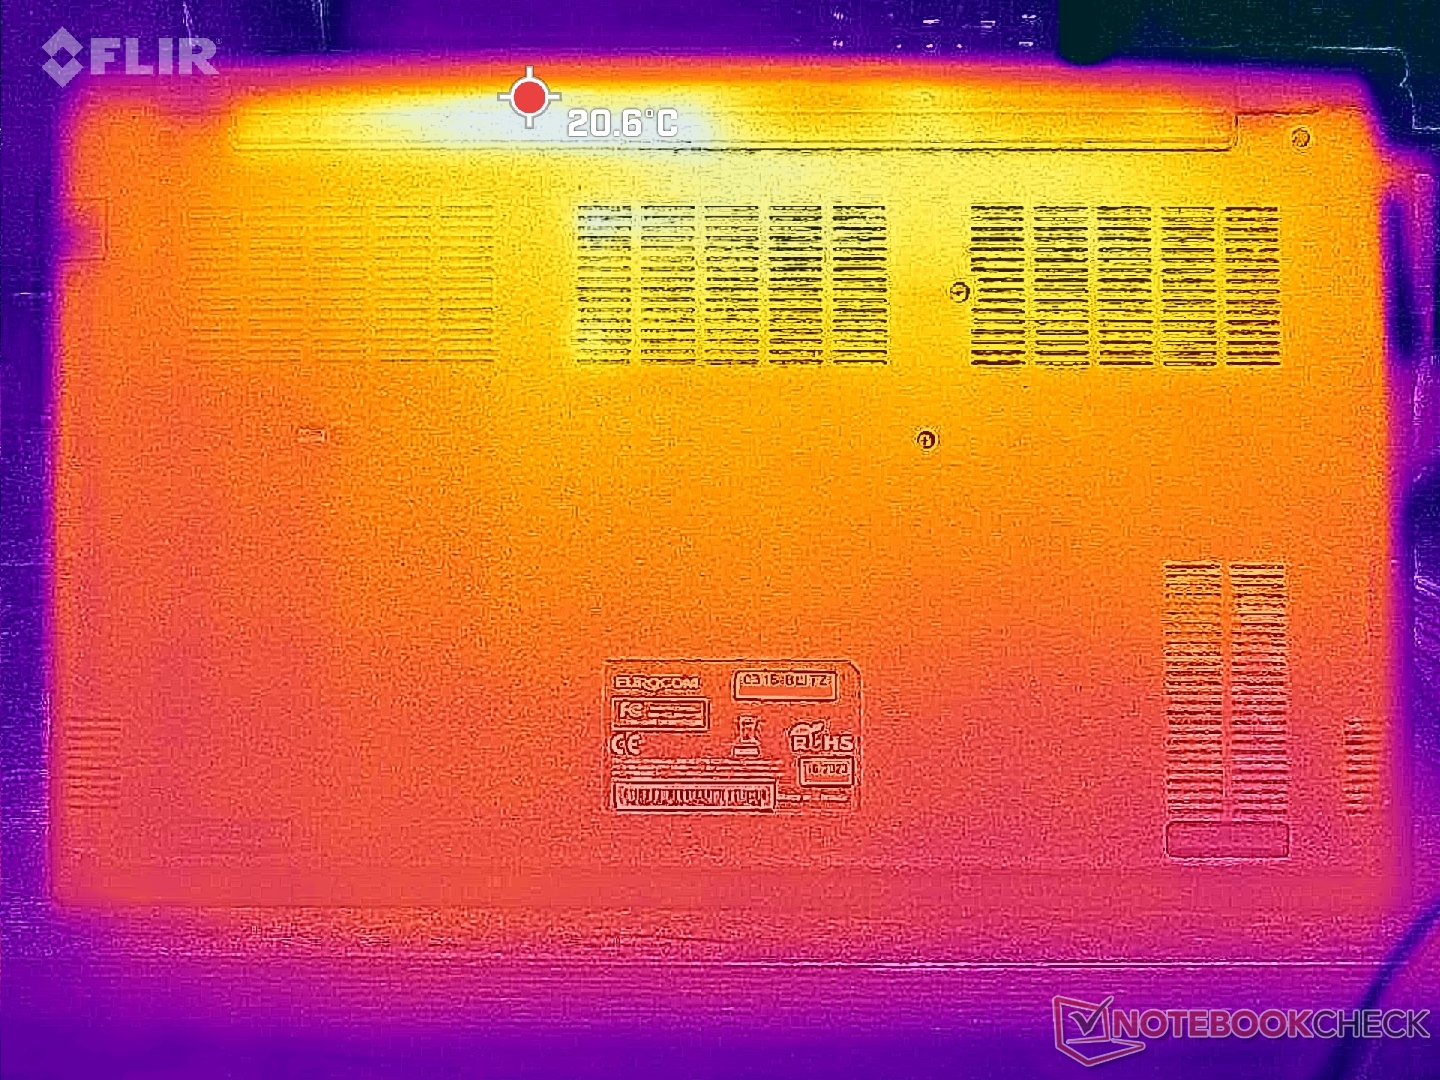
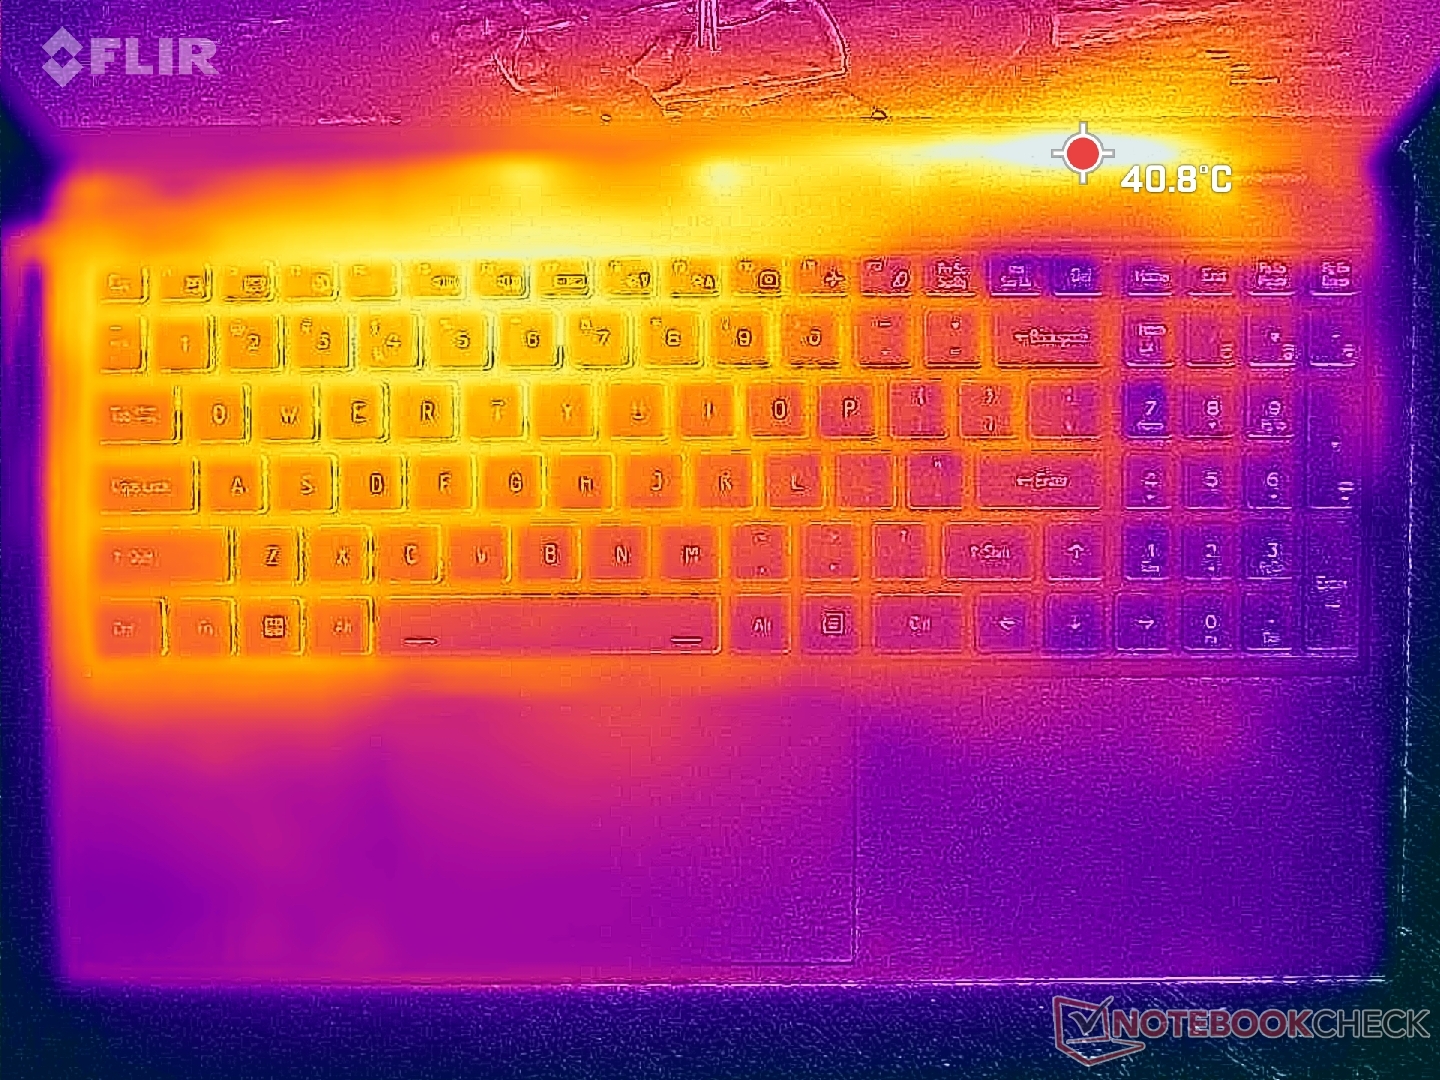
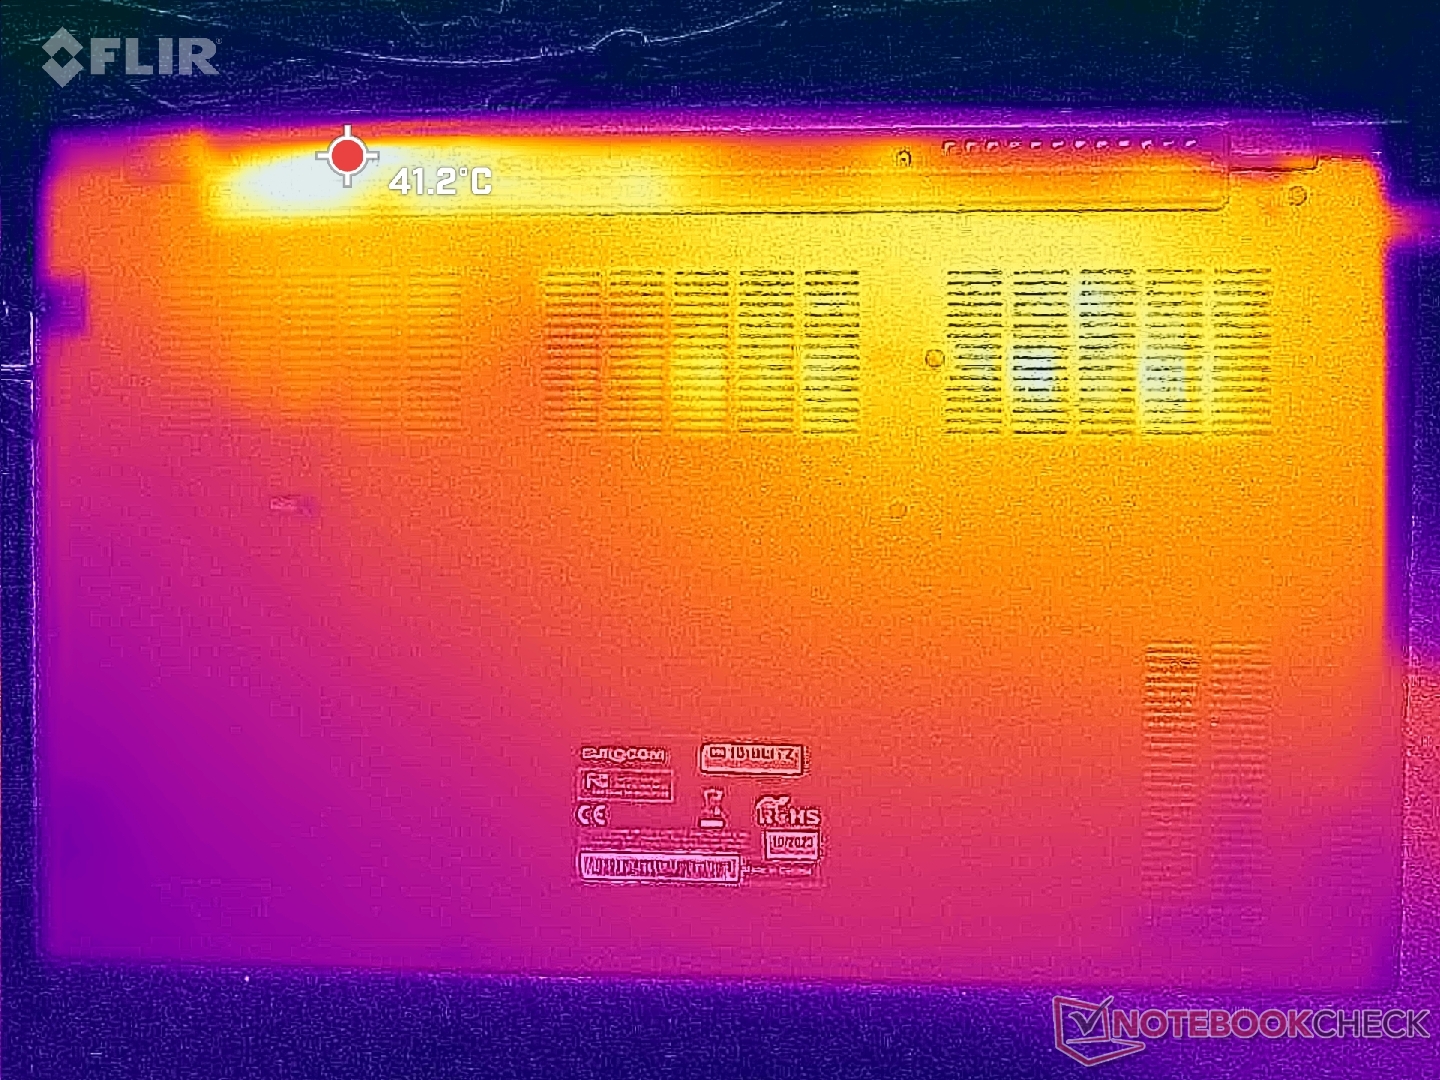
As temperaturas da superfície são um pouco mais baixas, em média, do que as observadas no Schenker Work 15. Ao executar cargas exigentes, por exemplo, os pontos quentes próximos à parte traseira do chassi atingiam apenas 35 °C a 38 °C, em comparação com os 43 °C do Schenker.
(+) A temperatura máxima no lado superior é 35.6 °C / 96 F, em comparação com a média de 34.3 °C / 94 F , variando de 21.2 a 62.5 °C para a classe Office.
(+) A parte inferior aquece até um máximo de 37.8 °C / 100 F, em comparação com a média de 36.8 °C / 98 F
(+) Em uso inativo, a temperatura média para o lado superior é 22.8 °C / 73 F, em comparação com a média do dispositivo de 29.5 °C / ### class_avg_f### F.
(+) Os apoios para as mãos e o touchpad são mais frios que a temperatura da pele, com um máximo de 26.6 °C / 79.9 F e, portanto, são frios ao toque.
(±) A temperatura média da área do apoio para as mãos de dispositivos semelhantes foi 27.5 °C / 81.5 F (+0.9 °C / 1.6 F).
| Eurocom C315 Blitz Intel Core i7-1360P, Intel Iris Xe Graphics G7 96EUs | Schenker Work 15 Tiger Lake-H Intel Core i7-11370H, Intel Iris Xe Graphics G7 96EUs | Lenovo ThinkPad L15 Gen 4 21H70021GE AMD Ryzen 7 PRO 7730U, AMD Radeon RX Vega 8 (Ryzen 4000/5000) | Acer Aspire 5 A515-58GM-76S8 Intel Core i7-1355U, NVIDIA GeForce RTX 2050 Mobile | Asus VivoBook S15 M3502RA-L1029W AMD Ryzen 7 6800H, AMD Radeon 680M | Samsung Galaxy Book2 15 Intel Core i7-1260P, Intel Arc A350M | |
|---|---|---|---|---|---|---|
| Heat | -6% | 0% | -5% | -35% | -15% | |
| Maximum Upper Side * (°C) | 35.6 | 39.1 -10% | 39.1 -10% | 35.7 -0% | 50.2 -41% | 44.6 -25% |
| Maximum Bottom * (°C) | 37.8 | 43.4 -15% | 36.1 4% | 36.8 3% | 50.2 -33% | 47.5 -26% |
| Idle Upper Side * (°C) | 24.2 | 24.3 -0% | 23.1 5% | 27.9 -15% | 32.1 -33% | 25.8 -7% |
| Idle Bottom * (°C) | 26 | 25.1 3% | 25.7 1% | 27.9 -7% | 34.6 -33% | 26.1 -0% |
* ... menor é melhor
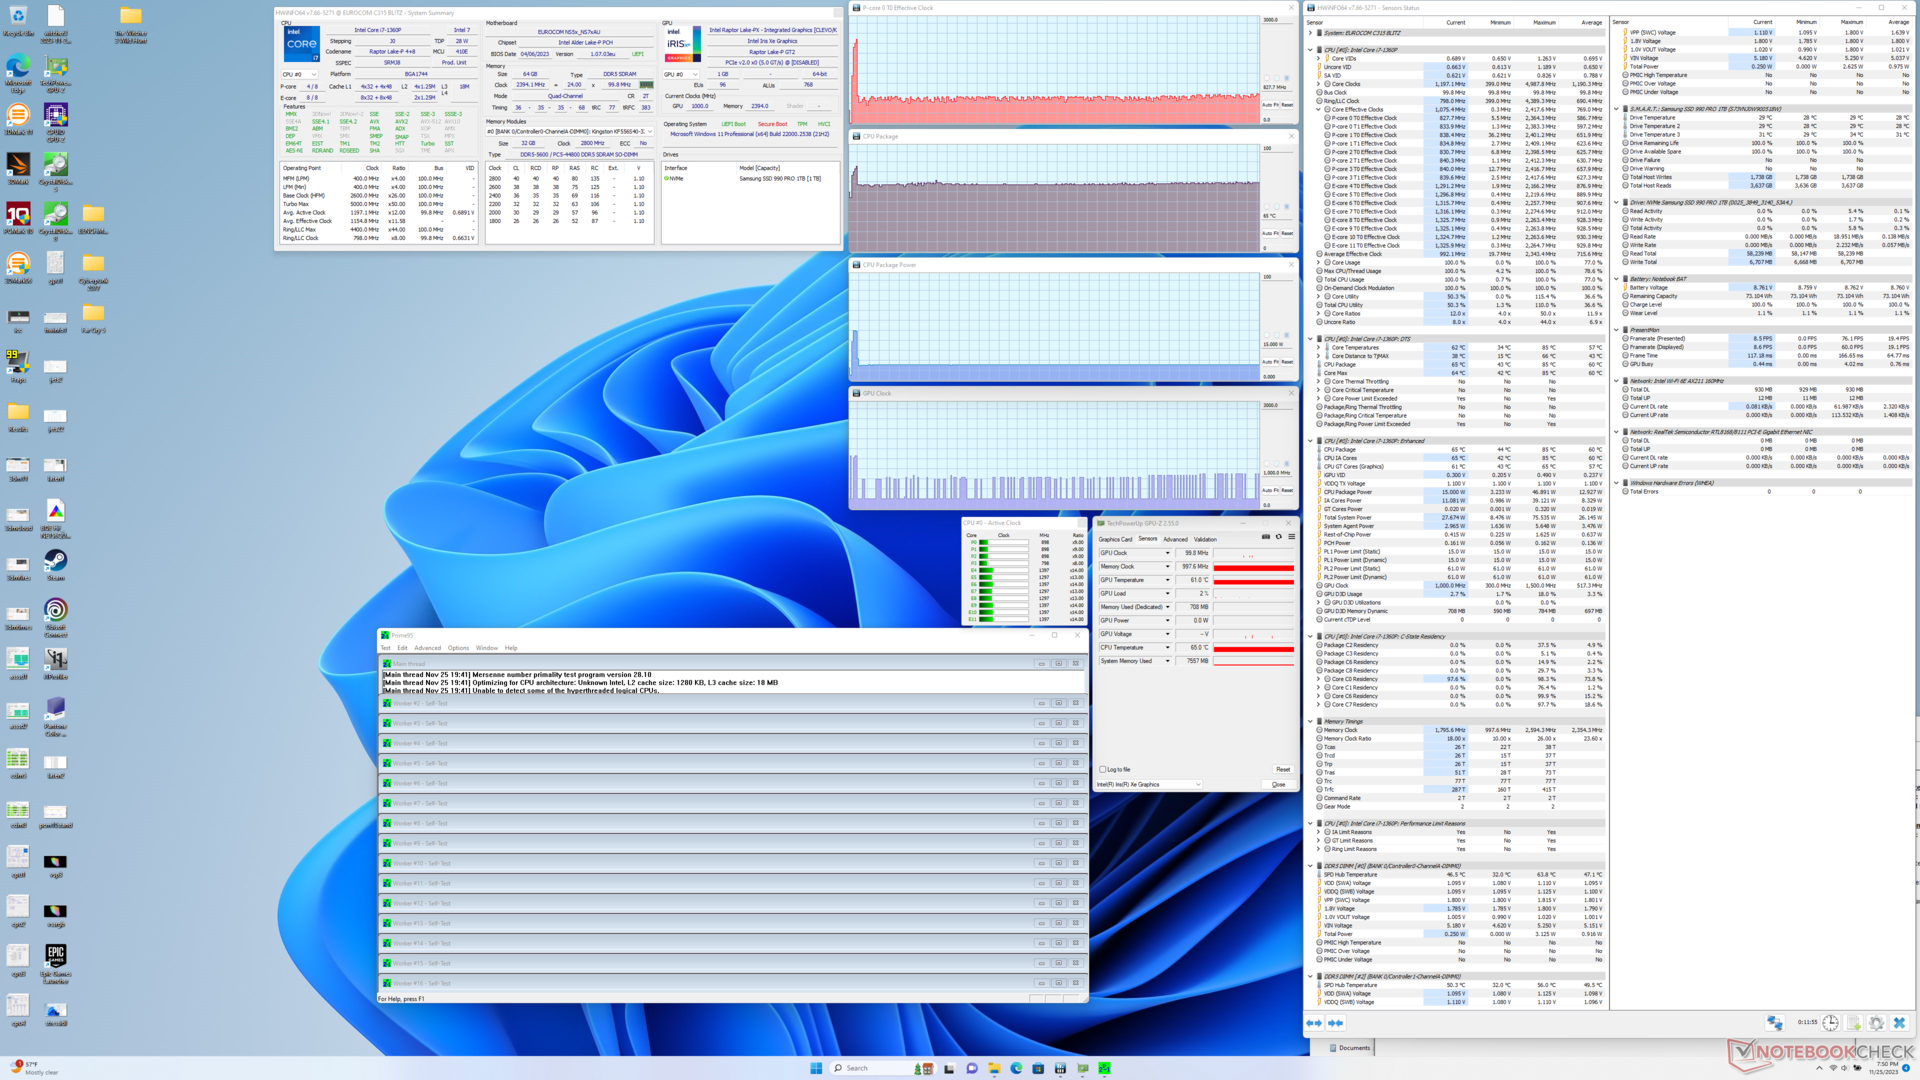
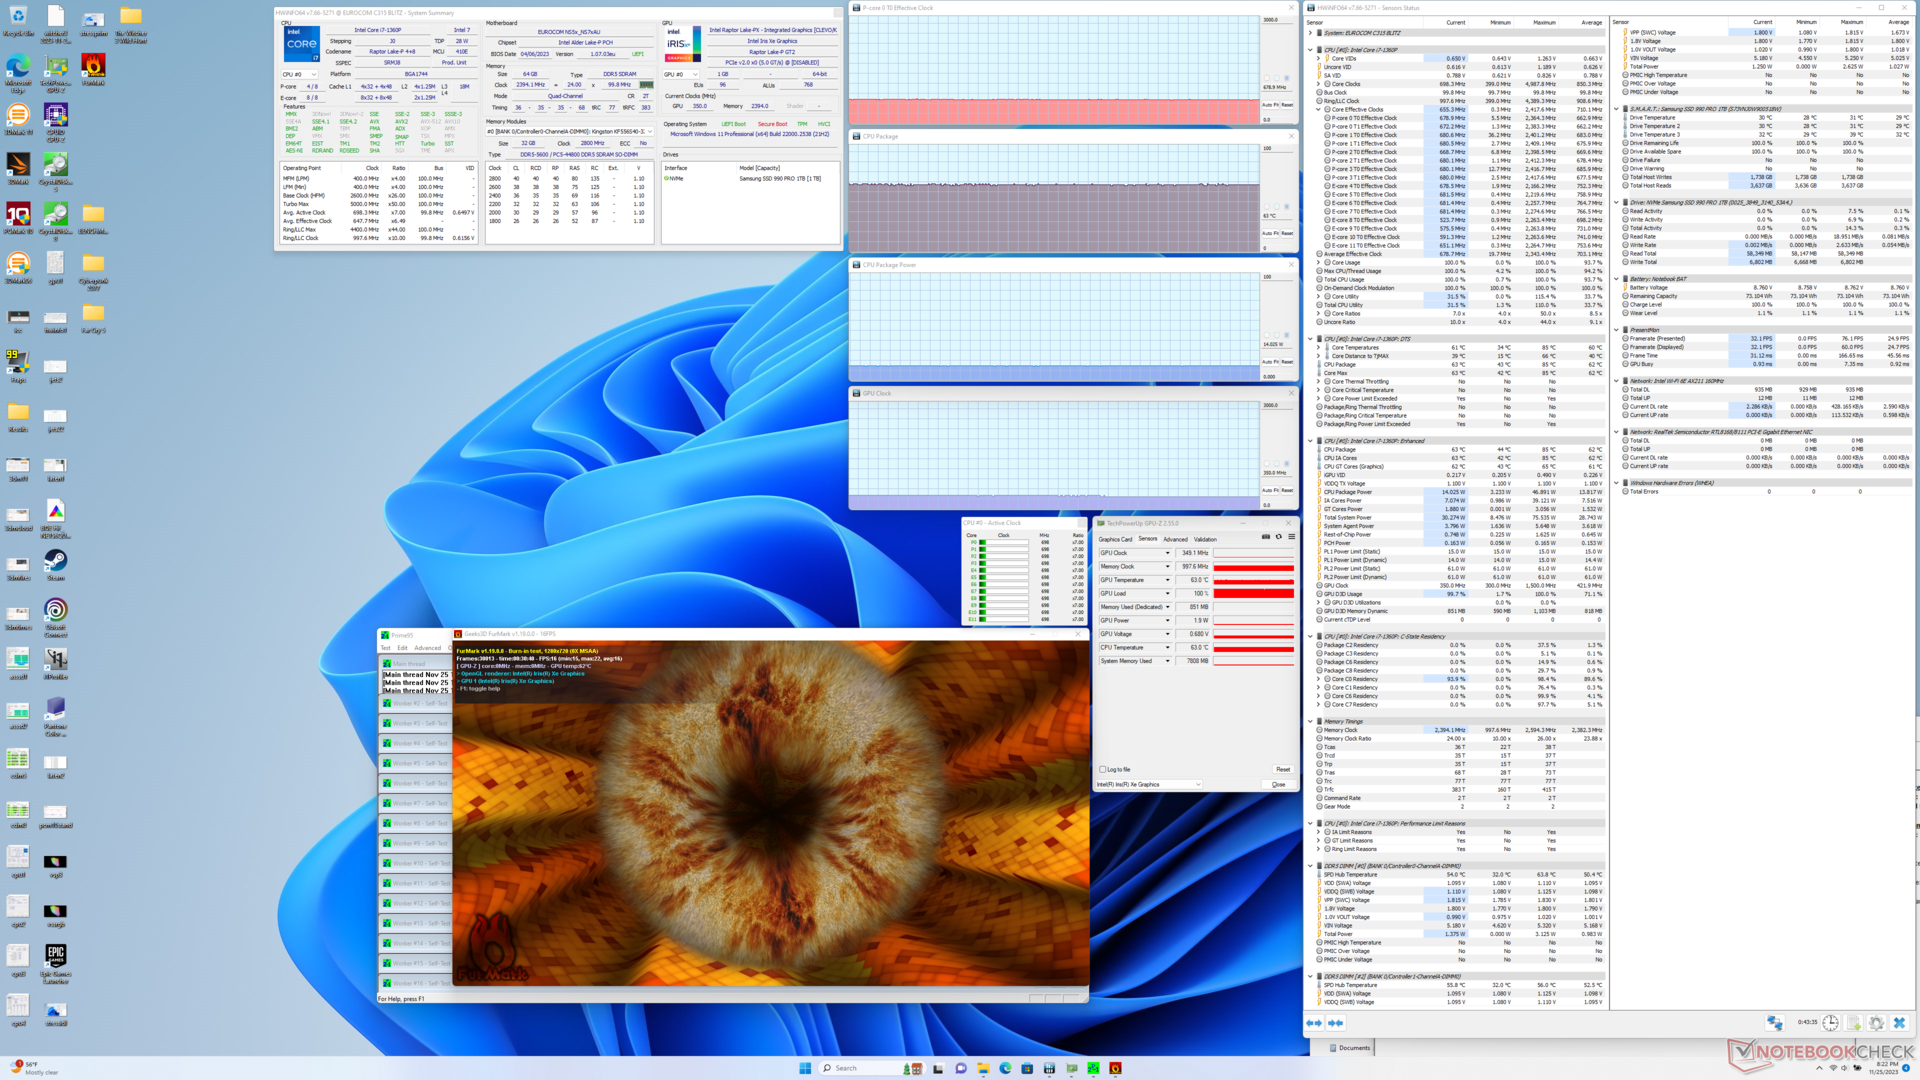
Teste de estresse
Ao iniciar o estresse do Prime95, a CPU aumentava para 2,4 GHz, 47 W e 85 W por apenas alguns segundos antes de cair e se estabilizar em 800 MHz - 1,3 GHz, 15 W e 65 W. A queda acentuada do desempenho está alinhada com os resultados do loop do CineBench R15 xT acima. Esperávamos uma melhor sustentabilidade do desempenho, já que a série Core P deveria ser um passo entre a série U, mais lenta, e a série H, mais potente, mas seu comportamento no Eurocom é típico da maioria das CPUs da série U.
A temperatura do núcleo se estabilizaria em torno de 65 °C ao executar cargas exigentes, em comparação com 78 °C no Schenker Work 15 com o antigo Core i7-11730H.
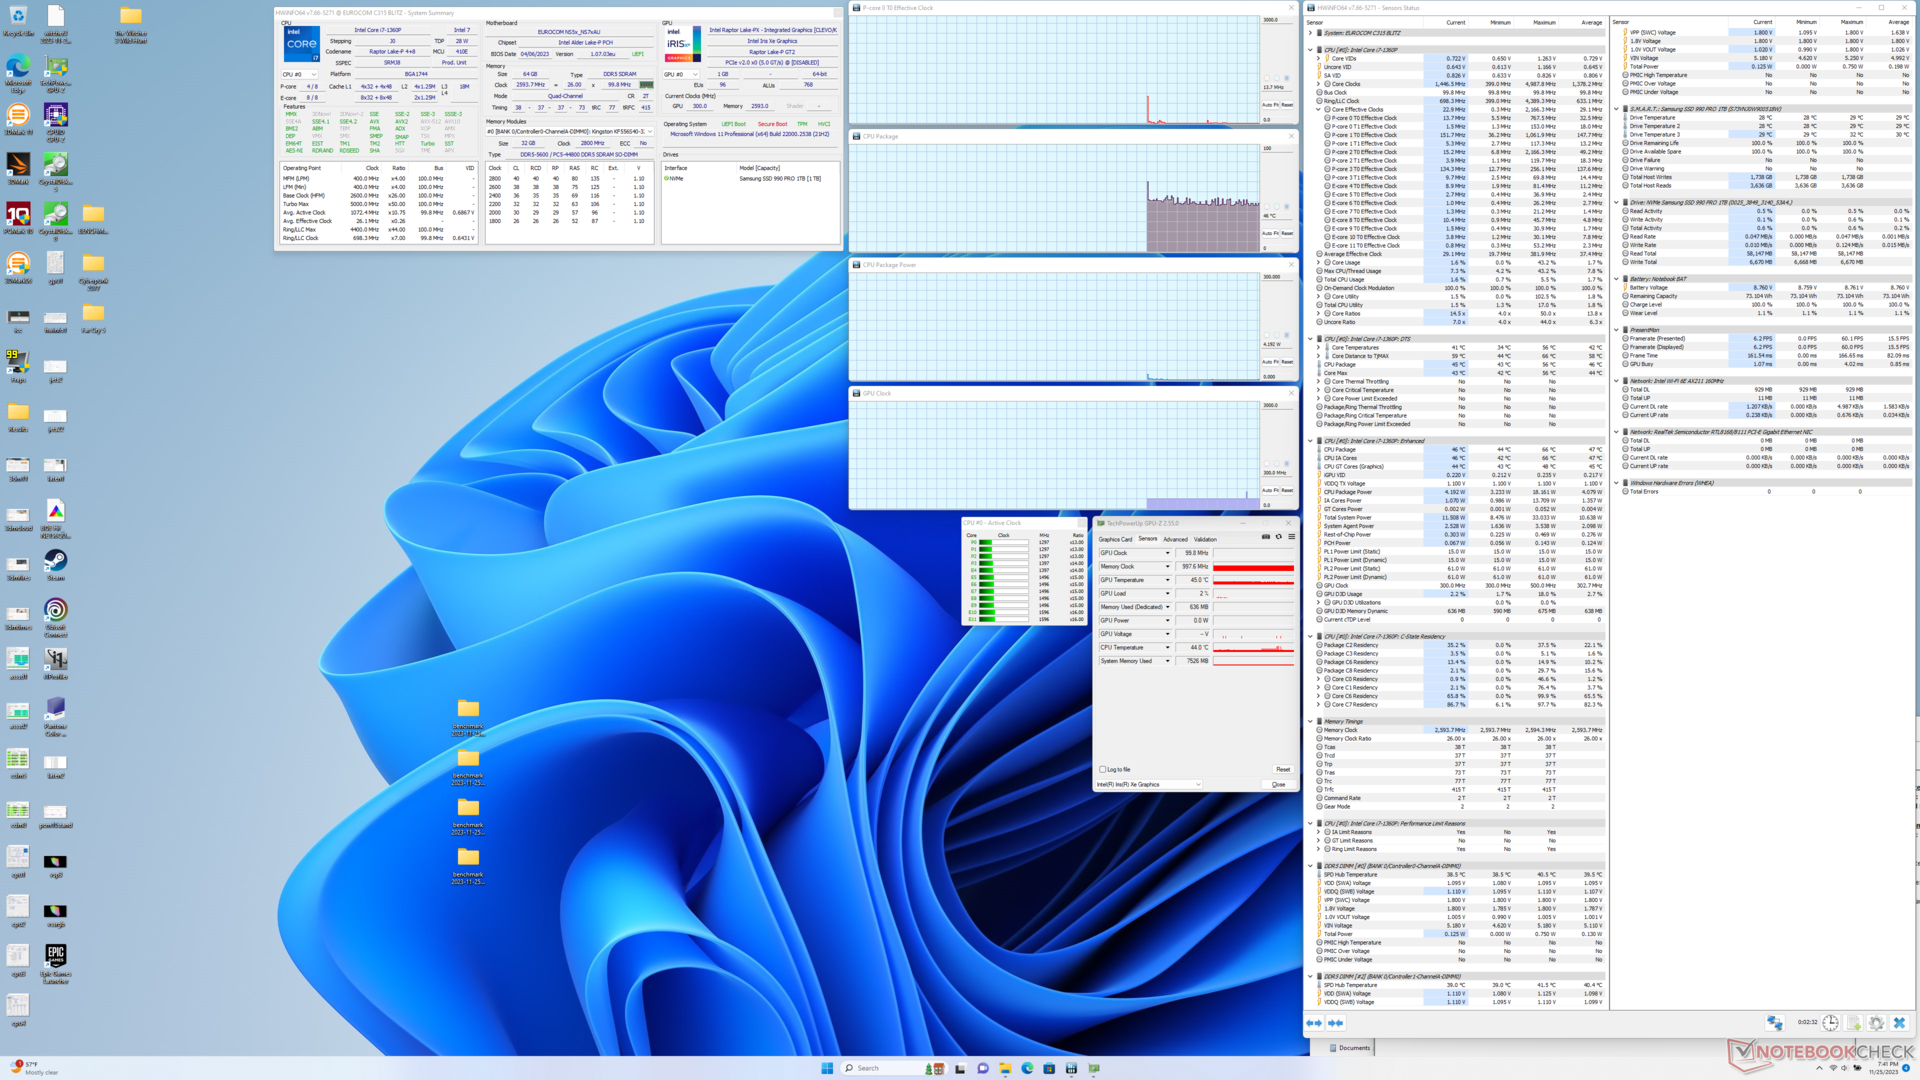
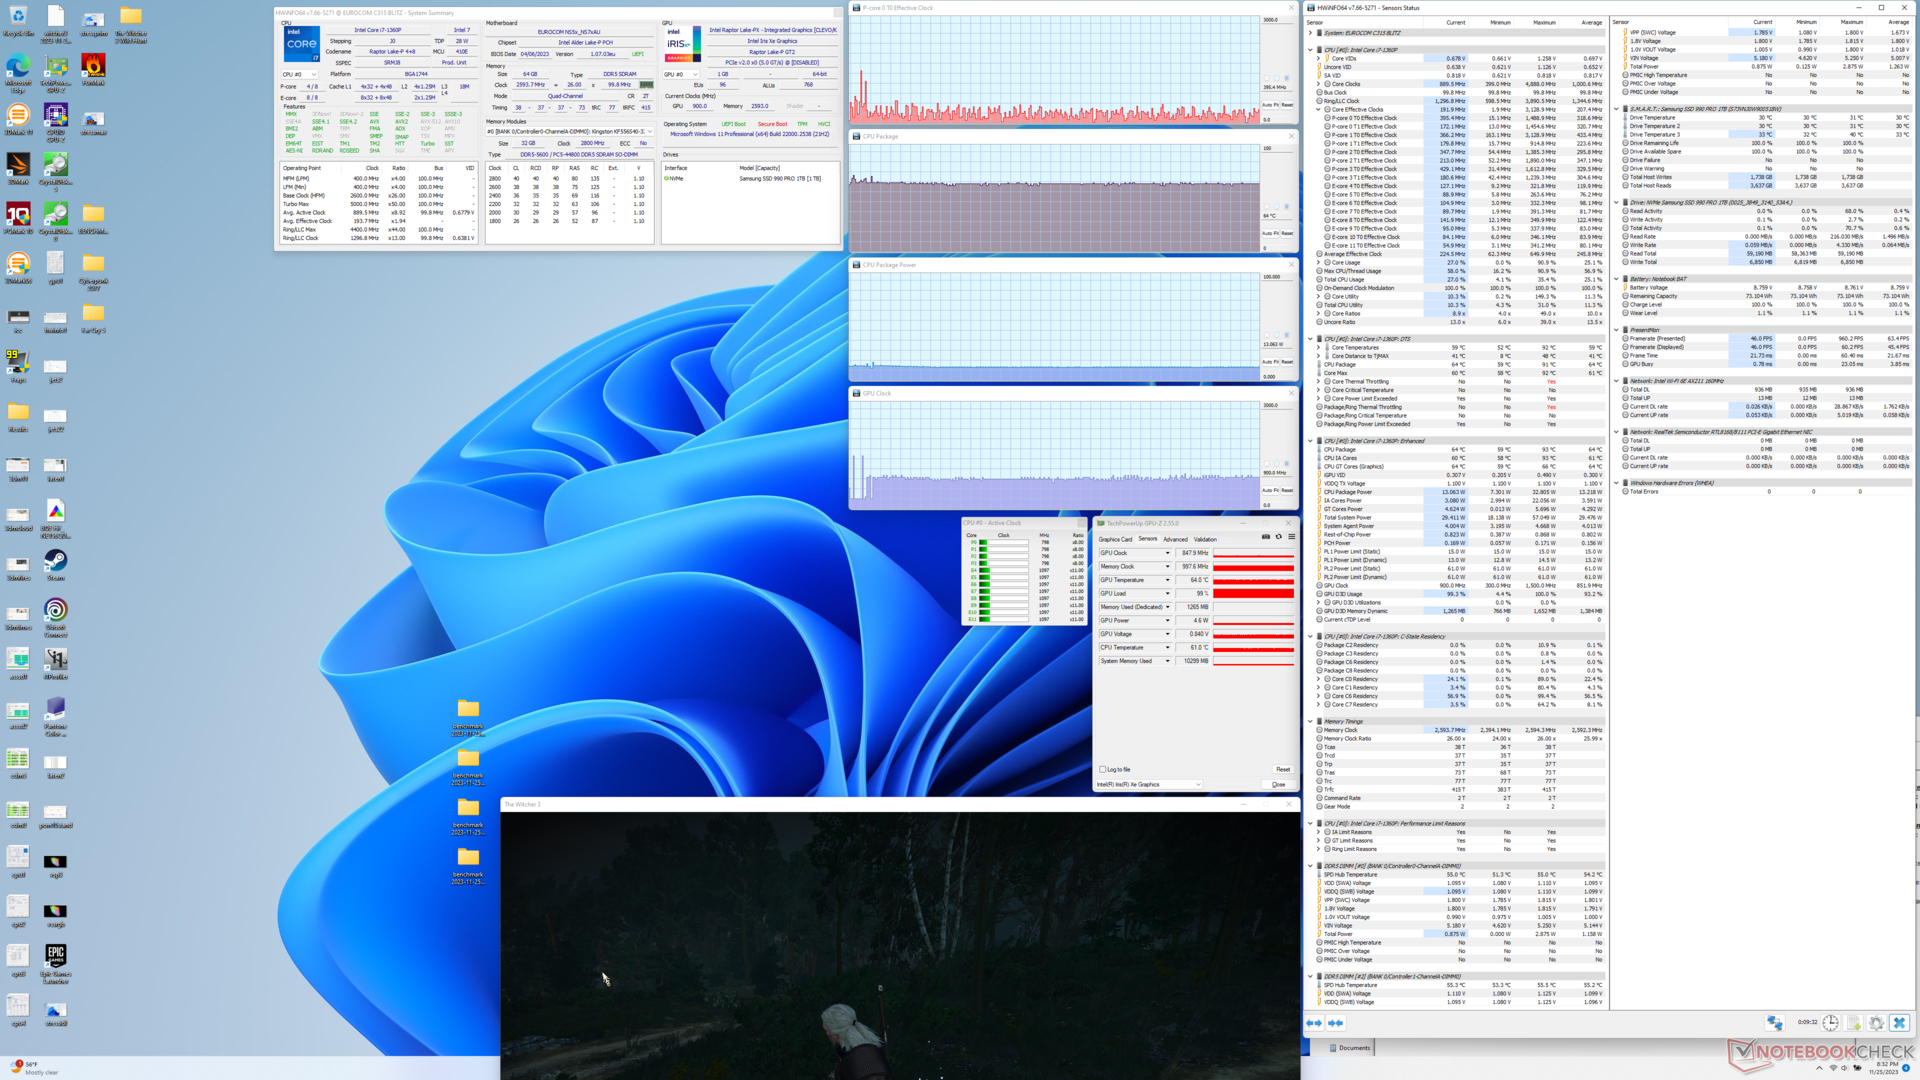
| Clock da CPU (GHz) | Clock da GPU (MHz) | Temperatura média da CPU (°C) | |
| Sistema ocioso | -- | -- | 46 |
| Estresse doPrime95 | 0,7 - 0,8 | -- | 65 |
| Prime95 + FurMark Stress | 0,7 | 350 | 63 |
| Witcher 3 Estresse | ~0,4 | 900 | 64 |
Alto-falantes
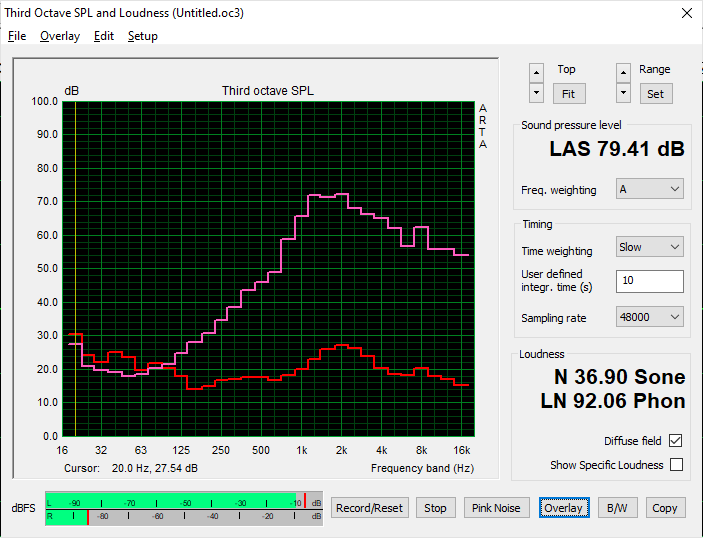
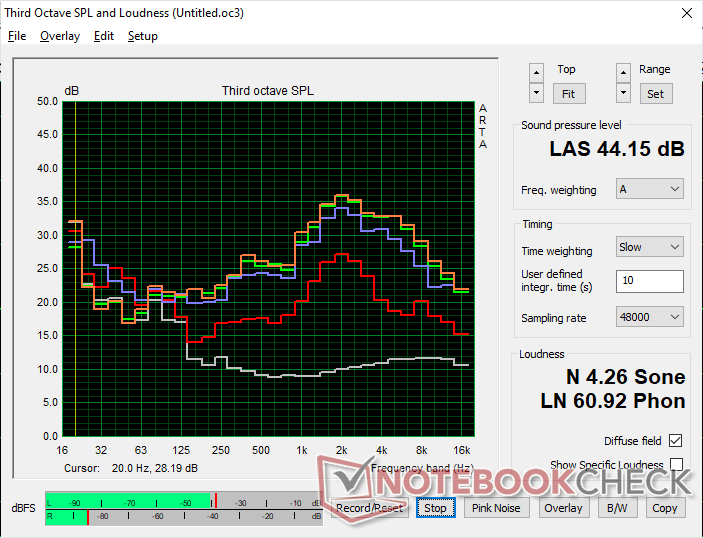
Eurocom C315 Blitz análise de áudio
(±) | o volume do alto-falante é médio, mas bom (###valor### dB)
Graves 100 - 315Hz
(-) | quase nenhum baixo - em média 26.1% menor que a mediana
(±) | a linearidade dos graves é média (8% delta para a frequência anterior)
Médios 400 - 2.000 Hz
(±) | médios mais altos - em média 11.2% maior que a mediana
(±) | a linearidade dos médios é média (11.5% delta para frequência anterior)
Altos 2 - 16 kHz
(±) | máximos mais altos - em média 6.6% maior que a mediana
(±) | a linearidade dos máximos é média (10.4% delta para frequência anterior)
Geral 100 - 16.000 Hz
(-) | o som geral não é linear (35.6% diferença em relação à mediana)
Comparado com a mesma classe
» 97% de todos os dispositivos testados nesta classe foram melhores, 1% semelhantes, 2% piores
» O melhor teve um delta de 7%, a média foi 21%, o pior foi 53%
Comparado com todos os dispositivos testados
» 94% de todos os dispositivos testados foram melhores, 1% semelhantes, 5% piores
» O melhor teve um delta de 4%, a média foi 23%, o pior foi 134%
Apple MacBook Pro 16 2021 M1 Pro análise de áudio
(+) | os alto-falantes podem tocar relativamente alto (###valor### dB)
Graves 100 - 315Hz
(+) | bons graves - apenas 3.8% longe da mediana
(+) | o baixo é linear (5.2% delta para a frequência anterior)
Médios 400 - 2.000 Hz
(+) | médios equilibrados - apenas 1.3% longe da mediana
(+) | médios são lineares (2.1% delta para frequência anterior)
Altos 2 - 16 kHz
(+) | agudos equilibrados - apenas 1.9% longe da mediana
(+) | os máximos são lineares (2.7% delta da frequência anterior)
Geral 100 - 16.000 Hz
(+) | o som geral é linear (4.6% diferença em relação à mediana)
Comparado com a mesma classe
» 0% de todos os dispositivos testados nesta classe foram melhores, 0% semelhantes, 100% piores
» O melhor teve um delta de 5%, a média foi 17%, o pior foi 45%
Comparado com todos os dispositivos testados
» 0% de todos os dispositivos testados foram melhores, 0% semelhantes, 100% piores
» O melhor teve um delta de 4%, a média foi 23%, o pior foi 134%
Gerenciamento de energia
Consumo de energia
A inatividade no desktop consumiria alguns watts a mais do que no Schenker Work 15, provavelmente devido à nossa tela 4K de maior resolução. No entanto, o consumo seria praticamente o mesmo, em média, ao executar cargas mais altas, apesar de quaisquer diferenças de desempenho ou temperatura entre o Core i7-1360P e o Core i7-11370H.
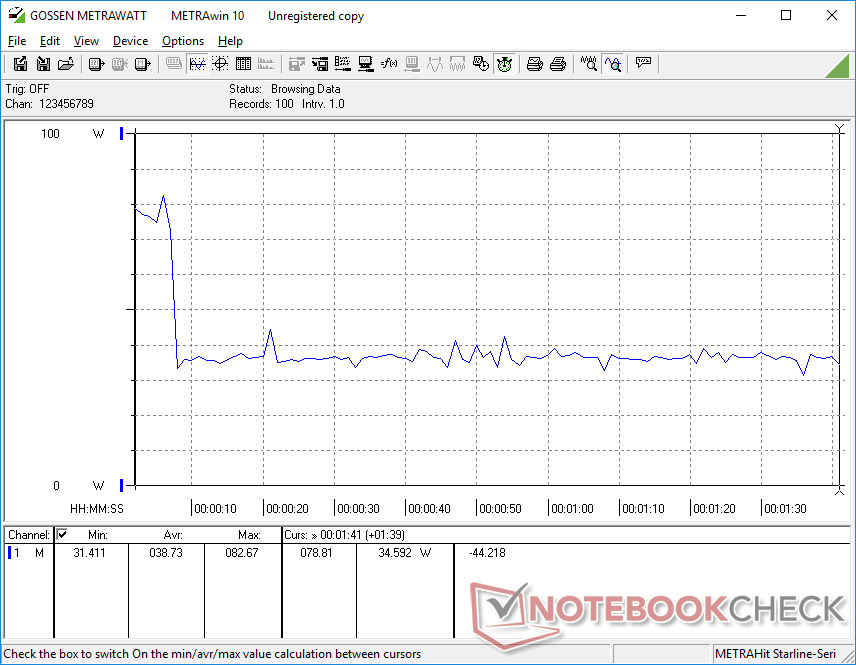
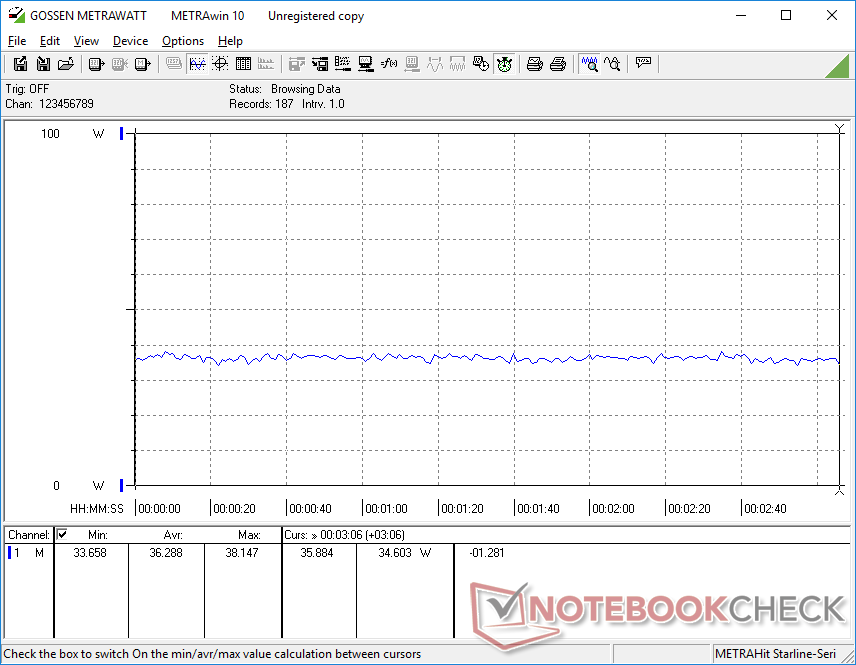
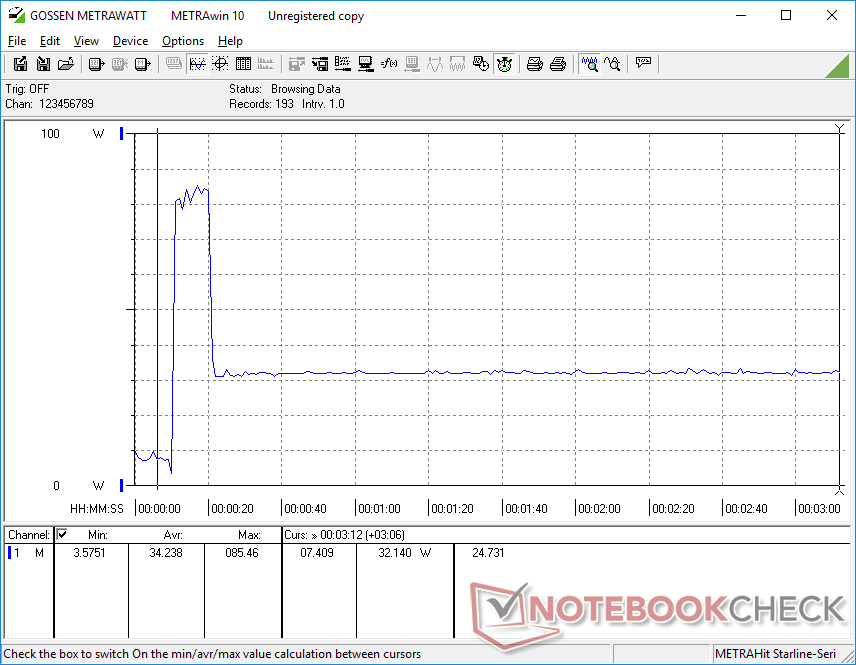
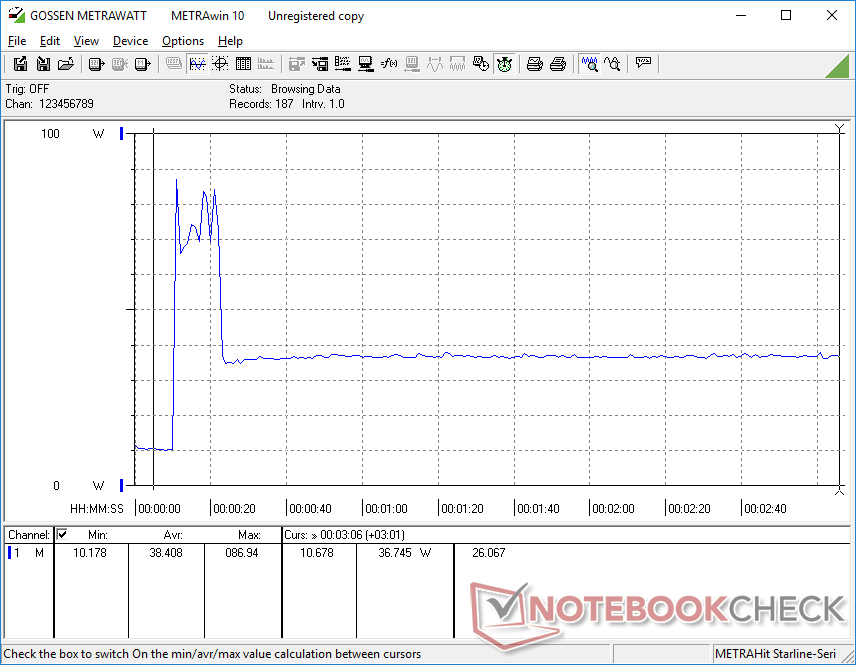
Conseguimos registrar um consumo máximo de 87 W do pequeno adaptador CA de 90 W (~12,5 x 4,8 x 3 cm) quando a CPU está com 100% de utilização. Essa demanda é apenas temporária, antes que o estrangulamento entre em ação, conforme mostram os gráficos de consumo de energia abaixo.
| desligado | |
| Ocioso | |
| Carga |
|
Key:
min: | |
| Eurocom C315 Blitz i7-1360P, Iris Xe G7 96EUs, Samsung 990 Pro 1 TB, IPS, 3840x2160, 15.6" | Schenker Work 15 Tiger Lake-H i7-11370H, Iris Xe G7 96EUs, Samsung SSD 980 Pro 1TB MZ-V8P1T0BW, IPS, 1920x1080, 15.6" | Lenovo ThinkPad L15 Gen 4 21H70021GE R7 PRO 7730U, Vega 8, SK hynix HFS512GEJ4X113N, IPS, 1920x1080, 15.6" | Acer Aspire 5 A515-58GM-76S8 i7-1355U, GeForce RTX 2050 Mobile, Micron 2450 1TB MTFDKBA1T0TFK, IPS, 1920x1080, 15.6" | Asus VivoBook S15 M3502RA-L1029W R7 6800H, Radeon 680M, WD PC SN735 SDBPNHH-512G, OLED, 1920x1080, 15.6" | Samsung Galaxy Book2 15 i7-1260P, A350M, Samsung PM991 MZVLQ512HBLU, IPS, 1920x1080, 15.6" | |
|---|---|---|---|---|---|---|
| Power Consumption | 18% | 22% | -6% | -5% | 6% | |
| Idle Minimum * (Watt) | 9.4 | 4.5 52% | 4.5 52% | 4.31 54% | 4.4 53% | 4 57% |
| Idle Average * (Watt) | 11.5 | 8.5 26% | 8.5 26% | 6.52 43% | 5.1 56% | 7.8 32% |
| Idle Maximum * (Watt) | 12.1 | 9.1 25% | 10.5 13% | 8.037 34% | 9.3 23% | 8.5 30% |
| Load Average * (Watt) | 38.7 | 43.5 -12% | 35.6 8% | 75.2 -94% | 67 -73% | 59.1 -53% |
| Witcher 3 ultra * (Watt) | 36.3 | 37.5 -3% | 37.4 -3% | 60.8 -67% | 66.4 -83% | 56.7 -56% |
| Load Maximum * (Watt) | 87 | 69.4 20% | 57.9 33% | 89.5 -3% | 93.5 -7% | 62.4 28% |
* ... menor é melhor
Power Consumption Witcher 3 / Stresstest
Power Consumption external Monitor
Duração da bateria
O tempo de funcionamento da WLAN é visivelmente menor do que no antigo Schenker Work 15, em mais de 2 horas. A discrepância pode ser atribuída à nossa tela 4K de maior resolução. Nossa CPU Core-P também aumentaria para taxas de clock e níveis de consumo mais altos do que o antigo Core i7 de 11ª geração, afetando ainda mais a vida útil da bateria.
O carregamento da bateria vazia até a capacidade total leva pouco mais de 90 minutos.
| Eurocom C315 Blitz i7-1360P, Iris Xe G7 96EUs, 73 Wh | Schenker Work 15 Tiger Lake-H i7-11370H, Iris Xe G7 96EUs, 73 Wh | Lenovo ThinkPad L15 Gen 4 21H70021GE R7 PRO 7730U, Vega 8, 57 Wh | Acer Aspire 5 A515-58GM-76S8 i7-1355U, GeForce RTX 2050 Mobile, 48 Wh | Asus VivoBook S15 M3502RA-L1029W R7 6800H, Radeon 680M, 70 Wh | Samsung Galaxy Book2 15 i7-1260P, A350M, 54 Wh | |
|---|---|---|---|---|---|---|
| Duração da bateria | 27% | 49% | 9% | 44% | 2% | |
| WiFi v1.3 (h) | 8 | 10.2 27% | 11.9 49% | 8.7 9% | 11.5 44% | 8.2 2% |
| Reader / Idle (h) | 24.5 | 25.1 | ||||
| H.264 (h) | 9.6 | 9.5 | 6.6 | 12.8 | 10.6 | |
| Load (h) | 2.2 | 2.2 | 2 | 1 | 1.5 |
Pro
Contra
Veredicto - O desempenho da CPU poderia ser melhorado
O Core i7-1360P ajuda a distinguir o Eurocom C315 Blitz da maioria dos outros laptops, pois essa opção de CPU é um tanto incomum. Infelizmente, o processador é muito acelerado no Eurocom, a ponto de o desempenho geral ser idêntico ao do Core i7-11370H ou até mais lento que o do Core i5-1340P, mais barato. OLG Gram 2 em 1 16que vem com a mesma opção de Core i7-1360P, é capaz de executar a CPU até 80% mais rápido do que o nosso Eurocom.
O Eurocom C315 Blitz é prejudicado pela CPU Core i7-1360P, que tem tendência a ser mais lenta, e pela falta de opções de tela.
Outros aspectos importantes do modelo carecem de recursos. O painel 4K, por exemplo, não oferece cores DCI-P3, altas taxas de atualização ou suporte a HDR, que alguns profissionais ou usuários de multimídia podem valorizar. A vida útil da bateria e a qualidade da webcam também são apenas medianas ou abaixo do esperado.
A base do Clevo X170KM certamente poderia ser melhorada com ajustes adicionais de desempenho, de ruído da ventoinha e de recursos de tela, especialmente quando se considera o preço inicial de US$ 1.300. A faixa de US$ 1.000 a US$ 1.500 já é extremamente competitiva nesse espaço, com opções profissionais como o Lenovo ThinkPad L15, o HP ProBook ou a série Dell Latitude.
Preço e disponibilidade
A Eurocom já está enviando o C315 Blitz a partir de US$ 1300 para a configuração básica até mais de US$ 2500 se configurado com 64 GB de RAM e um SSD de 1 TB como o nosso.
Eurocom C315 Blitz
- 11/29/2023 v7 (old)
Allen Ngo
Transparência
A seleção dos dispositivos a serem analisados é feita pela nossa equipe editorial. A amostra de teste foi fornecida ao autor como empréstimo pelo fabricante ou varejista para fins desta revisão. O credor não teve influência nesta revisão, nem o fabricante recebeu uma cópia desta revisão antes da publicação. Não houve obrigação de publicar esta revisão. Como empresa de mídia independente, a Notebookcheck não está sujeita à autoridade de fabricantes, varejistas ou editores.
É assim que o Notebookcheck está testando
Todos os anos, o Notebookcheck analisa de forma independente centenas de laptops e smartphones usando procedimentos padronizados para garantir que todos os resultados sejam comparáveis. Desenvolvemos continuamente nossos métodos de teste há cerca de 20 anos e definimos padrões da indústria no processo. Em nossos laboratórios de teste, equipamentos de medição de alta qualidade são utilizados por técnicos e editores experientes. Esses testes envolvem um processo de validação em vários estágios. Nosso complexo sistema de classificação é baseado em centenas de medições e benchmarks bem fundamentados, o que mantém a objetividade.Price comparison

