Revisão do laptop MSI Pulse GL76: 105 W TGP GeForce RTX 3070 gráficos
O Pulse GL76 é um laptop para jogos MSI de médio alcance entre as séries mais baratas Katana ou Sword e as séries mais caras GE Raider ou GT Titan. É essencialmente a versão de 17,3 polegadas da menor série de 15,6 polegadas Pulso GL66. Os modelos GL76 de 2021 e 2022 modelos GL76 esportivos têm projetos de chassis idênticos.
Nossa unidade em revisão é uma configuração superior com a CPU i7-12700H Core 12th gen, 105 W GeForce RTX 3070 GPU, e 360 Hz 1080p IPS display por aproximadamente $1300 USD no varejo. Outras SKUs estão disponíveis com taxas de atualização de tela mais lentas, GeForce RTX 3050/3050 Ti/3060 GPUs, ou a CPU Core i5-12500H em seu lugar.
Os concorrentes do Pulse GL76 incluem outros laptops para jogos de médio alcance de 17,3 polegadas, como o Acer Nitro 5, Série Asus TUF, Série HP Victusou o Série G da Dell.
Mais revisões da MSI:
Possíveis concorrentes em comparação
Avaliação | Data | Modelo | Peso | Altura | Size | Resolução | Preço |
|---|---|---|---|---|---|---|---|
| 83.2 % v7 (old) | 01/2023 | MSI Pulse GL76 12UGK i7-12700H, GeForce RTX 3070 Laptop GPU | 2.6 kg | 24.2 mm | 17.30" | 1920x1080 | |
| 86.1 % v7 (old) | 01/2023 | Alienware m17 R5 (R9 6900HX, RX 6850M XT) R9 6900HX, Radeon RX 6850M XT | 3.4 kg | 26.7 mm | 17.00" | 3840x2160 | |
| 86.9 % v7 (old) | 11/2022 | Asus ROG Strix Scar 17 SE G733CX-LL014W i9-12950HX, GeForce RTX 3080 Ti Laptop GPU | 2.9 kg | 28.3 mm | 17.30" | 2560x1440 | |
| 86.5 % v7 (old) | 11/2022 | Acer Predator Helios 300 (i7-12700H, RTX 3070 Ti) i7-12700H, GeForce RTX 3070 Ti Laptop GPU | 3 kg | 27.65 mm | 17.30" | 2560x1440 | |
| 89.9 % v7 (old) | 07/2022 | Razer Blade 17 Early 2022 i9-12900H, GeForce RTX 3080 Ti Laptop GPU | 2.8 kg | 19.9 mm | 17.30" | 3840x2160 | |
| 86.7 % v7 (old) | 05/2022 | MSI Vector GP76 12UGS-434 i7-12700H, GeForce RTX 3070 Ti Laptop GPU | 2.9 kg | 25.9 mm | 17.30" | 1920x1080 |
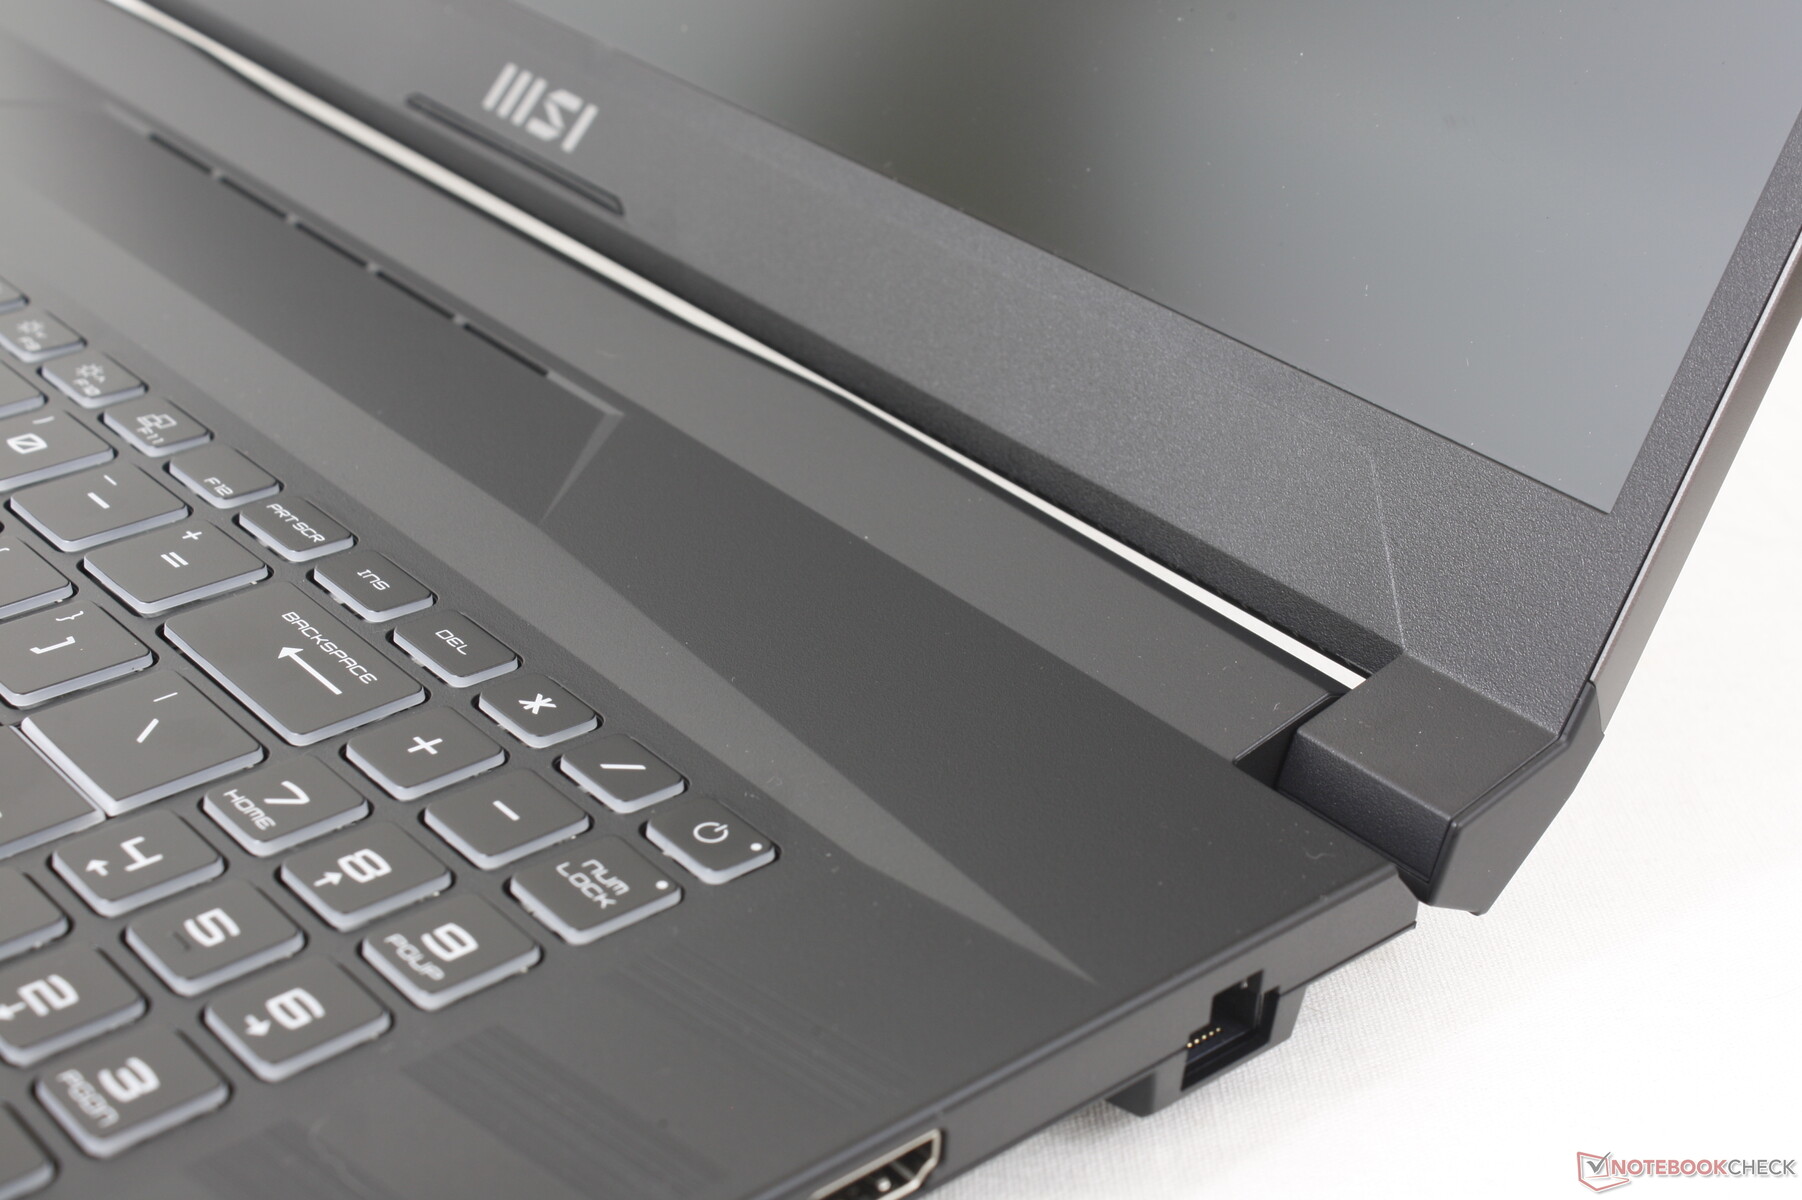
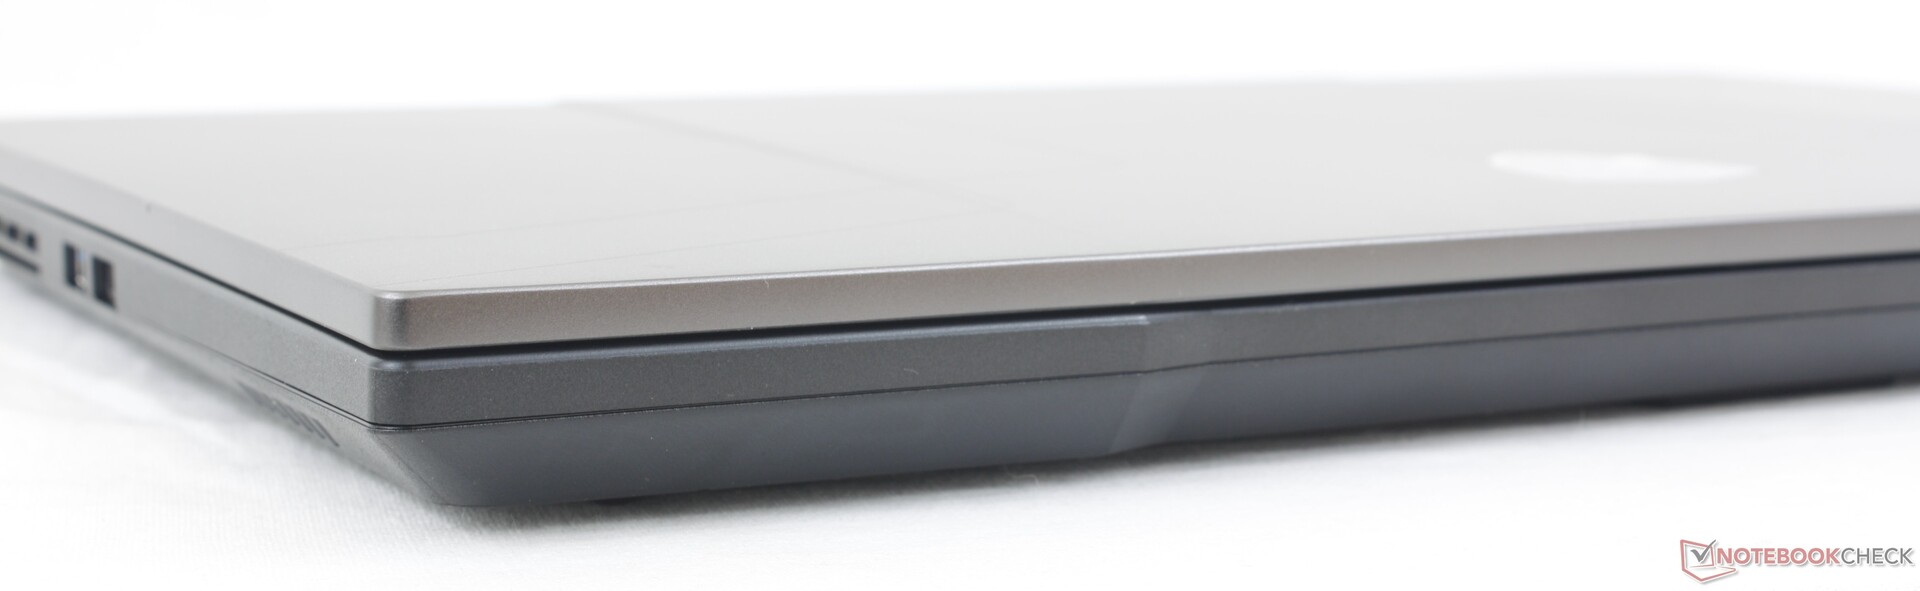
Estojo - Sem cores de fantasia ou LED
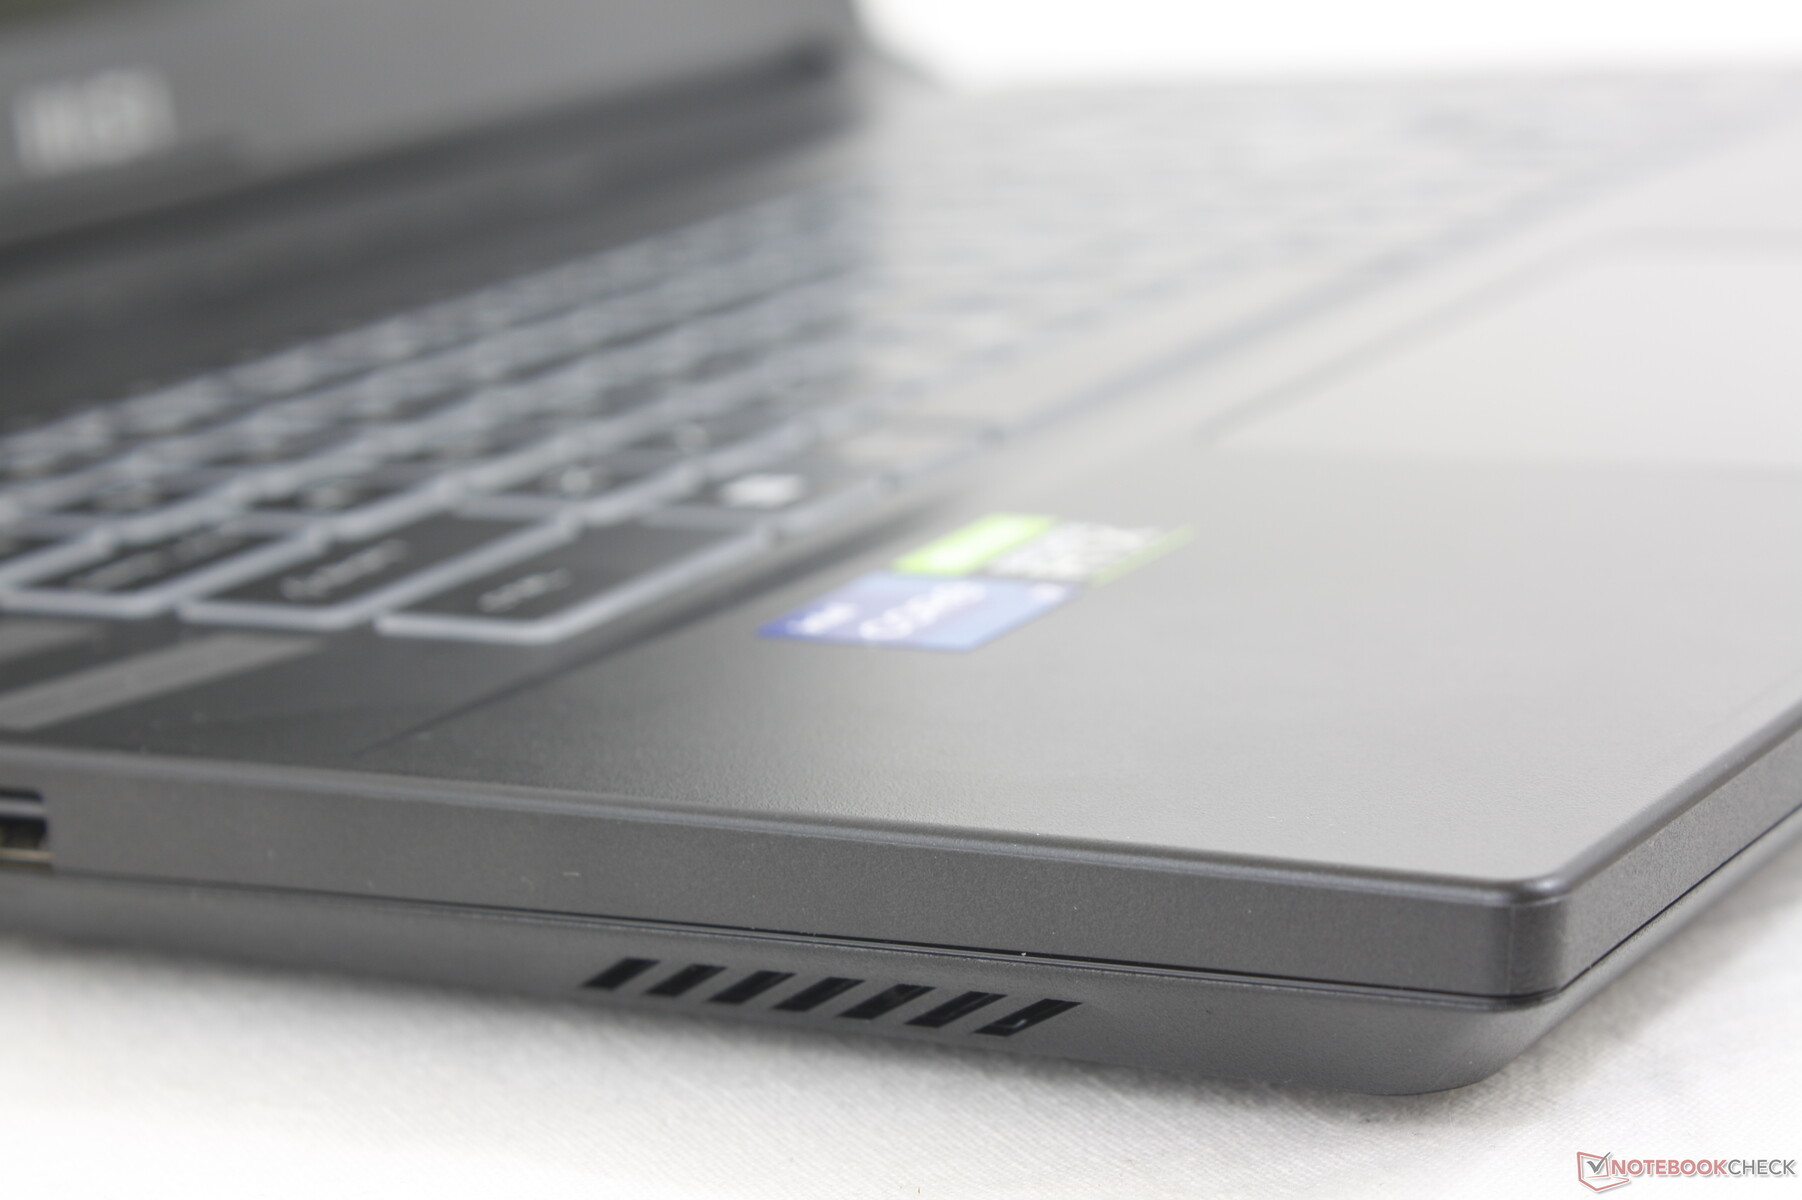
O chassi é, em sua maioria, de plástico, como em todos os laptops para jogos de médio alcance da MSI. Faltam-lhe os toques luxuosos, os LEDs brilhantes e a sensação mais suave dos modelos mais sofisticados como o MSI GE77 ou Lâmina Razer 17 para uma impressão mais branda. Isto não deve ser surpreendente, pois a aparência é uma das primeiras coisas a obter o machado ao cortar custos no orçamento para modelos de jogos de médio alcance.
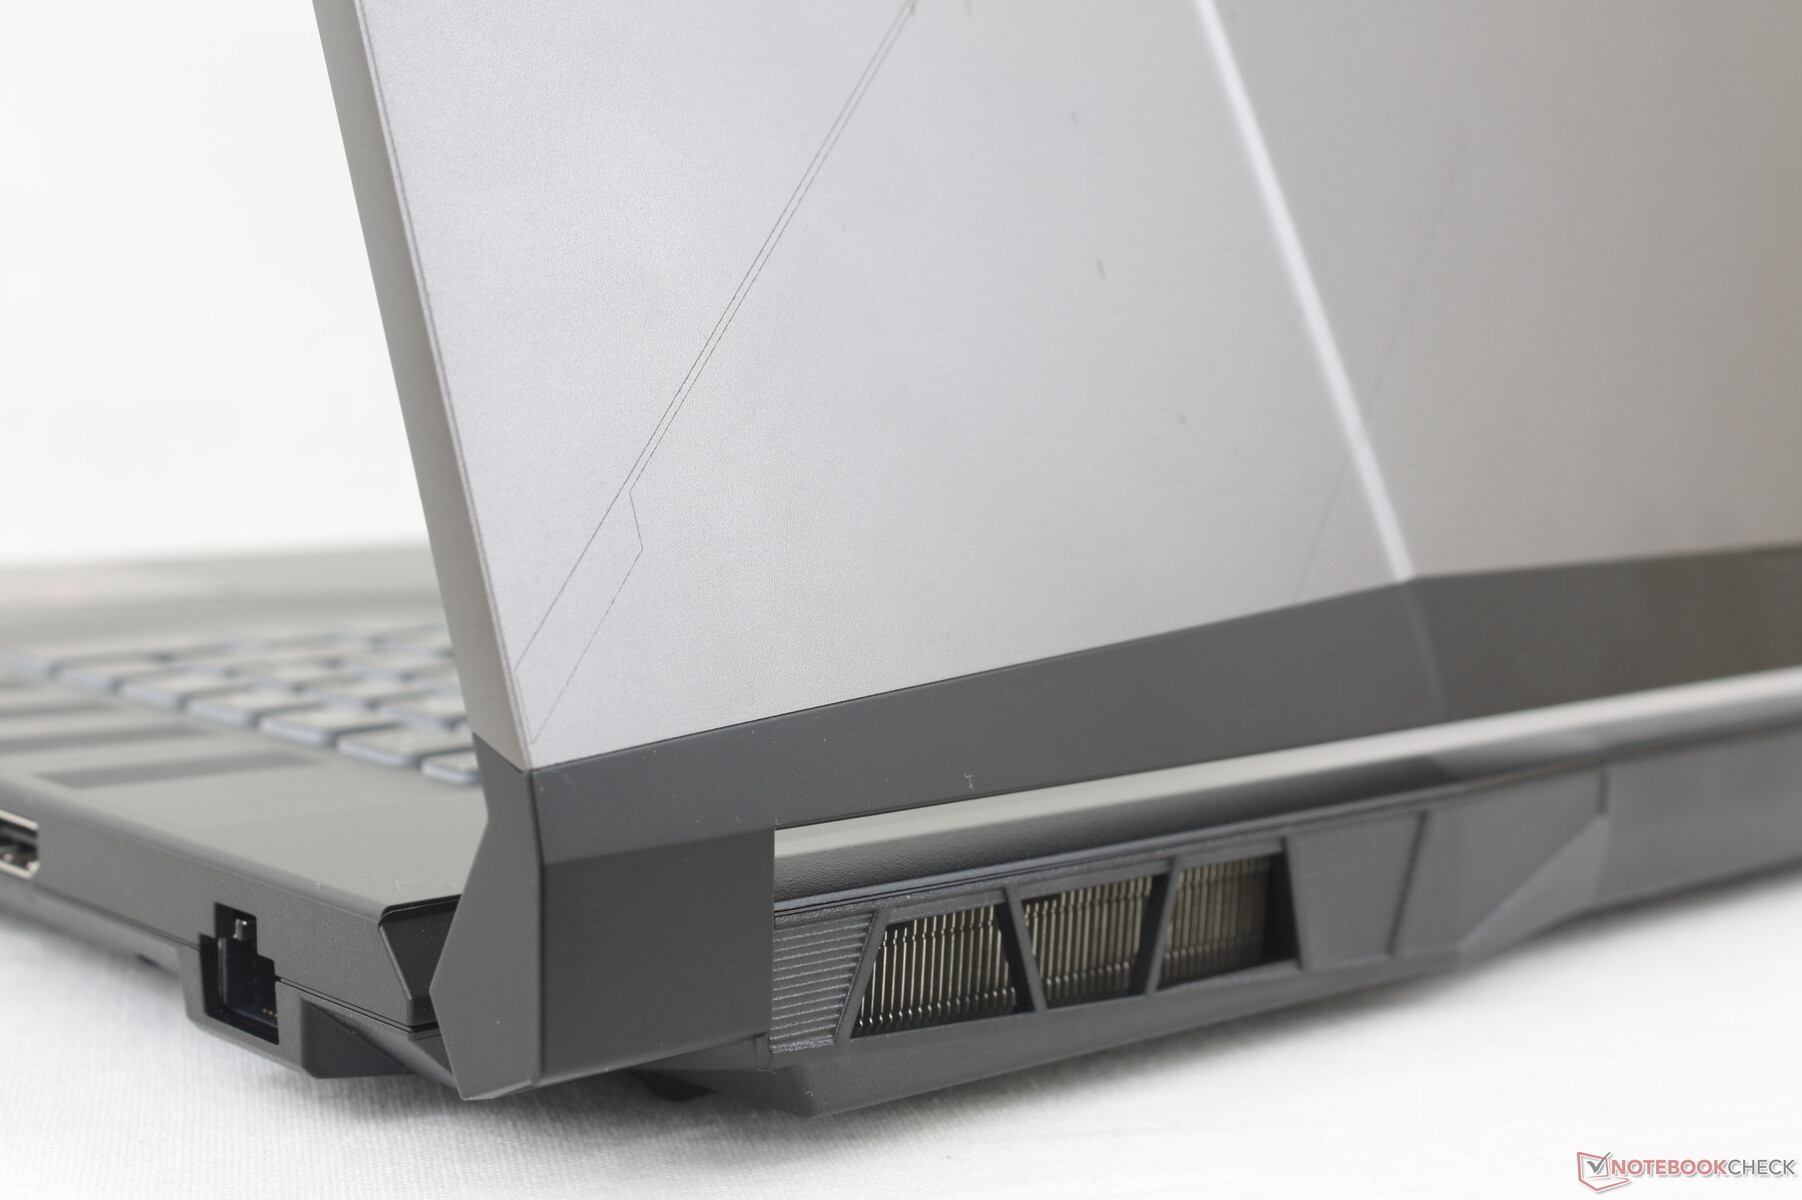
Felizmente, a rigidez do chassi não está comprometida. Embora as superfícies plásticas pareçam mais baratas ao toque do que em um modelo GE, GS ou GT, elas são no entanto bastante robustas e resistentes a torções ou depressões, mesmo no centro do teclado ou na tampa externa. Também não há grandes problemas de rangidos. Entretanto, as dobradiças poderiam ter sido mais rígidas em ângulos mais amplos para uma melhor sensação de longevidade.
O sistema é mais leve do que o esperado, especialmente para um laptop de 17,3 polegadas para jogos. Com 2,6 kg, é mais leve que o Razer Blade 17, Asus ROG Strix Scar 17, eAcer Predator Helios 300 por algumas centenas de gramas cada. A vantagem do peso é provavelmente devido ao comprimento visivelmente menor do desenho do chassi GL76. Entretanto, é um pouco largo, mas a economia de peso compensa a pegada um pouco mais longa.
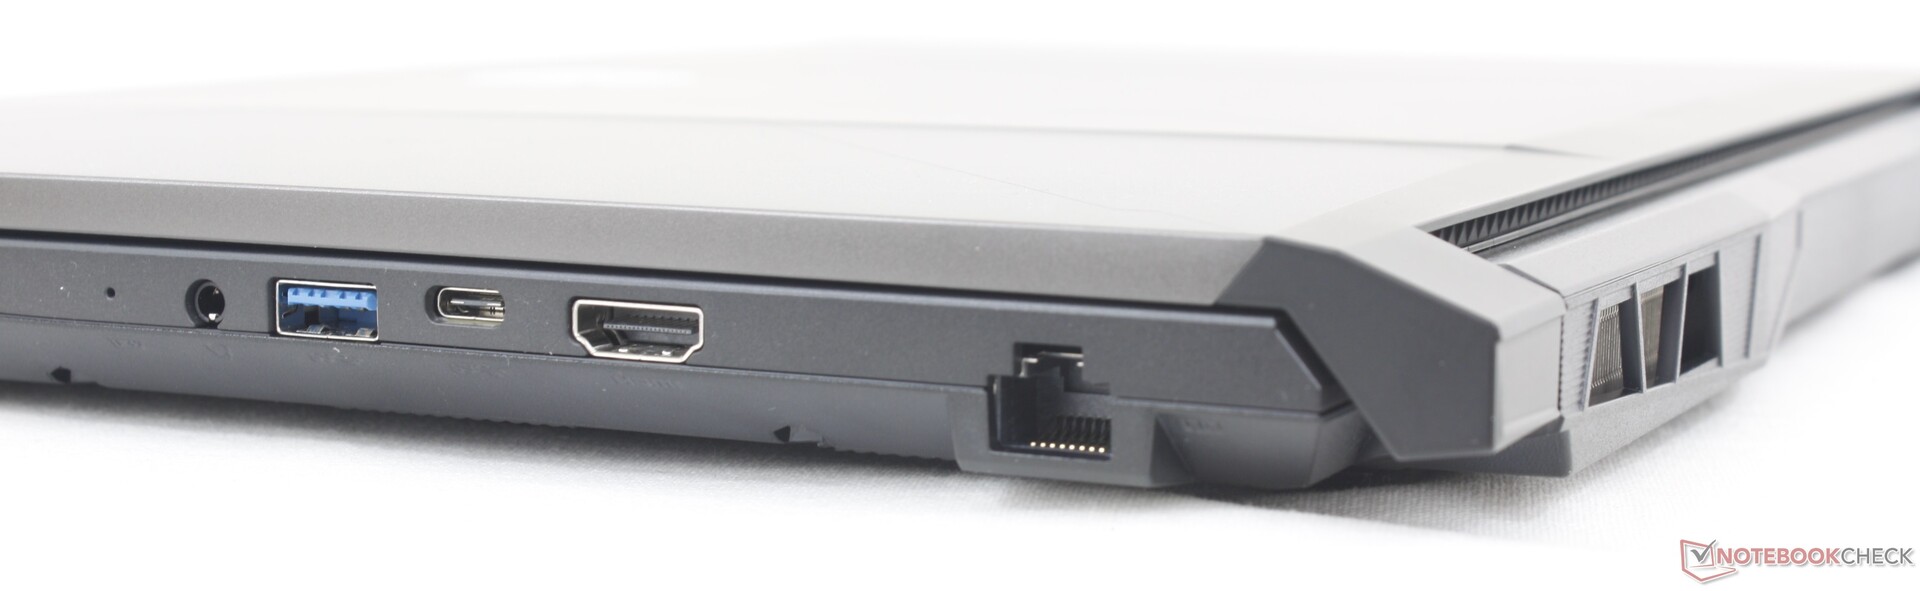
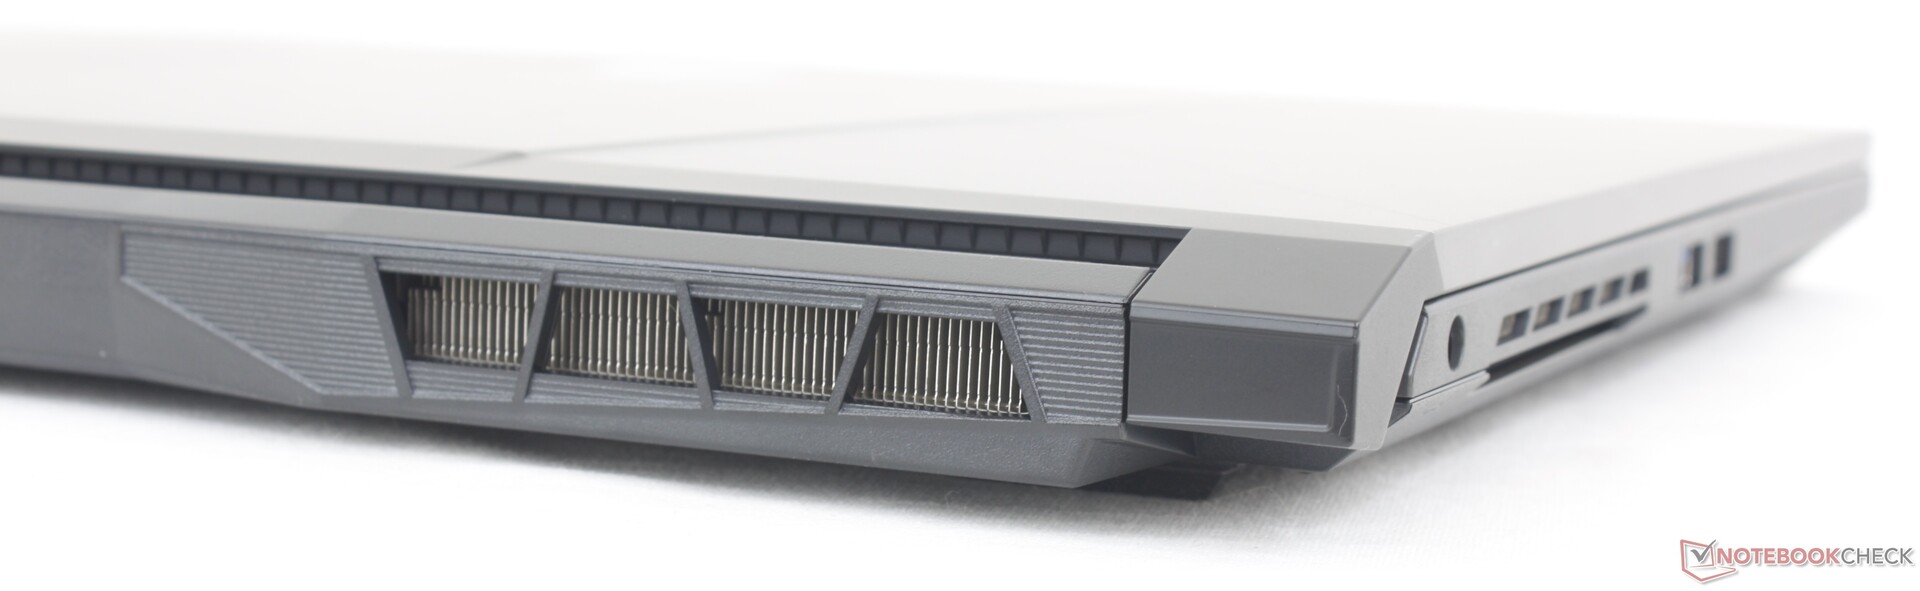
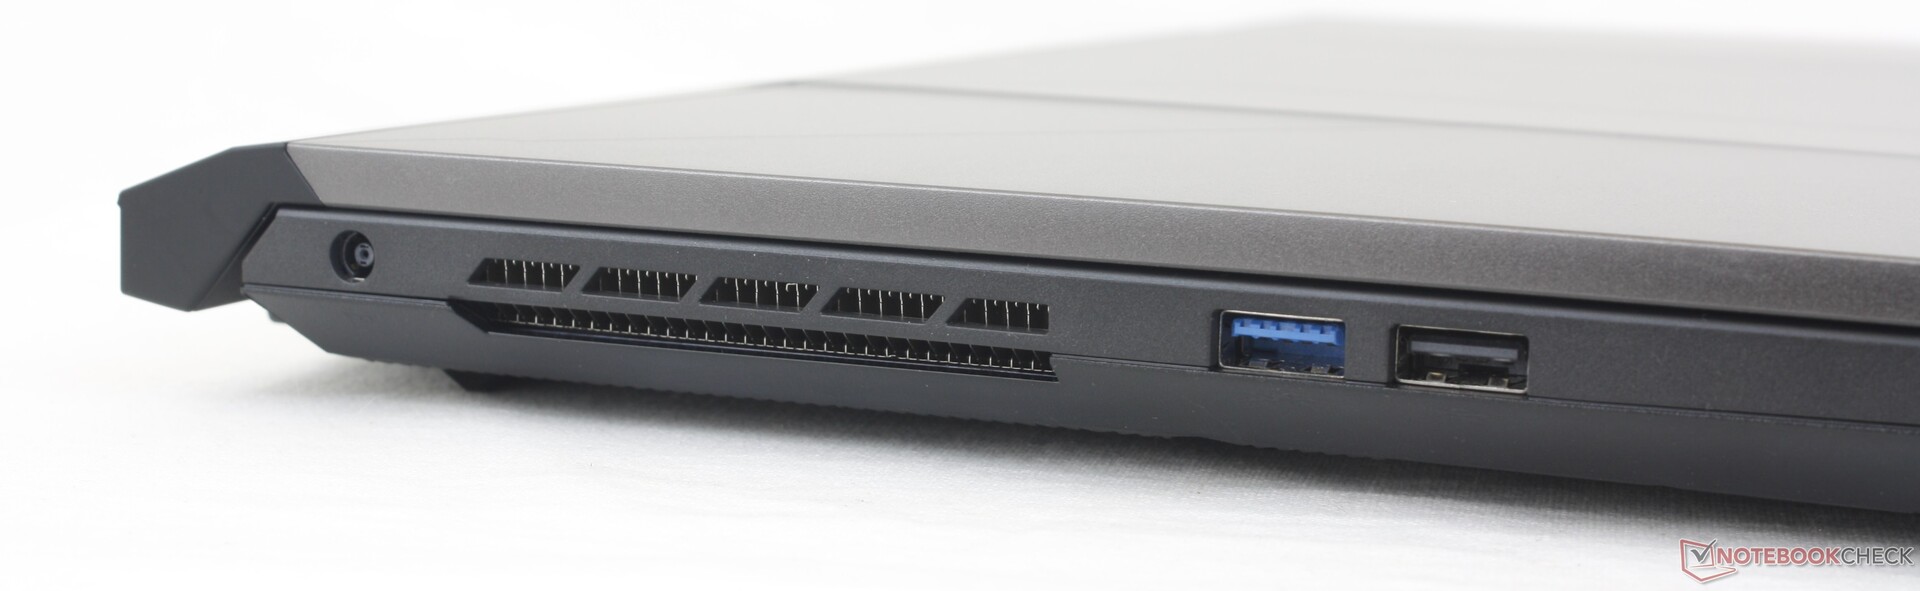
Conectividade - Limitada para o tamanho
As opções de porta são mais limitadas quando comparadas com outros laptops de jogos de médio alcance como o Dell G16acer Nitro 5, ou Asus TUF G17. A omissão mais importante aqui é a falta do suporte de Thunderbolt, enquanto que as três alternativas acima mencionadas a carregam. Isto é provavelmente um esforço consciente da MSI para encorajar os usuários a considerarem as séries GE, GS ou GT mais avançadas.
O DisplayPort-over-USB não é suportado. Nossa unidade de teste não reconheceria nenhum de nossos monitores externos via USB-C.
Comunicação
Um Intel AX201 vem como padrão para conectividade Wi-Fi 6 e Bluetooth 5.2. O Wi-Fi 6E não está incluído, o que provavelmente economizará custos, mas uma atualização do usuário final é simples. O desempenho ainda é estável, sem problemas notáveis quando acoplado ao nosso roteador Asus AXE11000.
| Networking | |
| iperf3 transmit AX12 | |
| MSI Vector GP76 12UGS-434 | |
| iperf3 receive AX12 | |
| MSI Vector GP76 12UGS-434 | |
| iperf3 receive AXE11000 6GHz | |
| Asus ROG Strix Scar 17 SE G733CX-LL014W | |
| Acer Predator Helios 300 (i7-12700H, RTX 3070 Ti) | |
| iperf3 receive AXE11000 | |
| Razer Blade 17 Early 2022 | |
| MSI Pulse GL76 12UGK | |
| Alienware m17 R5 (R9 6900HX, RX 6850M XT) | |
| iperf3 transmit AXE11000 | |
| MSI Pulse GL76 12UGK | |
| Alienware m17 R5 (R9 6900HX, RX 6850M XT) | |
| iperf3 transmit AXE11000 6GHz | |
| Asus ROG Strix Scar 17 SE G733CX-LL014W | |
| Acer Predator Helios 300 (i7-12700H, RTX 3070 Ti) | |
Webcam
A webcam integrada de 720p produz imagens lamacentas com cores pobres. Uma alternativa não-gama como a Espectro HP é recomendado se a qualidade da câmera for importante.
Um interruptor de desligamento da câmera digital é amarrado à tecla F7 enquanto o Windows Olá não é suportado.


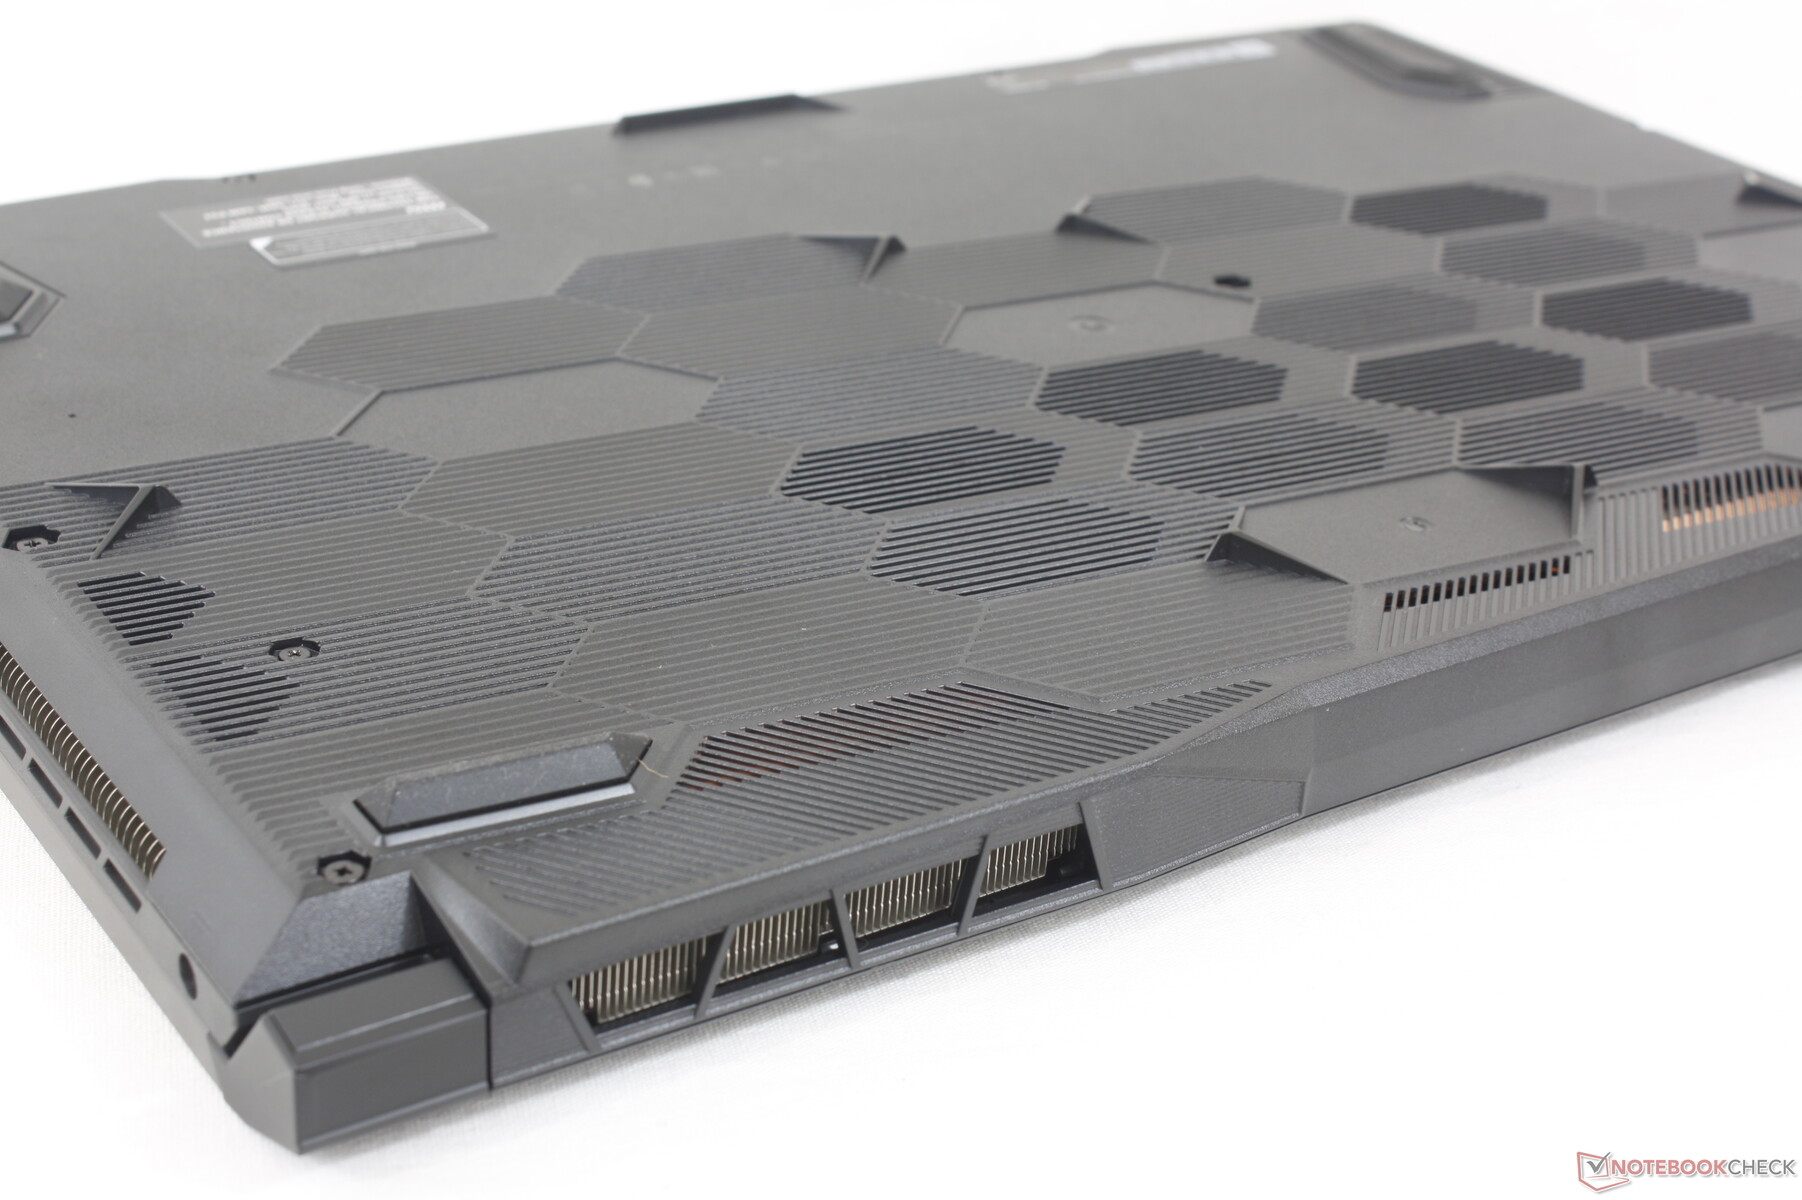
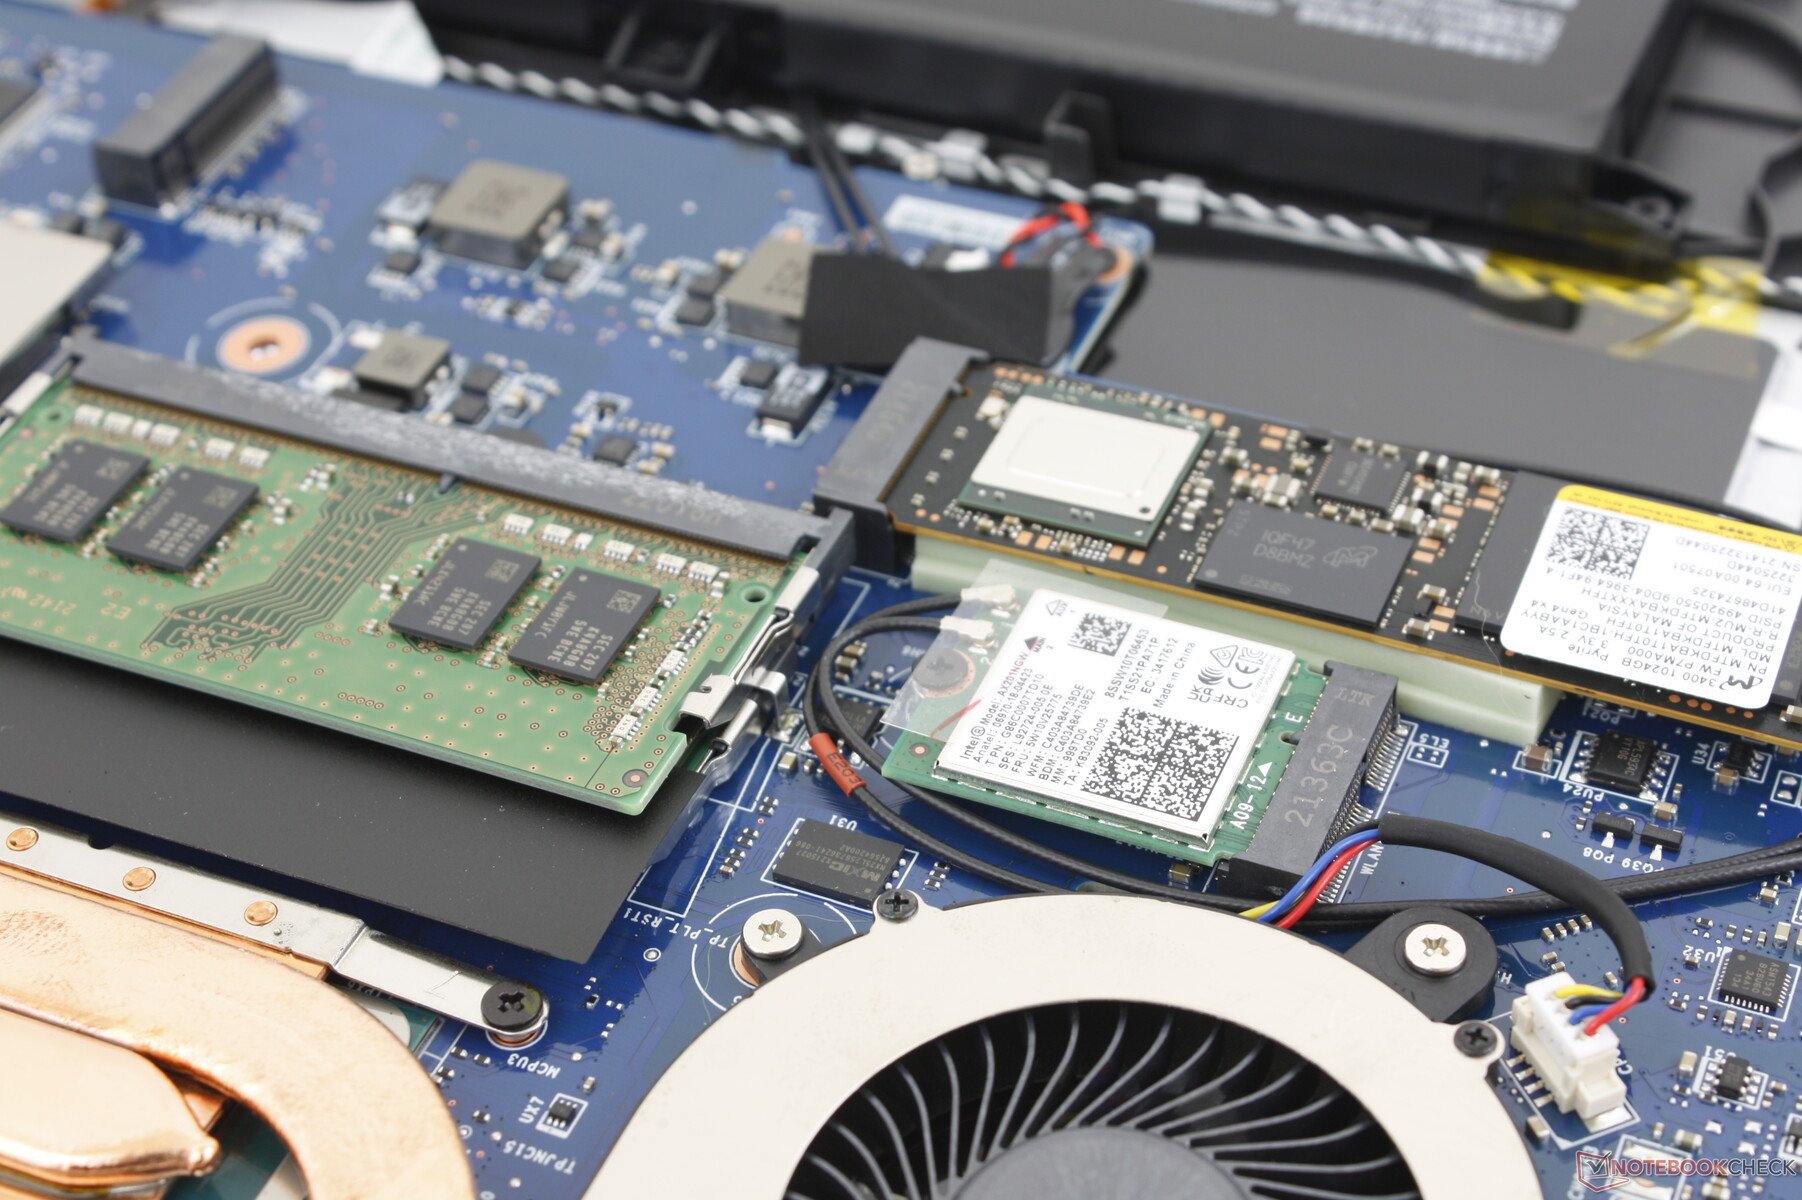
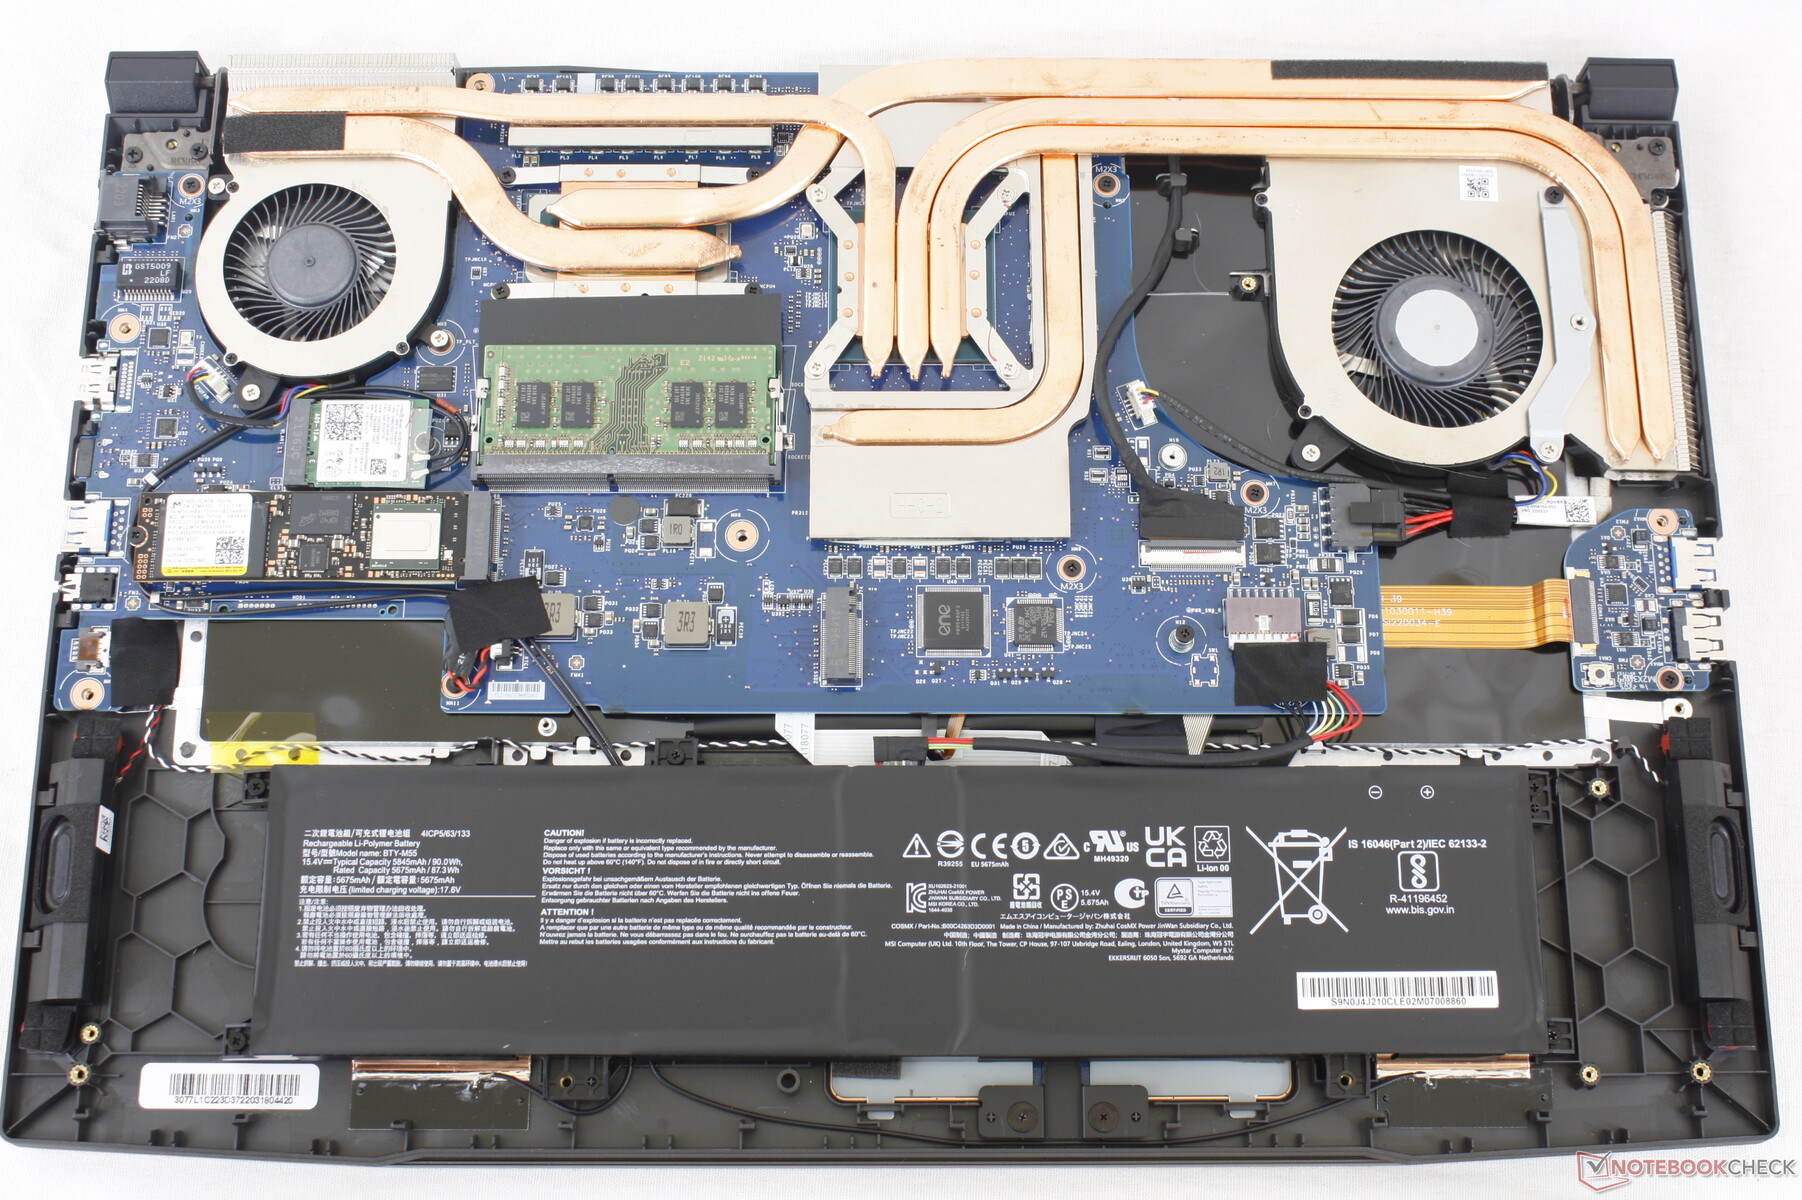
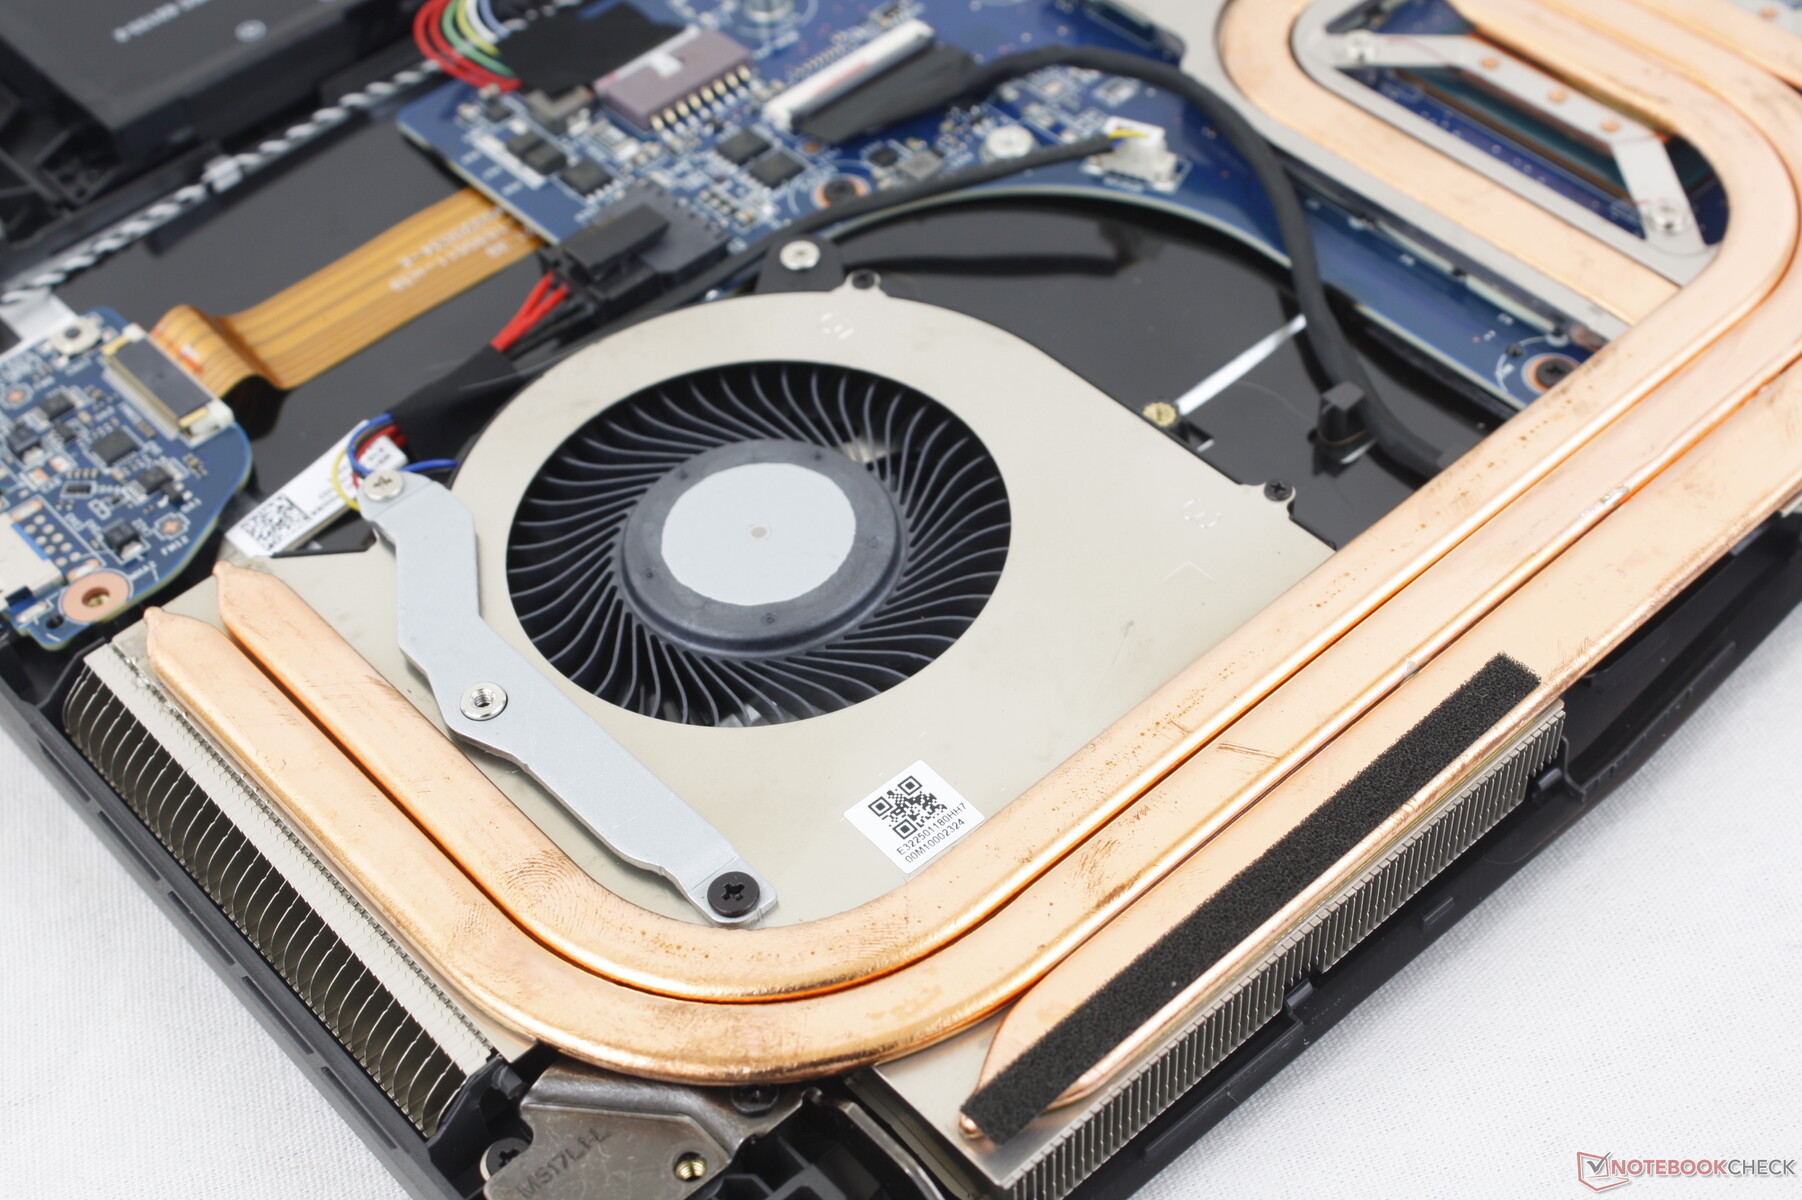
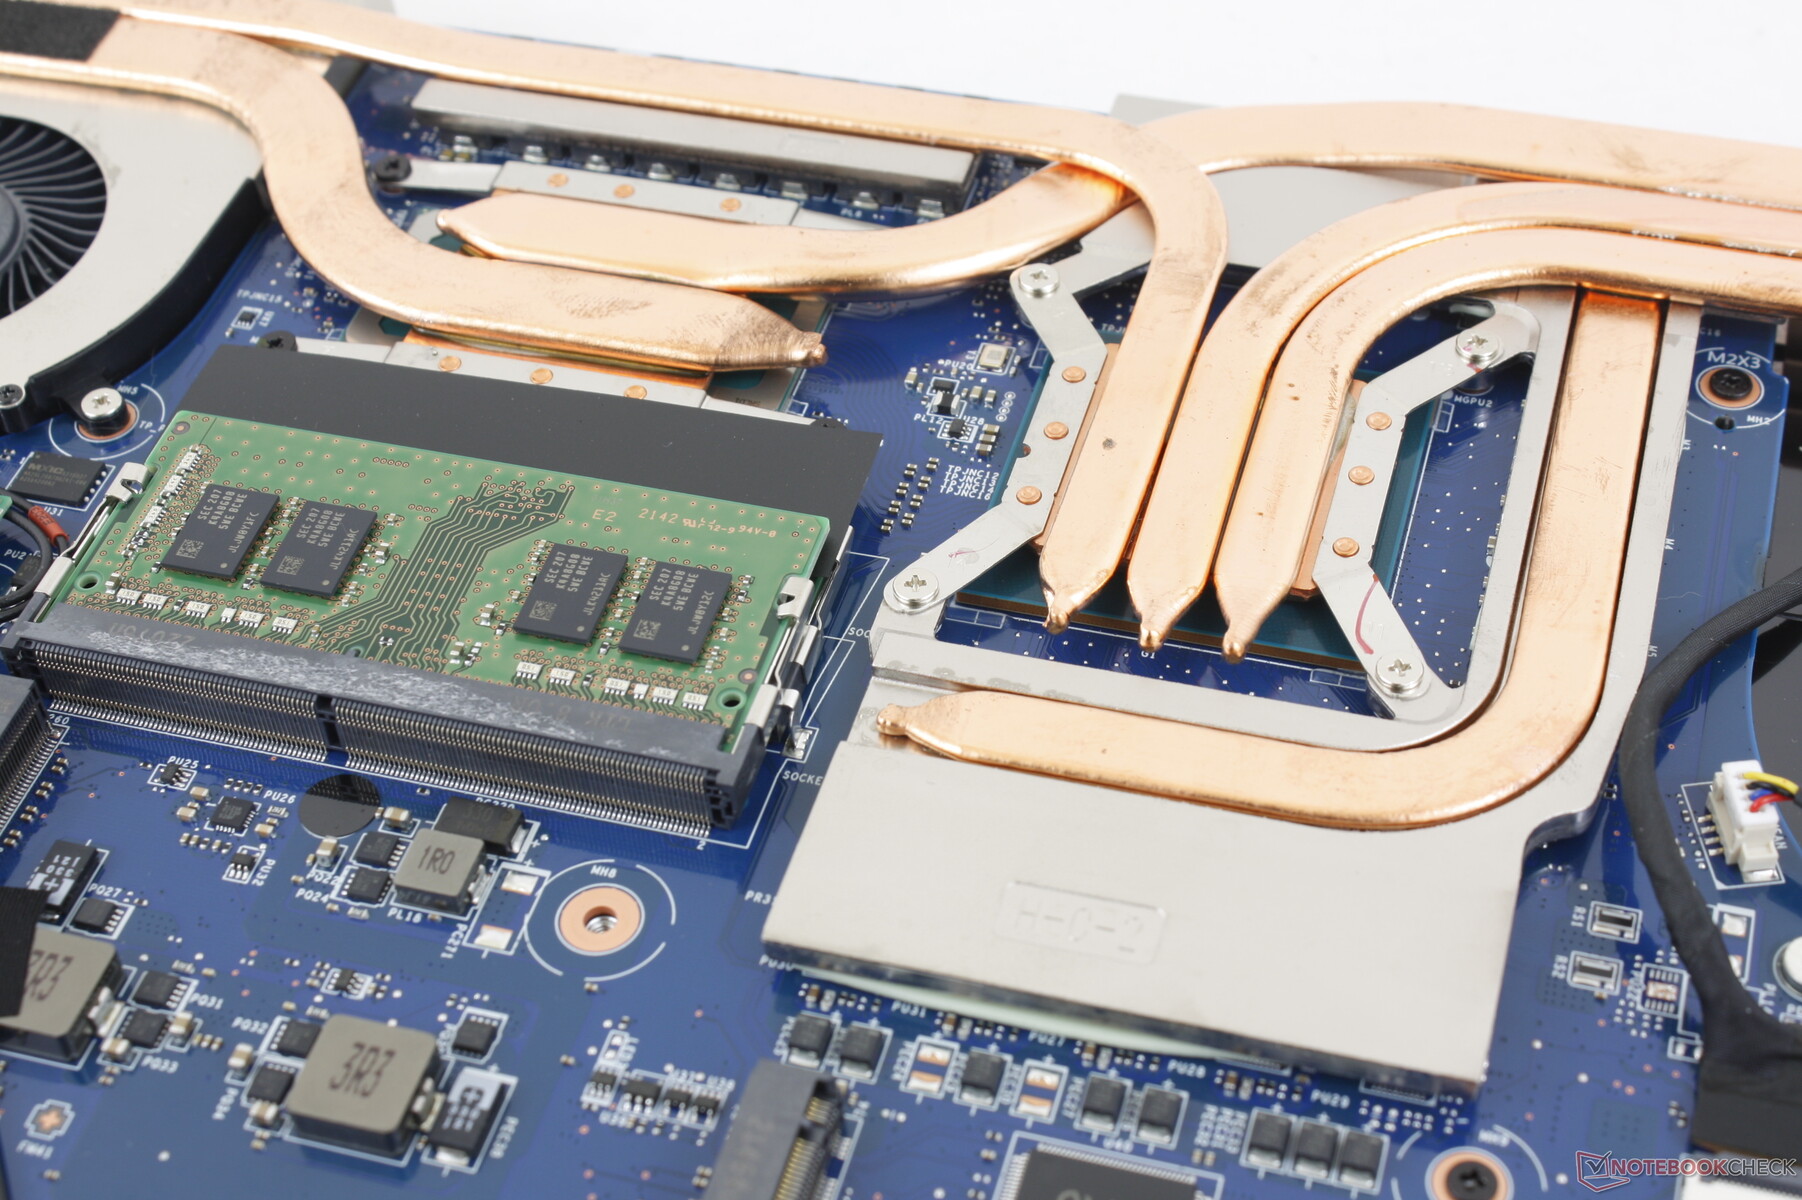
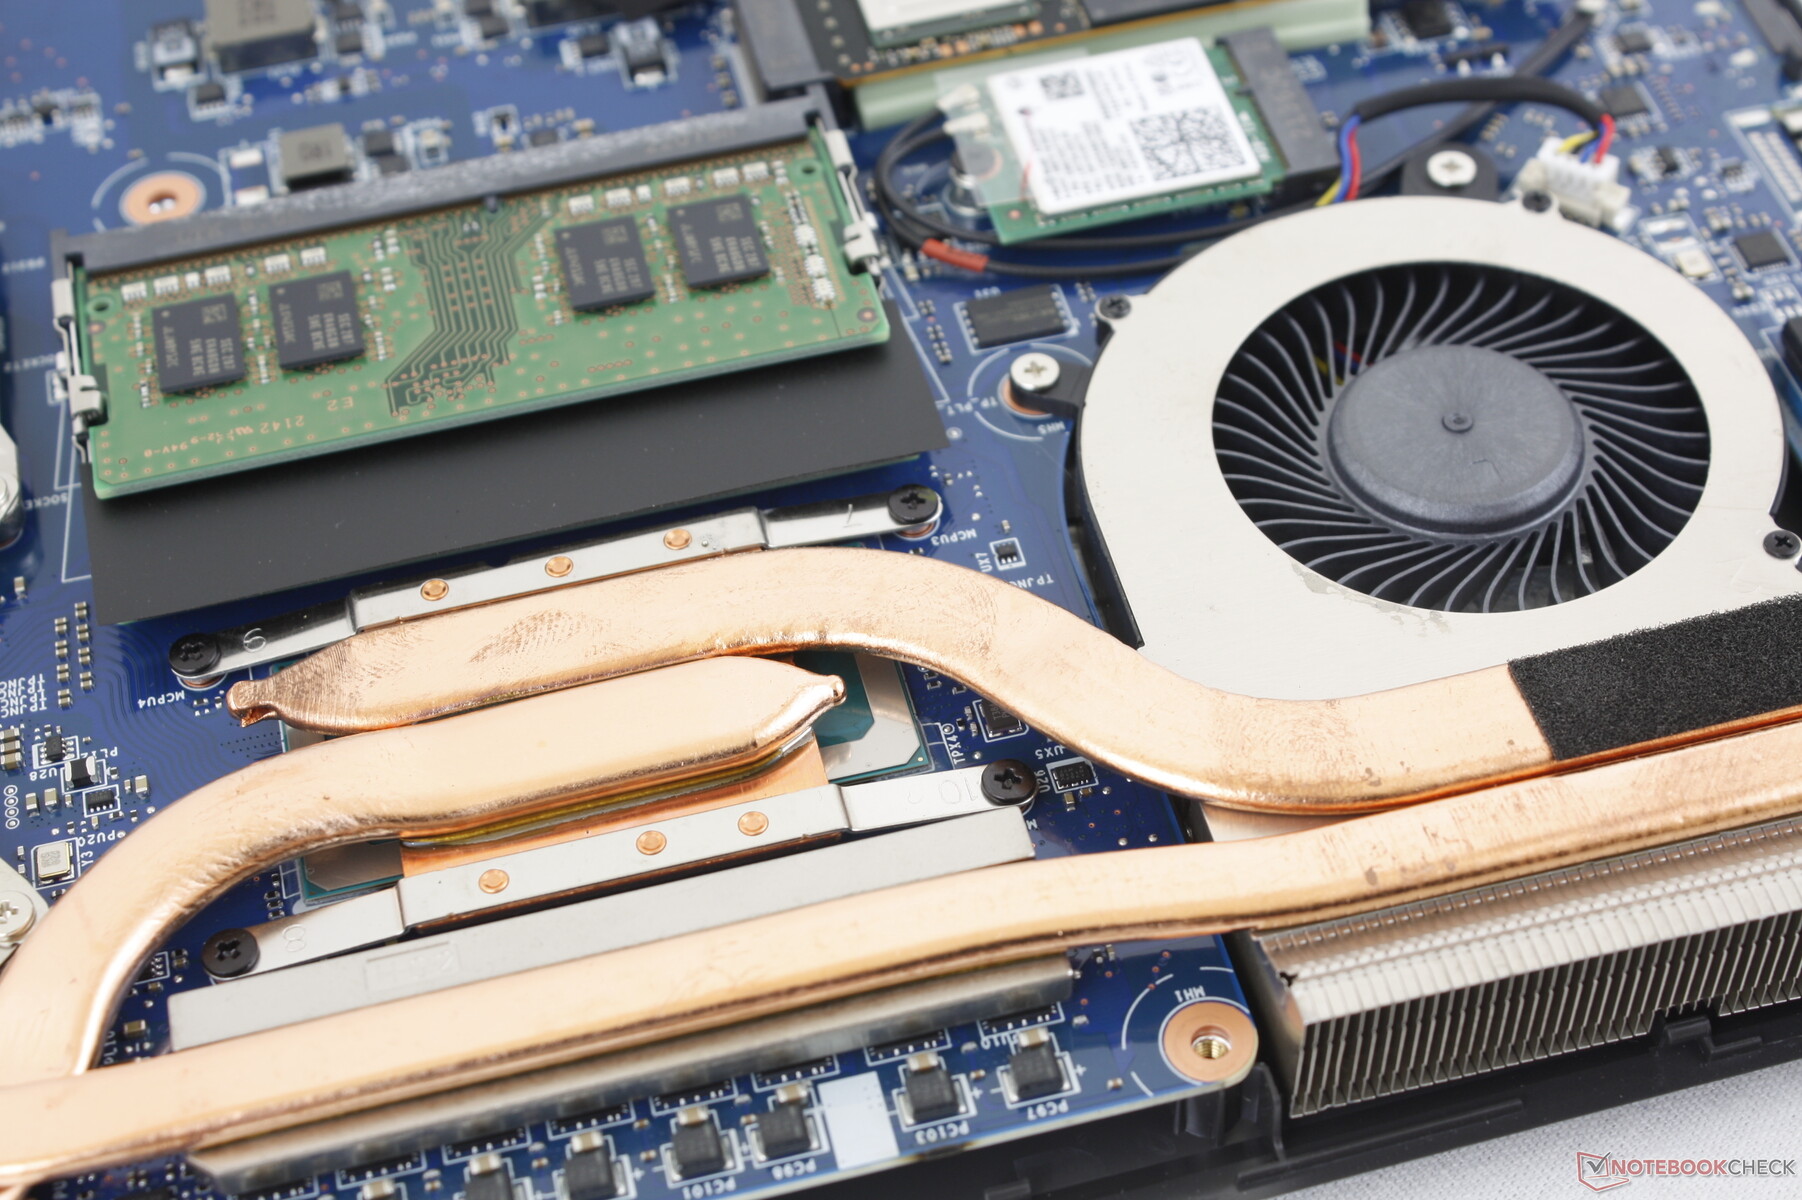
Manutenção
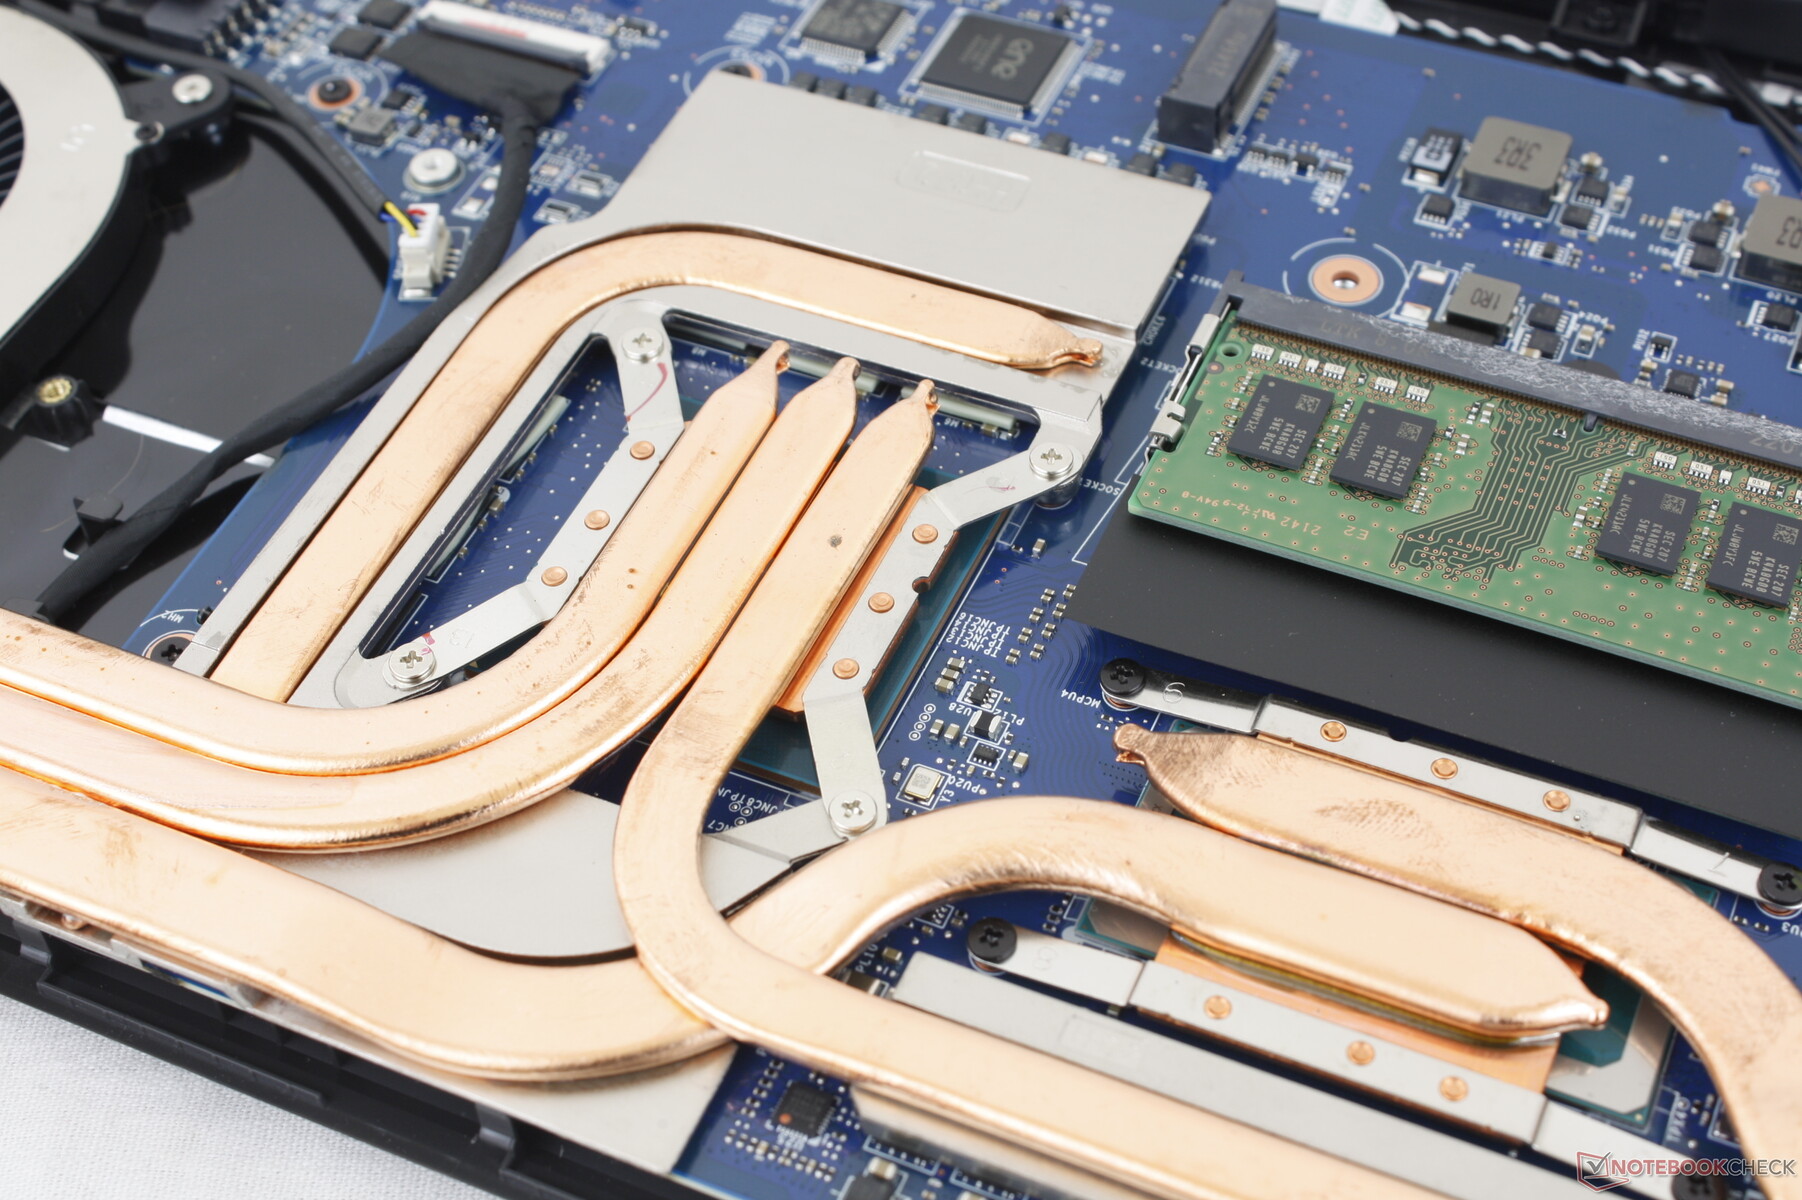
O painel inferior é fixado por 13 parafusos Philips fáceis de remover. Entretanto, tenha em mente que um adesivo de vedação de fábrica deve ser quebrado para que isso ocorra. A MSI continua sendo um dos poucos fabricantes importantes a ter um adesivo de vedação de fábrica, mesmo para atualizações simples como RAM ou armazenamento.
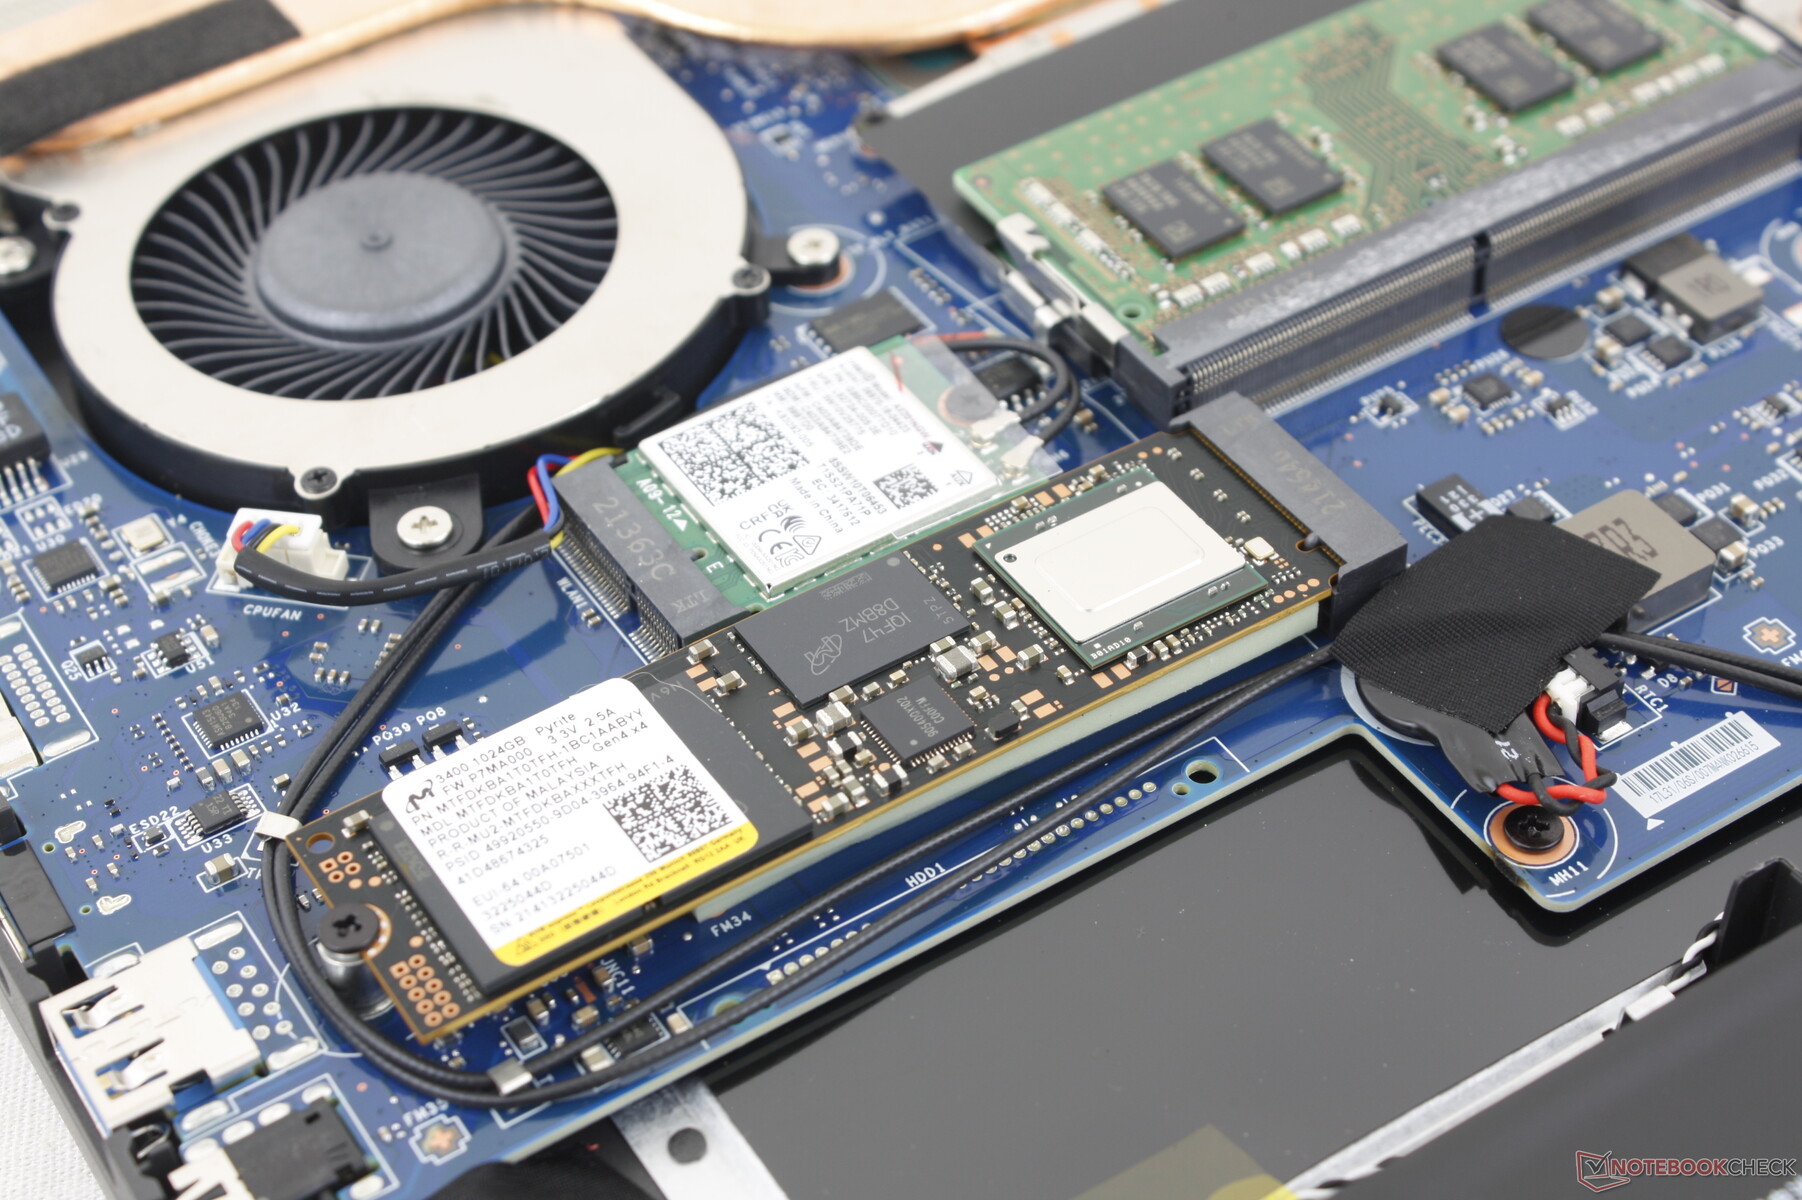
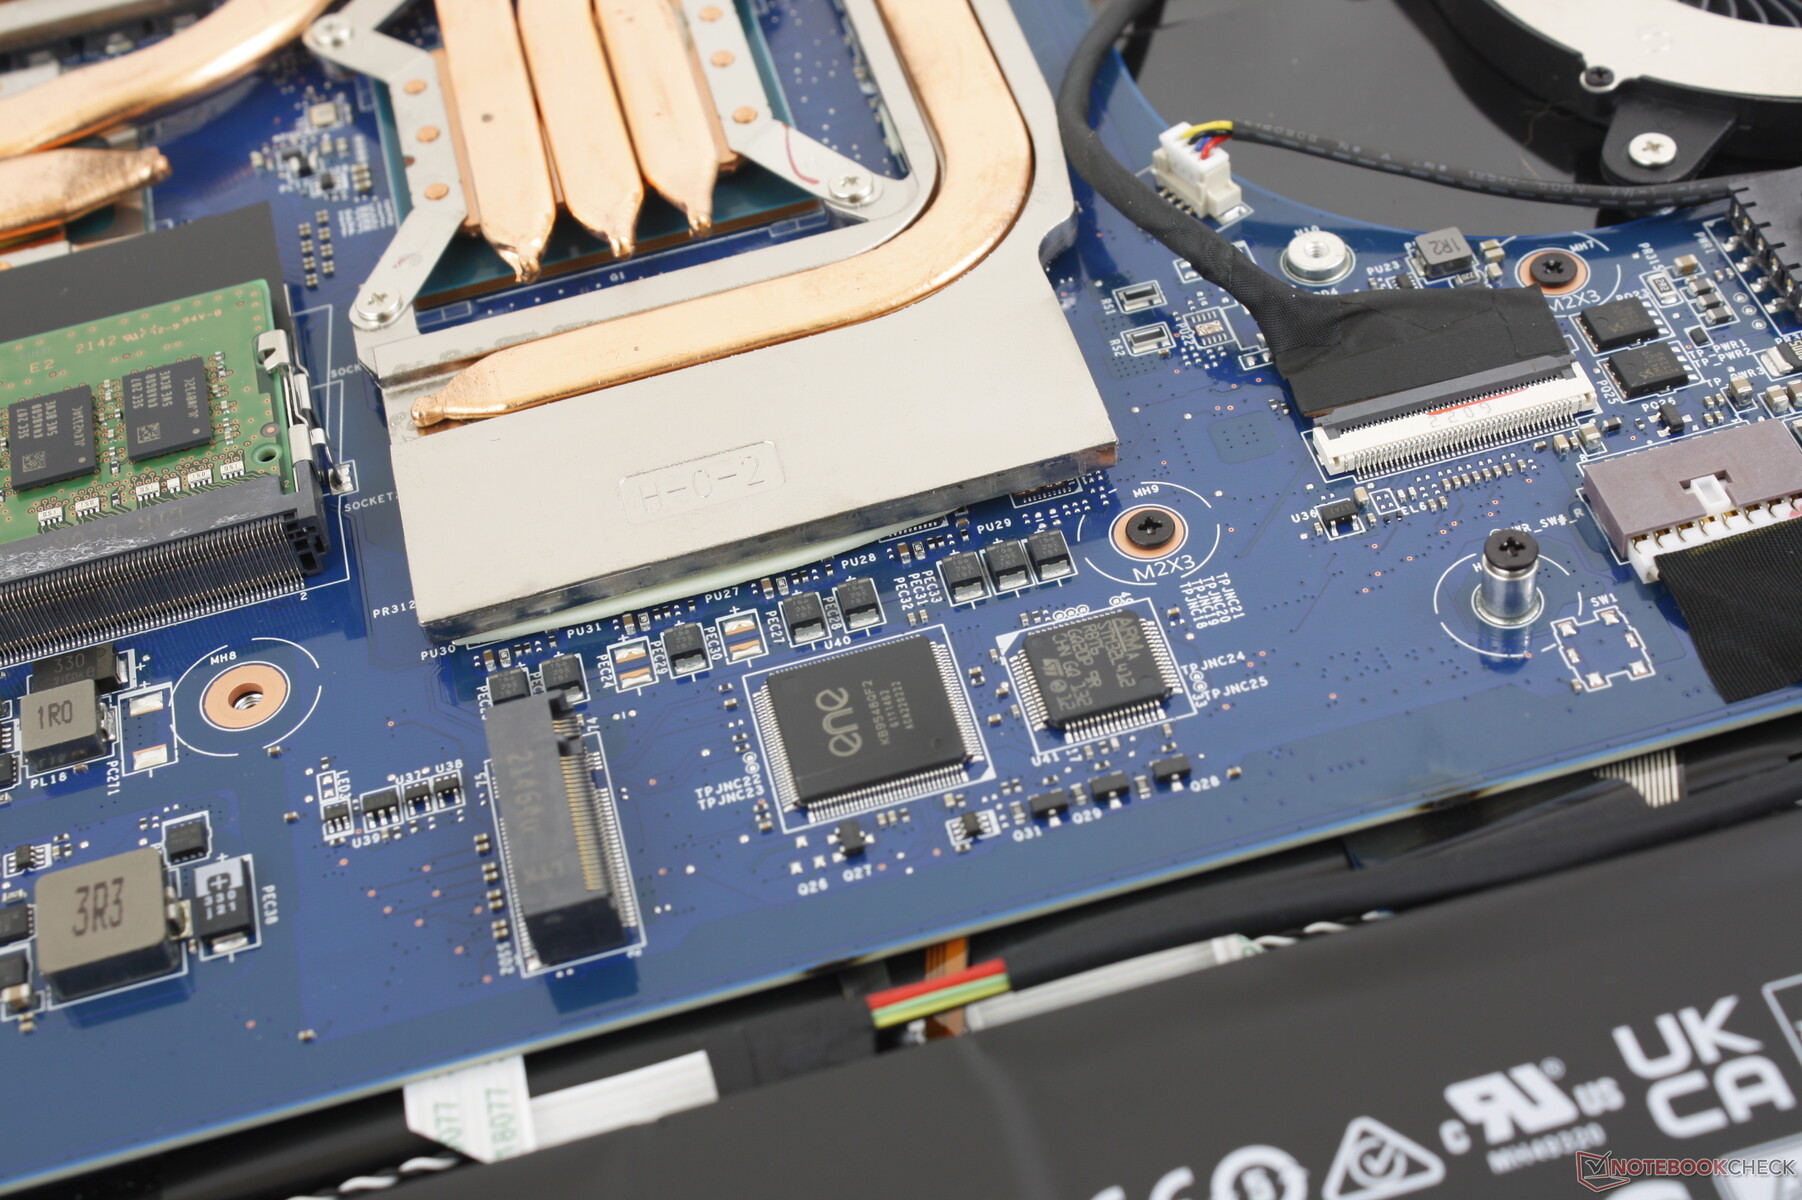
Uma vez dentro, os usuários terão acesso direto a 2x slots PCIe4 SSD, 2x slots SODIMM, módulo WLAN, bateria e solução de resfriamento.
Acessórios e Garantia
Não há extras na caixa de varejo além do adaptador AC e da papelada. Aplica-se uma garantia padrão limitada de um ano se comprada nos EUA.
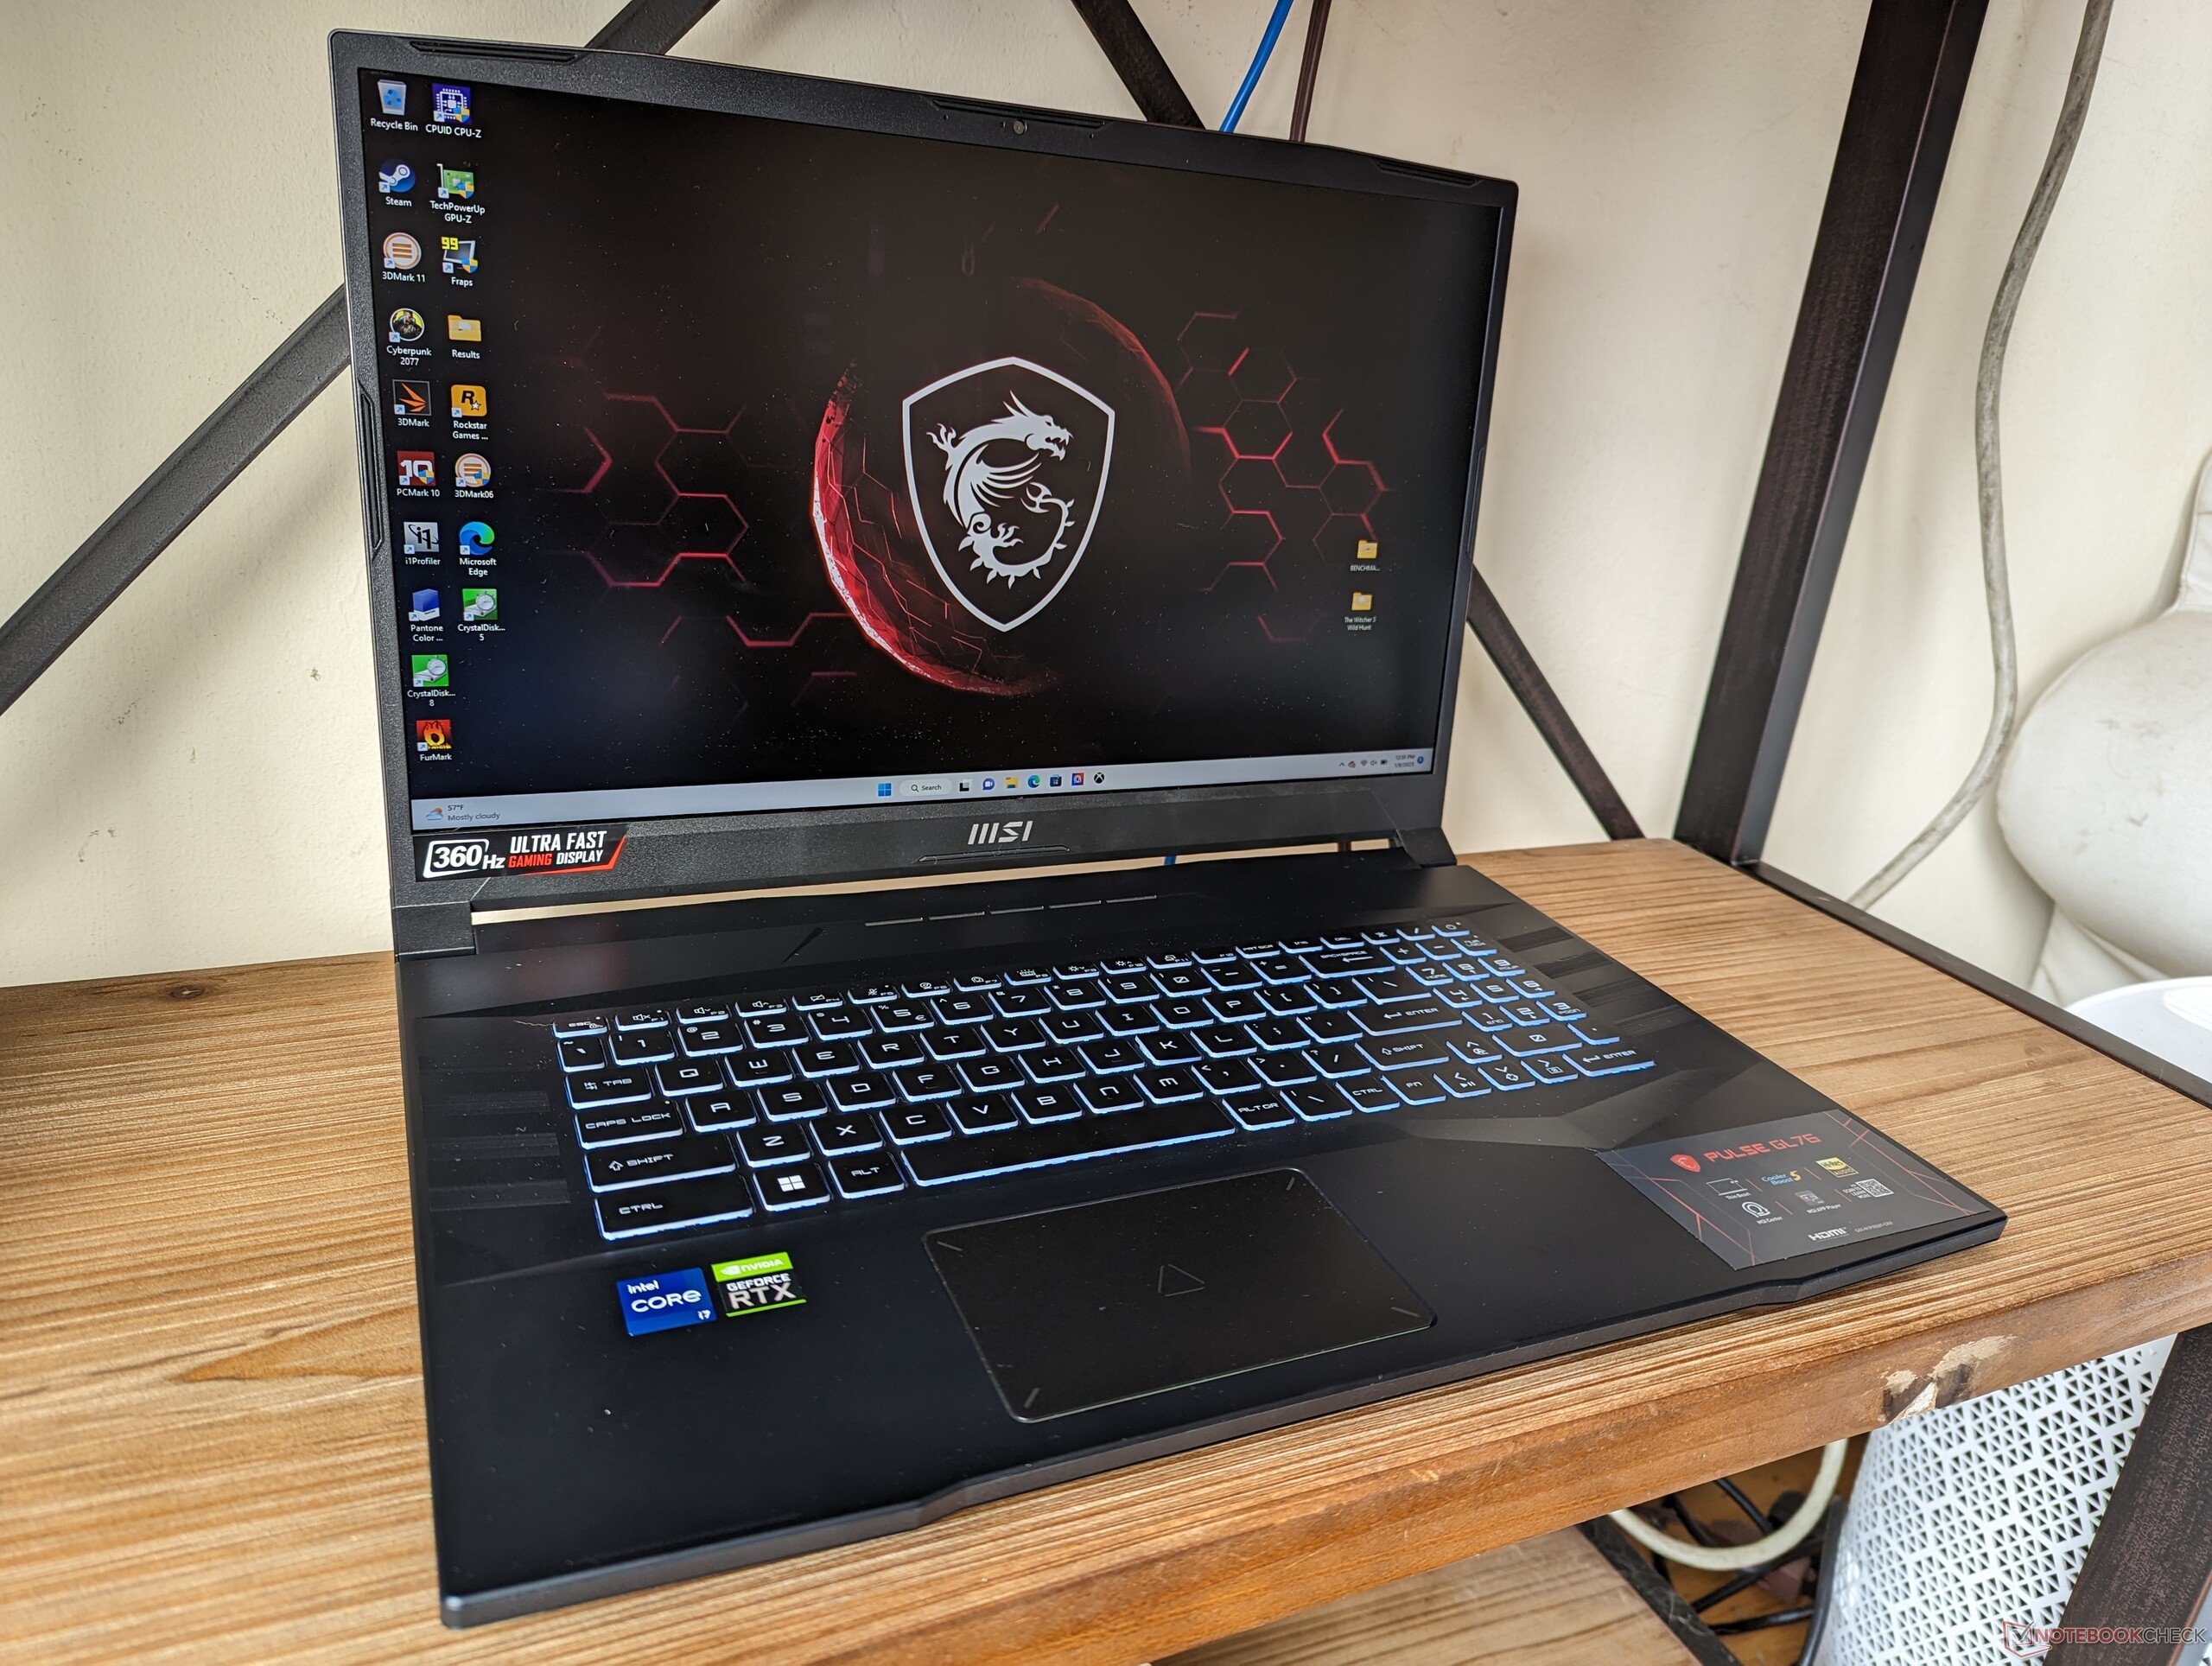
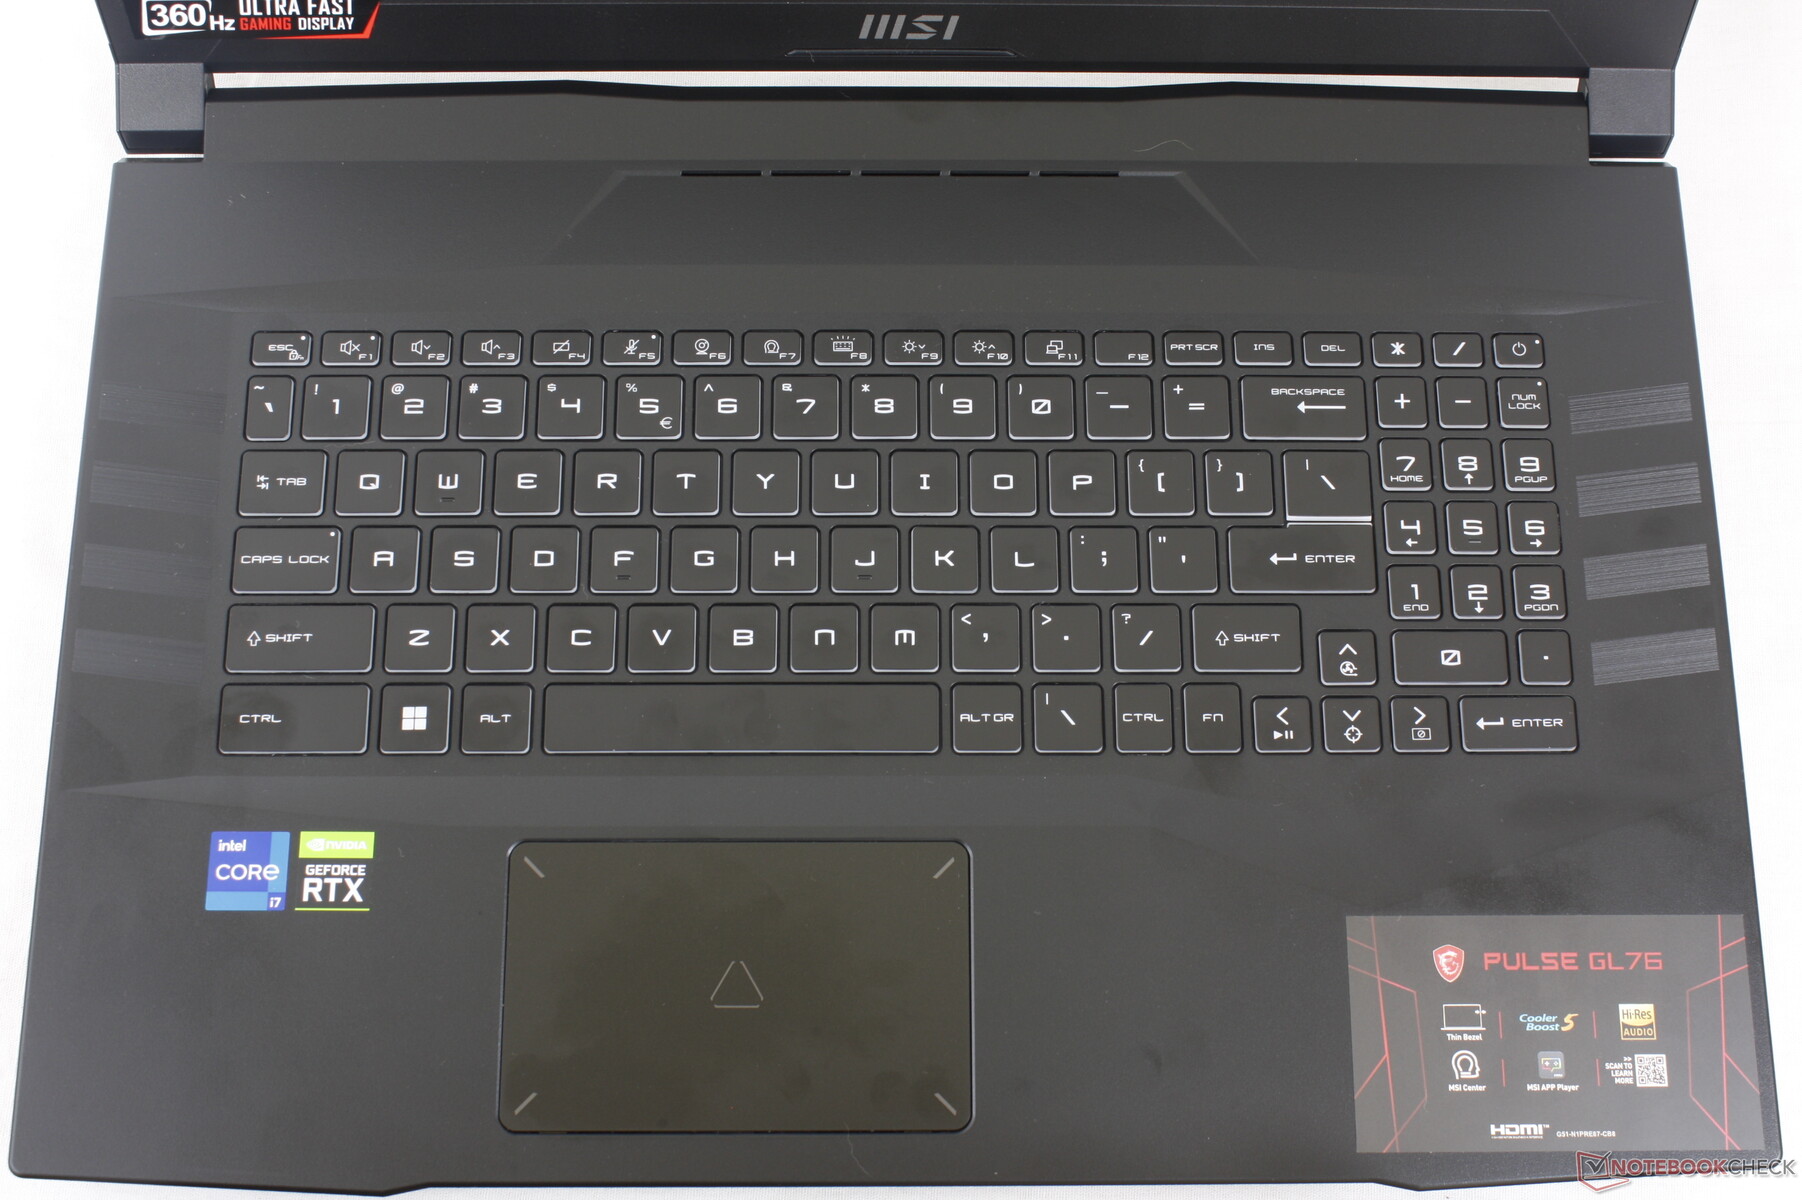
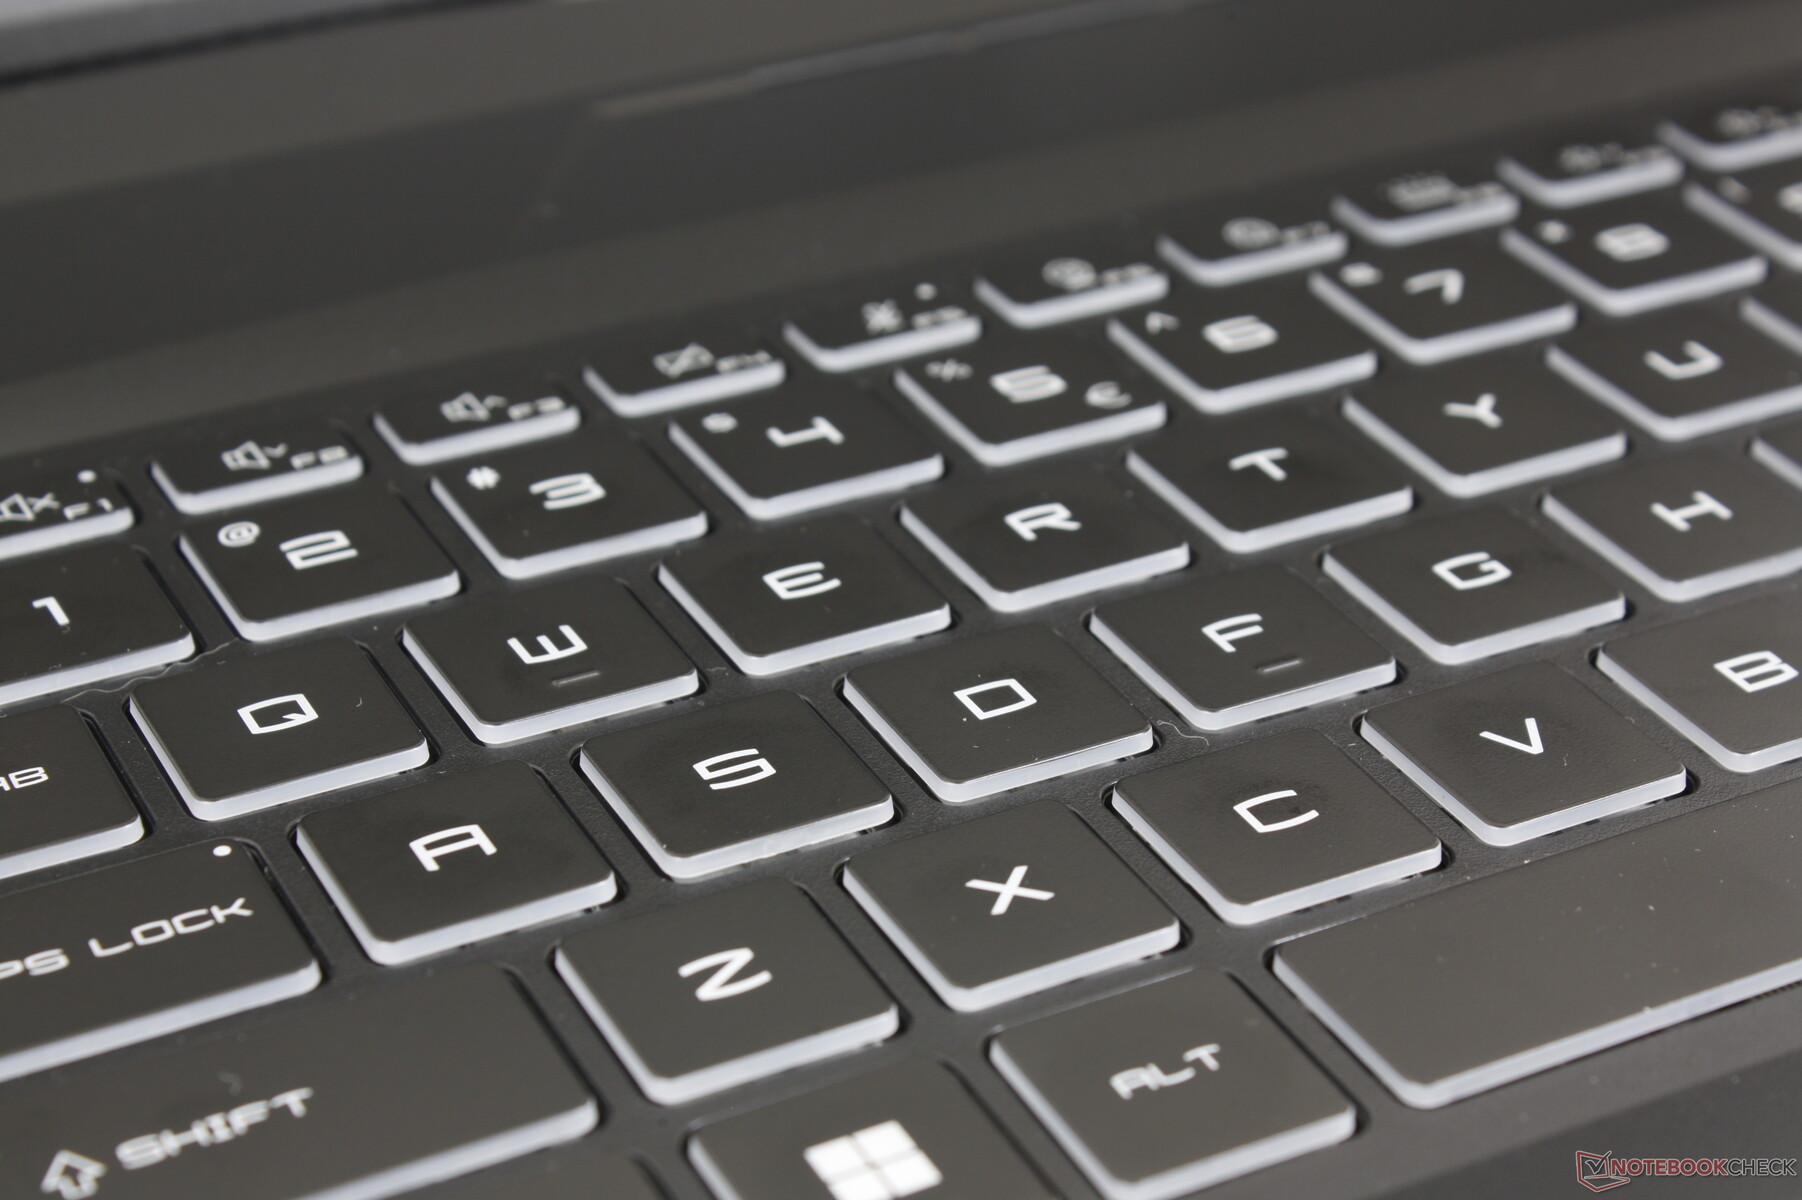
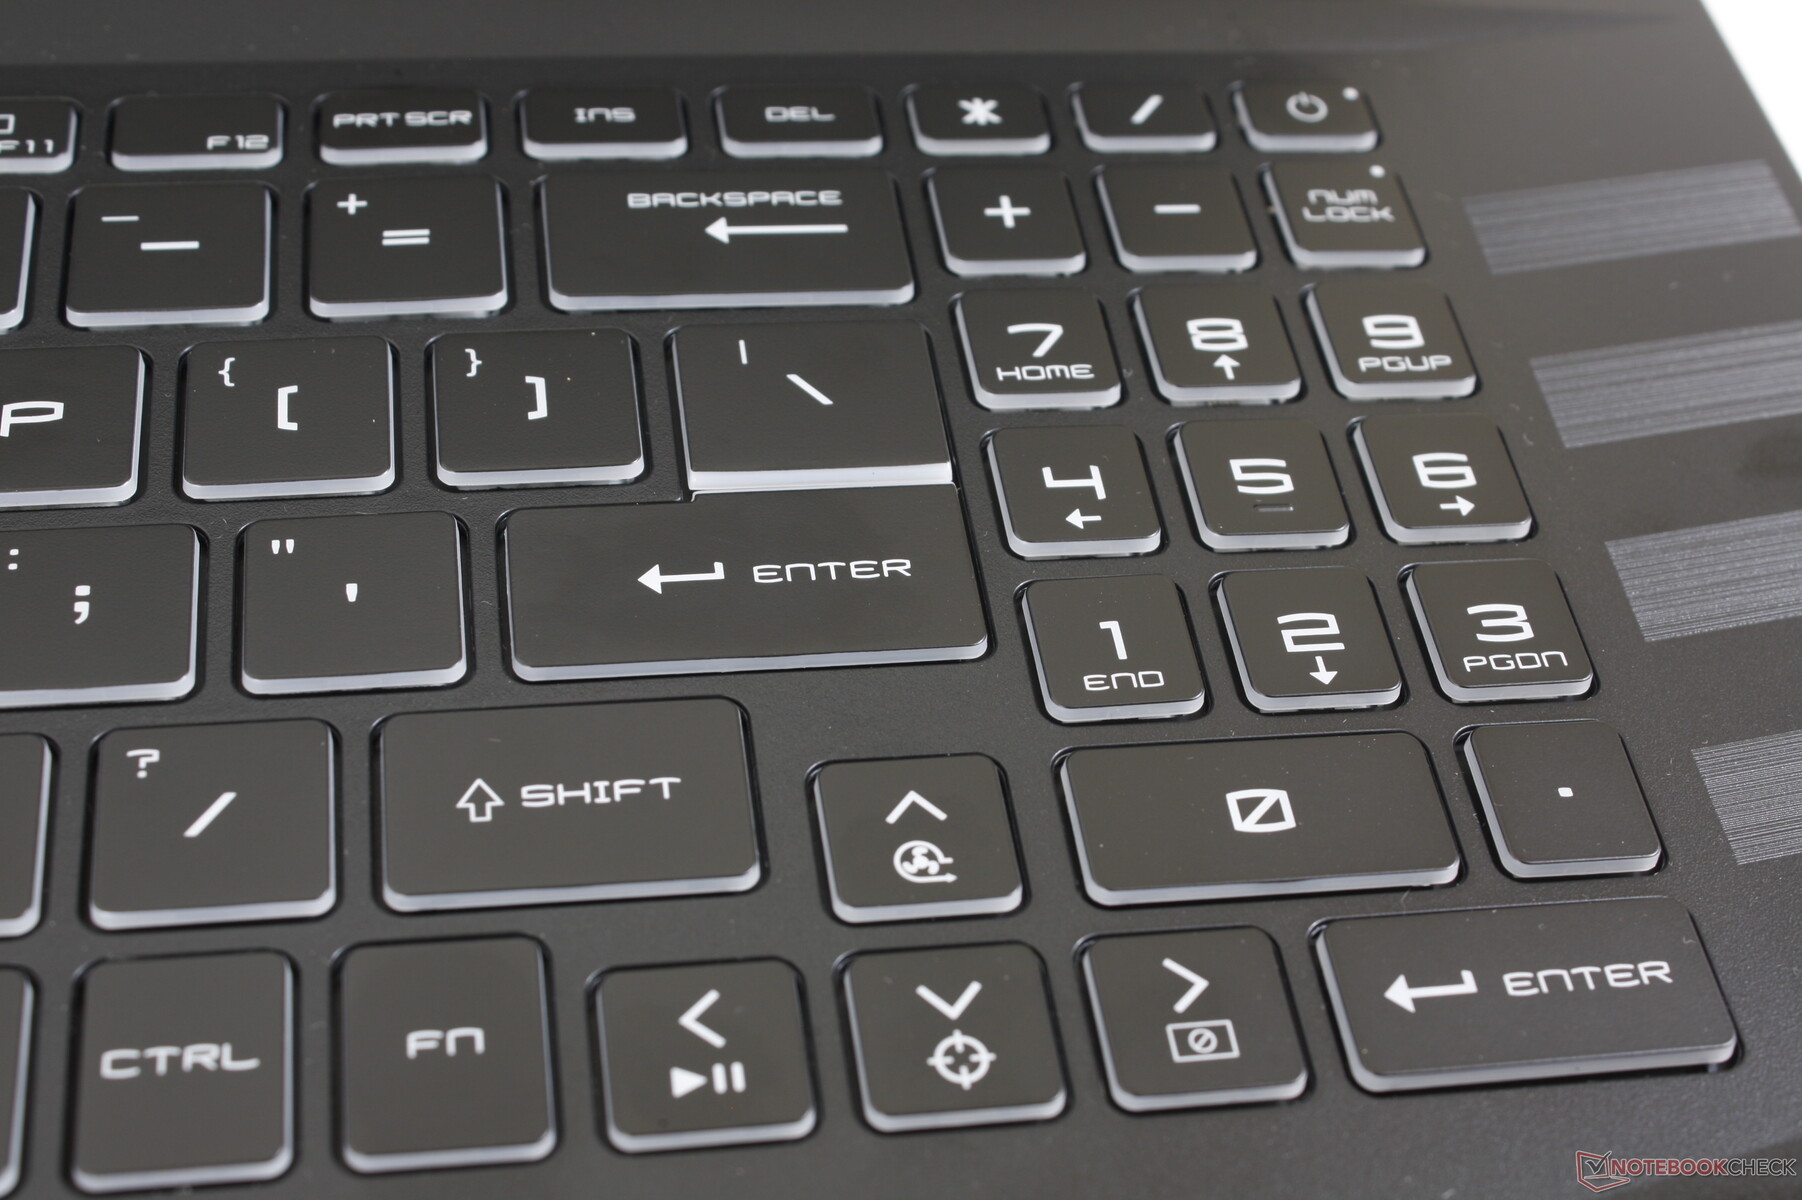
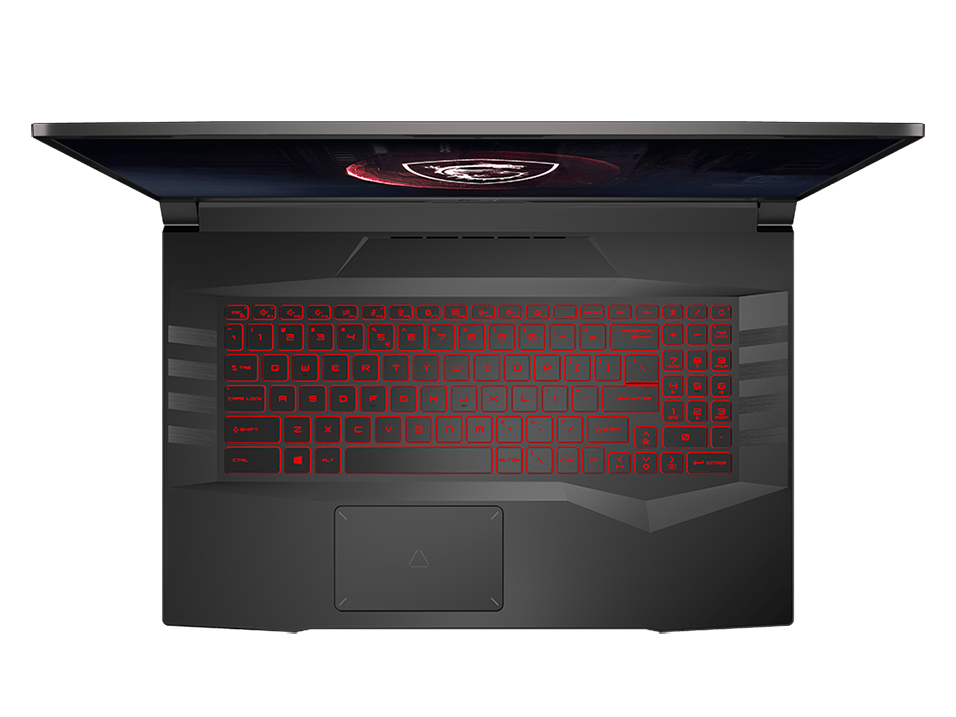
Dispositivos de entrada - OK Teclado, Spongy Clickpad
Teclado
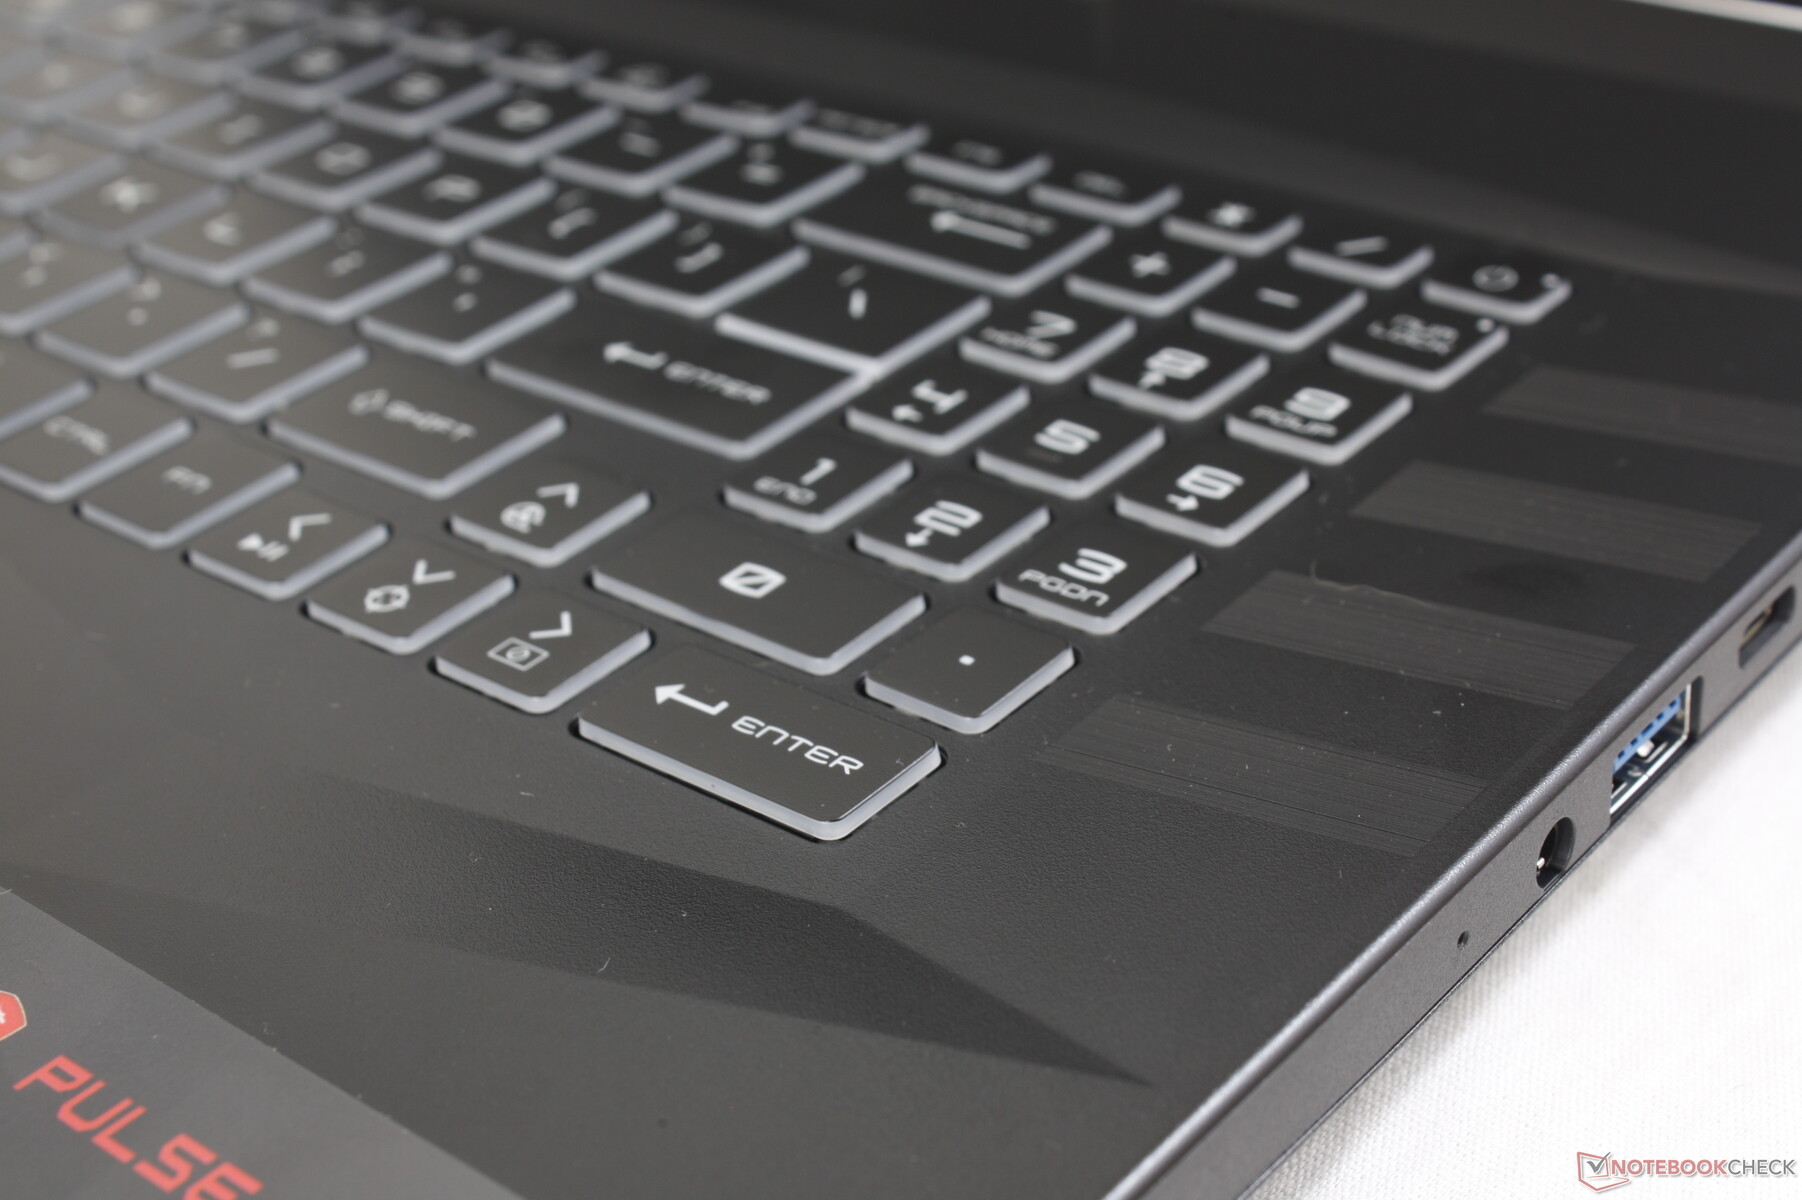
O GL76 compartilha a mesma experiência de teclado e digitação que no GL66 apesar de suas diferenças de formato. Assim, as pequenas viagens-chave e o feedback passível de ser passado na GL66 também se aplicam aqui na GL76. É lamentável que a MSI não tenha utilizado melhor o fator de forma maior de 17,3 polegadas ao aumentar o tamanho das teclas numpad e setas, pois elas são menores, mais esponjosas e mais apertadas quando comparadas com as teclas QWERTY maiores. Esta característica é compartilhada com o Asus TUF Gaming F17.
Uma luz de fundo RGB de zona única vem de série, sem opções RGB por chave. Todas as teclas e símbolos são iluminados.
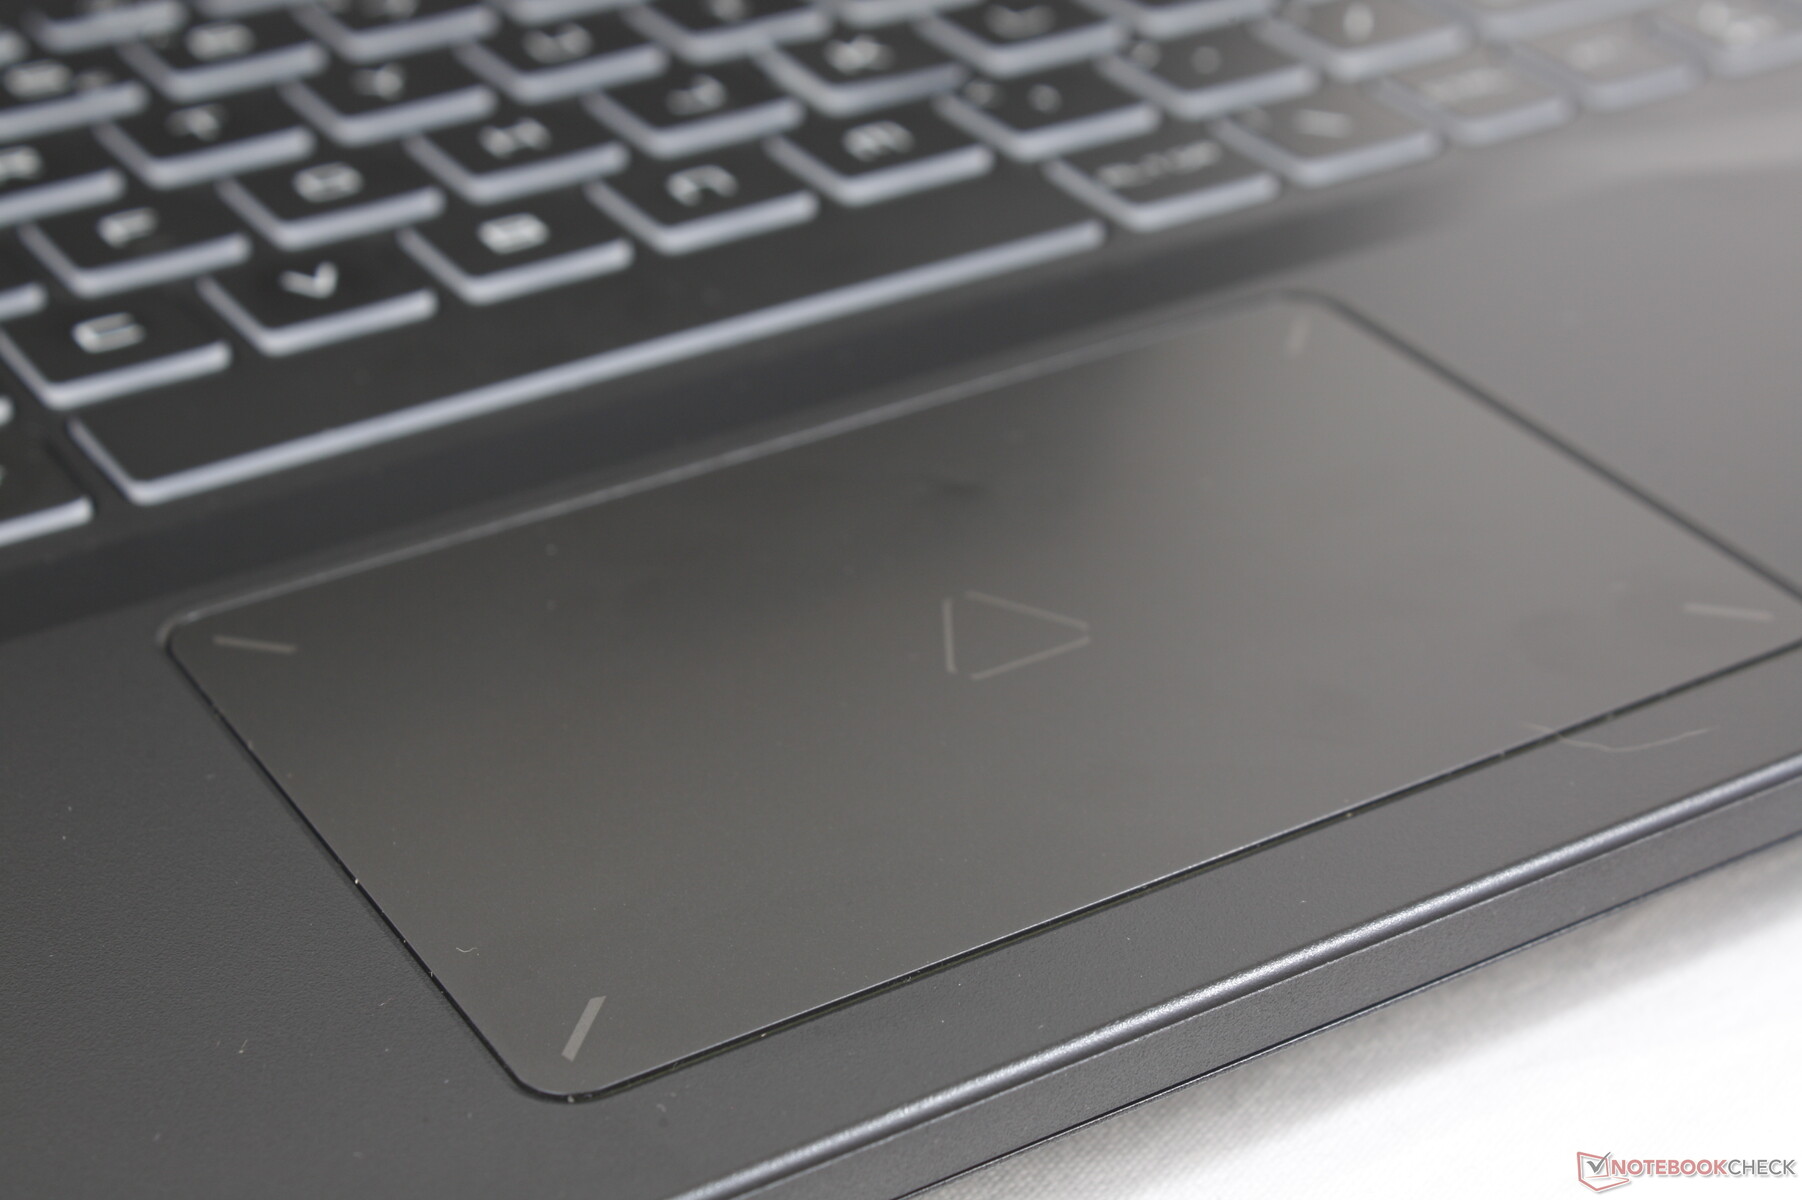
Touchpad
O clickpad é relativamente pequeno a 10,5 x 6,7 cm, mas é pelo menos um pouco maior que o clickpad de 10,5 x 6 cm no Dell G16. Sua superfície plástica tende a aderir quando desliza a velocidades médias ou lentas, o que pode tornar o controle do cursor um pouco acidentado às vezes. Além disso, o feedback ao clicar sobre a superfície é esponjoso para uma sensação muito insatisfatória. Você vai querer definitivamente um mouse externo adequado à mão sempre que possível.
Exibição - 1080p apenas
Há apenas duas opções de painel para a GL76 de 2022, conforme listado abaixo. 1080p é a única opção de resolução por enquanto, enquanto o modelo 2021 tinha um QHD SKU.
- 144 Hz, 1080p, 60% sRGB, IPS
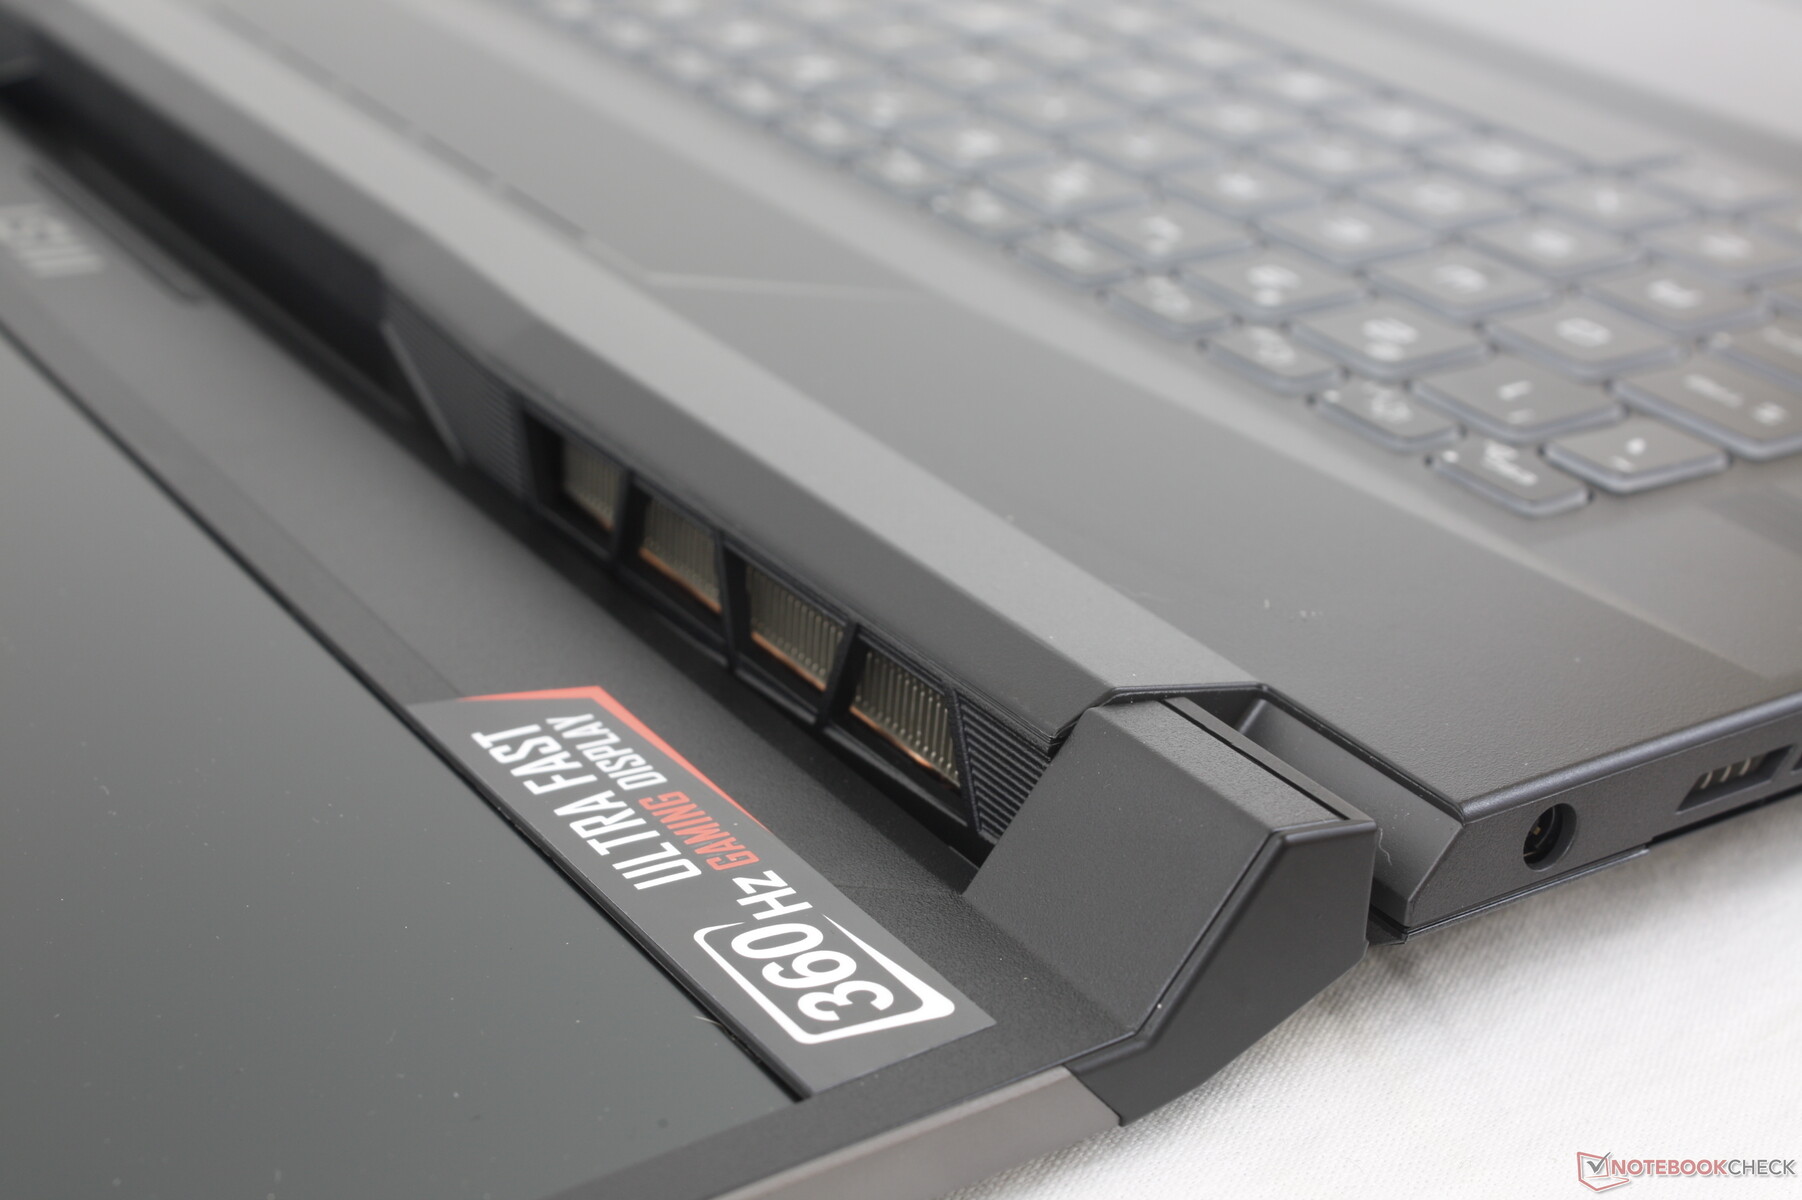
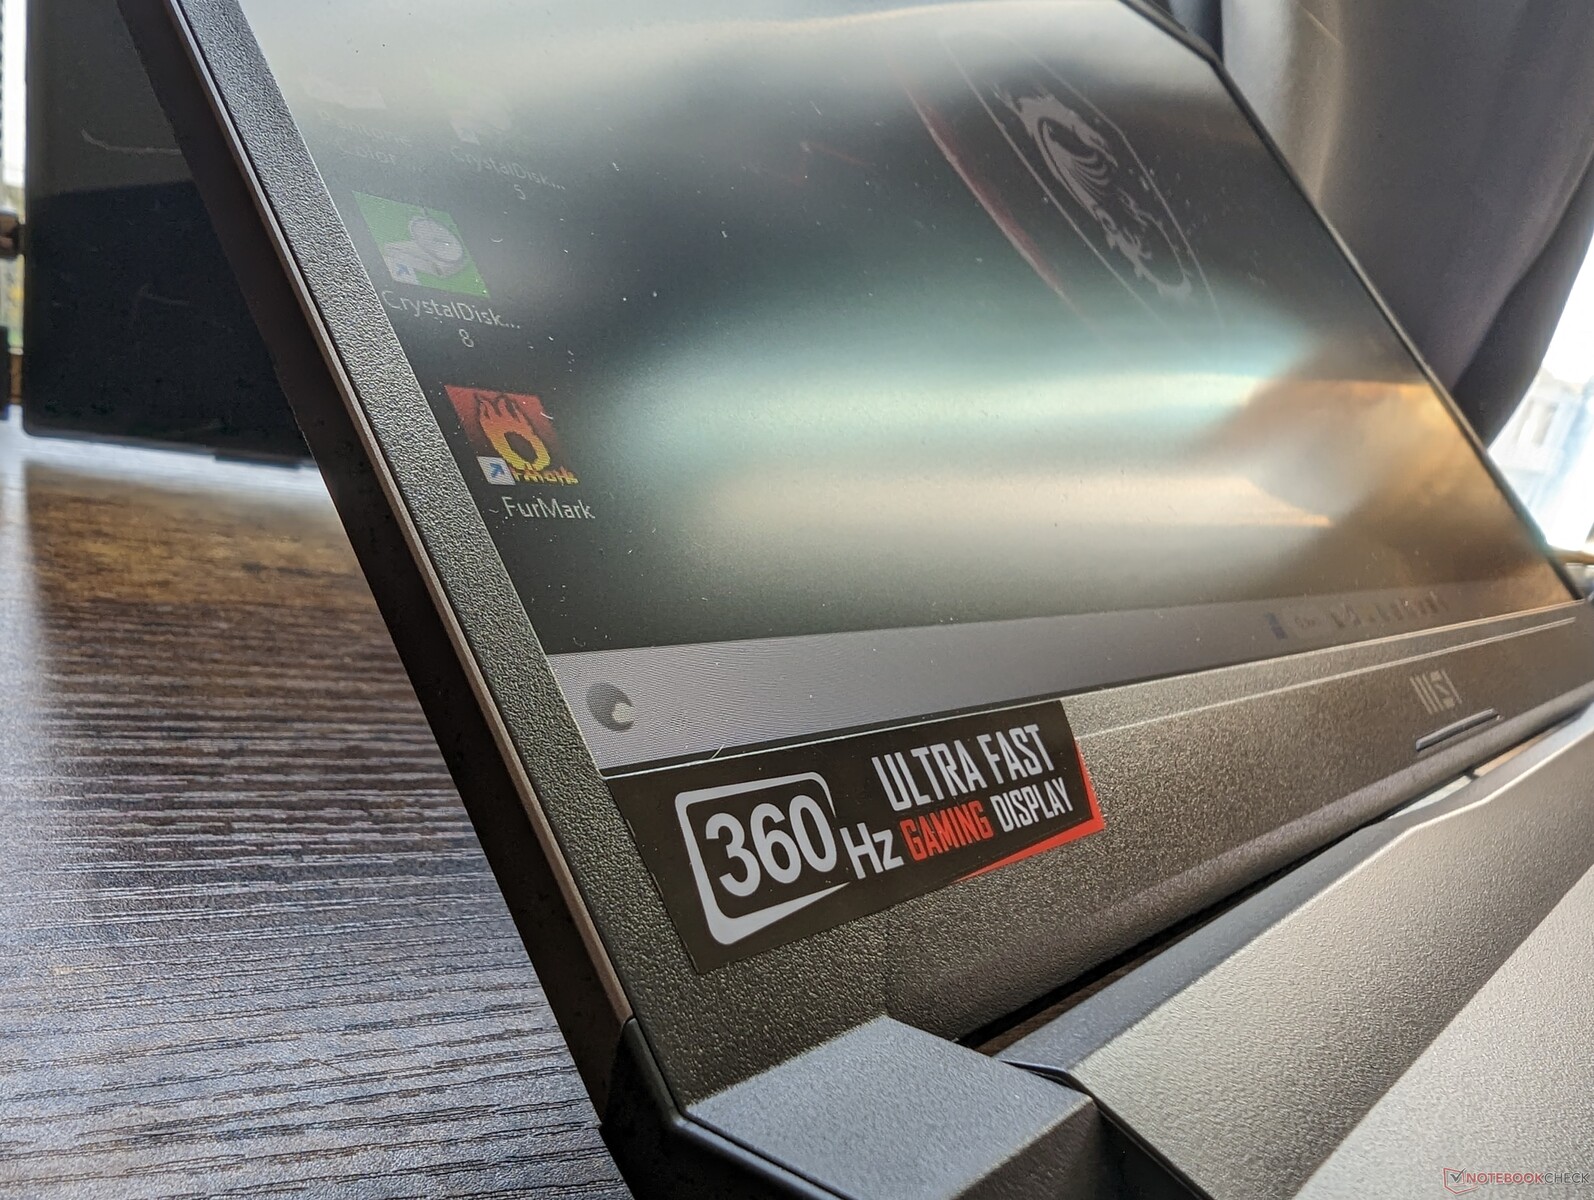
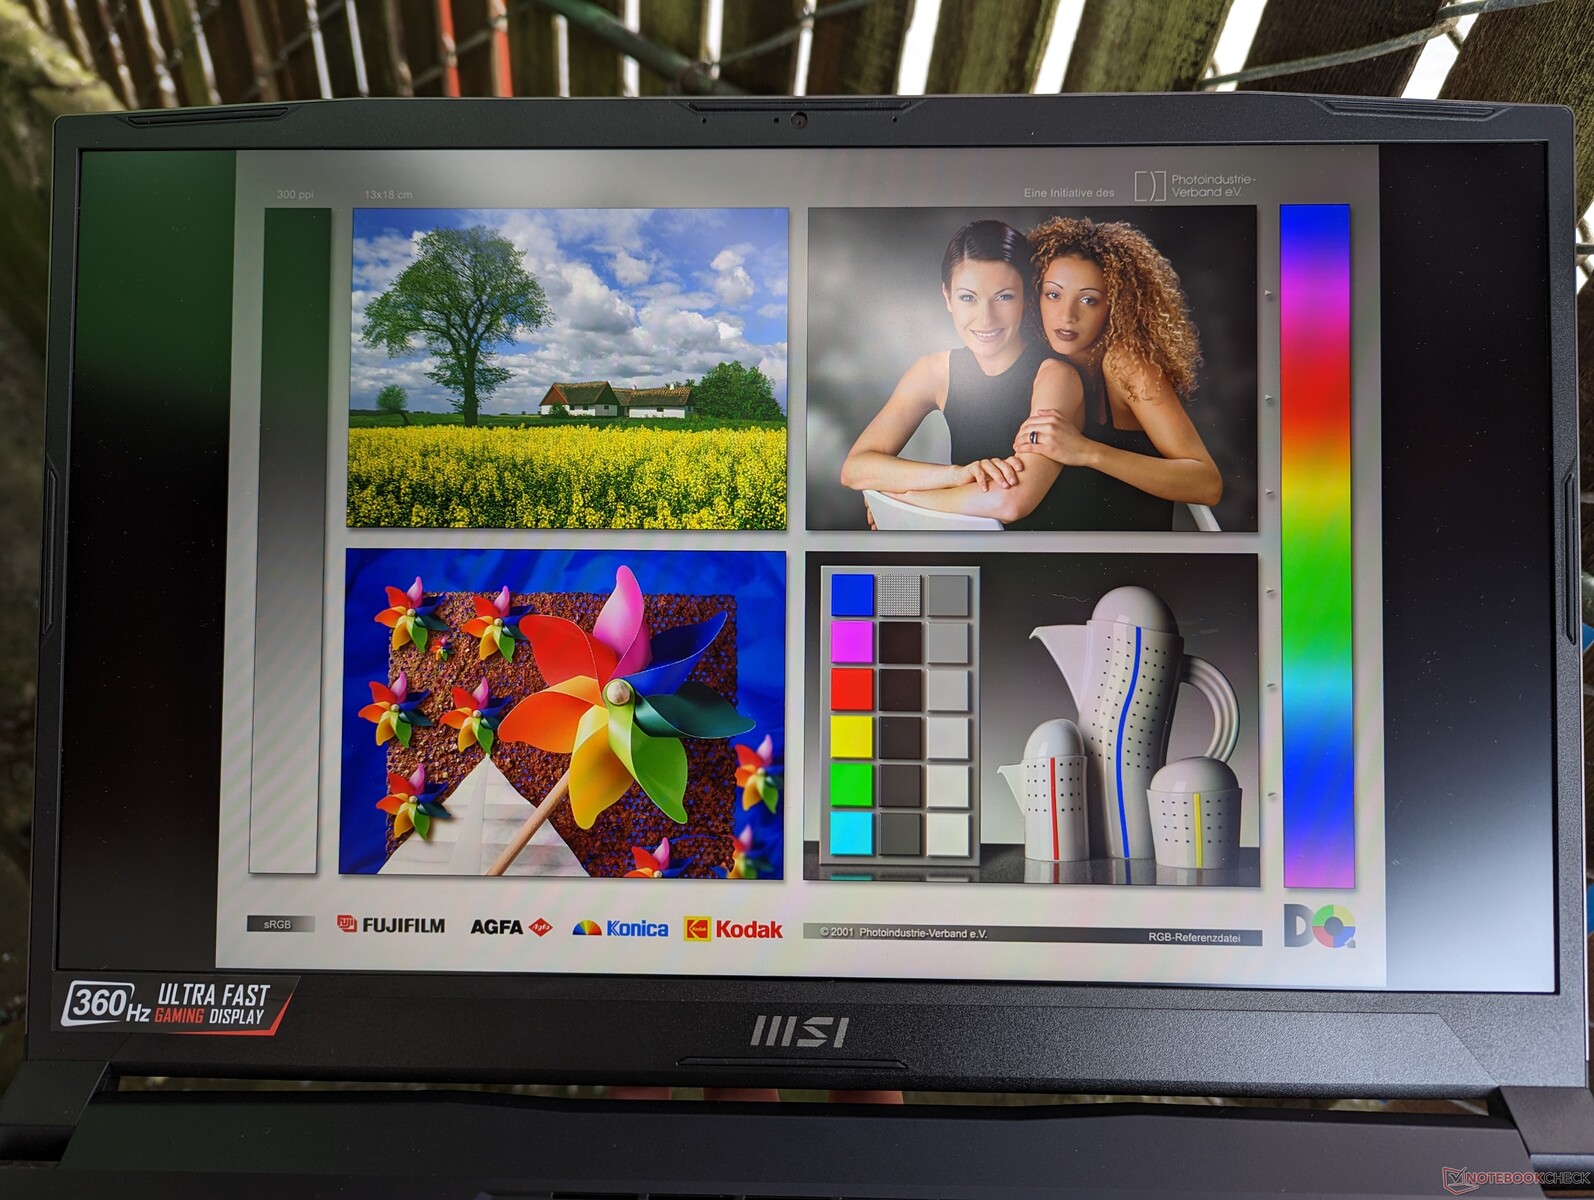
- 360 Hz, 1080p, 100% sRGB, IPS
O painel de 360 Hz tem tempos de resposta muito mais rápidos em preto e branco do que o painel de 144 Hz. É também o mesmo painel IPS Sharp LQ173M1JW08 que a MSI também utiliza em seu carro-chefe Titan GT77. Recomendamos evitar a opção de 144 Hz, pois seu espaço de cor limitado é um bom indicador de um painel muito barato.
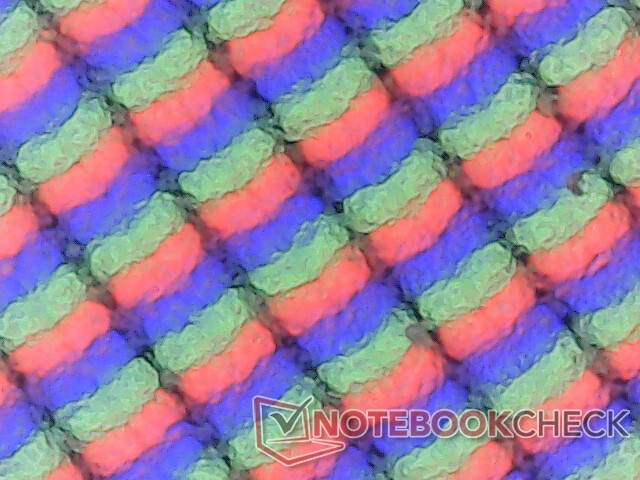
A qualidade da imagem é excelente e amanteigada, devido à taxa de atualização insanamente rápida. Tenha em mente que não é tão nítida quanto a maioria dos Ultrabooks ou portáteis de 15,6 polegadas menores devido ao PPI relativamente baixo. Este painel em particular prioriza a capacidade de resposta e a taxa de quadros em relação à resolução.
| |||||||||||||||||||||||||
iluminação: 82 %
iluminação com acumulador: 337.7 cd/m²
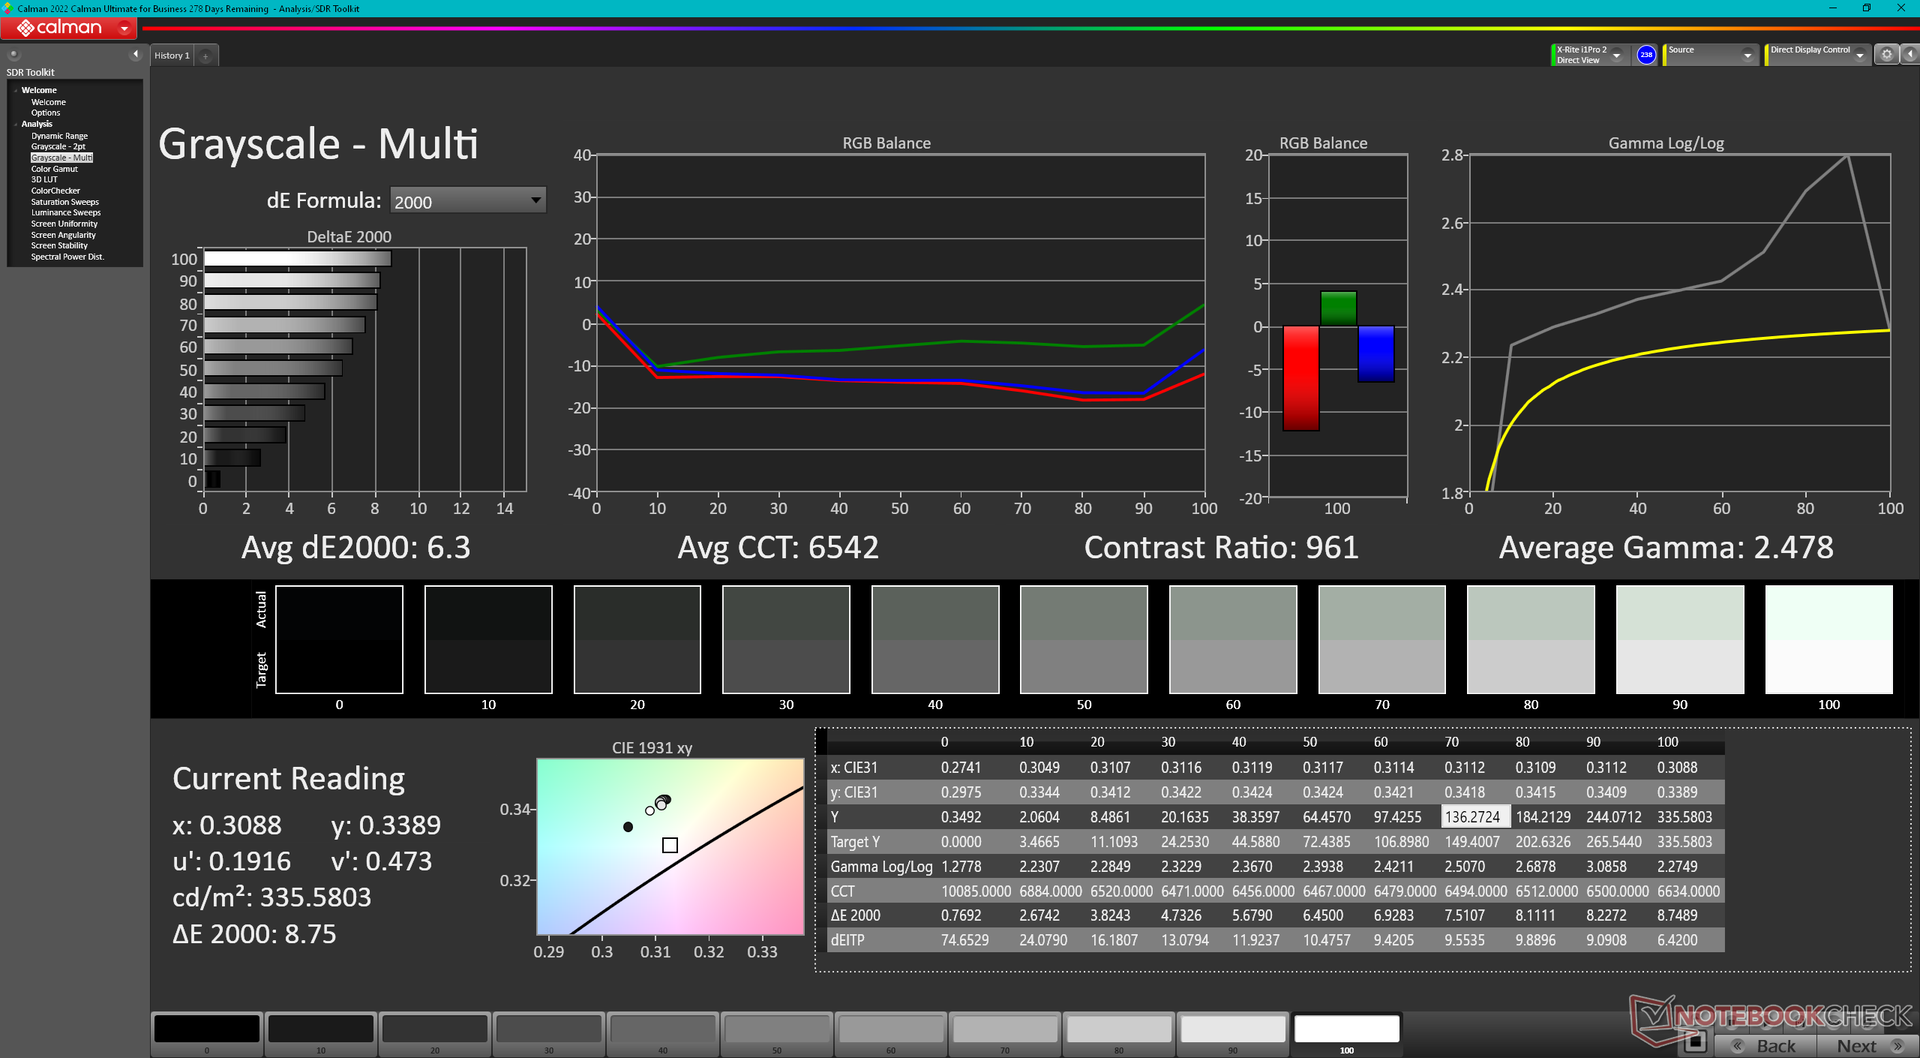
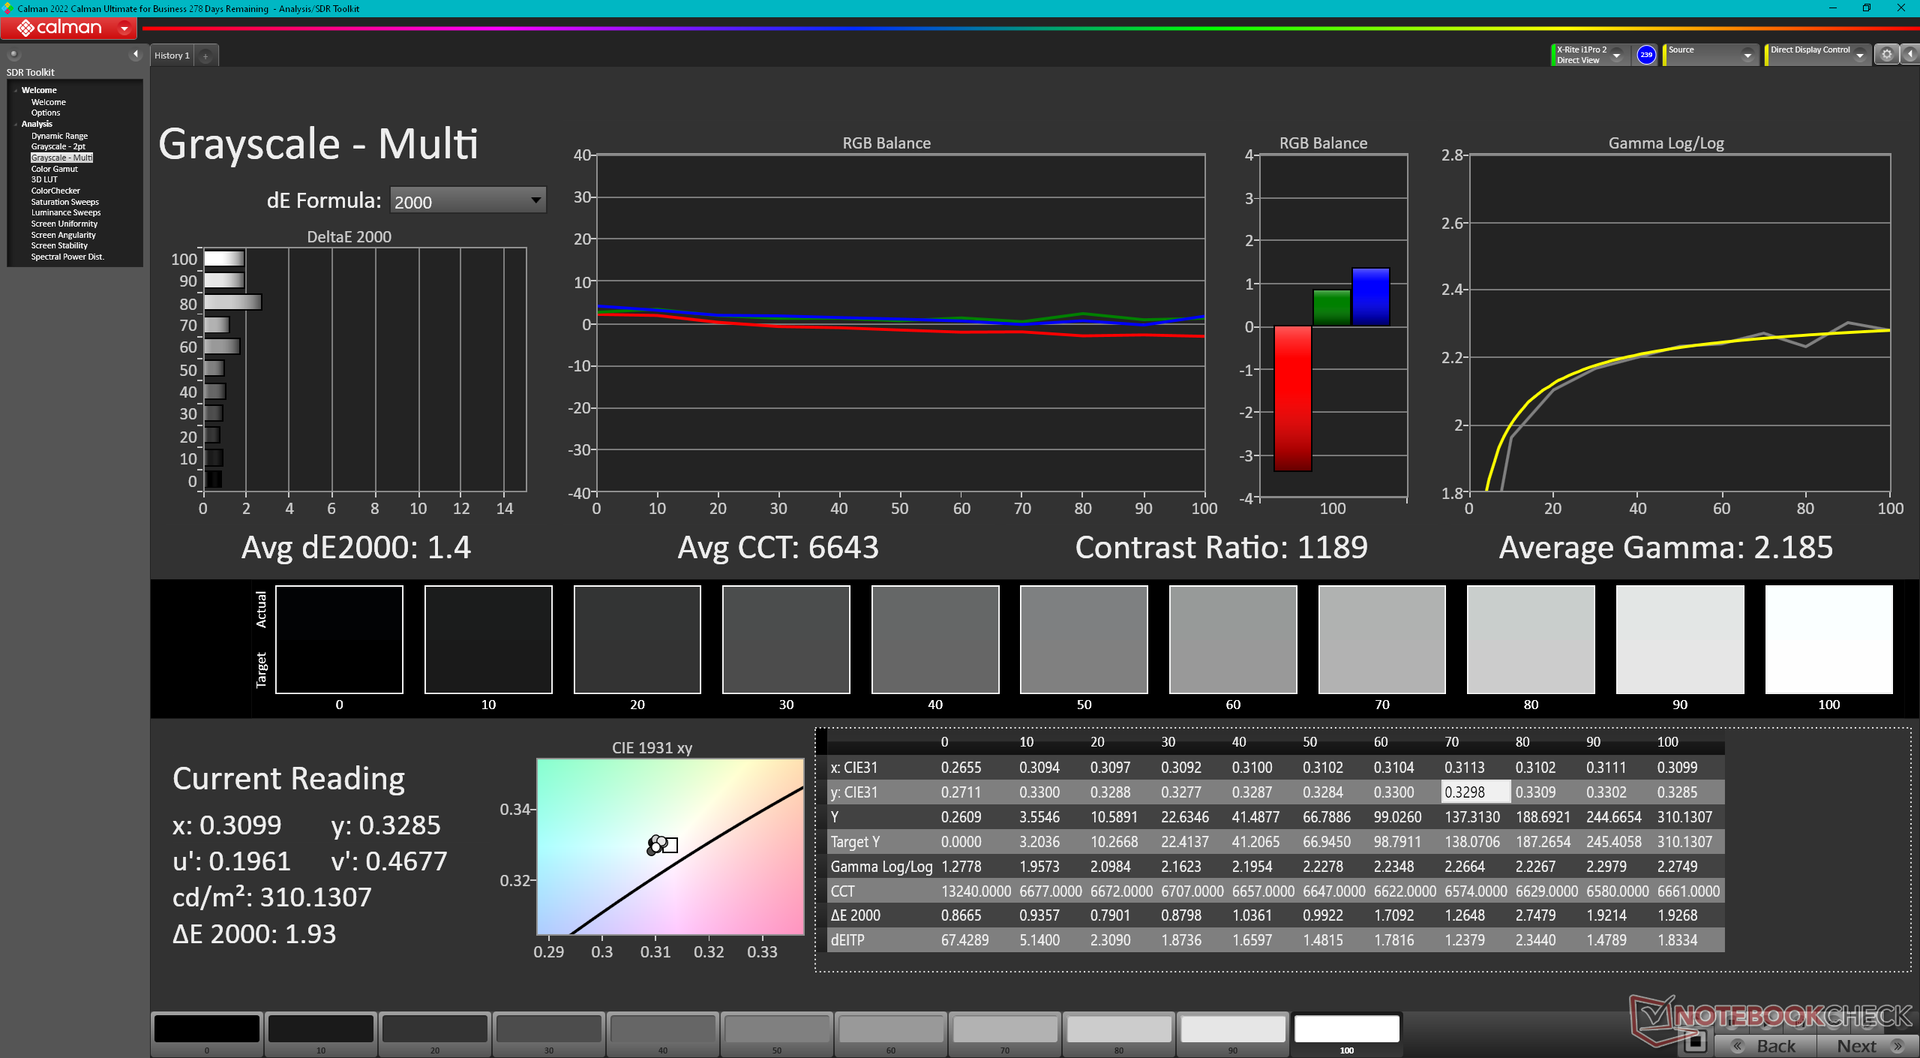
Contraste: 1089:1 (Preto: 0.31 cd/m²)
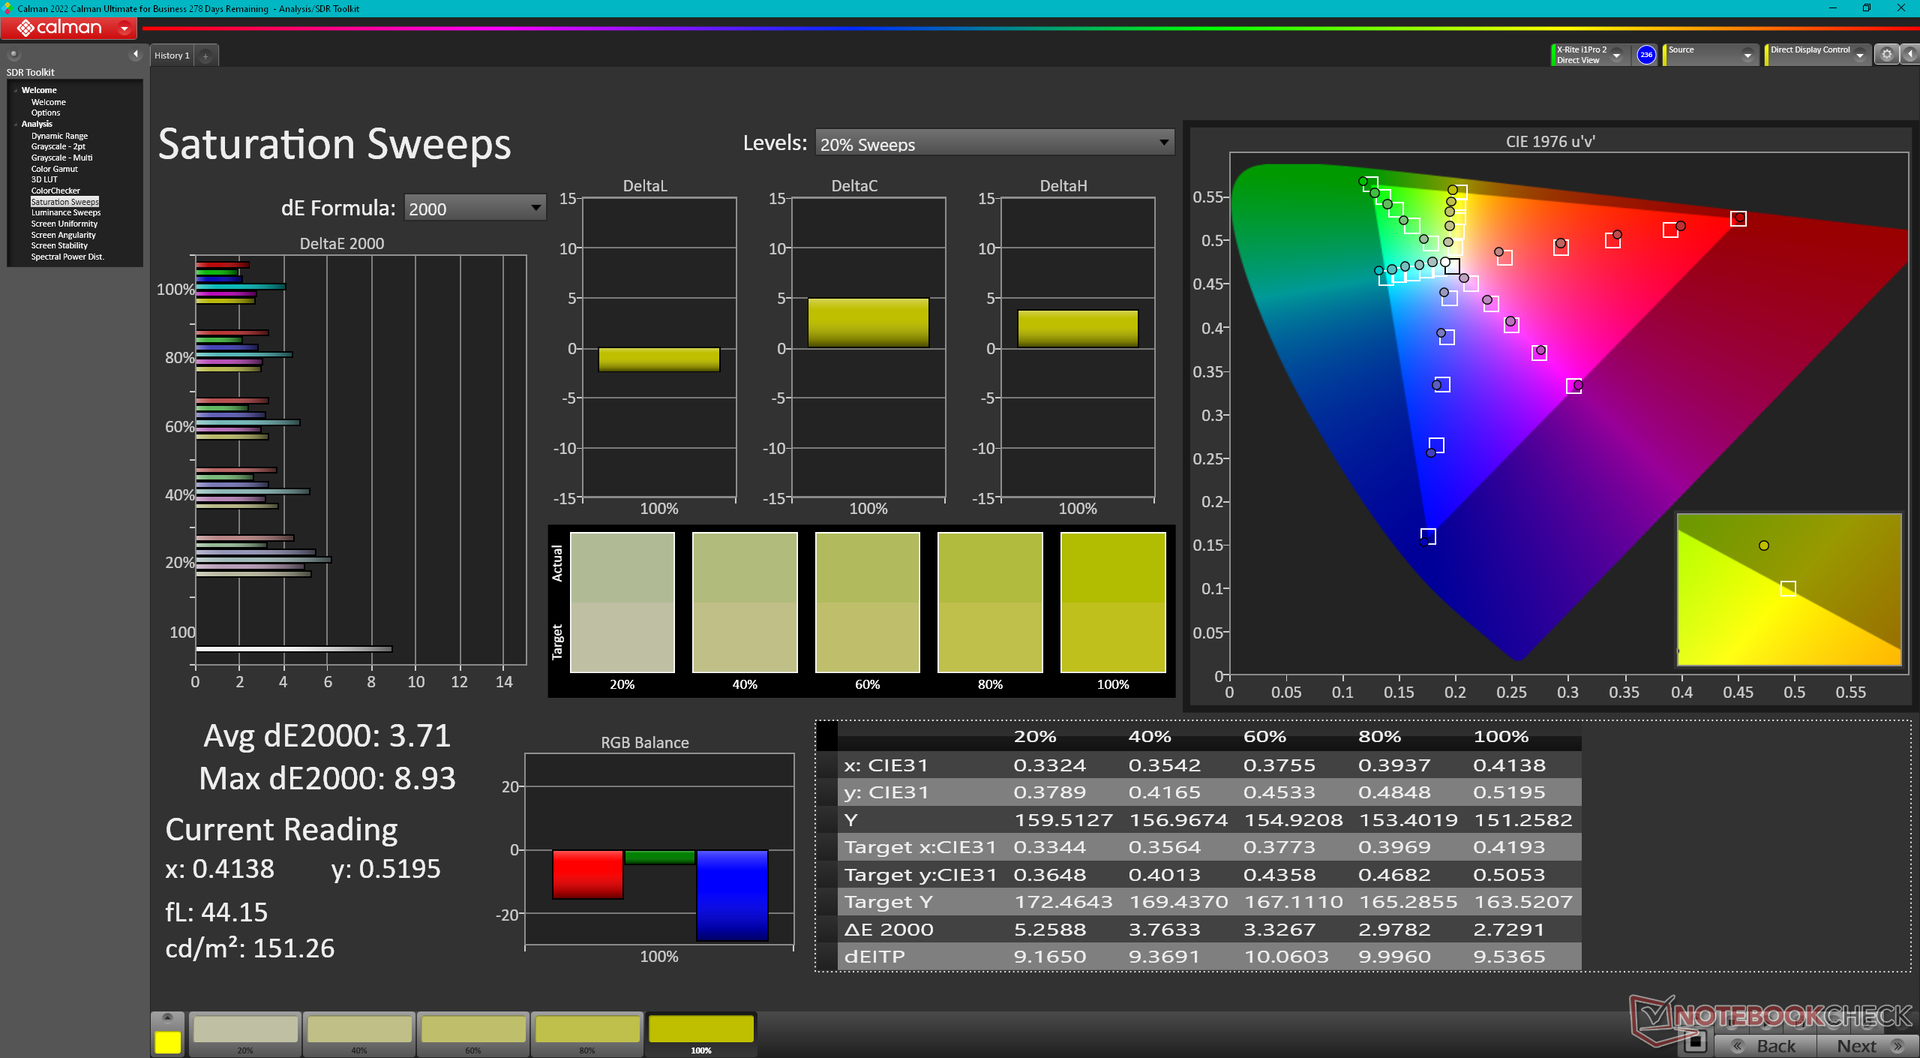
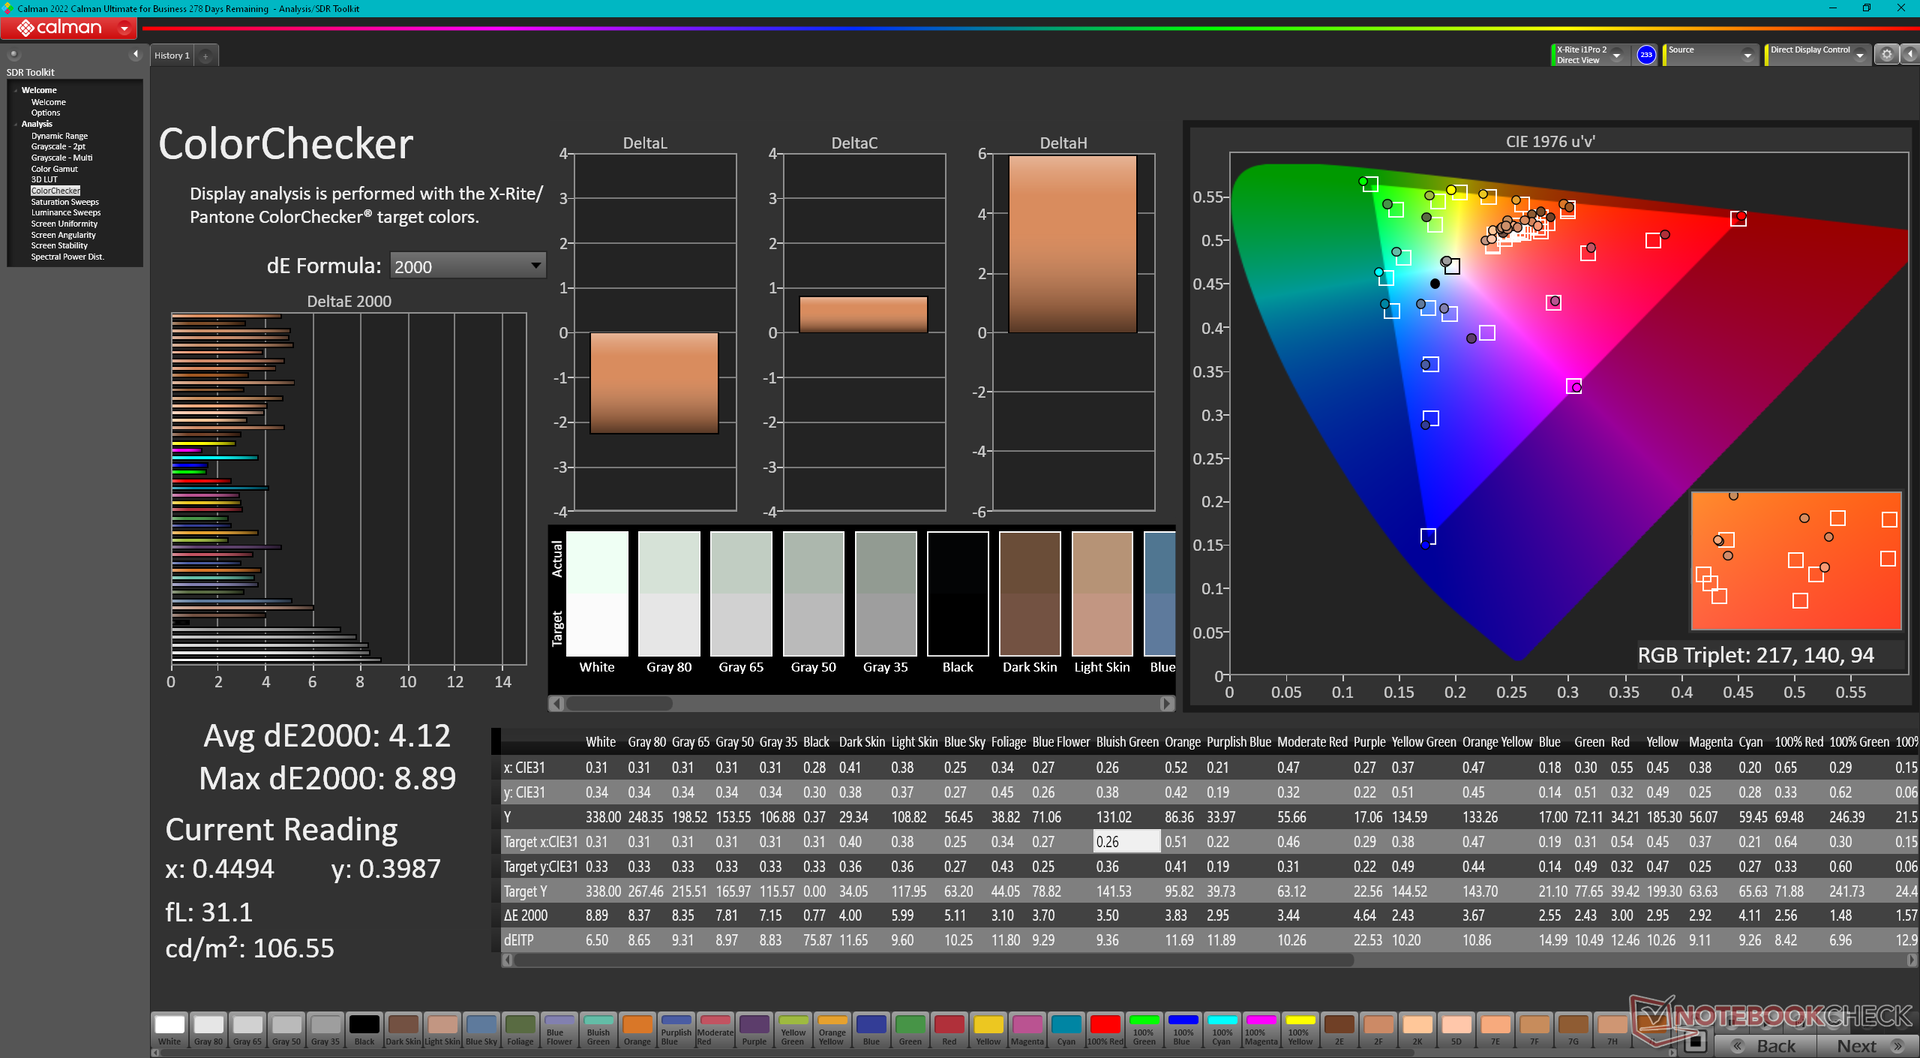
ΔE ColorChecker Calman: 4.12 | ∀{0.5-29.43 Ø4.71}
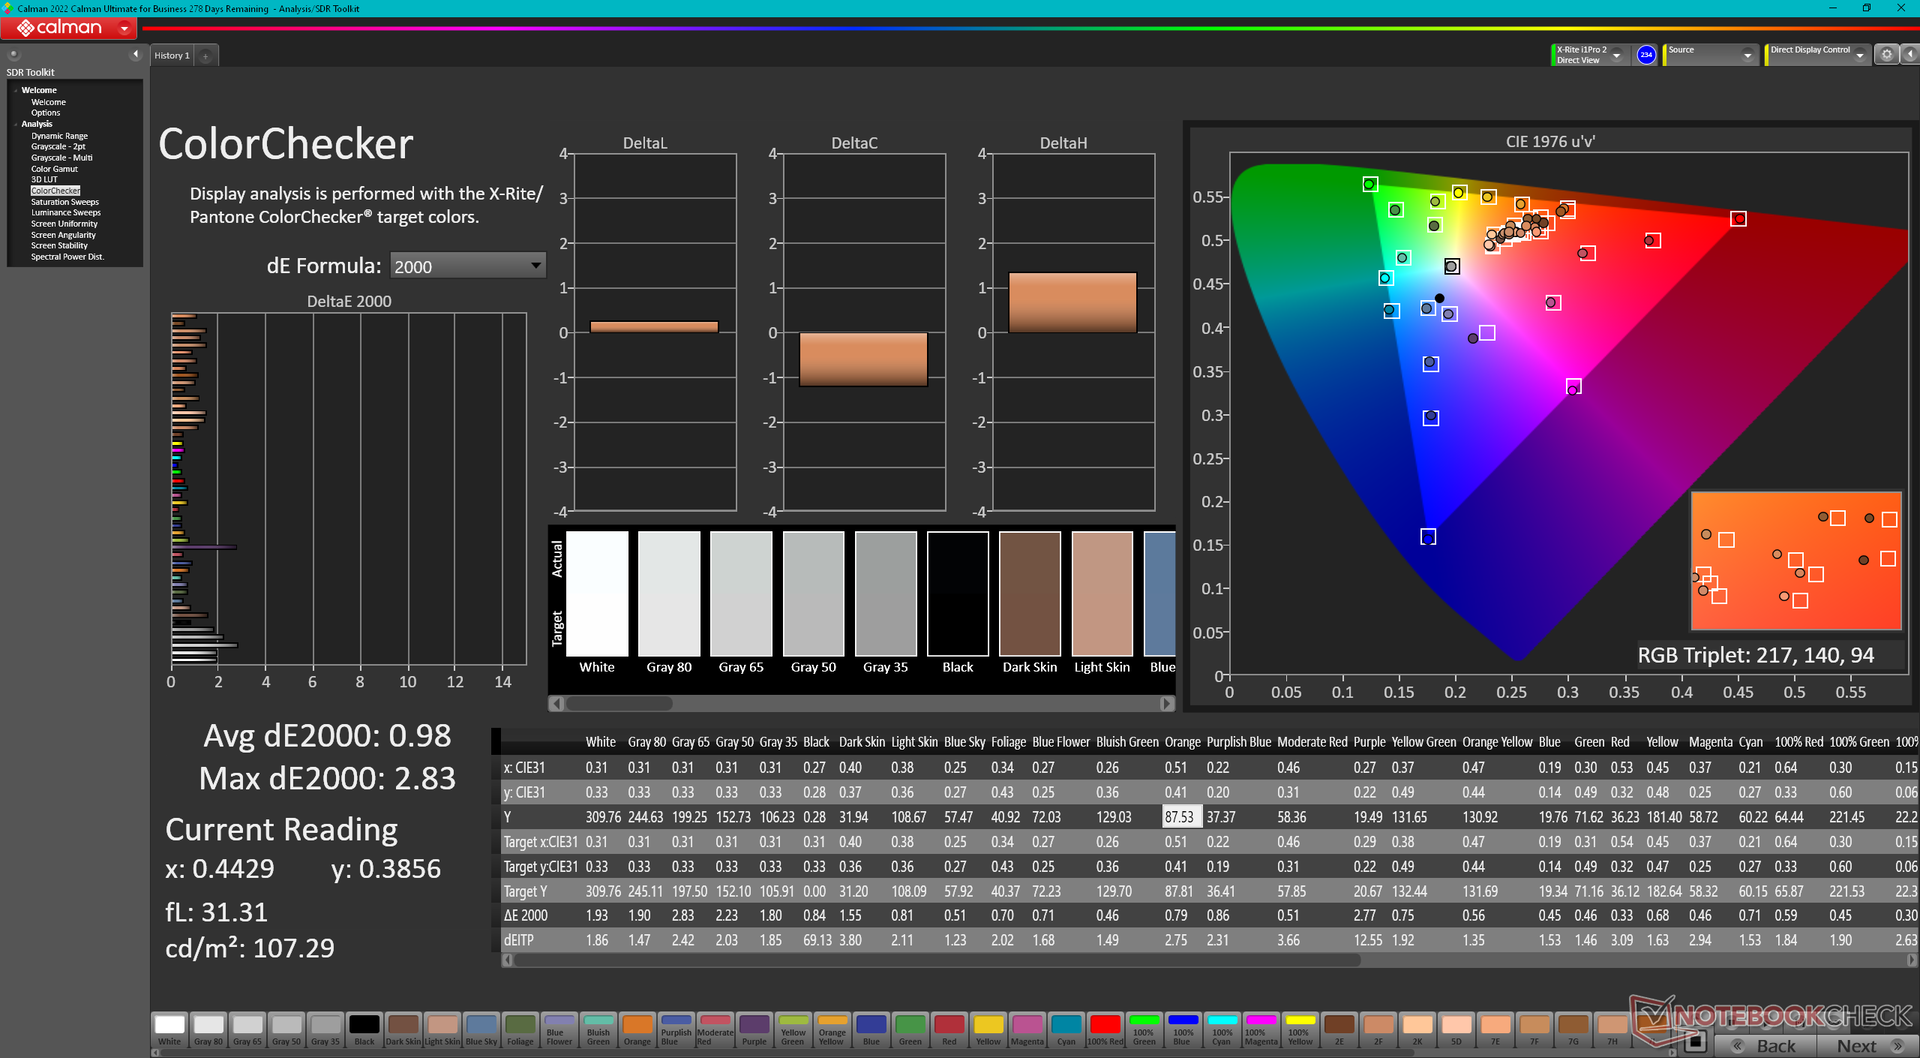
calibrated: 0.98
ΔE Greyscale Calman: 6.3 | ∀{0.09-98 Ø4.96}
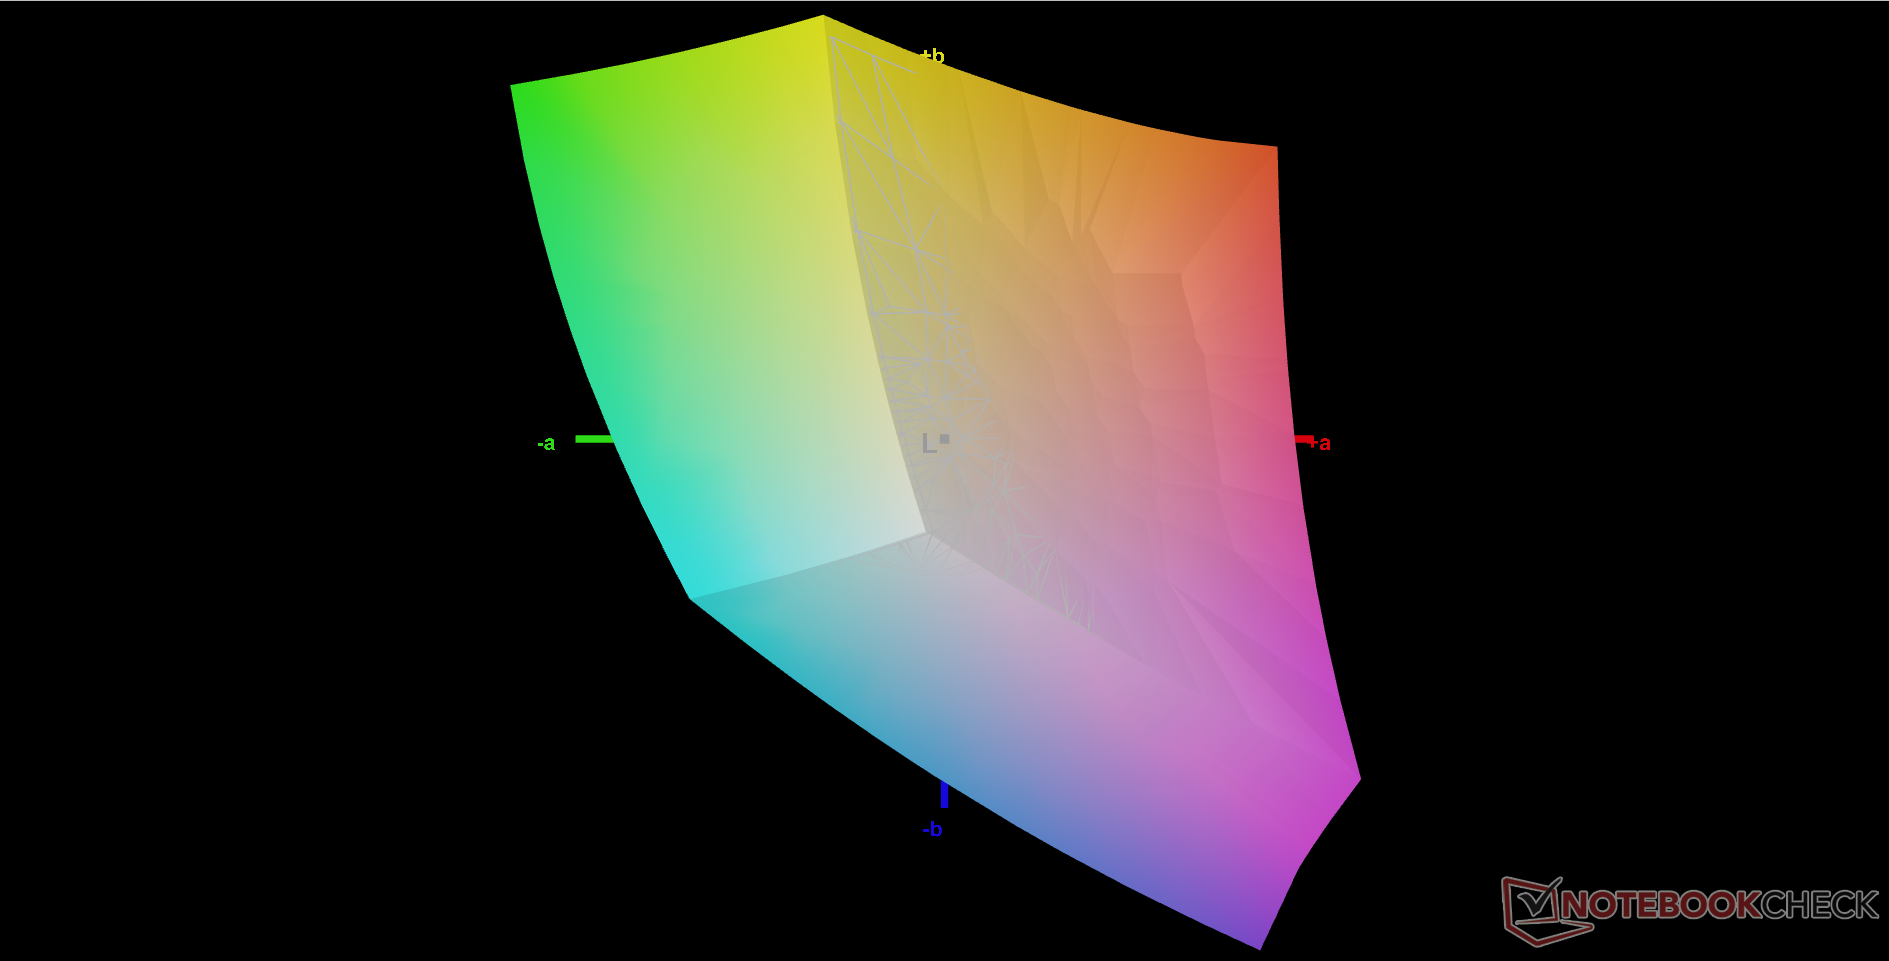
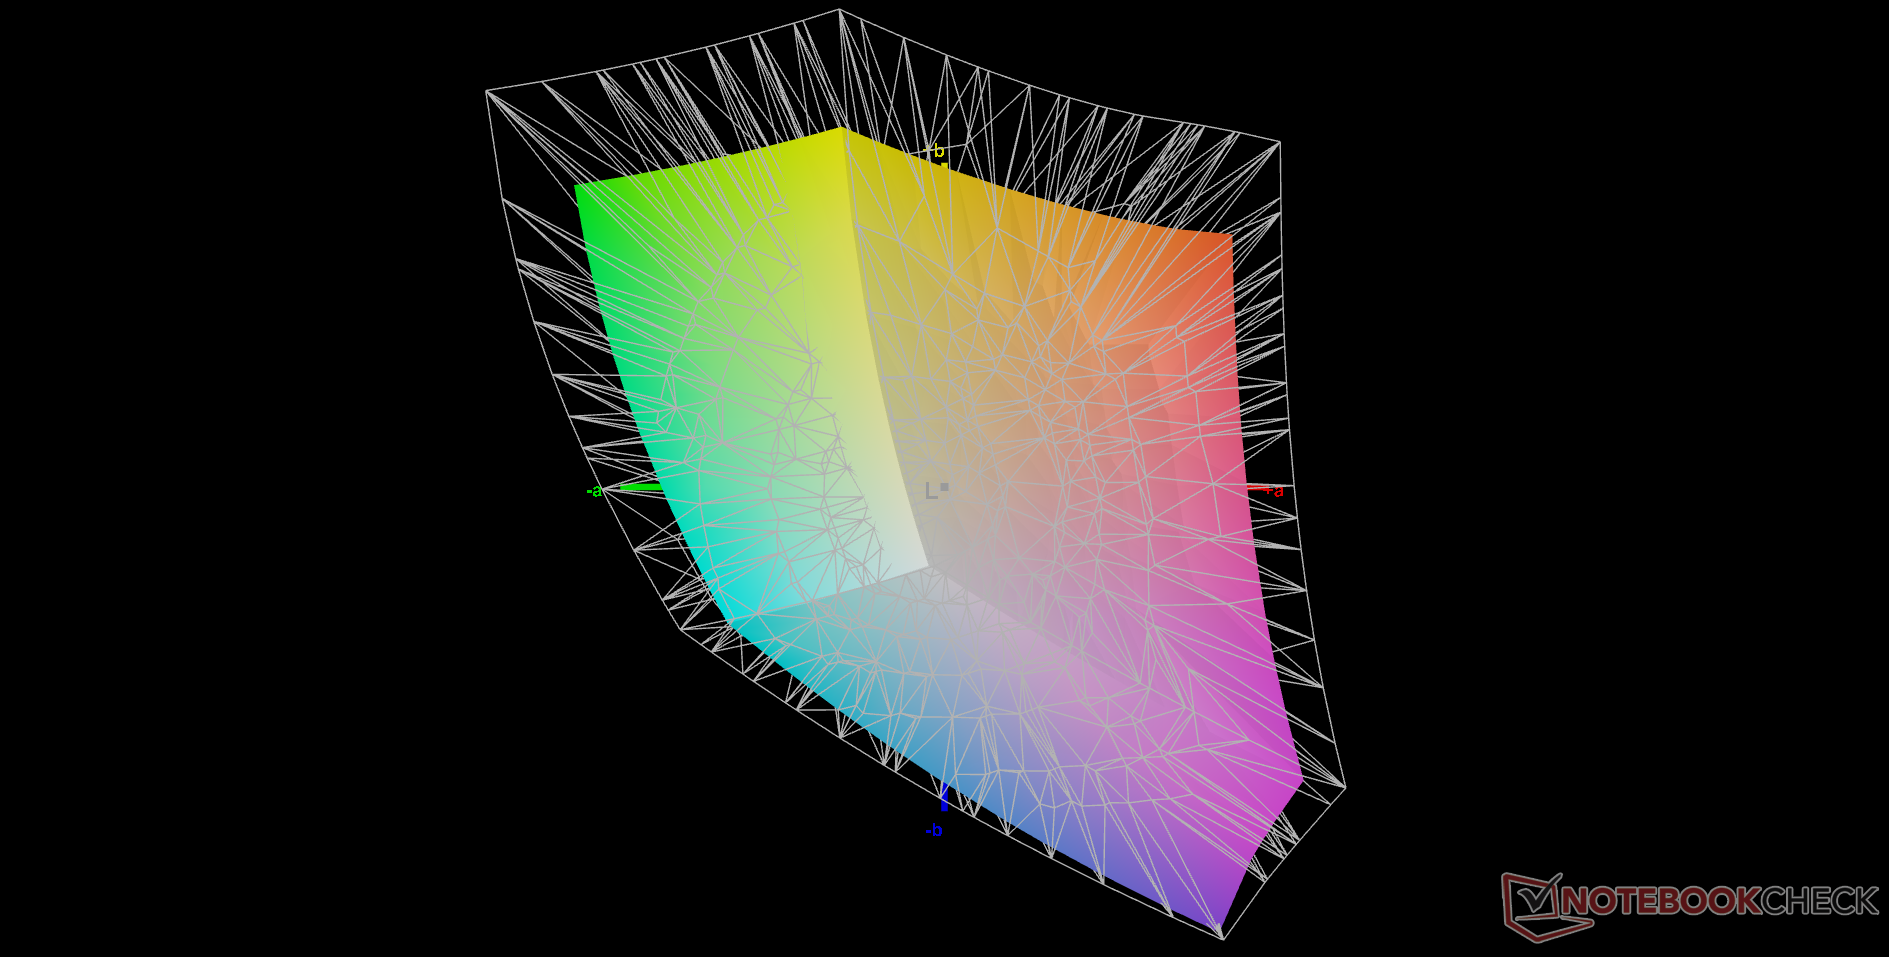
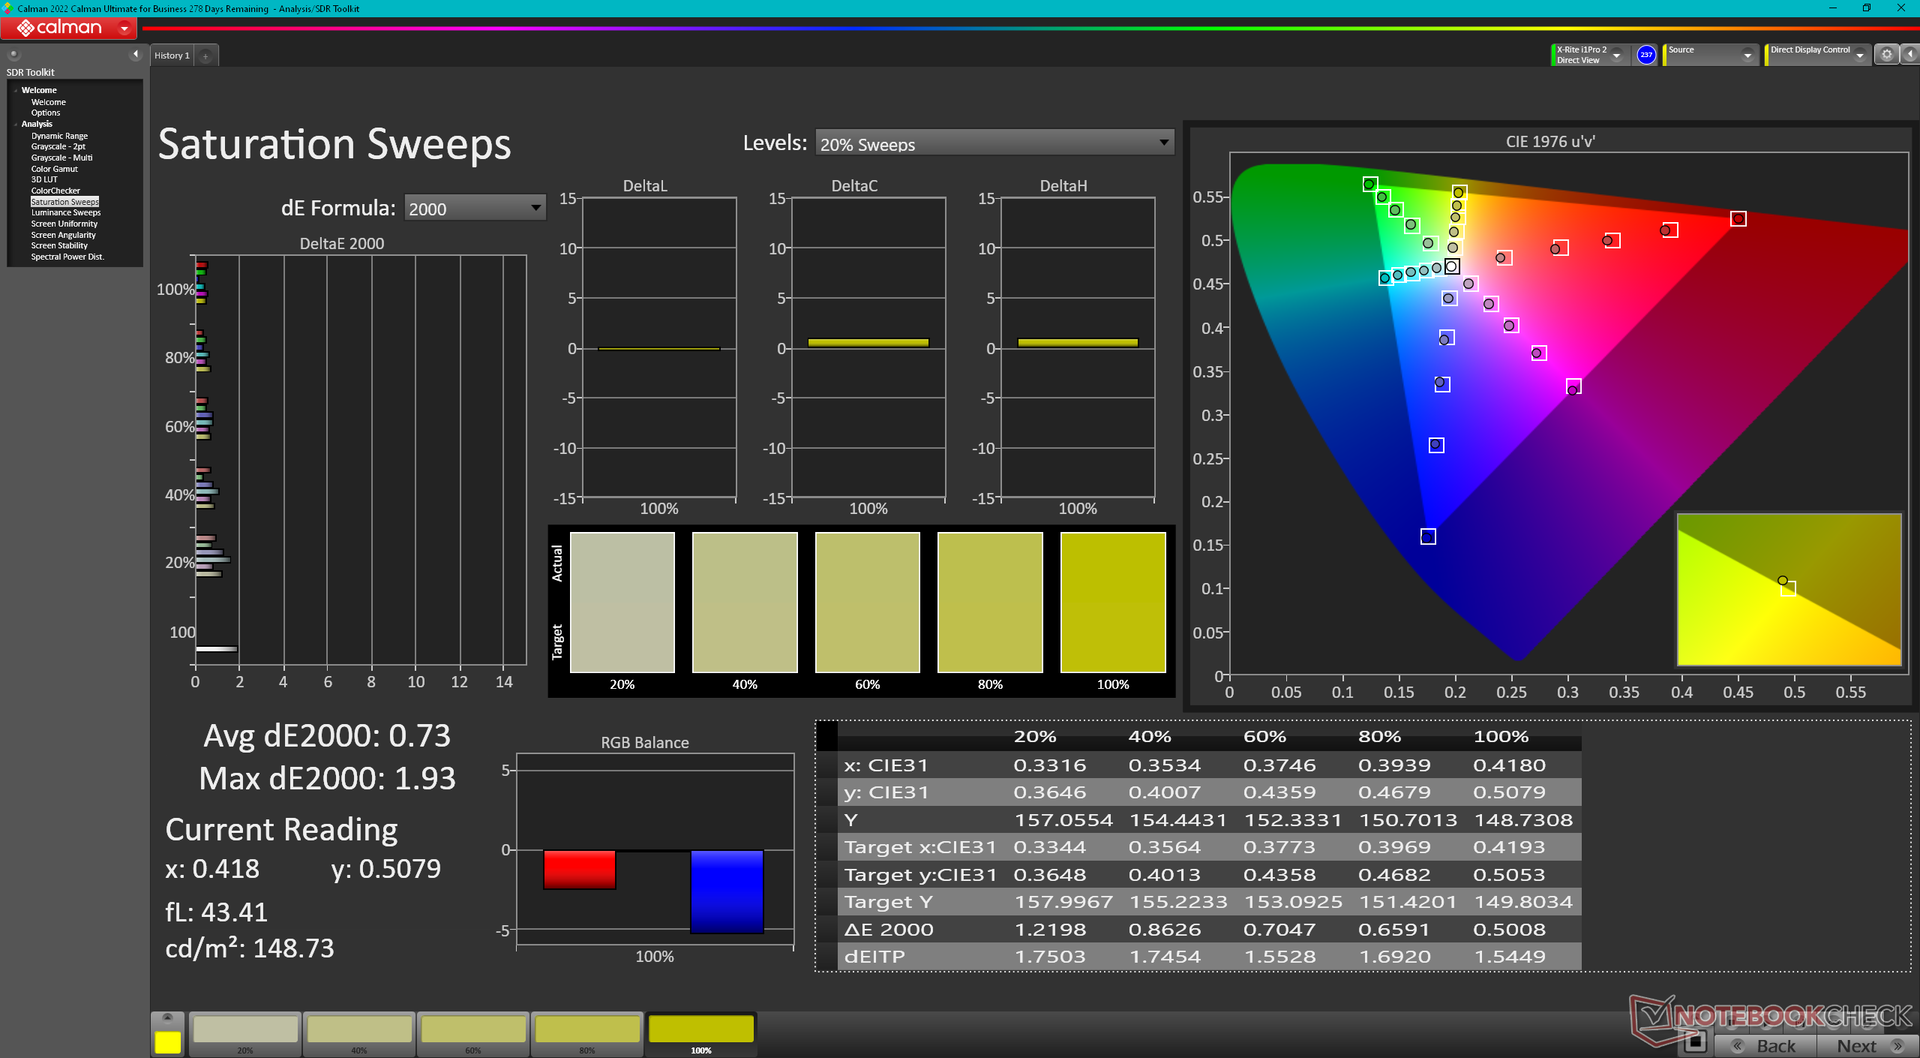
73.7% AdobeRGB 1998 (Argyll 3D)
99.9% sRGB (Argyll 3D)
71.9% Display P3 (Argyll 3D)
Gamma: 2.48
CCT: 6542 K
| MSI Pulse GL76 12UGK Sharp LQ173M1JW08, IPS, 1920x1080, 17.3" | Alienware m17 R5 (R9 6900HX, RX 6850M XT) AU Optronics AUODBA3, IPS, 3840x2160, 17" | Asus ROG Strix Scar 17 SE G733CX-LL014W NE173QHM-NZ2, IPS, 2560x1440, 17.3" | Acer Predator Helios 300 (i7-12700H, RTX 3070 Ti) BOE0A1A, IPS, 2560x1440, 17.3" | Razer Blade 17 Early 2022 AU Optronics B173ZAN06.9, IPS, 3840x2160, 17.3" | MSI Vector GP76 12UGS-434 AUO B173HAN05.4, IPS, 1920x1080, 17.3" | |
|---|---|---|---|---|---|---|
| Display | 18% | 17% | 17% | 19% | -3% | |
| Display P3 Coverage (%) | 71.9 | 97.2 35% | 97.1 35% | 96.8 35% | 99.4 38% | 70.09 -3% |
| sRGB Coverage (%) | 99.9 | 99.6 0% | 99.9 0% | 99.9 0% | 100 0% | 98.98 -1% |
| AdobeRGB 1998 Coverage (%) | 73.7 | 88.4 20% | 84.8 15% | 84.8 15% | 87.3 18% | 70.91 -4% |
| Response Times | -131% | -7% | -129% | -7% | 21% | |
| Response Time Grey 50% / Grey 80% * (ms) | 4.6 ? | 16.4 ? -257% | 5.7 ? -24% | 16.4 ? -257% | 7.5 ? -63% | 4 ? 13% |
| Response Time Black / White * (ms) | 11.2 ? | 11.6 ? -4% | 10.1 ? 10% | 11.2 ? -0% | 5.6 ? 50% | 8 ? 29% |
| PWM Frequency (Hz) | ||||||
| Screen | -43% | 28% | -12% | 34% | 11% | |
| Brightness middle (cd/m²) | 337.7 | 484 43% | 320 -5% | 366 8% | 503 49% | 274 -19% |
| Brightness (cd/m²) | 331 | 449 36% | 303 -8% | 340 3% | 486 47% | 264 -20% |
| Brightness Distribution (%) | 82 | 87 6% | 87 6% | 85 4% | 84 2% | 87 6% |
| Black Level * (cd/m²) | 0.31 | 0.55 -77% | 0.3 3% | 0.31 -0% | 0.44 -42% | 0.25 19% |
| Contrast (:1) | 1089 | 880 -19% | 1067 -2% | 1181 8% | 1143 5% | 1096 1% |
| Colorchecker dE 2000 * | 4.12 | 4.8 -17% | 1.1 73% | 3.56 14% | 1.08 74% | 2.53 39% |
| Colorchecker dE 2000 max. * | 8.89 | 7.48 16% | 2.7 70% | 5.66 36% | 4.54 49% | 6.76 24% |
| Colorchecker dE 2000 calibrated * | 0.98 | 4.74 -384% | 3.31 -238% | 0.6 39% | 0.98 -0% | |
| Greyscale dE 2000 * | 6.3 | 5.5 13% | 1.1 83% | 2.84 55% | 1.3 79% | 3.49 45% |
| Gamma | 2.48 89% | 2.42 91% | 2.13 103% | 2.29 96% | 2.151 102% | 2.31 95% |
| CCT | 6542 99% | 6148 106% | 6599 98% | 6835 95% | 6541 99% | 6714 97% |
| Média Total (Programa/Configurações) | -52% /
-42% | 13% /
20% | -41% /
-23% | 15% /
25% | 10% /
9% |
* ... menor é melhor
O display não é calibrado fora da caixa. Os valores médios de escala de cinza e cor DeltaE melhorariam significativamente de 6,3 e 4,12 para apenas 1,4 e 0,98, respectivamente, após uma calibração adequada com um colorímetro X-Rite. Recomendamos aplicar nosso perfil de ICM acima para melhor explorar a cobertura completa de sRGB do painel.
Exibir tempos de resposta
| ↔ Tempo de resposta preto para branco | ||
|---|---|---|
| 11.2 ms ... ascensão ↗ e queda ↘ combinadas | ↗ 6.8 ms ascensão | 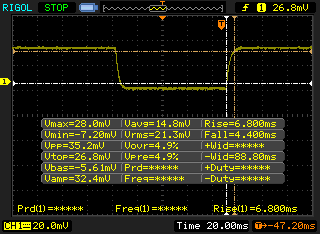 |
| ↘ 4.4 ms queda | ||
| A tela mostra boas taxas de resposta em nossos testes, mas pode ser muito lenta para jogadores competitivos. Em comparação, todos os dispositivos testados variam de 0.1 (mínimo) a 240 (máximo) ms. » 30 % de todos os dispositivos são melhores. Isso significa que o tempo de resposta medido é melhor que a média de todos os dispositivos testados (19.8 ms). | ||
| ↔ Tempo de resposta 50% cinza a 80% cinza | ||
| 4.6 ms ... ascensão ↗ e queda ↘ combinadas | ↗ 2.2 ms ascensão | 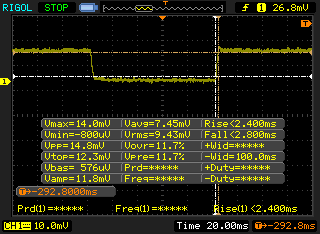 |
| ↘ 2.4 ms queda | ||
| A tela mostra taxas de resposta muito rápidas em nossos testes e deve ser muito adequada para jogos em ritmo acelerado. Em comparação, todos os dispositivos testados variam de 0.165 (mínimo) a 636 (máximo) ms. » 16 % de todos os dispositivos são melhores. Isso significa que o tempo de resposta medido é melhor que a média de todos os dispositivos testados (31 ms). | ||
Cintilação da tela / PWM (modulação por largura de pulso)
| Tela tremeluzindo / PWM não detectado | 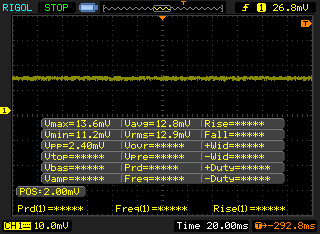 | ||
[pwm_comparison] Em comparação: 52 % de todos os dispositivos testados não usam PWM para escurecer a tela. Se PWM foi detectado, uma média de 7754 (mínimo: 5 - máximo: 343500) Hz foi medida. | |||
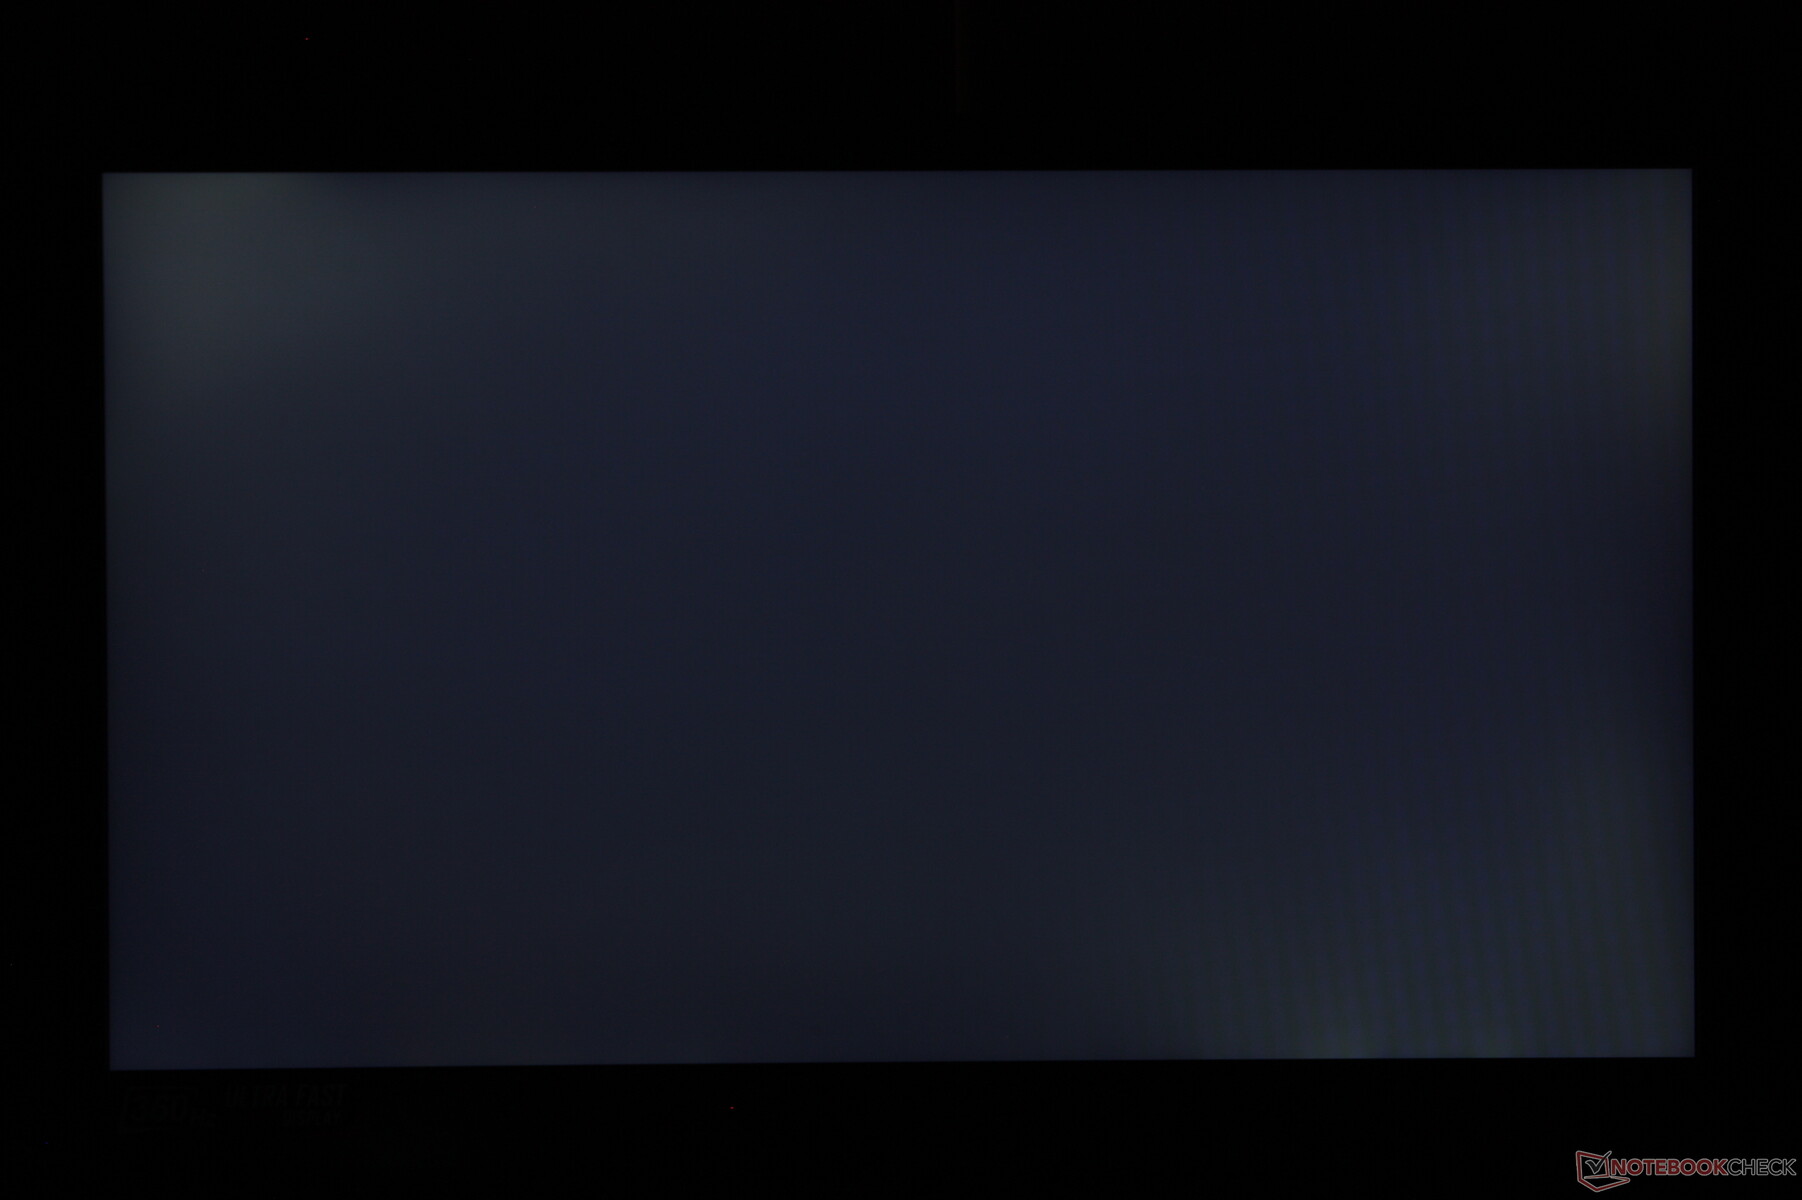
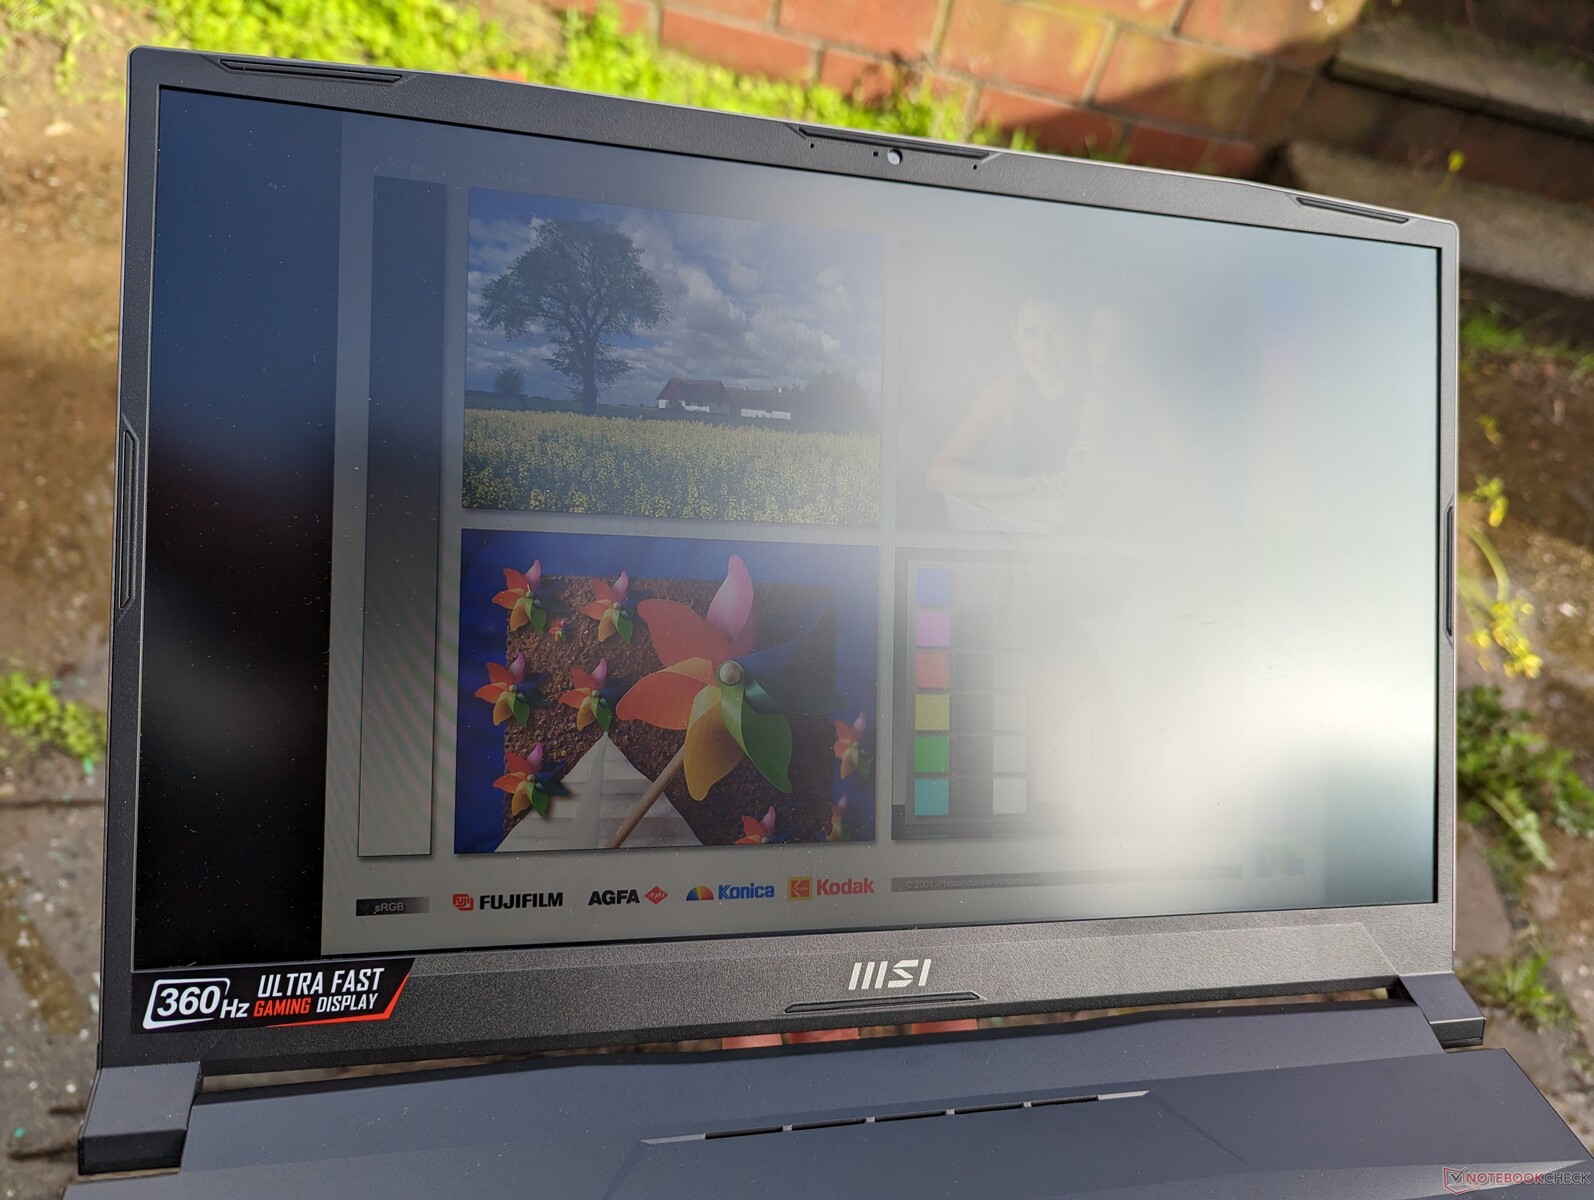
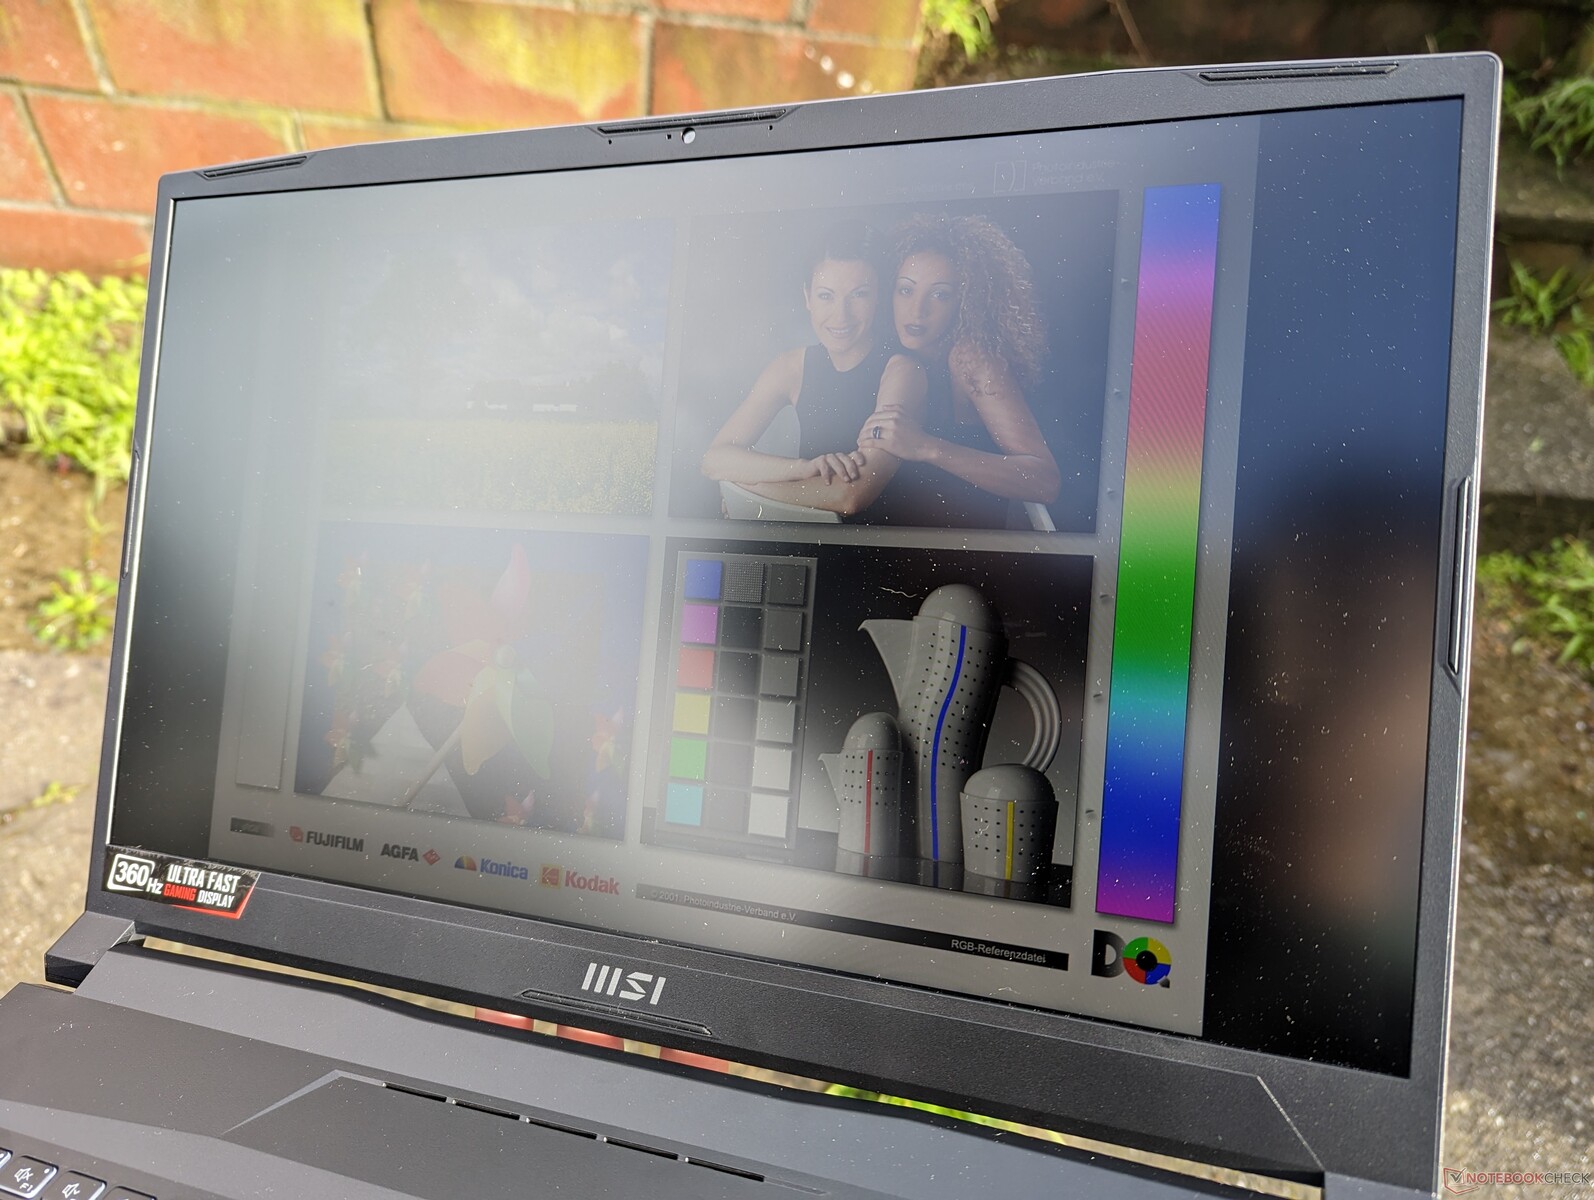
A tela mate é brilhante o suficiente para ser usada sob sombra, mas de outra forma não é projetada para condições externas mais brilhantes. Alguns laptops para jogos, tais como o Lâmina Razer 17 OLEDos painéis de 500-nit mais brilhantes para facilitar a leitura ao ar livre.
Desempenho - Intel 12th Gen Alder Lake-H
Condições de teste
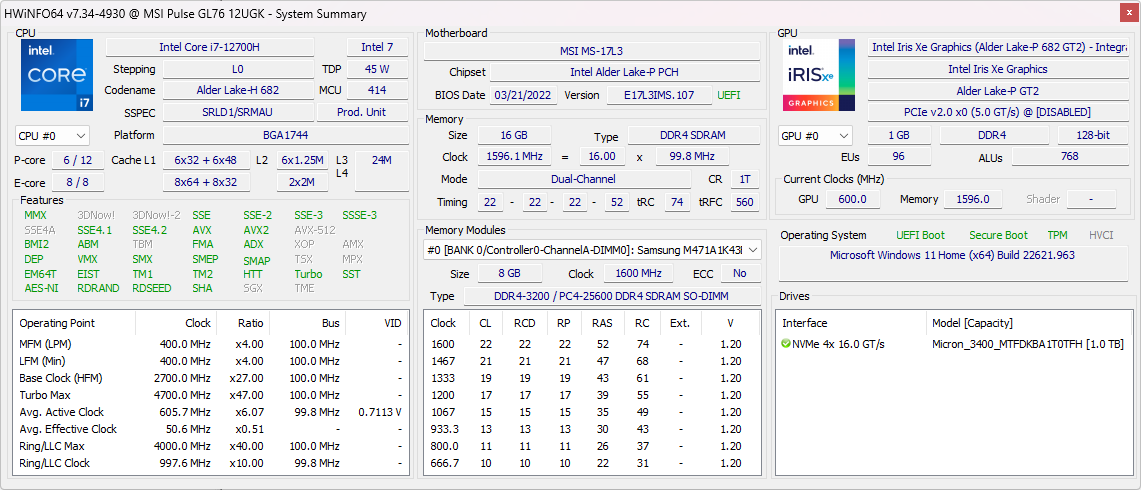
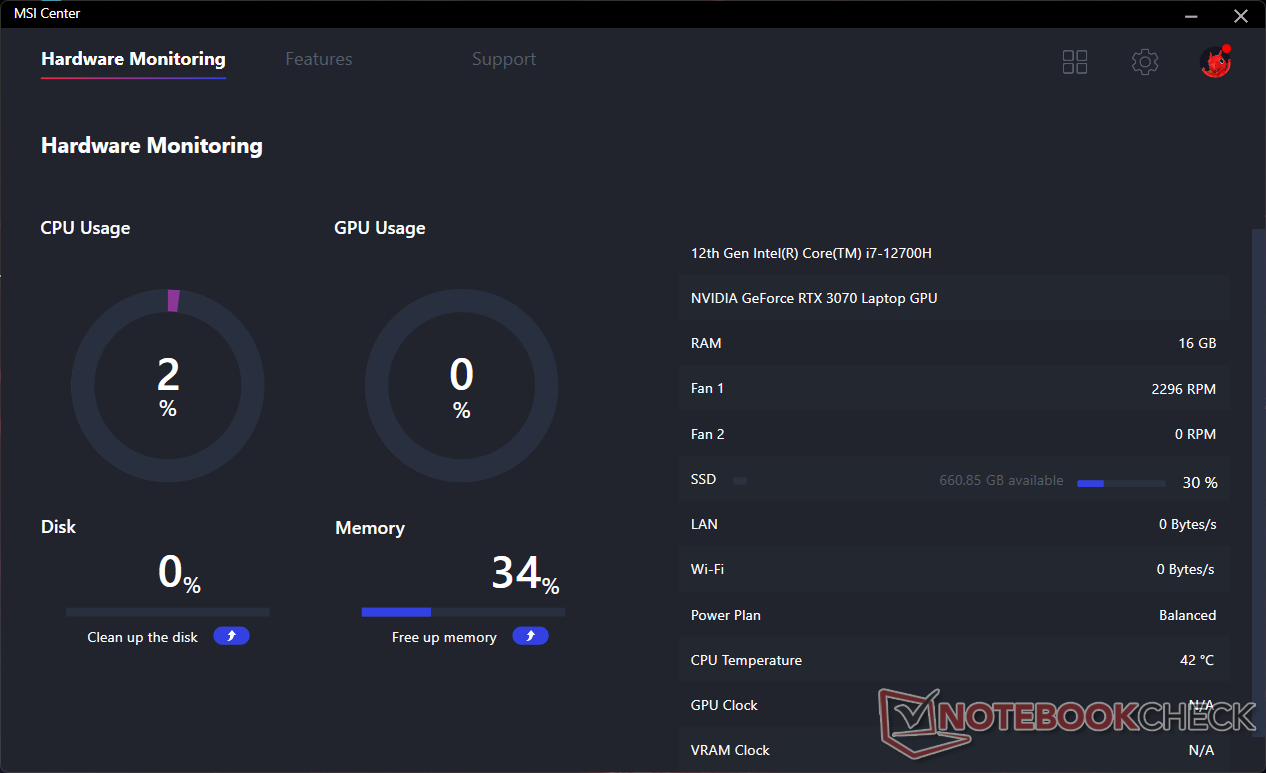
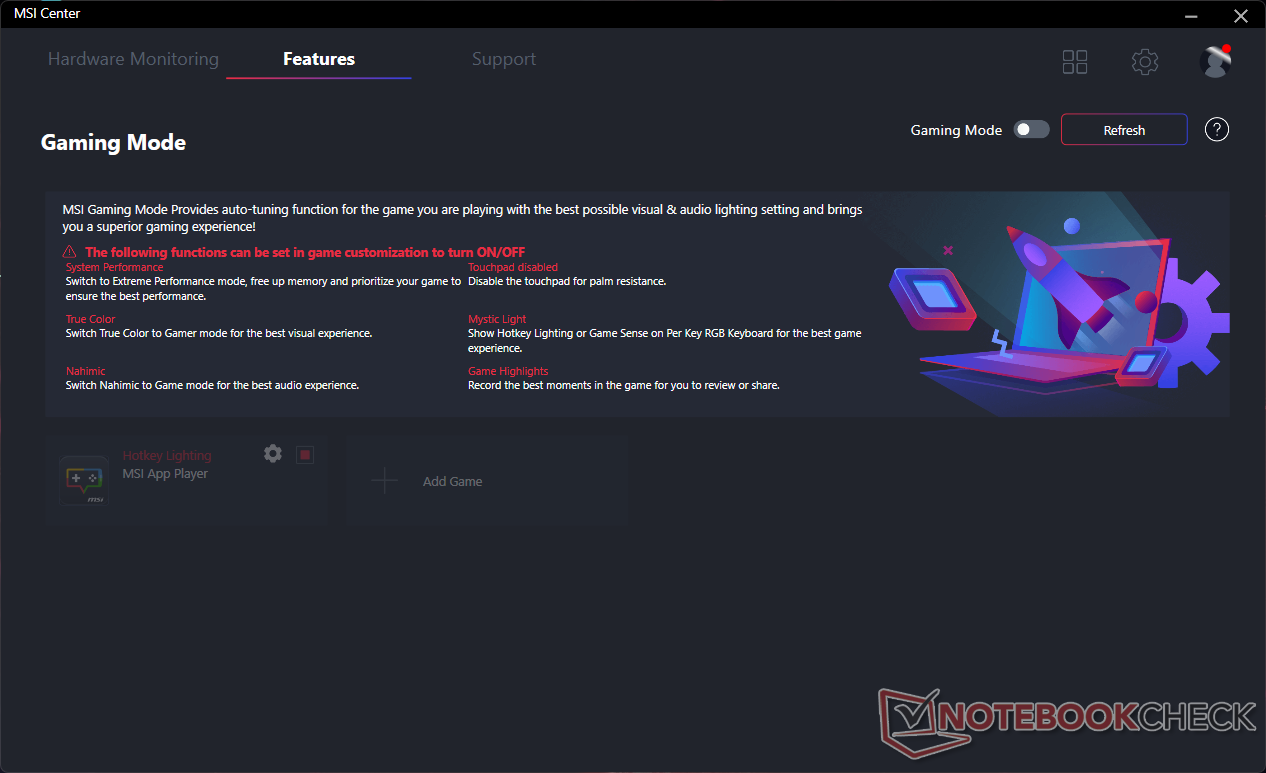
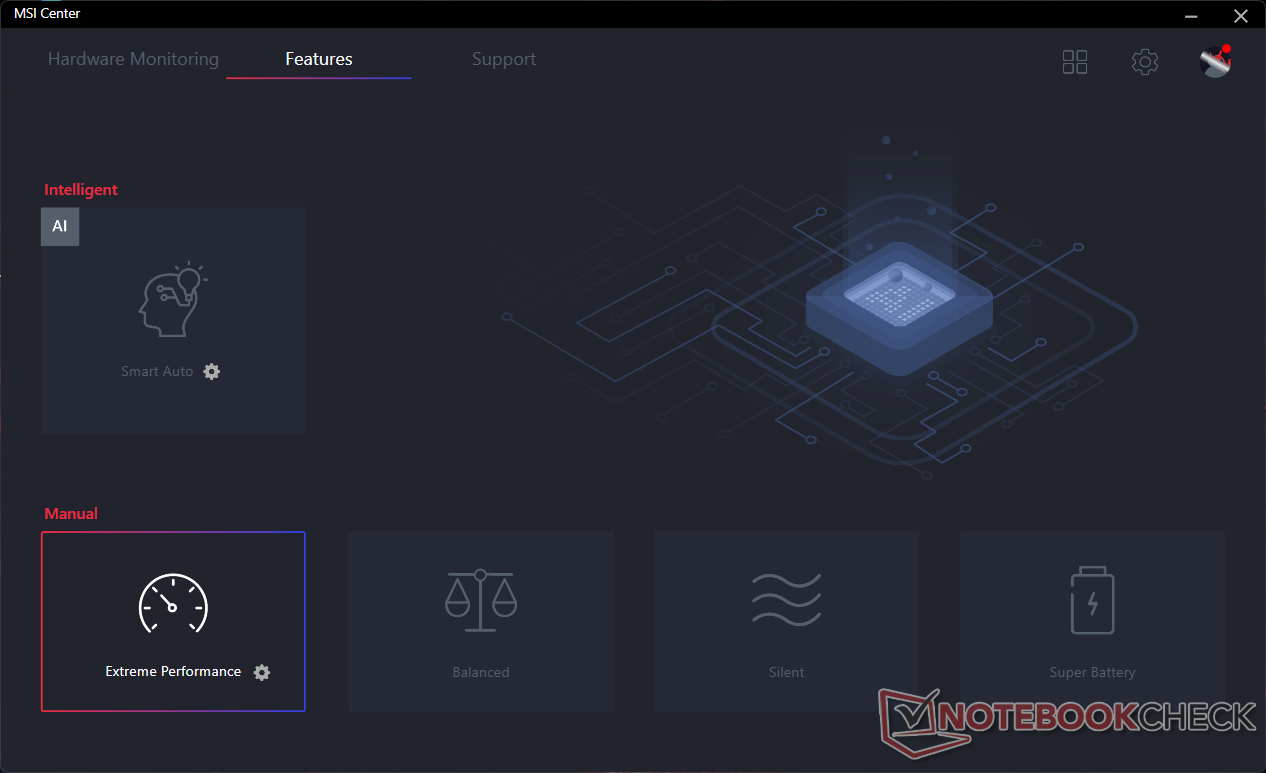
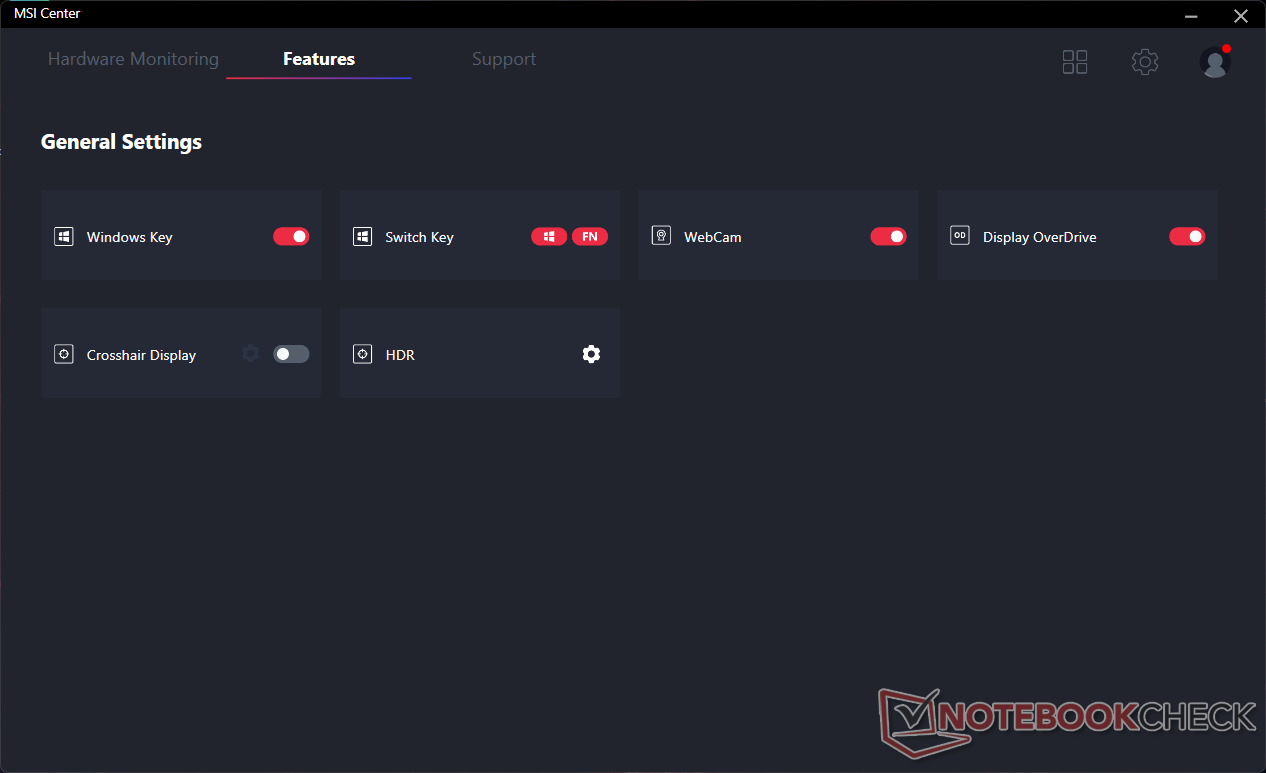
Configuramos nossa unidade para o modo Performance via Windows e modo Performance Extrema via MSI Center com o dGPU ativo antes de executar quaisquer benchmarks de performance abaixo. O modo ventilador também foi ajustado para Auto. Os usuários devem se familiarizar com o MSI Center, pois ele é o centro de controle para atualizações específicas da MSI, perfis de desempenho, monitoramento de hardware e muito mais, conforme mostrado pelas telas abaixo.
Não há nenhum suporte Advanced Optimus ou MUX na série GL76.
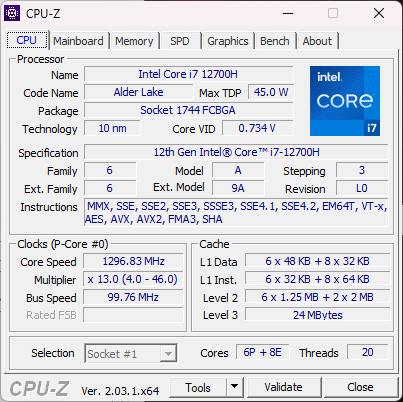
Processador
O desempenho da CPU é excelente com resultados multi-tarefa que são cerca de 10% mais rápidos do que a média do laptop em nosso banco de dados equipado com o mesmo Núcleo i7-12700H CPU. Em geral, ela está a apenas alguns pontos percentuais da Núcleo i9-12900H no muito mais caro Alienware x15 R2.
Optando pela parte de baixo Núcleo i5-12500H em vez de nosso Core i7, resultaria em um déficit de desempenho multi-tarefa de cerca de 15%.
Cinebench R15 Multi Loop
Cinebench R20: CPU (Multi Core) | CPU (Single Core)
Cinebench R23: Multi Core | Single Core
Cinebench R15: CPU Multi 64Bit | CPU Single 64Bit
Blender: v2.79 BMW27 CPU
7-Zip 18.03: 7z b 4 | 7z b 4 -mmt1
Geekbench 5.5: Multi-Core | Single-Core
HWBOT x265 Benchmark v2.2: 4k Preset
LibreOffice : 20 Documents To PDF
R Benchmark 2.5: Overall mean
| HWBOT x265 Benchmark v2.2 / 4k Preset | |
| MSI GE67 HX 12UGS | |
| Asus ROG Strix Scar 17 SE G733CX-LL014W | |
| Alienware x15 R2 P111F | |
| MSI Pulse GL76 12UGK | |
| Razer Blade 15 2022 | |
| Alienware m17 R5 (R9 6900HX, RX 6850M XT) | |
| Média Intel Core i7-12700H (4.67 - 21.8, n=64) | |
| HP Omen 16-n0033dx | |
| Lenovo IdeaPad Gaming 3 15IAH7 | |
| MSI GE76 Raider 10UH | |
| Schenker XMG Apex 15 Max | |
* ... menor é melhor
AIDA64: FP32 Ray-Trace | FPU Julia | CPU SHA3 | CPU Queen | FPU SinJulia | FPU Mandel | CPU AES | CPU ZLib | FP64 Ray-Trace | CPU PhotoWorxx
Desempenho do sistema
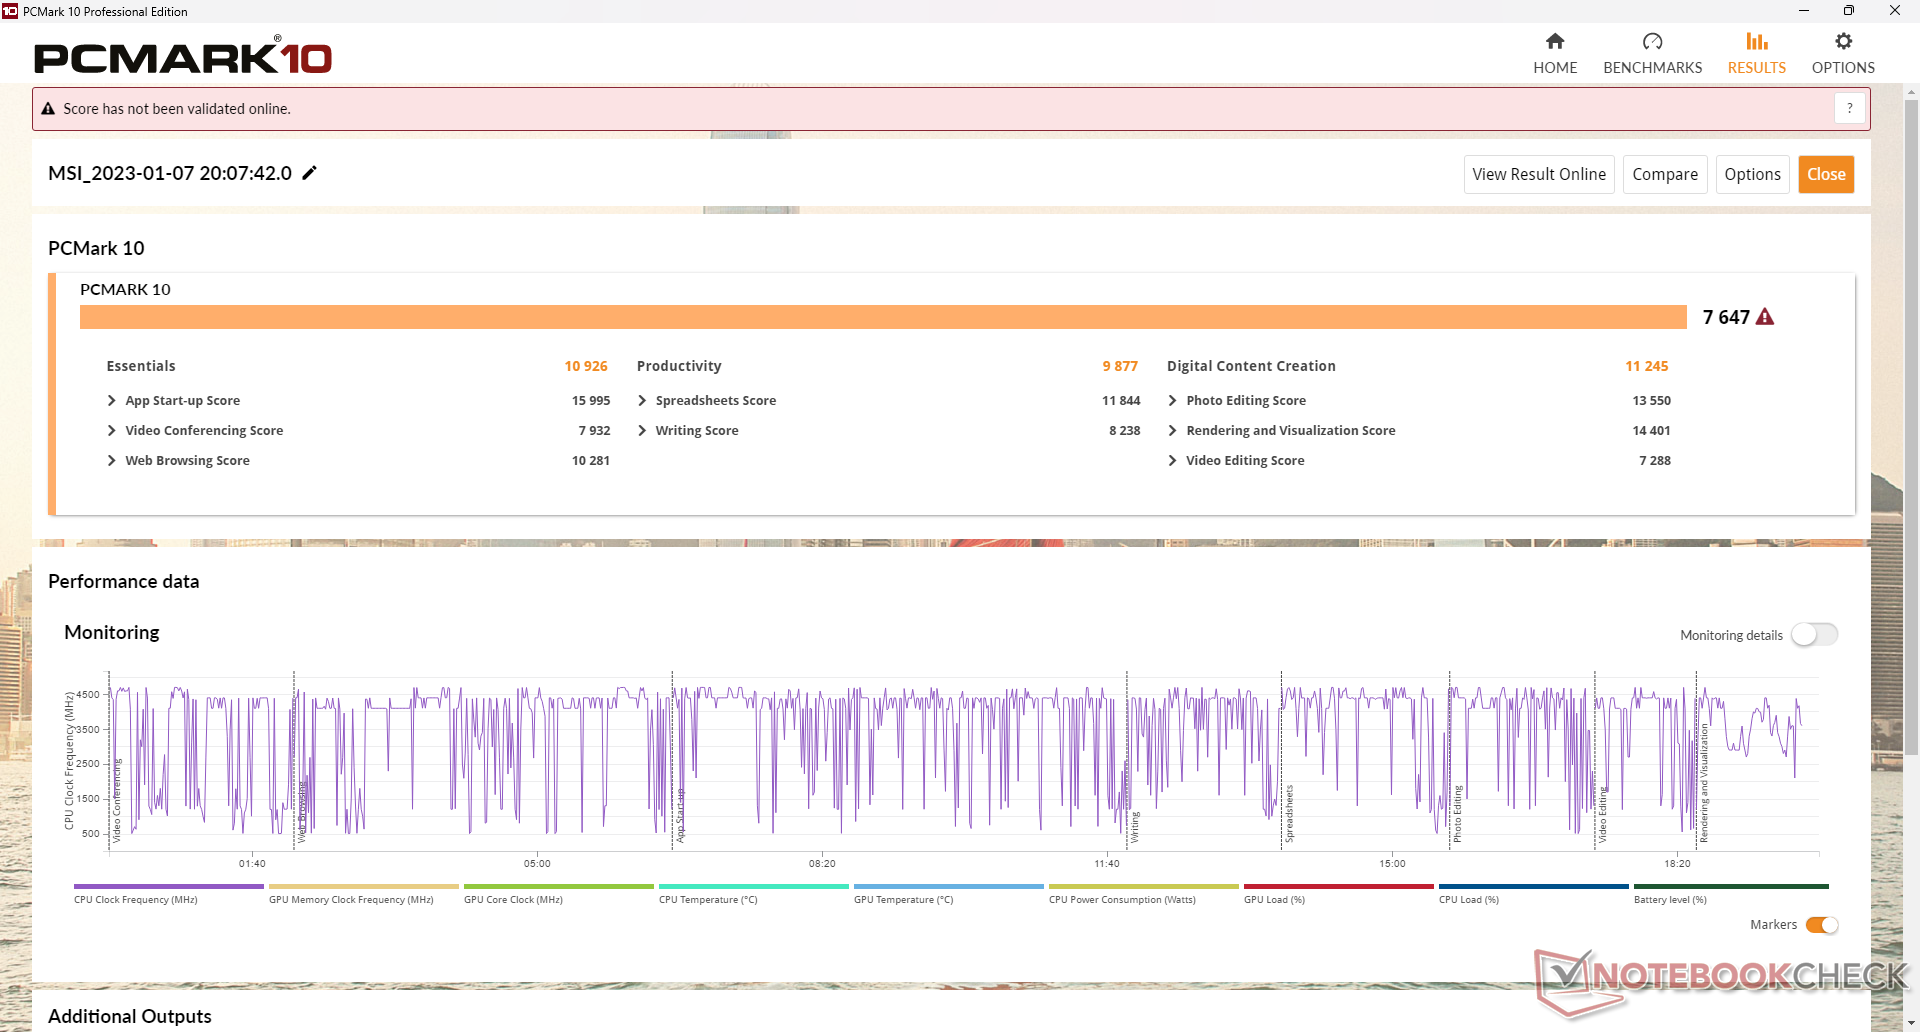
Os resultados da PCMark são excelentes e comparáveis aos dos laptops para jogos de alta tecnologia como oAsus ROG Strix Scar 17. Em outras palavras, a GL76 pode oferecer quase o mesmo desempenho que uma alternativa de bandeira, mas por muito menos dinheiro.
CrossMark: Overall | Productivity | Creativity | Responsiveness
| PCMark 10 / Score | |
| MSI Vector GP76 12UGS-434 | |
| Acer Predator Helios 300 (i7-12700H, RTX 3070 Ti) | |
| MSI Pulse GL76 12UGK | |
| Média Intel Core i7-12700H, NVIDIA GeForce RTX 3070 Laptop GPU (7082 - 7647, n=2) | |
| Alienware m17 R5 (R9 6900HX, RX 6850M XT) | |
| Asus ROG Strix Scar 17 SE G733CX-LL014W | |
| Razer Blade 17 Early 2022 | |
| PCMark 10 / Essentials | |
| MSI Pulse GL76 12UGK | |
| Acer Predator Helios 300 (i7-12700H, RTX 3070 Ti) | |
| MSI Vector GP76 12UGS-434 | |
| Média Intel Core i7-12700H, NVIDIA GeForce RTX 3070 Laptop GPU (10076 - 10926, n=2) | |
| Asus ROG Strix Scar 17 SE G733CX-LL014W | |
| Razer Blade 17 Early 2022 | |
| Alienware m17 R5 (R9 6900HX, RX 6850M XT) | |
| PCMark 10 / Productivity | |
| MSI Vector GP76 12UGS-434 | |
| Acer Predator Helios 300 (i7-12700H, RTX 3070 Ti) | |
| MSI Pulse GL76 12UGK | |
| Asus ROG Strix Scar 17 SE G733CX-LL014W | |
| Média Intel Core i7-12700H, NVIDIA GeForce RTX 3070 Laptop GPU (9460 - 9877, n=2) | |
| Razer Blade 17 Early 2022 | |
| Alienware m17 R5 (R9 6900HX, RX 6850M XT) | |
| PCMark 10 / Digital Content Creation | |
| Acer Predator Helios 300 (i7-12700H, RTX 3070 Ti) | |
| MSI Vector GP76 12UGS-434 | |
| Alienware m17 R5 (R9 6900HX, RX 6850M XT) | |
| MSI Pulse GL76 12UGK | |
| Média Intel Core i7-12700H, NVIDIA GeForce RTX 3070 Laptop GPU (10113 - 11245, n=2) | |
| Razer Blade 17 Early 2022 | |
| Asus ROG Strix Scar 17 SE G733CX-LL014W | |
| CrossMark / Overall | |
| Asus ROG Strix Scar 17 SE G733CX-LL014W | |
| MSI Vector GP76 12UGS-434 | |
| Média Intel Core i7-12700H, NVIDIA GeForce RTX 3070 Laptop GPU (1844 - 2003, n=2) | |
| Acer Predator Helios 300 (i7-12700H, RTX 3070 Ti) | |
| MSI Pulse GL76 12UGK | |
| Razer Blade 17 Early 2022 | |
| Alienware m17 R5 (R9 6900HX, RX 6850M XT) | |
| CrossMark / Productivity | |
| Asus ROG Strix Scar 17 SE G733CX-LL014W | |
| MSI Vector GP76 12UGS-434 | |
| Média Intel Core i7-12700H, NVIDIA GeForce RTX 3070 Laptop GPU (1785 - 1971, n=2) | |
| MSI Pulse GL76 12UGK | |
| Acer Predator Helios 300 (i7-12700H, RTX 3070 Ti) | |
| Razer Blade 17 Early 2022 | |
| Alienware m17 R5 (R9 6900HX, RX 6850M XT) | |
| CrossMark / Creativity | |
| Asus ROG Strix Scar 17 SE G733CX-LL014W | |
| Acer Predator Helios 300 (i7-12700H, RTX 3070 Ti) | |
| Média Intel Core i7-12700H, NVIDIA GeForce RTX 3070 Laptop GPU (1912 - 1979, n=2) | |
| MSI Vector GP76 12UGS-434 | |
| MSI Pulse GL76 12UGK | |
| Razer Blade 17 Early 2022 | |
| Alienware m17 R5 (R9 6900HX, RX 6850M XT) | |
| CrossMark / Responsiveness | |
| MSI Vector GP76 12UGS-434 | |
| Média Intel Core i7-12700H, NVIDIA GeForce RTX 3070 Laptop GPU (1824 - 2182, n=2) | |
| Asus ROG Strix Scar 17 SE G733CX-LL014W | |
| MSI Pulse GL76 12UGK | |
| Acer Predator Helios 300 (i7-12700H, RTX 3070 Ti) | |
| Razer Blade 17 Early 2022 | |
| Alienware m17 R5 (R9 6900HX, RX 6850M XT) | |
| PCMark 10 Score | 7647 pontos | |
Ajuda | ||
| AIDA64 / Memory Latency | |
| Alienware m17 R5 (R9 6900HX, RX 6850M XT) | |
| MSI Pulse GL76 12UGK | |
| MSI Vector GP76 12UGS-434 | |
| Acer Predator Helios 300 (i7-12700H, RTX 3070 Ti) | |
| Asus ROG Strix Scar 17 SE G733CX-LL014W | |
| Média Intel Core i7-12700H (76.2 - 133.9, n=62) | |
* ... menor é melhor
Latência do DPC
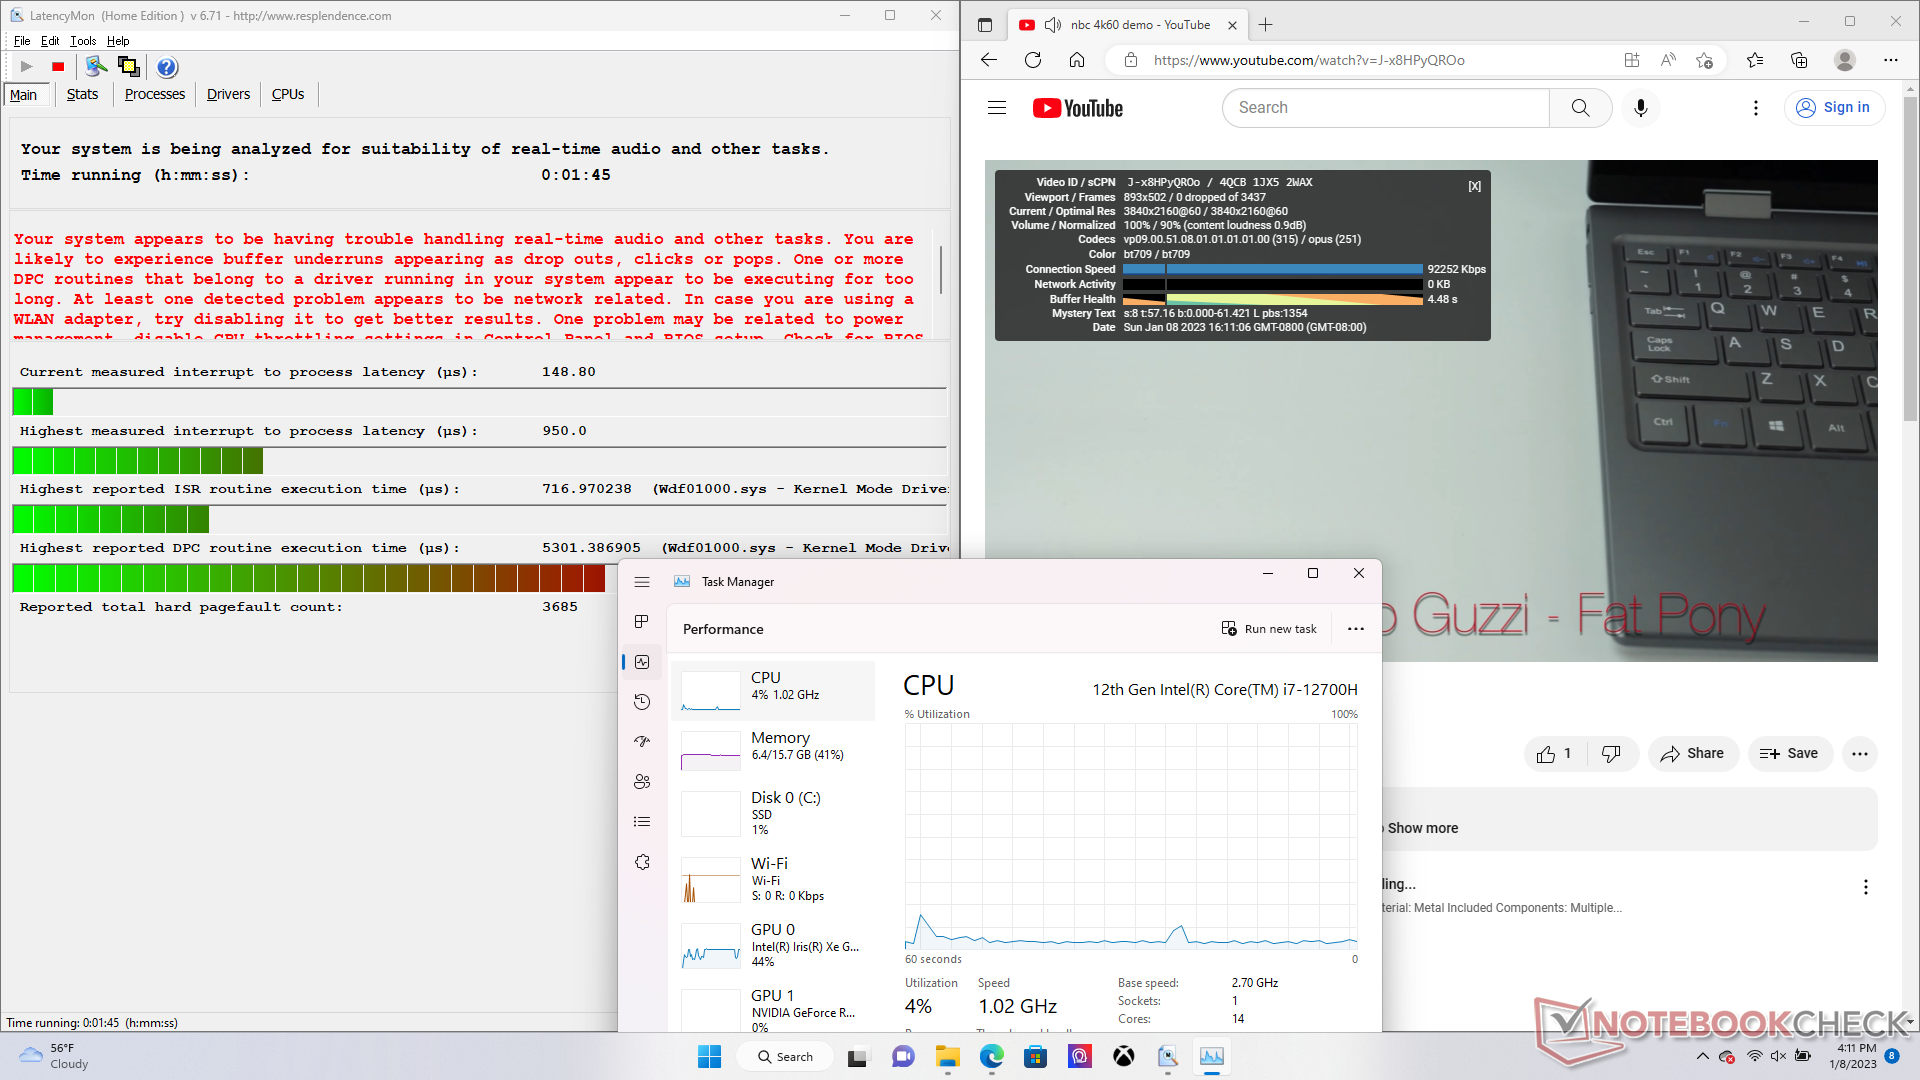
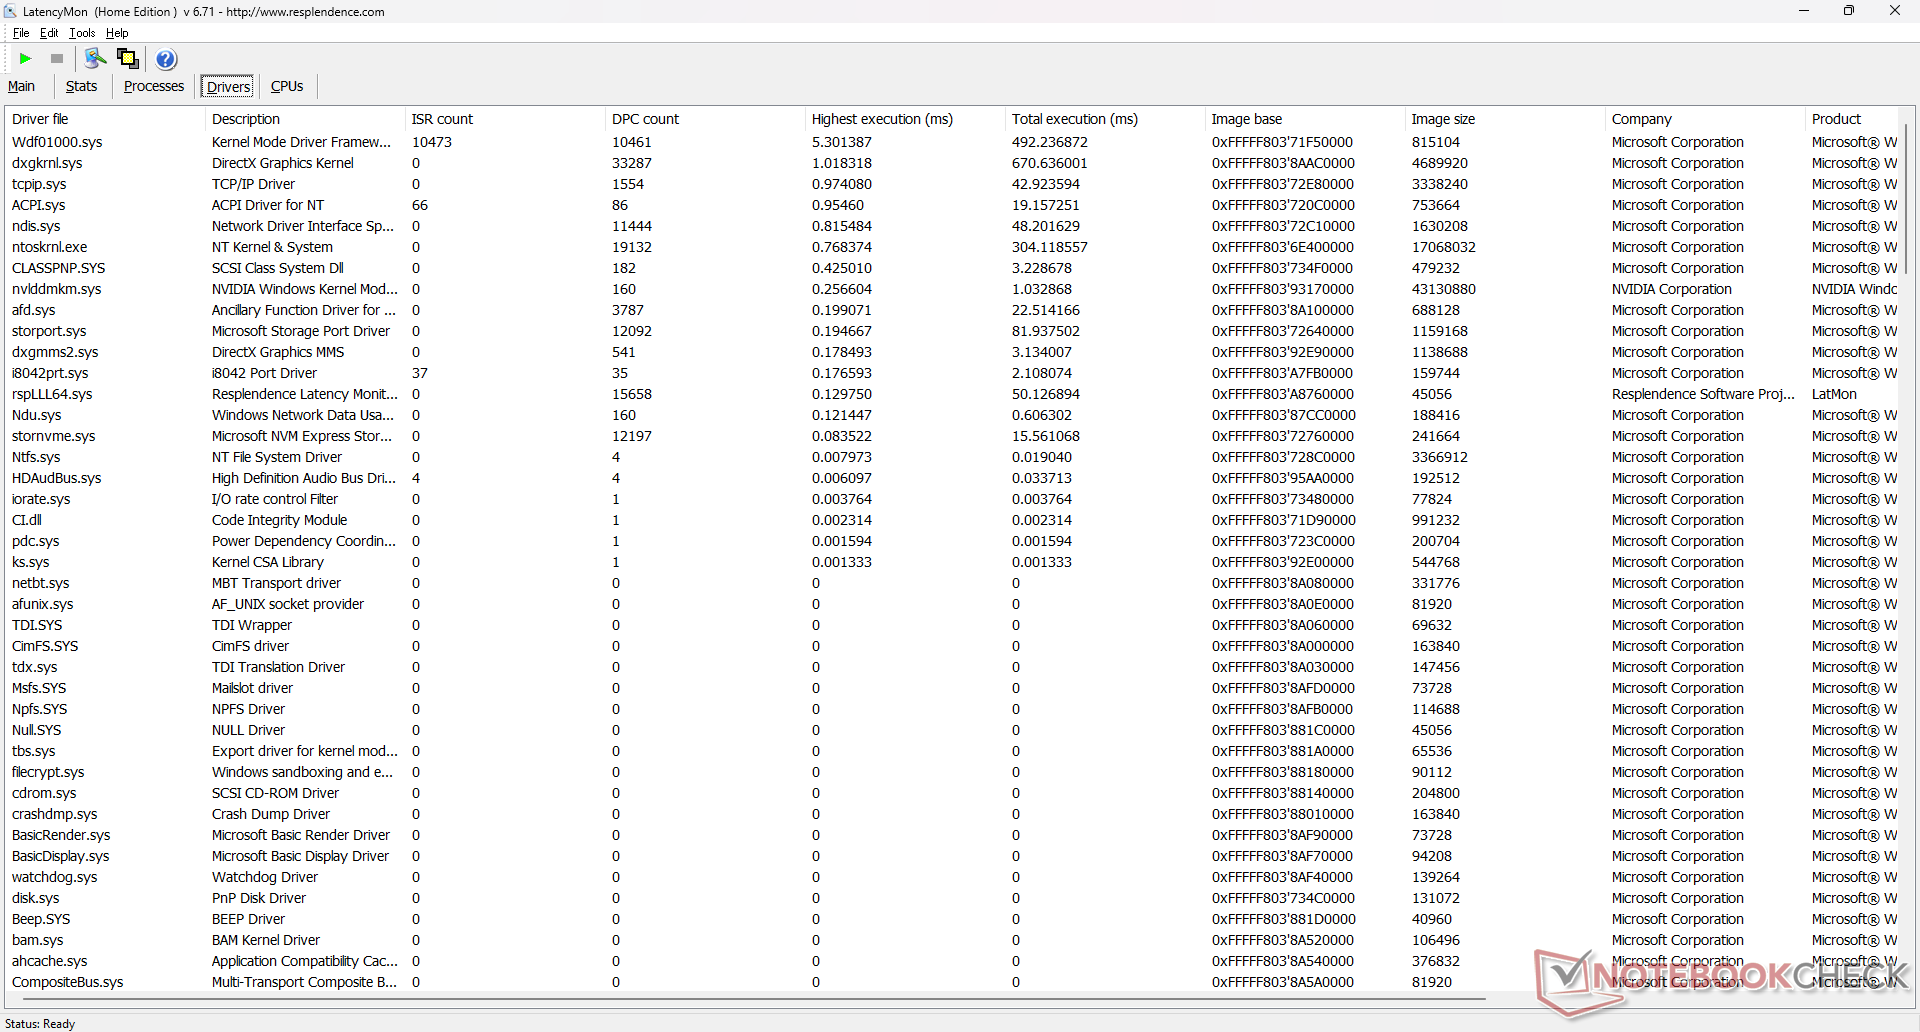
LatencyMon não revela nenhum problema de DPC ao abrir várias abas do navegador em nossa página inicial. a reprodução de vídeo de 4K a 60 FPS também é impecável, sem queda de quadros.
| DPC Latencies / LatencyMon - interrupt to process latency (max), Web, Youtube, Prime95 | |
| Asus ROG Strix Scar 17 SE G733CX-LL014W | |
| MSI Vector GP76 12UGS-434 | |
| Acer Predator Helios 300 (i7-12700H, RTX 3070 Ti) | |
| Alienware m17 R5 (R9 6900HX, RX 6850M XT) | |
| MSI Pulse GL76 12UGK | |
| Razer Blade 17 Early 2022 | |
* ... menor é melhor
Dispositivos de armazenamento - Até duas SSDs NVMe
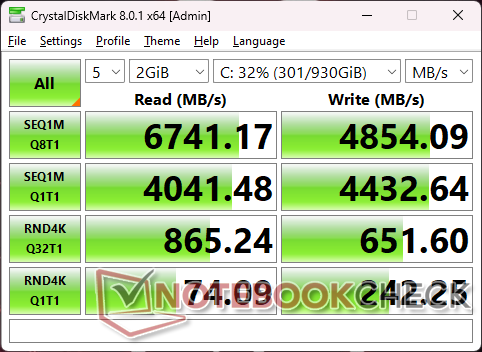
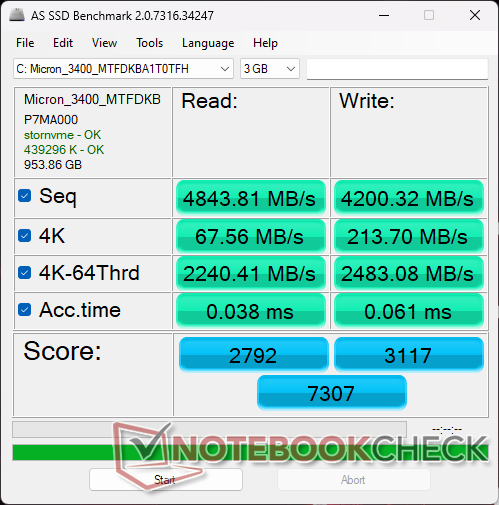
Nossa unidade é enviada com um 1 TB Micron 3400 PCIe4 x4 NVMe SSD em vez do mais comum 1 TB Samsung PM9A1 que provavelmente economizará em custos. As taxas de transferência são apenas cada vez mais lentas em cerca de 10%, em média. Estamos mais impressionados com a capacidade da unidade de manter taxas de transferência muito altas de mais de 6400 MB/s por longos períodos sem um espalhador de calor.

* ... menor é melhor
Disk Throttling: DiskSpd Read Loop, Queue Depth 8
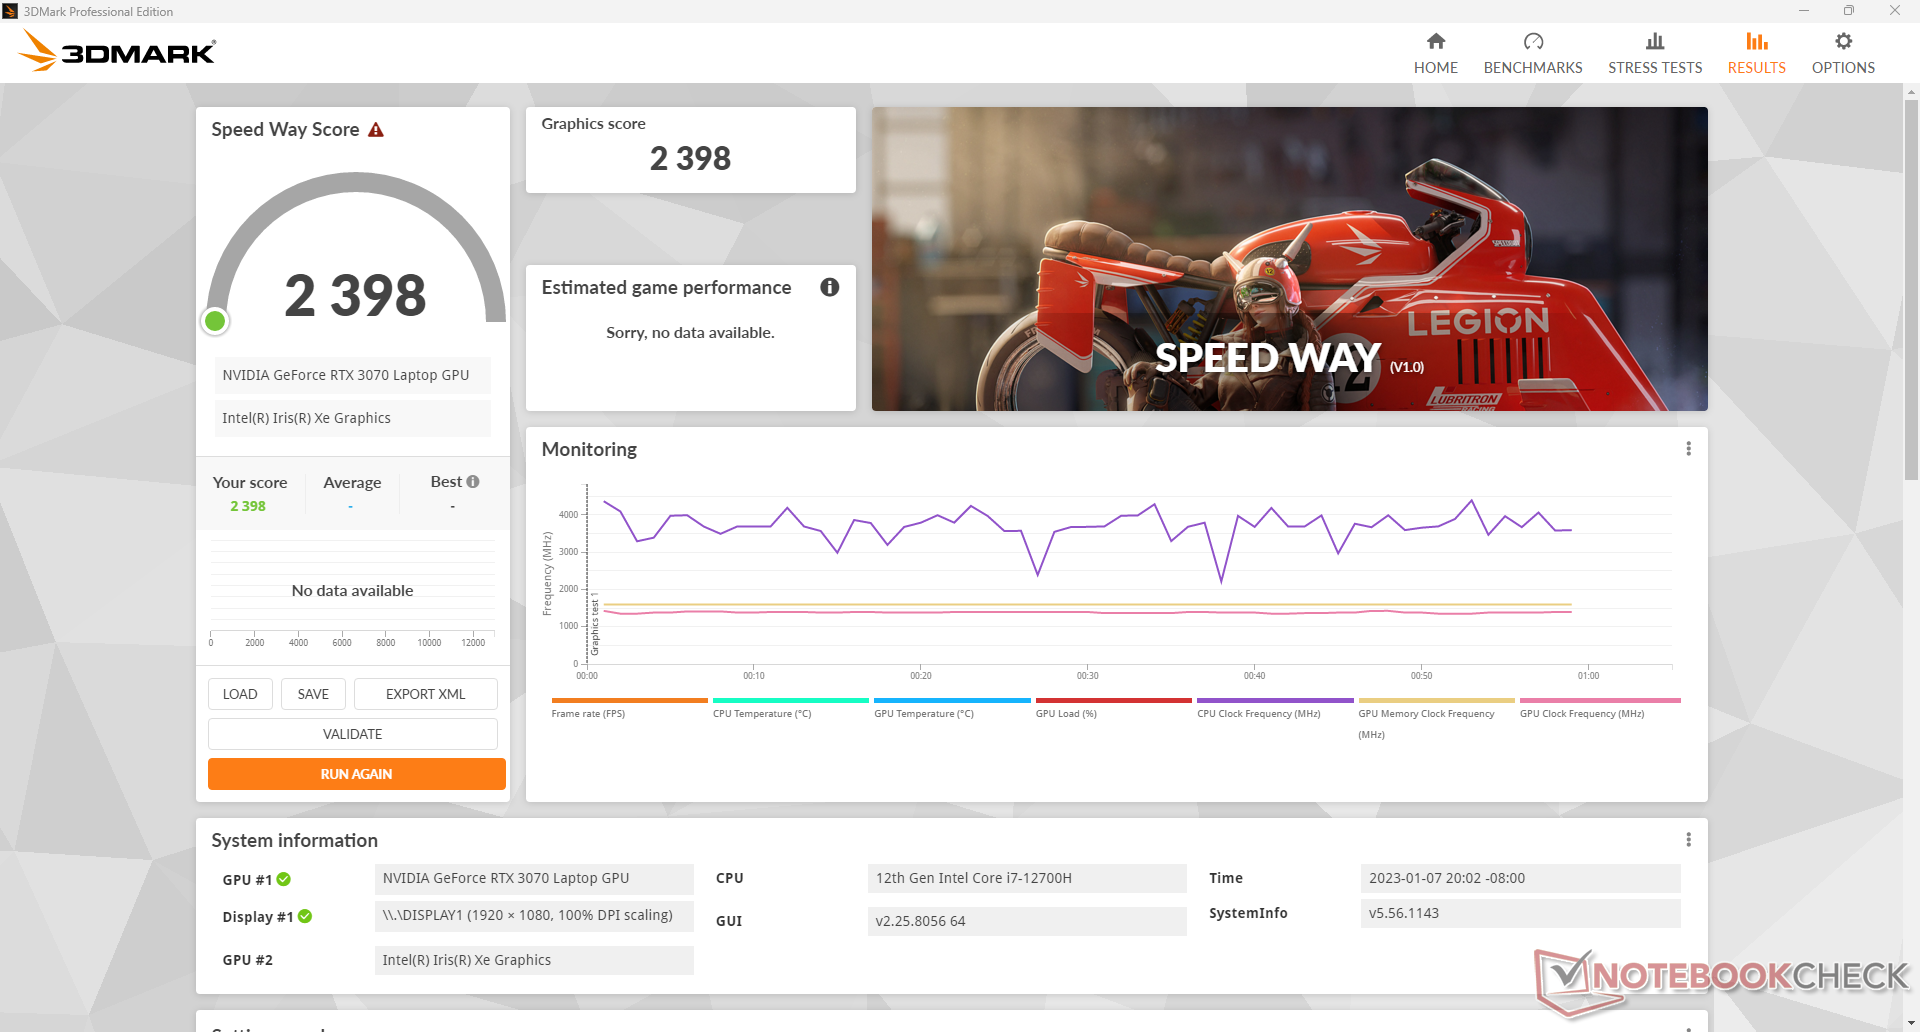
GPU Performance - Gráficos TGP 105 W
O desempenho gráfico bruto é aproximadamente 25% mais lento do que nosso GeForce Referência da área de trabalho RTX 3070. Quando comparado com os 115 WGeForce RTX 3070 no Schenker XMG Apex 15nossa versão 105 W está apenas cerca de 5% atrás. Desgraduando para a RTX 3060 ou RTX 3050 terá um impacto no desempenho gráfico de cerca de 10 a 15% e 40 a 45%, respectivamente.
Todos os títulos atuais podem ser jogados com a resolução nativa de 1080p com ajustes ao máximo. Para melhor explorar a rápida taxa de atualização nativa de 360 Hz, no entanto, você pode considerar a possibilidade de ajustar as configurações para médias ou baixas, especialmente em jogos competitivos como CS:GO ou Overwatch.
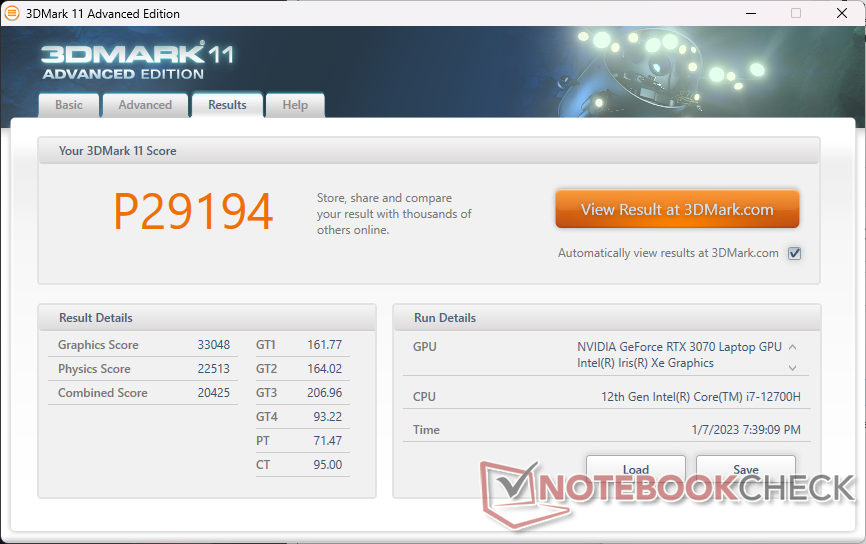
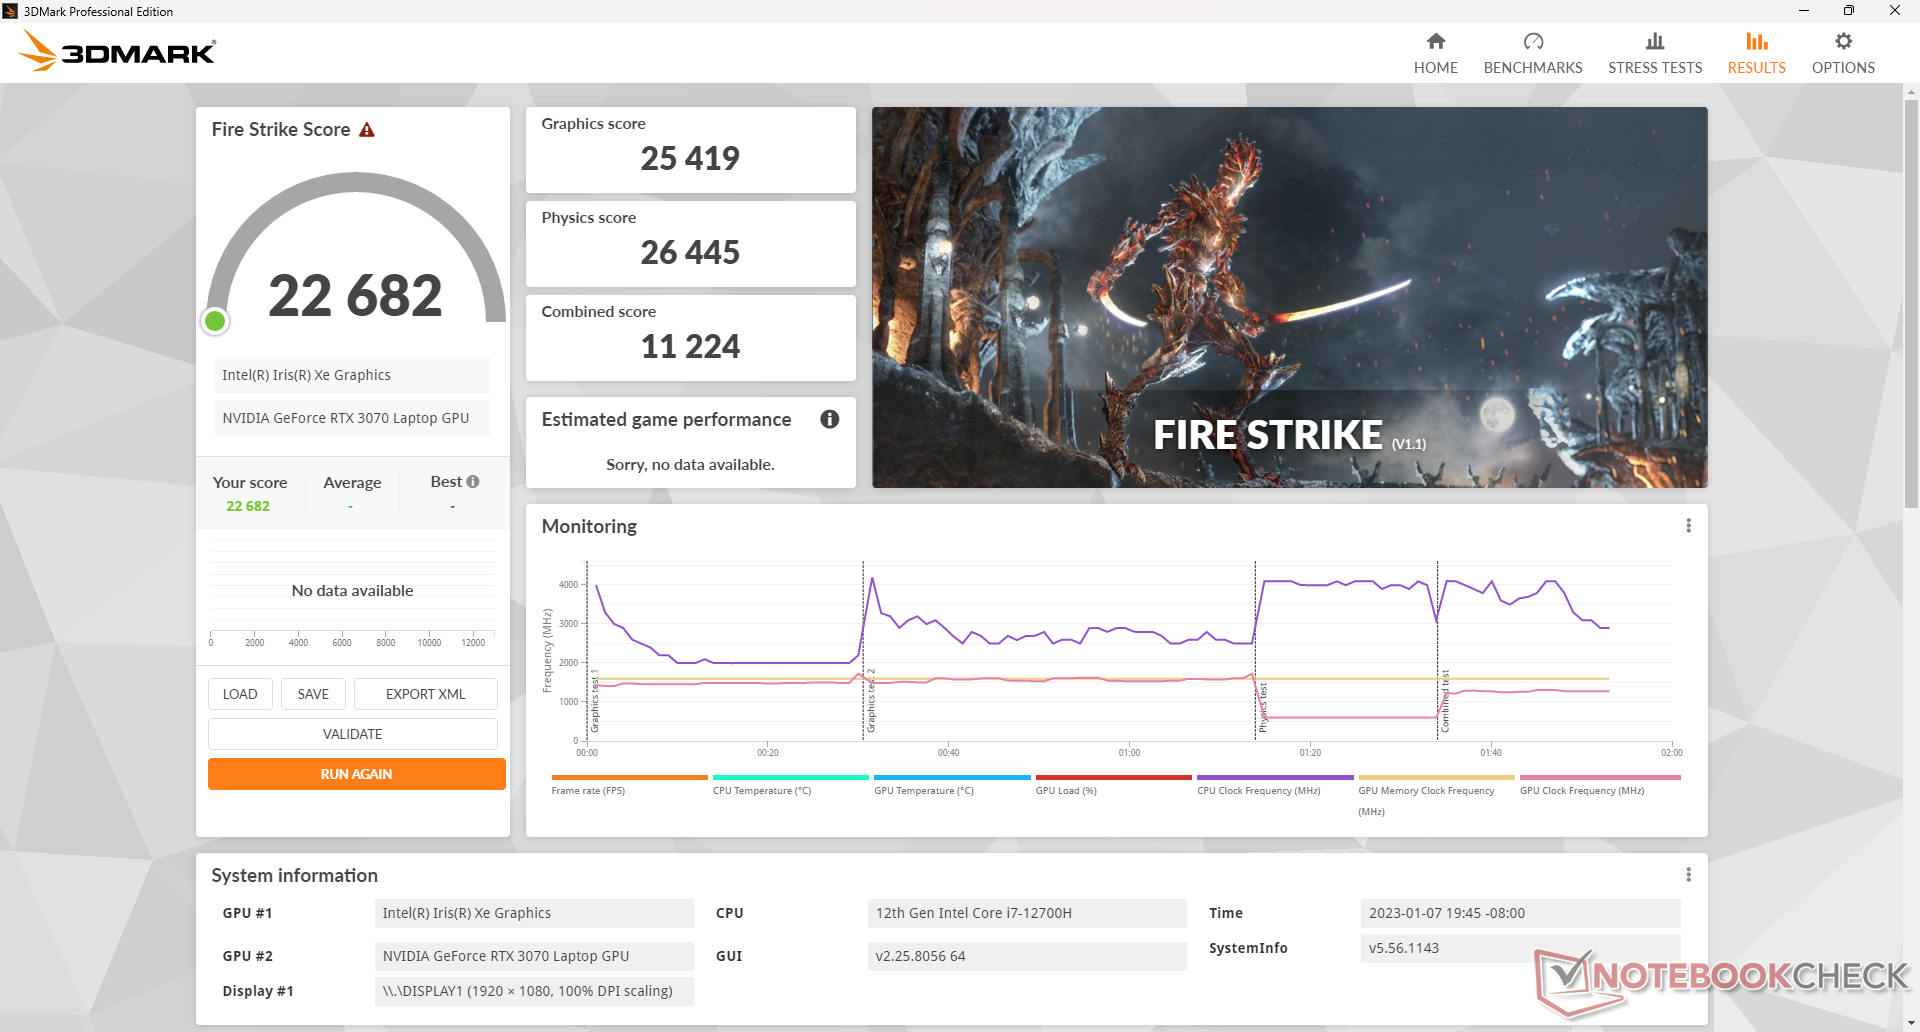
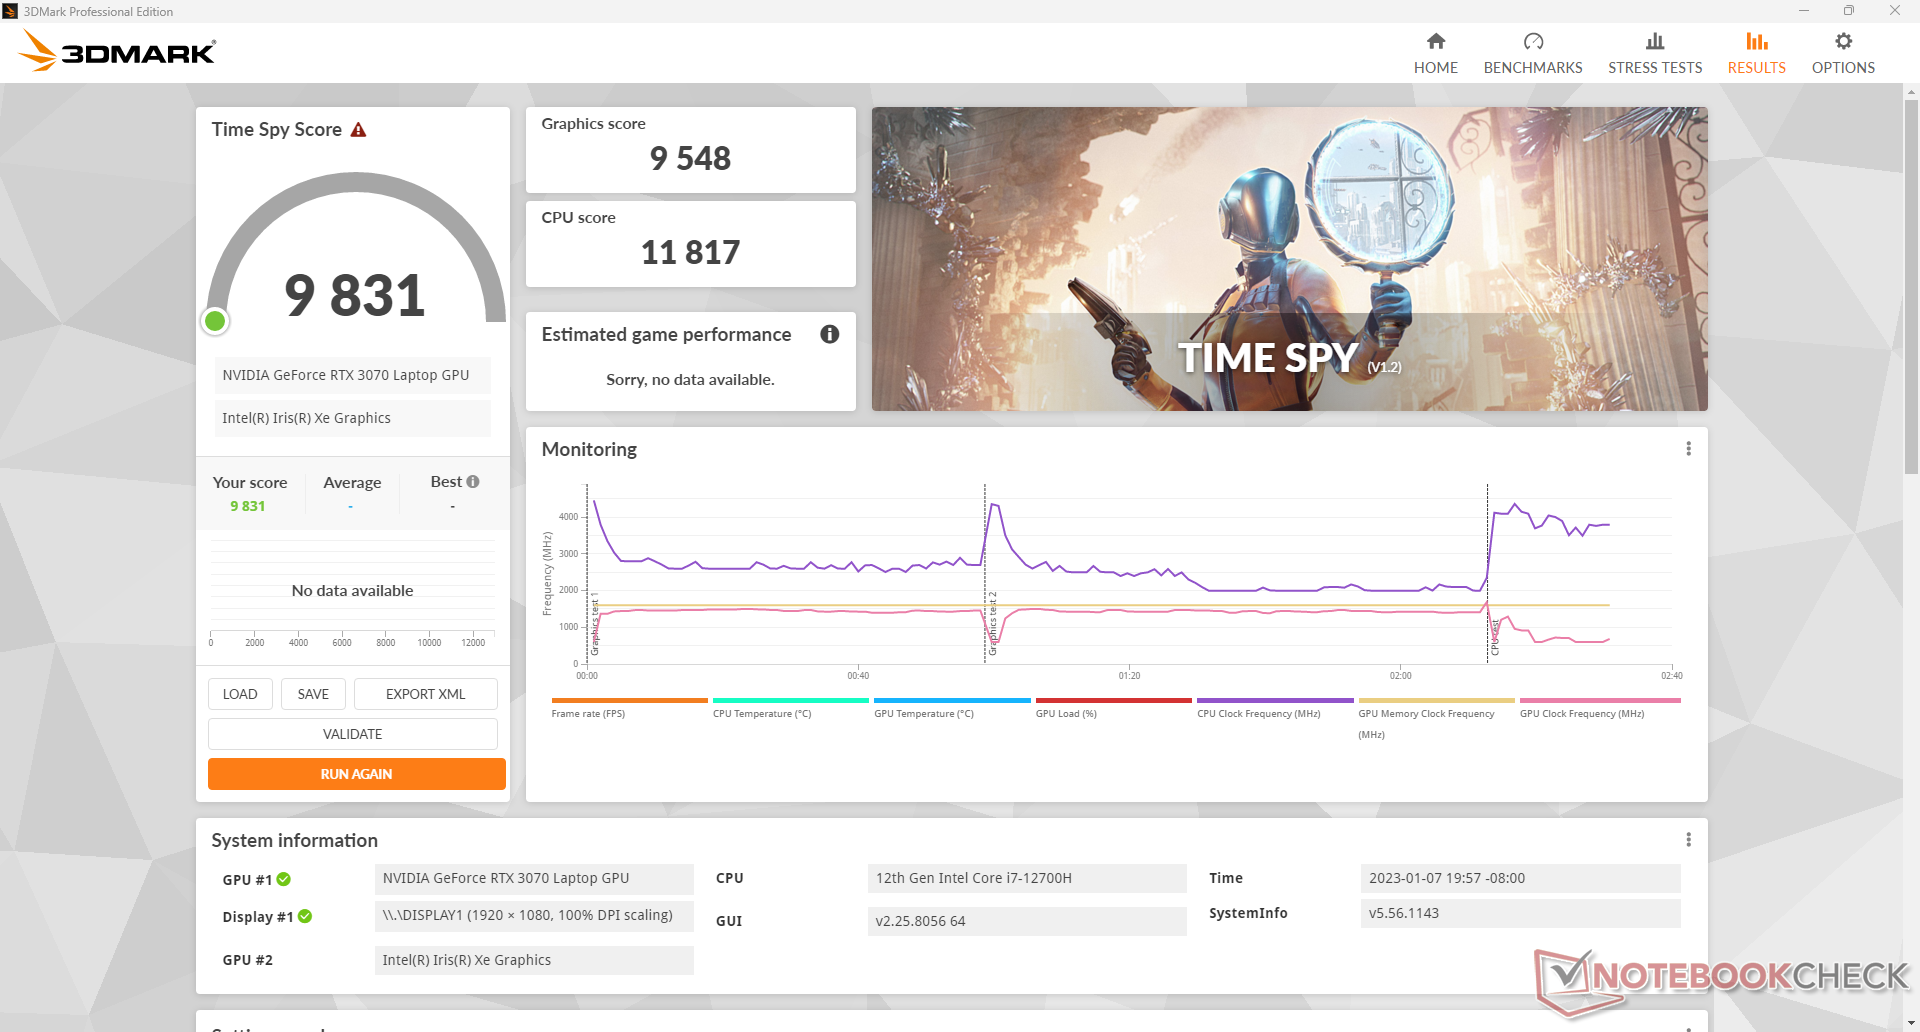
| 3DMark 11 Performance | 29194 pontos | |
| 3DMark Fire Strike Score | 22682 pontos | |
| 3DMark Time Spy Score | 9831 pontos | |
Ajuda | ||
* ... menor é melhor
Witcher 3 FPS Chart
| baixo | média | alto | ultra | |
|---|---|---|---|---|
| GTA V (2015) | 185.7 | 182.3 | 175.5 | 108.1 |
| The Witcher 3 (2015) | 377.1 | 252.8 | 170.5 | 92.8 |
| Dota 2 Reborn (2015) | 168.1 | 152.1 | 141.2 | 132.8 |
| Final Fantasy XV Benchmark (2018) | 186.3 | 118.5 | 89.7 | |
| X-Plane 11.11 (2018) | 139.9 | 122.9 | 97.7 | |
| Strange Brigade (2018) | 414 | 224 | 186.6 | 164.5 |
| Cyberpunk 2077 1.6 (2022) | 118.8 | 102.4 | 83.2 | 69.8 |
Emissões - Não muito barulhentas
Ruído do sistema
Os ventiladores nunca ficam ociosos mesmo quando ajustados para o modo "Silencioso". Somos capazes de gravar um mínimo de 26,9 dB(A) contra um fundo silencioso de 24,1 dB(A), o que é apenas dificilmente audível na maioria dos cenários. Em vez disso, o modo "Silencioso" é excelente para evitar que os ventiladores internos pulsem em resposta às mudanças de carga na tela. Ao transmitir vídeos ou navegar na web, por exemplo, o modo Silencioso é recomendado sobre o modo Equilibrado onde os ventiladores freqüentemente pulsarão entre 27 e 43,8 dB(A).
Ruído do ventilador quando em funcionamento Witcher 3 se estabiliza em pouco menos de 45 dB(A) para ser mais silencioso que muitos de seus concorrentes, como mostra a tabela abaixo. Se o Cooler Boost (isto é, modo de ventilação máxima) estiver ativado, o ruído do ventilador saltaria para até 58 dB(A). Este modo é mais para reduzir temperaturas do que para aumentar o desempenho e, portanto, não é necessário para a maioria dos cenários de jogos.
Barulho
| Ocioso |
| 26.9 / 26.9 / 27 dB |
| Carga |
| 43.8 / 58.3 dB |
 | ||
30 dB silencioso 40 dB(A) audível 50 dB(A) ruidosamente alto |
||
min: | ||
| MSI Pulse GL76 12UGK GeForce RTX 3070 Laptop GPU, i7-12700H, Micron 3400 1TB MTFDKBA1T0TFH | Alienware m17 R5 (R9 6900HX, RX 6850M XT) Radeon RX 6850M XT, R9 6900HX, SSSTC CA6-8D1024 | Asus ROG Strix Scar 17 SE G733CX-LL014W GeForce RTX 3080 Ti Laptop GPU, i9-12950HX, Samsung PM9A1 MZVL22T0HBLB | Acer Predator Helios 300 (i7-12700H, RTX 3070 Ti) GeForce RTX 3070 Ti Laptop GPU, i7-12700H, Samsung PM9A1 MZVL21T0HCLR | Razer Blade 17 Early 2022 GeForce RTX 3080 Ti Laptop GPU, i9-12900H, Samsung PM9A1 MZVL21T0HCLR | MSI Vector GP76 12UGS-434 GeForce RTX 3070 Ti Laptop GPU, i7-12700H, Micron 2450 1TB MTFDKBA1T0TFK | |
|---|---|---|---|---|---|---|
| Noise | 6% | 13% | -10% | -6% | -6% | |
| desligado / ambiente * (dB) | 24.1 | 23 5% | 23.9 1% | 23 5% | 26 -8% | 25.6 -6% |
| Idle Minimum * (dB) | 26.9 | 23 14% | 23.9 11% | 23 14% | 26 3% | 27 -0% |
| Idle Average * (dB) | 26.9 | 28.11 -4% | 23.9 11% | 25.92 4% | 27 -0% | 27 -0% |
| Idle Maximum * (dB) | 27 | 28.11 -4% | 23.9 11% | 40.67 -51% | 32 -19% | 30.1 -11% |
| Load Average * (dB) | 43.8 | 30.62 30% | 34.3 22% | 42.7 3% | 50 -14% | 54.4 -24% |
| Witcher 3 ultra * (dB) | 44.7 | 49.75 -11% | 62.48 -40% | 51 -14% | ||
| Load Maximum * (dB) | 58.3 | 50.17 14% | 45.9 21% | 62.67 -7% | 51 13% | 56.2 4% |
* ... menor é melhor
Temperatura
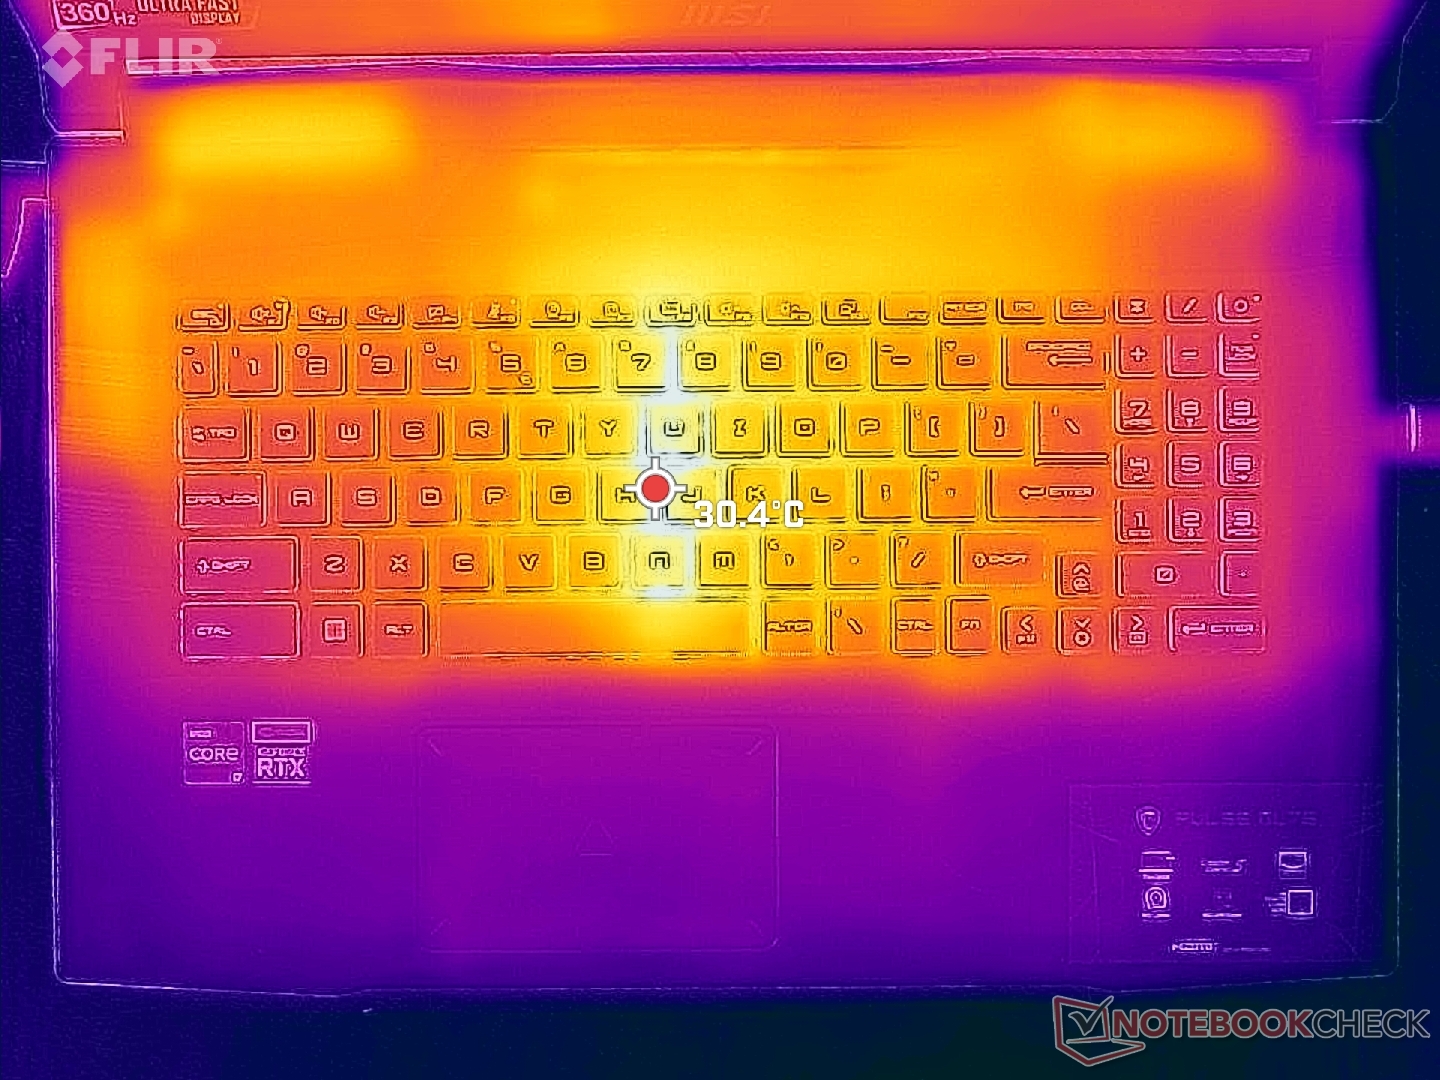
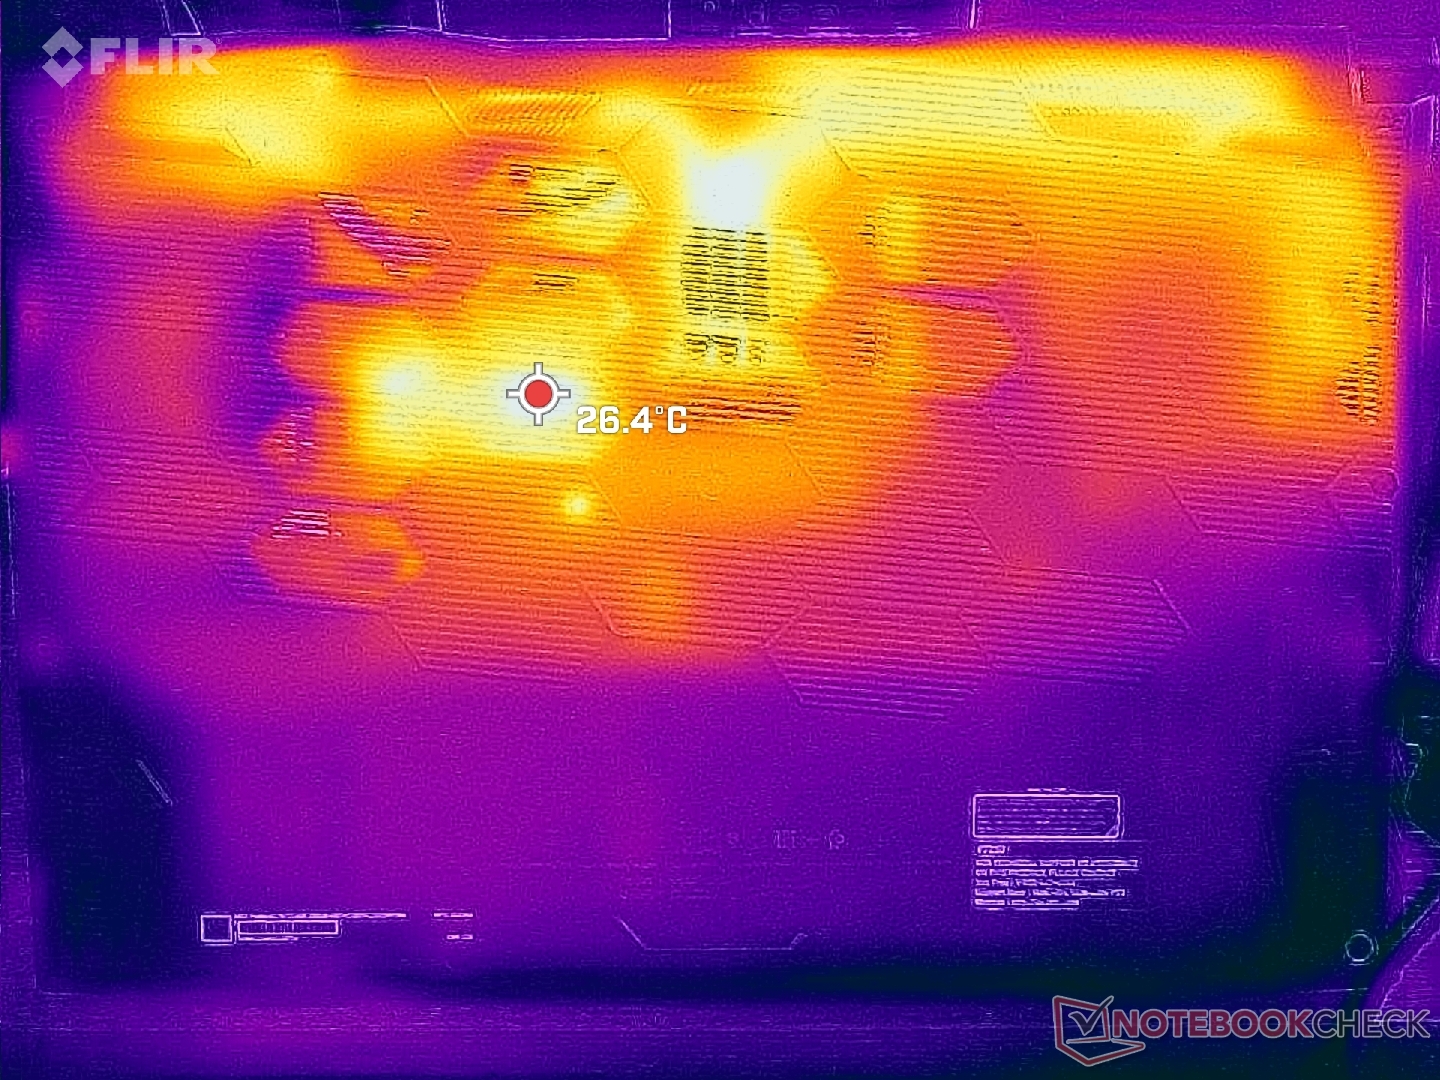
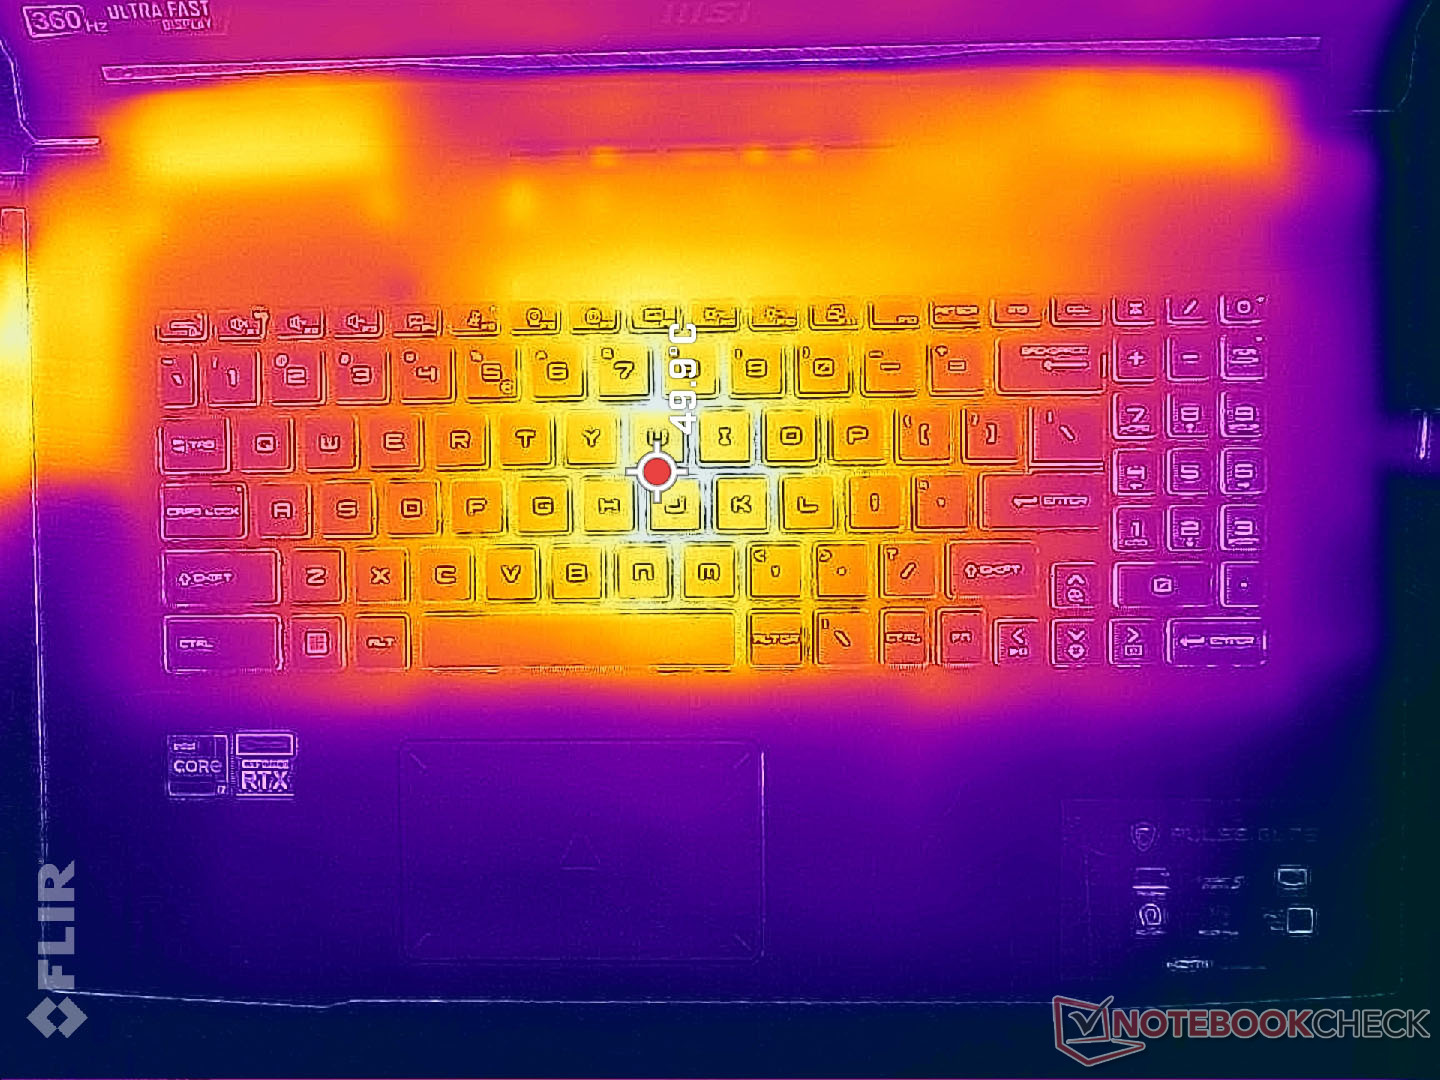
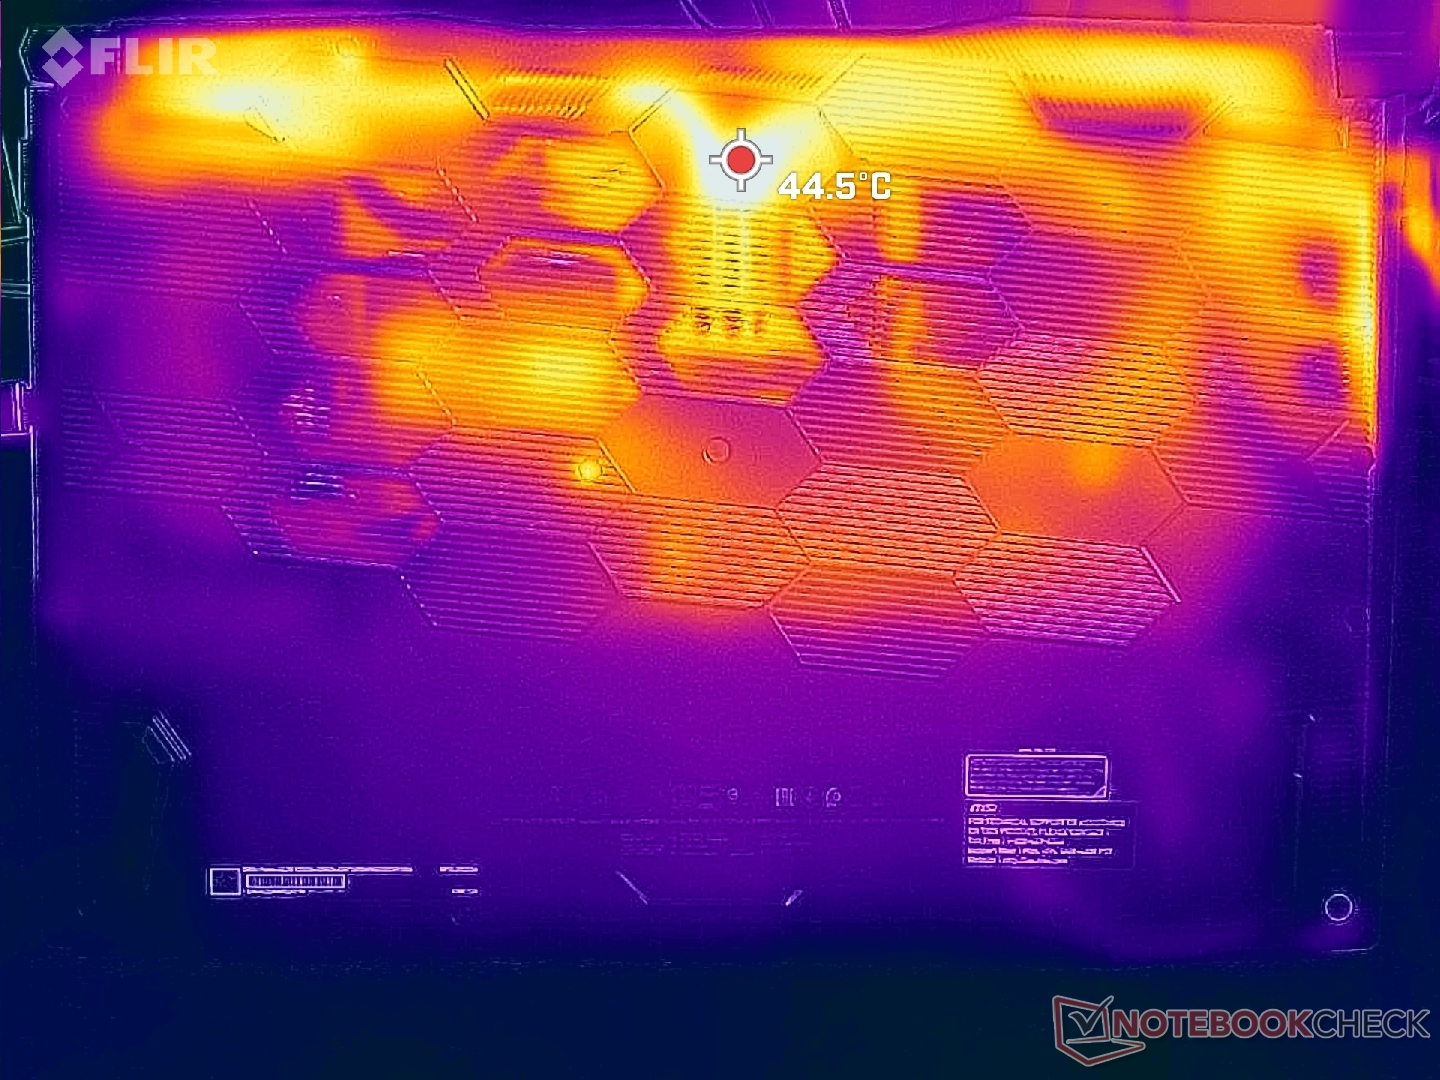
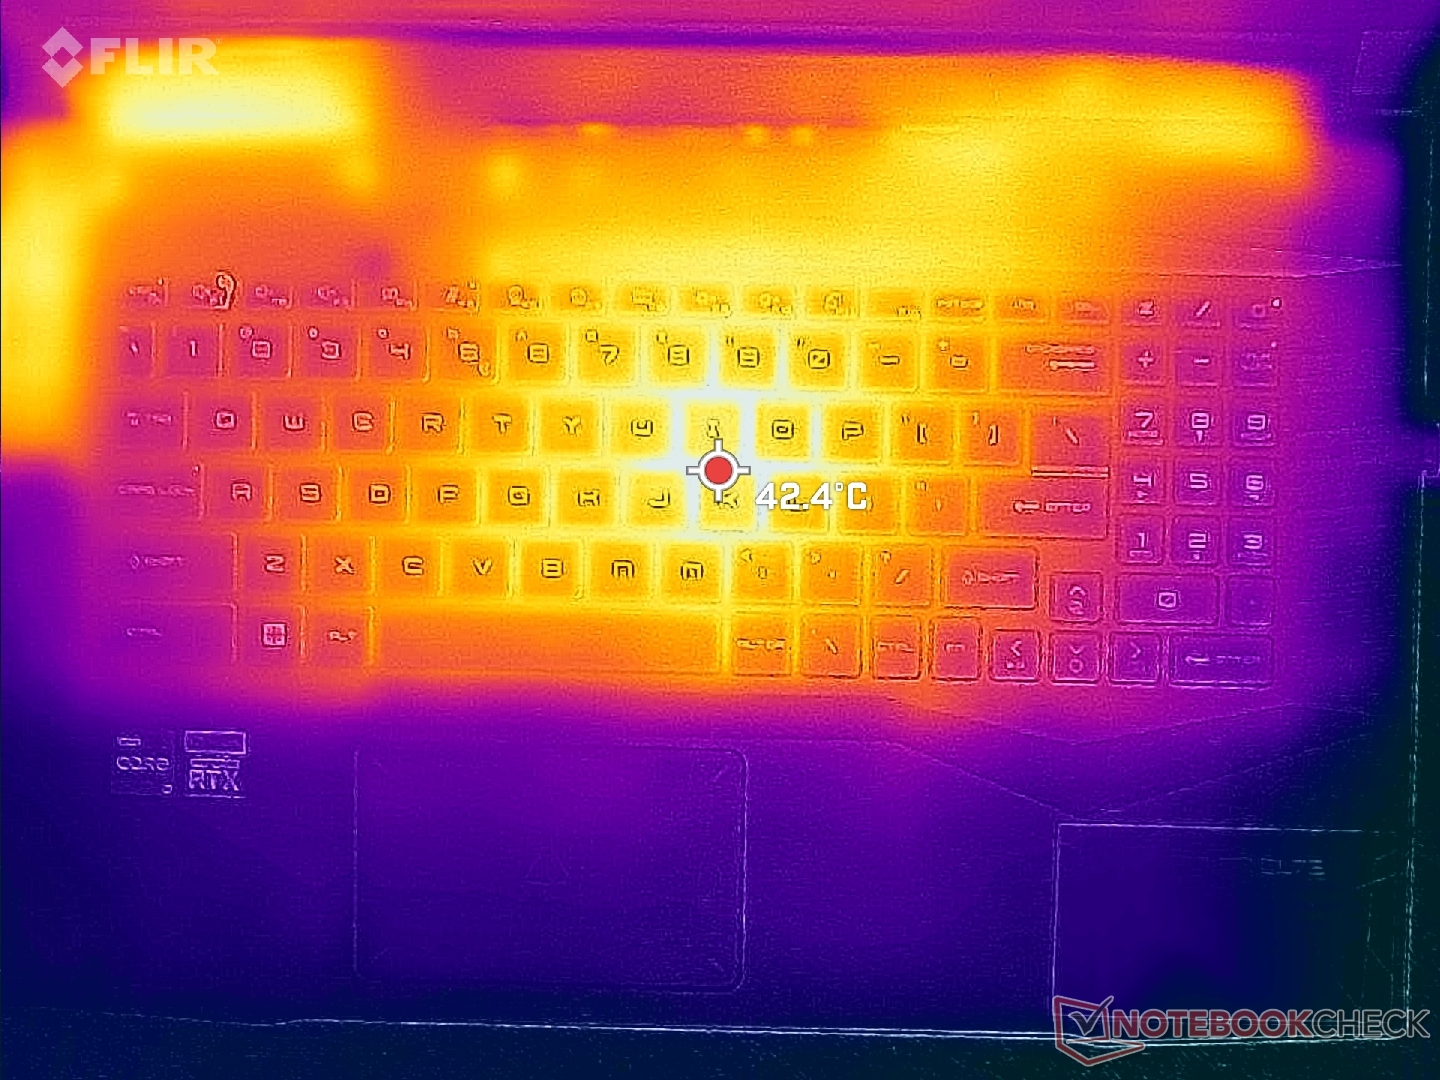
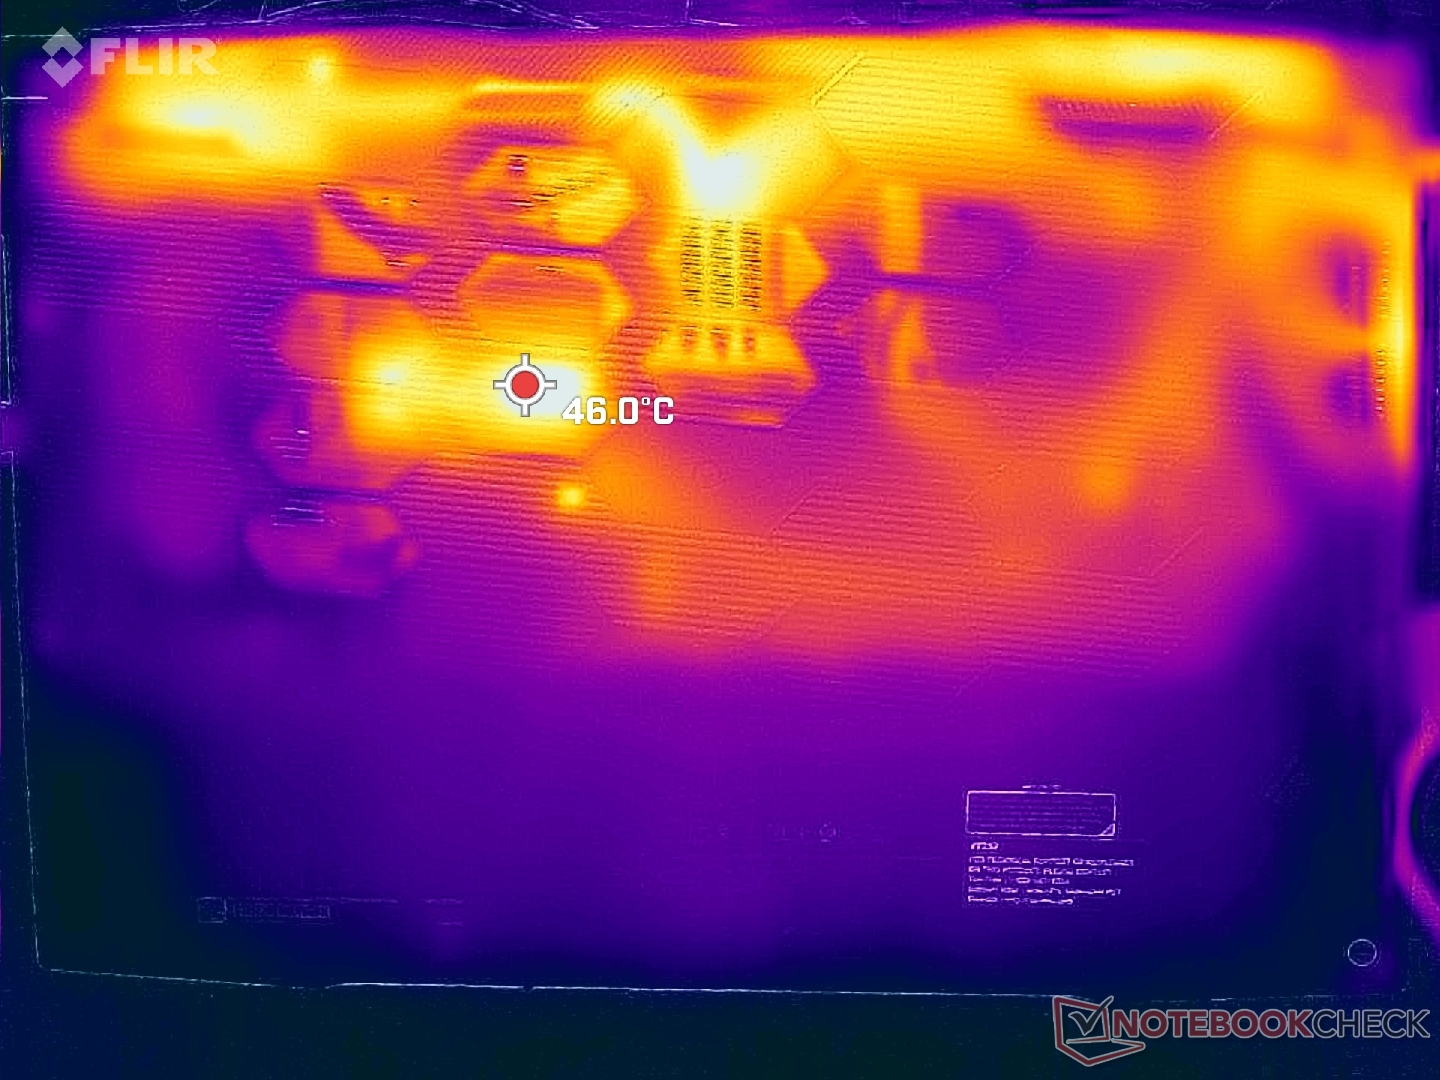
As temperaturas médias da superfície não são desconfortavelmente quentes e quaisquer pontos quentes são muito isolados devido ao grande fator de forma de 17,3 polegadas e principalmente chassis de plástico. O centro do teclado, por exemplo, pode chegar a quase 50 C quando se joga, enquanto o apoio da palma da mão e os lados do teclado são muito mais frios nas faixas médias de 20 C e 30 C, respectivamente. Os pontos quentes na parte superior e inferior raramente são perceptíveis quando se joga, uma vez que o contato com a pele é incomum nestas áreas.
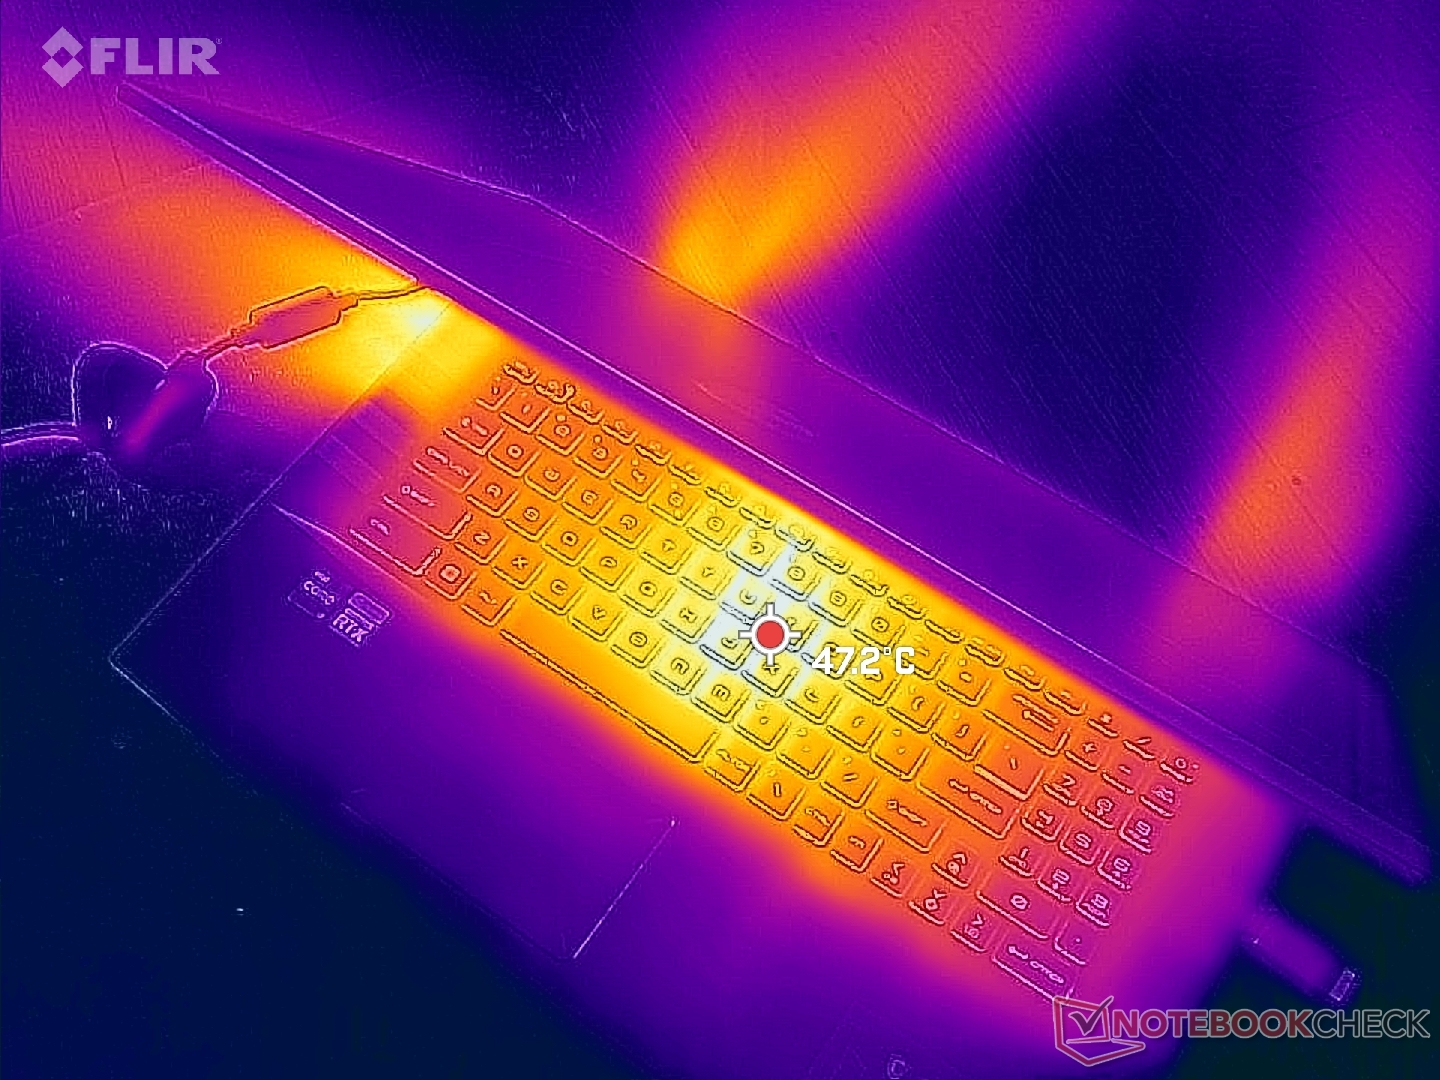
(±) A temperatura máxima no lado superior é 44.2 °C / 112 F, em comparação com a média de 40.4 °C / 105 F , variando de 21.2 a 68.8 °C para a classe Gaming.
(-) A parte inferior aquece até um máximo de 45.2 °C / 113 F, em comparação com a média de 43.2 °C / 110 F
(+) Em uso inativo, a temperatura média para o lado superior é 27.7 °C / 82 F, em comparação com a média do dispositivo de 33.9 °C / ### class_avg_f### F.
(±) Jogando The Witcher 3, a temperatura média para o lado superior é 35.1 °C / 95 F, em comparação com a média do dispositivo de 33.9 °C / ## #class_avg_f### F.
(+) Os apoios para as mãos e o touchpad são mais frios que a temperatura da pele, com um máximo de 25.4 °C / 77.7 F e, portanto, são frios ao toque.
(+) A temperatura média da área do apoio para as mãos de dispositivos semelhantes foi 28.8 °C / 83.8 F (+3.4 °C / 6.1 F).
| MSI Pulse GL76 12UGK Intel Core i7-12700H, NVIDIA GeForce RTX 3070 Laptop GPU | Alienware m17 R5 (R9 6900HX, RX 6850M XT) AMD Ryzen 9 6900HX, AMD Radeon RX 6850M XT | Asus ROG Strix Scar 17 SE G733CX-LL014W Intel Core i9-12950HX, NVIDIA GeForce RTX 3080 Ti Laptop GPU | Acer Predator Helios 300 (i7-12700H, RTX 3070 Ti) Intel Core i7-12700H, NVIDIA GeForce RTX 3070 Ti Laptop GPU | Razer Blade 17 Early 2022 Intel Core i9-12900H, NVIDIA GeForce RTX 3080 Ti Laptop GPU | MSI Vector GP76 12UGS-434 Intel Core i7-12700H, NVIDIA GeForce RTX 3070 Ti Laptop GPU | |
|---|---|---|---|---|---|---|
| Heat | -3% | -2% | 6% | -12% | -3% | |
| Maximum Upper Side * (°C) | 44.2 | 53 -20% | 48.8 -10% | 35 21% | 50 -13% | 46.3 -5% |
| Maximum Bottom * (°C) | 45.2 | 56 -24% | 52.4 -16% | 53 -17% | 56 -24% | 45 -0% |
| Idle Upper Side * (°C) | 35.4 | 30 15% | 30.4 14% | 29 18% | 36 -2% | 34.2 3% |
| Idle Bottom * (°C) | 35 | 29 17% | 34.1 3% | 34 3% | 38 -9% | 38.3 -9% |
* ... menor é melhor
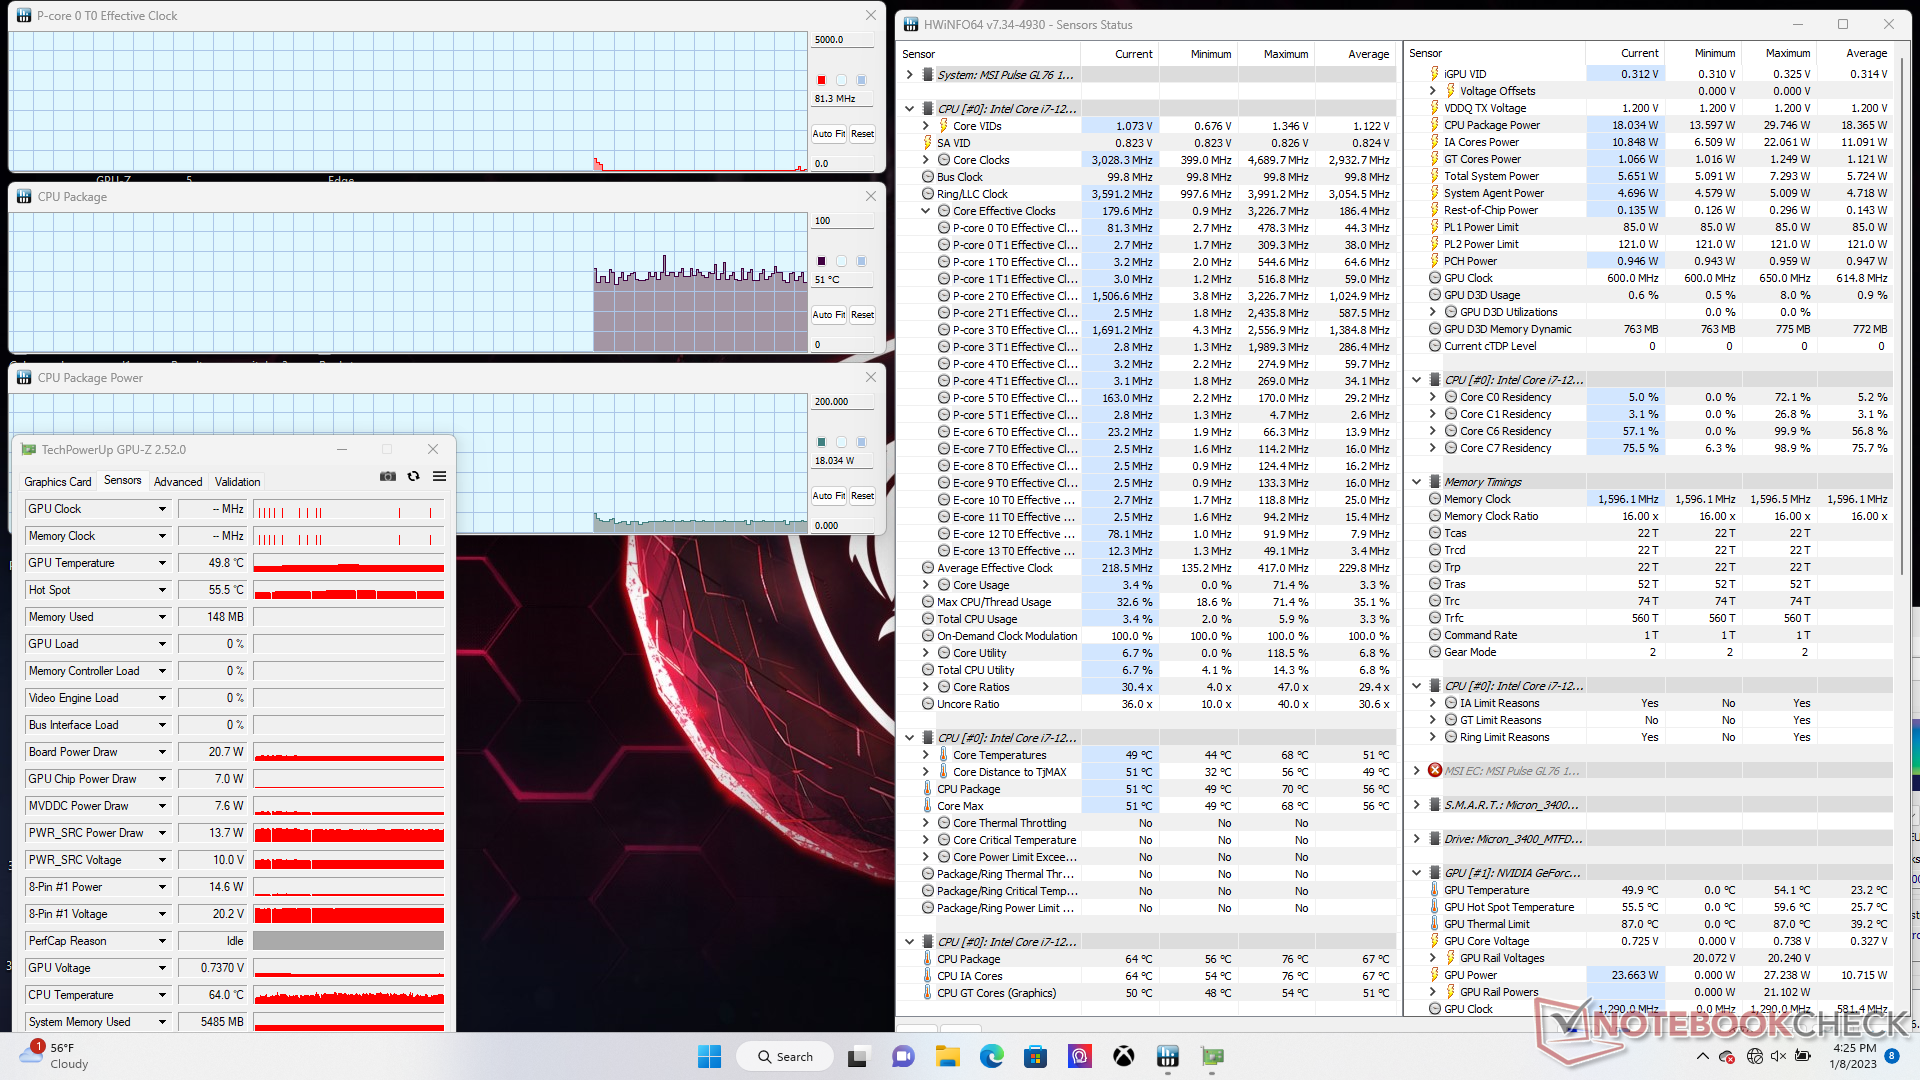
Teste de estresse
Ao rodar Prime95, as taxas de clock da CPU e o consumo de energia da placa aumentariam para 4,1 GHz e 110 W, respectivamente, durando apenas alguns segundos ou até a temperatura central atingir 95 C. Depois disso, as taxas de clock e o consumo de energia da placa cairiam para 3,6 GHz e 92 W antes de finalmente estabilizarem em 3,1 a 3,6 GHz e 85 W, respectivamente. A temperatura central também se estabilizaria em 90 C para indicar que a solução de resfriamento está praticamente no seu limite.
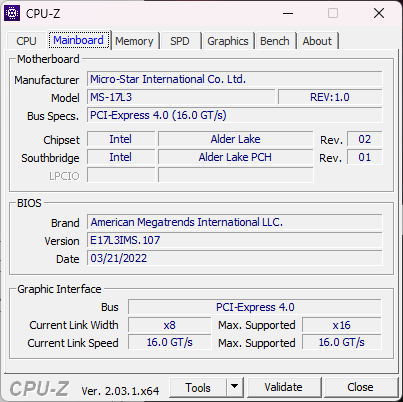
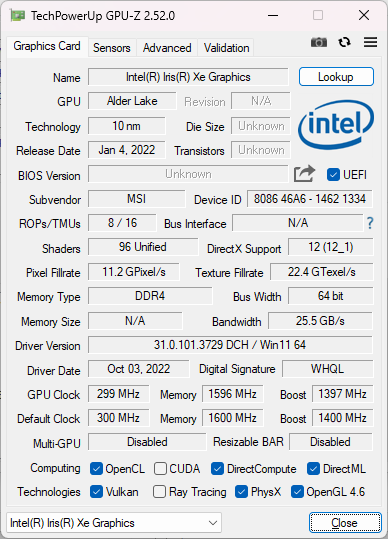
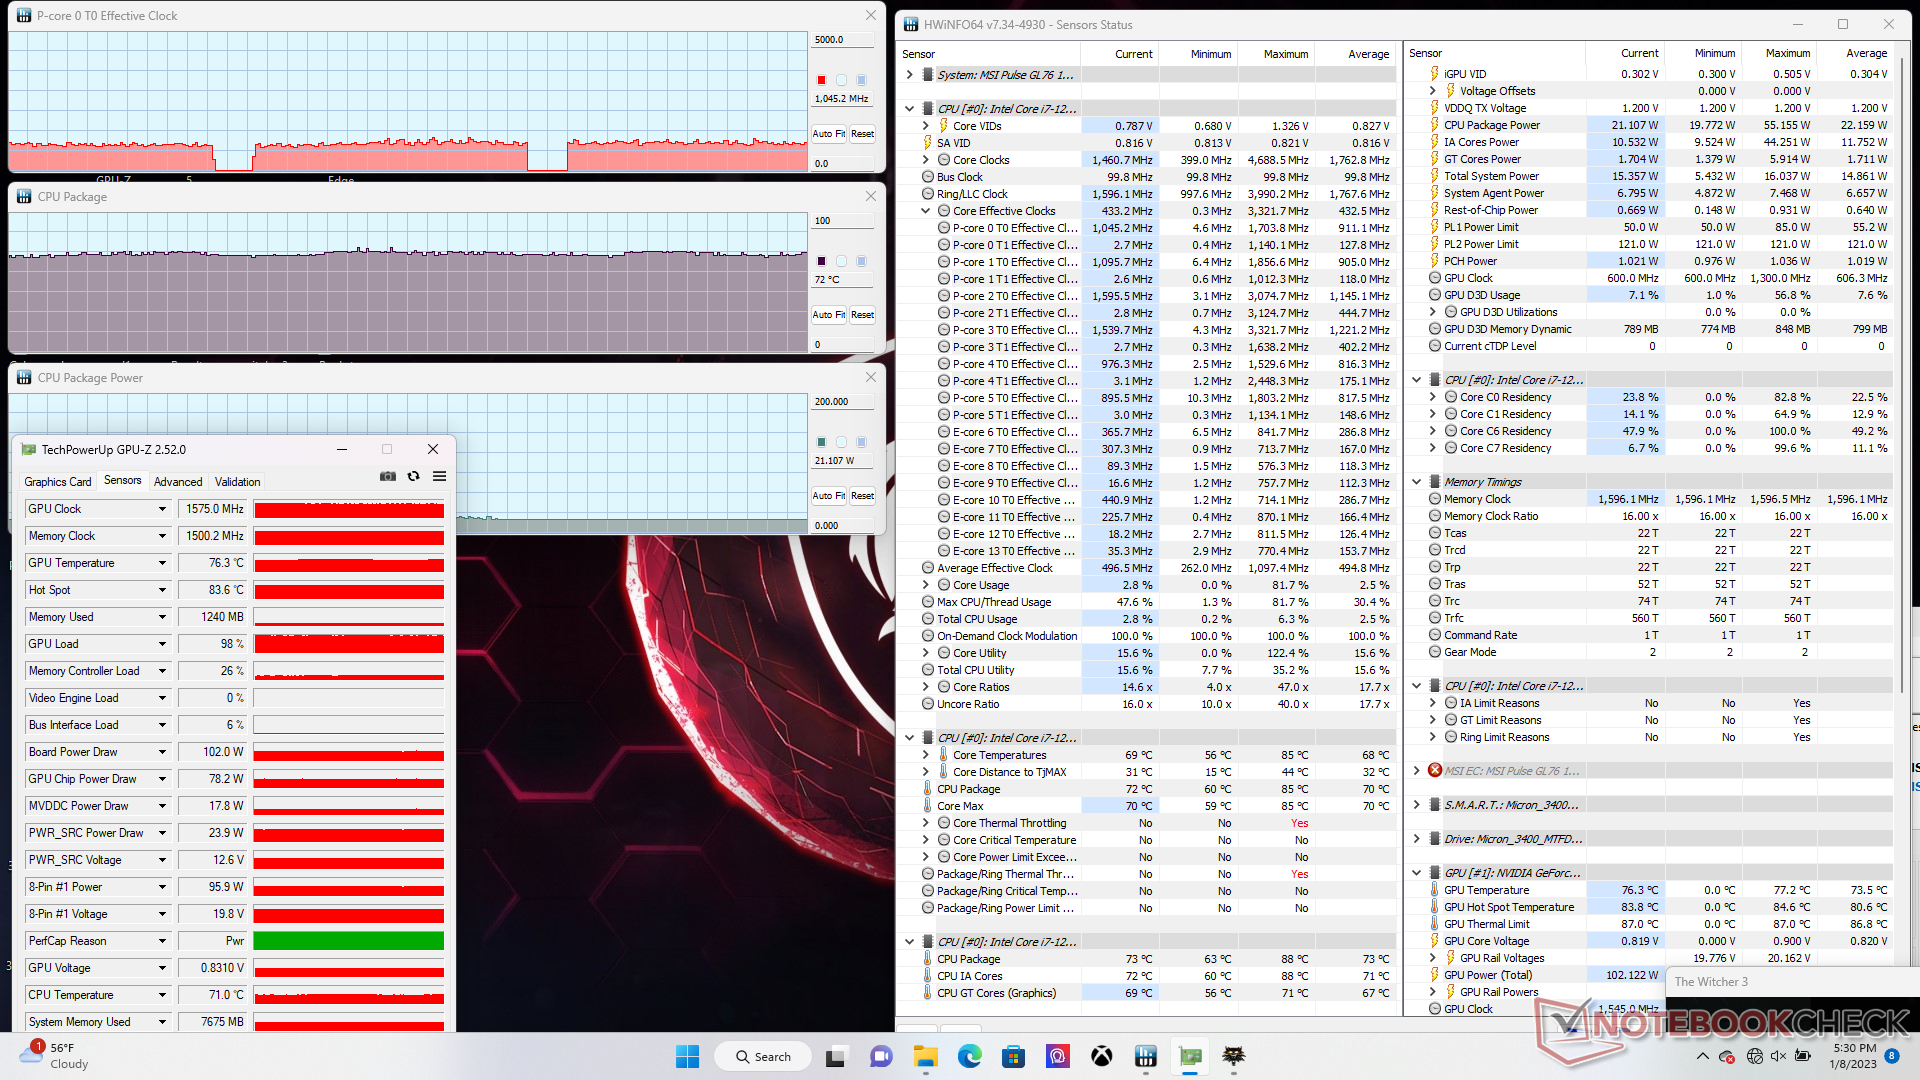
A GPU Nvidia se estabilizaria em 1575 MHz e 76 C ao rodar Witcher 3 em comparação com 1725 MHz e 72 C na Razer Blade 17 equipada com um TGP superior de 130 W GeForce RTX 3070. A GPU-Z em nossa unidade de teste MSI também indicaria uma tomada de potência da placa GPU de 102 W para estar muito próxima do alvo anunciado de 105 W.
Funcionando com a potência da bateria limita o desempenho. Um teste 3DMark 11 com baterias retornaria pontuações de Física e Gráficos de 9089 e 11291 pontos, respectivamente, em comparação com 22513 e 33048 pontos quando em rede elétrica.
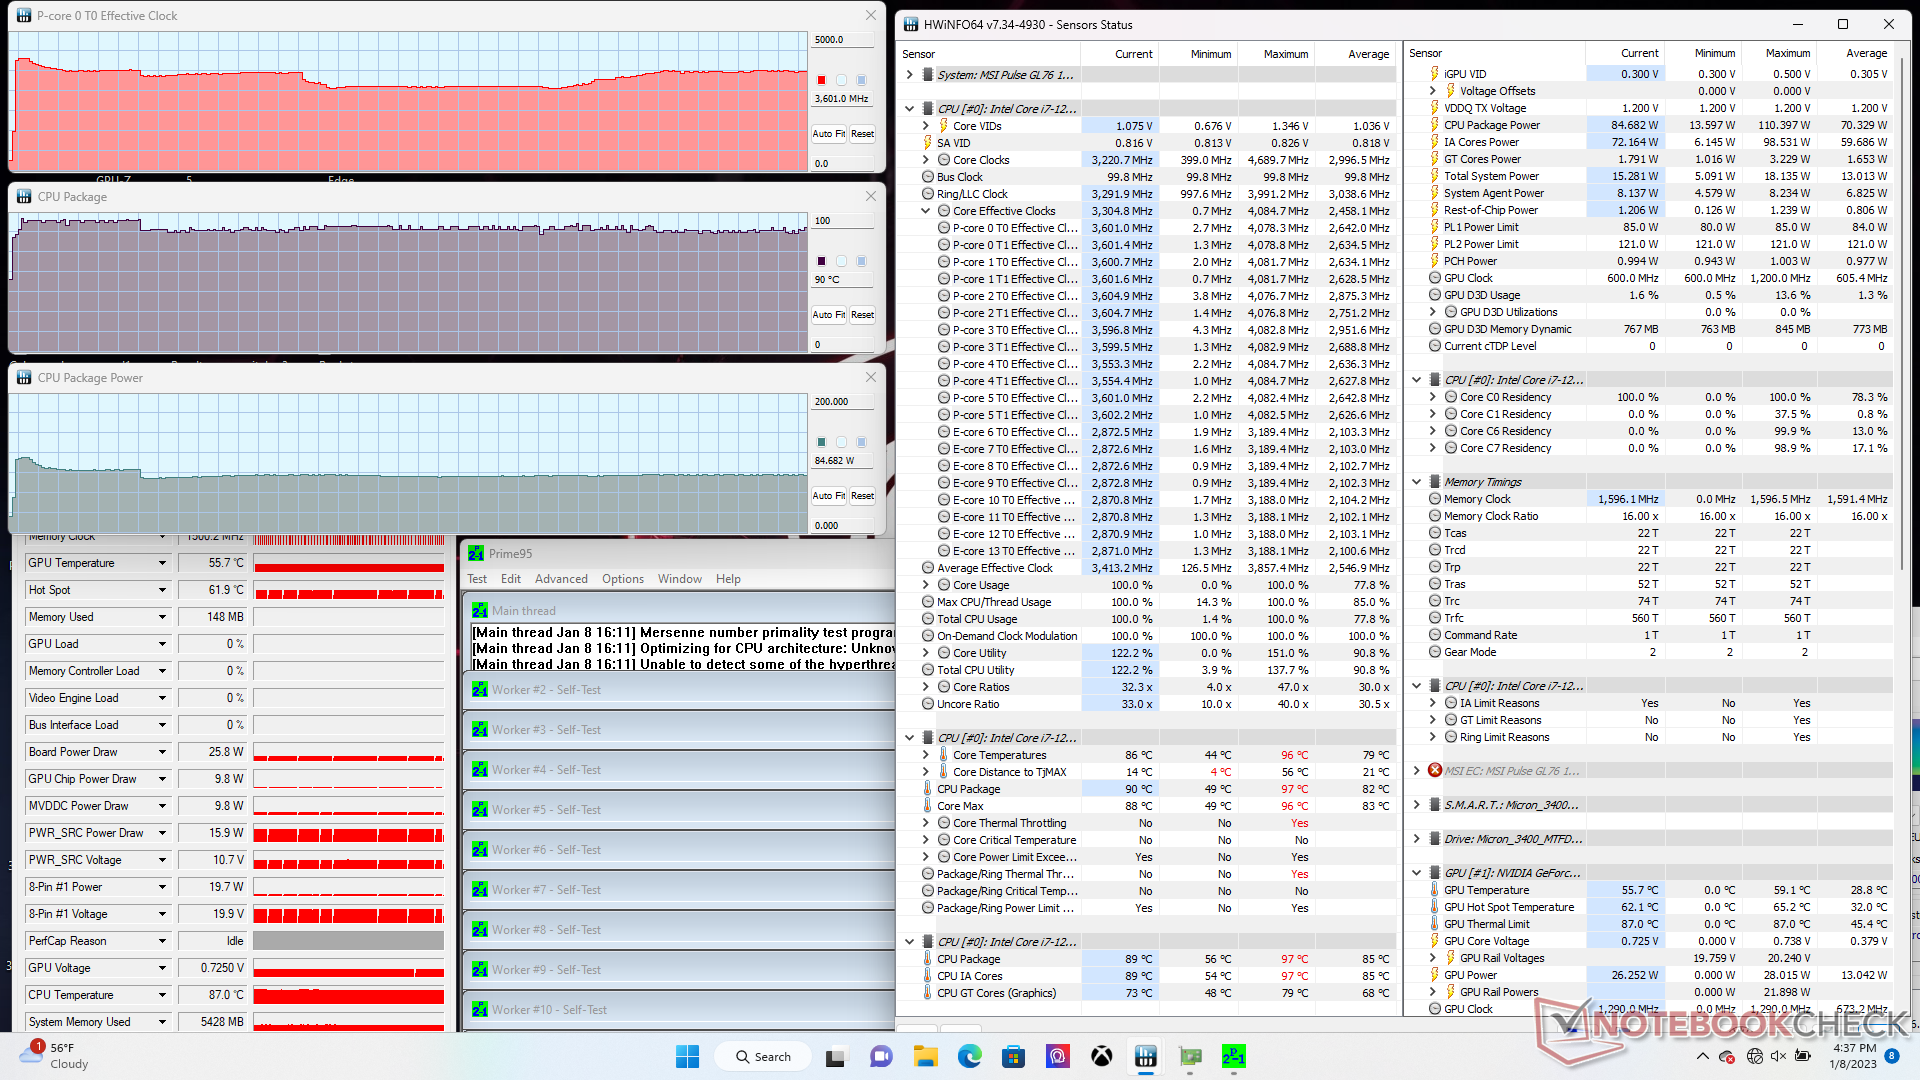
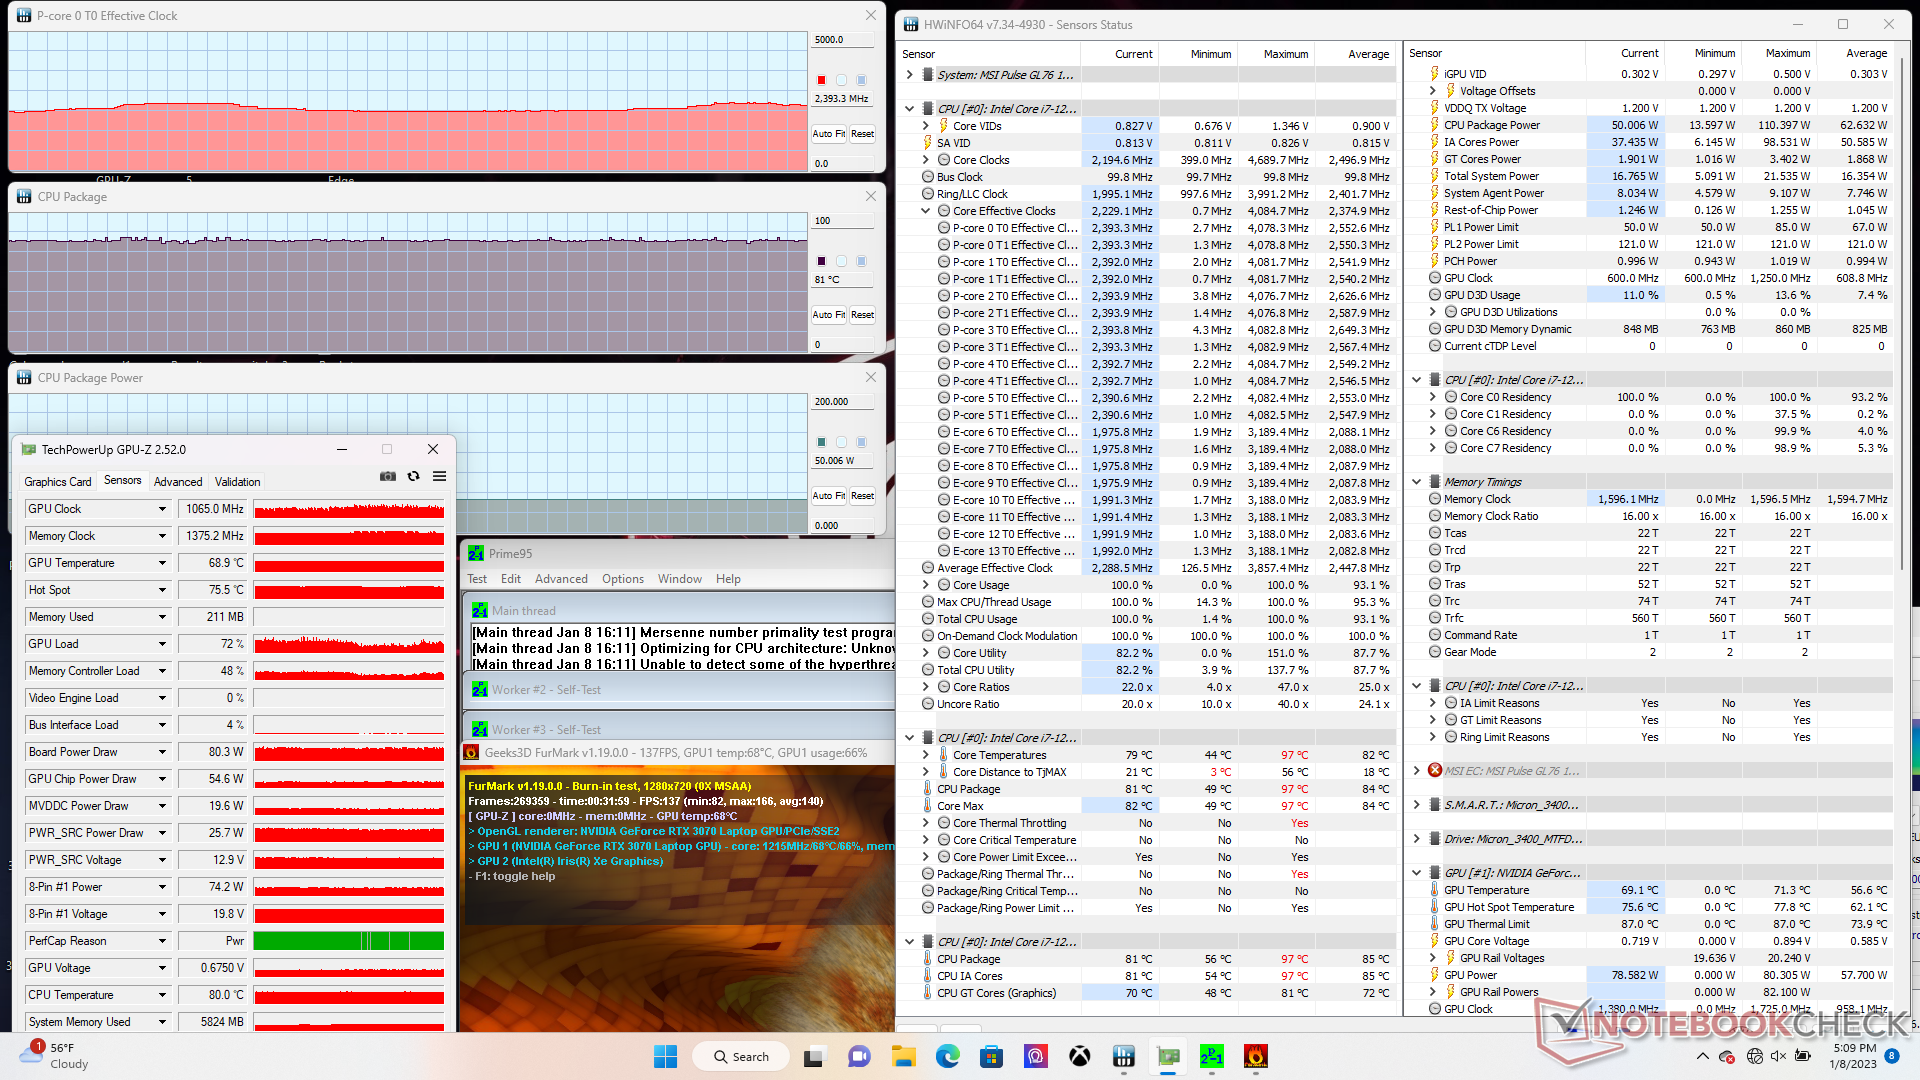
| Relógio CPU (GHz) | Relógio GPU (MHz) | Temperatura média da CPU (°C) | Temperatura média da GPU (°C) | |
| System Idle | -- | -- | 51 | 50 |
| Prime95 Stress | 3.4 - 3.6 | -- | 90 | 56 |
| Prime95 + FurMark Stress | 2.3 - 2.4 | 1065 | 81 | 69 |
| Witcher 3 Estresse | ~1.1 | 1575 | 72 | 76 |
Oradores
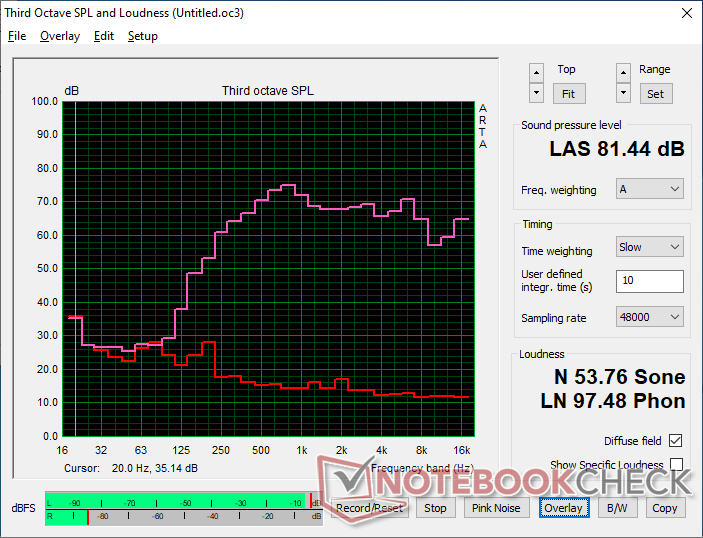
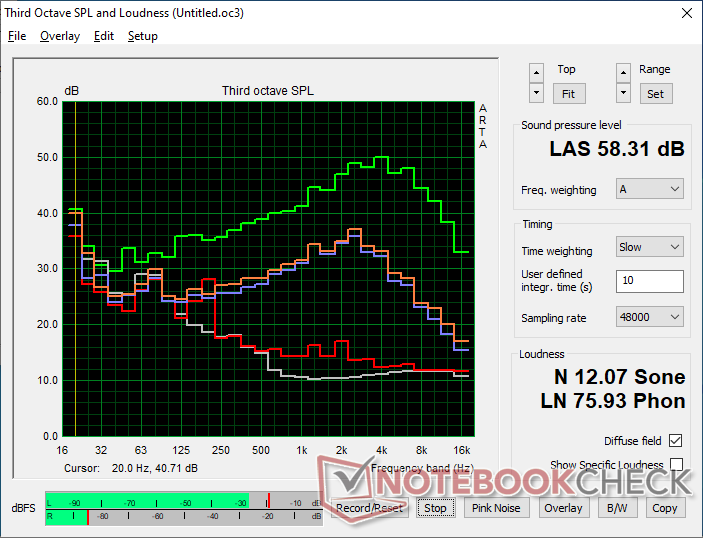
MSI Pulse GL76 12UGK análise de áudio
(±) | o volume do alto-falante é médio, mas bom (###valor### dB)
Graves 100 - 315Hz
(-) | quase nenhum baixo - em média 17.5% menor que a mediana
(±) | a linearidade dos graves é média (11.8% delta para a frequência anterior)
Médios 400 - 2.000 Hz
(+) | médios equilibrados - apenas 3.7% longe da mediana
(+) | médios são lineares (4.3% delta para frequência anterior)
Altos 2 - 16 kHz
(+) | agudos equilibrados - apenas 3.1% longe da mediana
(+) | os máximos são lineares (6.6% delta da frequência anterior)
Geral 100 - 16.000 Hz
(+) | o som geral é linear (14.8% diferença em relação à mediana)
Comparado com a mesma classe
» 30% de todos os dispositivos testados nesta classe foram melhores, 7% semelhantes, 63% piores
» O melhor teve um delta de 6%, a média foi 18%, o pior foi 132%
Comparado com todos os dispositivos testados
» 20% de todos os dispositivos testados foram melhores, 4% semelhantes, 76% piores
» O melhor teve um delta de 4%, a média foi 23%, o pior foi 134%
Apple MacBook Pro 16 2021 M1 Pro análise de áudio
(+) | os alto-falantes podem tocar relativamente alto (###valor### dB)
Graves 100 - 315Hz
(+) | bons graves - apenas 3.8% longe da mediana
(+) | o baixo é linear (5.2% delta para a frequência anterior)
Médios 400 - 2.000 Hz
(+) | médios equilibrados - apenas 1.3% longe da mediana
(+) | médios são lineares (2.1% delta para frequência anterior)
Altos 2 - 16 kHz
(+) | agudos equilibrados - apenas 1.9% longe da mediana
(+) | os máximos são lineares (2.7% delta da frequência anterior)
Geral 100 - 16.000 Hz
(+) | o som geral é linear (4.6% diferença em relação à mediana)
Comparado com a mesma classe
» 0% de todos os dispositivos testados nesta classe foram melhores, 0% semelhantes, 100% piores
» O melhor teve um delta de 5%, a média foi 17%, o pior foi 45%
Comparado com todos os dispositivos testados
» 0% de todos os dispositivos testados foram melhores, 0% semelhantes, 100% piores
» O melhor teve um delta de 4%, a média foi 23%, o pior foi 134%
Gestão de Energia - Mais Eficiente do que se esperava
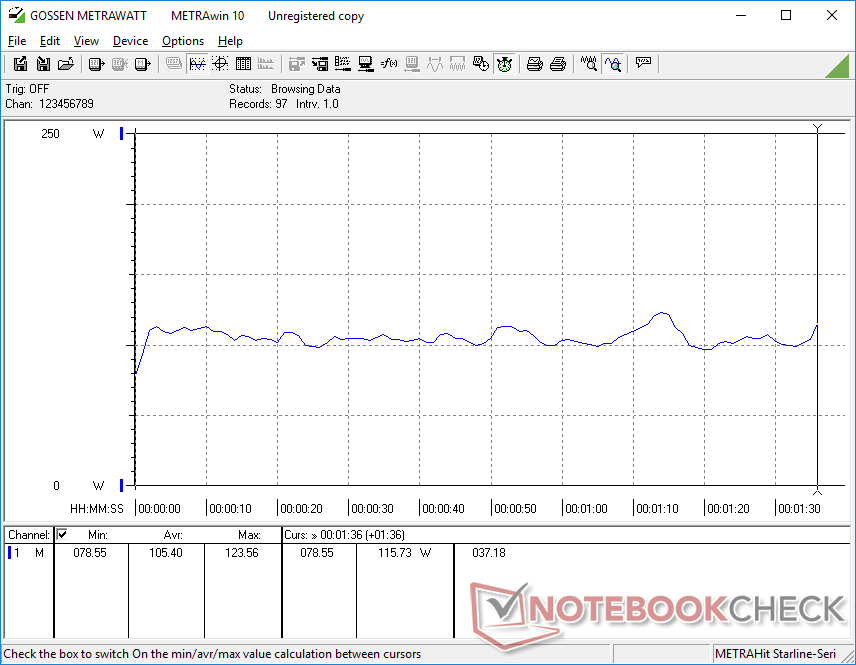
Consumo de energia
A manipulação na área de trabalho consome apenas 12 W quando no perfil Power Saver com o iGPU ativo e a luminosidade definida para o mínimo. Por outro lado, ociosos na área de trabalho podem consumir pouco mais de 25 W quando no modo de Desempenho Extremo com o brilho definido para o máximo. Assim, alternar entre os modos de potência é um fator importante para prolongar a vida útil da bateria.
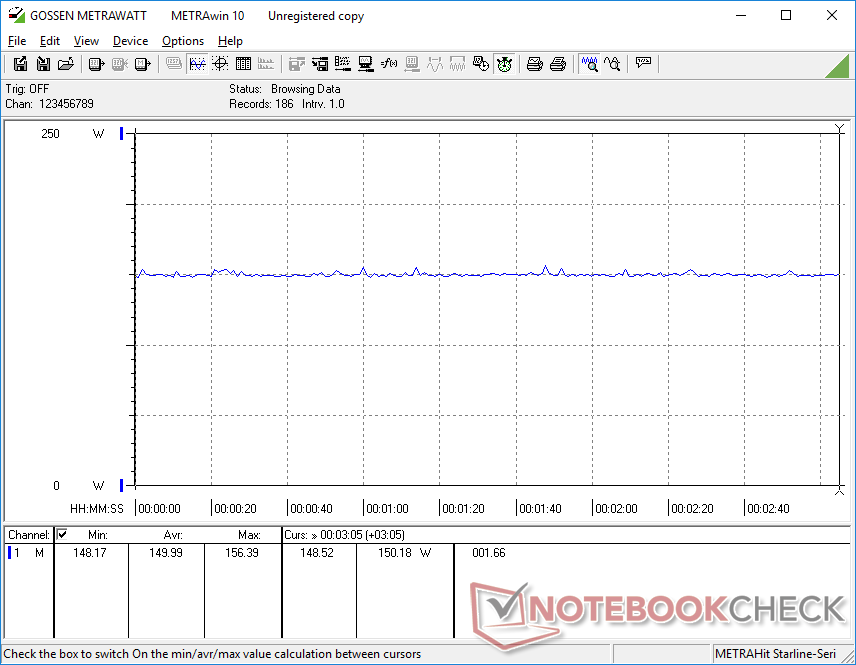
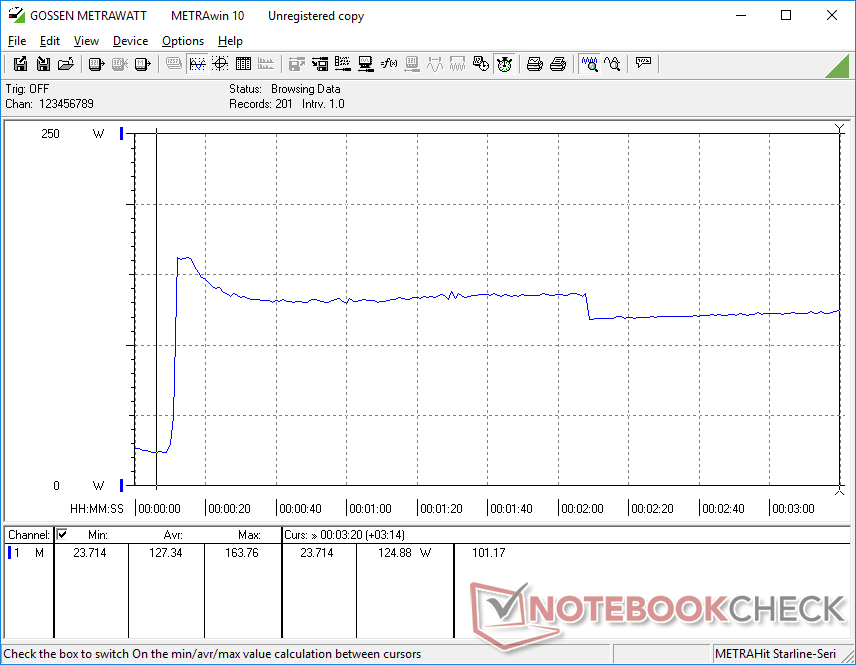
O consumo total de energia é menor do que na maioria dos outros laptops de jogo de 17,3 polegadas. Rodando Witcher 3, por exemplo, consumiria apenas 150 W em comparação com 199 W e 231 W no MSI Vector GP76 e Acer Predator Helios 300, respectivamente, cada um com a GPU RTX 3070 Ti. O consumo também é significativamente inferior ao do Radeon RX 6850M XT M17 R5, enquanto oferece quase a mesma performance gráfica bruta.
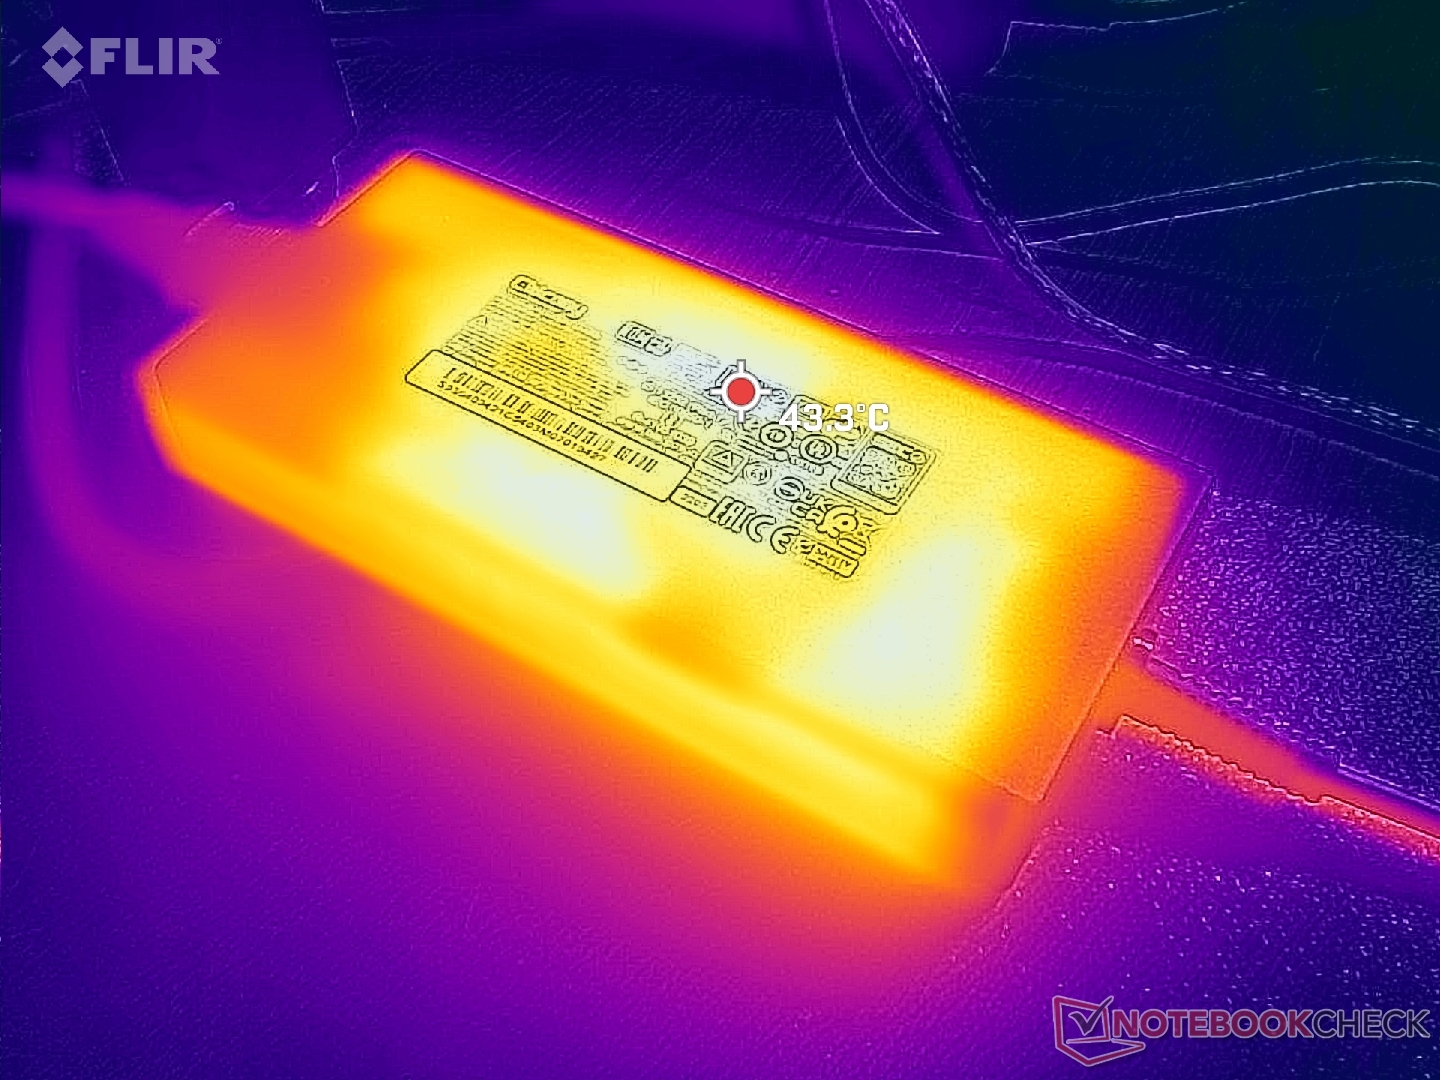
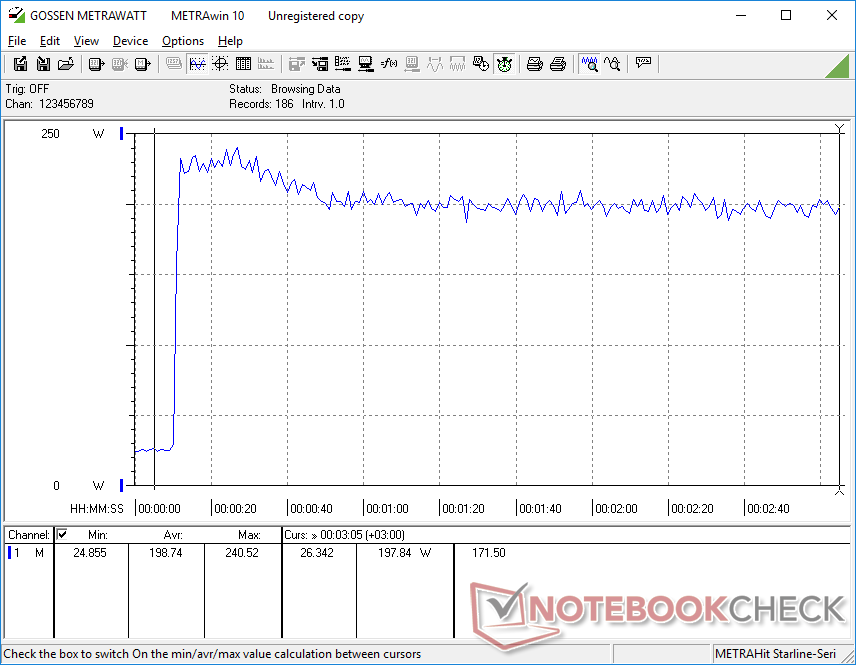
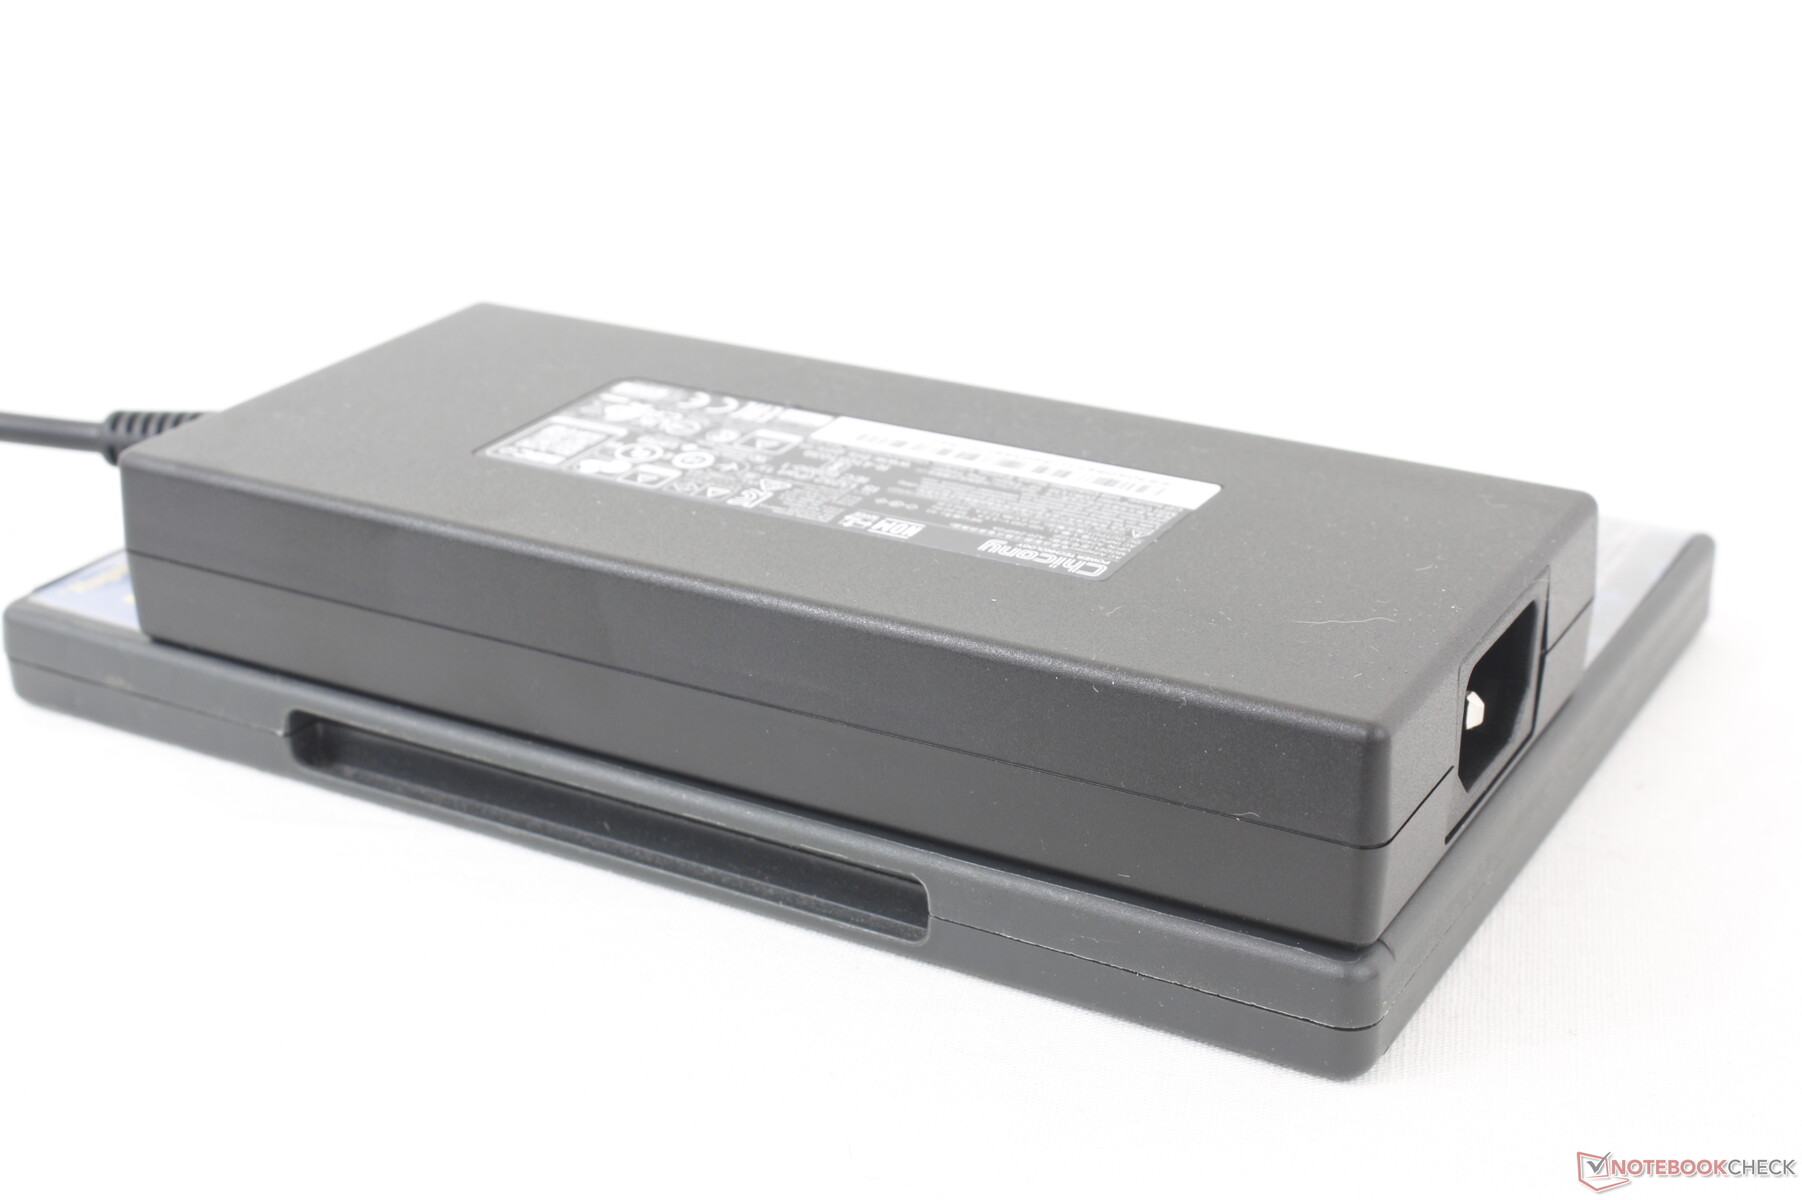
Somos capazes de medir um consumo máximo de 241 W a partir do adaptador AC de tamanho médio (~16,4 x 7,4 x 2,5 cm) 240 W quando a CPU e a GPU estão cada uma com 100% de utilização. Esta taxa é apenas temporária, como mostram as capturas de tela abaixo, devido ao limitado potencial de Turbo Boost da CPU. A bateria ainda pode ser carregada a uma taxa decente enquanto estiver com altas cargas, como jogos.
| desligado | |
| Ocioso | |
| Carga |
|
Key:
min: | |
| MSI Pulse GL76 12UGK i7-12700H, GeForce RTX 3070 Laptop GPU, Micron 3400 1TB MTFDKBA1T0TFH, IPS, 1920x1080, 17.3" | Alienware m17 R5 (R9 6900HX, RX 6850M XT) R9 6900HX, Radeon RX 6850M XT, SSSTC CA6-8D1024, IPS, 3840x2160, 17" | Asus ROG Strix Scar 17 SE G733CX-LL014W i9-12950HX, GeForce RTX 3080 Ti Laptop GPU, Samsung PM9A1 MZVL22T0HBLB, IPS, 2560x1440, 17.3" | Acer Predator Helios 300 (i7-12700H, RTX 3070 Ti) i7-12700H, GeForce RTX 3070 Ti Laptop GPU, Samsung PM9A1 MZVL21T0HCLR, IPS, 2560x1440, 17.3" | Razer Blade 17 Early 2022 i9-12900H, GeForce RTX 3080 Ti Laptop GPU, Samsung PM9A1 MZVL21T0HCLR, IPS, 3840x2160, 17.3" | MSI Vector GP76 12UGS-434 i7-12700H, GeForce RTX 3070 Ti Laptop GPU, Micron 2450 1TB MTFDKBA1T0TFK, IPS, 1920x1080, 17.3" | |
|---|---|---|---|---|---|---|
| Power Consumption | -8% | -46% | -27% | -36% | -27% | |
| Idle Minimum * (Watt) | 12.4 | 13 -5% | 19.3 -56% | 15 -21% | 17 -37% | 13.5 -9% |
| Idle Average * (Watt) | 13.1 | 16.5 -26% | 26.5 -102% | 20 -53% | 23 -76% | 15.6 -19% |
| Idle Maximum * (Watt) | 25.3 | 17 33% | 27.1 -7% | 22.3 12% | 34 -34% | 20.6 19% |
| Load Average * (Watt) | 105.4 | 93 12% | 141 -34% | 133 -26% | 120 -14% | 198 -88% |
| Witcher 3 ultra * (Watt) | 150 | 239 -59% | 225 -50% | 231 -54% | 229 -53% | 199 -33% |
| Load Maximum * (Watt) | 240.5 | 251 -4% | 307.9 -28% | 290 -21% | 243 -1% | 319 -33% |
* ... menor é melhor
Power Consumption Witcher 3 / Stresstest
Power Consumption external Monitor
Vida útil da bateria - 99 Wh Li-Ion Pack
Curiosamente, as especificações oficiais da MSI https://us.msi.com/Laptop/Pulse-GL76-12UX/Specification reclamar uma bateria de 53 Wh para a GL76 enquanto uma olhada mais de perto no HWiNFO e a bateria física de nossa unidade de teste mostra uma capacidade de 90 Wh. A discrepância é provavelmente um erro da parte do fabricante. No entanto, a vida útil da bateria é boa para um laptop para jogos. Somos capazes de gravar um tempo de execução WLAN de pouco menos de 6 horas, que é aproximadamente 2 horas mais longo do que no Razer Blade 17 ou Asus ROG Strix Scar 17.
O carregamento da capacidade vazia para a plena leva pouco mais de 2 horas. USB-PD não é suportado e, portanto, o sistema só pode recarregar com o adaptador AC do tipo barril incluído.
| MSI Pulse GL76 12UGK i7-12700H, GeForce RTX 3070 Laptop GPU, 90 Wh | Alienware m17 R5 (R9 6900HX, RX 6850M XT) R9 6900HX, Radeon RX 6850M XT, 97 Wh | Asus ROG Strix Scar 17 SE G733CX-LL014W i9-12950HX, GeForce RTX 3080 Ti Laptop GPU, 90 Wh | Acer Predator Helios 300 (i7-12700H, RTX 3070 Ti) i7-12700H, GeForce RTX 3070 Ti Laptop GPU, 90 Wh | Razer Blade 17 Early 2022 i9-12900H, GeForce RTX 3080 Ti Laptop GPU, 82 Wh | MSI Vector GP76 12UGS-434 i7-12700H, GeForce RTX 3070 Ti Laptop GPU, 65 Wh | |
|---|---|---|---|---|---|---|
| Duração da bateria | -17% | -29% | -6% | -19% | -11% | |
| Reader / Idle (h) | 7.3 | 7.1 -3% | 7.3 0% | |||
| WiFi v1.3 (h) | 5.9 | 4.8 -19% | 4.2 -29% | 6 2% | 3.8 -36% | 5.1 -14% |
| Load (h) | 2.1 | 1.8 -14% | 1.8 -14% | 1.7 -19% | 1.7 -19% | |
| H.264 (h) | 4.9 | 5.9 | 4.8 |
Pro
Contra
Veredicto - Muita energia bruta, mas com algumas características-chave em falta
O Pulse GL76 prega-o quando se trata de preço, desempenho e exibição. O Core i7-12700H emparelha bem com o GeForce RTX 3070 enquanto o painel de 360 Hz 1080p é o mesmo painel que a MSI usa para seu muito mais caro GT77 Titã. Por US$ 1400 ou até US$ 1200 se estiver à venda, seria difícil encontrar outro laptop de 17,3 polegadas com uma CPU, GPU e display melhor como nosso GL76.
Uma vez que você olha além dos processadores e exibe, no entanto, os cantos cortados começam a aparecer. A falta de suporte G-Sync, MUX, Advanced Optimus e Thunderbolt em particular, realmente coloca um amortecedor em um sistema de outro modo poderoso. Alternativas como o Asus TUF Gaming F17 ou Acer Predator Helios 300 trazem muitas dessas características em falta que os usuários avançados ou jogadores podem apreciar. Não esperamos que os laptops para jogos de azar tenham tais características modernas, mas o GL76 está bem acima de $1000 USD para ser merecedor de pelo menos alguns deles.
O MSI Pulse GL76 prioriza o desempenho bruto da Intel e Nvidia junto com uma tela IPS 360 Hz de alta qualidade. Faltam algumas características avançadas que provavelmente manterão os custos sob controle.
Outras desvantagens, como o clickpad esponjoso, a webcam enlameada, as dobradiças médias, a maioria de design plástico e a falta de iluminação RGB por tecla, são típicas em laptops de jogos de médio alcance e não de disjuntores. Os gamers que querem maximizar o desempenho e a qualidade de exibição sem quebrar o banco ainda devem considerar o GL76.
Preço e Disponibilidade
O Pulse GL76 conforme configurado está atualmente disponível em Costco por $1200 a $1400 USD. O modelo também está disponível na Amazon por $1650 USD, Newegg por $1750 USD, ou Melhor Compra por $1700 USD.
MSI Pulse GL76 12UGK
- 01/11/2023 v7 (old)
Allen Ngo
Price comparison

