Quase um XPS 16: Dell Inspiron 16 Plus 7610 revisão de laptop
A família Inspiron é provavelmente a maior e mais ampla família de PCs de consumo da Dell. Ela consiste no orçamento da série 3000 até a série superior 7000 em todos os tamanhos de tela, de 13 polegadas a 17 polegadas. O último Inspiron 16 é notável por ser o primeiro modelo de 16 polegadas da família equipado com certas características não encontradas em outros modelos, como originalmente anunciado em abril.
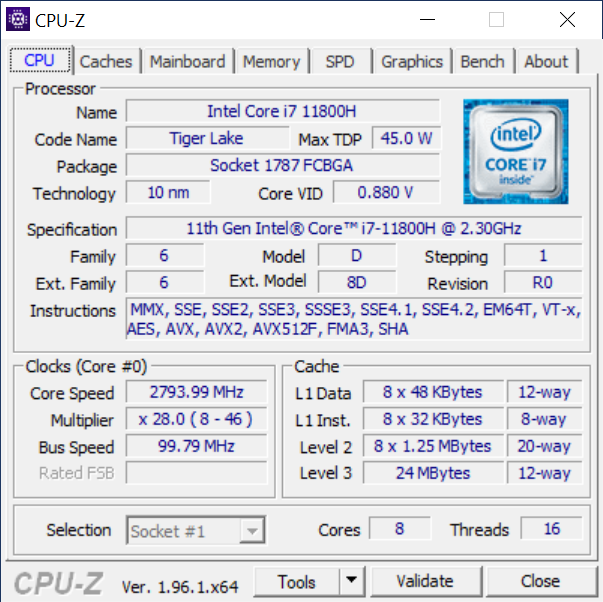
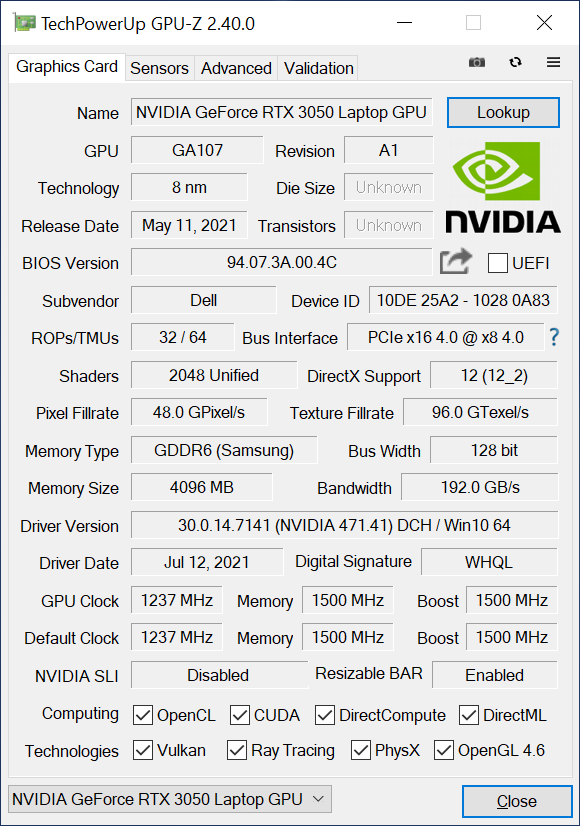
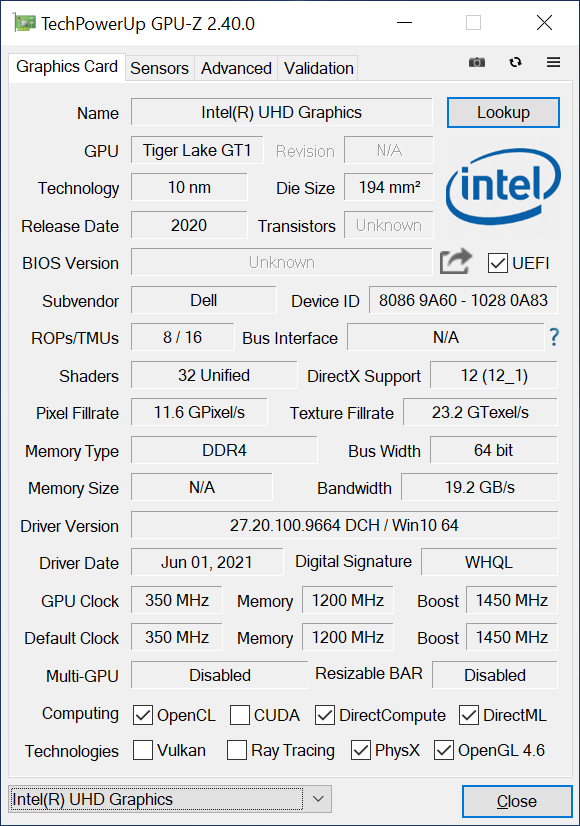
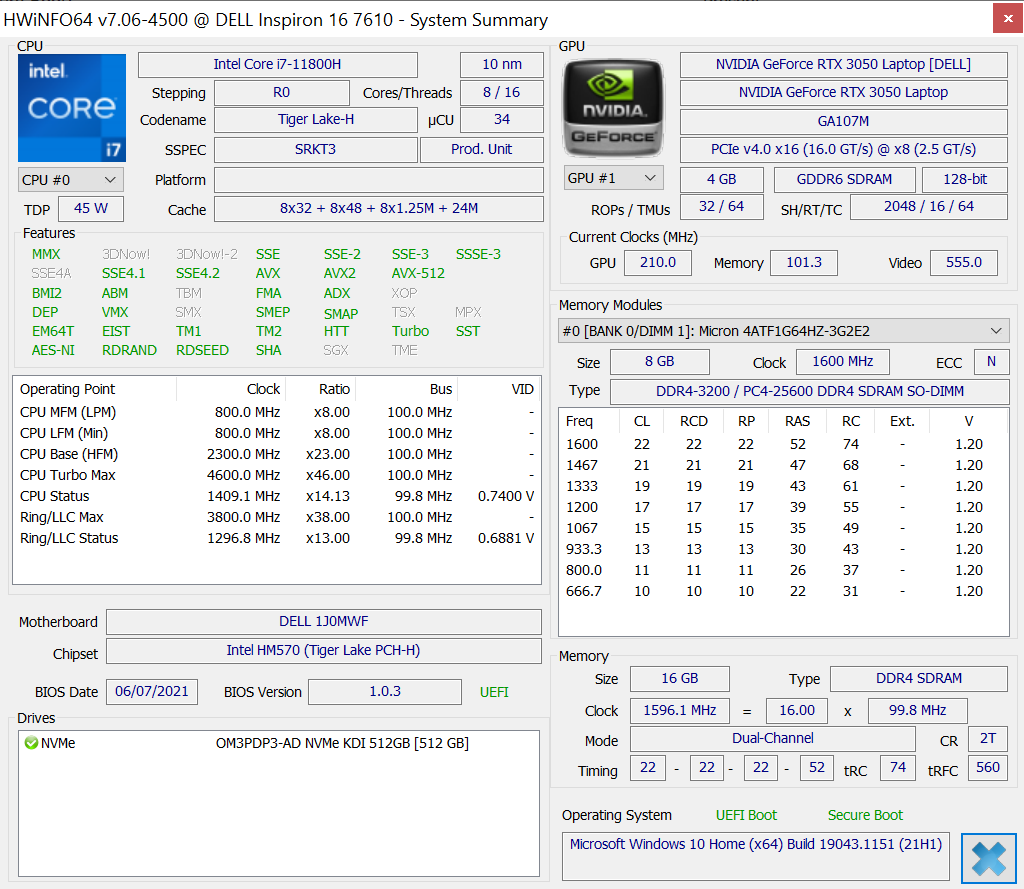
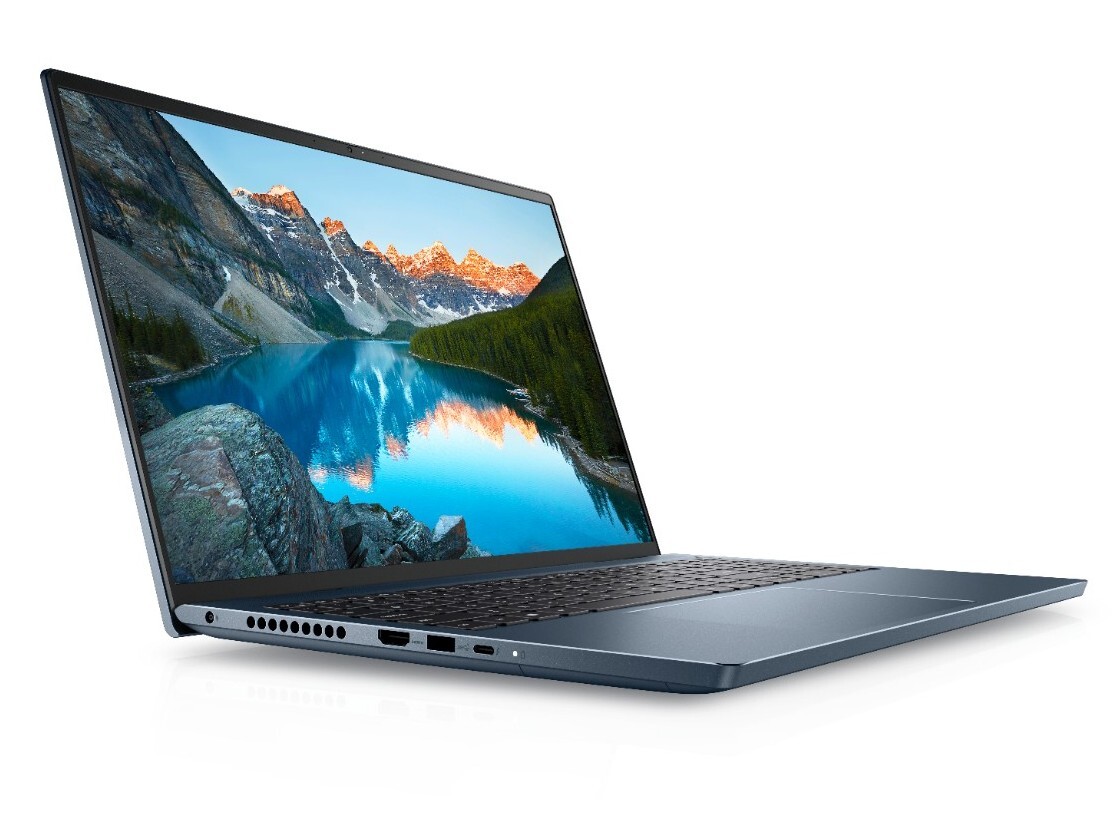
Nossa unidade de teste é uma configuração superior do Inspiron 16 7610 com a CPU Intel Core i7-11800H do 11º gênero, GeForce RTX 3050 gráficos por aproximadamente $1150 USD. Outros SKUs estão disponíveis com o menor Core i5-11400H ou integrado UHD Graphics, mas todas as opções vêm com o mesmo display de 16,0 polegadas 16:10 3K e a cor do chassi Mist Blue. O sistema é comercializado como uma máquina Nvidia Studio para contrastar a série G centrada em jogos ou a série XPS de prosumer.
Os concorrentes diretos incluem outros laptops multimídia de 16 polegadas como o LG Gram 16, Honor MagicBook Pro, ou o MacBook Pro 16.
Mais análises da Dell:
potential competitors in comparison
Avaliação | Data | Modelo | Peso | Altura | Size | Resolução | Preço |
|---|---|---|---|---|---|---|---|
| 86.7 % v7 (old) | 08/2021 | Dell Inspiron 16 Plus 7610 i7-11800H, GeForce RTX 3050 4GB Laptop GPU | 2 kg | 18.99 mm | 16.00" | 3072x1920 | |
| 87.4 % v7 (old) | 08/2021 | Lenovo Legion 5 Pro 16ACH6H (82JQ001PGE) R7 5800H, GeForce RTX 3070 Laptop GPU | 2.6 kg | 26.85 mm | 16.00" | 2560x1600 | |
| 85.6 % v7 (old) | 07/2021 | Asus ROG Zephyrus M16 GU603H i9-11900H, GeForce RTX 3070 Laptop GPU | 2 kg | 20 mm | 16.00" | 2560x1600 | |
| 86.3 % v7 (old) | 06/2021 | LG Gram 16 (2021) i7-1165G7, Iris Xe G7 96EUs | 1.2 kg | 16.8 mm | 16.00" | 2560x1600 | |
| 79.9 % v7 (old) | 08/2020 | HP Pavilion Gaming 16-a0242ng i5-10300H, GeForce GTX 1650 Ti Mobile | 2.2 kg | 23.5 mm | 16.10" | 1920x1080 | |
| 82.4 % v7 (old) | 01/2021 | Dell Inspiron 15 7000 7506 2-in-1 Black Edition i7-1165G7, Xe MAX | 1.9 kg | 17.94 mm | 15.60" | 3840x2160 |
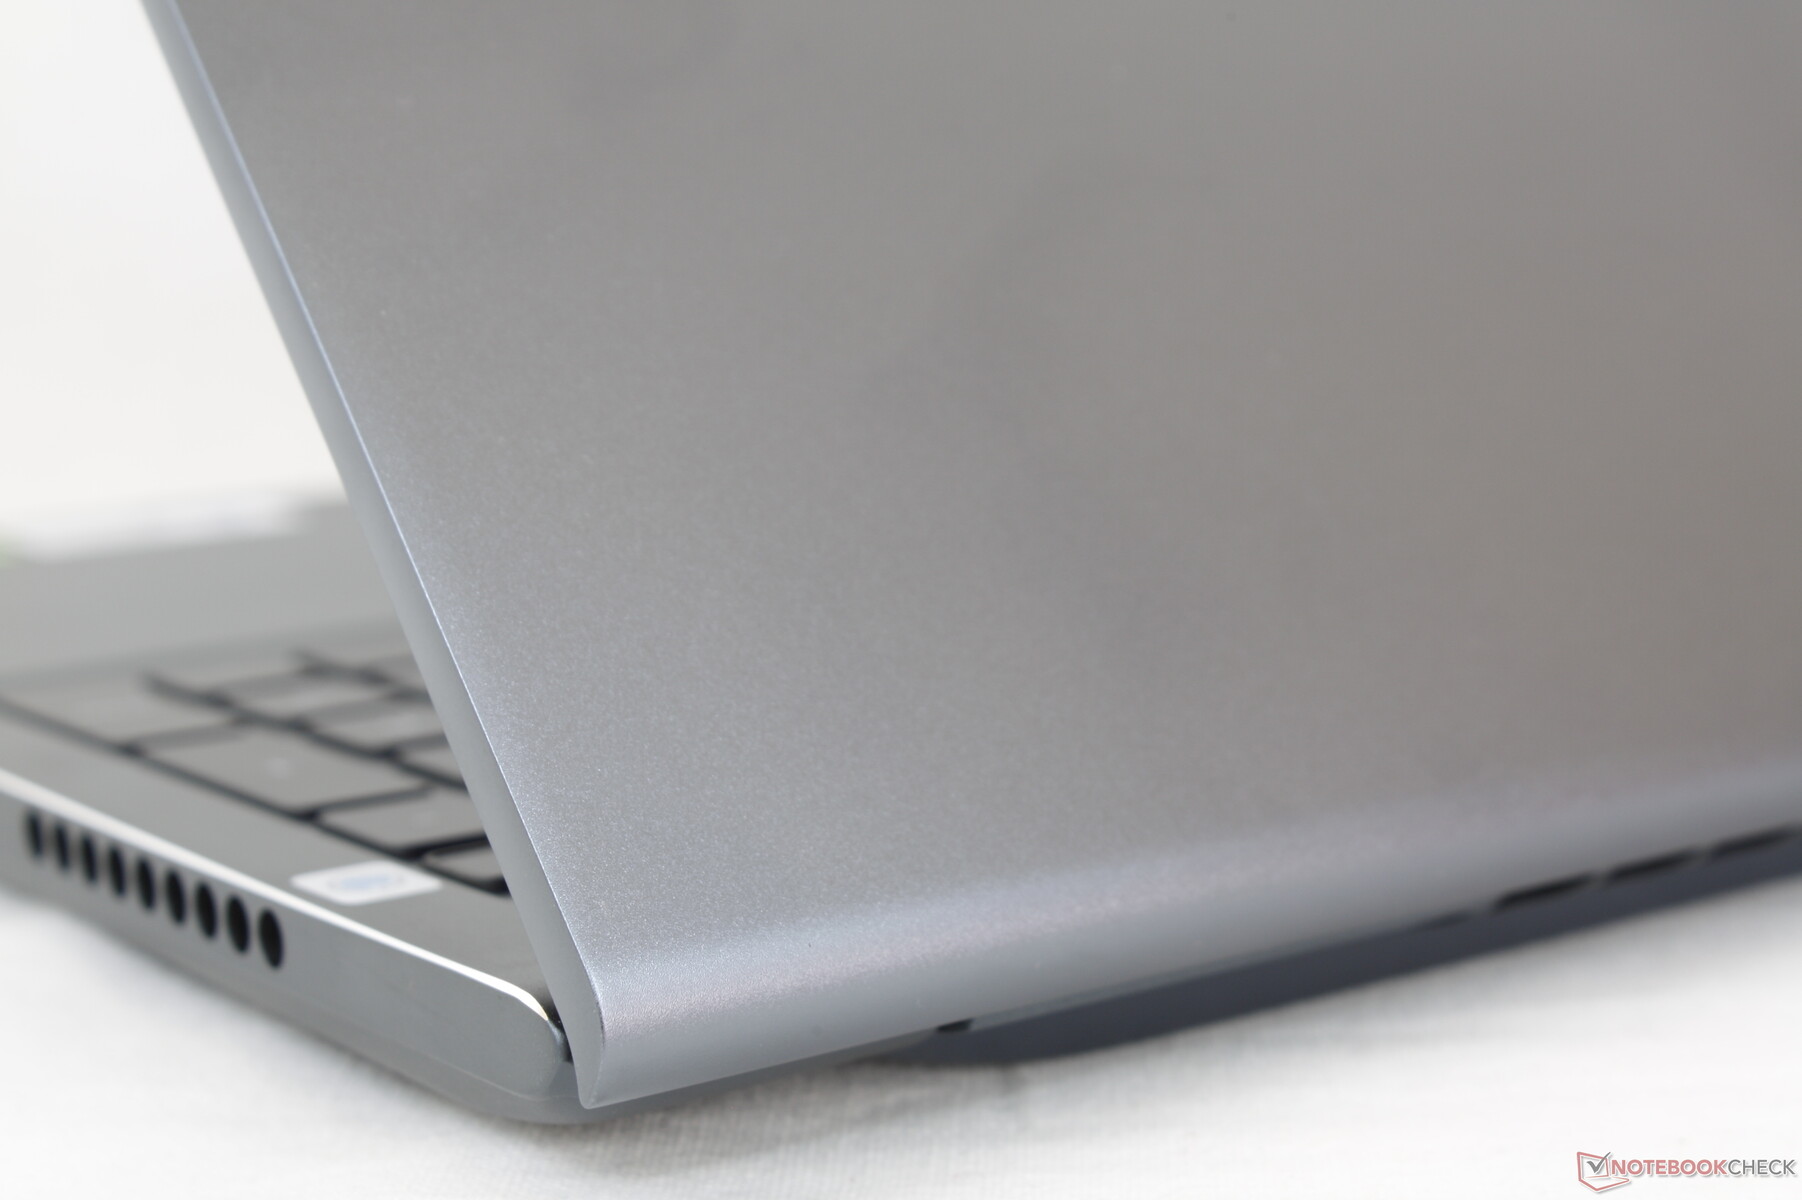
Estojo - Forte e Pesado
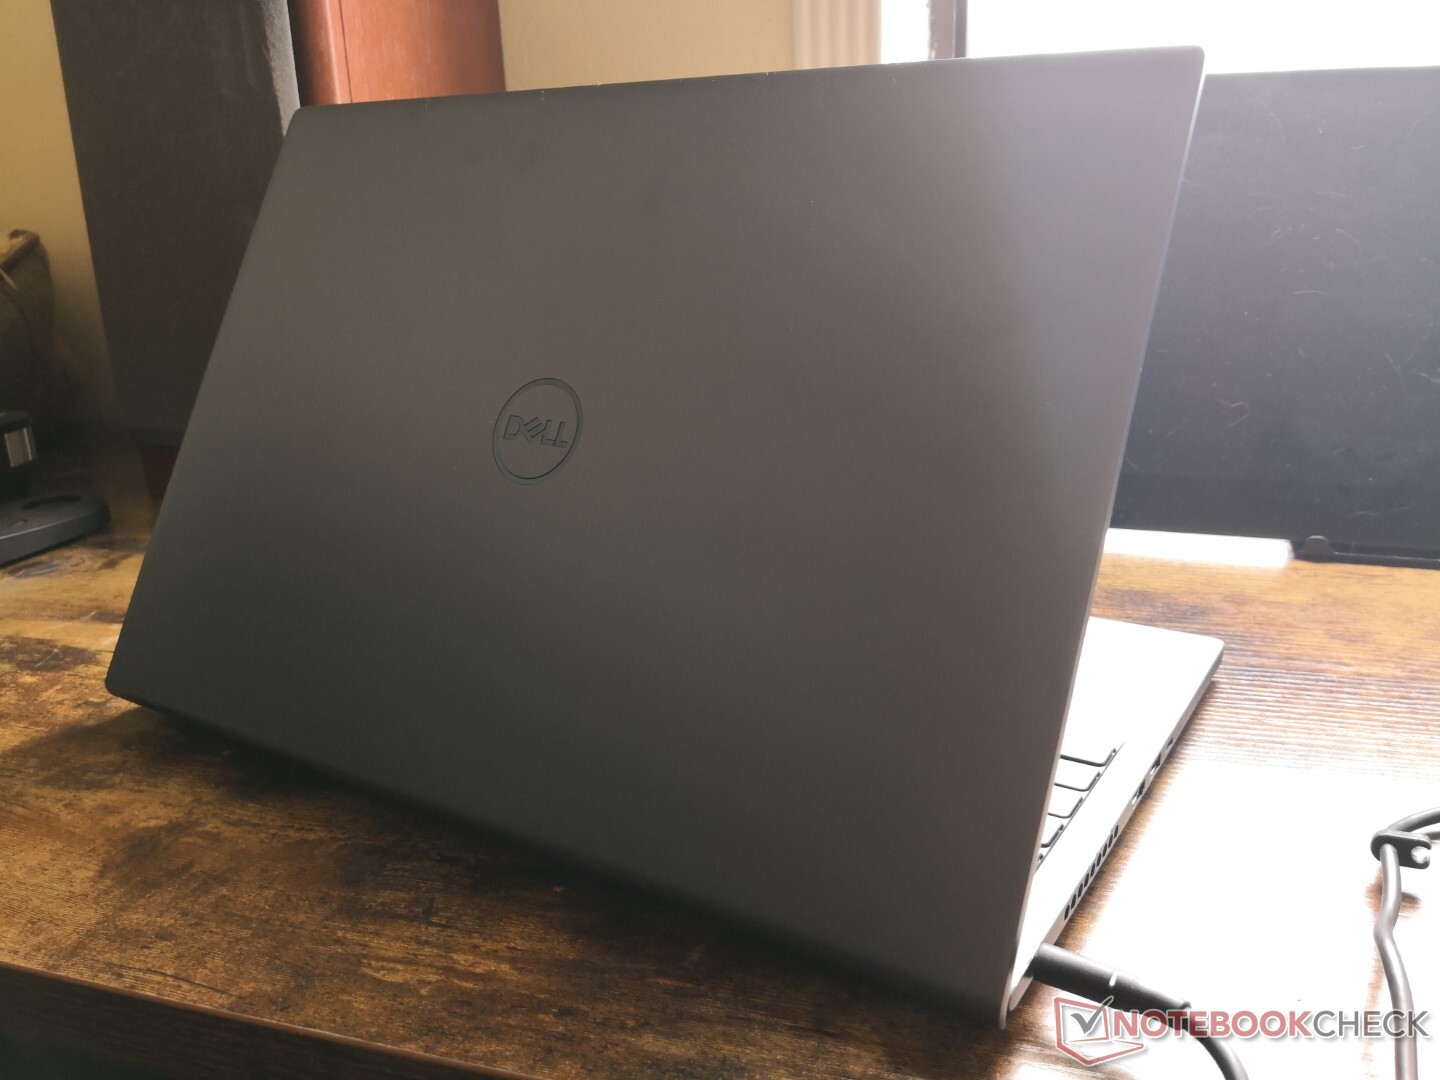
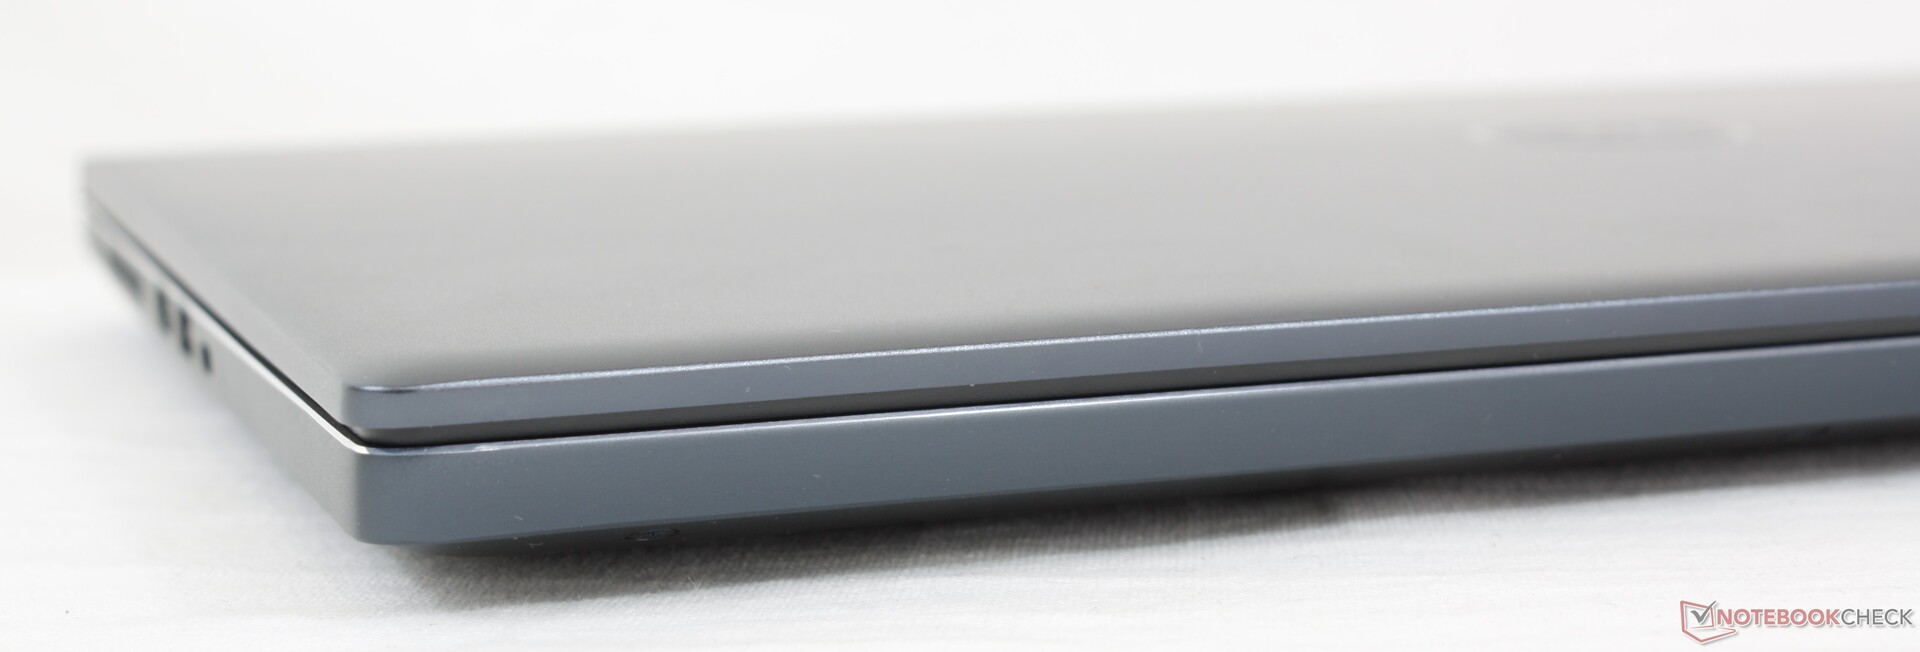
O sistema parece ser um novo projeto não derivado de nenhum modelo Inspiron 15 ou 17 existente. O atual Inspiron 15A base, por exemplo, utiliza dobradiças que levantam a base em um ângulo sem grelhas de ventilação ostensivas ao longo dos lados ou atrás. Em contraste, o Inspiron 16 metálico tem dobradiças mais tradicionais com grelhas de ventilação visíveis em toda a volta. O chassi e a tampa são mais rígidos e de melhor qualidade do que qualquer outro Inspiron 15 que testamos até agora. É mais fraco na tampa externa onde não recomendamos o empilhamento de livros pesados
A construção sólida vem ao custo do peso, pois o Inspiron 16 é mais pesado que o já pesadoXPS 15. Quando comparado com outros modelos de 16 polegadas, o sistema é muitopróximo do mais potente Asus Zephyrus M16 enquanto é menor e mais leve que o Pavilion Jogos 16.
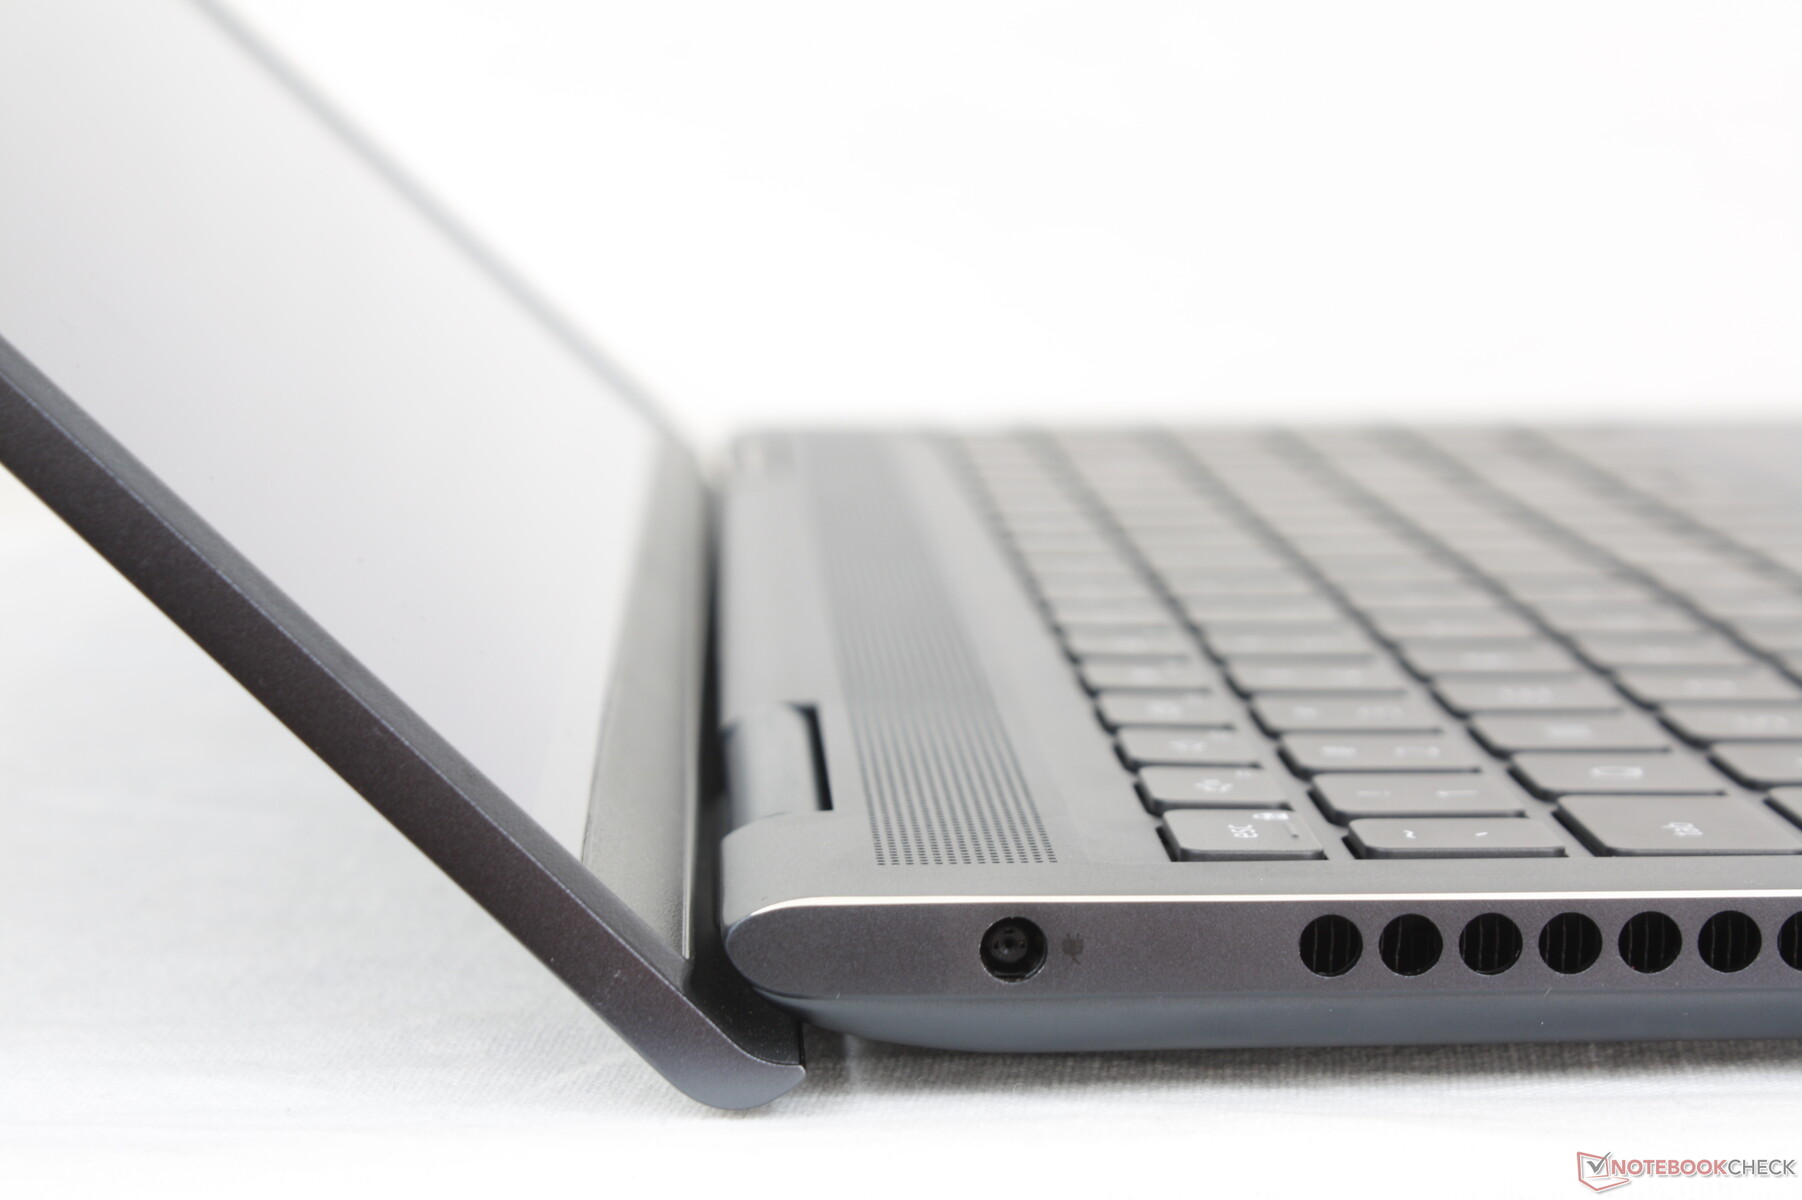
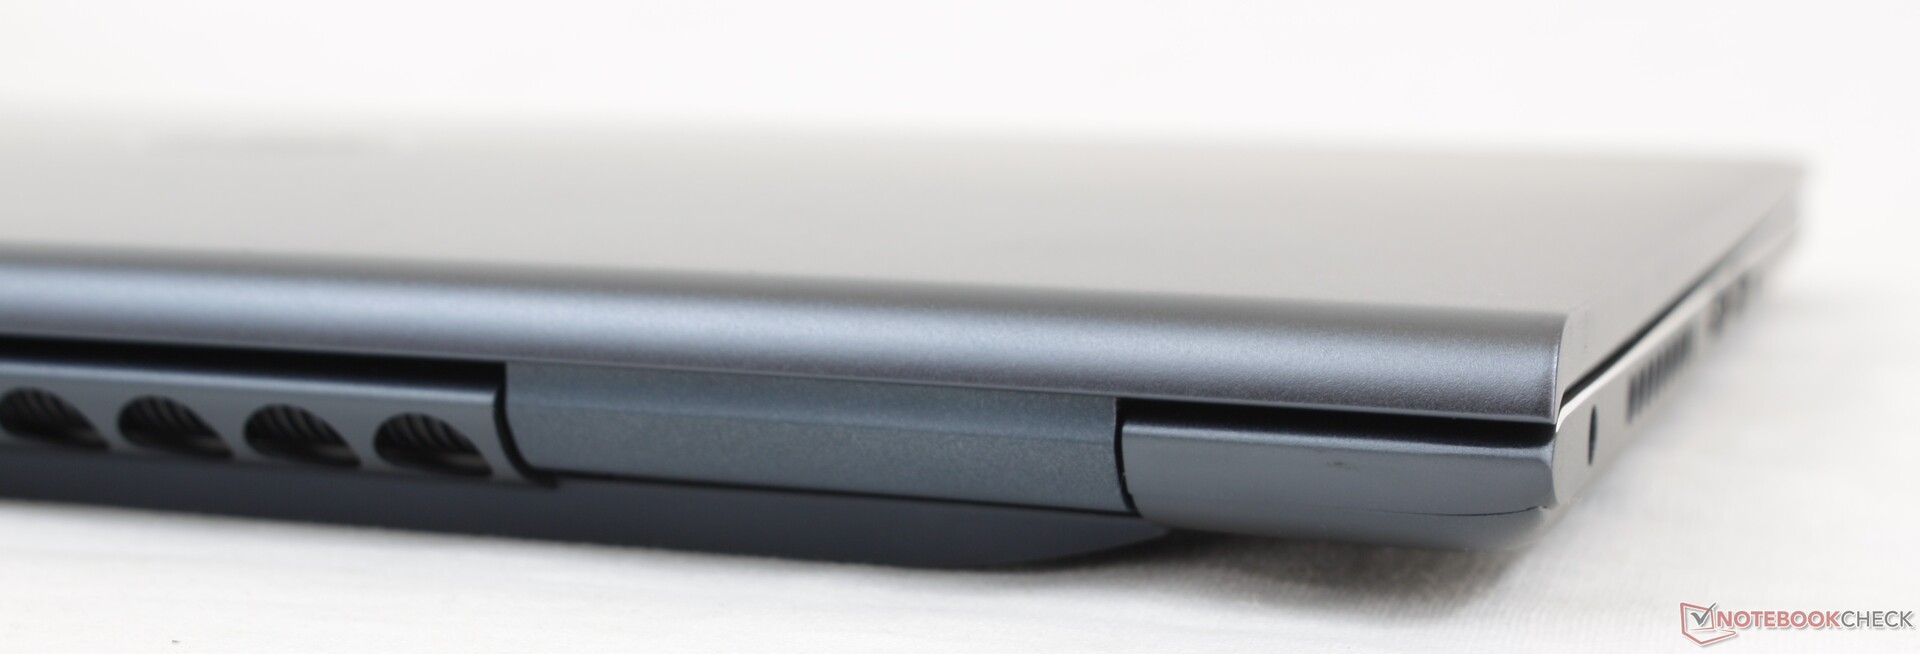
Conectividade - Um Pouco de Tudo
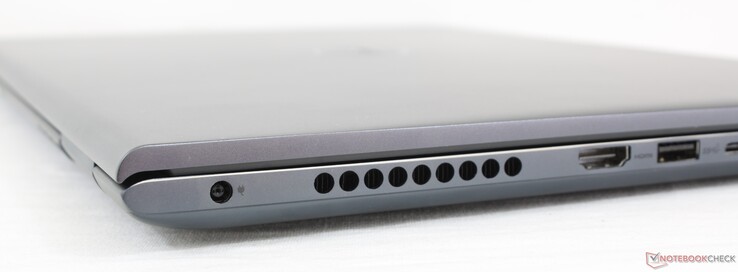
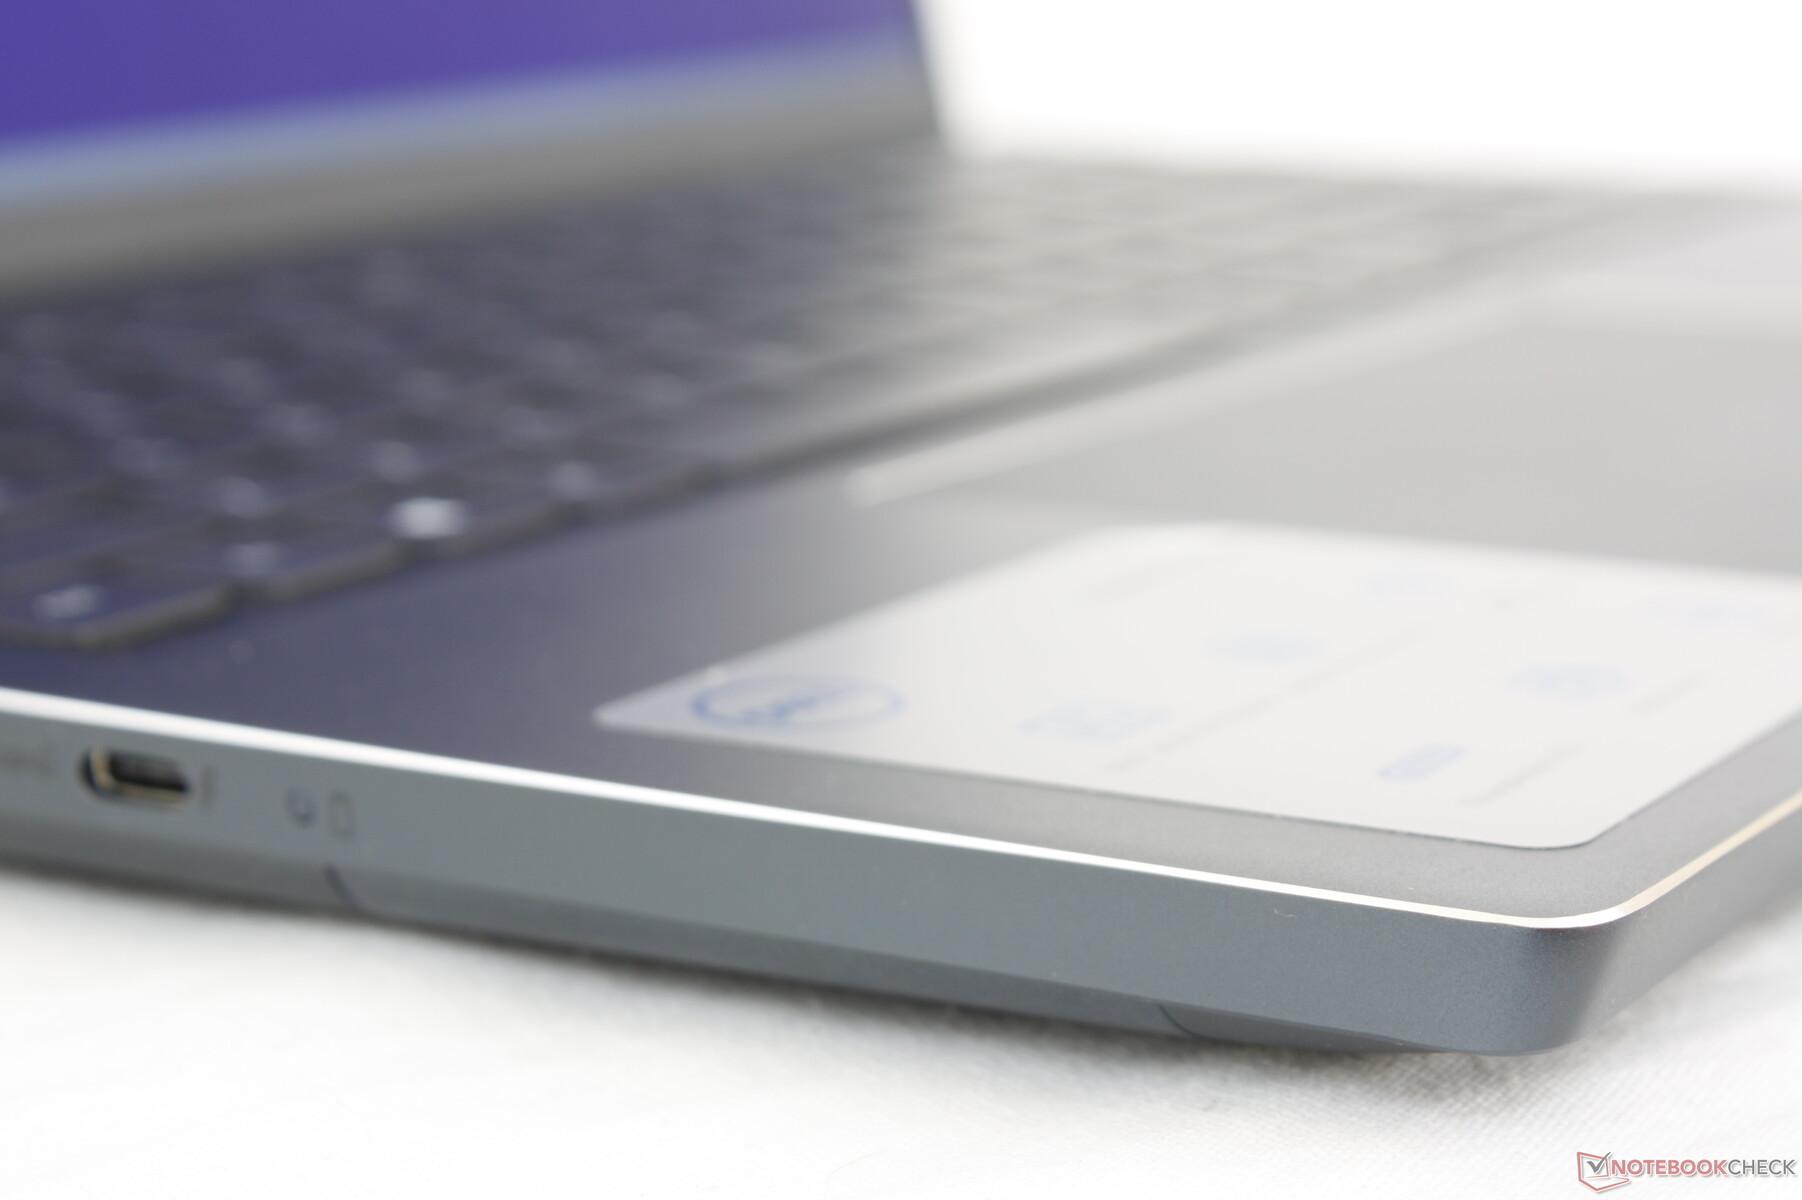
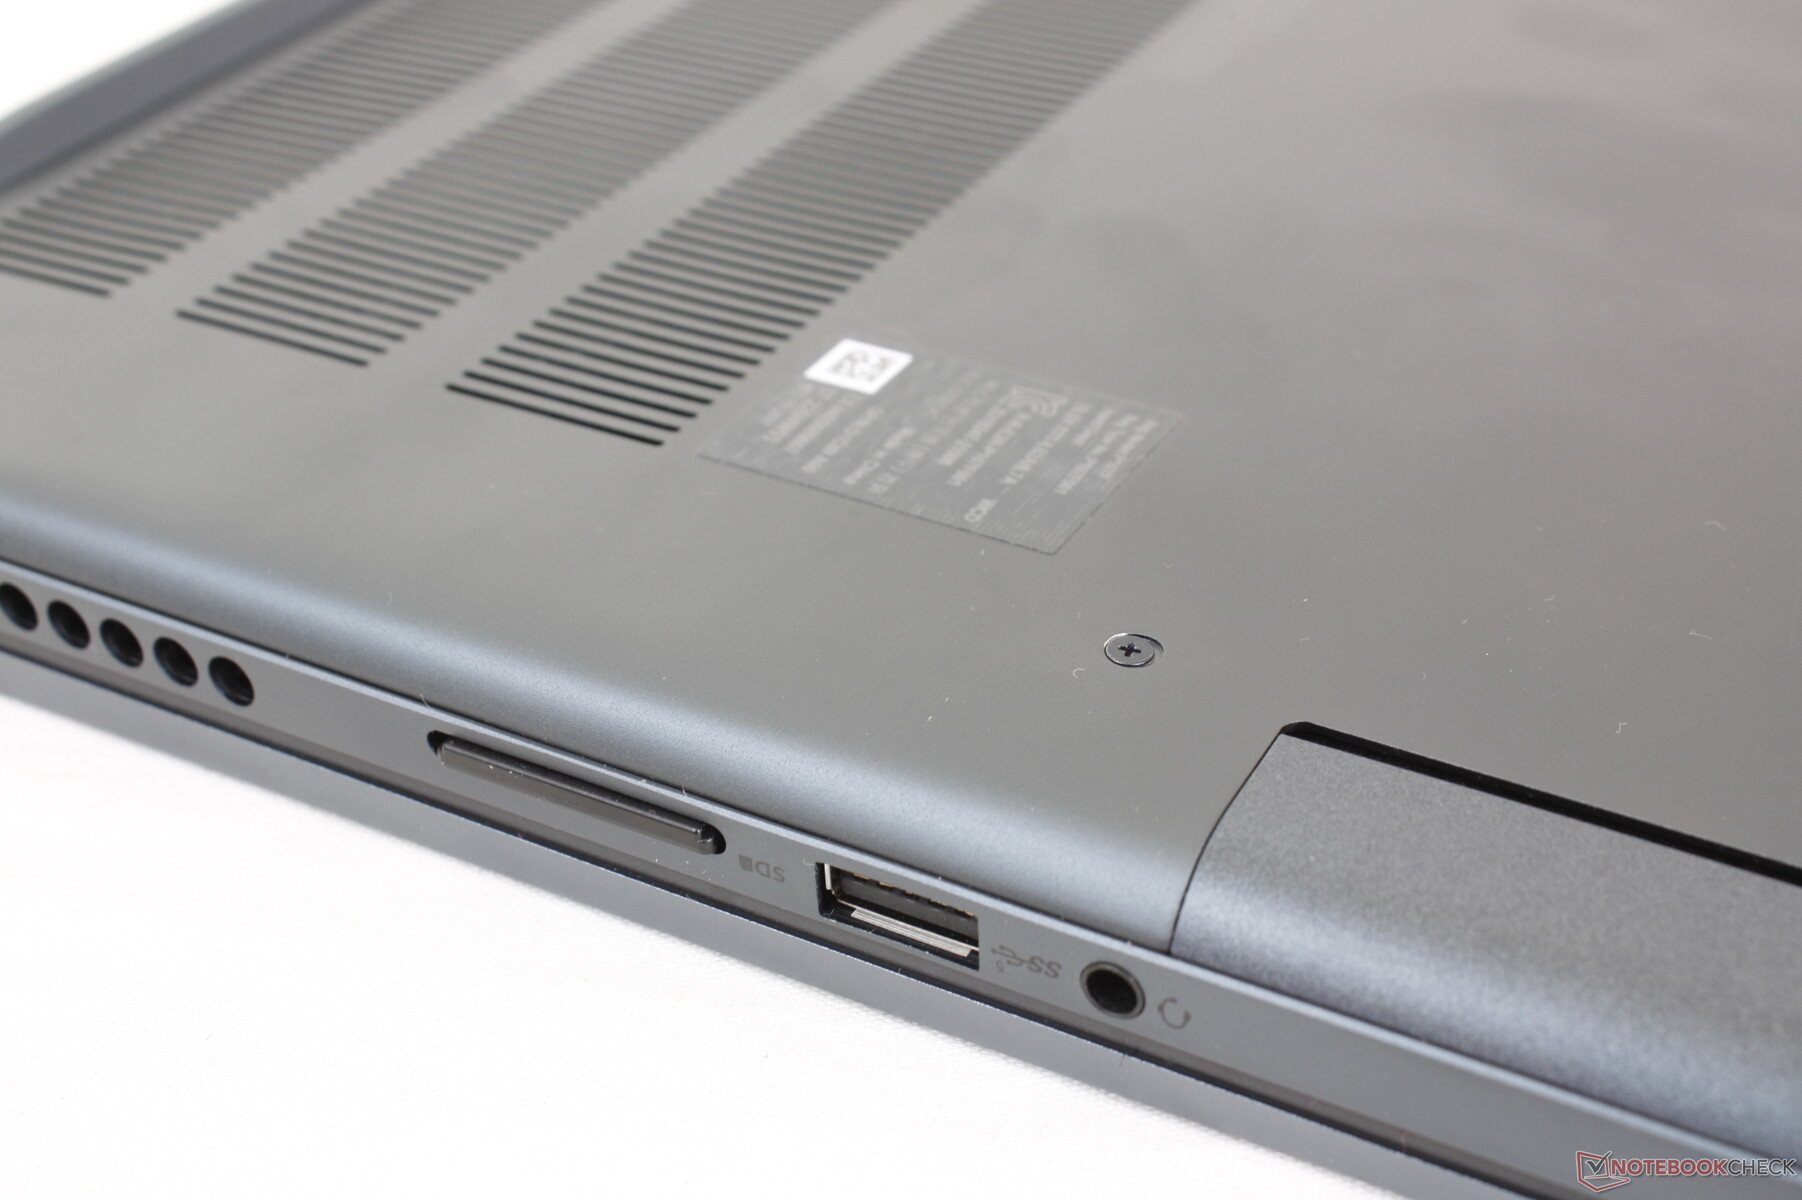
As opções de porto são similares às doInspiron 15 7506 2 em 1 mas com duas pequenas diferenças: o leitor MicroSD foi atualizado para o tamanho completo enquanto o posicionamento das portas é ligeiramente diferente devido às novas grelhas de ventilação. As portas são mais variadas aqui, ao contrário da linha XPS, onde as portas USB-C têm prioridade sobre tudo o resto.
Vale a pena notar que tivemos um problema em que nenhuma das duas portas USB-A pôde reconhecer nosso SSD externo. A conexão de nossa unidade à porta USB-C, no entanto, não mostraria nenhum problema. Recomendamos verificar as portas USB-A imediatamente após a compra para qualquer problema em potencial.
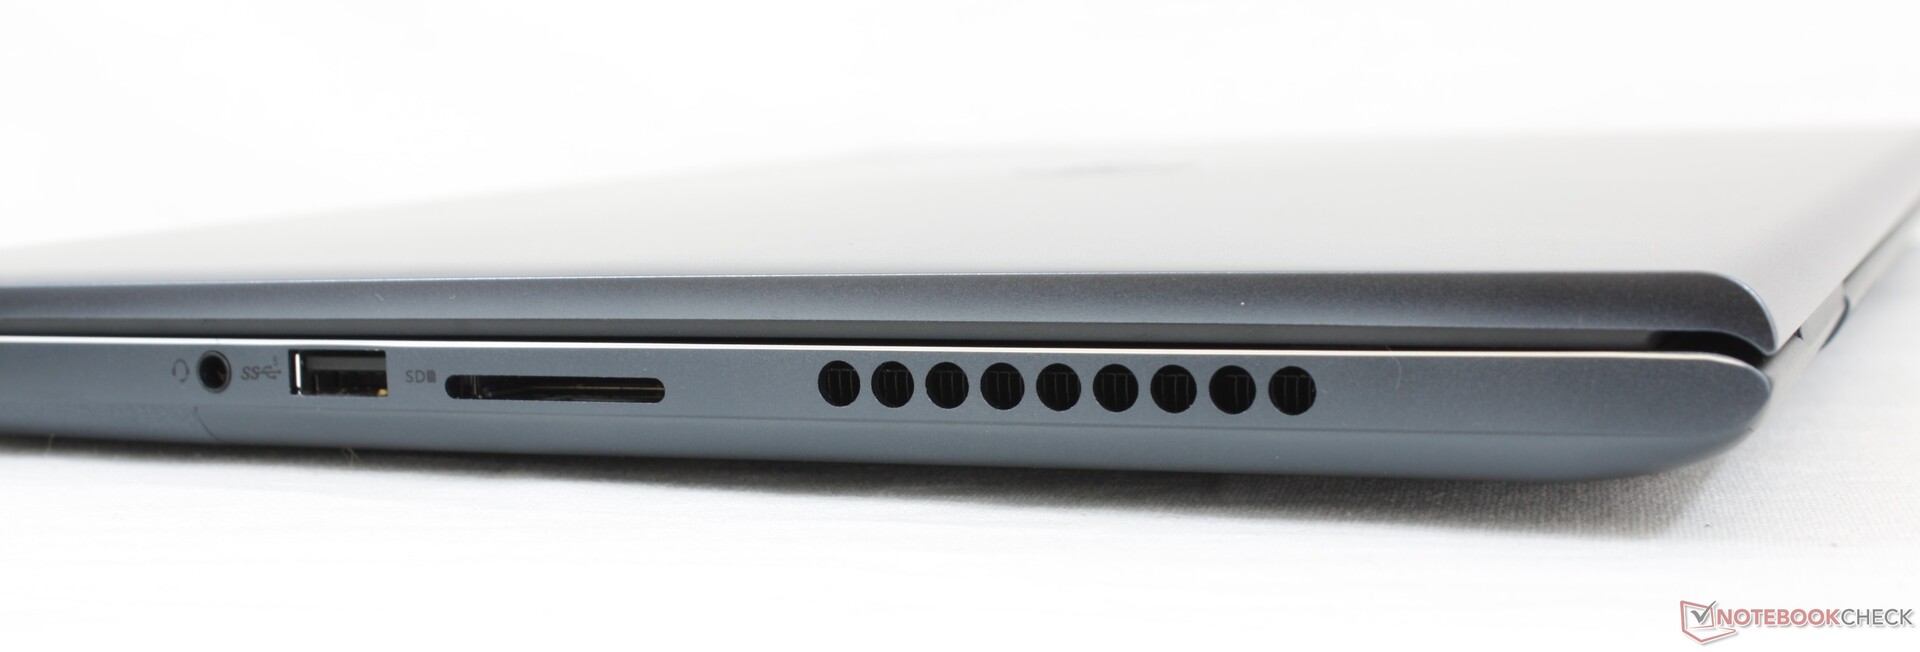
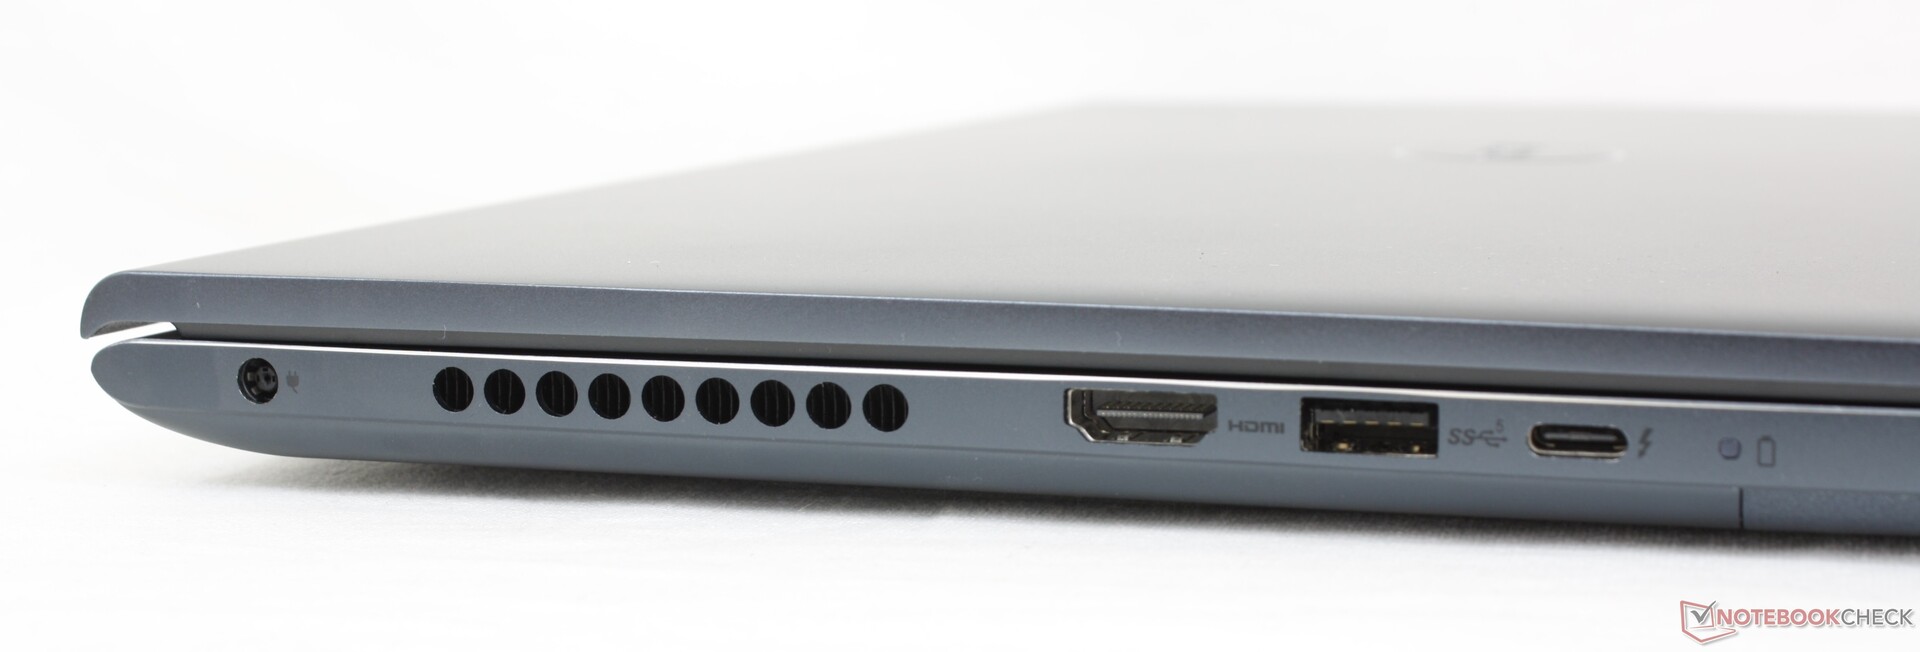
Leitor de cartões SD
As taxas de transferência do leitor SD carregado com mola são muito lentas. A transferência de 1 GB de fotos de nosso cartão de teste UHS-II para a área de trabalho leva mais de 50 segundos em comparação com apenas 6 segundos no XPS 15.
| SD Card Reader | |
| average JPG Copy Test (av. of 3 runs) | |
| Asus ROG Zephyrus M16 GU603H (AV PRO microSD 128 GB V60) | |
| LG Gram 16 (2021) (Toshiba Exceria Pro M501 microSDXC 64GB) | |
| HP Pavilion Gaming 16-a0242ng (Toshiba Exceria Pro SDXC 64 GB UHS-II) | |
| Dell Inspiron 15 7000 7506 2-in-1 Black Edition (Toshiba Exceria Pro M501 microSDXC 32GB) | |
| Dell Inspiron 16 Plus 7610 (AV PRO microSD 128 GB V60) | |
| maximum AS SSD Seq Read Test (1GB) | |
| Asus ROG Zephyrus M16 GU603H (AV PRO microSD 128 GB V60) | |
| LG Gram 16 (2021) (Toshiba Exceria Pro M501 microSDXC 64GB) | |
| HP Pavilion Gaming 16-a0242ng (Toshiba Exceria Pro SDXC 64 GB UHS-II) | |
| Dell Inspiron 15 7000 7506 2-in-1 Black Edition (Toshiba Exceria Pro M501 microSDXC 32GB) | |
| Dell Inspiron 16 Plus 7610 (AV PRO microSD 128 GB V60) | |
Comunicação
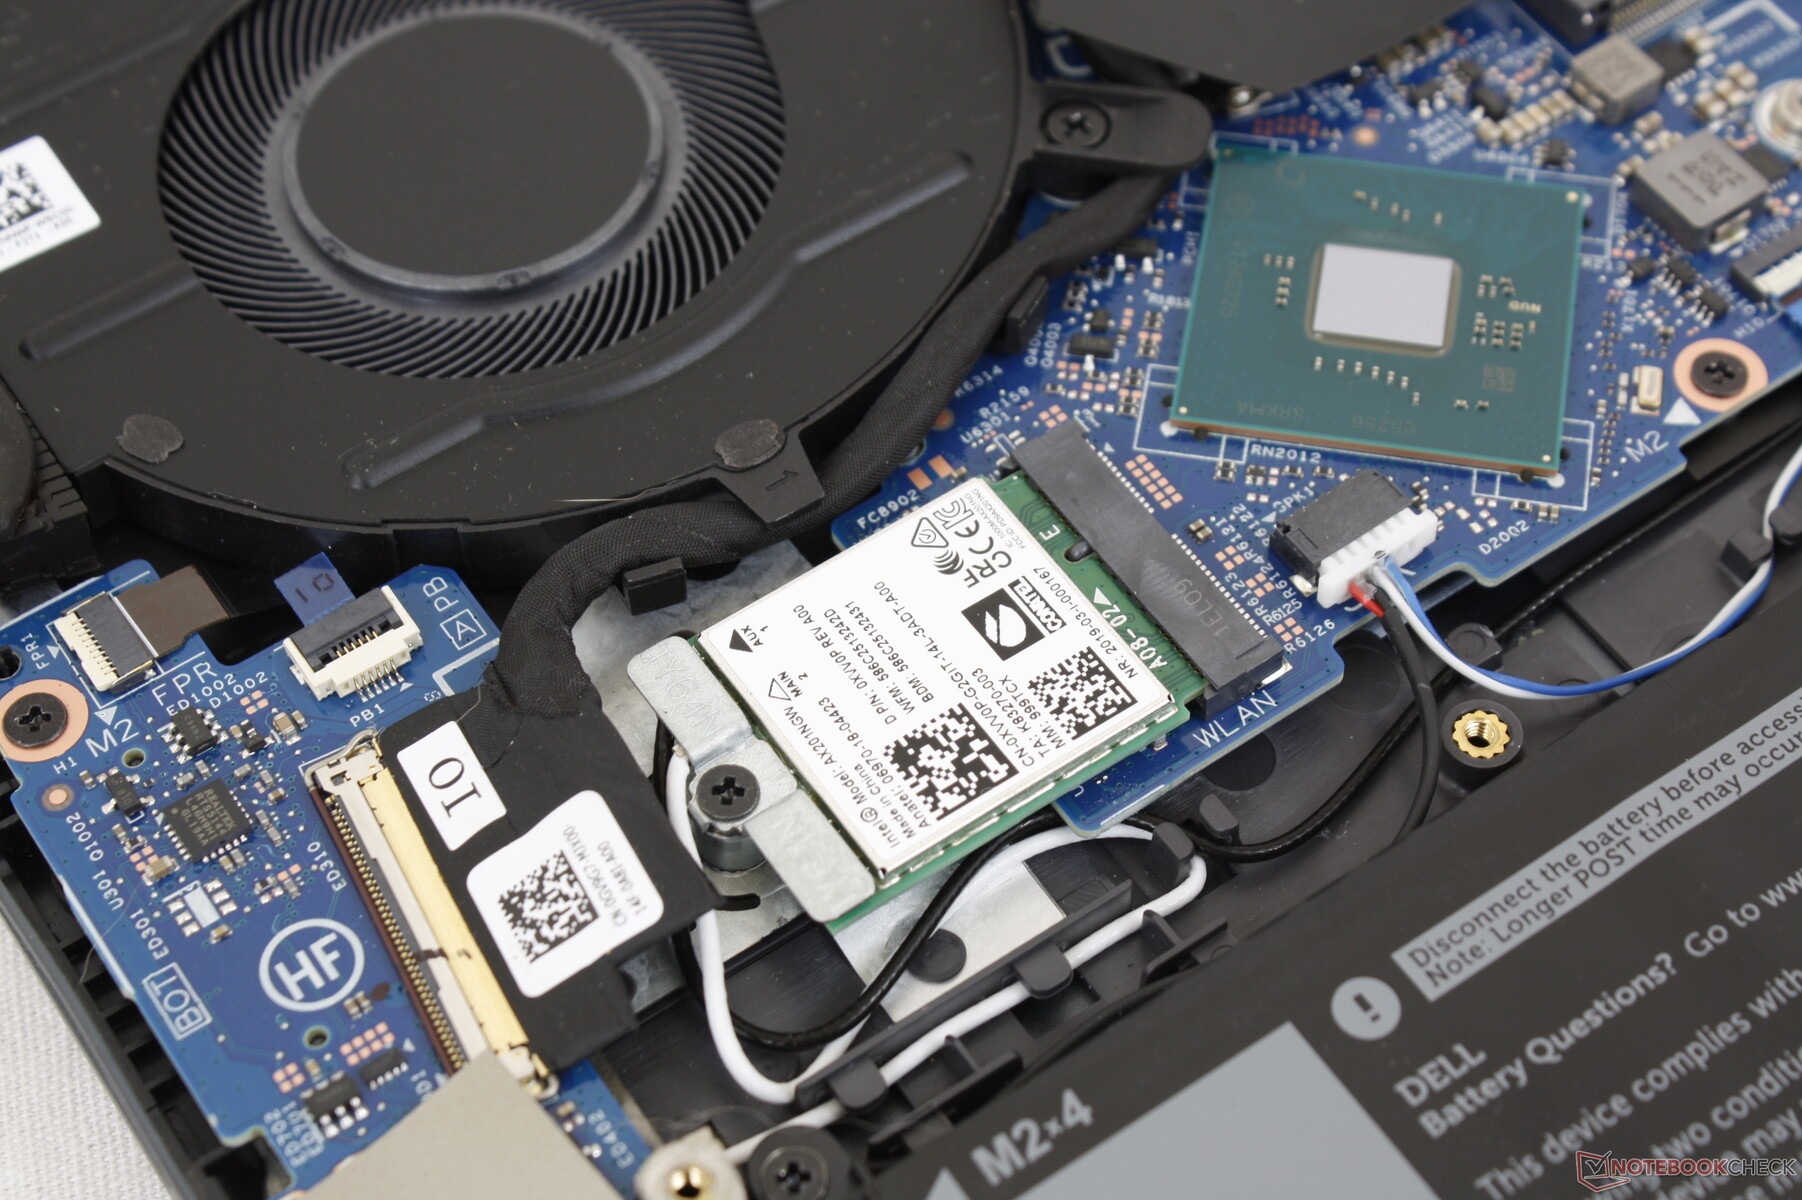
O Intel AX201 vem como padrão para conectividade Wi-Fi 6 e Bluetooth 5.1. Não tivemos nenhum problema quando acoplado ao nosso roteador de teste Netgear RAX200.
Webcam
A câmera é a qualidade padrão de 1 MP ou 720p que todos nós estamos familiarizados com a maioria dos laptops. Embora ela integre um obturador manual, não inclui as capacidades IR ou Windows Hello.


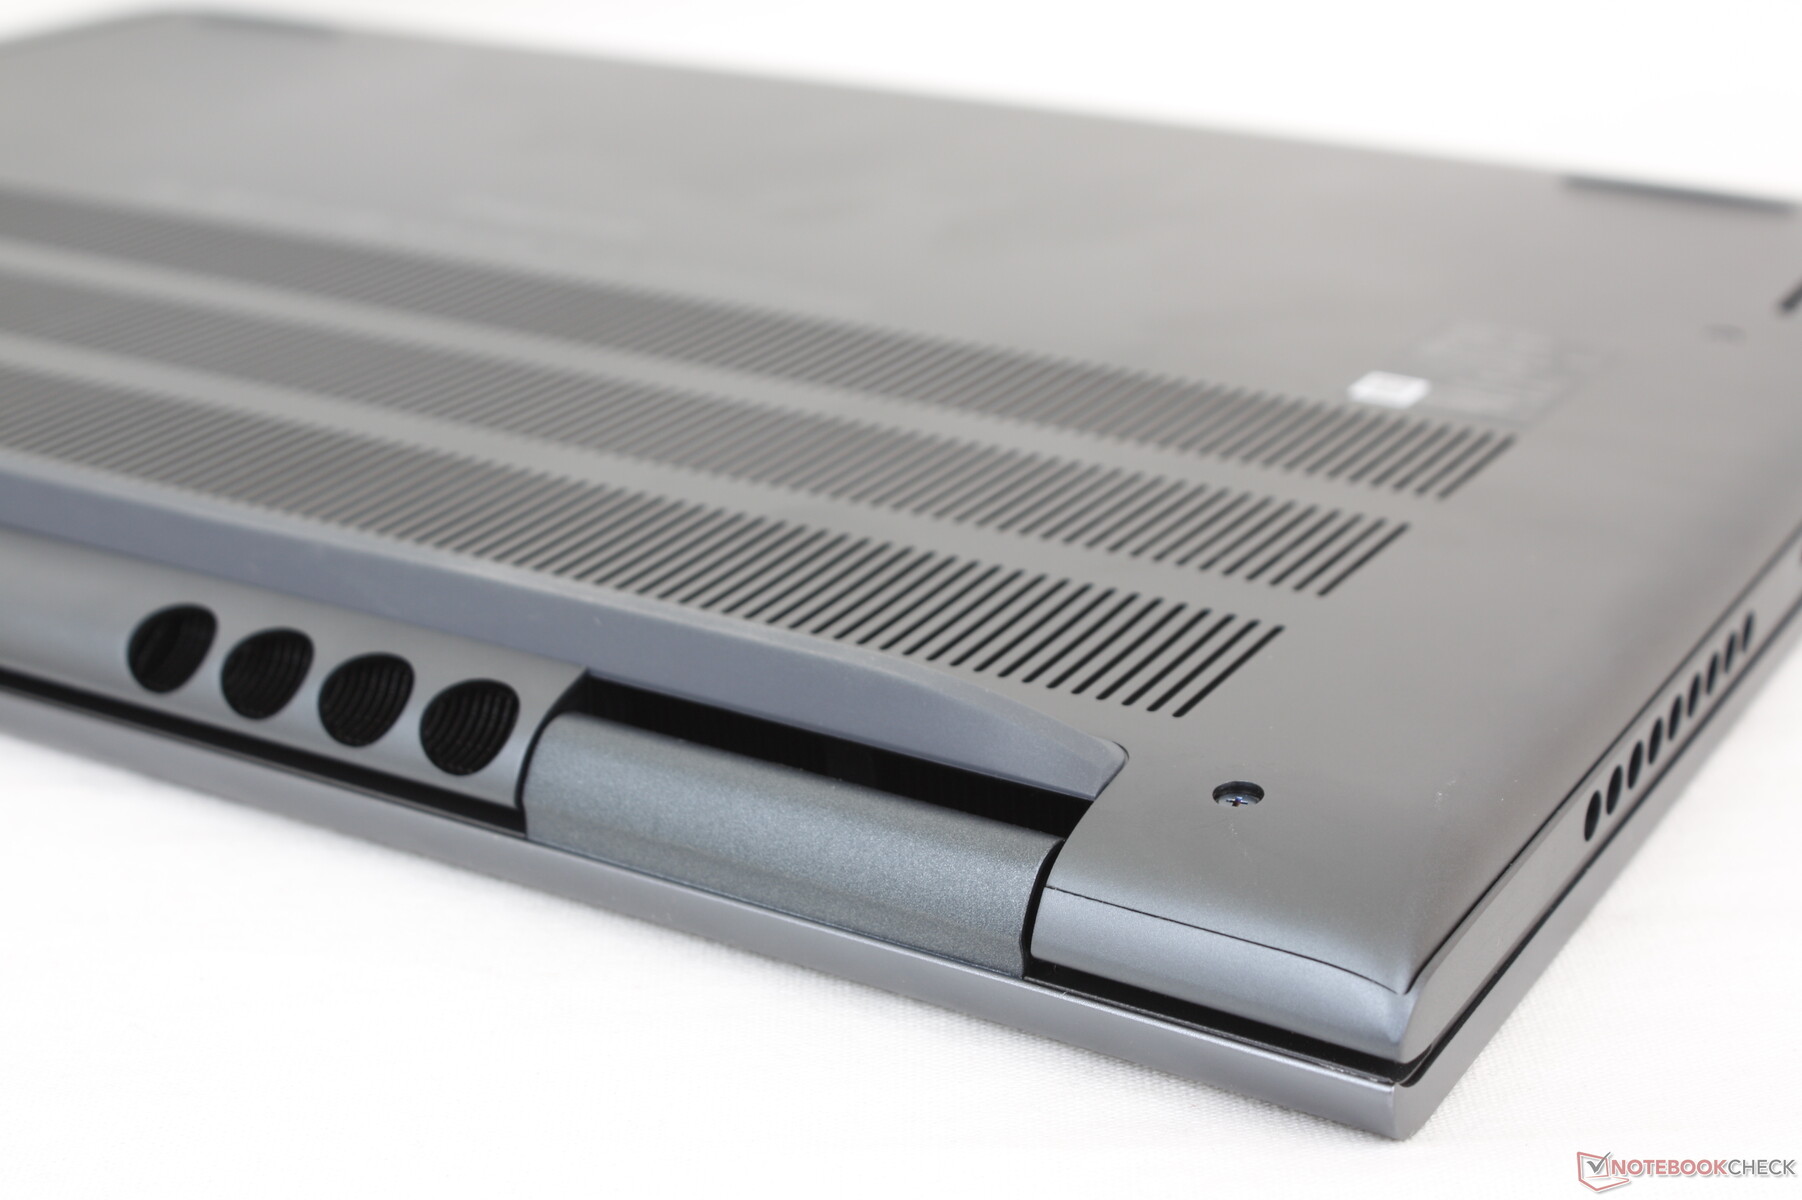
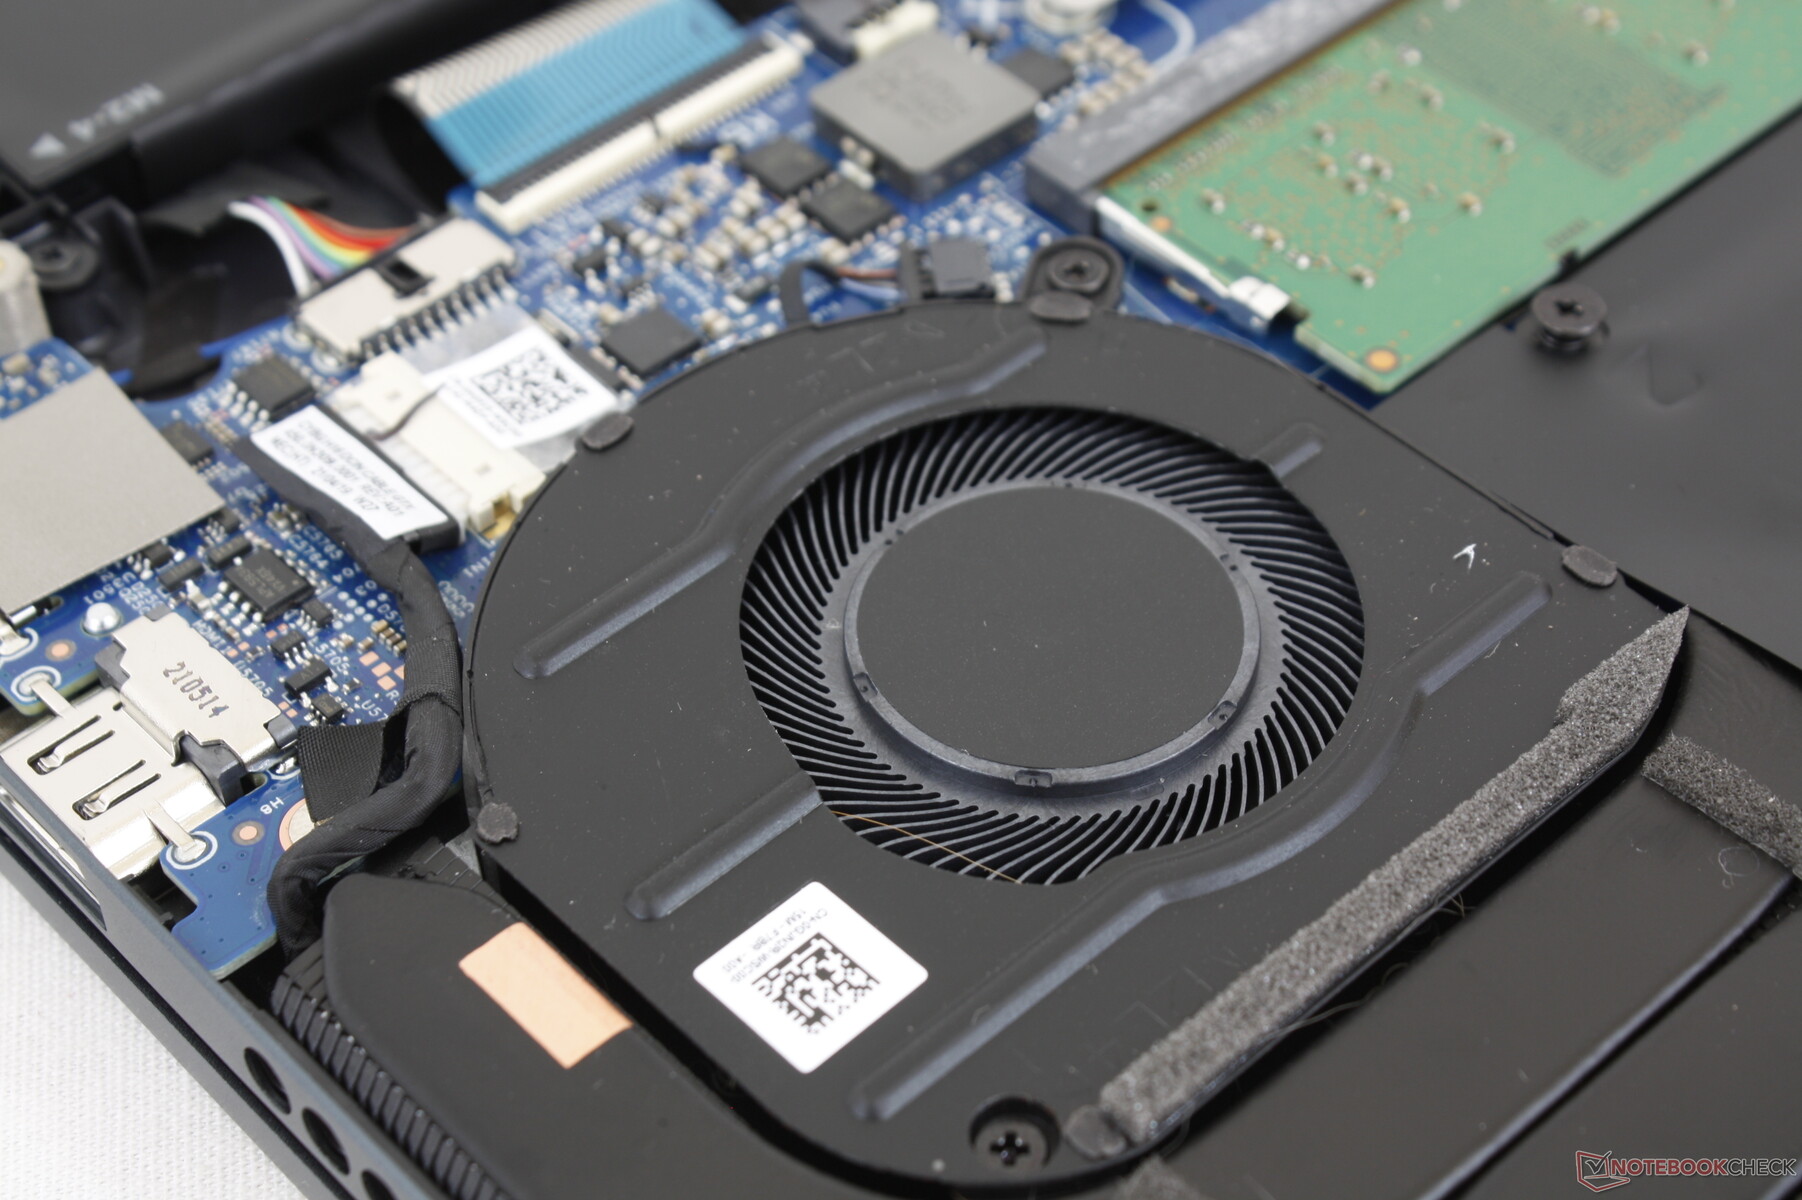
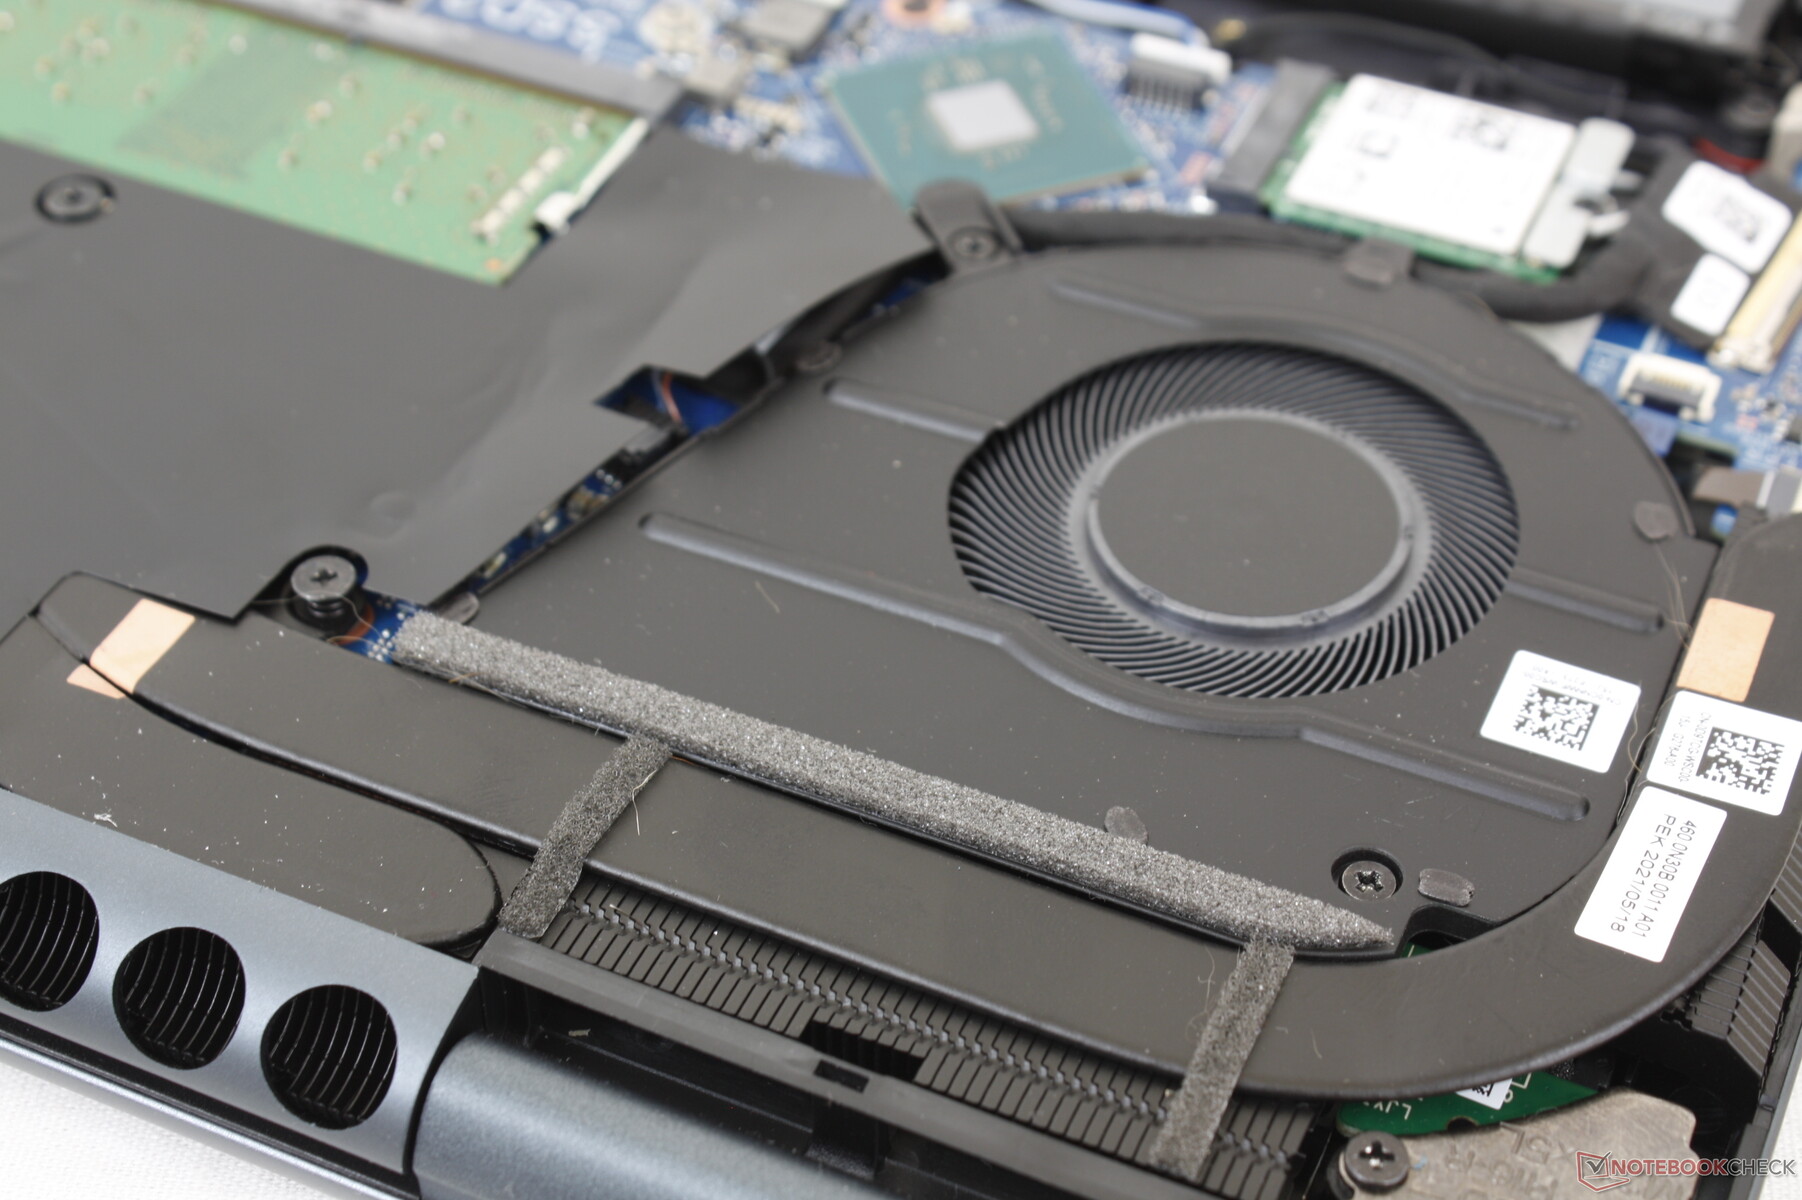
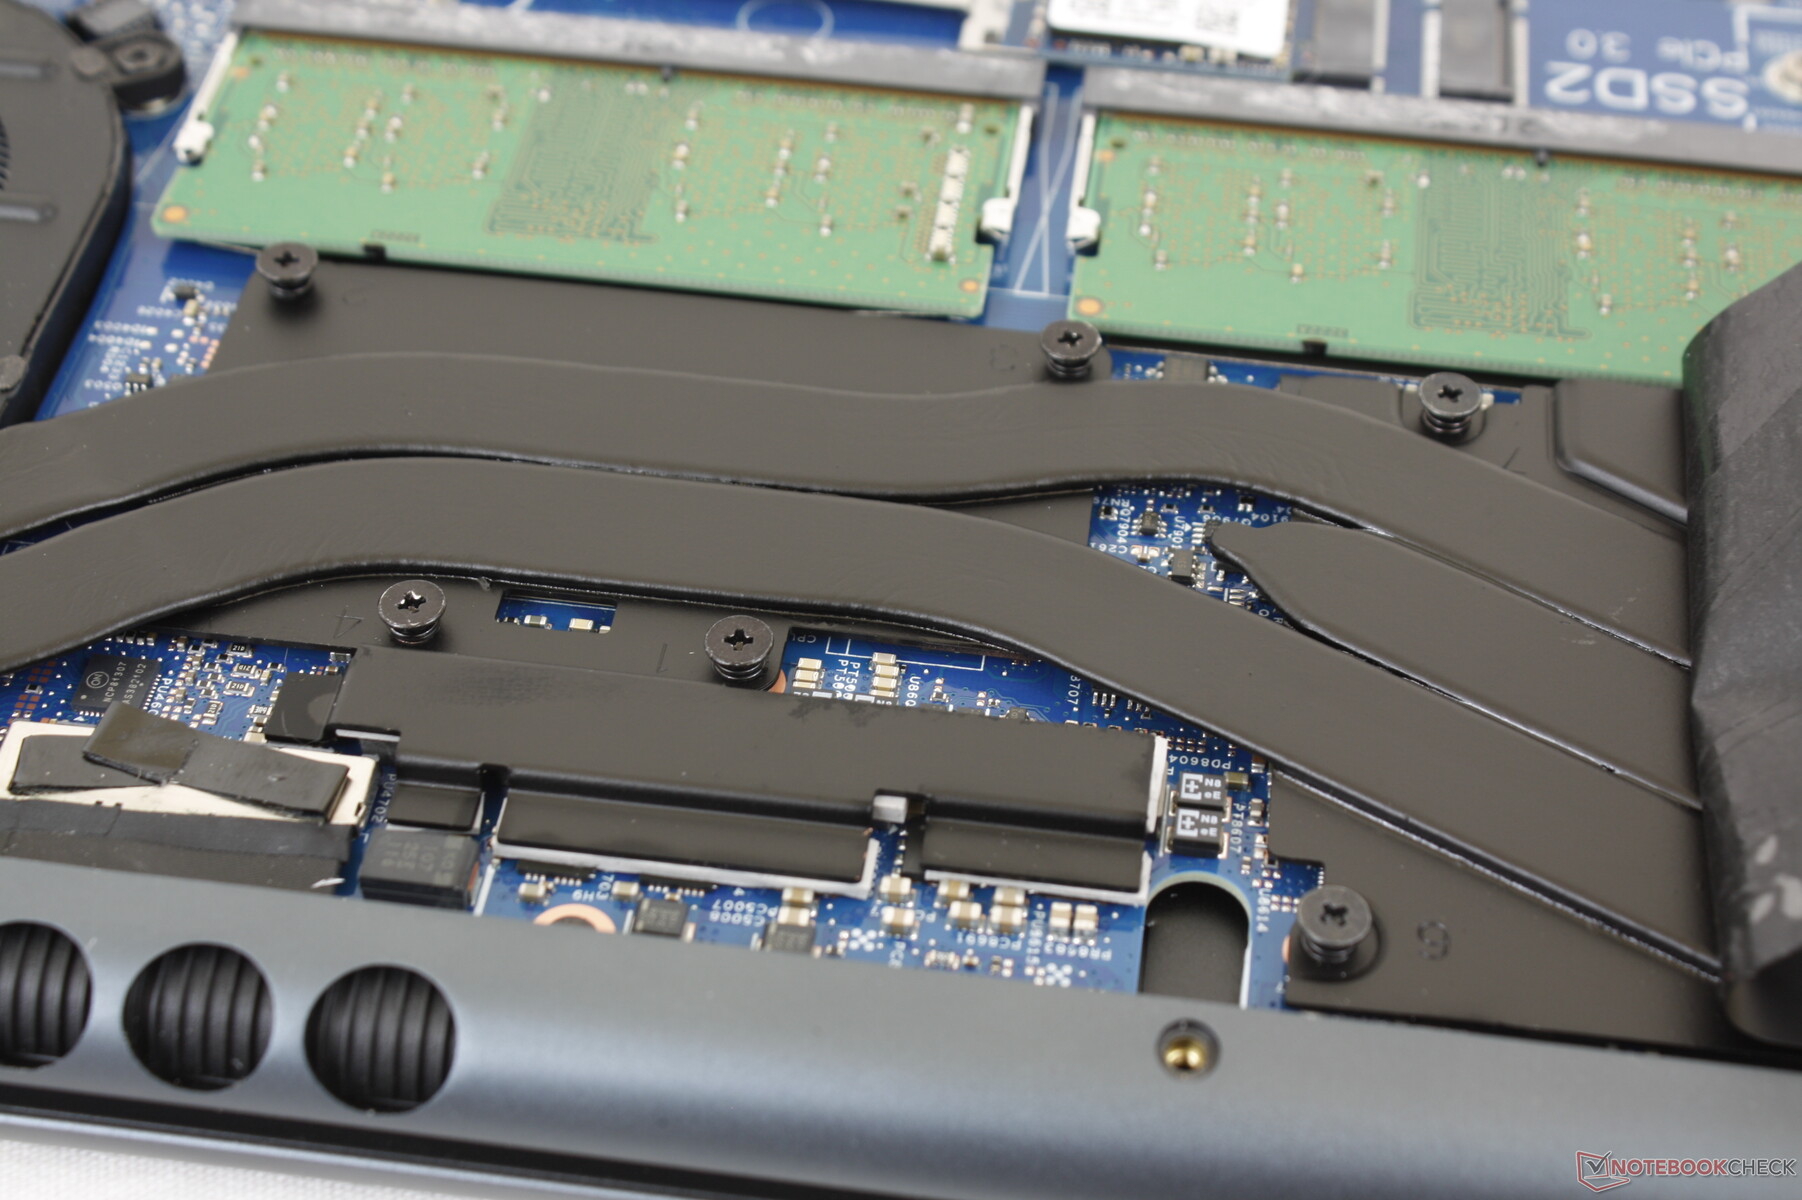
Manutenção - Upgrades fáceis
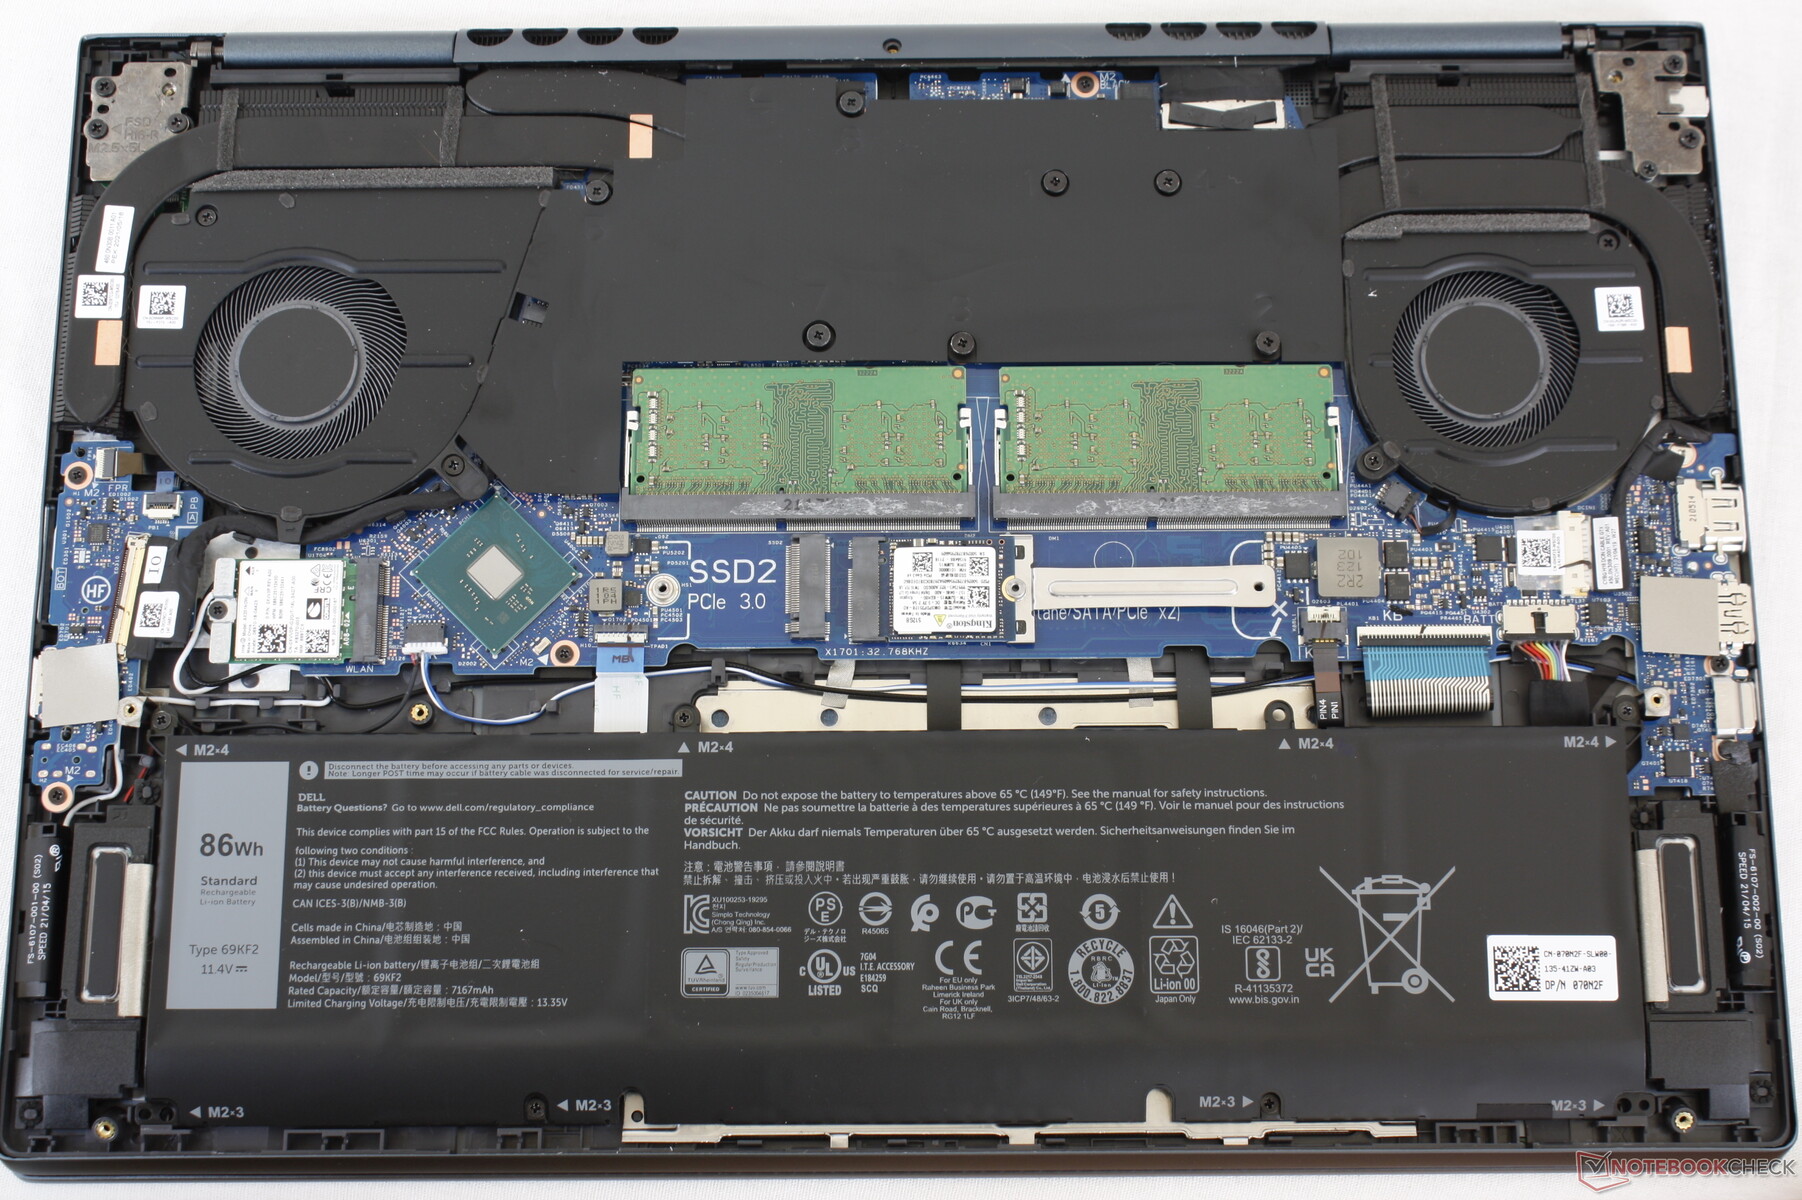
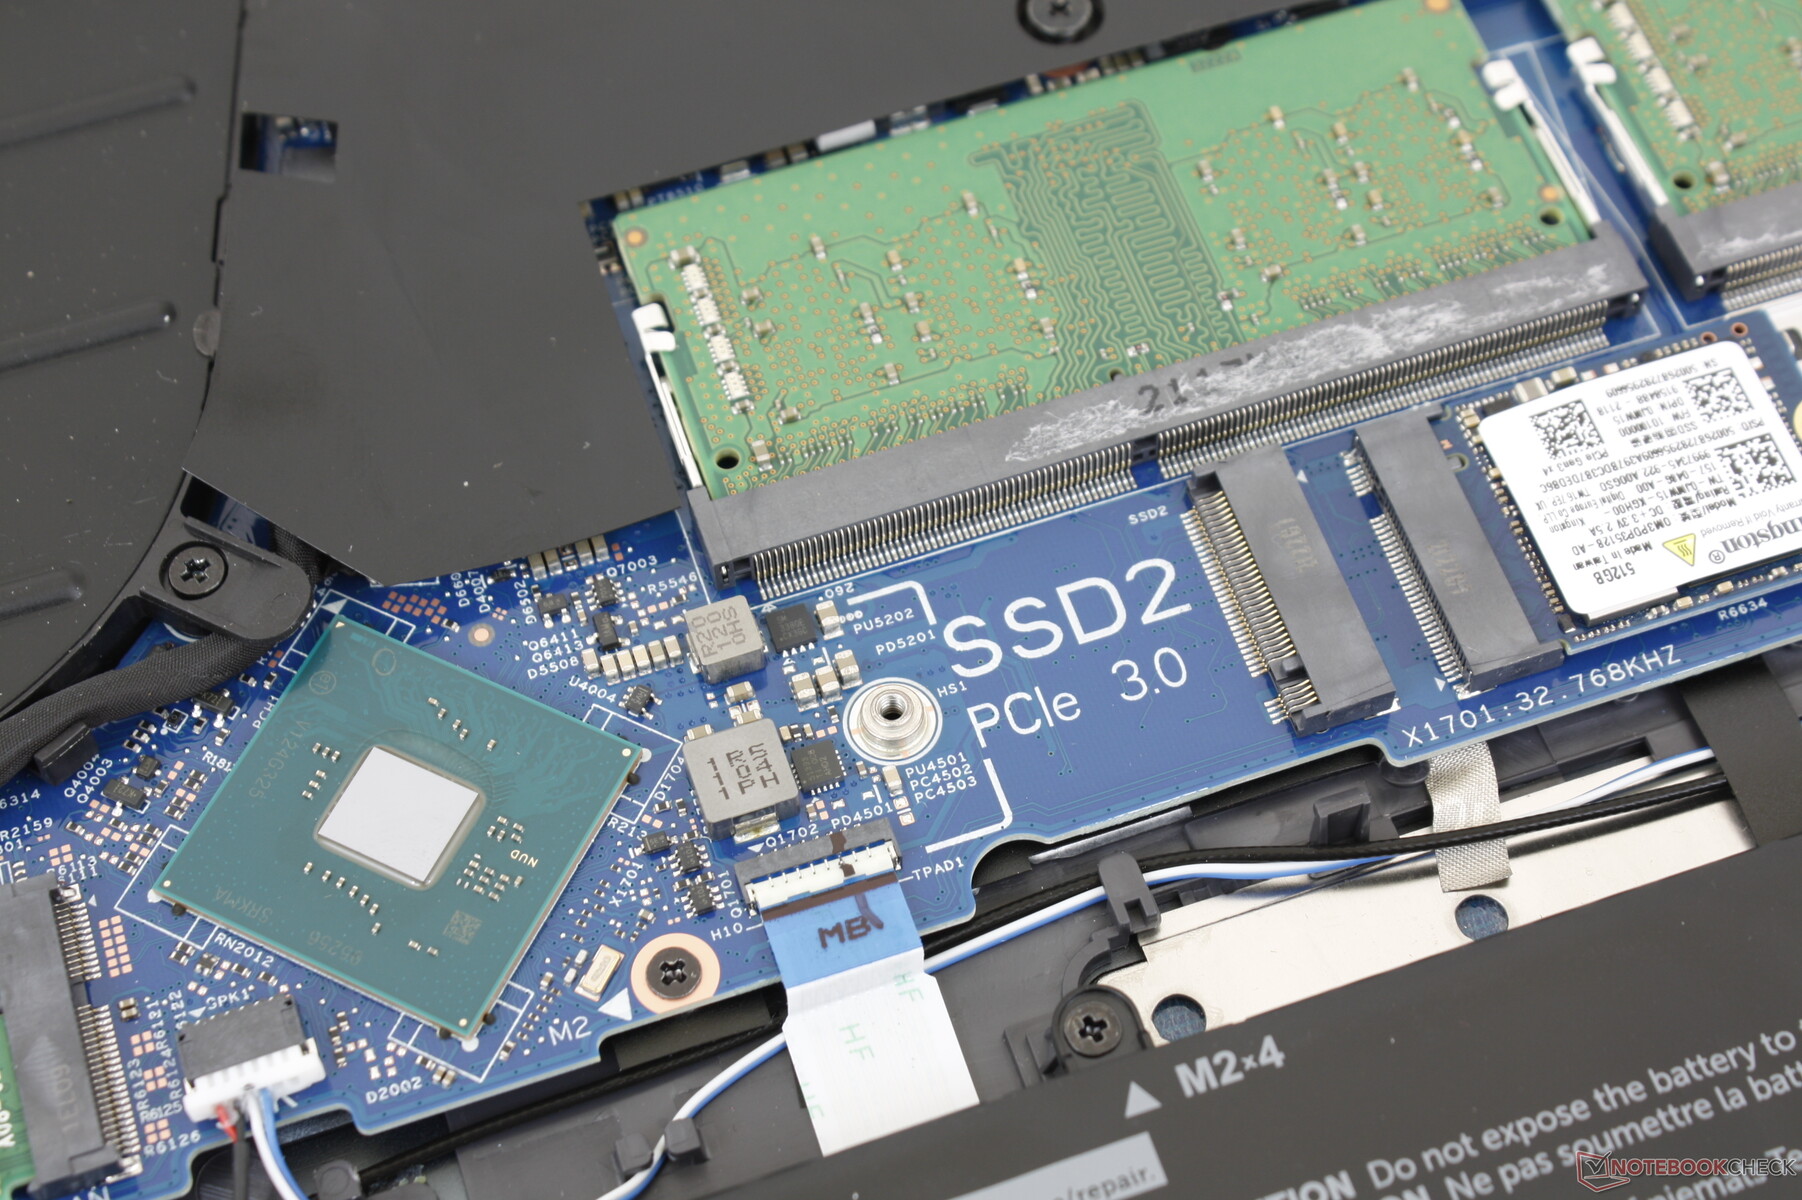
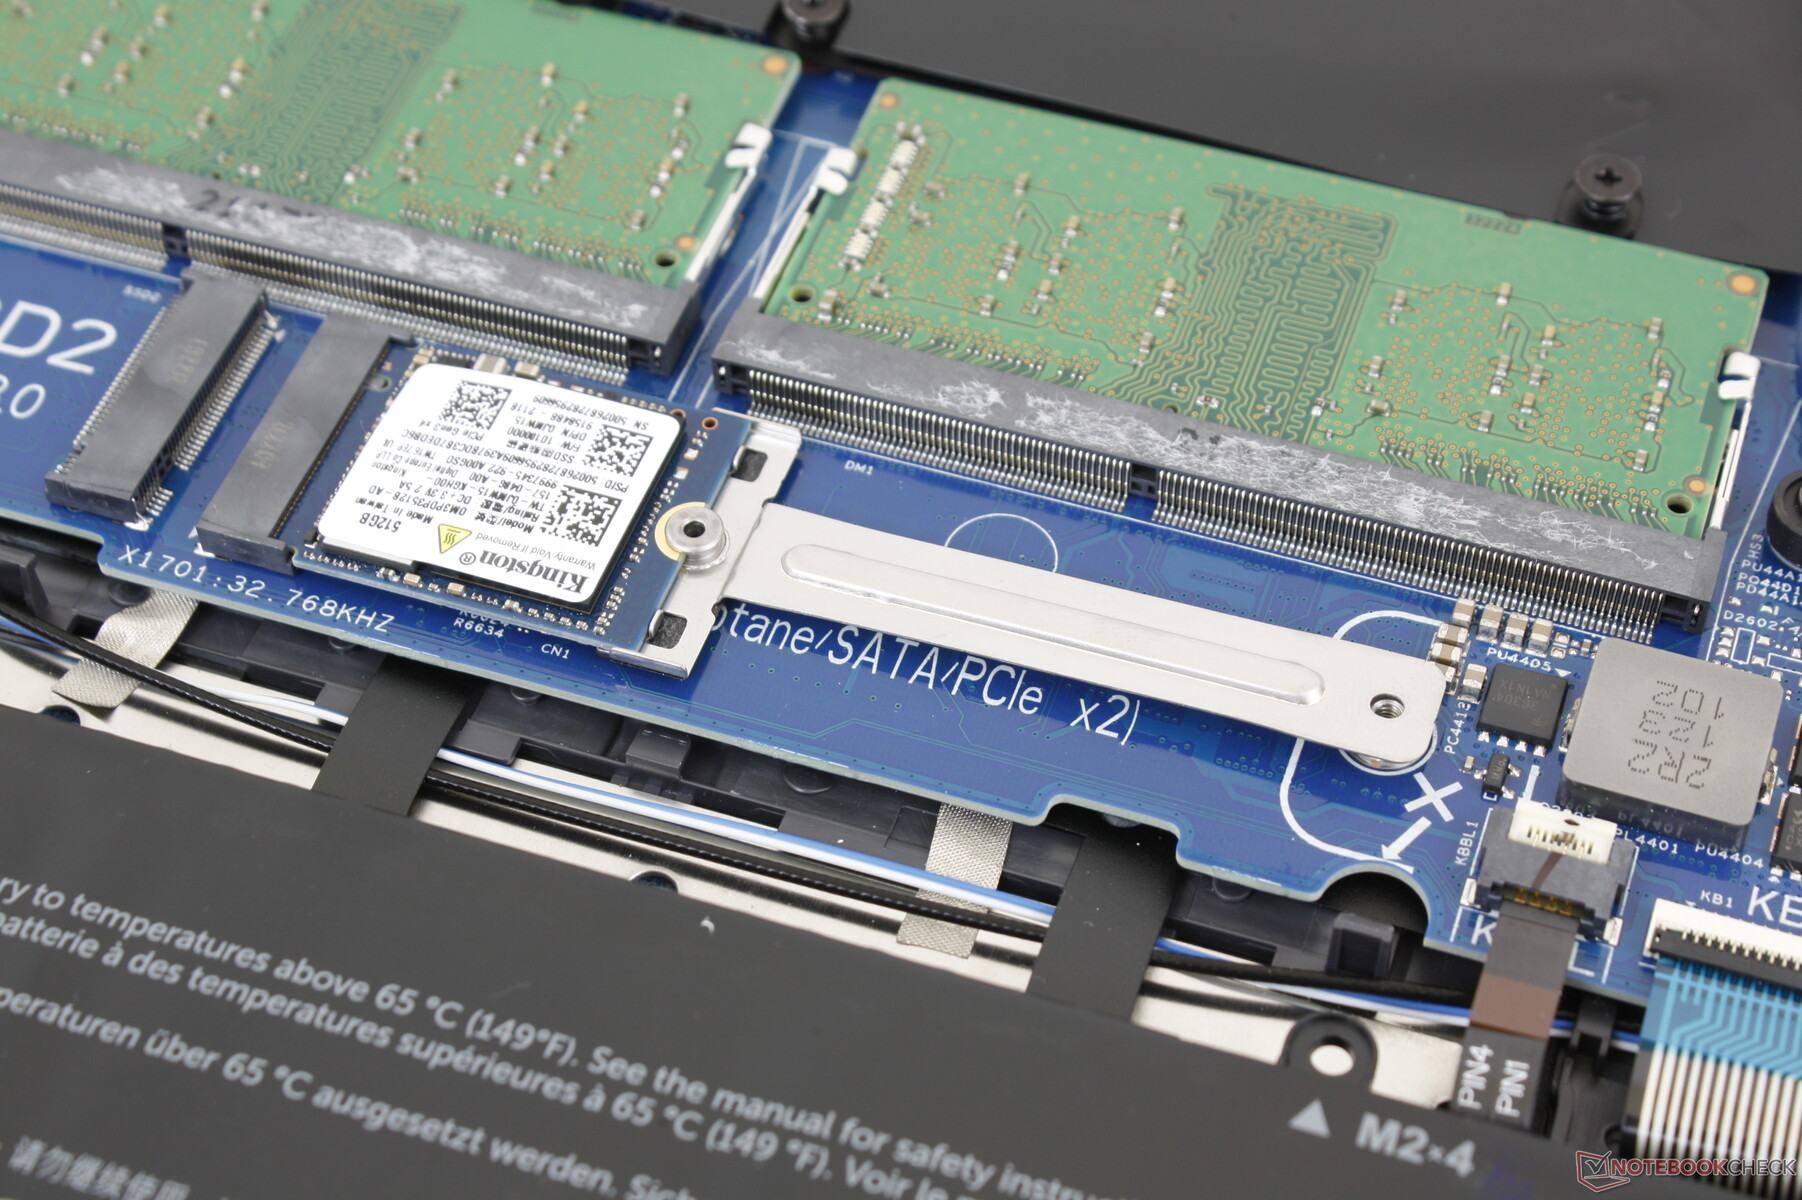
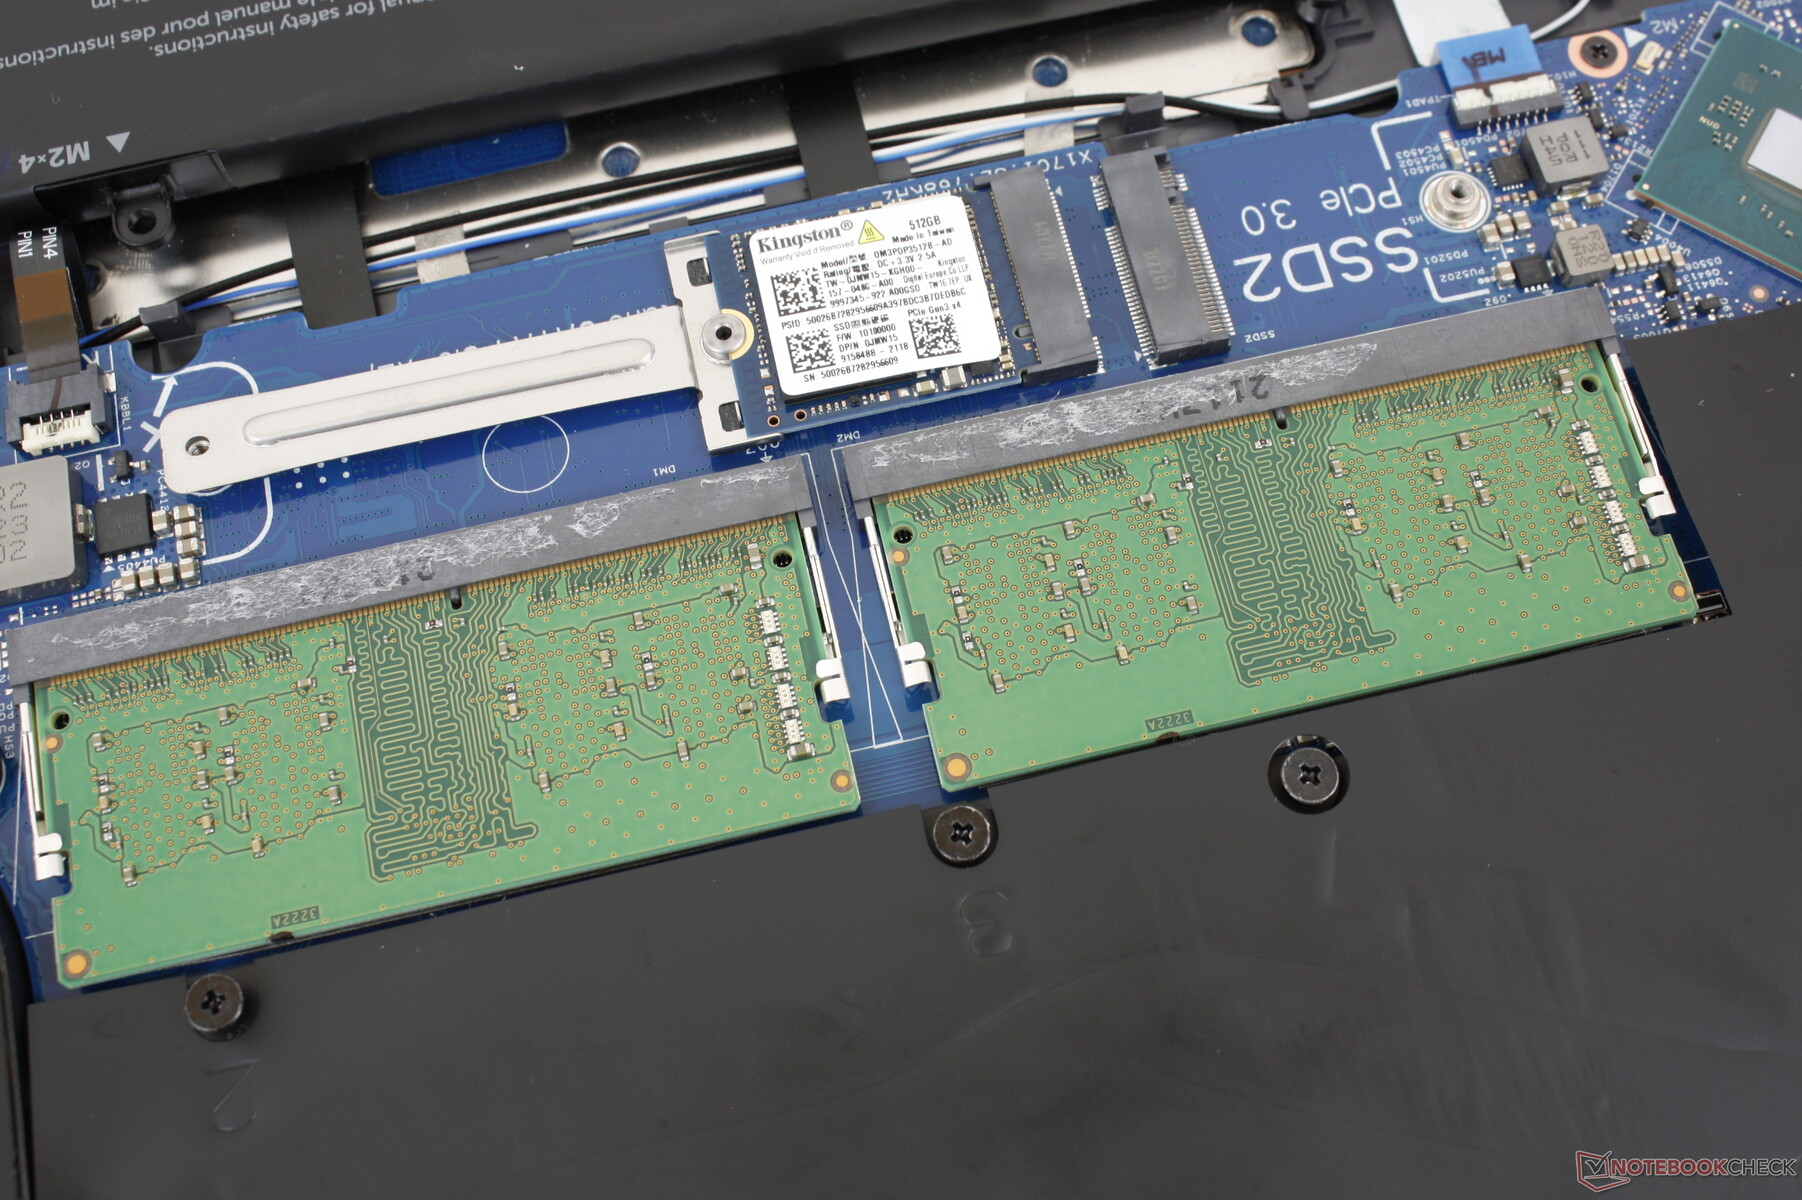
O painel inferior requer uma chave de fenda Philips, aresta afiada e alguma paciência para abrir, já que a parte traseira pode ser complicada de se soltar.Uma vez dentro, os usuários terão acesso direto a dois slots SODIMM, dois compartimentos de armazenamento M.2, e o módulo WLAN removível.
Acessórios e Garantia
Não há extras na caixa além do adaptador AC do barril e da papelada. A garantia padrão limitada de um ano aplica-se com opções de extensão se comprada diretamente da Dell.
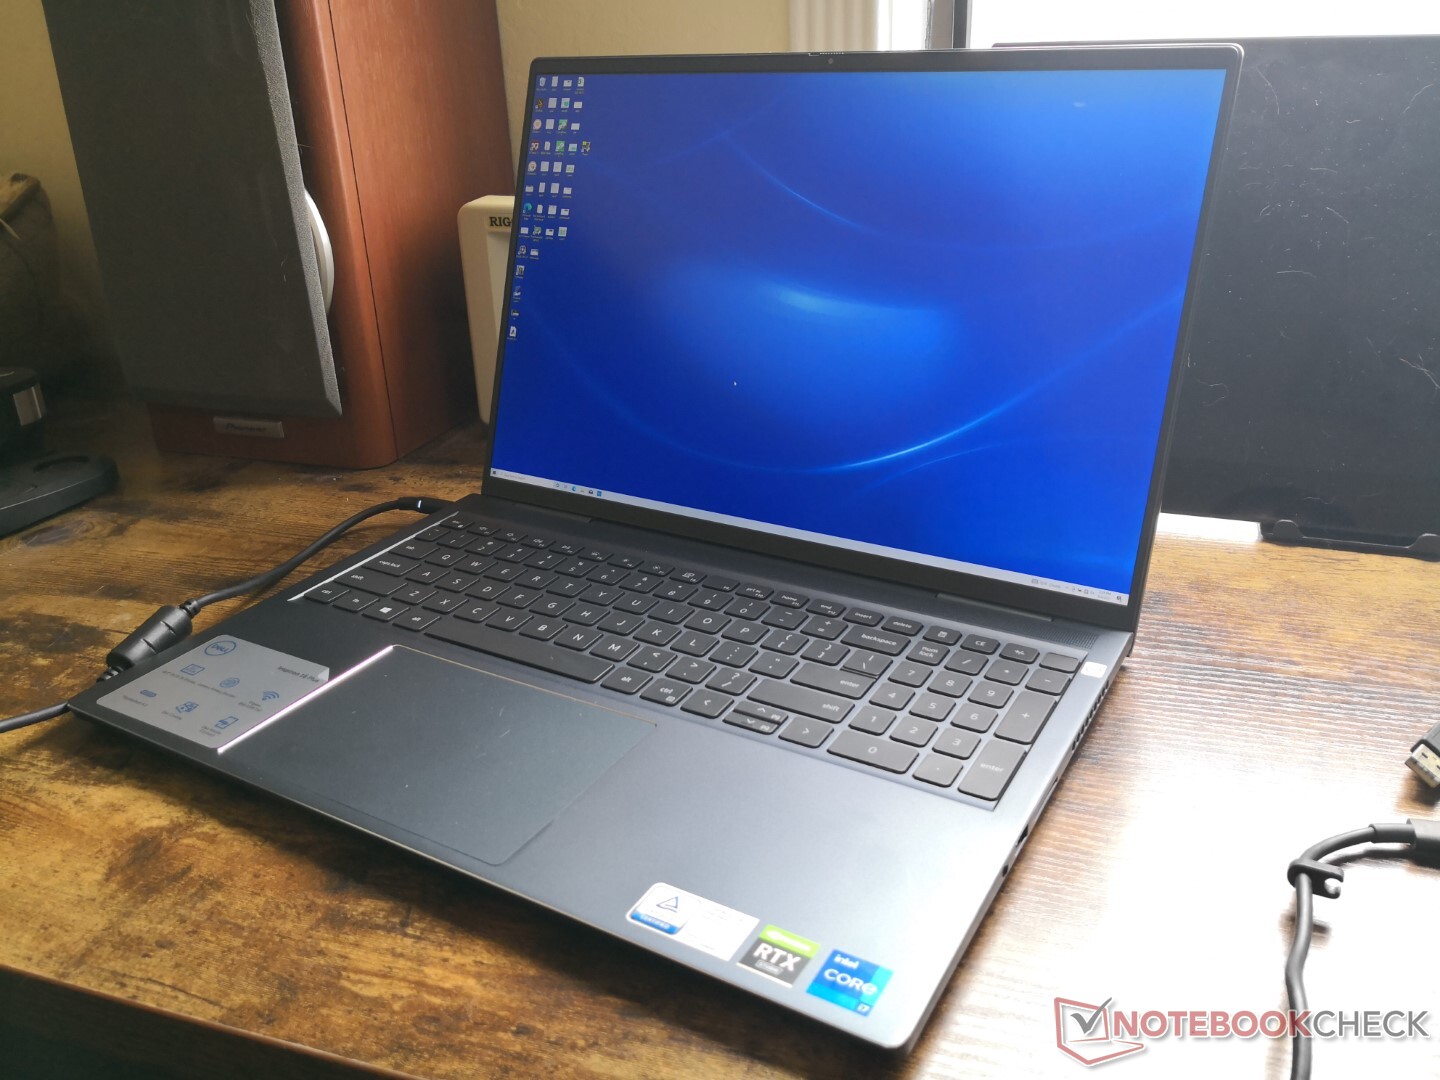
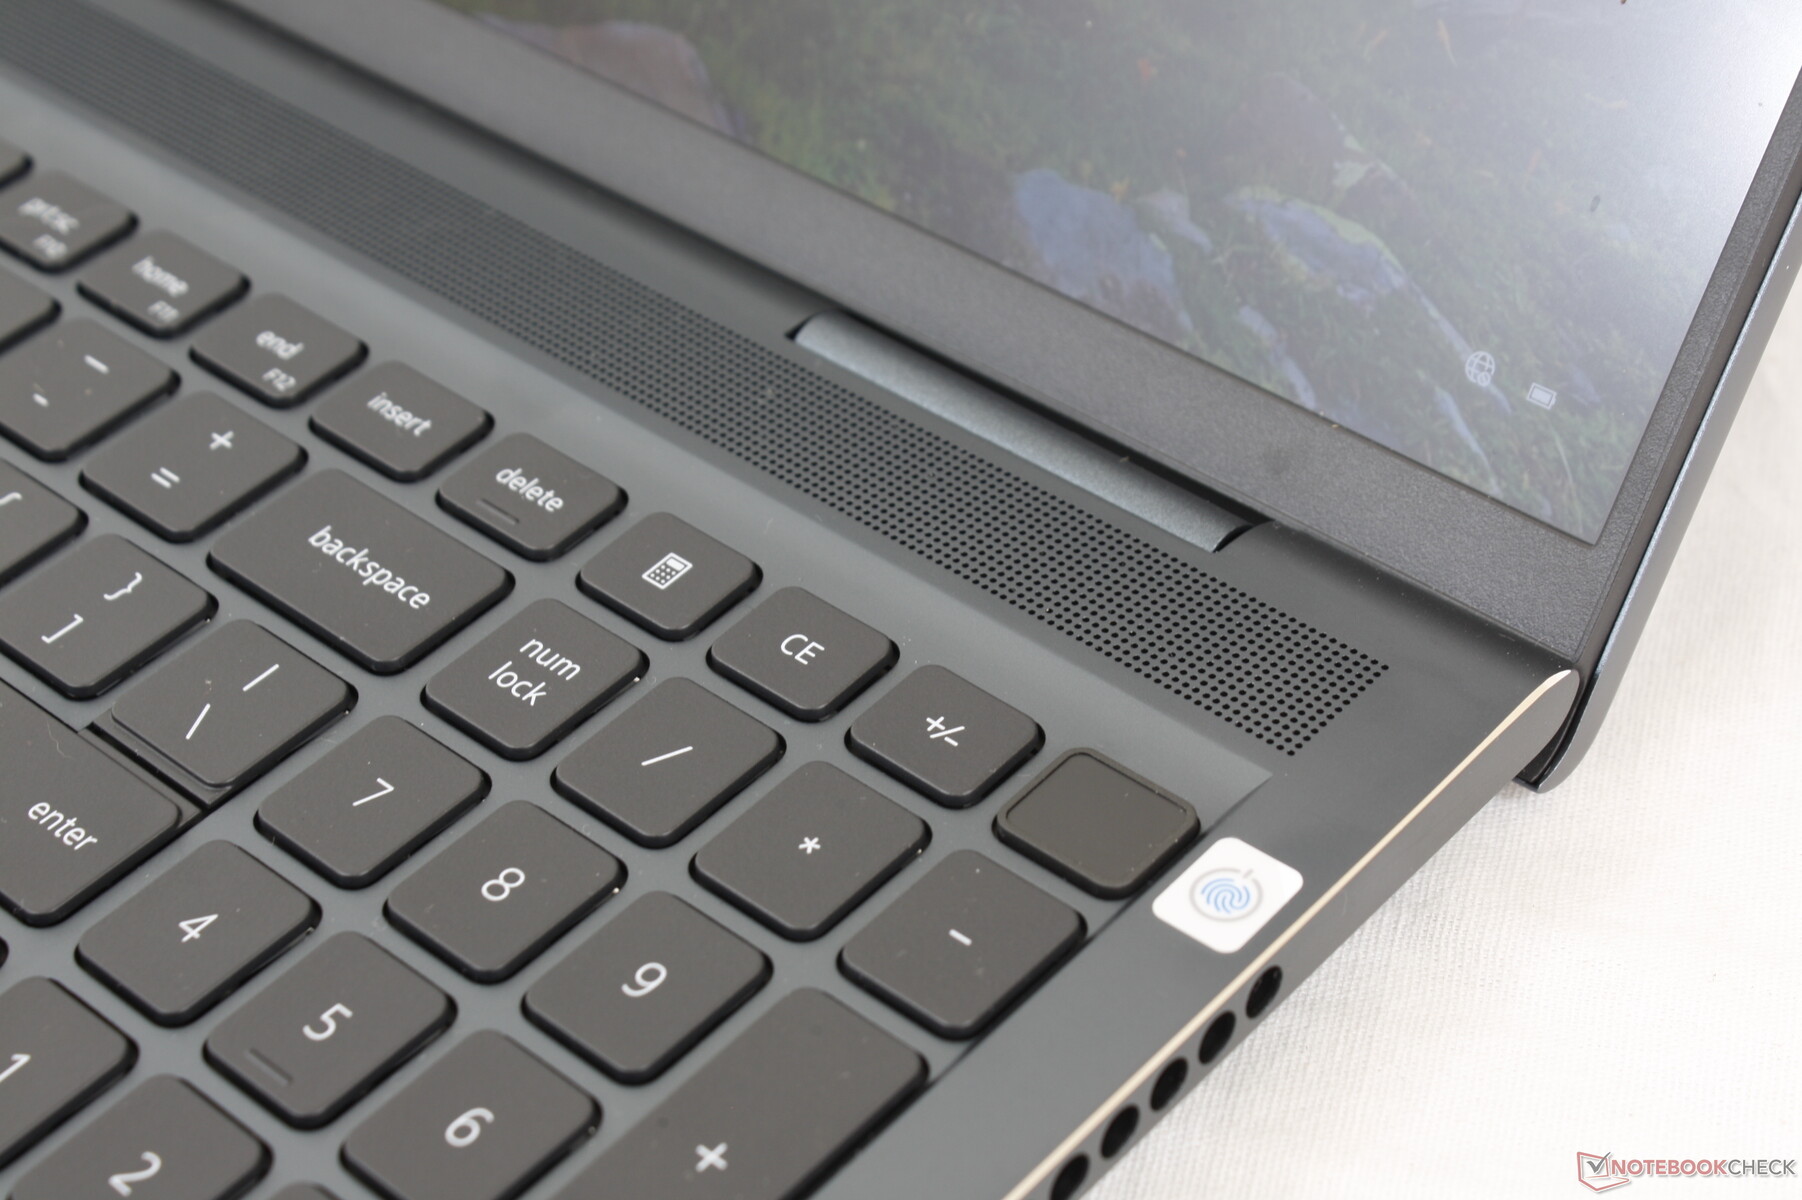
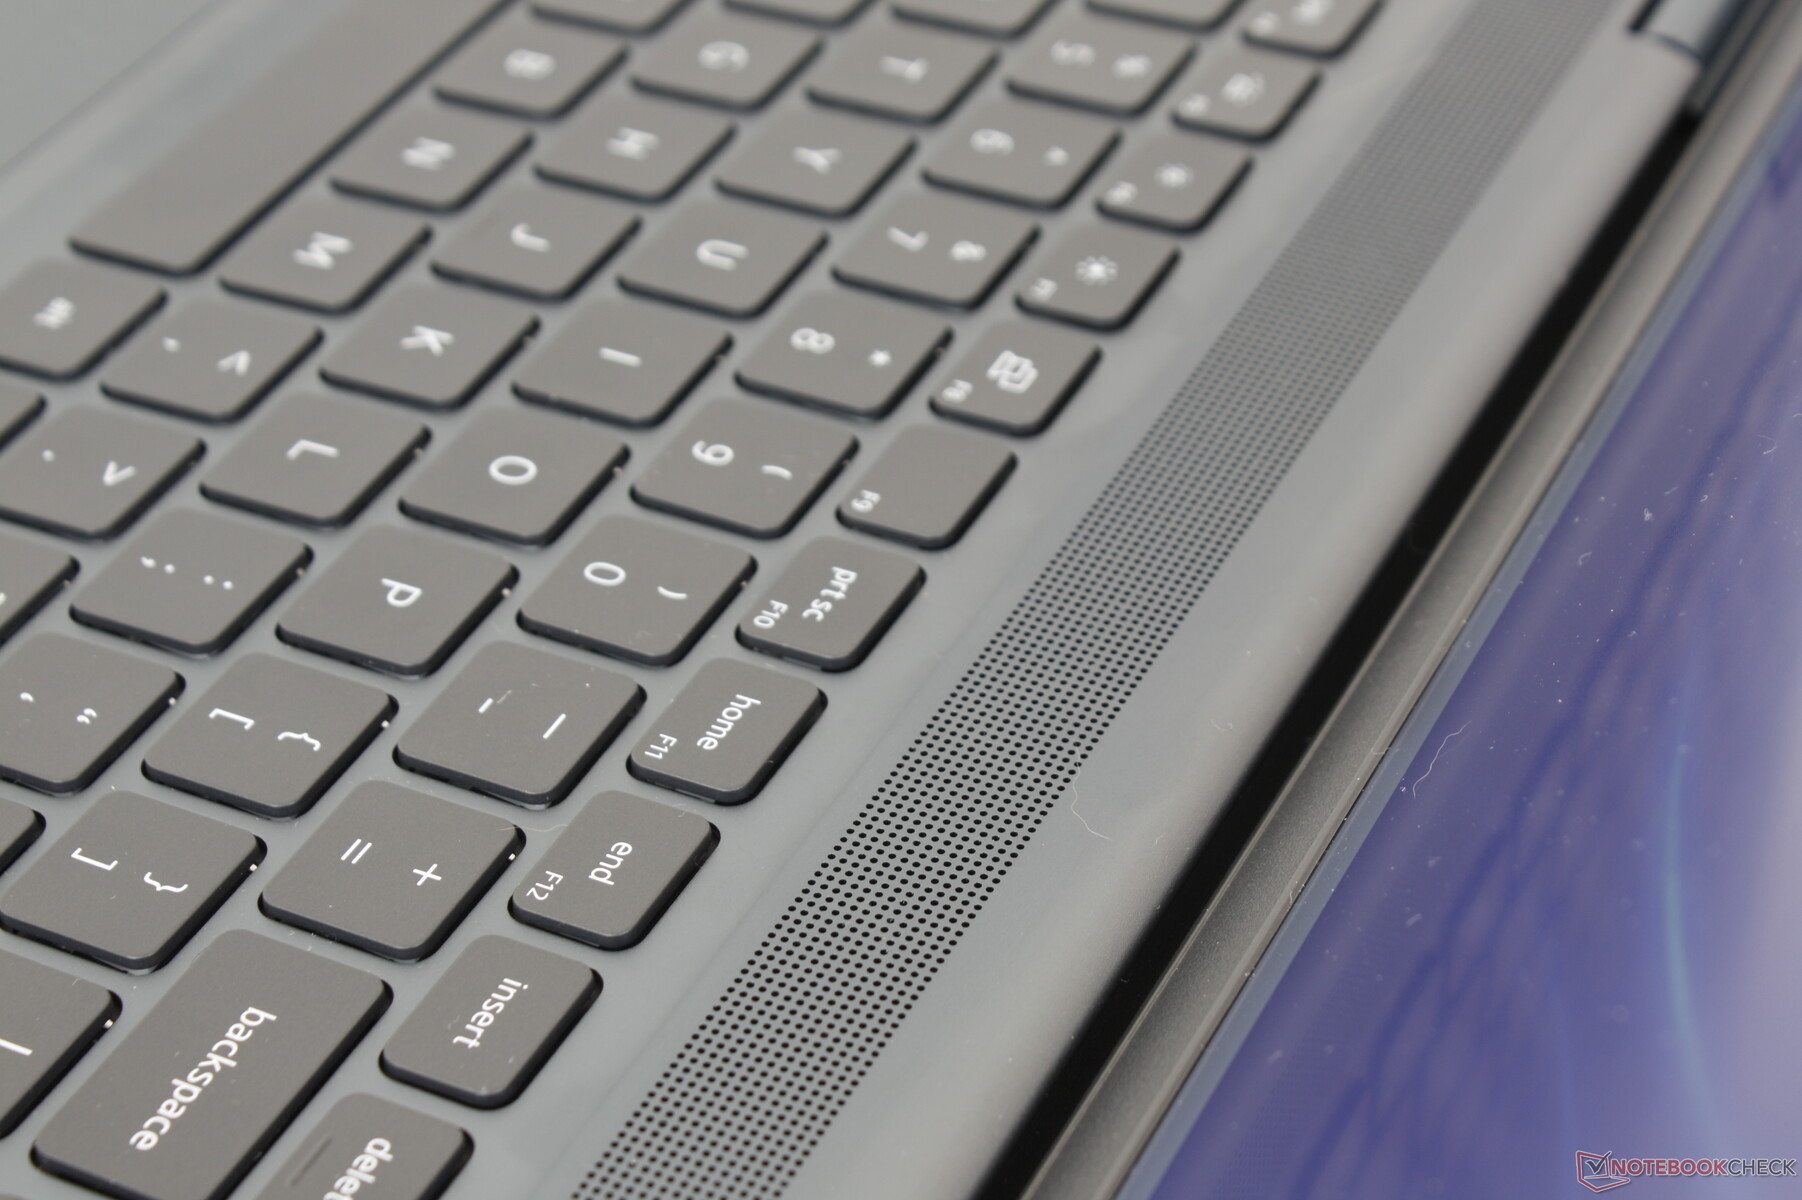
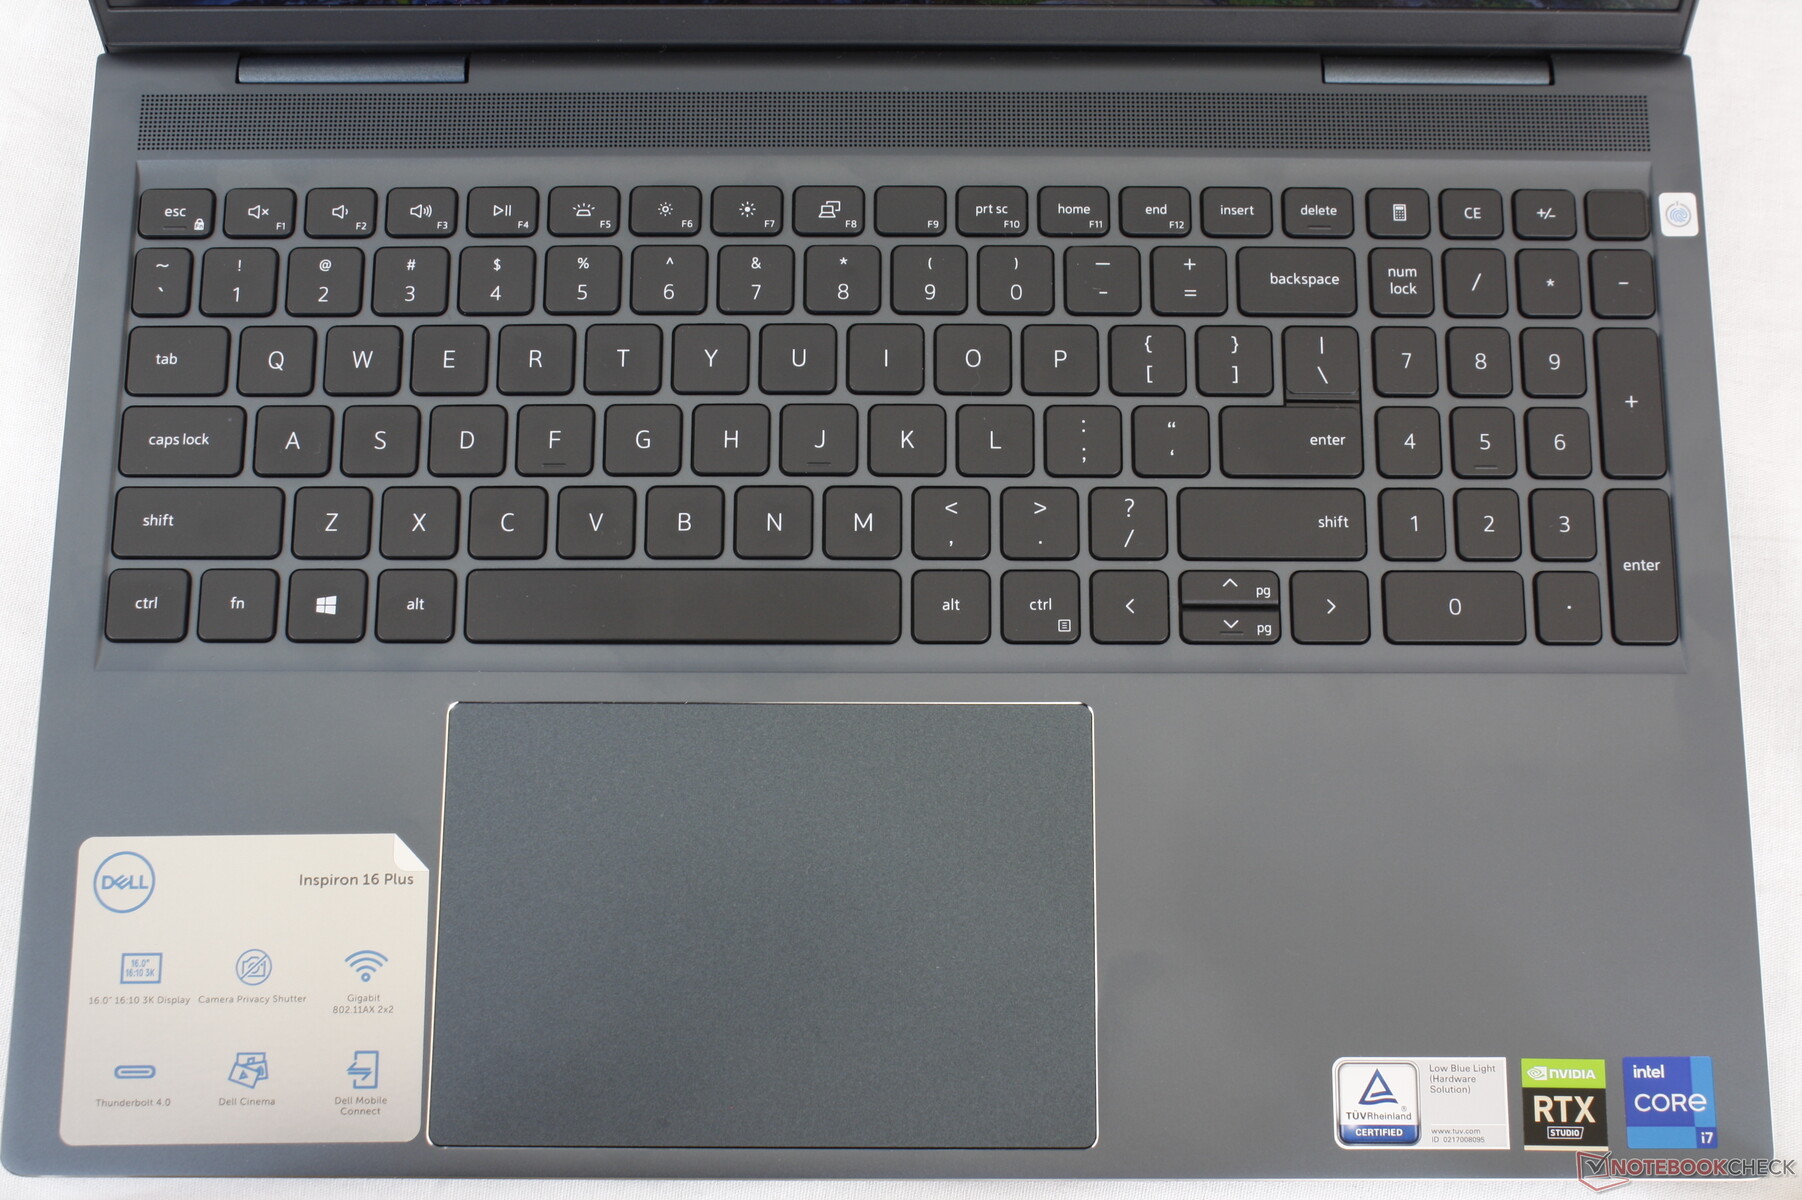
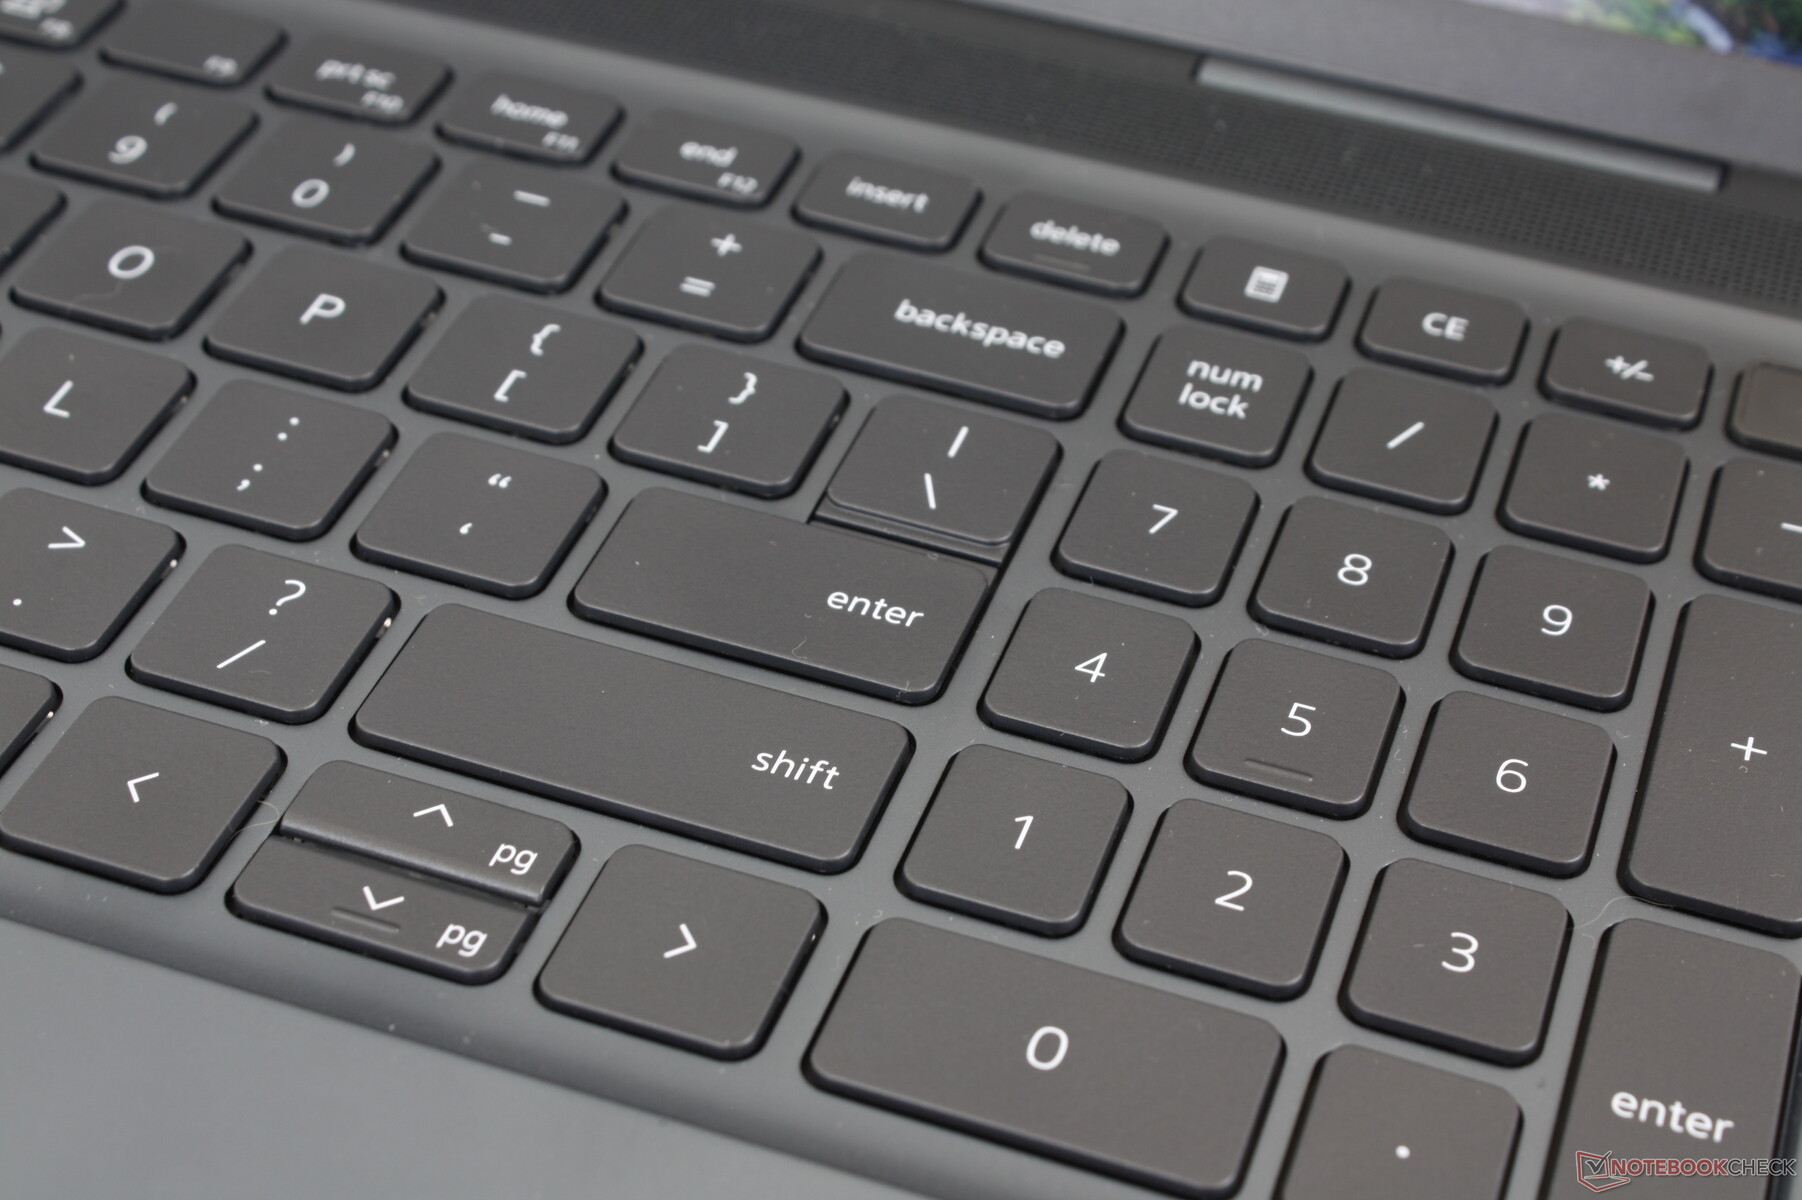
Dispositivos de entrada - Silenciosos mas superficiais
Teclado
Achamos a experiência de datilografia um saco misto. Embora as chaves tenham um feedback mais nítido e satisfatório quando comparadas com a série XPS, as viagens são muito superficiais e leves. Viagens mais profundas como nos laptops HP Envy ou Spectre teriam tornado as chaves Inspiron ainda melhores e menos como um típico Ultrabook.
Uma luz de fundo branca de dois níveis vem como padrão para iluminar todas as teclas e símbolos, exceto para o botão de alimentação opcional habilitado para impressões digitais. Não é tão brilhante quanto a maioria dos outros teclados com luz de fundo, mas é bom o suficiente em ambientes escuros.
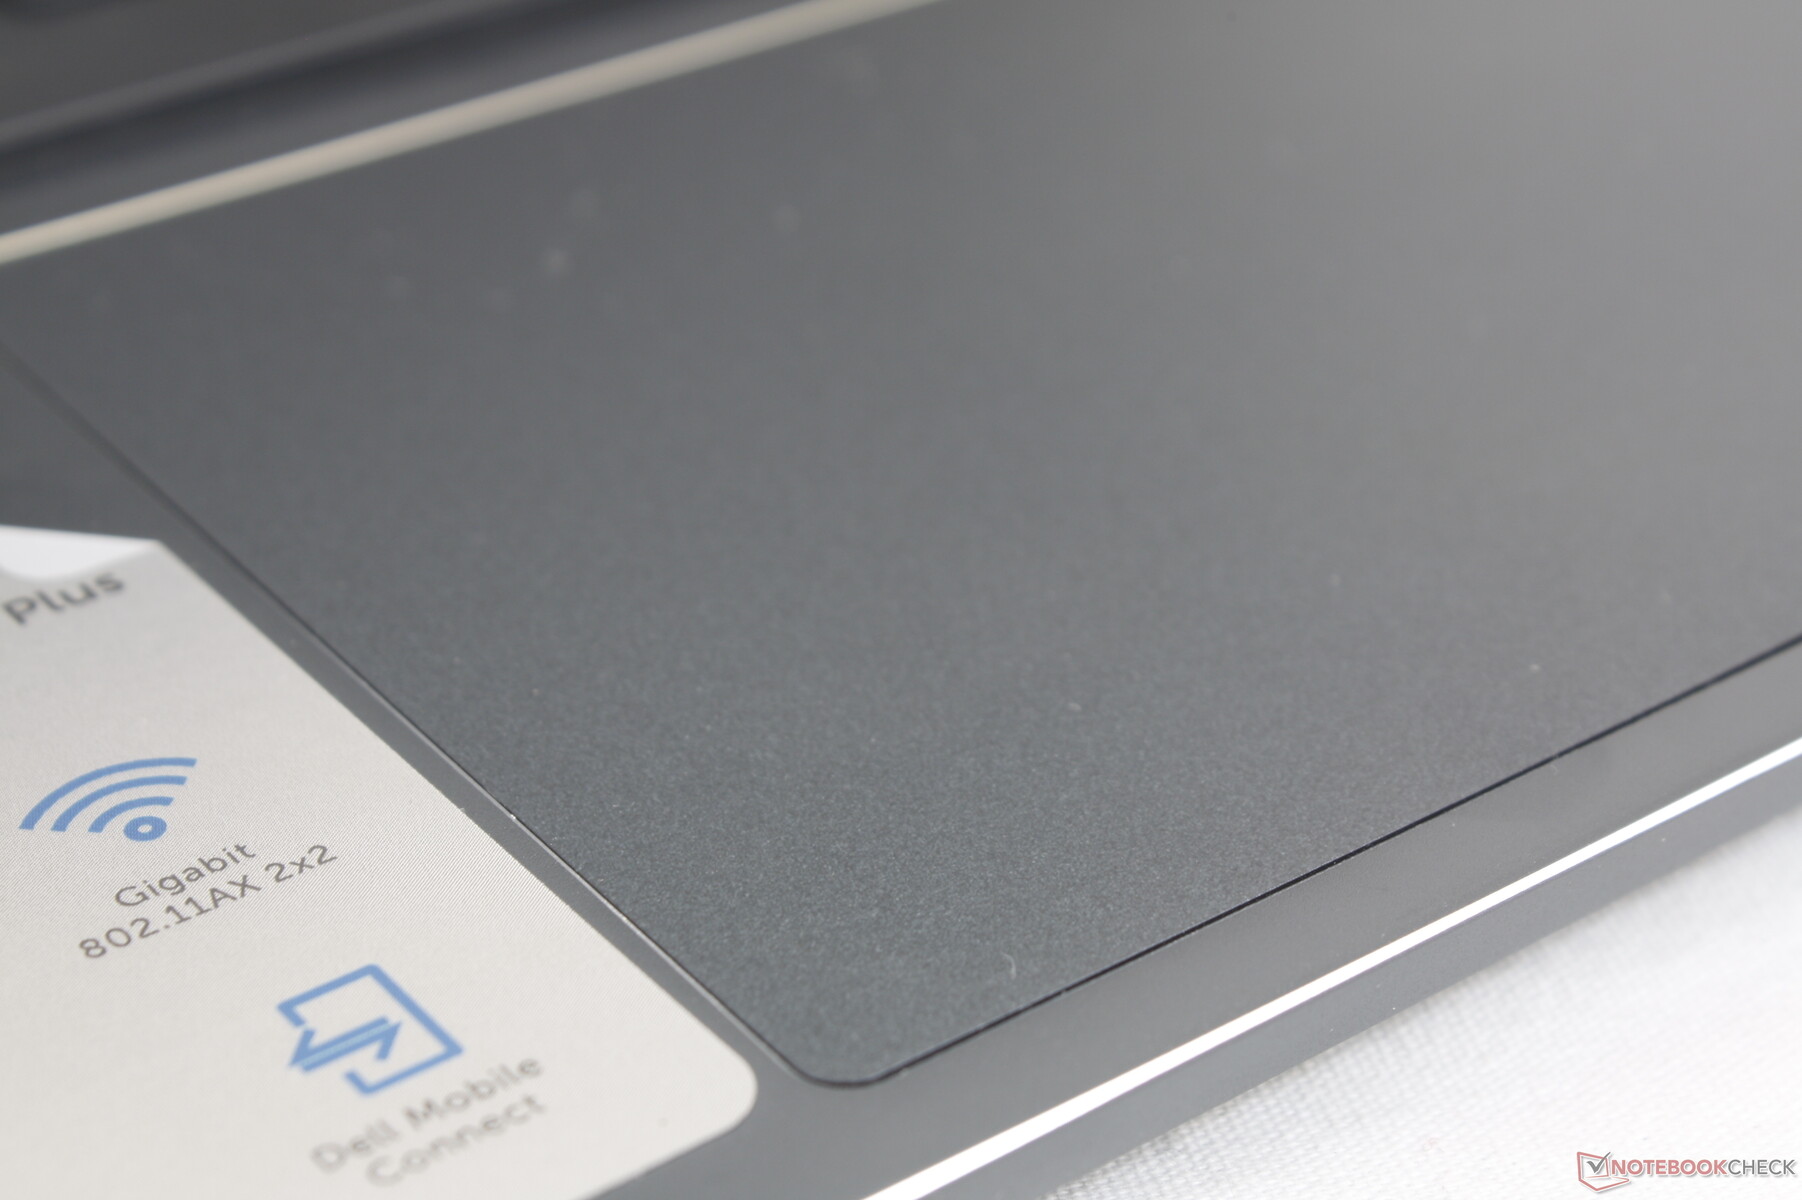
Touchpad
O clickpad é maior do que o clickpad do anterior Inspiron 15 7506 (13,5 x 9 cm vs. 11,5 x 8 cm) para facilitar as entradas multi-toque. O deslizamento na superfície lisa é confiável com apenas um pouco de aderência em velocidades mais lentas para um controle mais preciso do cursor. Infelizmente, clicar no clickpad é esponjoso e com um feedback insatisfatório.

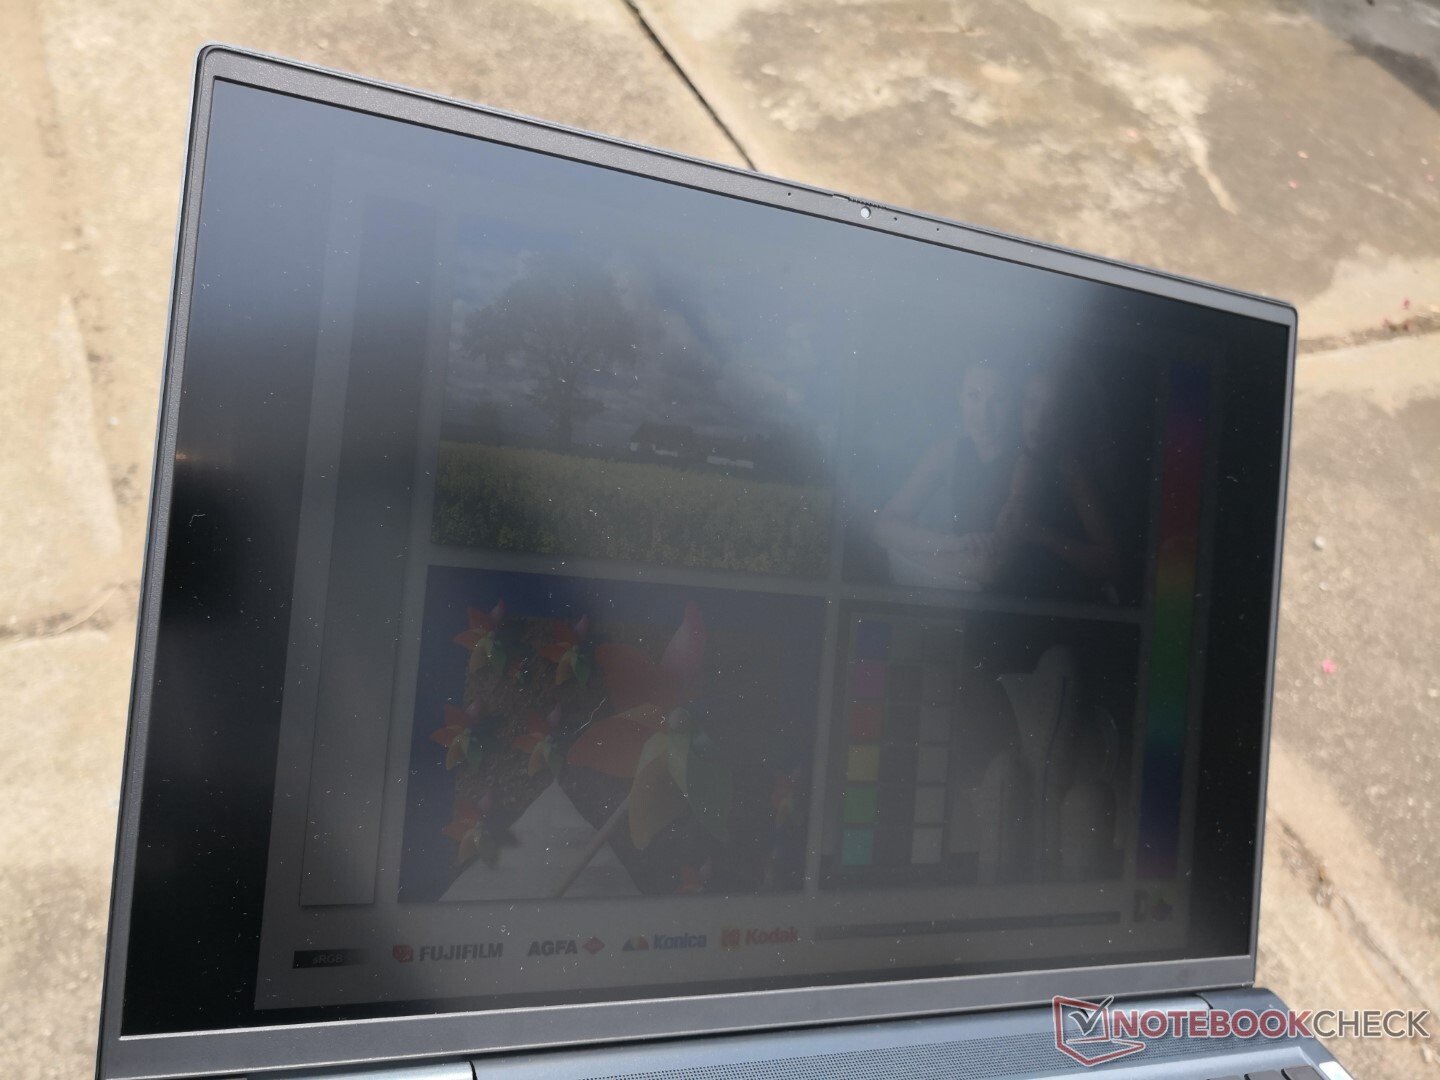
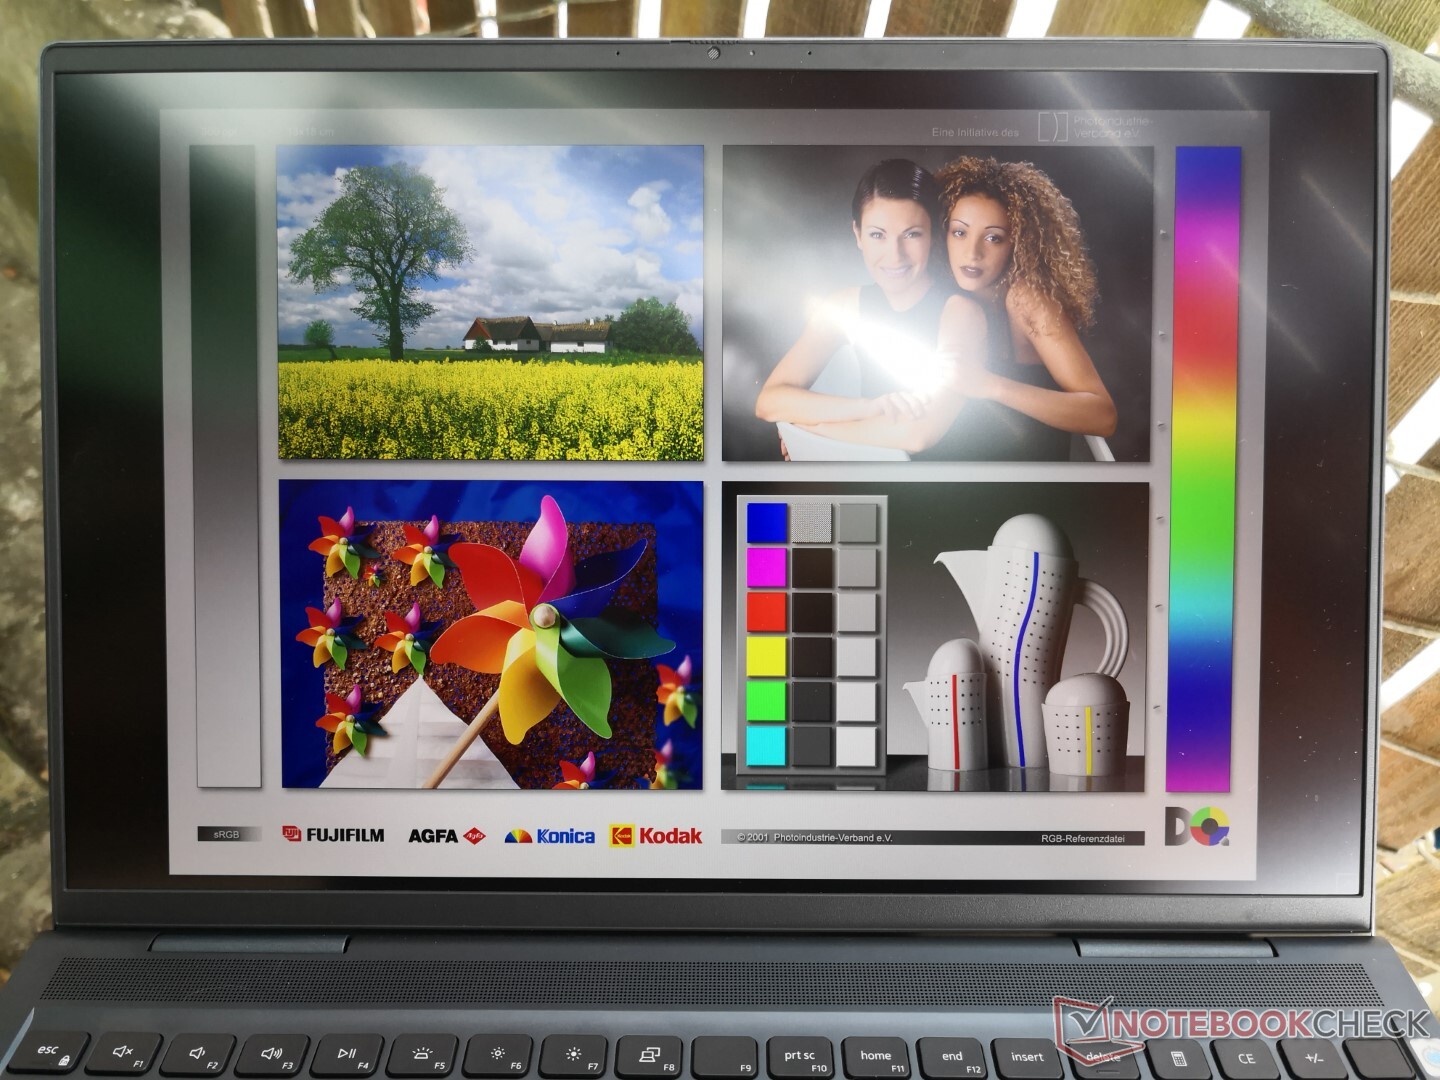
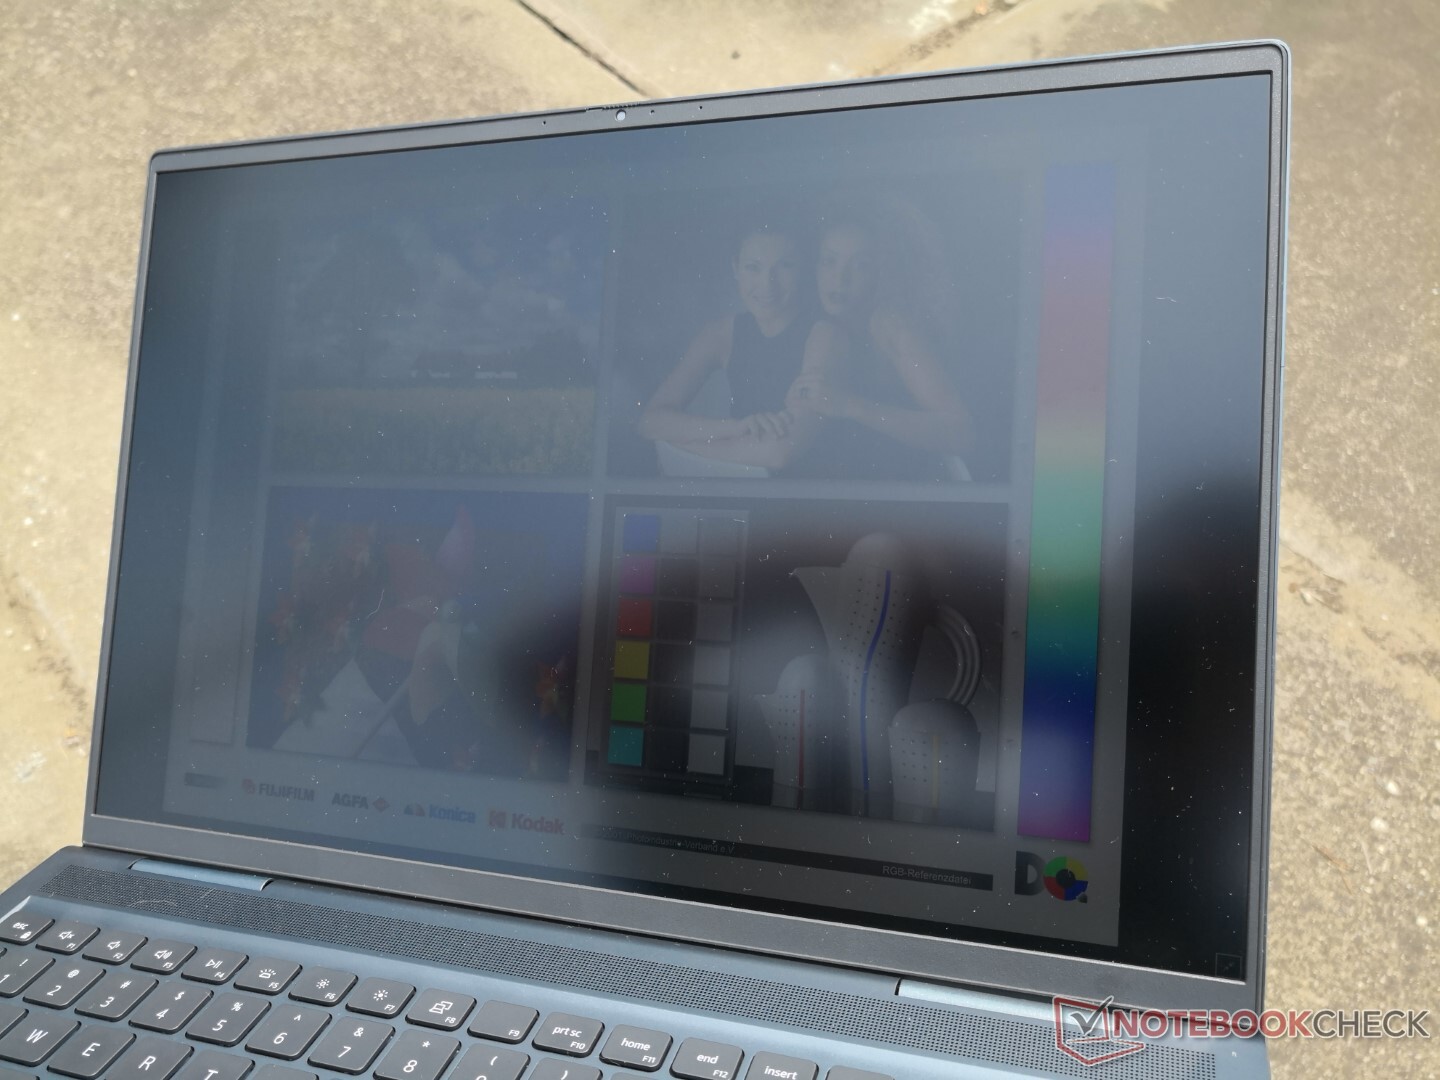
Visor - Cores boas, OK Brilho, Tempos de resposta lentos
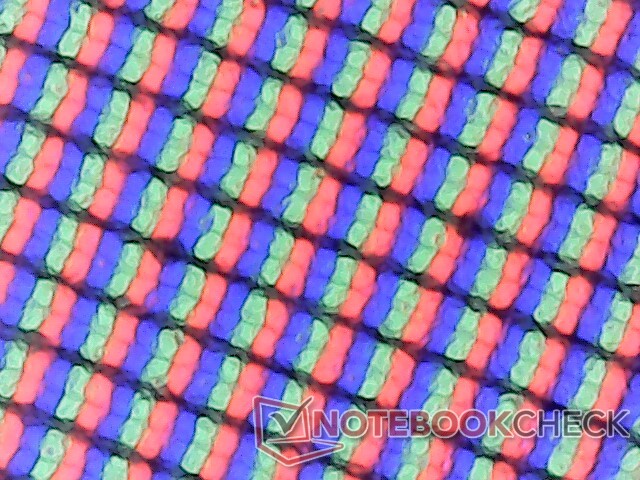
O modelo utiliza um painel IPS AU Optronics B160QAN 3K que não pode ser encontrado em nenhum outro laptop a partir desta escrita. Ele compartilha, no entanto, a mesma resolução nativa da tela do MacBook Pro 16. O PPI é quase tão denso quanto um painel de 4K, o que significa que a maioria dos usuários ainda vai querer ajustar a escala de fontes para facilitar a leitura.
A qualidade da tela é excelente, com uma relação de contraste próxima de 1500:1. Entretanto, seus tempos de resposta lentos são o fator diferenciador que separa o Inspiron 16 dos laptops "puros" de 16 polegadas como o Asus ROG Zephyrus M16, onde os tempos de resposta são significativamente mais rápidos.

| |||||||||||||||||||||||||
iluminação: 87 %
iluminação com acumulador: 296.8 cd/m²
Contraste: 1413:1 (Preto: 0.21 cd/m²)
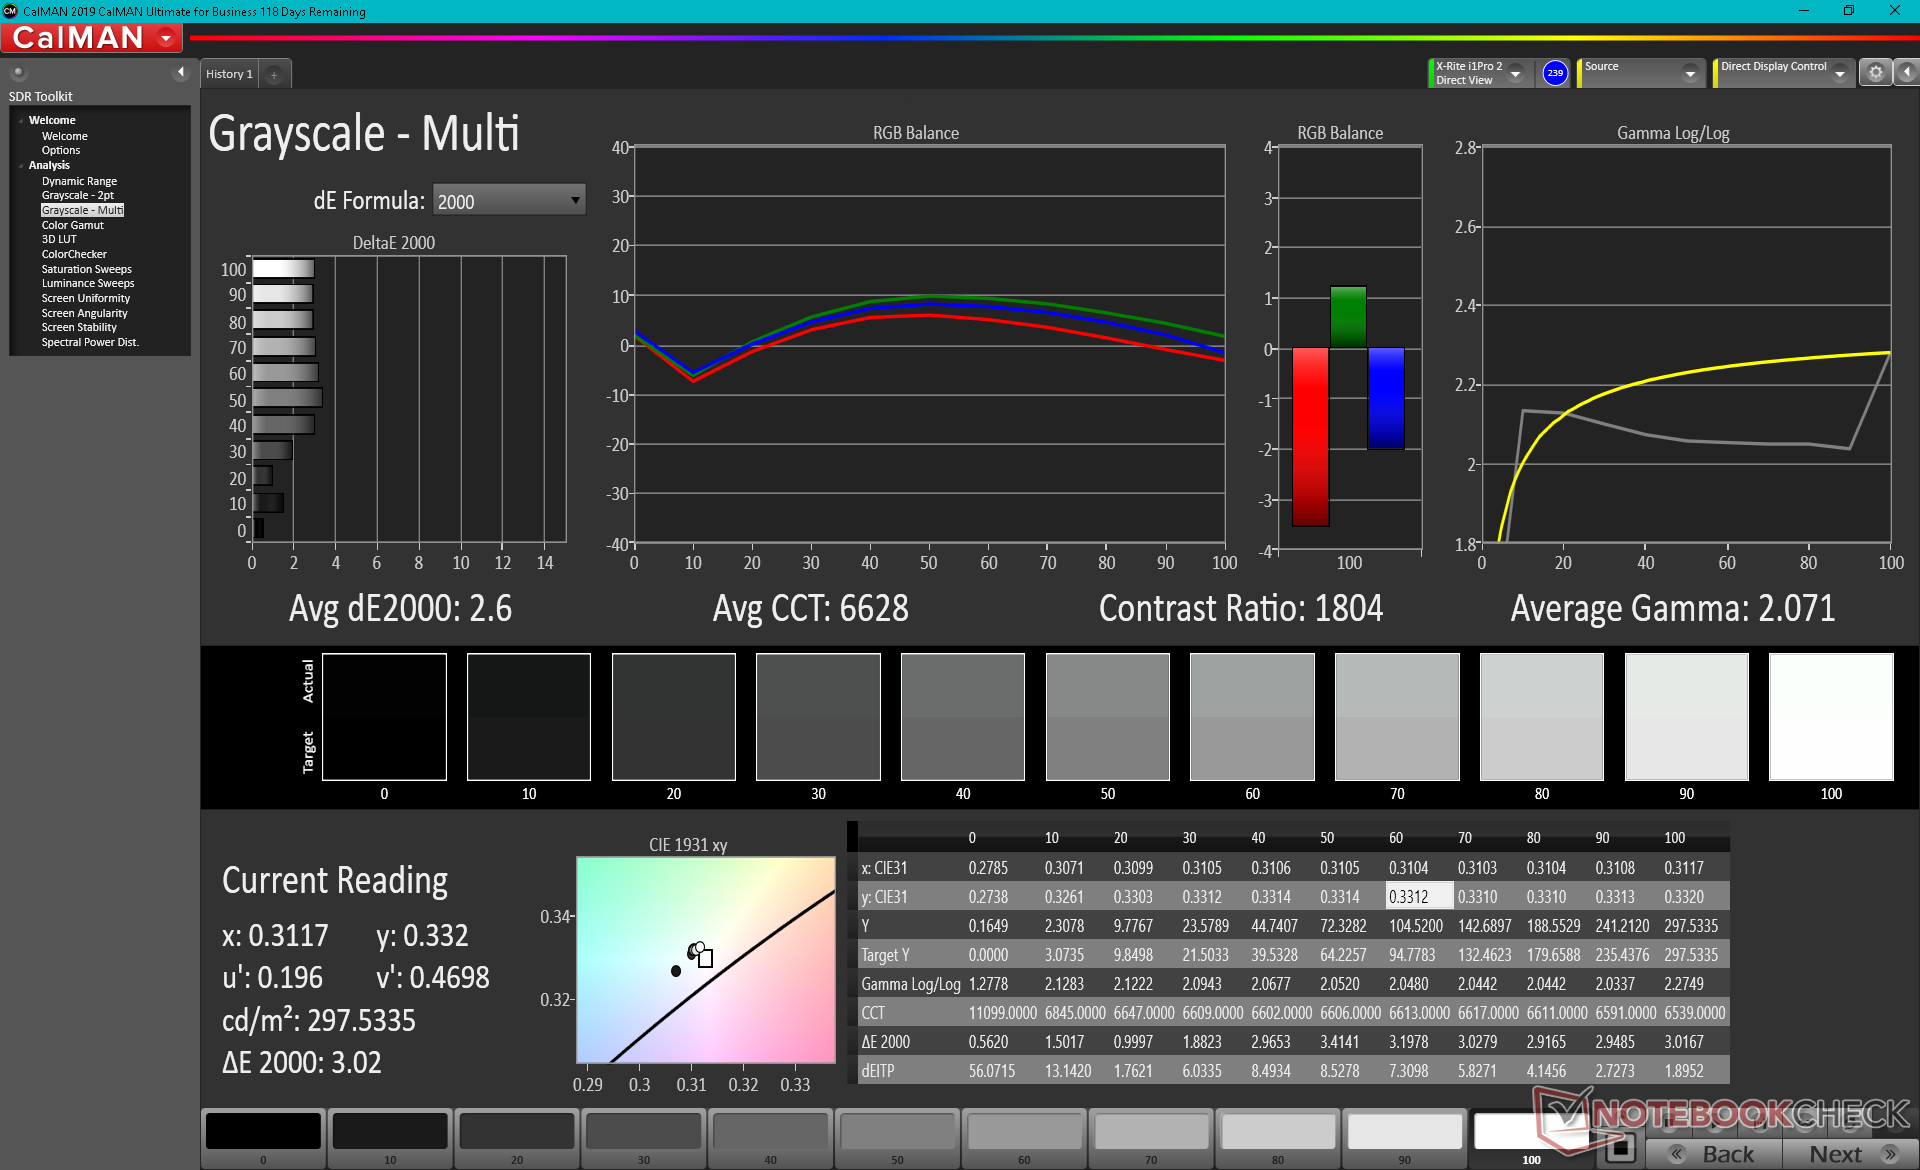
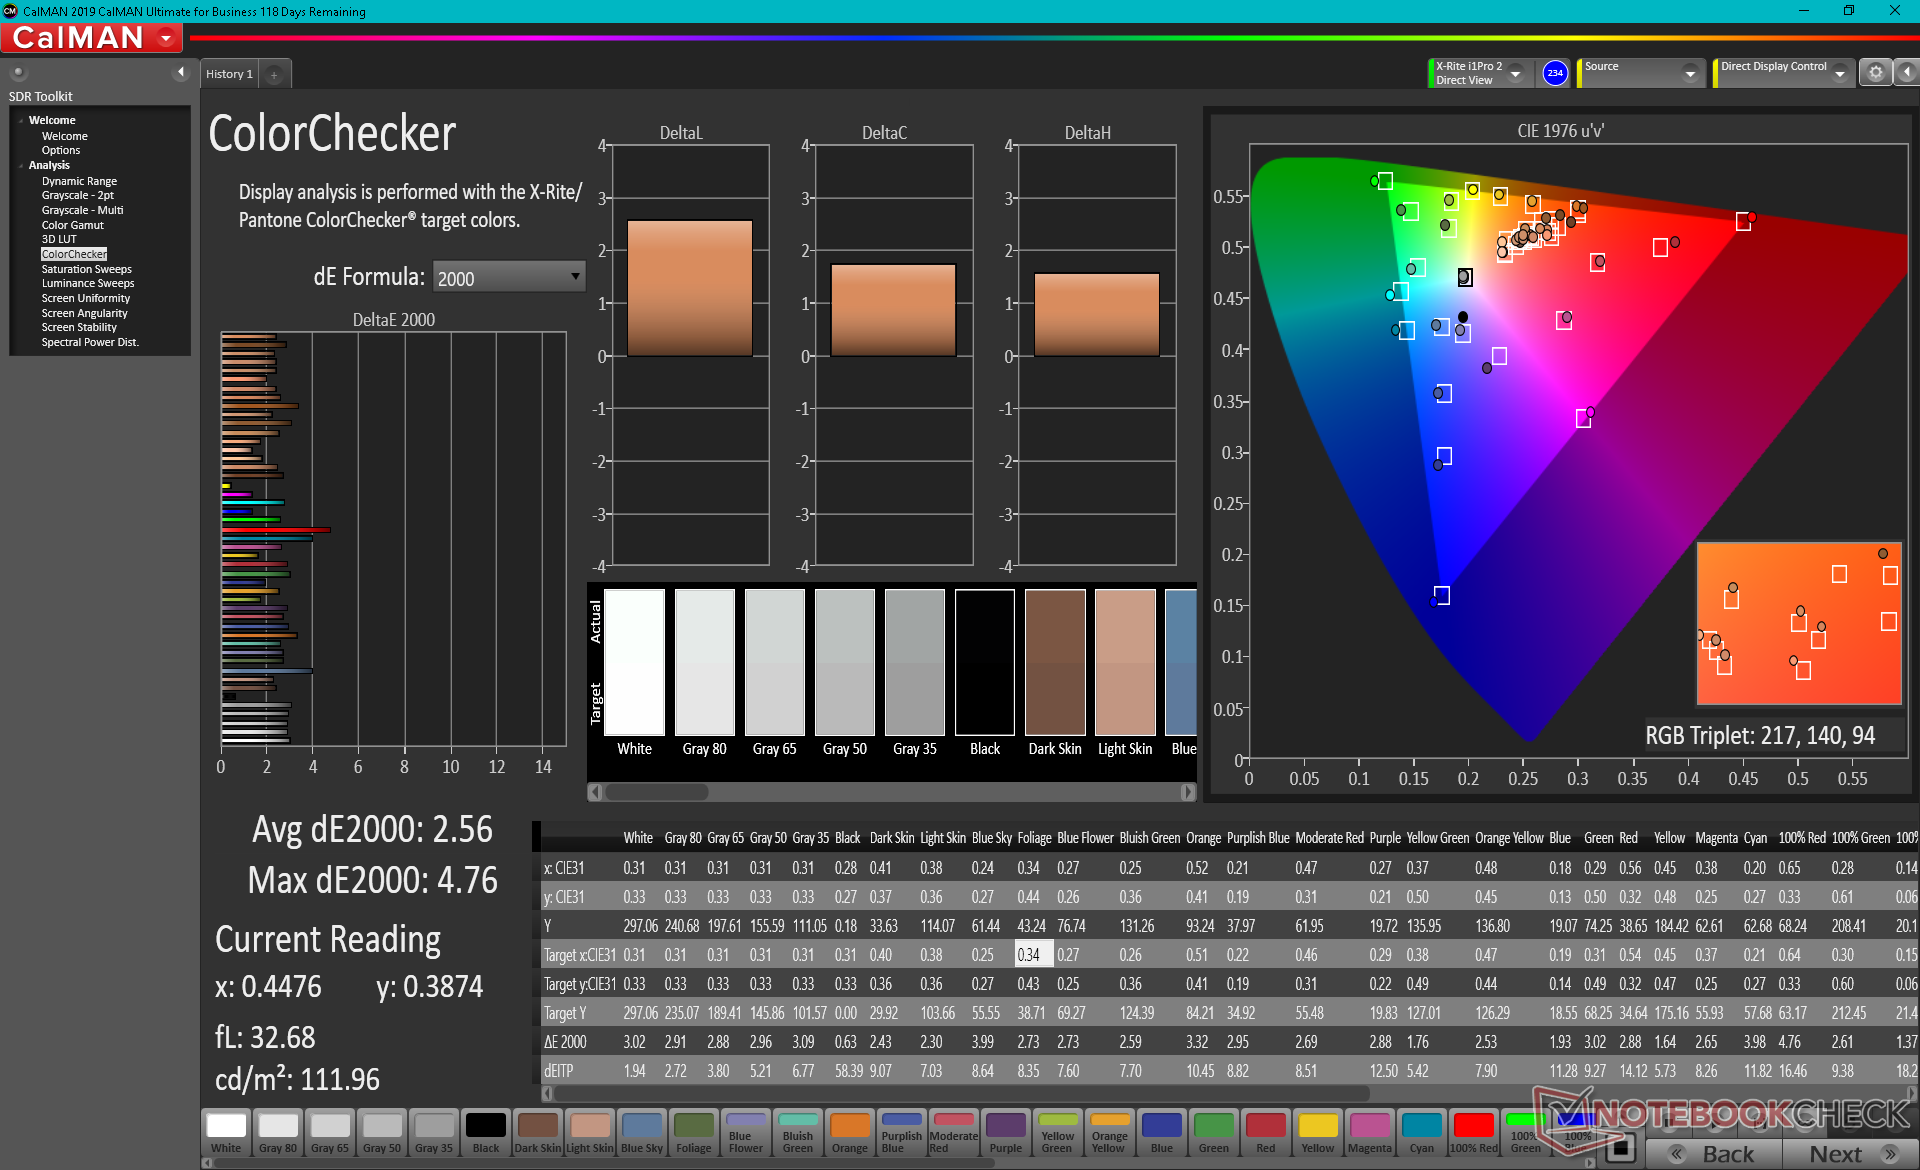
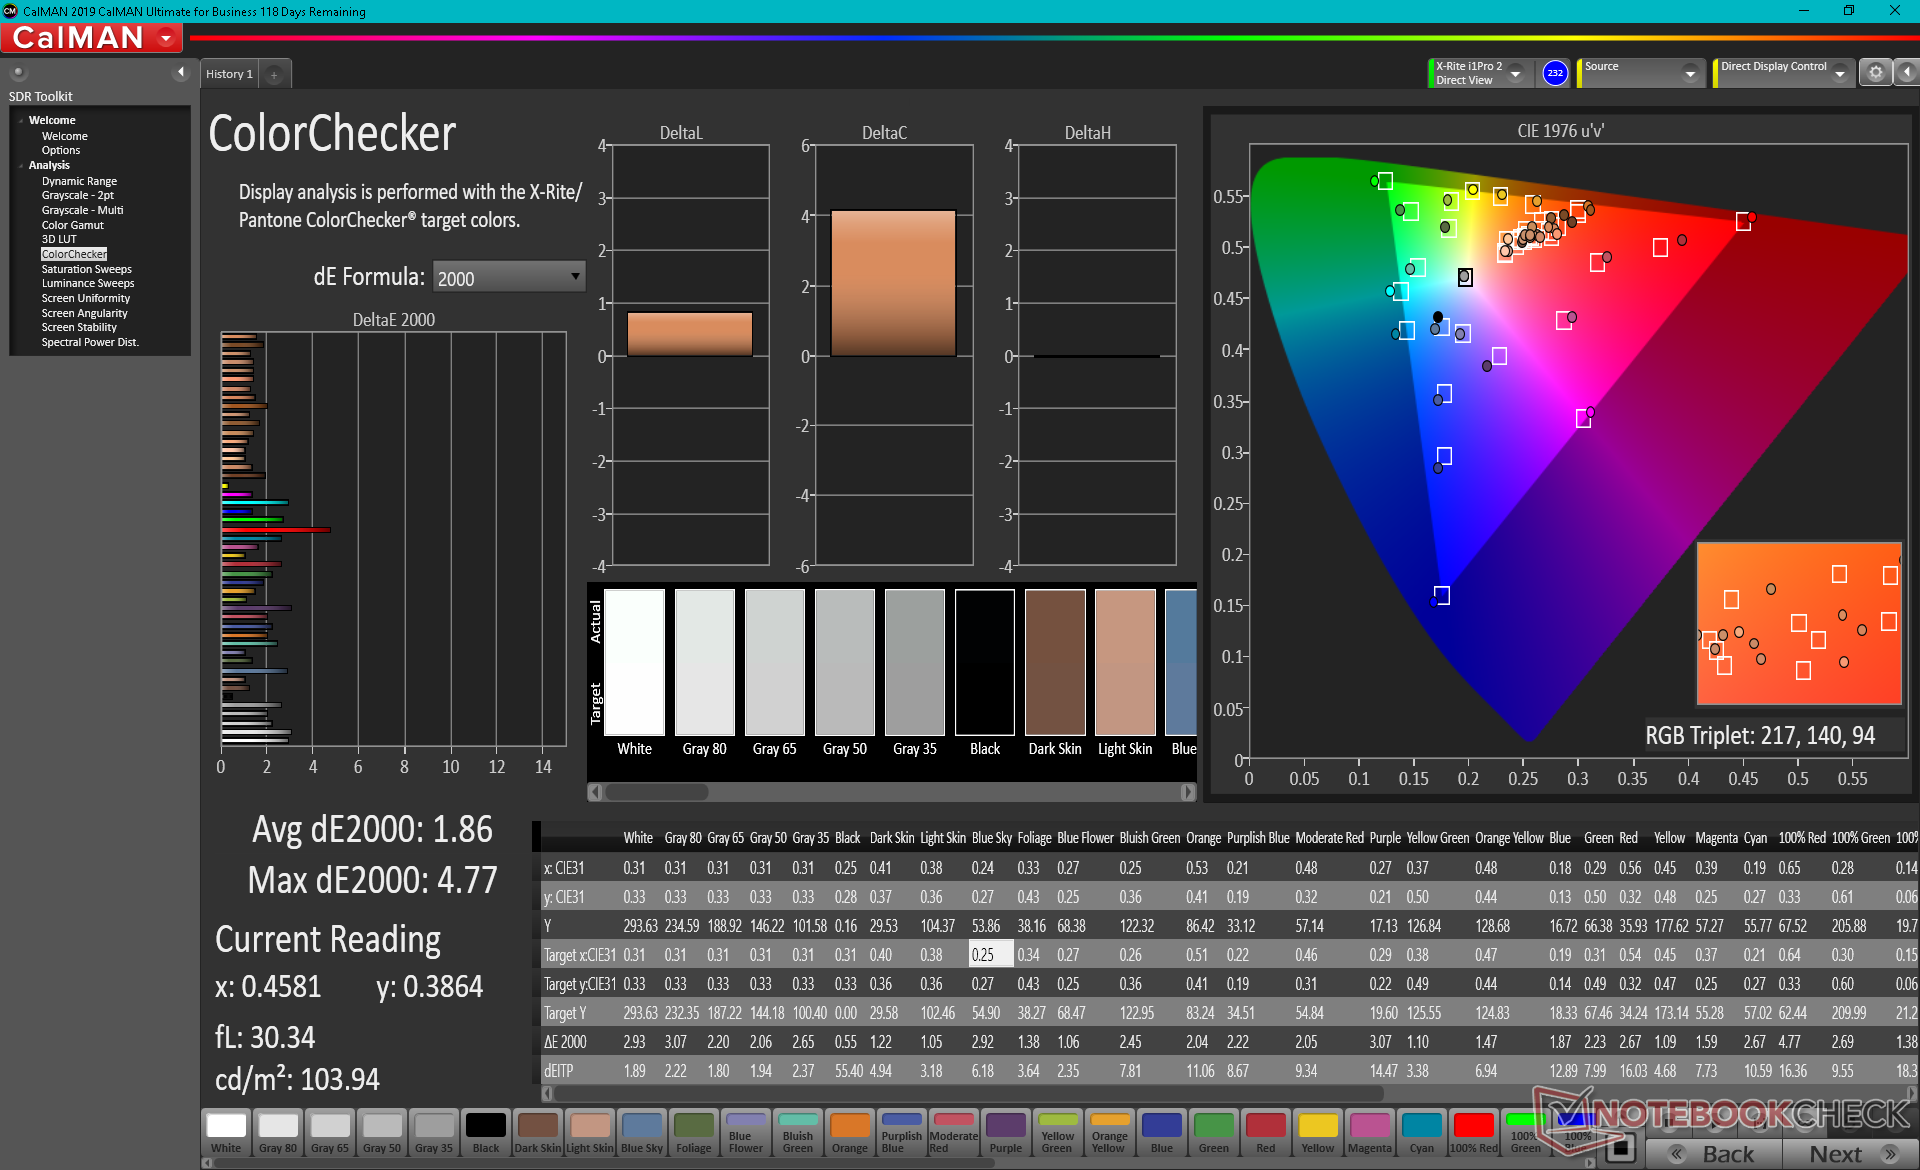
ΔE ColorChecker Calman: 2.56 | ∀{0.5-29.43 Ø4.71}
calibrated: 1.86
ΔE Greyscale Calman: 2.6 | ∀{0.09-98 Ø4.96}
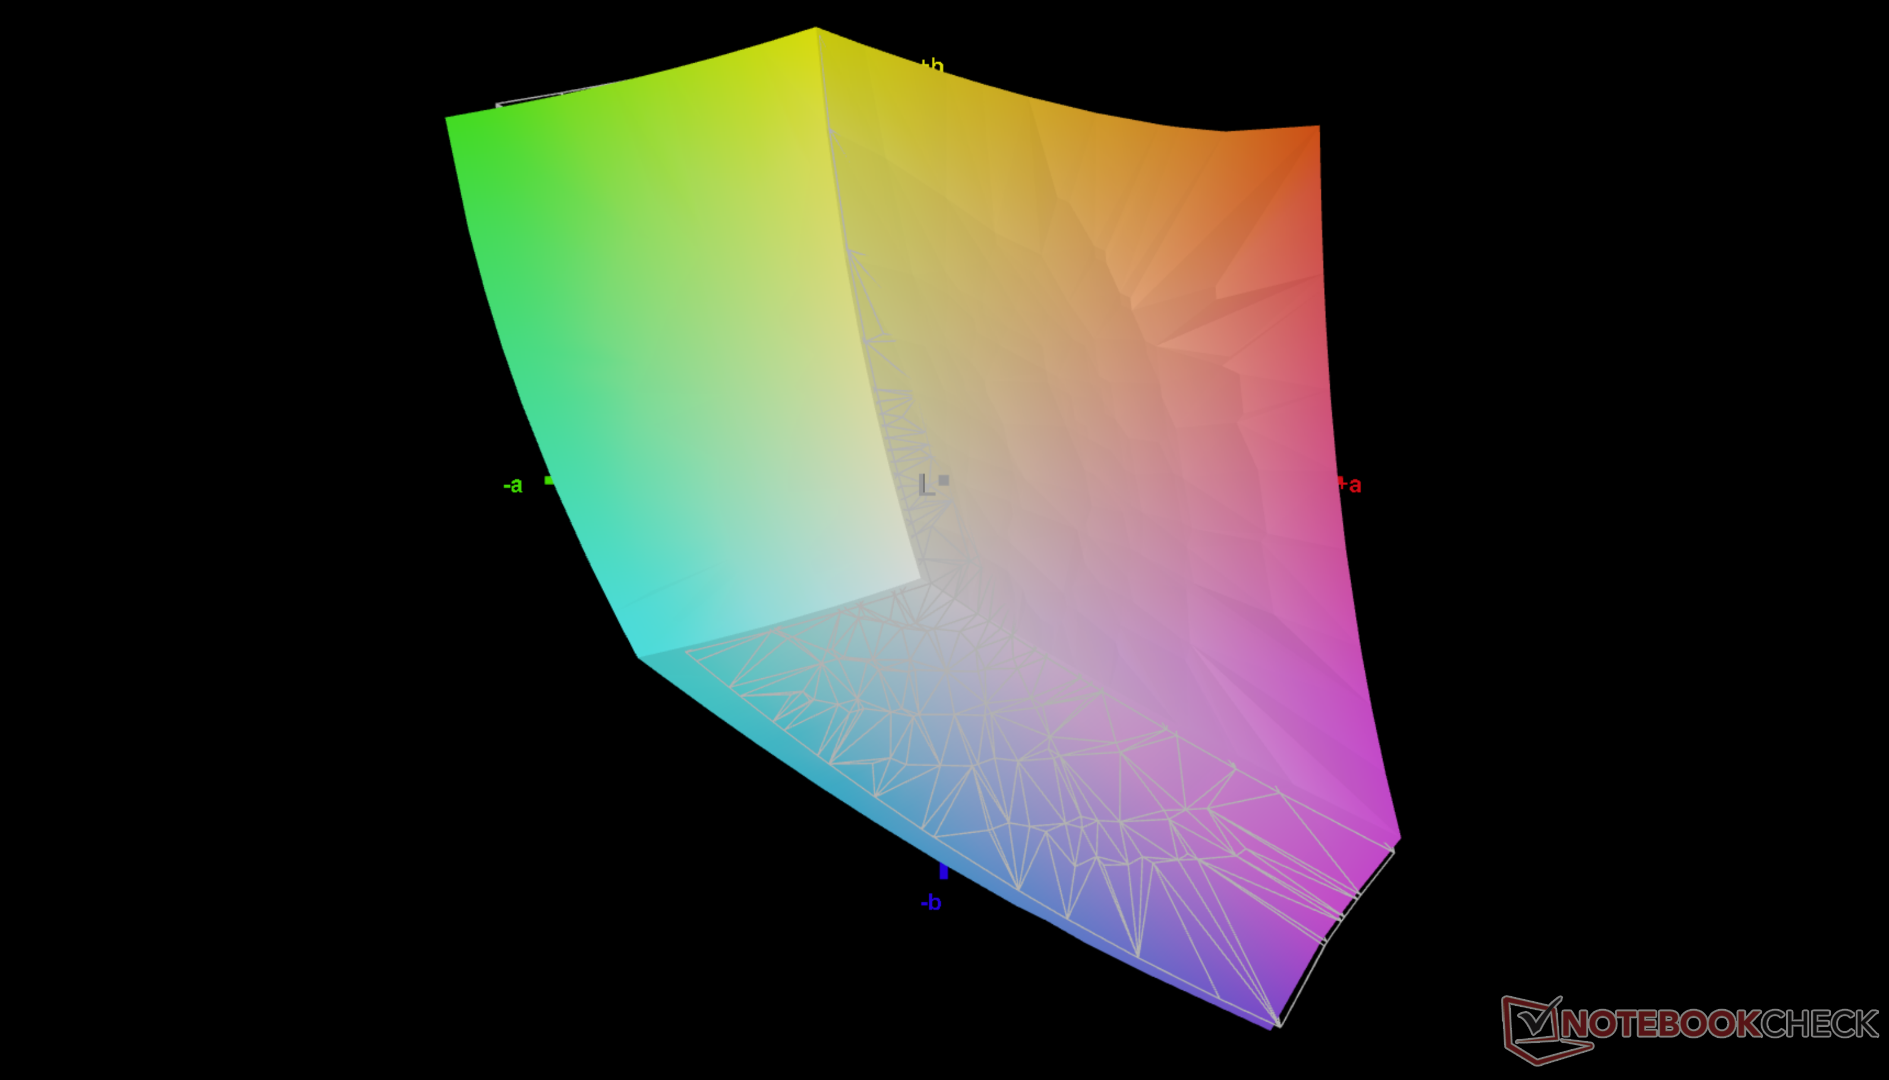
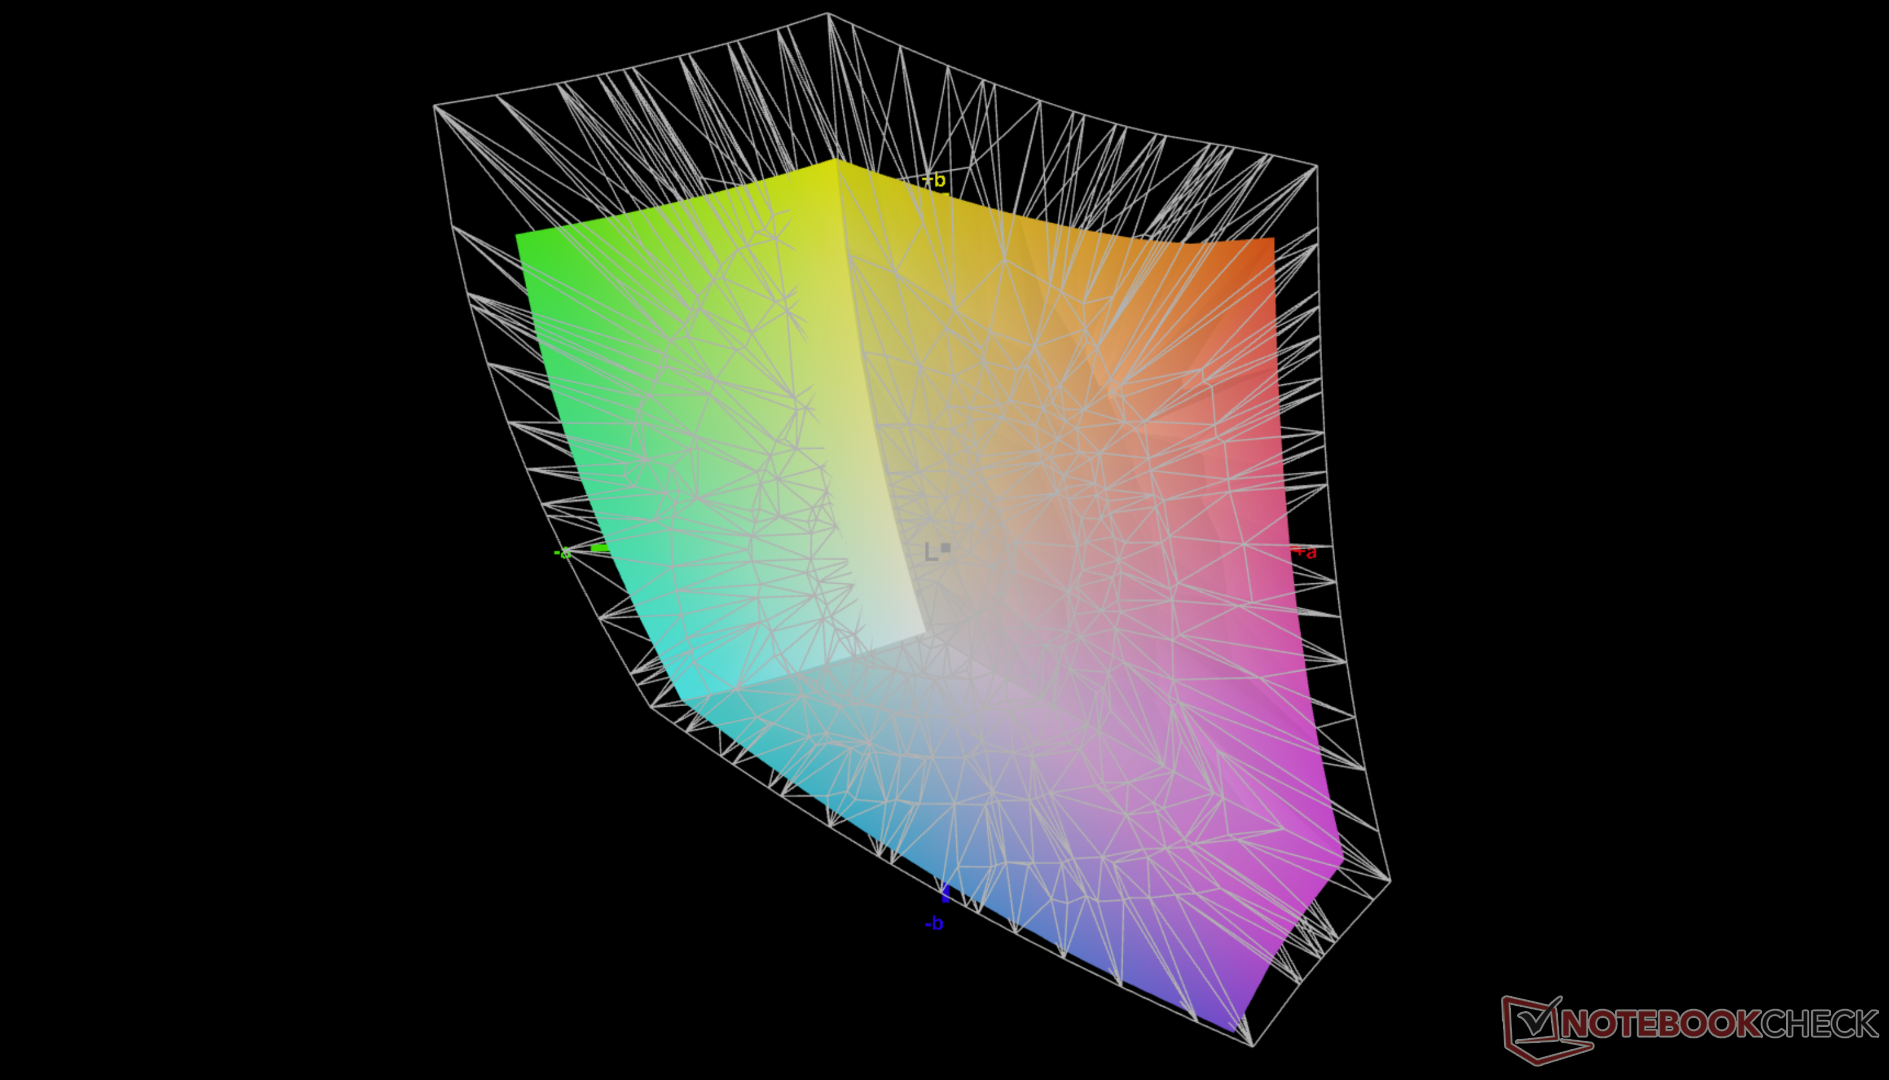
75.8% AdobeRGB 1998 (Argyll 3D)
99.4% sRGB (Argyll 3D)
74.1% Display P3 (Argyll 3D)
Gamma: 2.07
CCT: 6628 K
| Dell Inspiron 16 Plus 7610 AU Optronics B160QAN, IPS, 16", 3072x1920 | Lenovo Legion 5 Pro 16ACH6H (82JQ001PGE) CSOT T3 MNG007DA1-1, IPS, 16", 2560x1600 | Asus ROG Zephyrus M16 GU603H AU Optronics AUOC199, IPS, 16", 2560x1600 | LG Gram 16 (2021) LG Philips LP160WQ1-SPA1, IPS, 16", 2560x1600 | HP Pavilion Gaming 16-a0242ng BOE08F6, IPS, 16.1", 1920x1080 | Dell Inspiron 15 7000 7506 2-in-1 Black Edition AU Optronics B156ZAN, IPS, 15.6", 3840x2160 | |
|---|---|---|---|---|---|---|
| Display | -2% | 13% | -43% | -1% | ||
| Display P3 Coverage (%) | 74.1 | 95.8 29% | 40.42 -45% | 74.3 0% | ||
| sRGB Coverage (%) | 99.4 | 99 0% | 99.8 0% | 60.7 -39% | 99 0% | |
| AdobeRGB 1998 Coverage (%) | 75.8 | 73 -4% | 83.8 11% | 41.77 -45% | 74.6 -2% | |
| Response Times | 84% | 87% | 29% | 15% | -2% | |
| Response Time Grey 50% / Grey 80% * (ms) | 49.2 ? | 9.2 ? 81% | 4.8 ? 90% | 44 ? 11% | 43.2 ? 12% | 55.2 ? -12% |
| Response Time Black / White * (ms) | 36.8 ? | 4.8 87% | 6 ? 84% | 20 ? 46% | 30.4 ? 17% | 34 ? 8% |
| PWM Frequency (Hz) | ||||||
| Screen | 11% | -21% | -45% | -20% | -39% | |
| Brightness middle (cd/m²) | 296.8 | 551 86% | 448 51% | 331 12% | 319 7% | 303.8 2% |
| Brightness (cd/m²) | 292 | 523 79% | 446 53% | 309 6% | 306 5% | 296 1% |
| Brightness Distribution (%) | 87 | 88 1% | 86 -1% | 88 1% | 91 5% | 93 7% |
| Black Level * (cd/m²) | 0.21 | 0.54 -157% | 0.48 -129% | 0.22 -5% | 0.18 14% | 0.24 -14% |
| Contrast (:1) | 1413 | 1020 -28% | 933 -34% | 1505 7% | 1772 25% | 1266 -10% |
| Colorchecker dE 2000 * | 2.56 | 1.8 30% | 2.76 -8% | 4.64 -81% | 4 -56% | 4.58 -79% |
| Colorchecker dE 2000 max. * | 4.76 | 2.53 47% | 7.09 -49% | 9.82 -106% | 11.18 -135% | 9.4 -97% |
| Colorchecker dE 2000 calibrated * | 1.86 | 1.66 11% | 2.86 -54% | 3.16 -70% | 3.52 -89% | 2.17 -17% |
| Greyscale dE 2000 * | 2.6 | 1.85 29% | 3.1 -19% | 6.9 -165% | 1.53 41% | 6.4 -146% |
| Gamma | 2.07 106% | 2.3 96% | 2.153 102% | 2.34 94% | 2.39 92% | 2.3 96% |
| CCT | 6628 98% | 6338 103% | 6826 95% | 7904 82% | 6533 99% | 7414 88% |
| Color Space (Percent of AdobeRGB 1998) (%) | 72.81 | 87 | 75.1 | 38 | 66.7 | |
| Color Space (Percent of sRGB) (%) | 99.41 | 100 | 100 | 60 | 99 | |
| Média Total (Programa/Configurações) | 31% /
20% | 33% /
-1% | -1% /
-22% | -16% /
-20% | -14% /
-26% |
* ... menor é melhor
O espaço de cores abrange o sRGB inteiramente para satisfazer a maioria dos artistas gráficos amadores. Outros laptops multimídia, como o Série ZenBook Pro oferecem cores AdobeRGB ou DCI-P3 mais amplas que o Inspiron 16 ainda não pode oferecer.
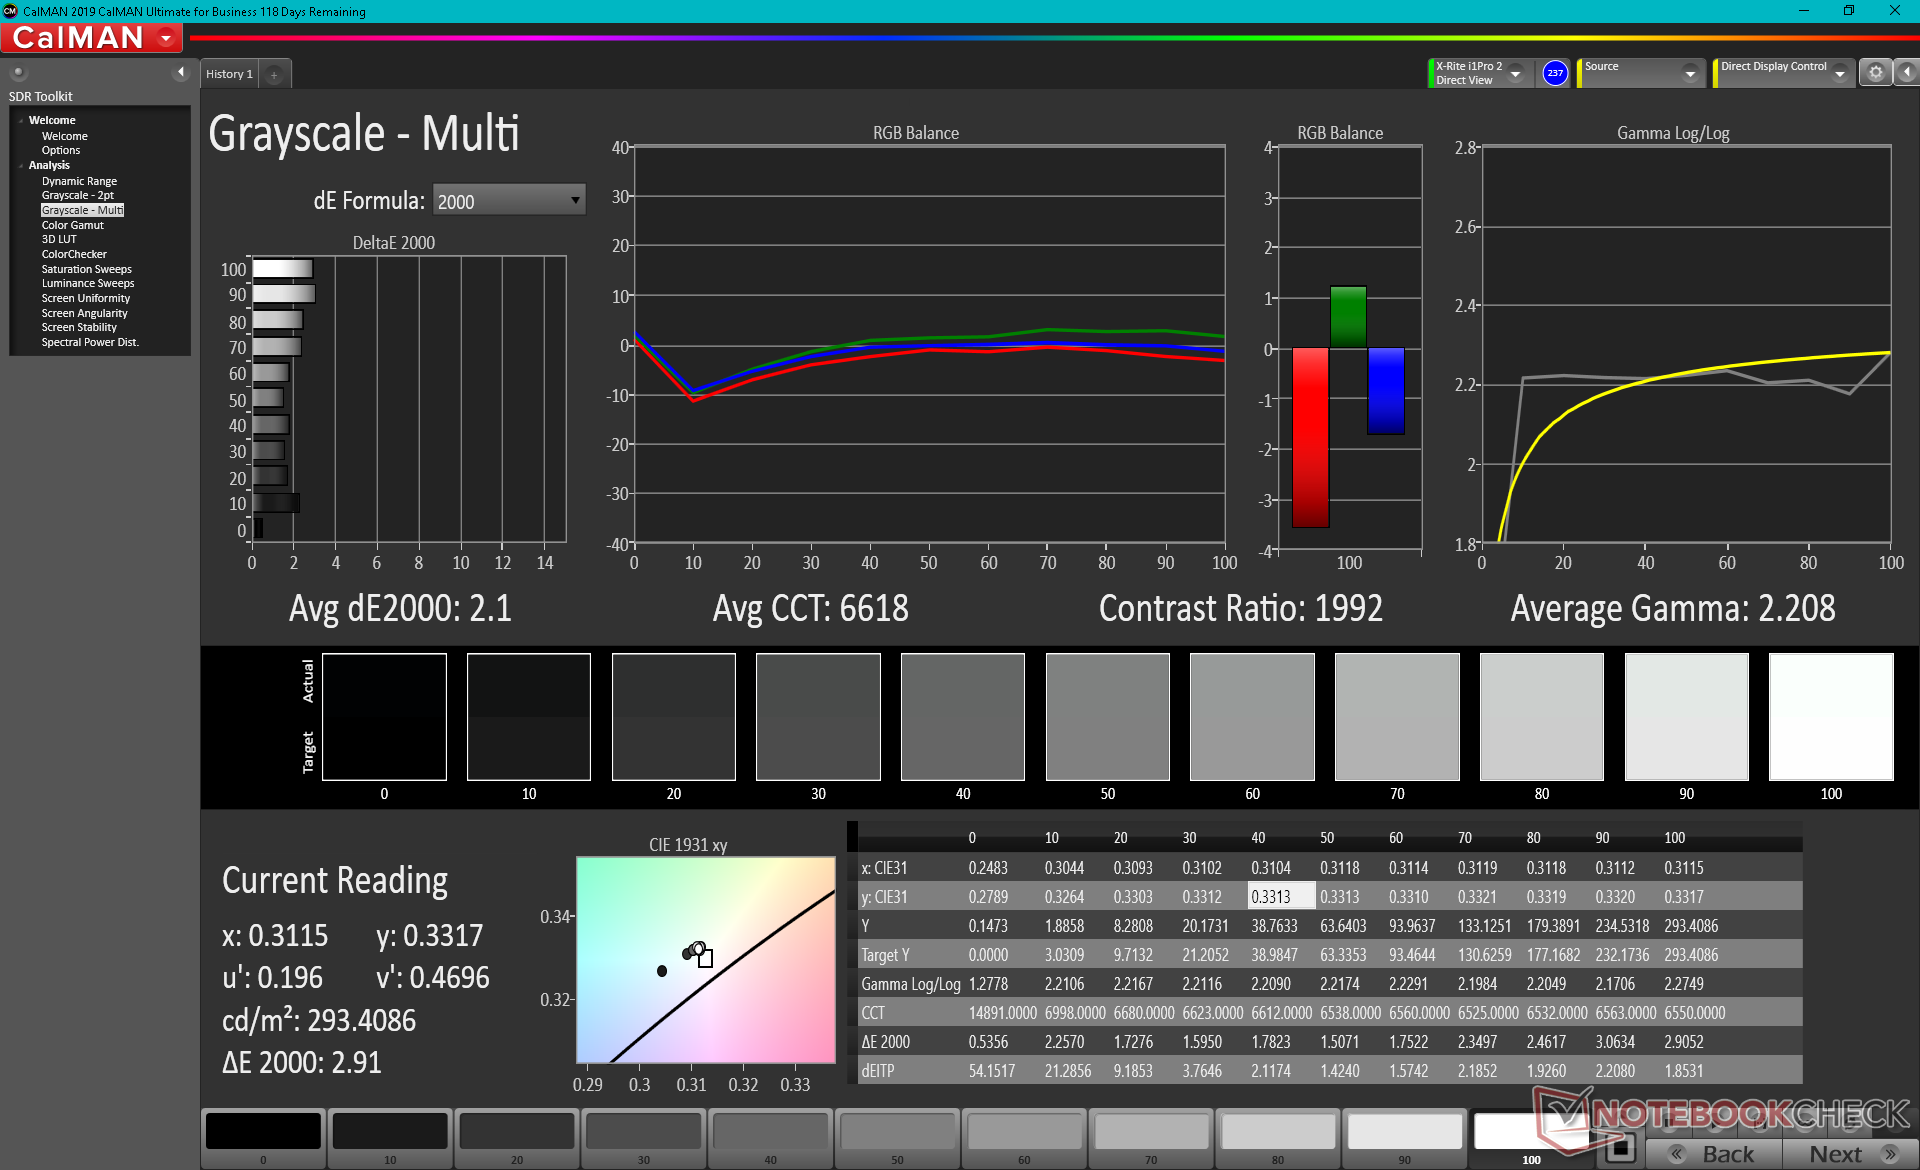
Nosso colorímetro X-Rite revela um display bem calibrado fora da caixa com valores médios de tons de cinza e deltaE de apenas 2,6 e 2,56, respectivamente. Há espaço para melhorias, entretanto, já que nossa própria tentativa de calibração melhoraria ligeiramente os dois valores deltaE para 2,1 e 1,86.

Exibir tempos de resposta
| ↔ Tempo de resposta preto para branco | ||
|---|---|---|
| 36.8 ms ... ascensão ↗ e queda ↘ combinadas | ↗ 20.8 ms ascensão | 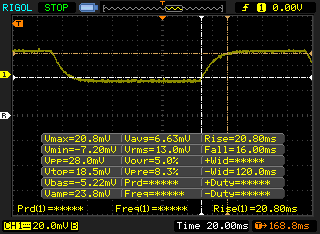 |
| ↘ 16 ms queda | ||
| A tela mostra taxas de resposta lentas em nossos testes e será insatisfatória para os jogadores. Em comparação, todos os dispositivos testados variam de 0.1 (mínimo) a 240 (máximo) ms. » 95 % de todos os dispositivos são melhores. Isso significa que o tempo de resposta medido é pior que a média de todos os dispositivos testados (19.8 ms). | ||
| ↔ Tempo de resposta 50% cinza a 80% cinza | ||
| 49.2 ms ... ascensão ↗ e queda ↘ combinadas | ↗ 24.8 ms ascensão | 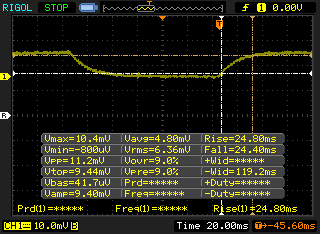 |
| ↘ 24.4 ms queda | ||
| A tela mostra taxas de resposta lentas em nossos testes e será insatisfatória para os jogadores. Em comparação, todos os dispositivos testados variam de 0.165 (mínimo) a 636 (máximo) ms. » 85 % de todos os dispositivos são melhores. Isso significa que o tempo de resposta medido é pior que a média de todos os dispositivos testados (31 ms). | ||
Cintilação da tela / PWM (modulação por largura de pulso)
| Tela tremeluzindo / PWM não detectado | 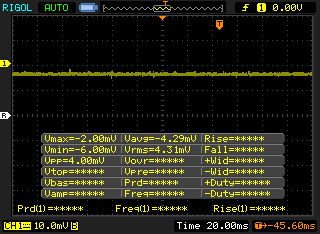 | ||
[pwm_comparison] Em comparação: 52 % de todos os dispositivos testados não usam PWM para escurecer a tela. Se PWM foi detectado, uma média de 7757 (mínimo: 5 - máximo: 343500) Hz foi medida. | |||
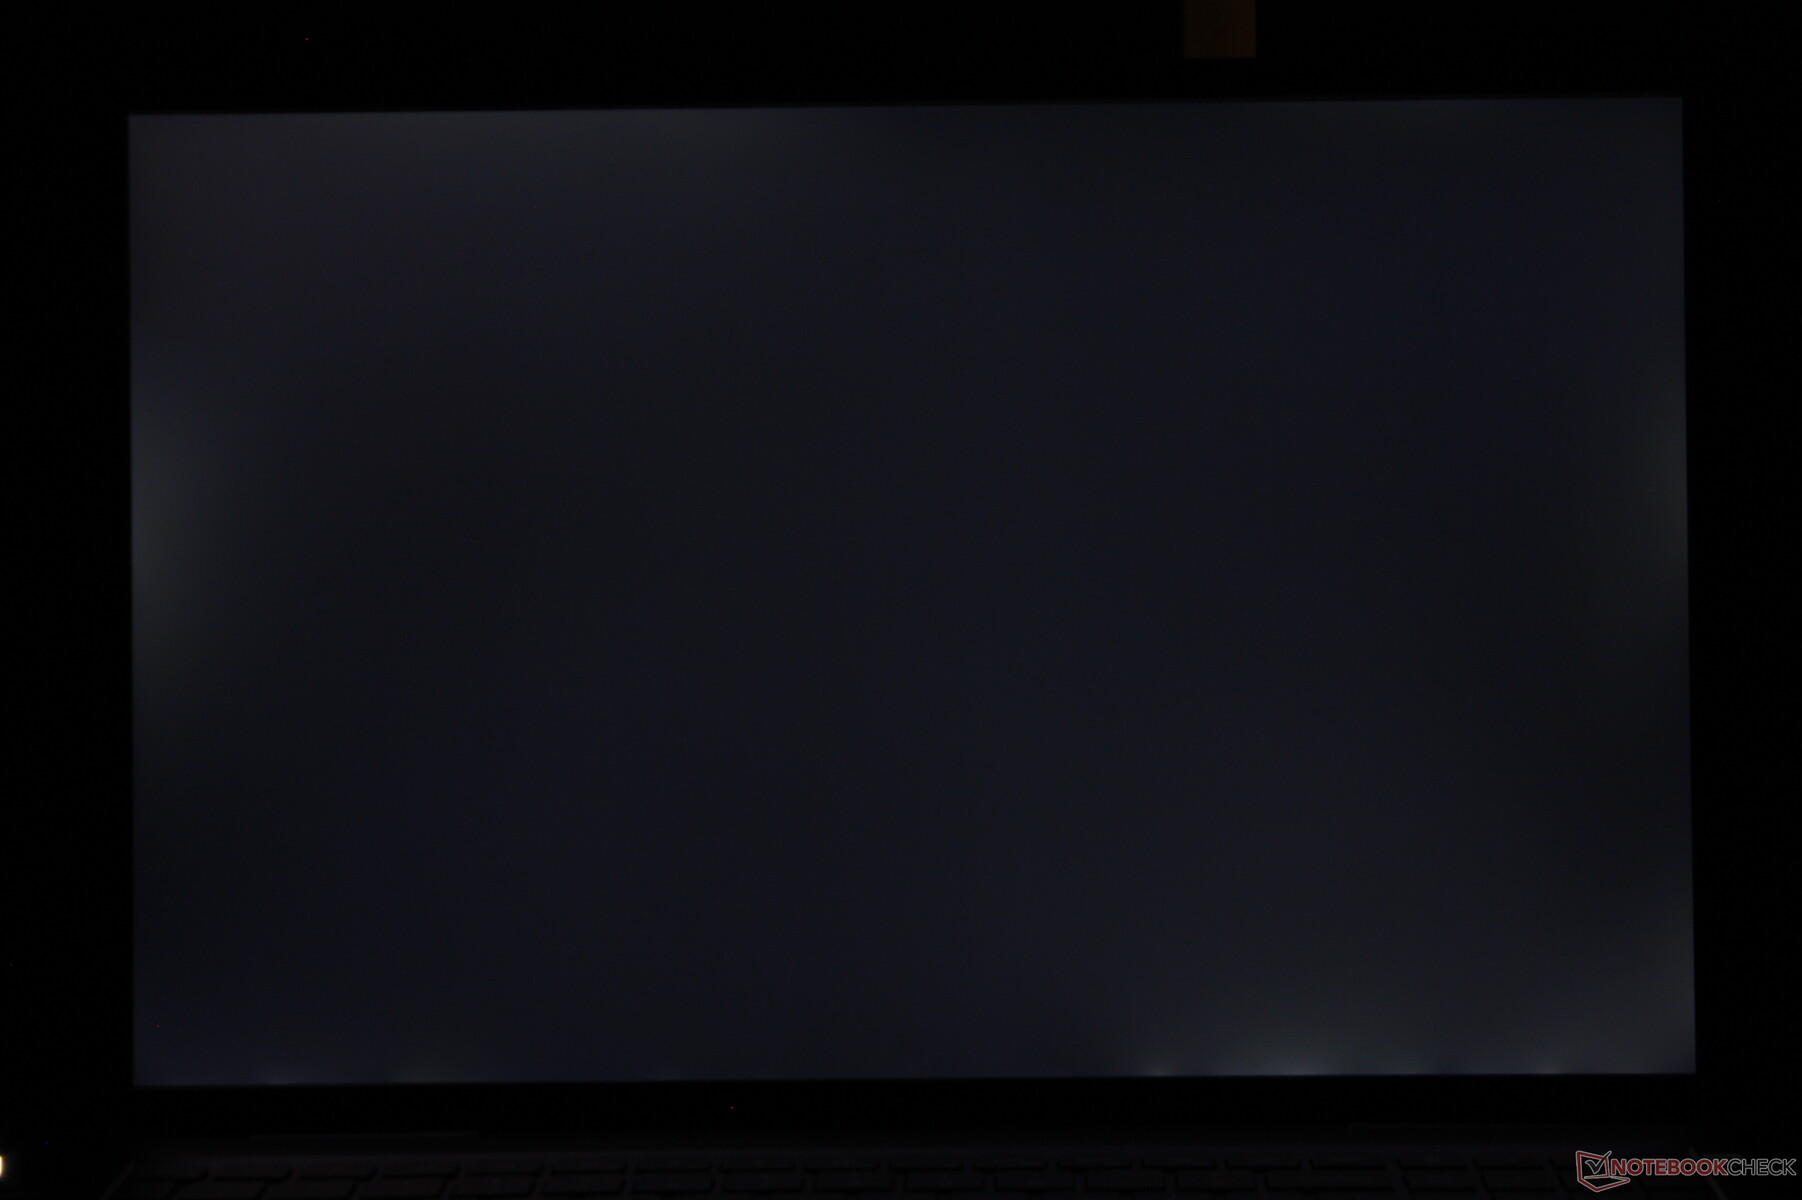
A visibilidade externa está abaixo da média e é semelhante a muitos laptops para jogos de 15,6 polegadas, uma vez que a maioria dos modelos da categoria visa o mesmo brilho de 300-nit do painel. O Asus ROG Zephyrus M16, MacBook Pro 16, ou Lenovo Legion 5 Pro são visivelmente mais brilhantes se a visualização ao ar livre for importante.

Desempenho - Acionado pelo Intel Core H
Intel Tiger Lake-H CPUs vêm como padrão enquanto o GeForce RTX 3050 ou RTX 3060 são opcionais. O Inspiron 16 é um laptop quase XPS uma vez que transporta opções similares de CPU e GPU sem o Core i9 topo de linha. Não existem SKUs AMD a partir desta escrita.
Barra redimensionável e Optimus 1.0 estão incluídos se configurados com uma GPU Nvidia.
Processador
O desempenho da CPU poderia ter sido melhor, pois os resultados do CineBench Multithread são 11 a 16 por cento mais lentos do que a média dos portáteis equipados com o mesmo Núcleo i7-11800H processador. Este déficit significa que a maioria dos laptops com a AMD mais antiga Ryzen 7 4800Hpode superar o desempenho de nossa Dell. Mesmo assim, ainda é um passo à frente da geração anterior Núcleo i7-10870H em cerca de 10 a 15 por cento. O desempenho de uma única linha é de outra forma excelente e onde esperamos que esteja.
Optando pela linha inferior Núcleo i5-11400H ao invés de nossa configuração i7-11800H incorrerá em um déficit de desempenho de cerca de 10 a 20 por cento.
Cinebench R15 Multi Loop
Cinebench R23: Multi Core | Single Core
Cinebench R15: CPU Multi 64Bit | CPU Single 64Bit
Blender: v2.79 BMW27 CPU
7-Zip 18.03: 7z b 4 -mmt1 | 7z b 4
Geekbench 5.5: Single-Core | Multi-Core
HWBOT x265 Benchmark v2.2: 4k Preset
LibreOffice : 20 Documents To PDF
R Benchmark 2.5: Overall mean
| Cinebench R23 / Multi Core | |
| Média Intel Core i7-11800H (6508 - 14088, n=48) | |
| Schenker XMG Core 15 Ampere | |
| Dell Inspiron 16 Plus 7610 | |
| Gigabyte Aero 15 OLED XC | |
| Razer Blade 15 Advanced Model Early 2021 | |
| Acer Aspire Nitro 5 AN515-55-57GF | |
| Cinebench R23 / Single Core | |
| Dell Inspiron 16 Plus 7610 | |
| Média Intel Core i7-11800H (1386 - 1522, n=45) | |
| Schenker XMG Core 15 Ampere | |
| Gigabyte Aero 15 OLED XC | |
| Razer Blade 15 Advanced Model Early 2021 | |
| Acer Aspire Nitro 5 AN515-55-57GF | |
| HWBOT x265 Benchmark v2.2 / 4k Preset | |
| Asus ROG Zephyrus M16 GU603H | |
| Média Intel Core i7-11800H (7.38 - 17.4, n=46) | |
| Schenker XMG Core 15 Ampere | |
| Asus TUF Gaming A15 FA506QR-AZ061T | |
| Dell Inspiron 16 Plus 7610 | |
| Gigabyte Aero 15 OLED XC | |
| Razer Blade 15 Advanced Model Early 2021 | |
| Asus ProArt StudioBook Pro 15 W500G5T | |
| Acer Aspire Nitro 5 AN515-55-57GF | |
* ... menor é melhor
Desempenho do sistema
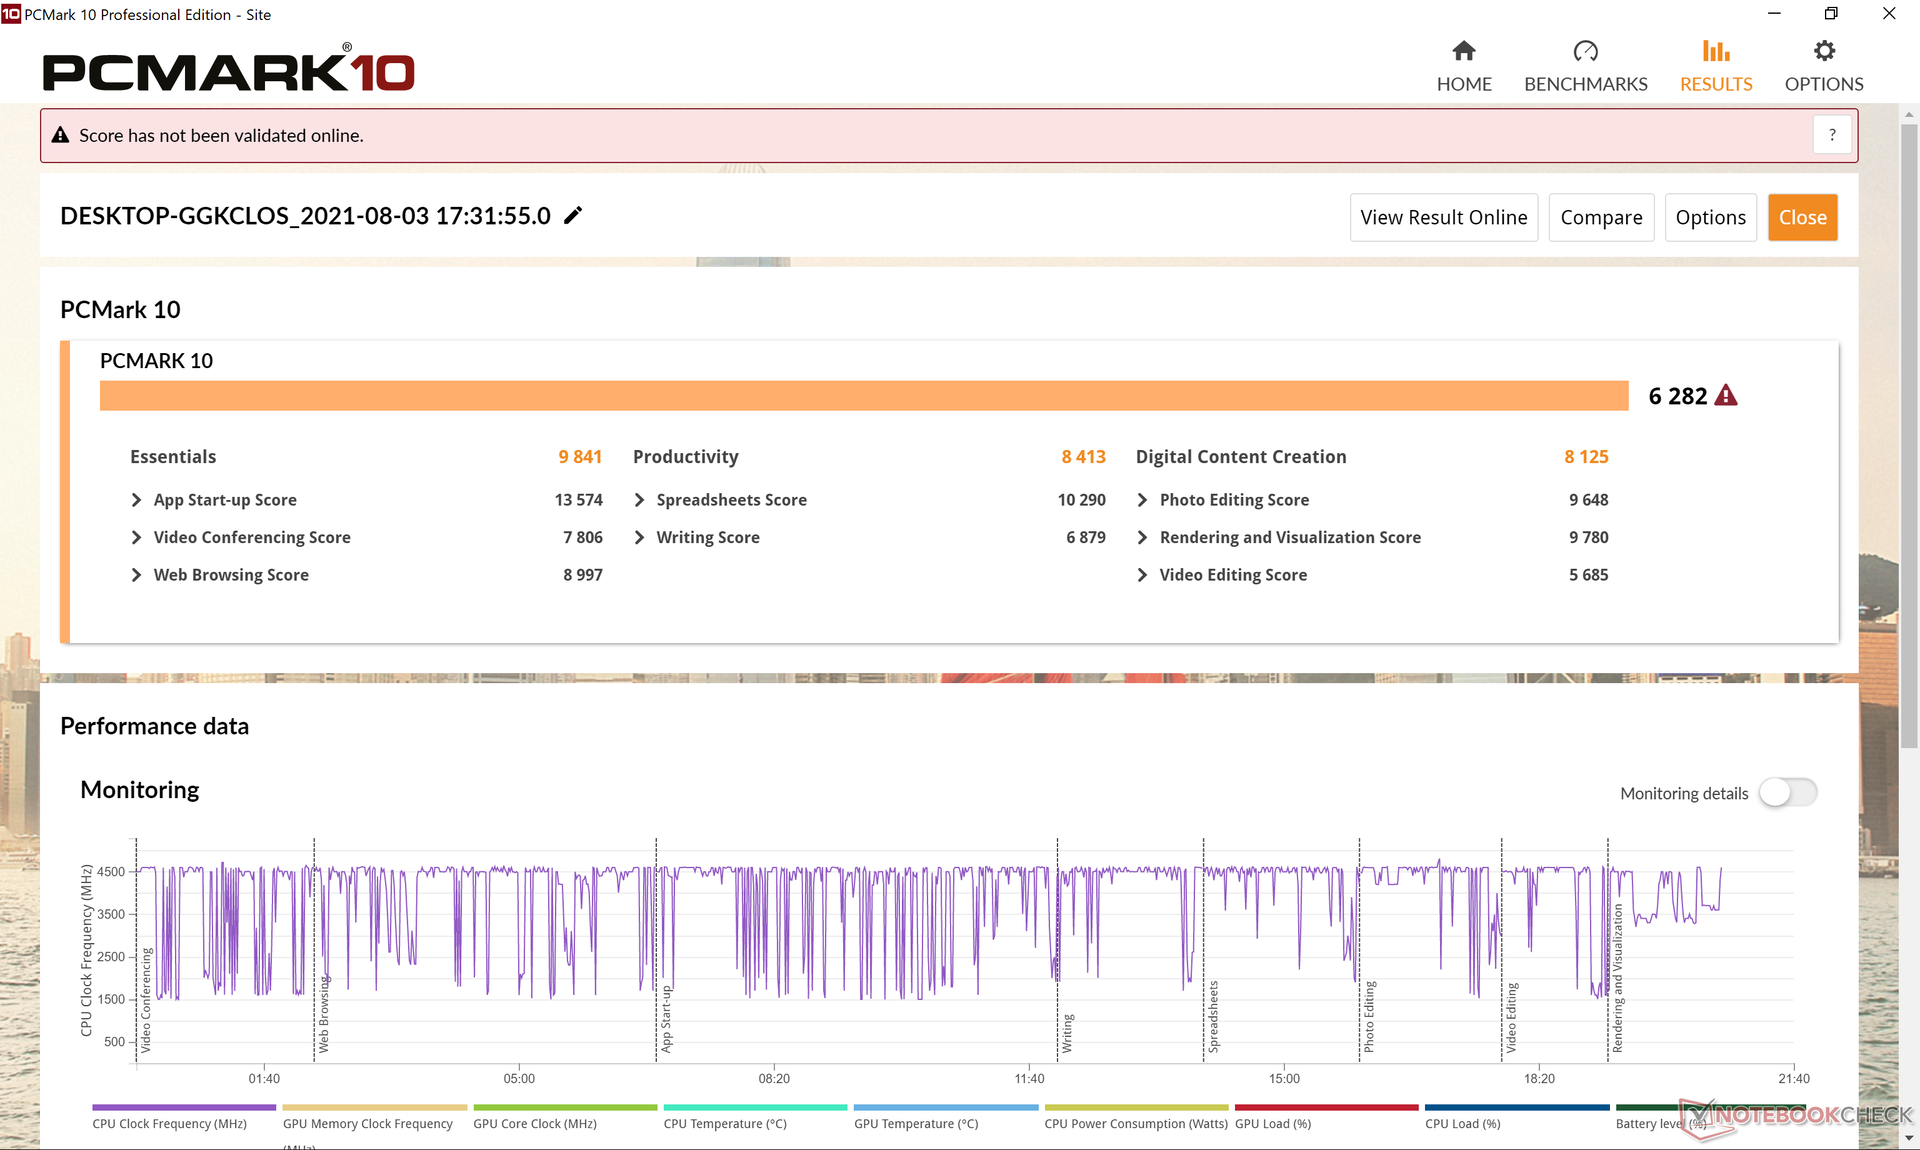
Os resultados do PCMark 10 são geralmente mais altos que os portáteis com CPUs mais antigas do 10º gênero Core-H, tais como asAsus ROG Zephyrus M15. As diferenças são especialmente acentuadas quando comparadas aos laptops alimentados por CPUs Core da série U.
| PCMark 10 / Score | |
| Asus ROG Zephyrus M16 GU603H | |
| Lenovo Legion 5 Pro 16ACH6H (82JQ001PGE) | |
| Dell Inspiron 16 Plus 7610 | |
| Média Intel Core i7-11800H, NVIDIA GeForce RTX 3050 4GB Laptop GPU (n=1) | |
| Dell Inspiron 15 7000 7506 2-in-1 Black Edition | |
| LG Gram 16 (2021) | |
| HP Pavilion Gaming 16-a0242ng | |
| PCMark 10 / Essentials | |
| Asus ROG Zephyrus M16 GU603H | |
| LG Gram 16 (2021) | |
| Dell Inspiron 16 Plus 7610 | |
| Média Intel Core i7-11800H, NVIDIA GeForce RTX 3050 4GB Laptop GPU (n=1) | |
| Dell Inspiron 15 7000 7506 2-in-1 Black Edition | |
| Lenovo Legion 5 Pro 16ACH6H (82JQ001PGE) | |
| HP Pavilion Gaming 16-a0242ng | |
| PCMark 10 / Productivity | |
| Asus ROG Zephyrus M16 GU603H | |
| Lenovo Legion 5 Pro 16ACH6H (82JQ001PGE) | |
| Dell Inspiron 16 Plus 7610 | |
| Média Intel Core i7-11800H, NVIDIA GeForce RTX 3050 4GB Laptop GPU (n=1) | |
| HP Pavilion Gaming 16-a0242ng | |
| LG Gram 16 (2021) | |
| Dell Inspiron 15 7000 7506 2-in-1 Black Edition | |
| PCMark 10 / Digital Content Creation | |
| Asus ROG Zephyrus M16 GU603H | |
| Lenovo Legion 5 Pro 16ACH6H (82JQ001PGE) | |
| Dell Inspiron 16 Plus 7610 | |
| Média Intel Core i7-11800H, NVIDIA GeForce RTX 3050 4GB Laptop GPU (n=1) | |
| Dell Inspiron 15 7000 7506 2-in-1 Black Edition | |
| HP Pavilion Gaming 16-a0242ng | |
| LG Gram 16 (2021) | |
| PCMark 10 Score | 6282 pontos | |
Ajuda | ||
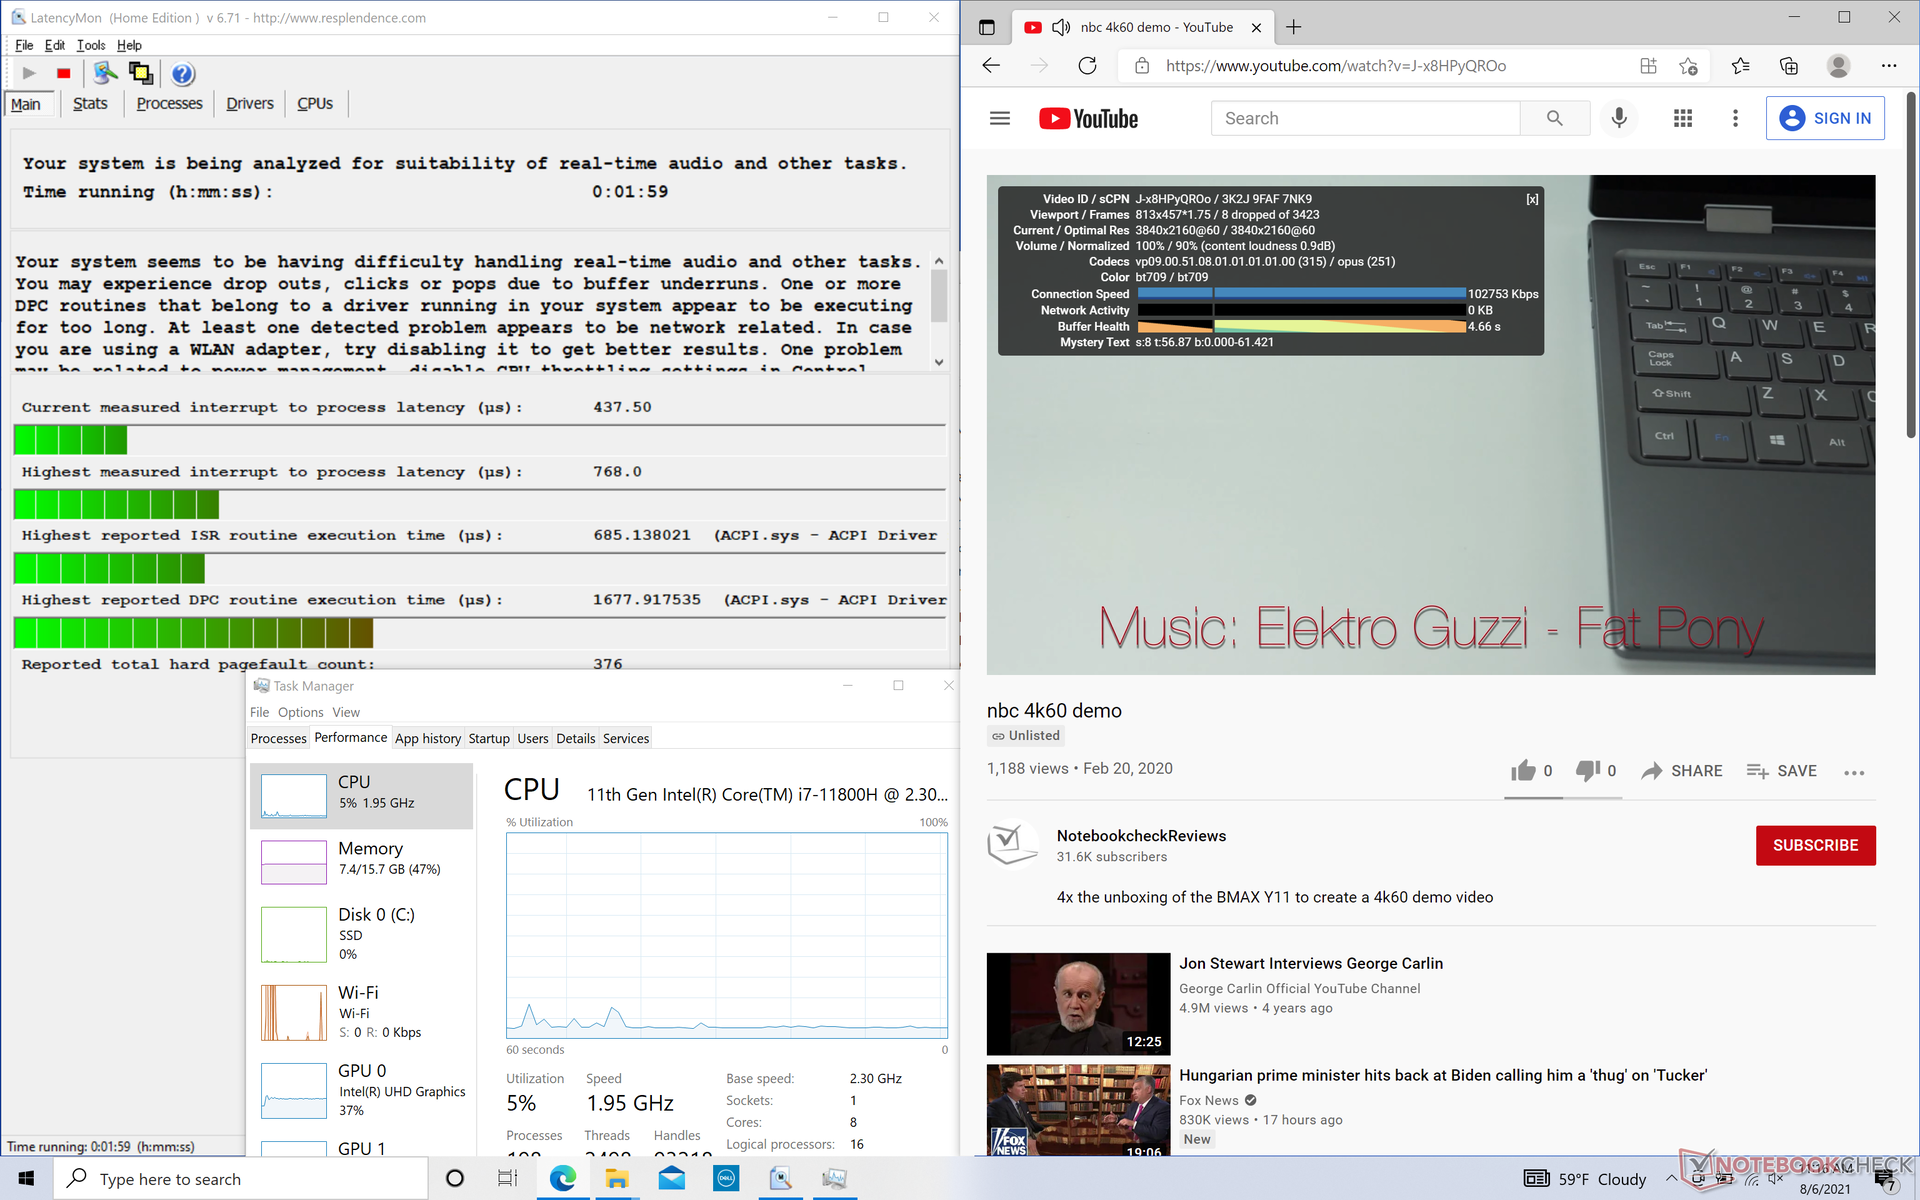
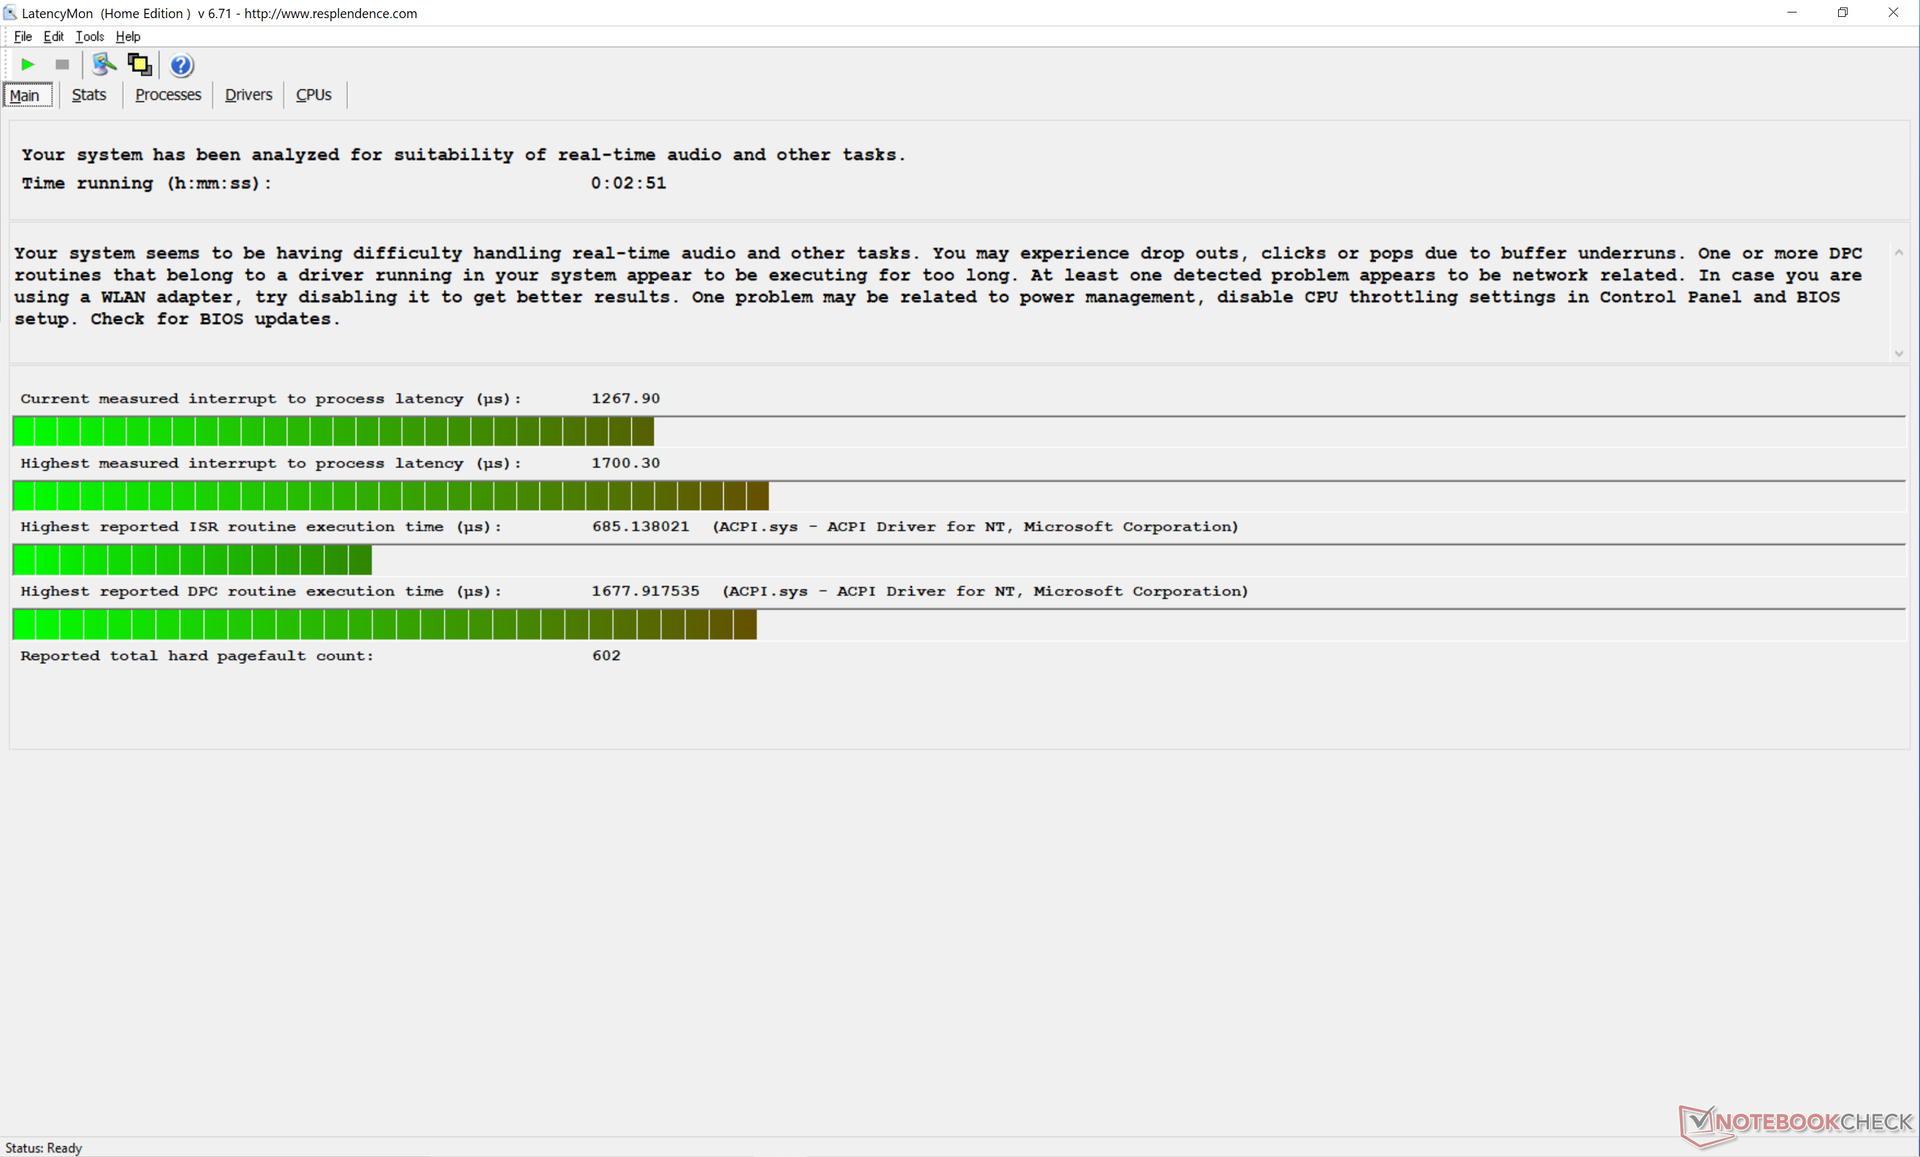
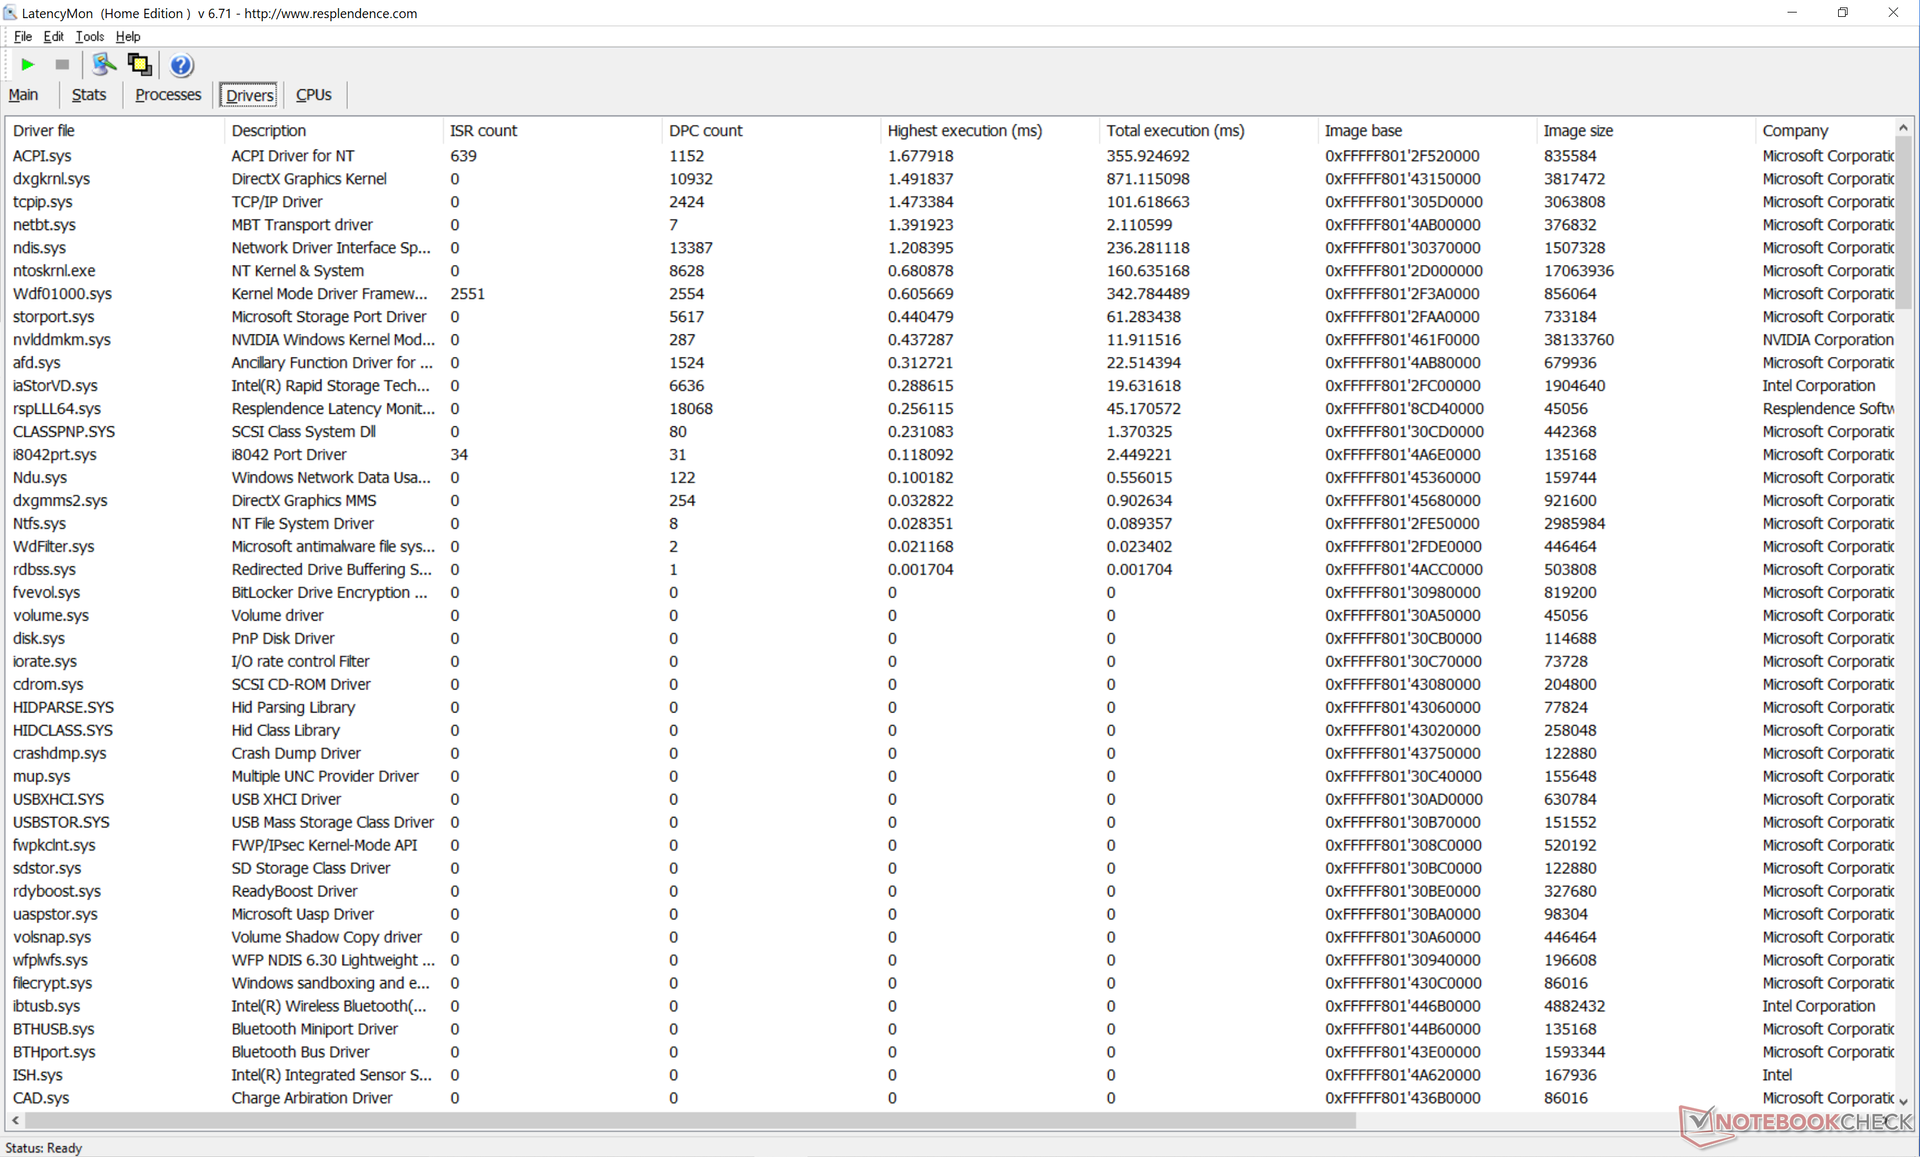
Latência do DPC
LatencyMon revela problemas de latência da DPC ao abrir várias abas em nossa página inicial ou ao executar Prime95 stress. A reprodução do vídeo de 4K a 60 FPS também não é impecável, já que somos capazes de gravar 8 quadros soltos durante nossos 60 segundos de vídeo.
| DPC Latencies / LatencyMon - interrupt to process latency (max), Web, Youtube, Prime95 | |
| HP Pavilion Gaming 16-a0242ng | |
| Dell Inspiron 16 Plus 7610 | |
| Lenovo Legion 5 Pro 16ACH6H (82JQ001PGE) | |
| Asus ROG Zephyrus M16 GU603H | |
| LG Gram 16 (2021) | |
| Dell Inspiron 15 7000 7506 2-in-1 Black Edition | |
* ... menor é melhor
Dispositivos de armazenamento - Dois acionamentos internos
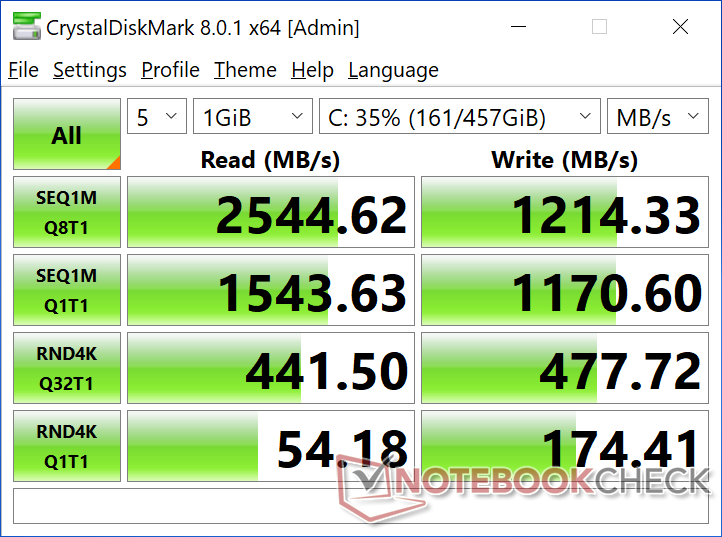
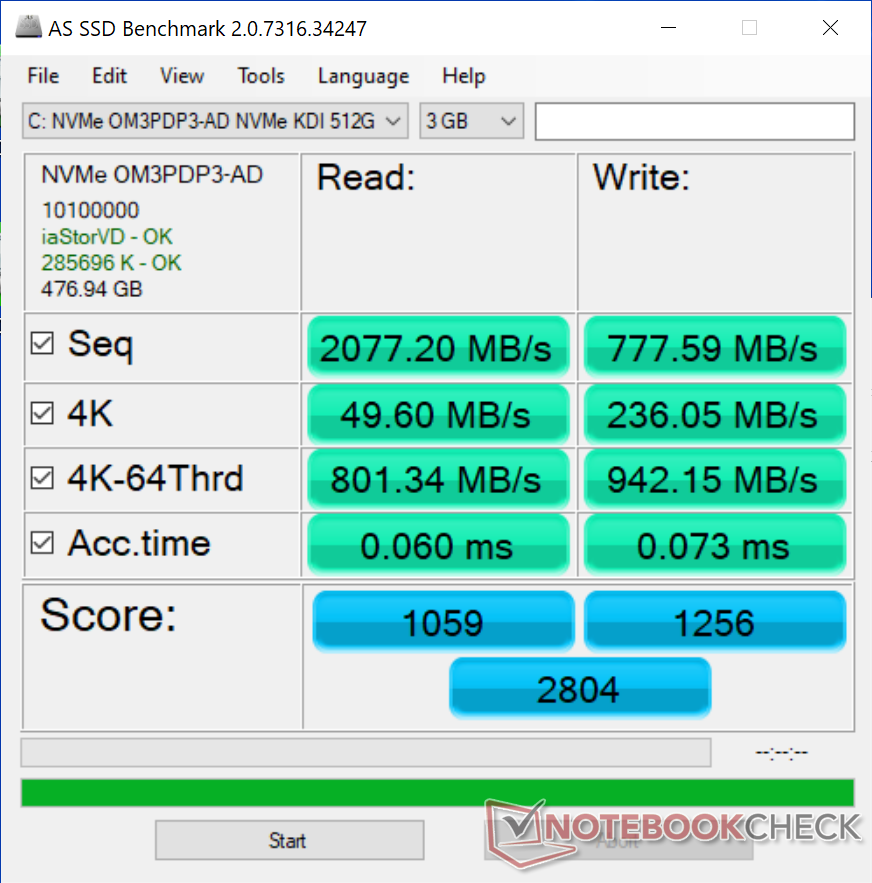
Nossa unidade de teste vem com um SSD NVMe OM3PDP3-AD incomum da Kingston. O desempenho é bastante médio em até a metade do desempenho do Micron 2300 no XPS 15 9510. É difícil prever com o que as unidades de varejo serão enviadas como fontes Dell de múltiplos fornecedores de SSD, incluindo Samsung, Micron, Western Digital, Toshiba e aparentemente Kingston.
Os usuários podem instalar até duas unidades internas, mas pelo menos uma deve estar no fator de forma 2230 menor.
| Dell Inspiron 16 Plus 7610 Kingston OM3PDP3512B | Lenovo Legion 5 Pro 16ACH6H (82JQ001PGE) WDC PC SN730 SDBPNTY-1T00 | LG Gram 16 (2021) SK Hynix PC601 1TB HFS001TD9TNG | HP Pavilion Gaming 16-a0242ng Intel SSD 660p SSDPEKNW512G8 | Dell Inspiron 15 7000 7506 2-in-1 Black Edition Micron 2300 1TB MTFDHBA1T0TDV | |
|---|---|---|---|---|---|
| AS SSD | -28% | 57% | -23% | 31% | |
| Seq Read (MB/s) | 2077 | 2695 30% | 2808 35% | 1438 -31% | 1910 -8% |
| Seq Write (MB/s) | 778 | 2384 206% | 2345 201% | 905 16% | 2795 259% |
| 4K Read (MB/s) | 49.6 | 29.75 -40% | 50.2 1% | 50.3 1% | 50.5 2% |
| 4K Write (MB/s) | 236.1 | 52 -78% | 138.6 -41% | 111.7 -53% | 103.8 -56% |
| 4K-64 Read (MB/s) | 801 | 1193 49% | 1584 98% | 324 -60% | 1485 85% |
| 4K-64 Write (MB/s) | 942 | 1107 18% | 1687 79% | 729 -23% | 1820 93% |
| Access Time Read * (ms) | 0.06 | 0.136 -127% | 0.035 42% | 0.105 -75% | 0.056 7% |
| Access Time Write * (ms) | 0.073 | 0.36 -393% | 0.028 62% | 0.047 36% | 0.282 -286% |
| Score Read (Points) | 1059 | 1493 41% | 1915 81% | 518 -51% | 1727 63% |
| Score Write (Points) | 1256 | 1397 11% | 2060 64% | 931 -26% | 2203 75% |
| Score Total (Points) | 2804 | 3636 30% | 4934 76% | 1707 -39% | 4863 73% |
| Copy ISO MB/s (MB/s) | 1028 | 1007 -2% | 1852 80% | 1145 11% | 1892 84% |
| Copy Program MB/s (MB/s) | 794 | 43.11 -95% | 704 -11% | 602 -24% | 649 -18% |
| Copy Game MB/s (MB/s) | 987 | 621 -37% | 1329 35% | 929 -6% | 1558 58% |
| CrystalDiskMark 5.2 / 6 | 13% | 49% | 51% | ||
| Write 4K (MB/s) | 176.8 | 89.9 -49% | 204.2 15% | 111.4 -37% | |
| Read 4K (MB/s) | 52.3 | 30.98 -41% | 47.14 -10% | 53.4 2% | |
| Write Seq (MB/s) | 1170 | 2521 115% | 2598 122% | ||
| Read Seq (MB/s) | 1557 | 1748 12% | 2308 48% | ||
| Write 4K Q32T1 (MB/s) | 471.5 | 371.6 -21% | 669 42% | 644 37% | |
| Read 4K Q32T1 (MB/s) | 437.9 | 470.6 7% | 760 74% | 665 52% | |
| Write Seq Q32T1 (MB/s) | 1214 | 3065 152% | 2513 107% | 3147 159% | |
| Read Seq Q32T1 (MB/s) | 2549 | 3370 32% | 3452 35% | 3242 27% | |
| Write 4K Q8T8 (MB/s) | 1619 | ||||
| Read 4K Q8T8 (MB/s) | 1670 | ||||
| Média Total (Programa/Configurações) | -8% /
-15% | 53% /
54% | -23% /
-23% | 41% /
38% |
* ... menor é melhor

Disk Throttling: DiskSpd Read Loop, Queue Depth 8
GPU Performance - Até 65 W TGP
O desempenho gráfico é um tanto decepcionante. Embora não estivéssemos esperando nada próximo ao mais caro RTX 3060nosso RTX 3050 não pode nem mesmo superar o GTX 1660 Ti na maioria dos casos. A queda de 40% no desempenho quando comparado com o RTX 3060 é suficiente para colocá-lo abaixo de laptops mais antigos e baratos rodando no GTX 1660 Ti ou RTX 2060.
Além disso, nossa pontuação 3DMark Port Royal é excepcionalmente baixa, com apenas 701 pontos, mesmo depois de atualizar os drivers e o benchmark para suas respectivas versões mais recentes. Chegamos até a Dell para ver se isto poderia ser um bug.
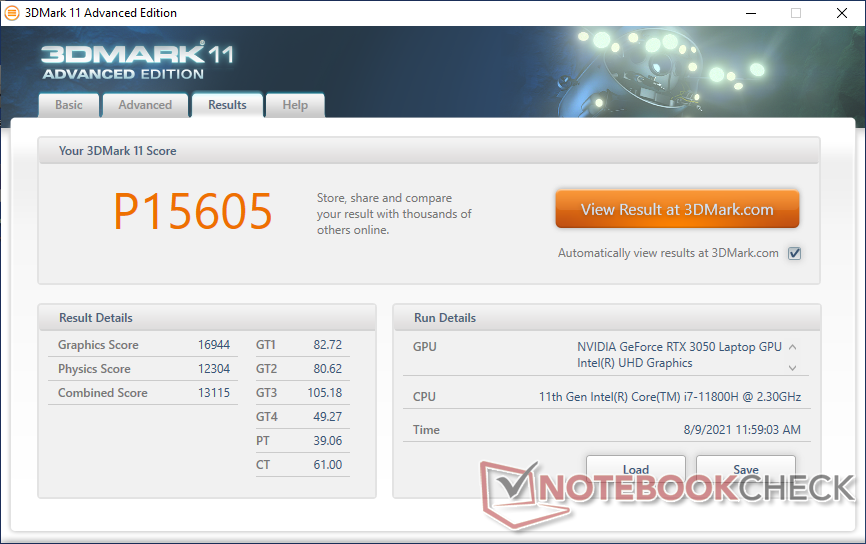
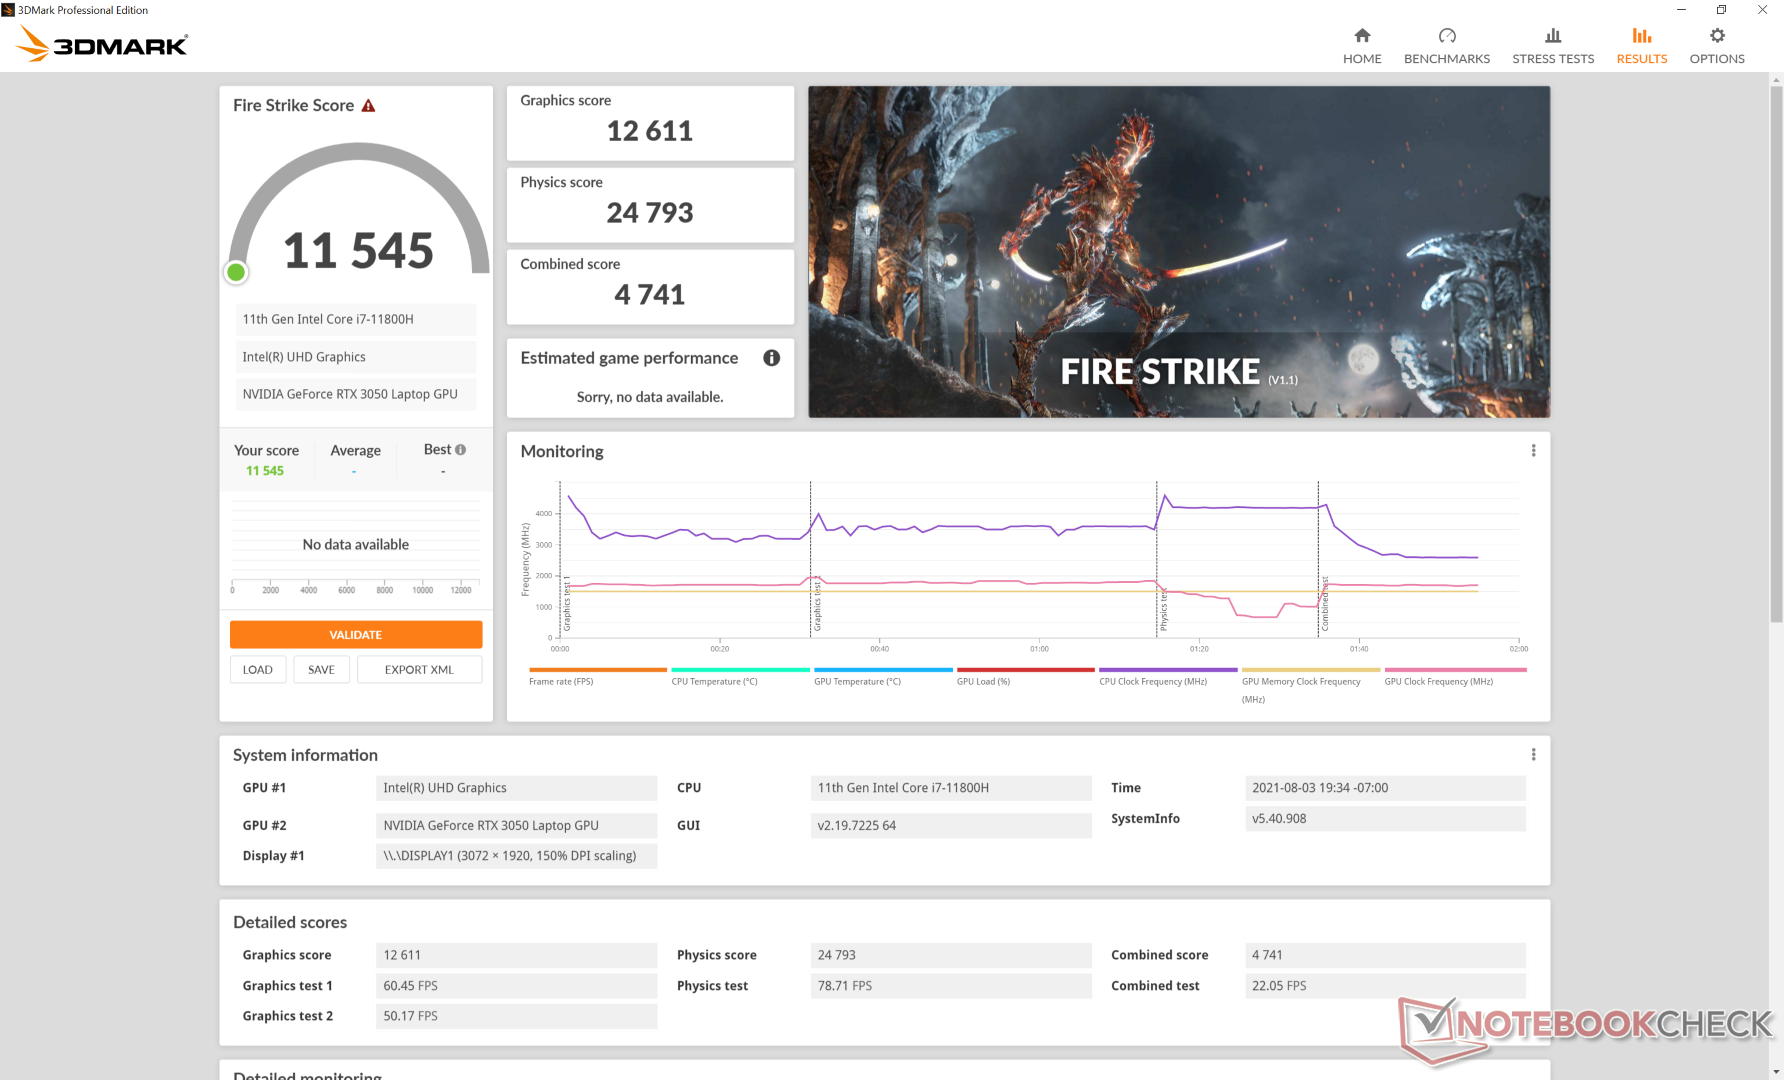
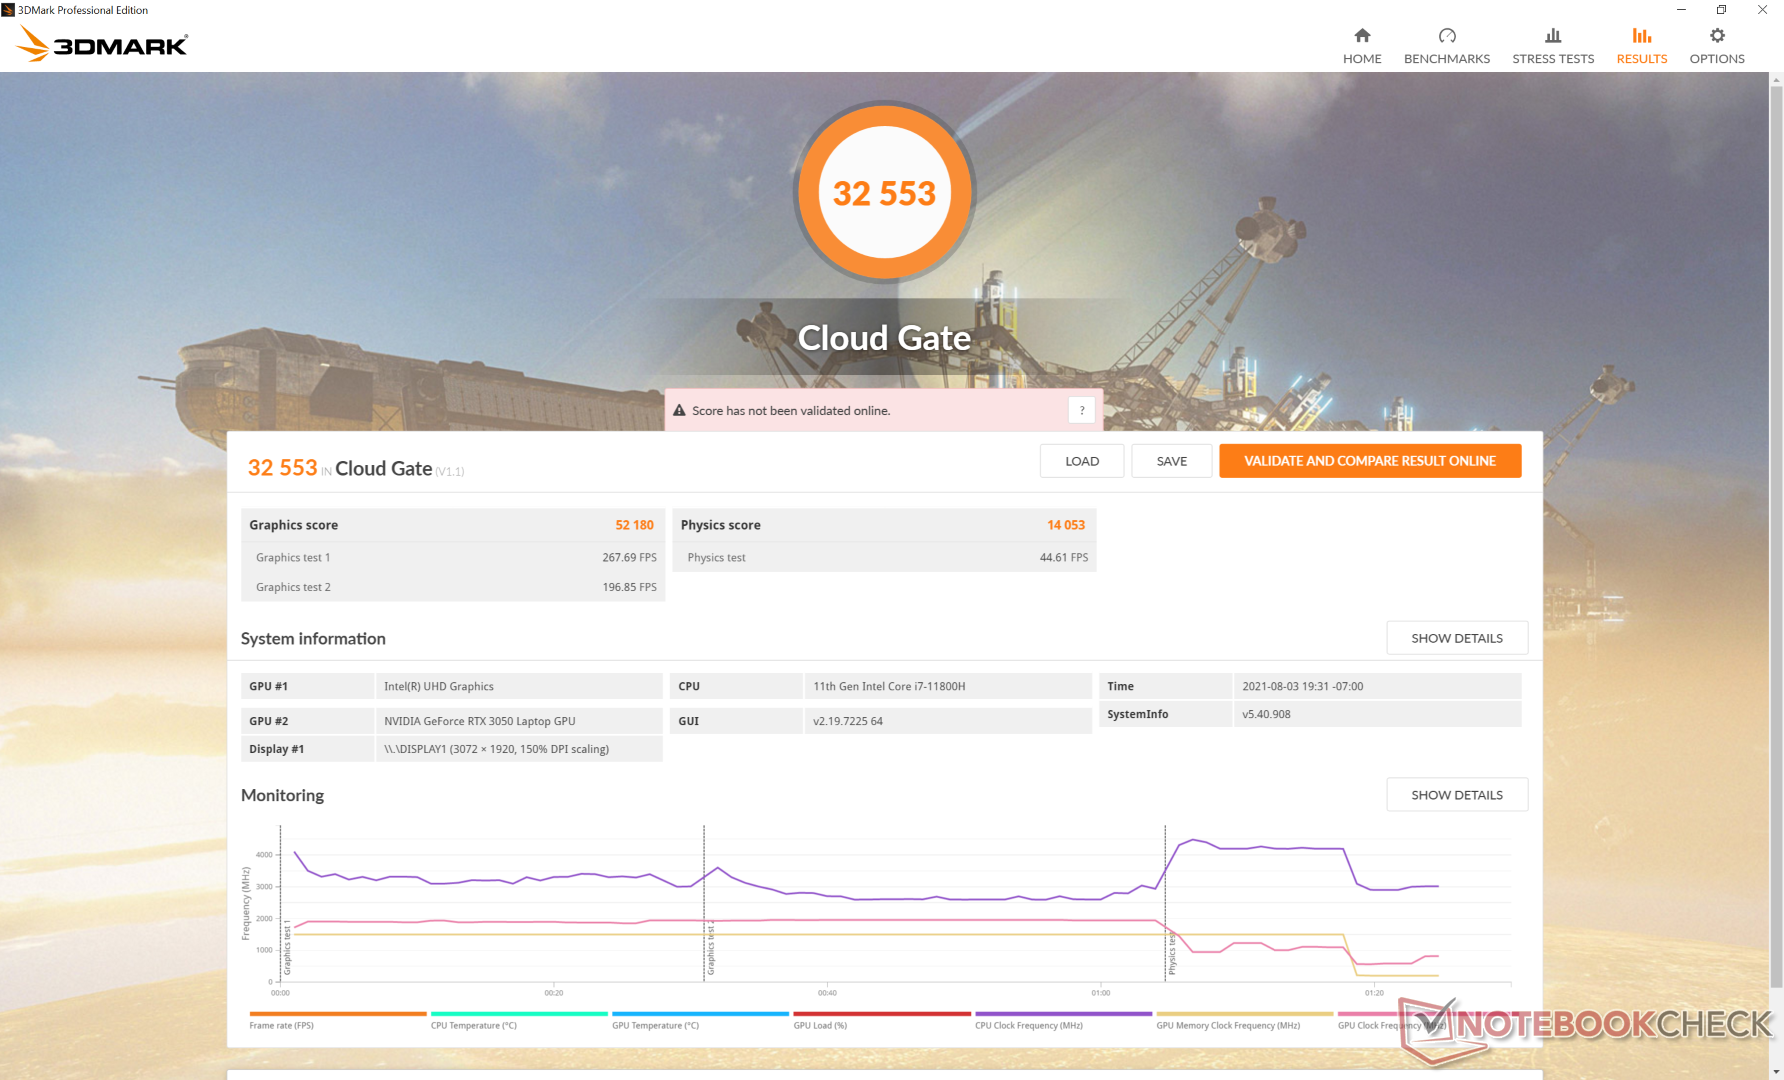
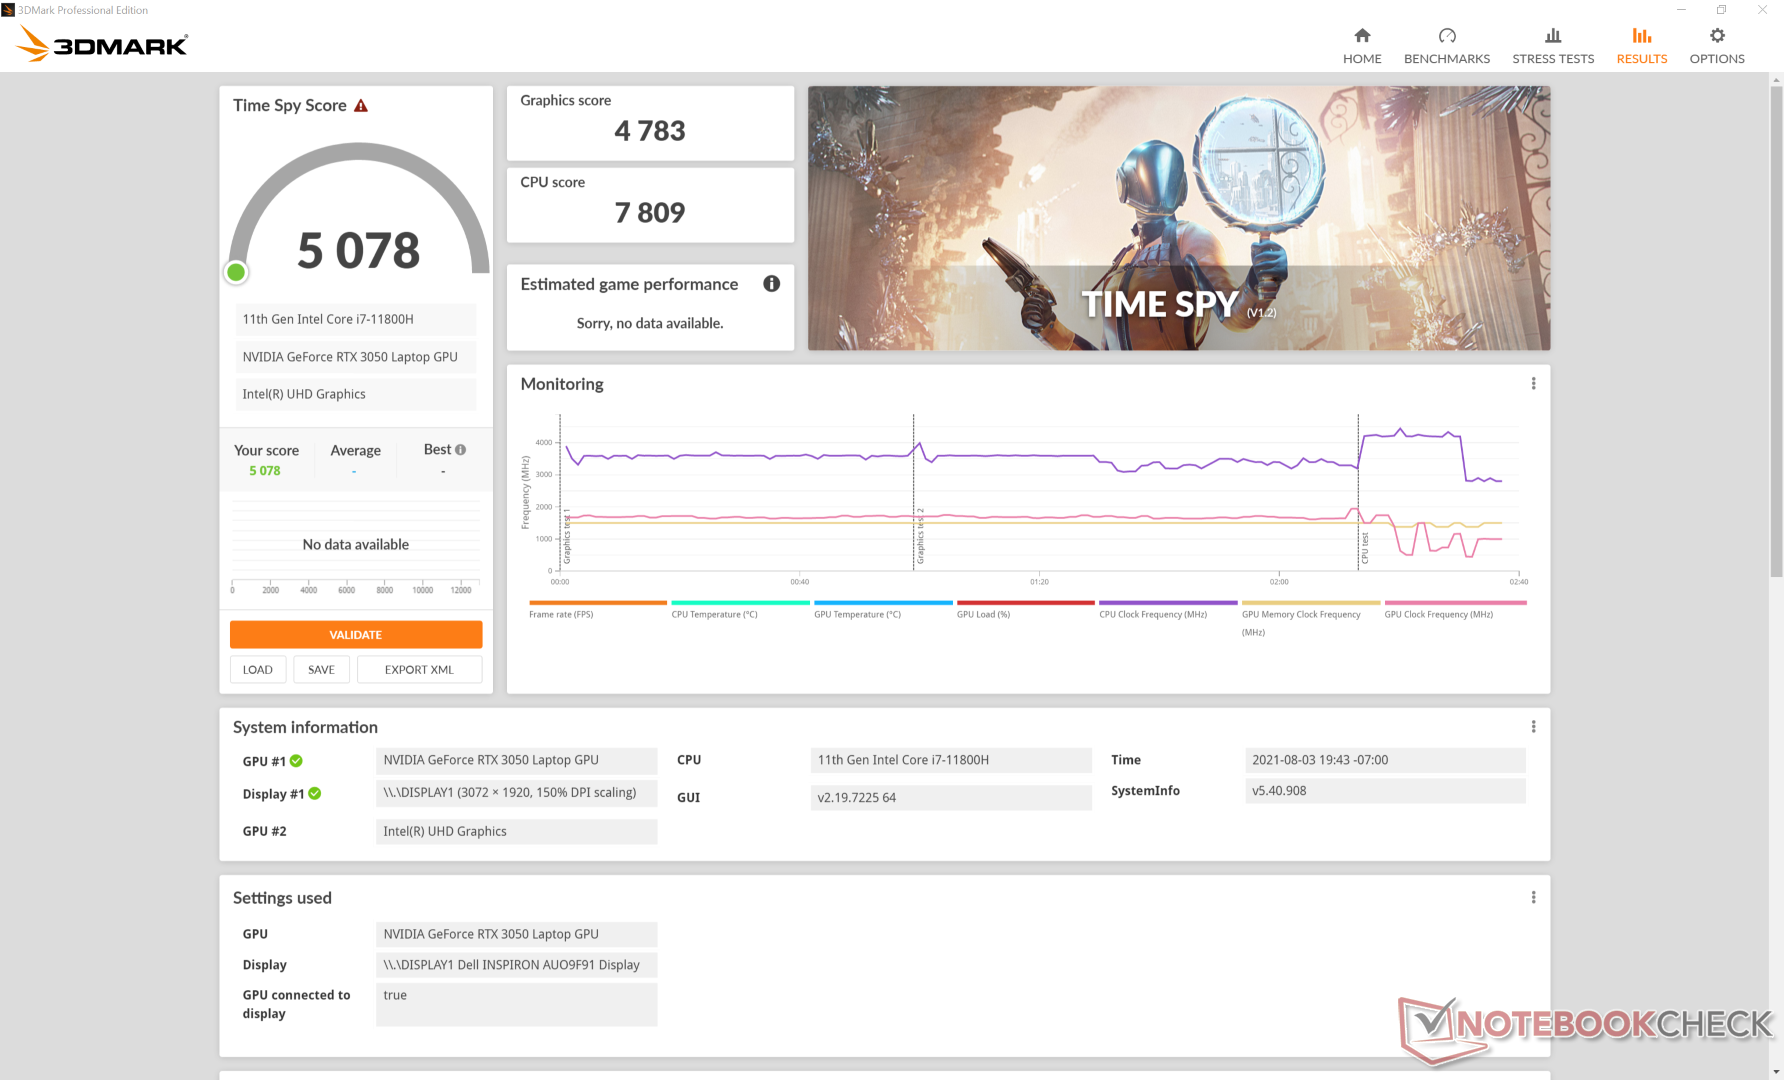
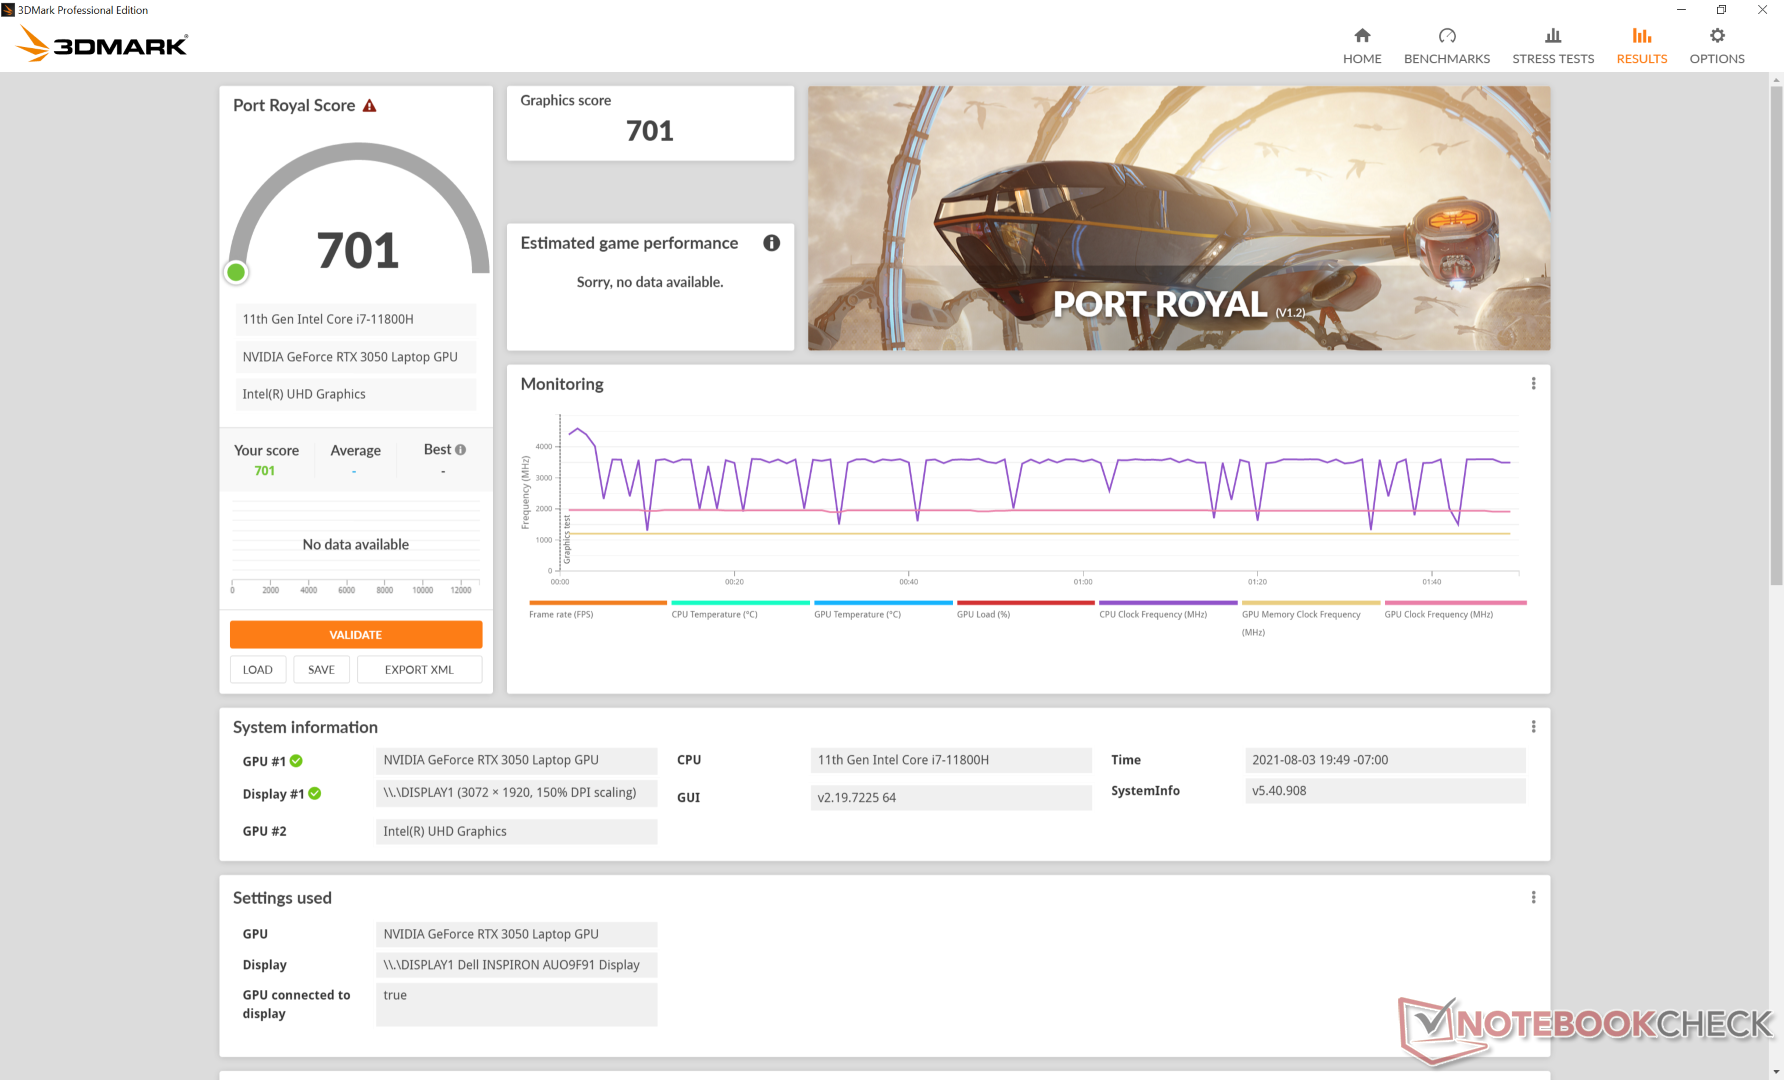
| 3DMark 11 Performance | 15605 pontos | |
| 3DMark Cloud Gate Standard Score | 32553 pontos | |
| 3DMark Fire Strike Score | 11545 pontos | |
| 3DMark Time Spy Score | 5078 pontos | |
Ajuda | ||
Desempenho nos jogos
O Inspiron 16 Plus não foi construído para jogos, mas ainda assim é uma máquina com capacidade para jogos em configurações de 1080p. Você vai querer conectar um monitor externo para evitar os tempos de resposta lentos e o fantasma perceptível da tela interna.
Witcher 3 FPS Chart
| baixo | média | alto | ultra | QHD | |
|---|---|---|---|---|---|
| GTA V (2015) | 179 | 174 | 131 | 68.3 | 48.9 |
| The Witcher 3 (2015) | 248.5 | 153.9 | 92.1 | 51.6 | |
| Dota 2 Reborn (2015) | 162 | 142 | 135 | 125 | |
| Final Fantasy XV Benchmark (2018) | 117 | 69.6 | 50.1 | 36.5 | |
| X-Plane 11.11 (2018) | 119 | 101 | 76.2 | ||
| Far Cry 5 (2018) | 138 | 88 | 80 | 74 | 51 |
| Strange Brigade (2018) | 274 | 125 | 101 | 87 | 63.4 |
| Shadow of the Tomb Raider (2018) | 118 | 81 | 71 | 61 | 39 |
| Far Cry New Dawn (2019) | 118 | 83 | 77 | 66 | 52 |
| Metro Exodus (2019) | 123 | 62.2 | 45.8 | 36.5 | 28.6 |
| The Division 2 (2019) | 132 | 77 | 66 | 50 | 32 |
| Borderlands 3 (2019) | 111.7 | 69.2 | 49.4 | 34.9 | 22.5 |
| GRID 2019 (2019) | 181 | 108 | 104 | 43 | 27 |
| Gears Tactics (2020) | 253 | 122 | 81 | 58 | 38 |
| F1 2020 (2020) | 218 | 134 | 113 | 81 | 59 |
| Horizon Zero Dawn (2020) | 99 | 75 | 62 | 56 | 46 |
| Watch Dogs Legion (2020) | 80 | 71 | 60 | 26 | 19 |
| Dirt 5 (2020) | 141 | 66 | 51 | 40 | 34 |
| Assassin´s Creed Valhalla (2020) | 99 | 56 | 36 | 27 | 24 |
| Immortals Fenyx Rising (2020) | 106 | 71 | 57 | 53 | 39 |
| Hitman 3 (2021) | 159.4 | 100.7 | 86.9 | 79.9 | 49.1 |
| F1 2021 (2021) | 186 | 130 | 110 | 52 | 36 |
Emissions
Ruído do sistema
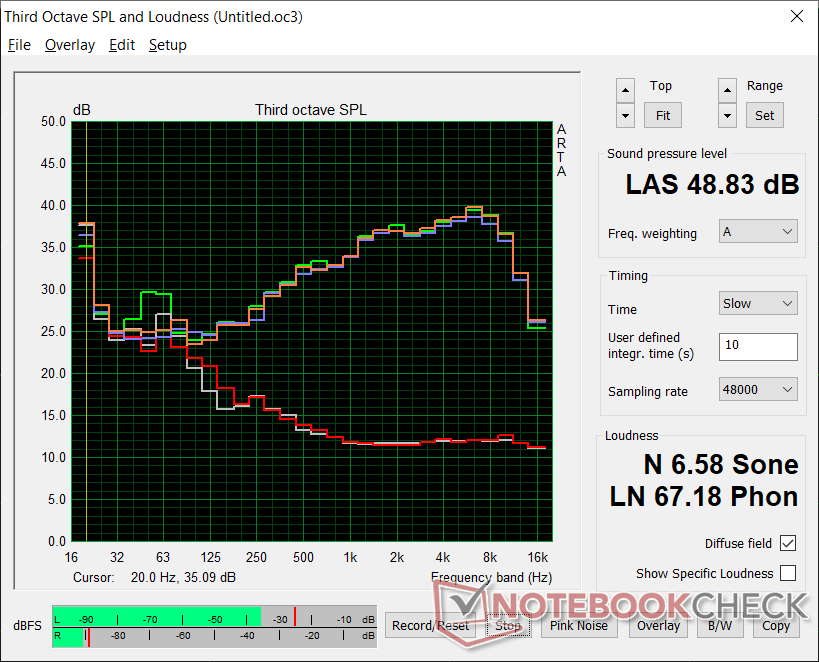
Os ventiladores do Inspiron 16 são bastante hábeis em permanecer em silêncio ou em silêncio por longos períodos. Por exemplo, o ruído dos ventiladores não se torna perceptível ao rodar o 3DMark 06 até depois de 40 segundos no padrão de referência. Uma vez que os ventiladores aumentam, no entanto, o sistema se tornará barulhento muito rapidamente a quase 50 dB(A) para ser semelhante a muitos laptops de jogos.
O ruído dos ventiladores normalmente atingirá apenas 33 dB(A) temporariamente durante atividades menos exigentes como navegação ou transmissão de vídeo. A pulsação ocorre, embora com pouca freqüência.
| Dell Inspiron 16 Plus 7610 GeForce RTX 3050 4GB Laptop GPU, i7-11800H, Kingston OM3PDP3512B | Asus ROG Zephyrus M16 GU603H GeForce RTX 3070 Laptop GPU, i9-11900H, Samsung PM9A1 MZVL22T0HBLB | LG Gram 16 (2021) Iris Xe G7 96EUs, i7-1165G7, SK Hynix PC601 1TB HFS001TD9TNG | HP Pavilion Gaming 16-a0242ng GeForce GTX 1650 Ti Mobile, i5-10300H, Intel SSD 660p SSDPEKNW512G8 | Dell Inspiron 15 7000 7506 2-in-1 Black Edition Xe MAX, i7-1165G7, Micron 2300 1TB MTFDHBA1T0TDV | |
|---|---|---|---|---|---|
| Noise | -18% | 7% | -16% | -6% | |
| desligado / ambiente * (dB) | 24.4 | 25 -2% | 26 -7% | 25 -2% | 27.3 -12% |
| Idle Minimum * (dB) | 24.4 | 25 -2% | 26 -7% | 25 -2% | 27.3 -12% |
| Idle Average * (dB) | 24.4 | 31 -27% | 26 -7% | 33 -35% | 27.3 -12% |
| Idle Maximum * (dB) | 24.4 | 42 -72% | 26 -7% | 42 -72% | 27.3 -12% |
| Load Average * (dB) | 48.3 | 48 1% | 30.8 36% | 48 1% | 47.4 2% |
| Witcher 3 ultra * (dB) | 48.9 | 52 -6% | 46 6% | 47.4 3% | |
| Load Maximum * (dB) | 48.9 | 56 -15% | 31.1 36% | 54 -10% | 47.5 3% |
* ... menor é melhor
Barulho
| Ocioso |
| 24.4 / 24.4 / 24.4 dB |
| Carga |
| 48.3 / 48.9 dB |
 | ||
30 dB silencioso 40 dB(A) audível 50 dB(A) ruidosamente alto |
||
min: | ||
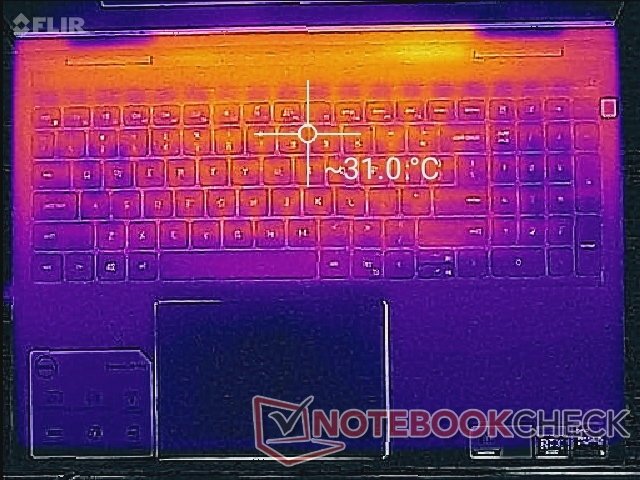
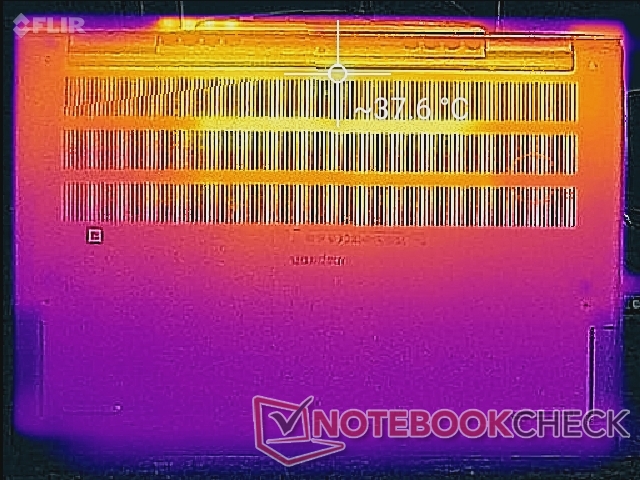
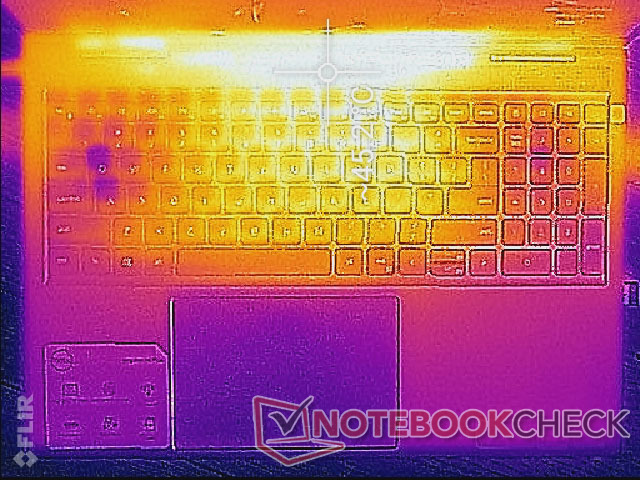
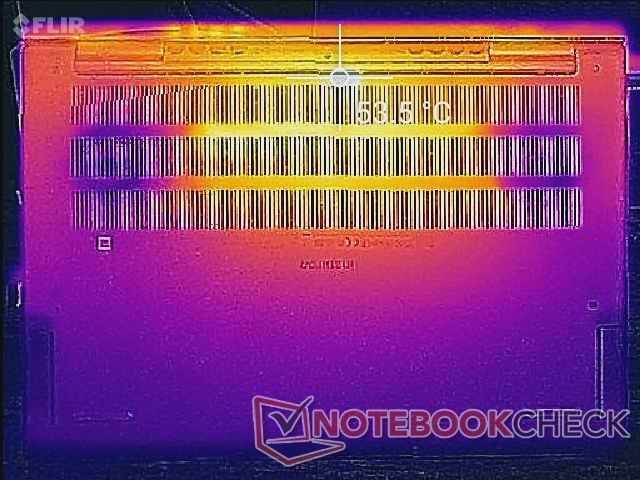
Temperatura - Quase sempre morno
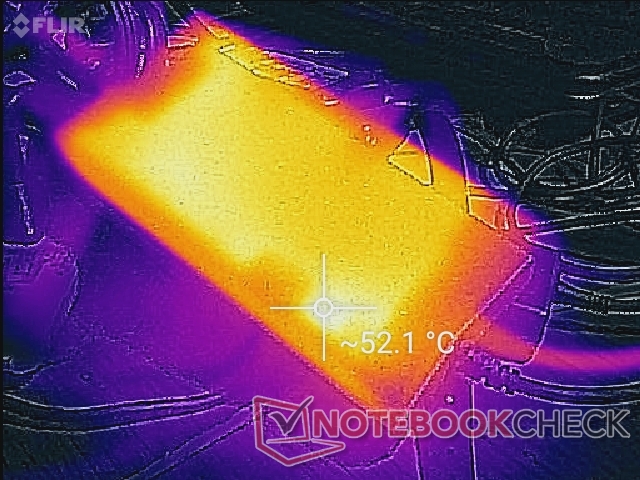
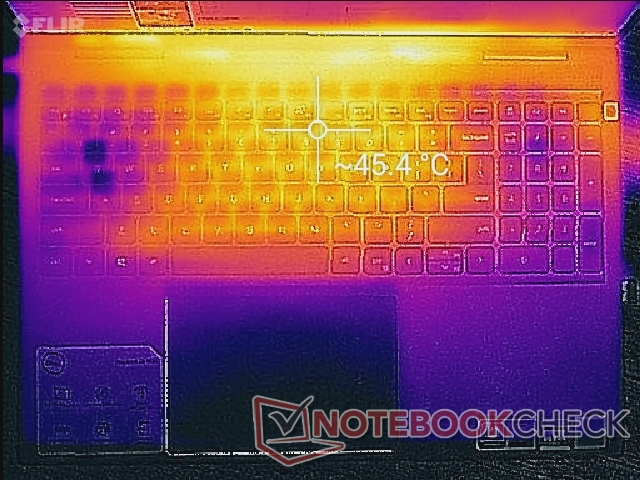
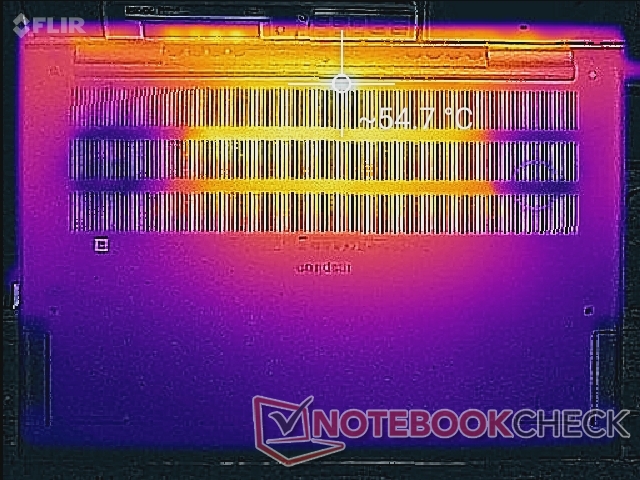
As temperaturas superficiais estão no lado quente provavelmente devido aos ventiladores letárgicos mencionados acima. Por exemplo, os pontos quentes na parte superior e inferior podem ser tão quentes quanto 31 C e 38 C, respectivamente, quando simplesmente ociosos na área de trabalho, sem aplicações em execução. Se jogar, o centro do teclado pode ser até 45 C, o que é semelhante ao que observamos no site Pavilion Gaming 16. As grelhas de ventilação no Inspiron 16 são maiores e mais numerosas quando comparadas com os laptops mais lentos com núcleo em U, como o LG Gram 16.
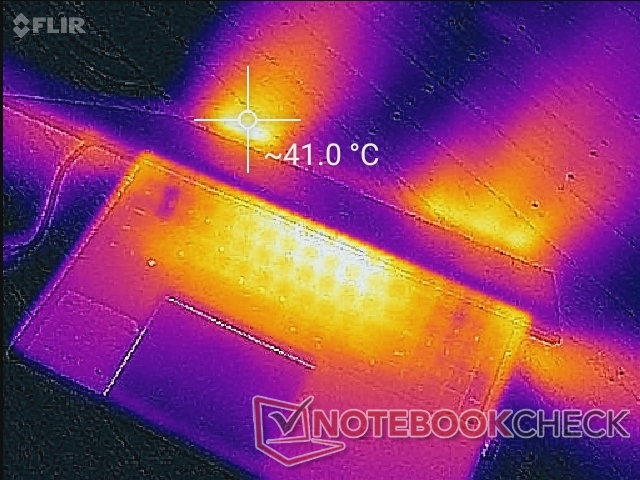
(-) A temperatura máxima no lado superior é 46.4 °C / 116 F, em comparação com a média de 36.8 °C / 98 F , variando de 21 a 71 °C para a classe Multimedia.
(-) A parte inferior aquece até um máximo de 54.8 °C / 131 F, em comparação com a média de 39.1 °C / 102 F
(+) Em uso inativo, a temperatura média para o lado superior é 28.3 °C / 83 F, em comparação com a média do dispositivo de 31.3 °C / ### class_avg_f### F.
(±) Jogando The Witcher 3, a temperatura média para o lado superior é 35.4 °C / 96 F, em comparação com a média do dispositivo de 31.3 °C / ## #class_avg_f### F.
(+) Os apoios para as mãos e o touchpad são mais frios que a temperatura da pele, com um máximo de 29 °C / 84.2 F e, portanto, são frios ao toque.
(±) A temperatura média da área do apoio para as mãos de dispositivos semelhantes foi 28.7 °C / 83.7 F (-0.3 °C / -0.5 F).
Teste de estresse
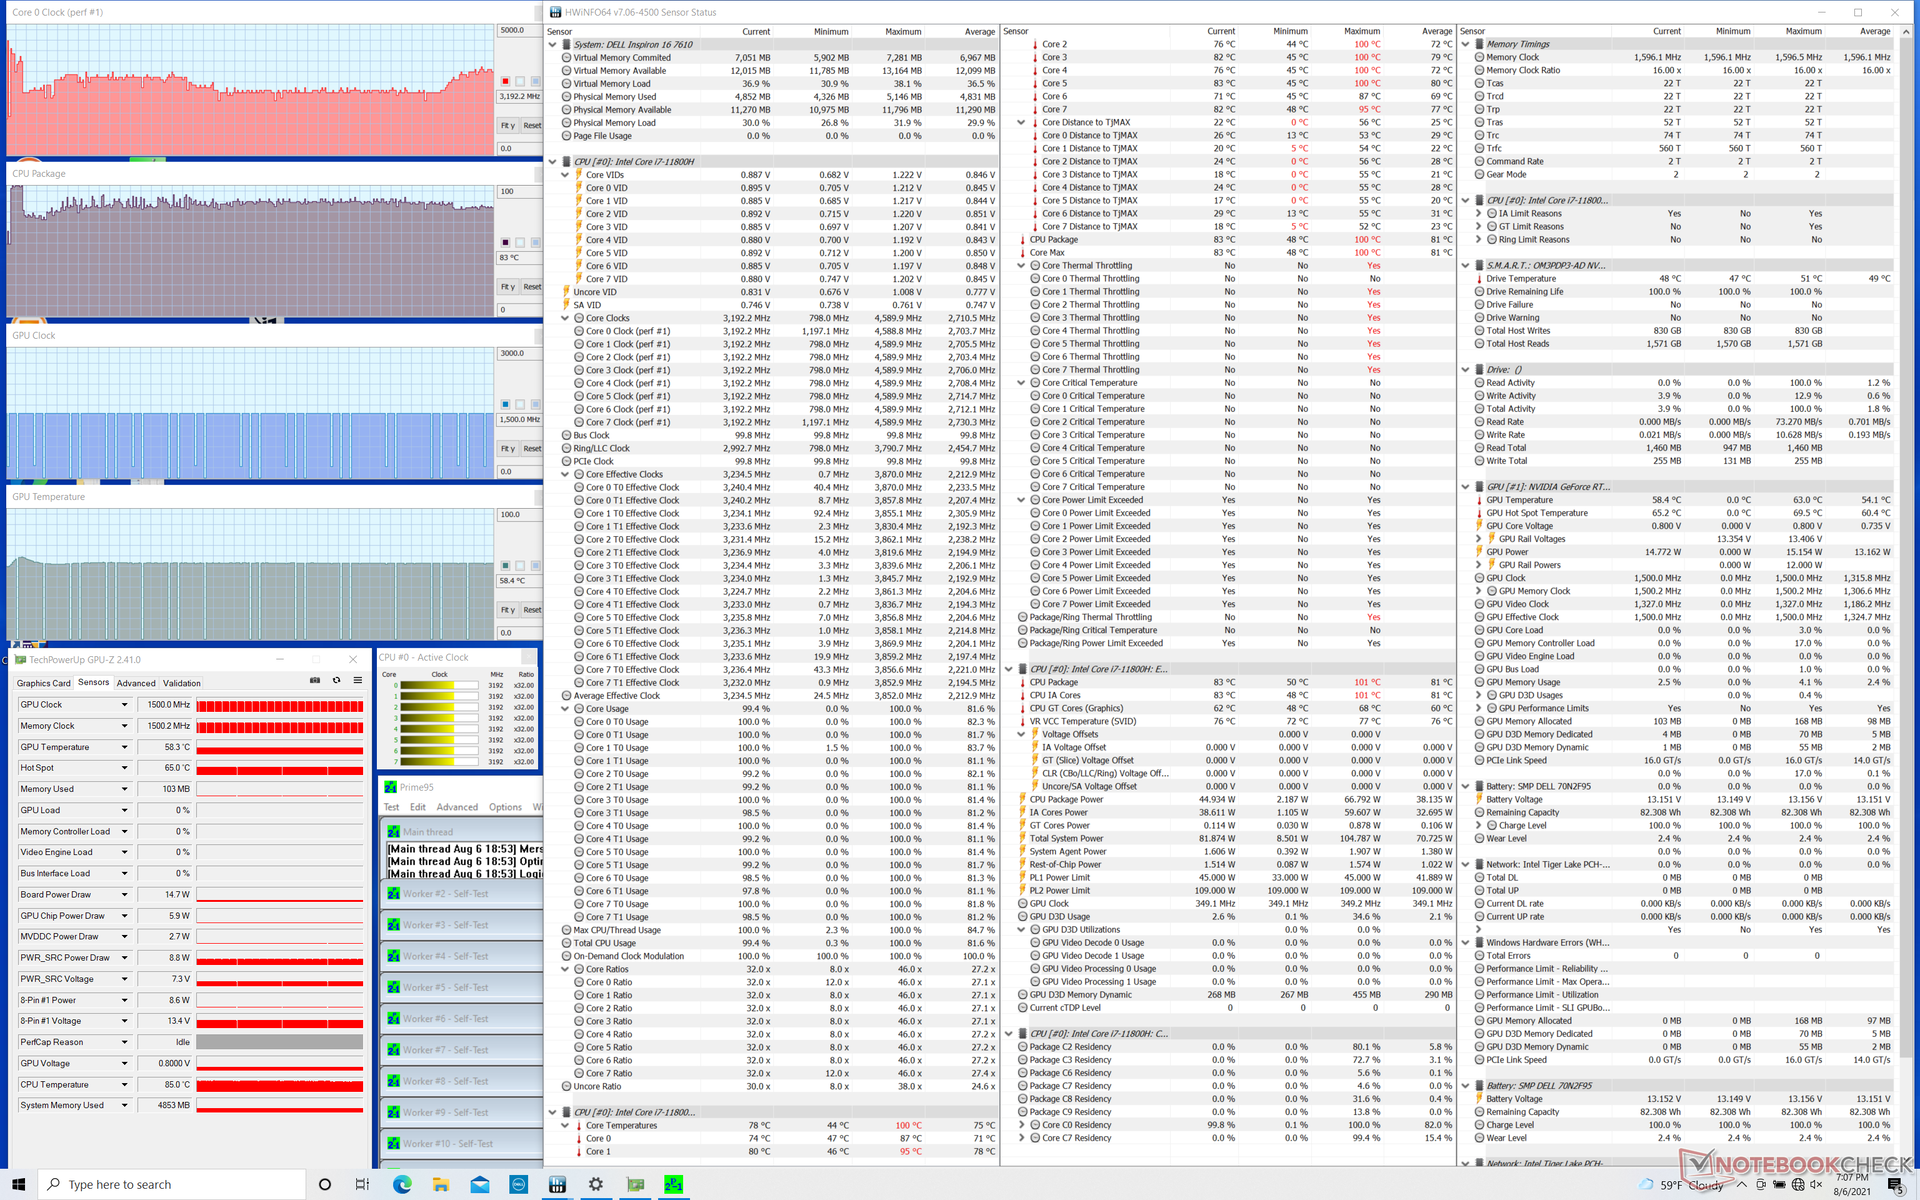
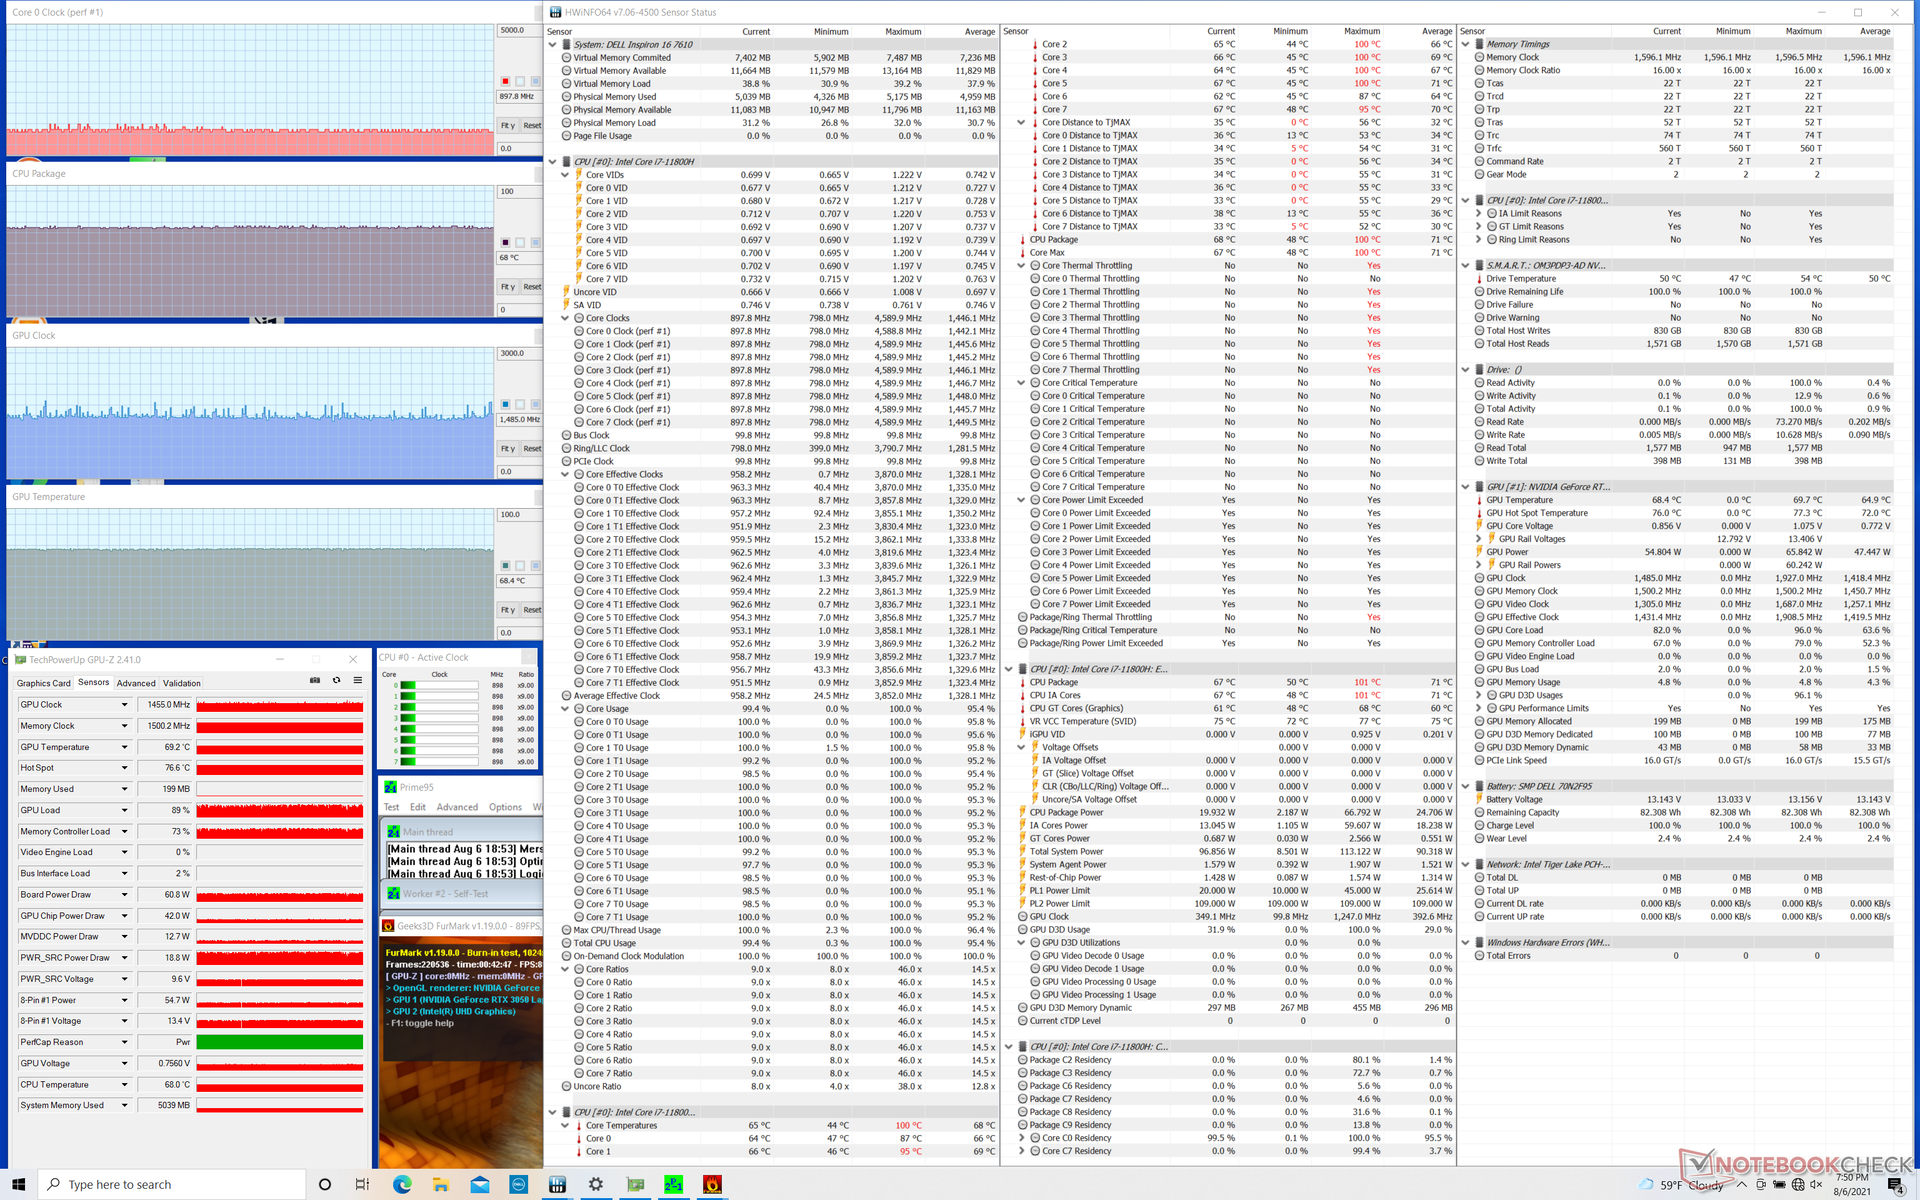
Quando estressadas sob Prime95, as taxas de relógio aumentariam para 4,1 GHz por apenas um segundo ou dois antes de atingir imediatamente uma temperatura central de 100 C. As taxas de relógio cairiam então para a faixa de 2,4 a 3,2 GHz a fim de manter uma temperatura mais razoável de 83 C
Ao rodar Witcher 3 para representar o estresse dos jogos no mundo real, a CPU e GPU se estabilizariam em 63 C e 69 C, respectivamente, em comparação com 61 C e 72 C na espessura e mais alto MSI GF65 com o mais antigo GTX 1660 Ti. A potência da placa GPU também se estabilizaria em 49 W em vez do máximo de 65 W TGP que a placa é capaz de fazer. Somente quando o FurMark em funcionamento é que a placa da GPU atingiria mais de 60 W.
O funcionamento com energia de bateria limitará a performance gráfica. Um teste 3DMark 11 com baterias retornaria pontuações de Física e Gráficos de 12832 e 10938 pontos, respectivamente, em comparação com 12304 e 16944 pontos quando em rede elétrica.
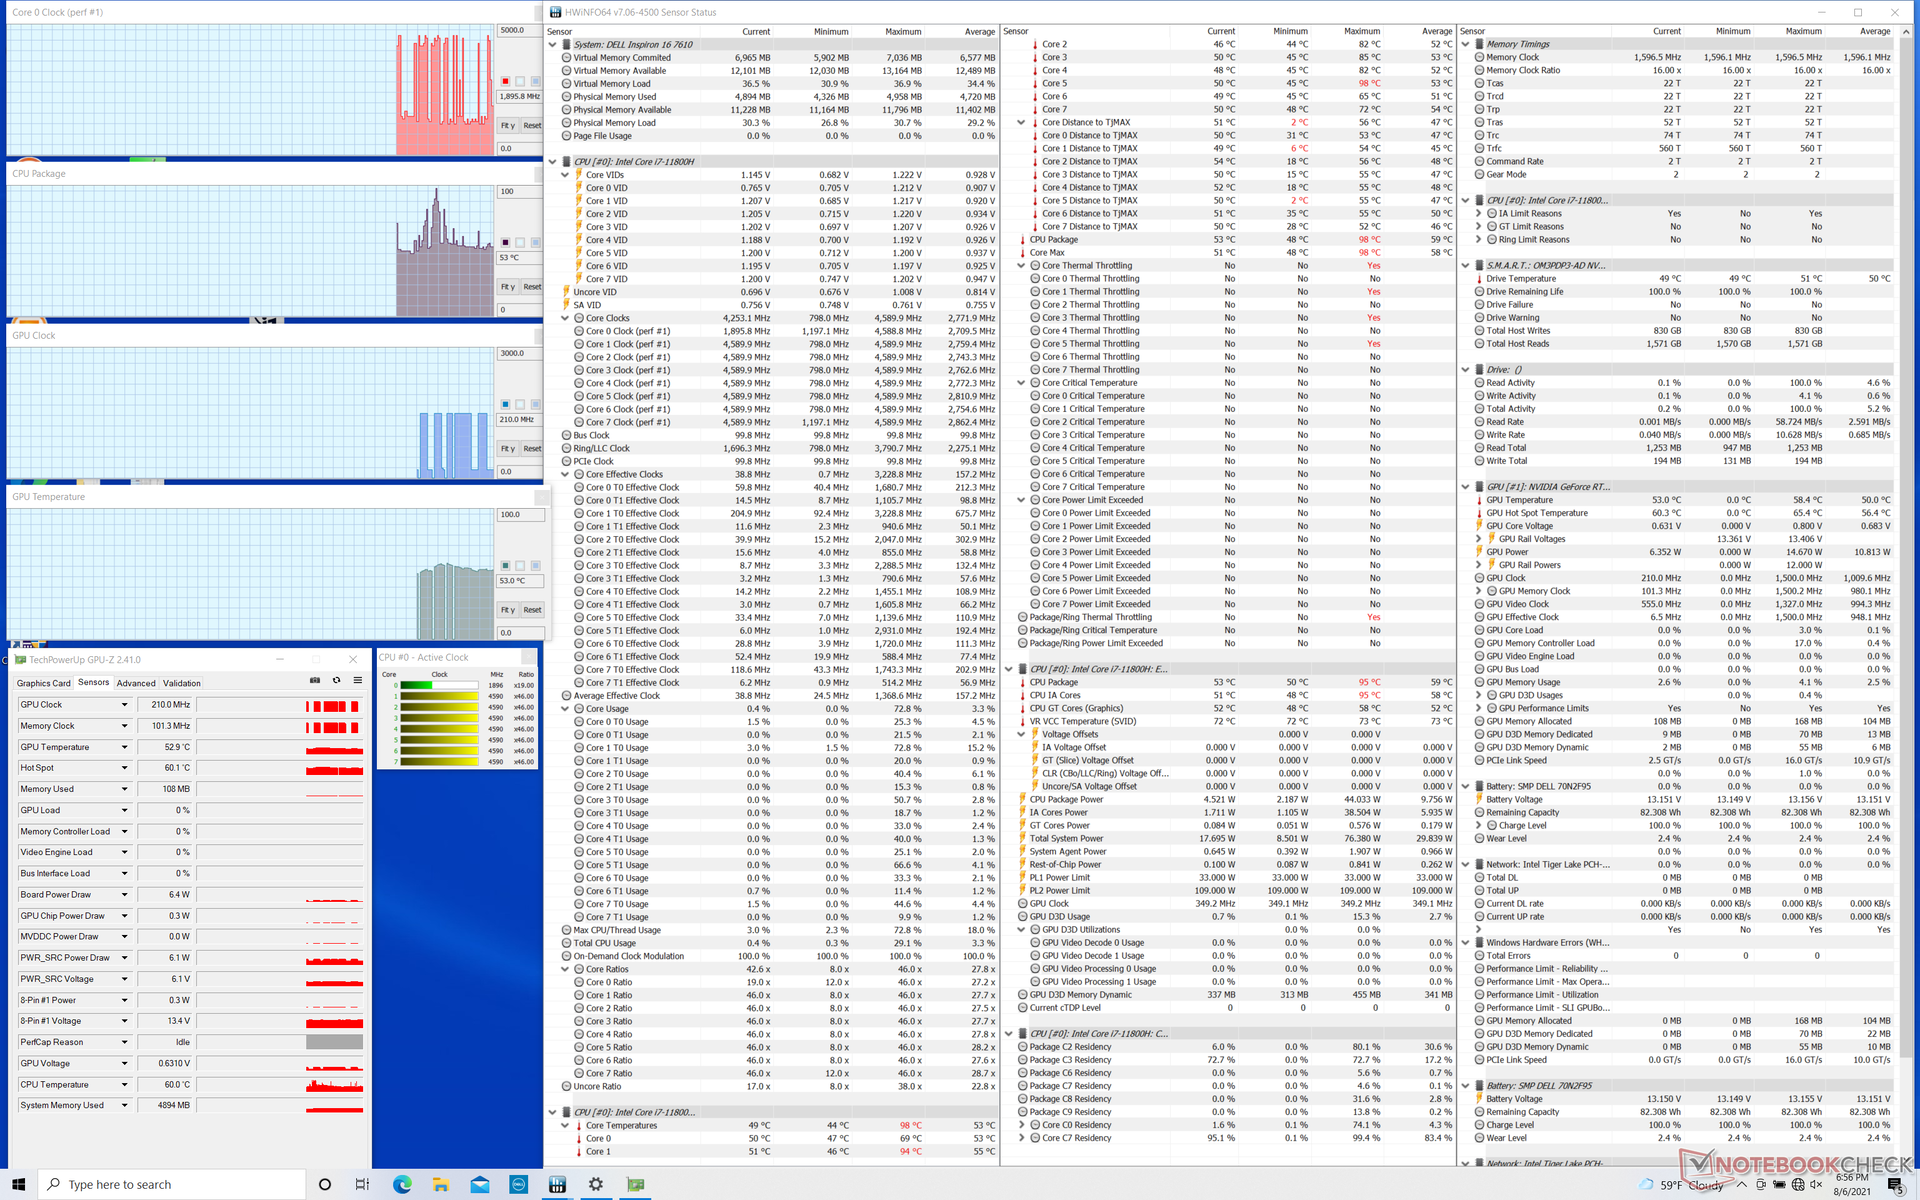
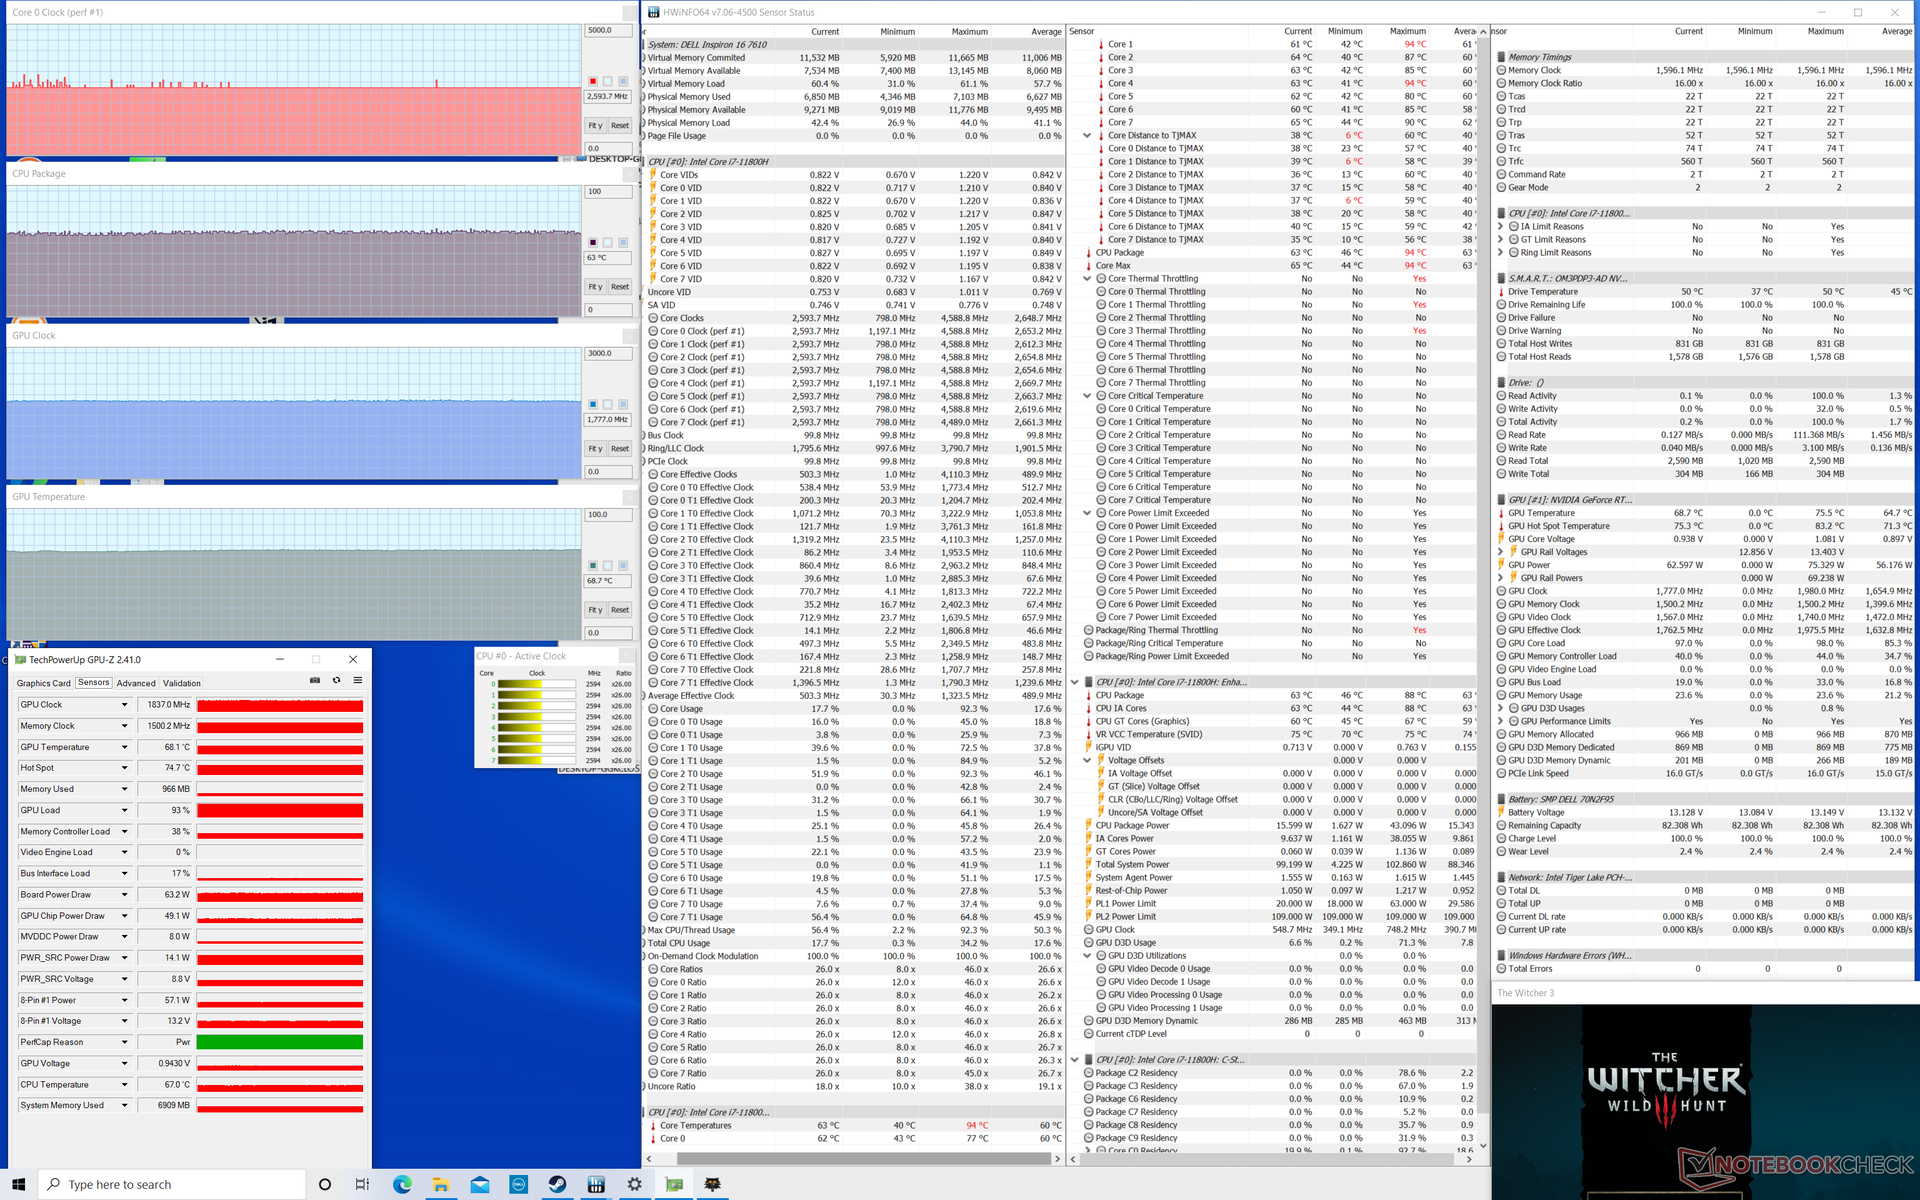
| RelógioCPU (GHz) | RelógioGPU (MHz) | Temperaturamédiada CPU (°C) | Temperaturamédiada GPU (°C) | |
| System Idle | -- | --- 53 | 53 | 53 |
| Prime95 Stress | 2.4 - 3.2 | --83 | 58 | |
| Prime95 + FurMark Stress | 0.9 - 1.0 | 1455 | 68 | 68 |
| Witcher 3 Stress | 2.6 | 1837 | 63 | 69 |
Palestrantes - No lado do Weaker
A qualidade de áudio dos alto-falantes integrados não é tão boa. O volume máximo é decente, mas os graves são pobres. Nosso gráfico de ruído rosa mostra o roll-off em torno de 500 Hz e um nível de pressão sonora de apenas 75 dB. Outros laptops tendem a ter alto-falantes mais altos ou melhor reprodução de graves, como o XPG Xenia Xe ou Inveja x360 15respectivamente.


Dell Inspiron 16 Plus 7610 análise de áudio
(±) | o volume do alto-falante é médio, mas bom (###valor### dB)
Graves 100 - 315Hz
(±) | graves reduzidos - em média 14.4% menor que a mediana
(±) | a linearidade dos graves é média (8.4% delta para a frequência anterior)
Médios 400 - 2.000 Hz
(±) | médios mais altos - em média 5.6% maior que a mediana
(±) | a linearidade dos médios é média (7.9% delta para frequência anterior)
Altos 2 - 16 kHz
(+) | agudos equilibrados - apenas 3.9% longe da mediana
(±) | a linearidade dos máximos é média (7.2% delta para frequência anterior)
Geral 100 - 16.000 Hz
(±) | a linearidade do som geral é média (19.3% diferença em relação à mediana)
Comparado com a mesma classe
» 62% de todos os dispositivos testados nesta classe foram melhores, 8% semelhantes, 30% piores
» O melhor teve um delta de 5%, a média foi 17%, o pior foi 45%
Comparado com todos os dispositivos testados
» 47% de todos os dispositivos testados foram melhores, 8% semelhantes, 46% piores
» O melhor teve um delta de 4%, a média foi 23%, o pior foi 134%
Apple MacBook 12 (Early 2016) 1.1 GHz análise de áudio
(+) | os alto-falantes podem tocar relativamente alto (###valor### dB)
Graves 100 - 315Hz
(±) | graves reduzidos - em média 11.3% menor que a mediana
(±) | a linearidade dos graves é média (14.2% delta para a frequência anterior)
Médios 400 - 2.000 Hz
(+) | médios equilibrados - apenas 2.4% longe da mediana
(+) | médios são lineares (5.5% delta para frequência anterior)
Altos 2 - 16 kHz
(+) | agudos equilibrados - apenas 2% longe da mediana
(+) | os máximos são lineares (4.5% delta da frequência anterior)
Geral 100 - 16.000 Hz
(+) | o som geral é linear (10.2% diferença em relação à mediana)
Comparado com a mesma classe
» 7% de todos os dispositivos testados nesta classe foram melhores, 2% semelhantes, 90% piores
» O melhor teve um delta de 5%, a média foi 18%, o pior foi 53%
Comparado com todos os dispositivos testados
» 5% de todos os dispositivos testados foram melhores, 1% semelhantes, 94% piores
» O melhor teve um delta de 4%, a média foi 23%, o pior foi 134%
Energy Management
Consumo de energia
A manipulação na área de trabalho com o menor brilho e perfil de potência consumiria pouco mais de 7 W para ser um pouco mais do que o esperado. O LG Gram 16 e Pavilion Gaming 16, por exemplo, seria tão baixo quanto 3 W a 4 W cada quando sob condições semelhantes.
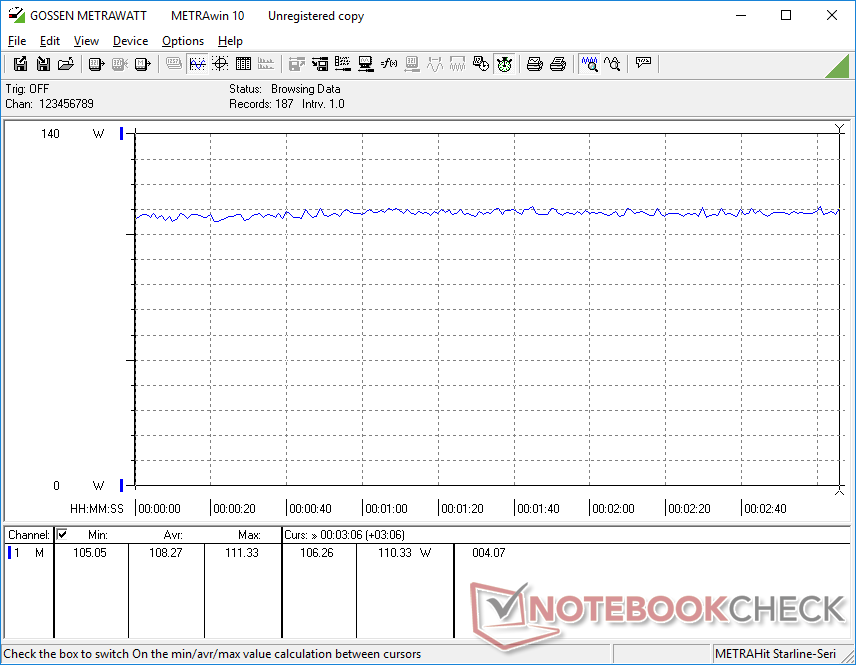
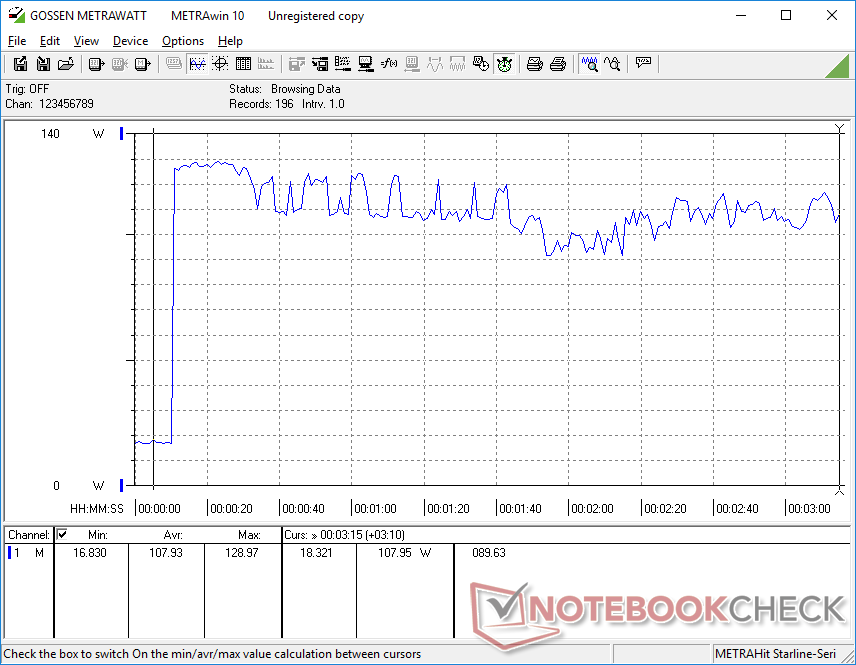
A eficiência do sistema começa a brilhar quando se corre cargas mais altas como jogos. Rodando Witcher 3Por exemplo, consumiria cerca de 108 W em comparação com 143 W no Asus ROG Zephyrus M15 equipado com a última geração de 12 nm GTX 1660 Ti. O desempenho por watt é um pouco maior em nossa Dell, apesar de ser consistentemente mais lento que a maioria dos computadores portáteis GTX 1660 Ti em termos de desempenho gráfico.
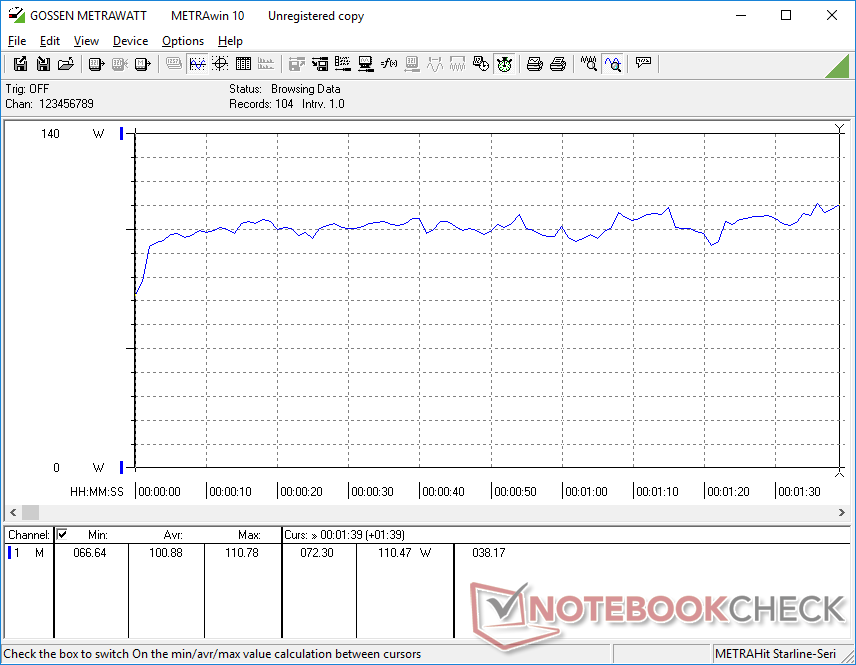
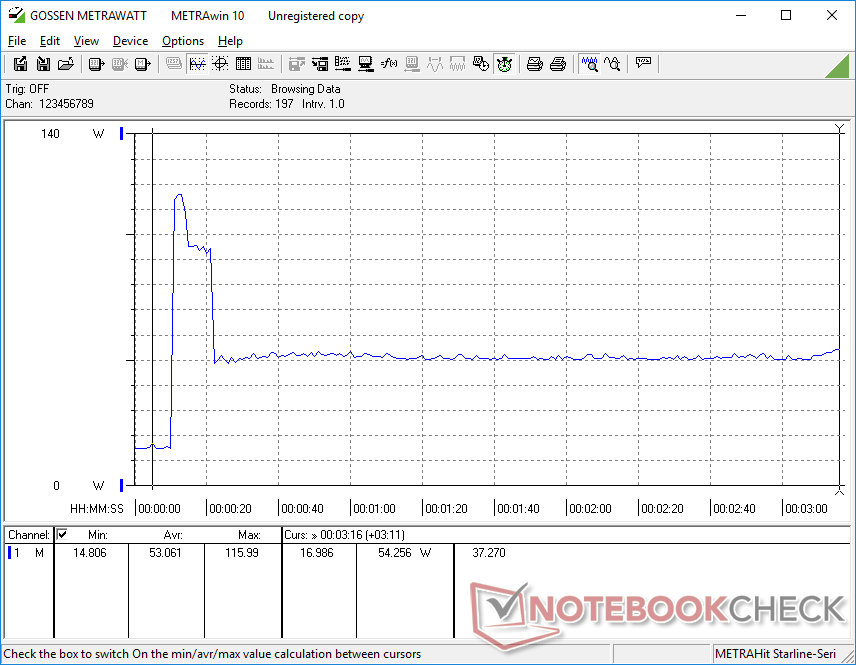
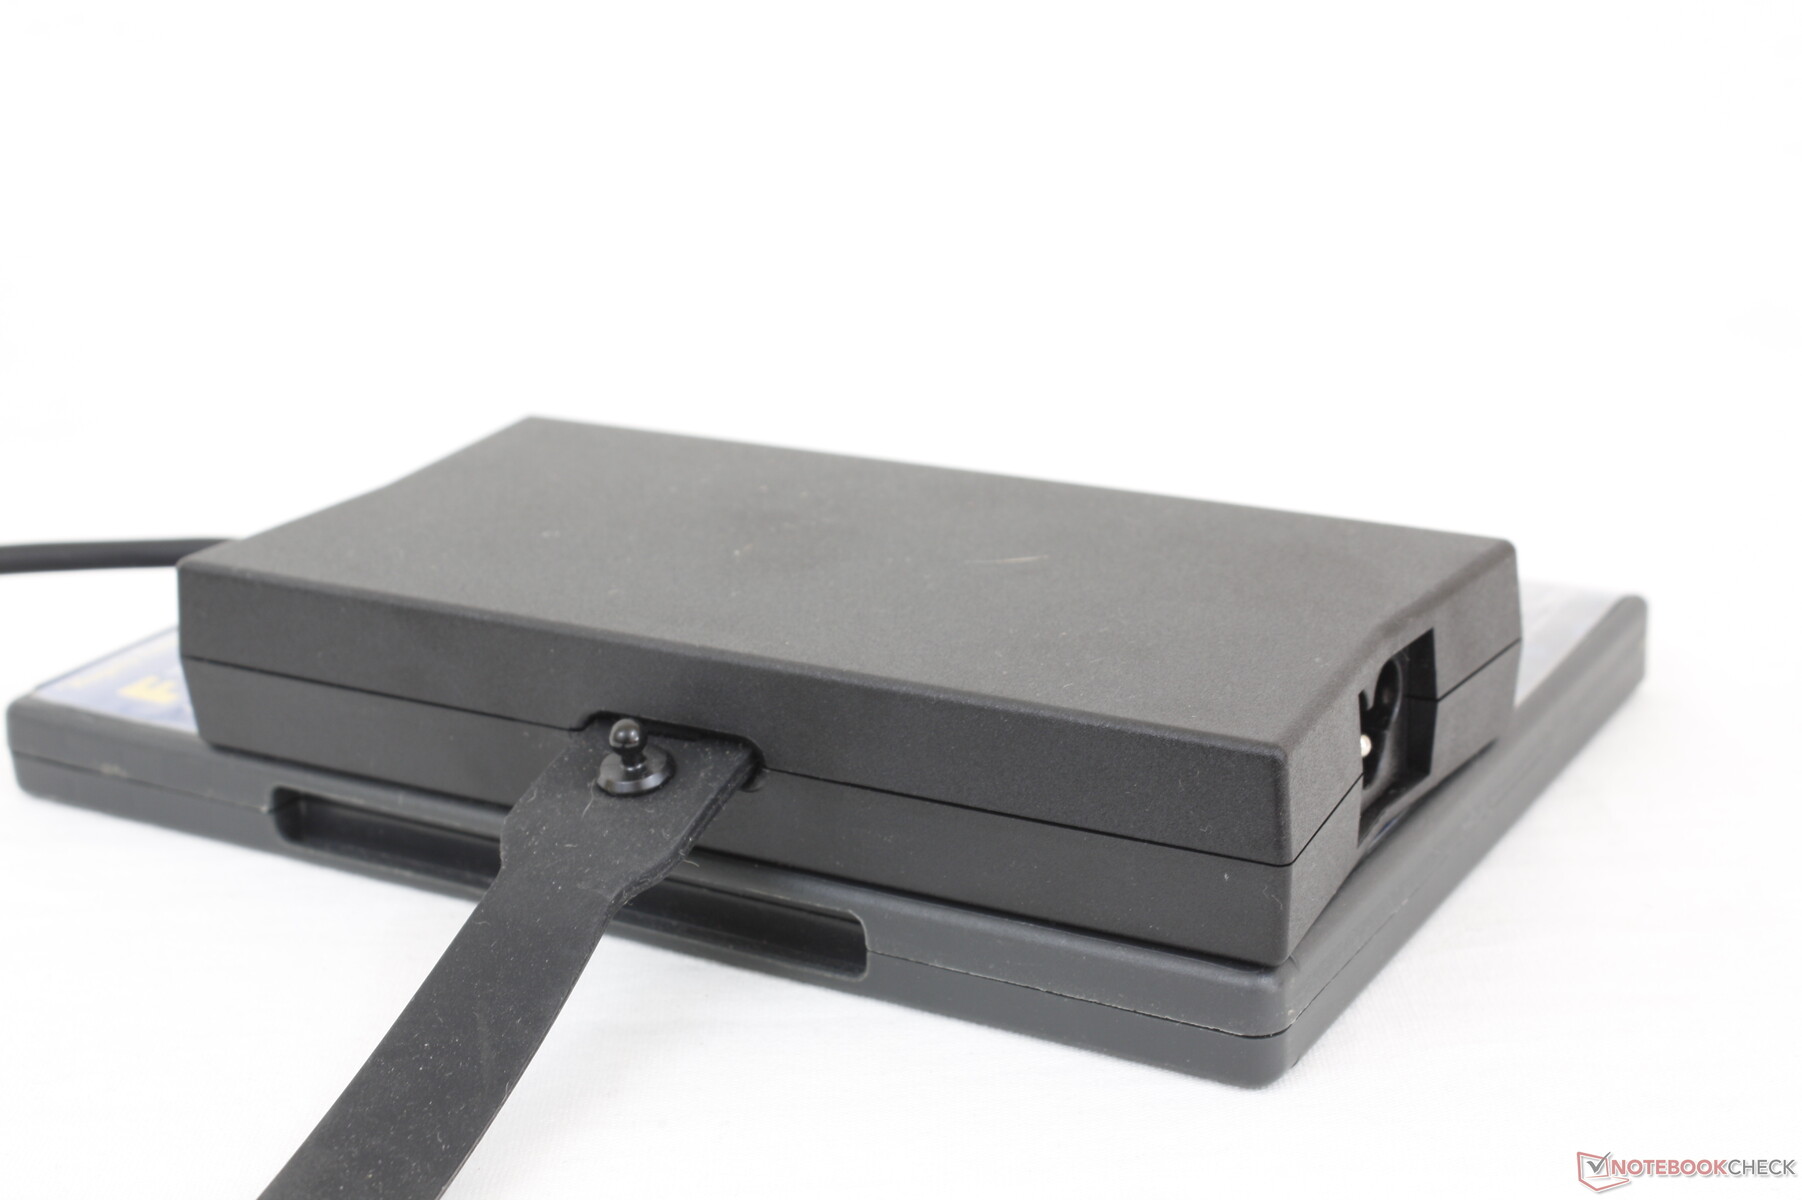
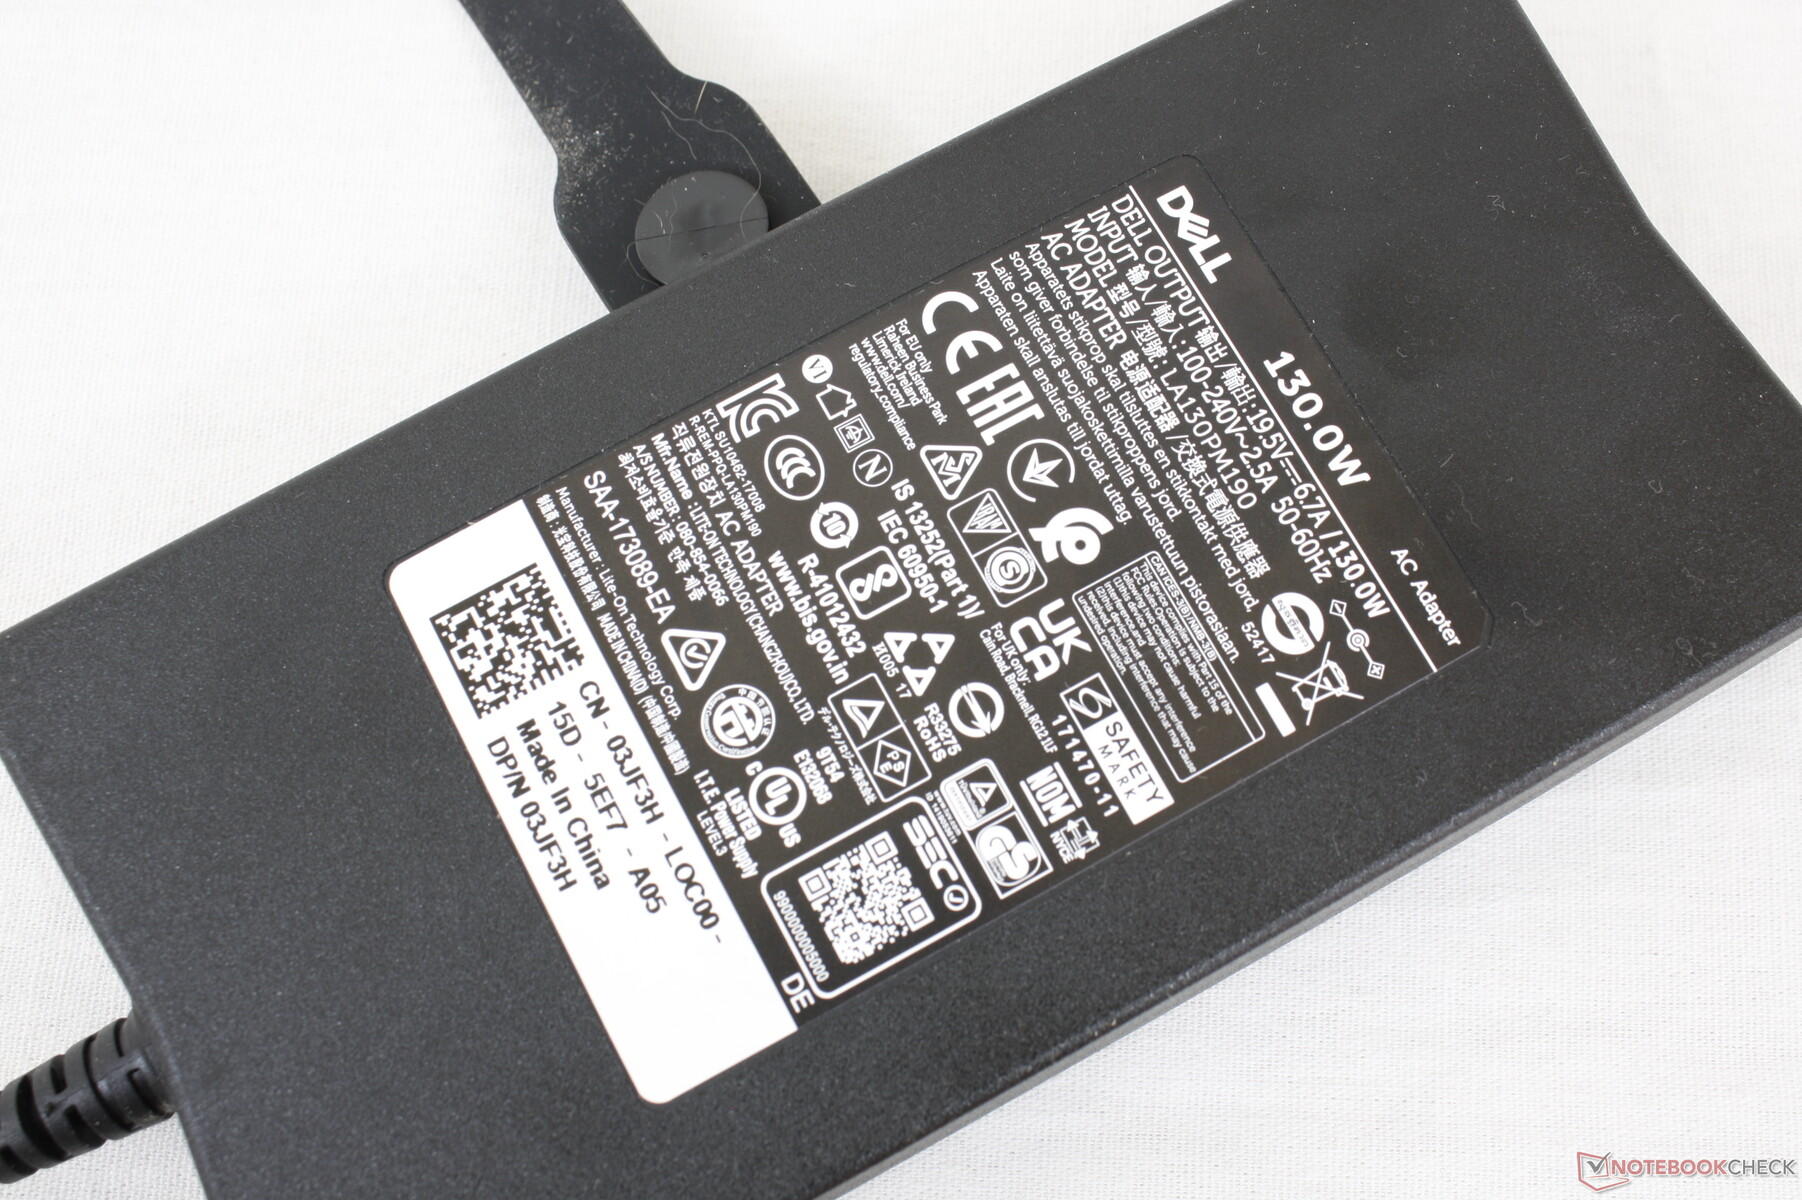
Somos capazes de registrar um consumo máximo de 129 W a partir do tamanho médio (~15,3 x 7,5 x 2,6 cm) adaptador AC de 130 W ao executar cargas extremas. A taxa é apenas temporária e duradoura por apenas alguns segundos, no máximo, como mostra o gráfico abaixo. Há espaço livre suficiente para carregar a bateria e operar com cargas exigentes simultaneamente.
| desligado | |
| Ocioso | |
| Carga |
|
Key:
min: | |
| Dell Inspiron 16 Plus 7610 i7-11800H, GeForce RTX 3050 4GB Laptop GPU, Kingston OM3PDP3512B, IPS, 3072x1920, 16" | Asus ROG Zephyrus M16 GU603H i9-11900H, GeForce RTX 3070 Laptop GPU, Samsung PM9A1 MZVL22T0HBLB, IPS, 2560x1600, 16" | LG Gram 16 (2021) i7-1165G7, Iris Xe G7 96EUs, SK Hynix PC601 1TB HFS001TD9TNG, IPS, 2560x1600, 16" | HP Pavilion Gaming 16-a0242ng i5-10300H, GeForce GTX 1650 Ti Mobile, Intel SSD 660p SSDPEKNW512G8, IPS, 1920x1080, 16.1" | Dell Inspiron 15 7000 7506 2-in-1 Black Edition i7-1165G7, Xe MAX, Micron 2300 1TB MTFDHBA1T0TDV, IPS, 3840x2160, 15.6" | |
|---|---|---|---|---|---|
| Power Consumption | -53% | 46% | 19% | 23% | |
| Idle Minimum * (Watt) | 7.7 | 11 -43% | 3.8 51% | 3 61% | 4 48% |
| Idle Average * (Watt) | 10.7 | 20 -87% | 9 16% | 7 35% | 15.5 -45% |
| Idle Maximum * (Watt) | 16.8 | 30 -79% | 11.3 33% | 18 -7% | 16.2 4% |
| Load Average * (Watt) | 100.39 | 111 -11% | 35.2 65% | 86 14% | 49.7 50% |
| Witcher 3 ultra * (Watt) | 108 | 156 -44% | 82 24% | 52.2 52% | |
| Load Maximum * (Watt) | 129 | 197 -53% | 43.5 66% | 144 -12% | 92.7 28% |
* ... menor é melhor
Power Consumption Witcher 3 / Stresstest
Vida útil da bateria - Grande capacidade 86 Wh
Os tempos de funcionamento são longos, com quase 10 horas de uso da WLAN no mundo real, para coincidir com a grande bateria 86 Wh. O LG Gram 16 pode durar várias horas mais, pois funciona com hardware mais lento e sem GPU Nvidia.
A carga de capacidade vazia a plena leva duas horas completas. Os usuários também podem carregar com adaptadores USB-C de terceiros, mas a taxa de carga irá diminuir significativamente quando comparada com o carregador de barril proprietário de 130 W que vem com o laptop
| Dell Inspiron 16 Plus 7610 i7-11800H, GeForce RTX 3050 4GB Laptop GPU, 86 Wh | Lenovo Legion 5 Pro 16ACH6H (82JQ001PGE) R7 5800H, GeForce RTX 3070 Laptop GPU, 80 Wh | Asus ROG Zephyrus M16 GU603H i9-11900H, GeForce RTX 3070 Laptop GPU, 90 Wh | LG Gram 16 (2021) i7-1165G7, Iris Xe G7 96EUs, 80 Wh | HP Pavilion Gaming 16-a0242ng i5-10300H, GeForce GTX 1650 Ti Mobile, 52 Wh | Dell Inspiron 15 7000 7506 2-in-1 Black Edition i7-1165G7, Xe MAX, 68 Wh | |
|---|---|---|---|---|---|---|
| Duração da bateria | -55% | -36% | 43% | -25% | -11% | |
| Reader / Idle (h) | 20.5 | 9.1 -56% | 13.3 -35% | 28.6 40% | 16.5 -20% | 25 22% |
| WiFi v1.3 (h) | 9.9 | 7 -29% | 7.7 -22% | 15.7 59% | 8.3 -16% | 9.7 -2% |
| Load (h) | 3.3 | 0.7 -79% | 1.6 -52% | 4.3 30% | 2 -39% | 1.6 -52% |
Pro
Contra
Veredicto - Grande aparência, Meh Performance
Visualmente, o Inspiron 16 é o modelo mais bonito de sua família. As luneiras são mais estreitas do que o esperado, considerando os processadores ávidos de energia no interior, enquanto o chassis metálico pesado ajuda a dar uma sensação de qualidade táctil aproximando-se da do XPS 15, o mais caro. As opções de porta são generosas, a manutenção é relativamente fácil, e o display 3K fosco encabeça tudo isso para uma ótima primeira exibição.
O Inspiron 16 Plus 7610 é um sistema com ótima aparência, com muitas portas e opções de atualização, mas poderia usar alguns ajustes de desempenho para criadores de conteúdo e usuários de multimídia famintos por energia.
As coisas não parecem tão cor-de-rosa do ponto de vista do desempenho. Tanto o processador quanto a GPU não são tão rápidos quanto esperávamos quando comparados a outros modelos com as mesmas opções ou similares. OAsus TUF F15 com a mesma CPU Core i7-11800H funciona 25% mais rápido enquanto a MSI Stealth 15M com os mais velhos RTX 2060 os gráficos terão um desempenho melhor do que nosso RTX 3050 na maioria dos cenários. Mesmo os dois anos de idade Jogos HP Pavilion 15 com gráficos GTX 1660 Ti podem igualar ou superar nossa Dell em potência gráfica. Uma tela mais brilhante para combinar com o MacBook Pro 16 ou Legion 5 Pro também não faria mal aos usuários em movimento.
Preço e disponibilidade
A disponibilidade on-line é limitada no momento da redação. Amazon está atualmente oferecendo apenas uma SKU no momento por US$ 989. Os usuários podem comprar diretamente da Dell, em vez disso, para opções mais configuráveis.
Dell Inspiron 16 Plus 7610
- 08/11/2021 v7 (old)
Allen Ngo
Price comparison

