Benchmarking da Intel Celeron N5095 Jasper Lake: Revisão do mini PC Beelink U59

A Beelink disponibilizou recentemente seu U59 mini PC para suceder seu U55 de última geração. O sistema leva o novo Celeron N5095 quad-core da Intel para substituir o antigo Celeron N4500, J4125 ou N4120 comumente encontrado em outros mini PCs nesta mesma faixa de preço de US$ 300.
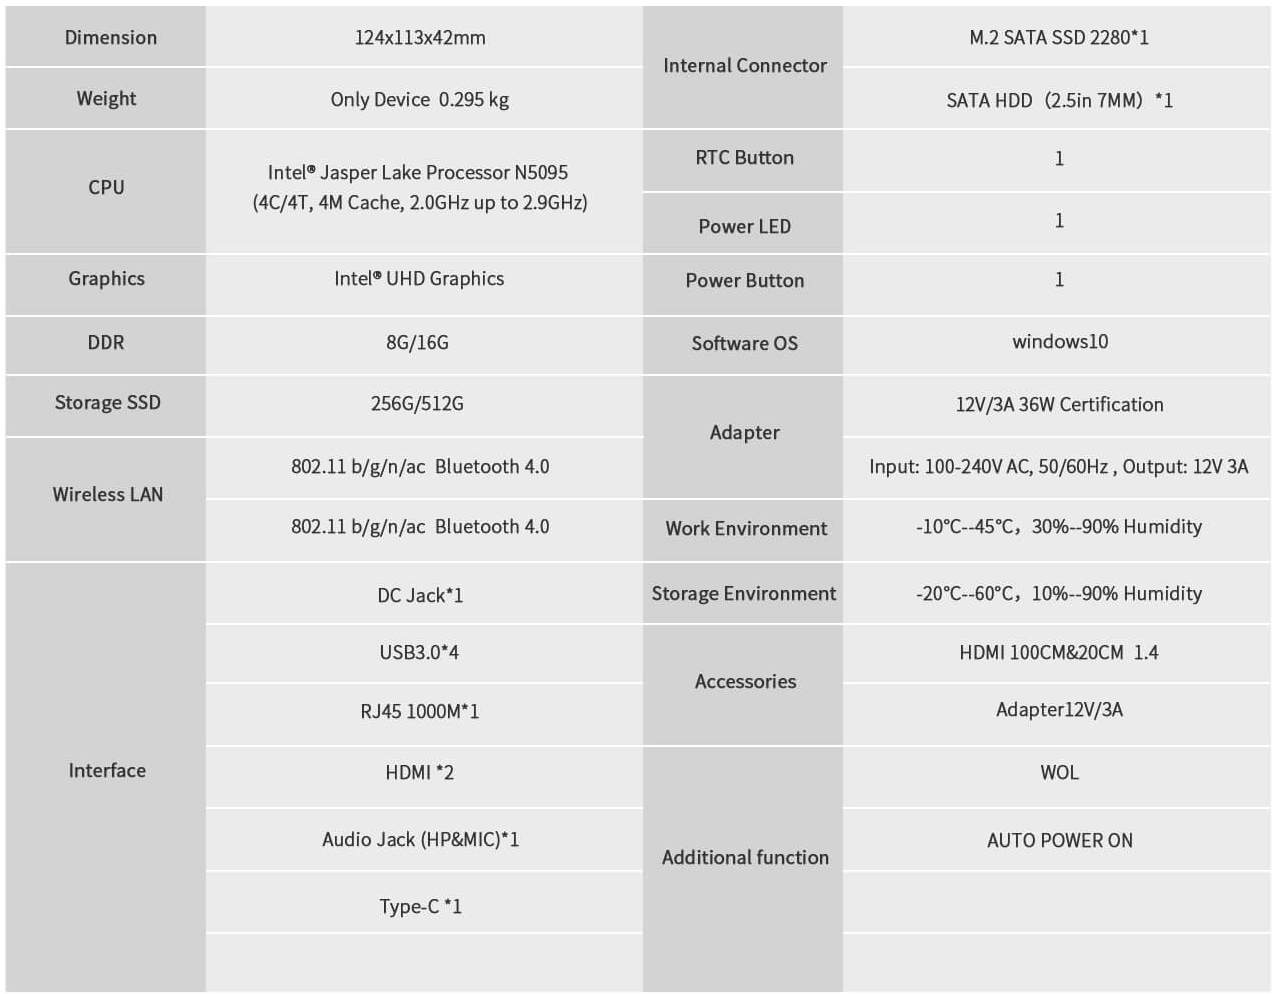
Nossa configuração de teste específica com 16 GB de RAM de canal duplo e 512 GB M.2 SSD pode ser encontrada on-line por $349 USD, enquanto uma configuração menor com metade da RAM e armazenamento pode ser encontrada por apenas $279 USD. Especificações adicionais sobre o U59 podem ser encontradas em sua página oficial de produtos aqui.
Mais revisões Beelink:
Potential Competitors in Comparison
Avaliação | Data | Modelo | Peso | Altura | Size | Resolução | Preço |
|---|---|---|---|---|---|---|---|
v (old) | 11/2021 | Beelink U59 Celeron N5095, UHD Graphics (Jasper Lake 16 EU) | 329 g | 42 mm | x | ||
v (old) | 04/2021 | Intel NUC11TNKi5 i5-1135G7, Iris Xe G7 80EUs | 504 g | 37 mm | x | ||
v (old) | 11/2018 | Intel NUC8i7BE i7-8559U, Iris Plus Graphics 655 | 683 g | 51 mm | x | ||
v (old) | Beelink SEi10 i3-1005G1, UHD Graphics G1 (Ice Lake 32 EU) | 350 g | 41 mm | x | |||
v (old) | Zotac ZBOX MI642 Nano i5-10210U, UHD Graphics 620 | 472 g | 51 mm | x | |||
v (old) | GMK NucBox K1 Celeron J4125, UHD Graphics 600 | 130 g | 42 mm | x |
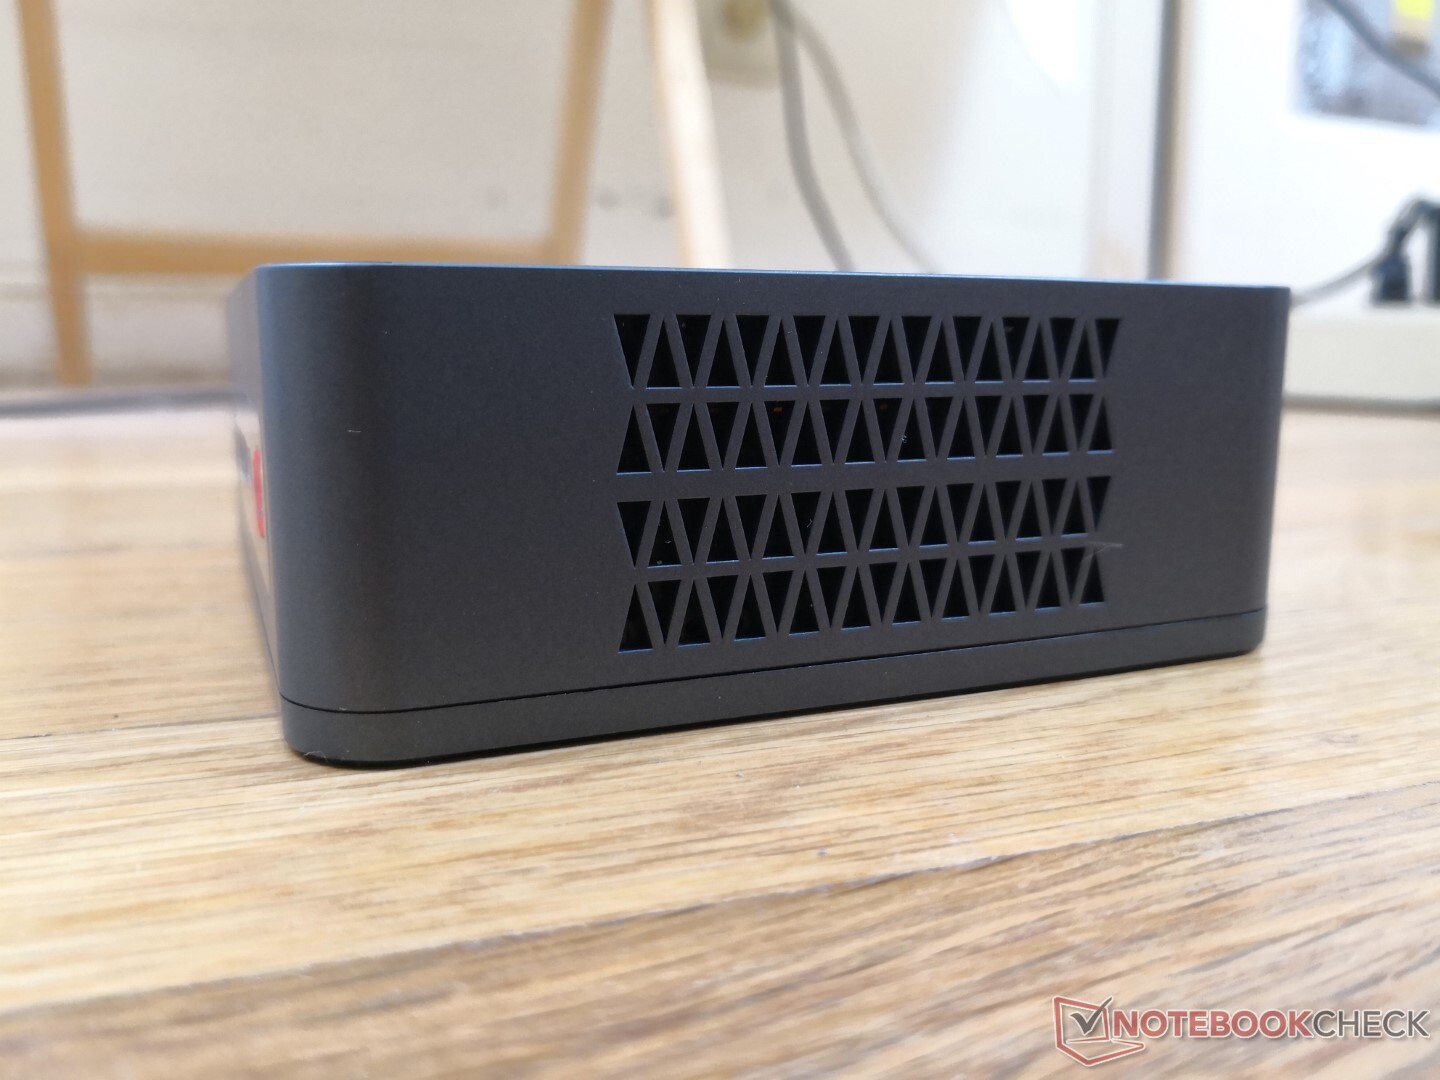
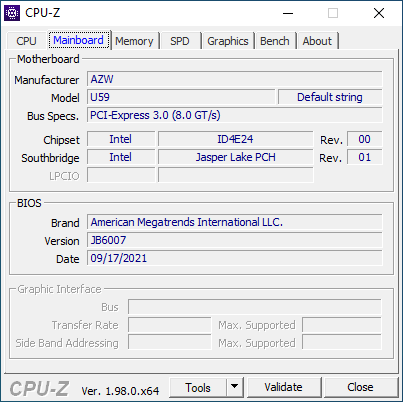
Caso
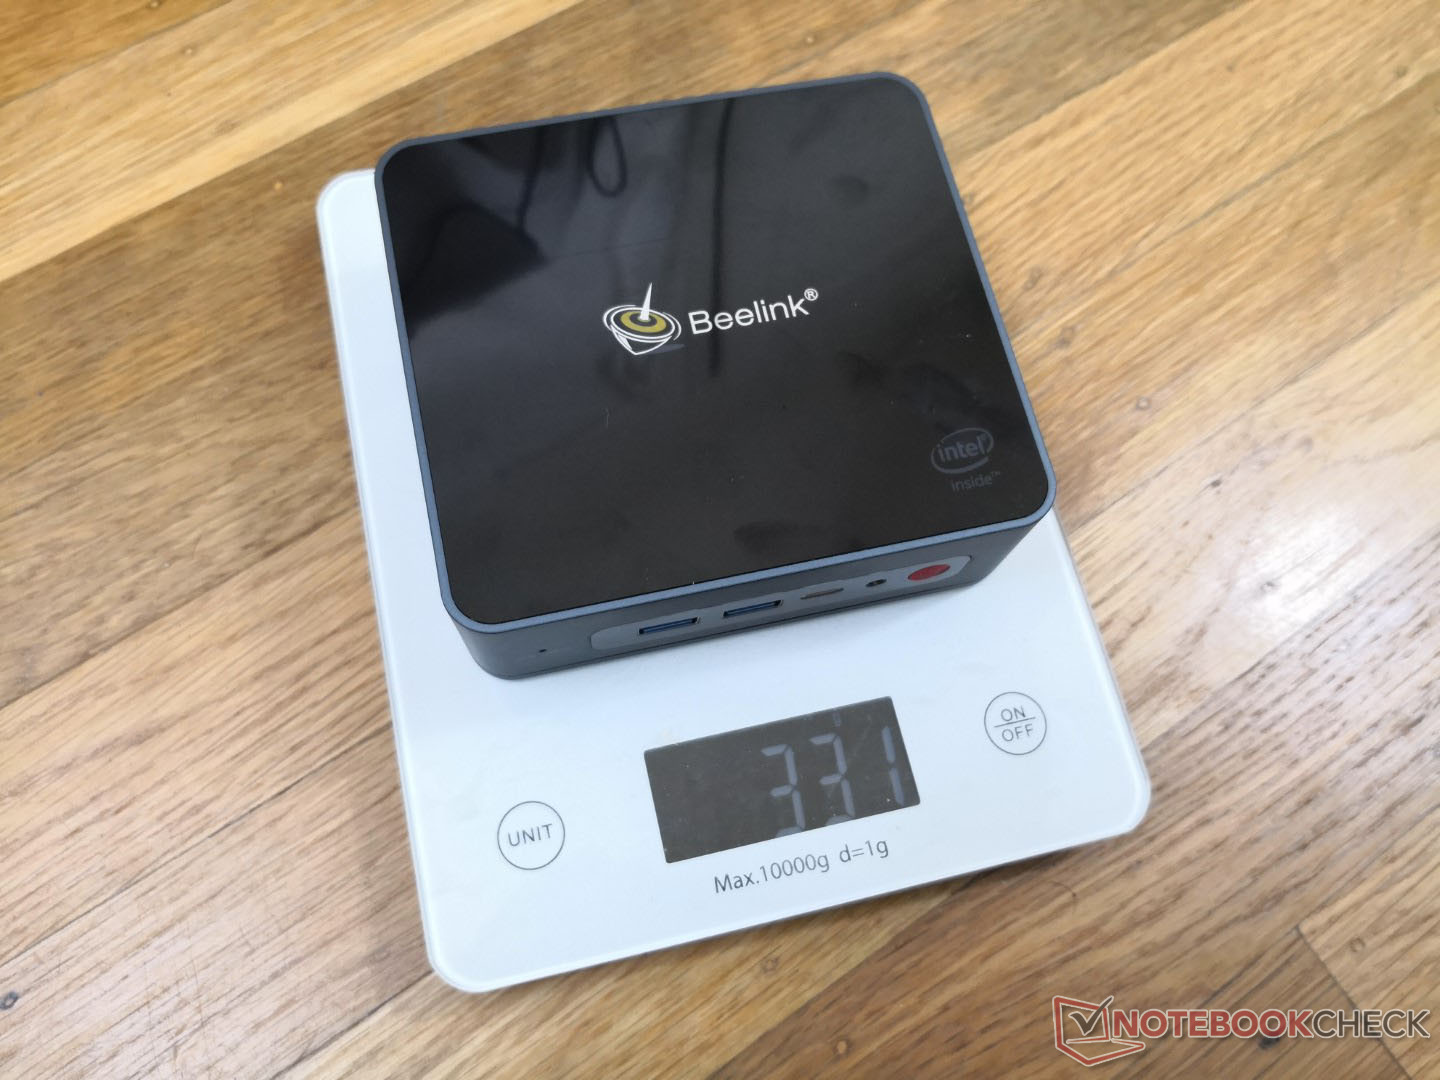
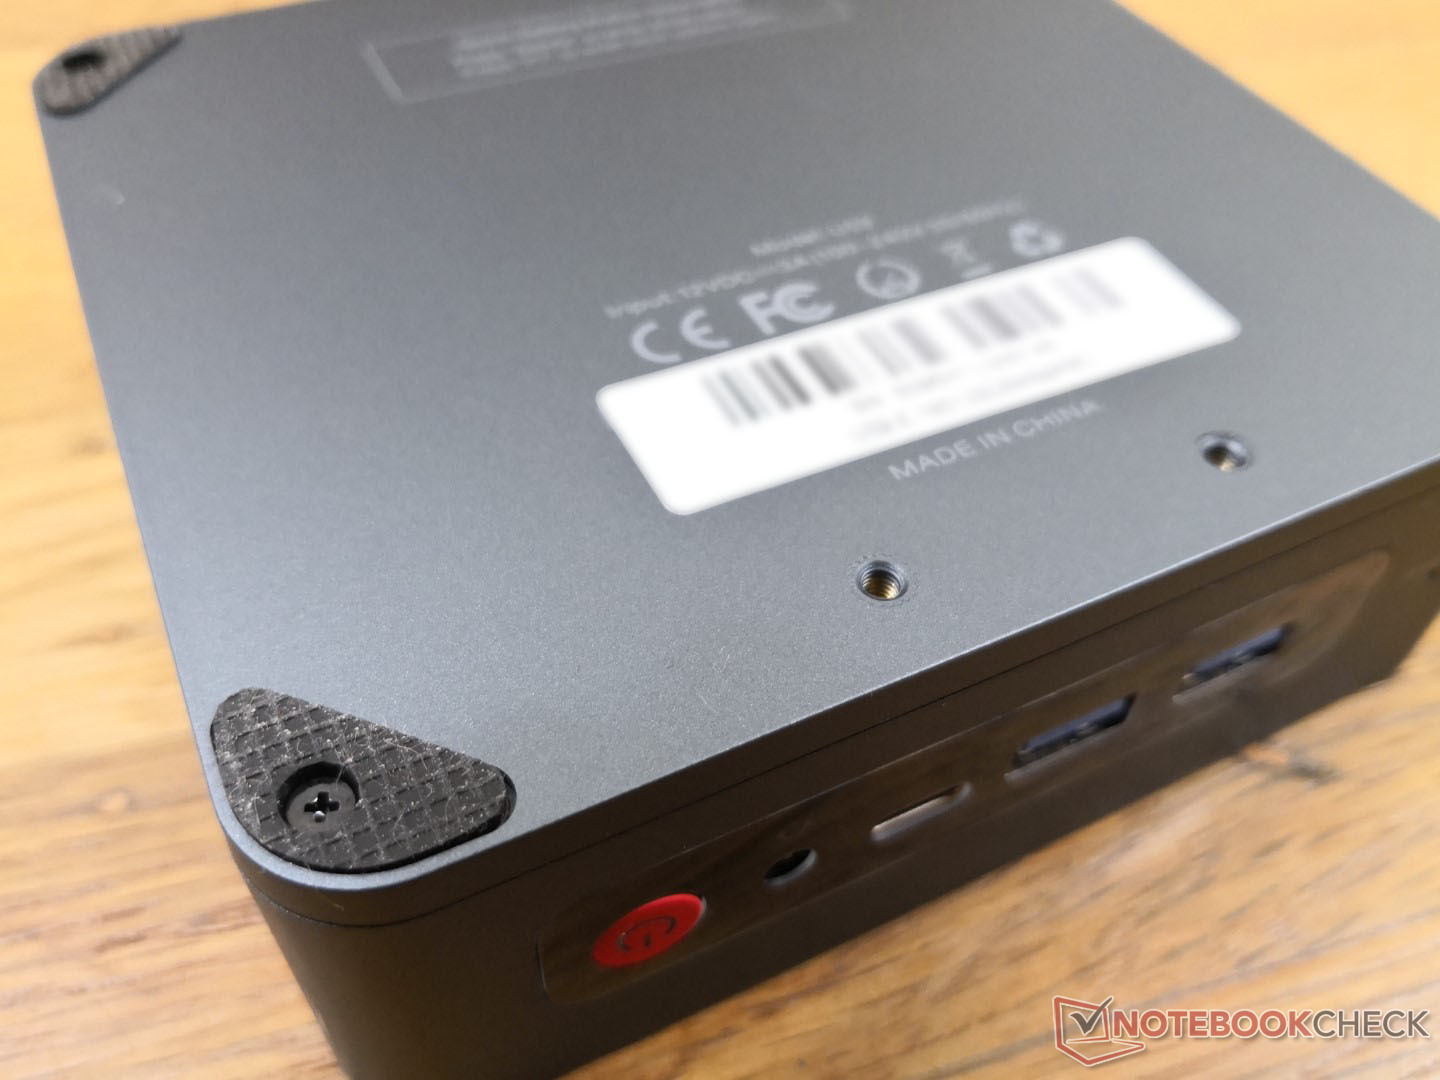
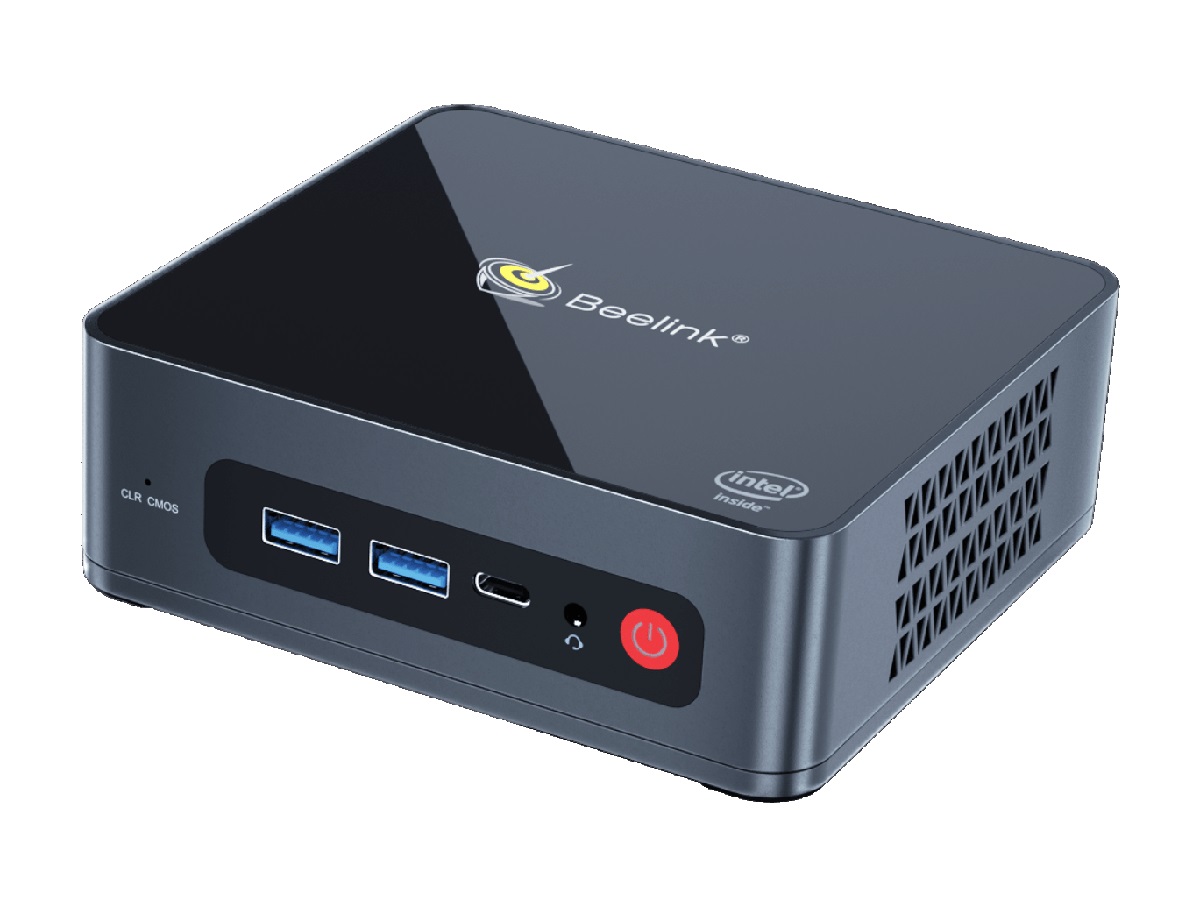
A Beelink utiliza um projeto de chassi semelhante entre suas séries SER3 mini PC baseadas em U59 e AMD. No U59, porém, o topo é simplesmente de plástico brilhante sem as grelhas metálicas ou o perímetro cromado como encontrado no SER3 para um visual mais silencioso. A parte superior de plástico parece bonita no início, mas até mesmo os mais fracos arranhões ou impressões digitais serão difíceis de esconder. Ele também flexiona mais facilmente pelo centro quando comparado a outros mini PCs mais grossos como o GMK NucBox 2 ou Intel NUC série.
Conectividade
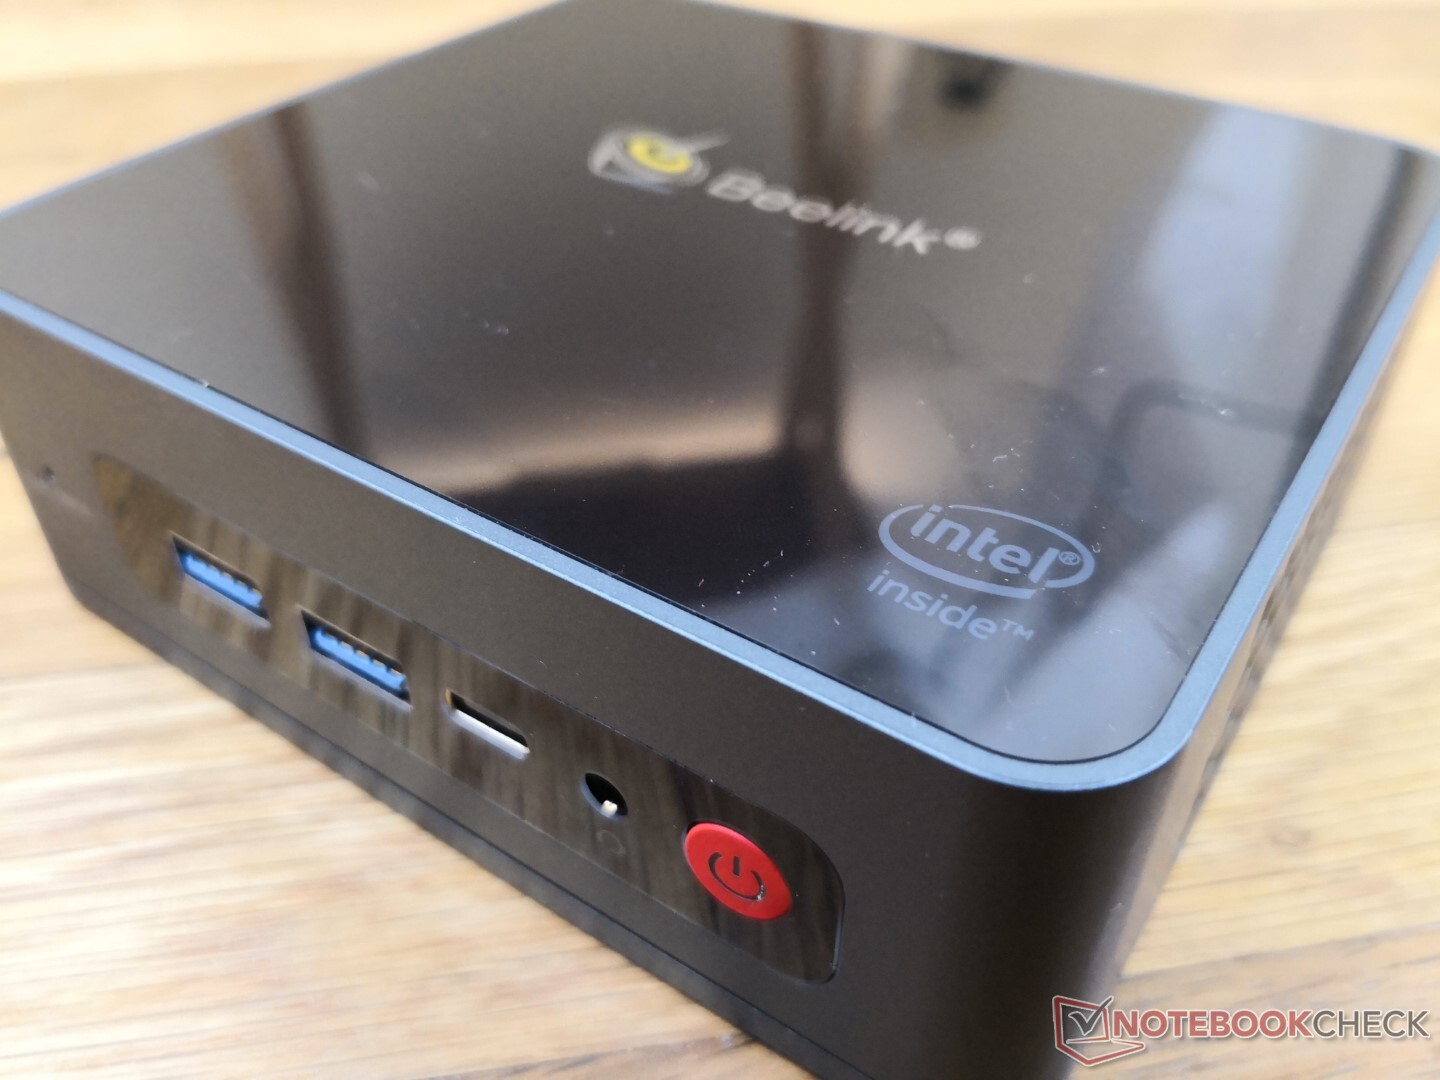
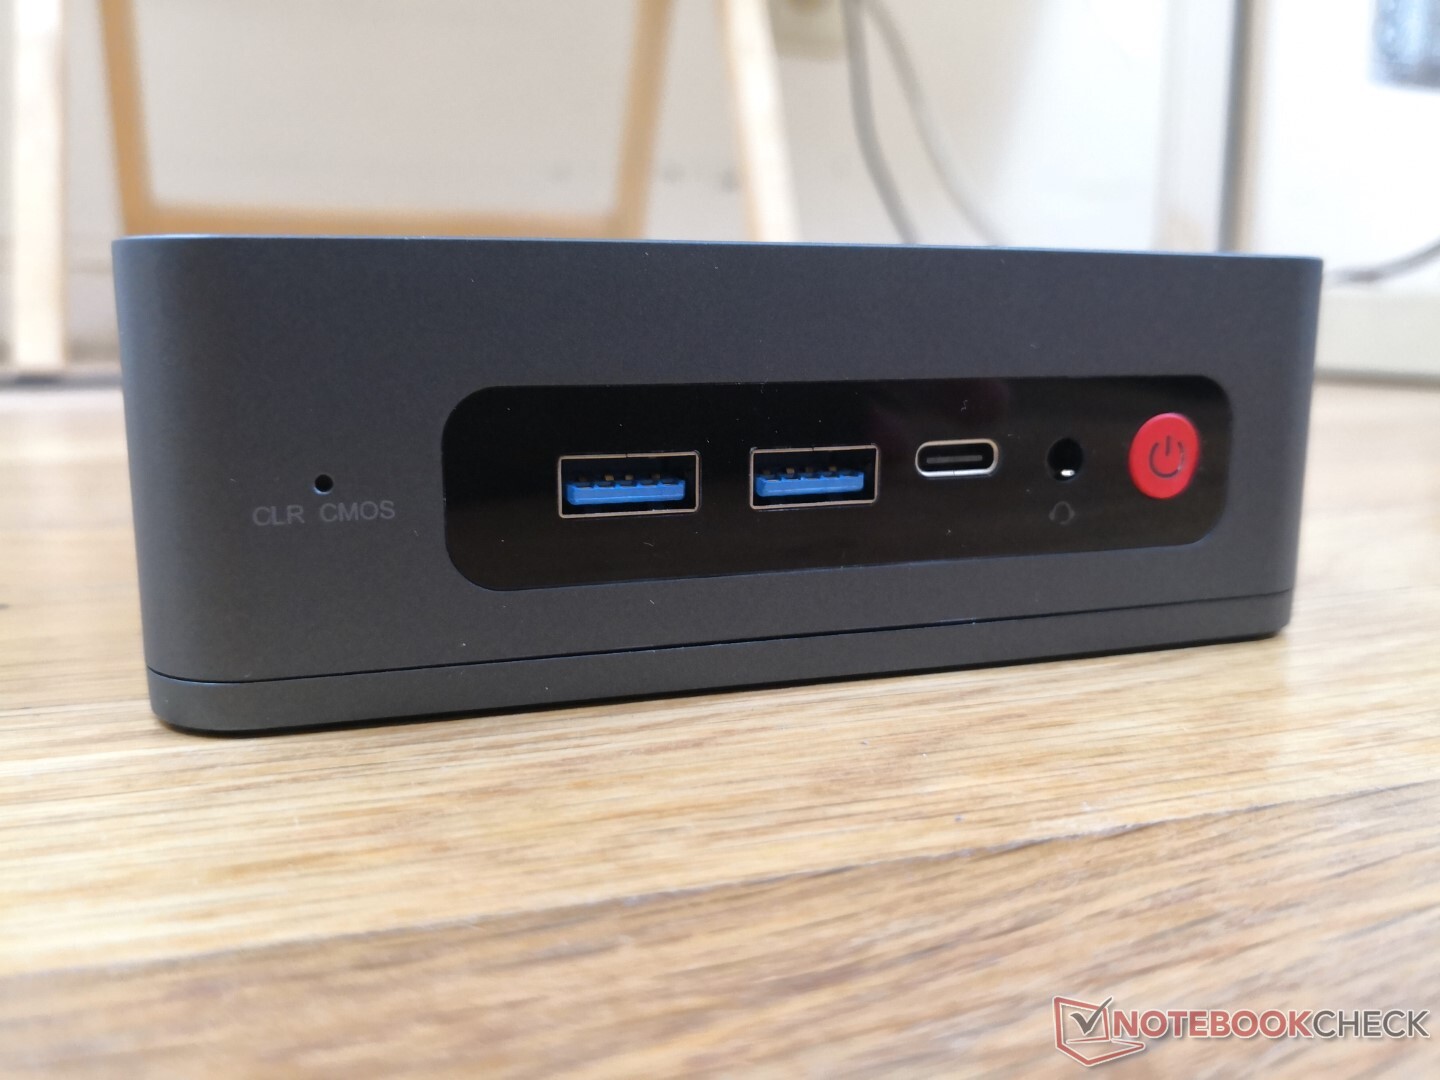
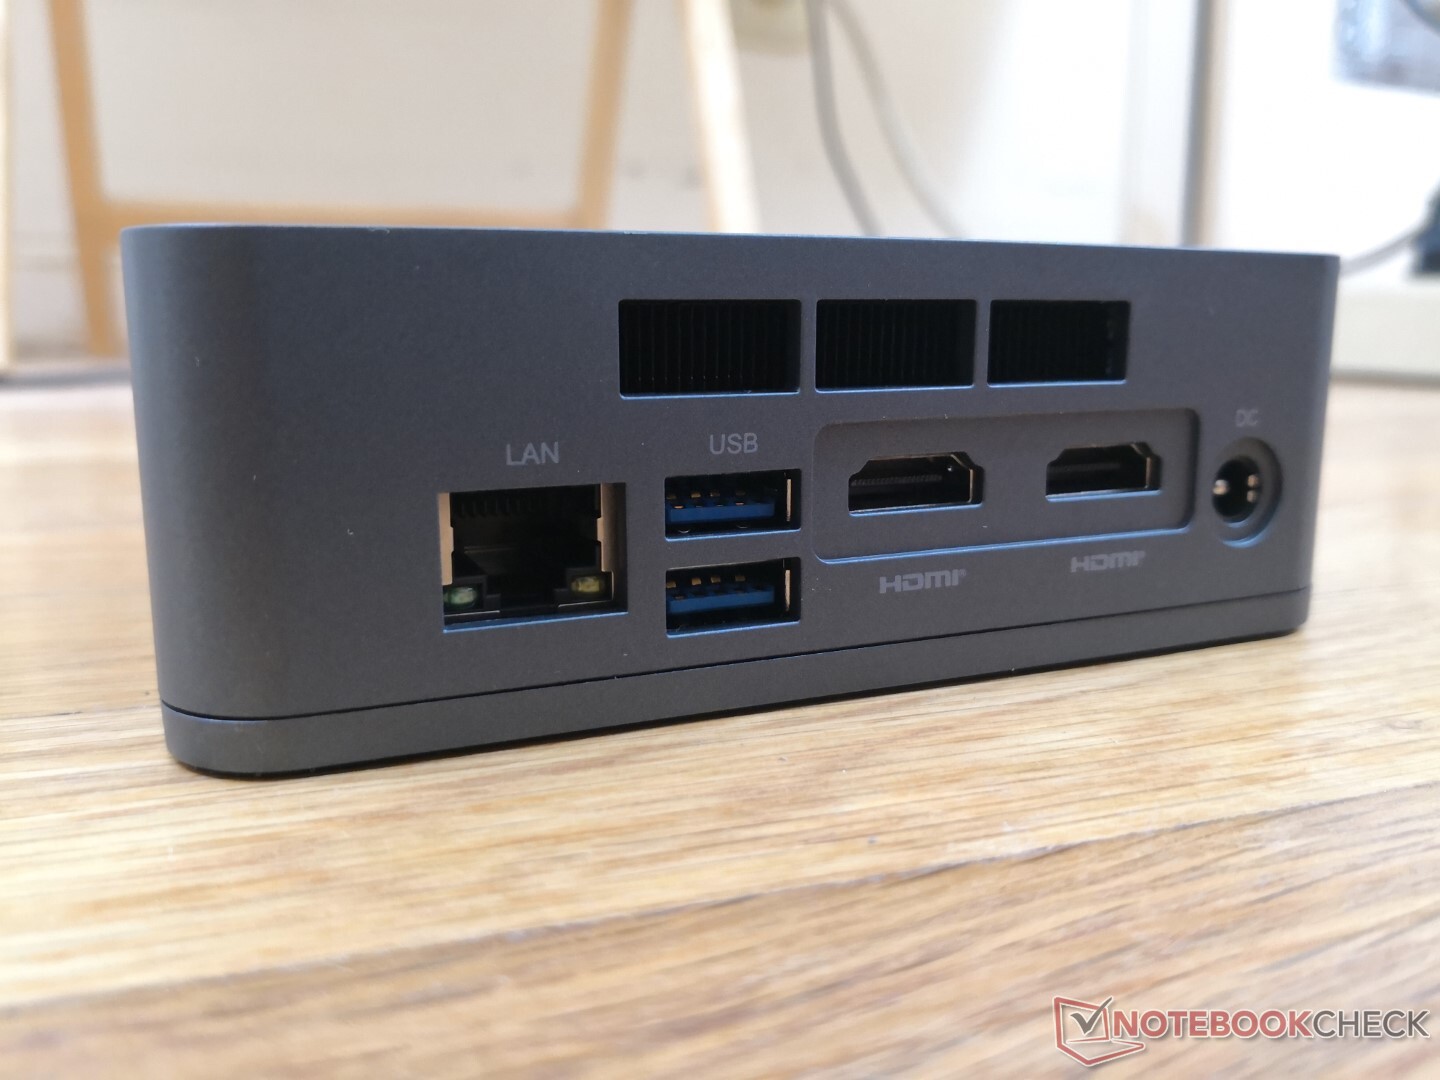
As opções de porta física são idênticas às do Beelink SEi10 mas com a exceção do suporte Thunderbolt. Ambos DisplayPort-over-USB-C e saída 4K60 são suportados.
Comunicação
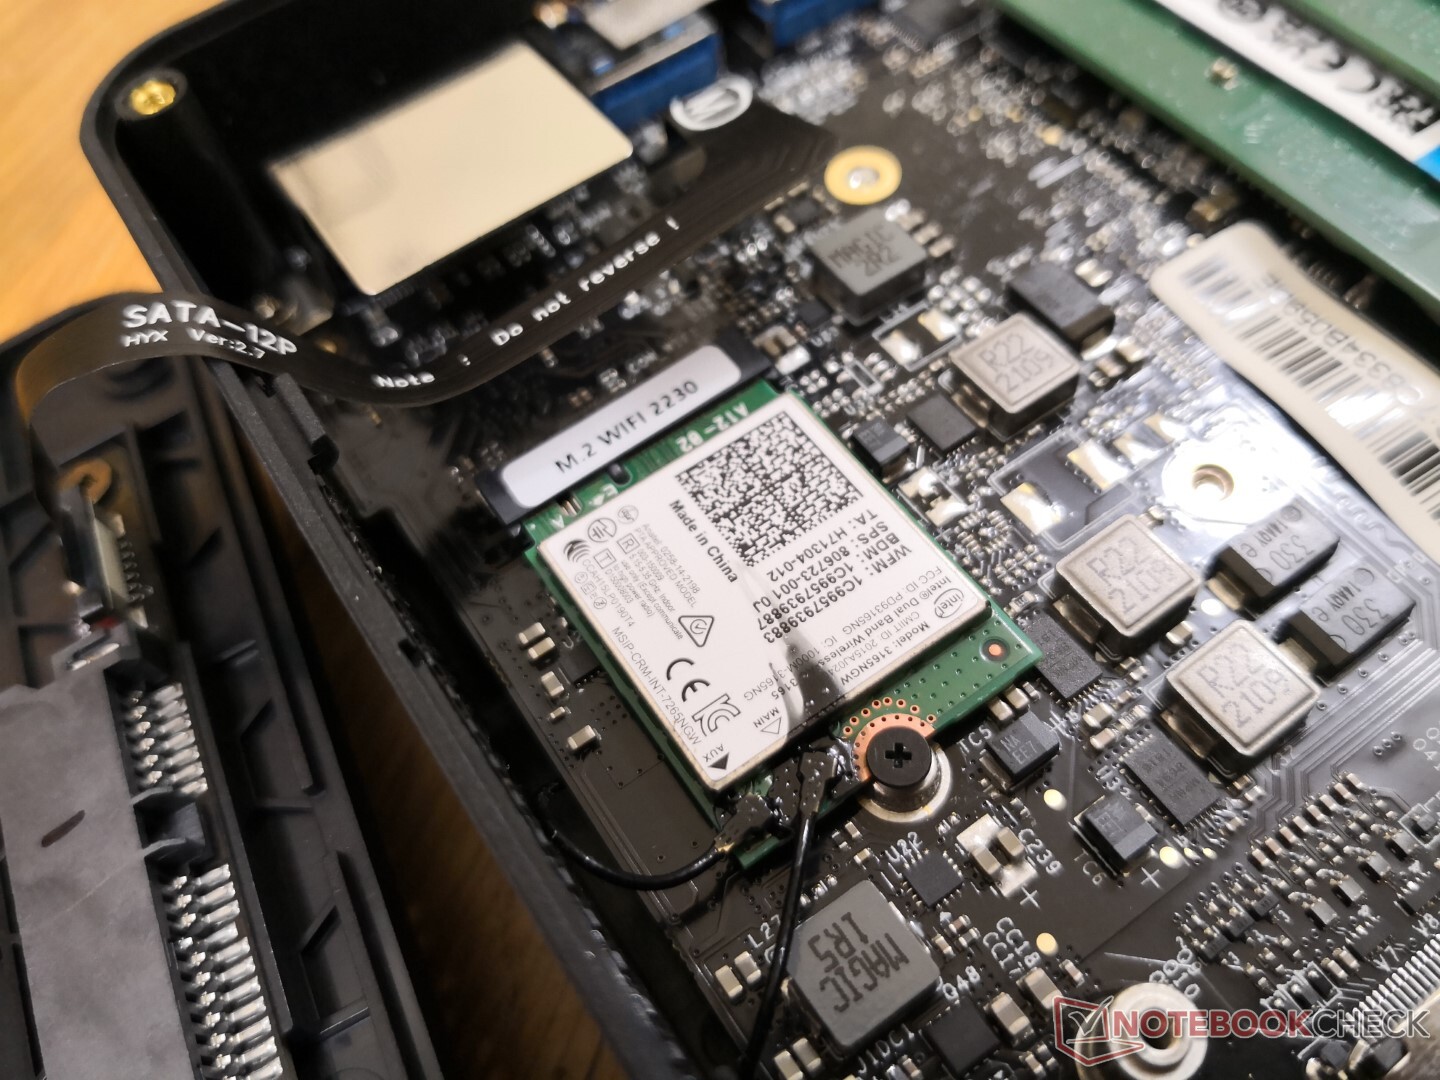
O Intel 3165 de 7 anos de idade vem como padrão para conectividade Wi-Fi 5 até um teórico 433 Mbps. O desempenho é estável, embora muito mais lento que os módulos Wi-Fi 6 modernos por mais de um gigabit.
| Networking | |
| iperf3 transmit AX12 | |
| Intel NUC11TNKi5 | |
| Beelink SEi10 | |
| Intel NUC8i7BE | |
| Beelink U59 | |
| GMK NucBox K1 | |
| iperf3 receive AX12 | |
| Intel NUC11TNKi5 | |
| Beelink SEi10 | |
| Intel NUC8i7BE | |
| GMK NucBox K1 | |
| Beelink U59 | |
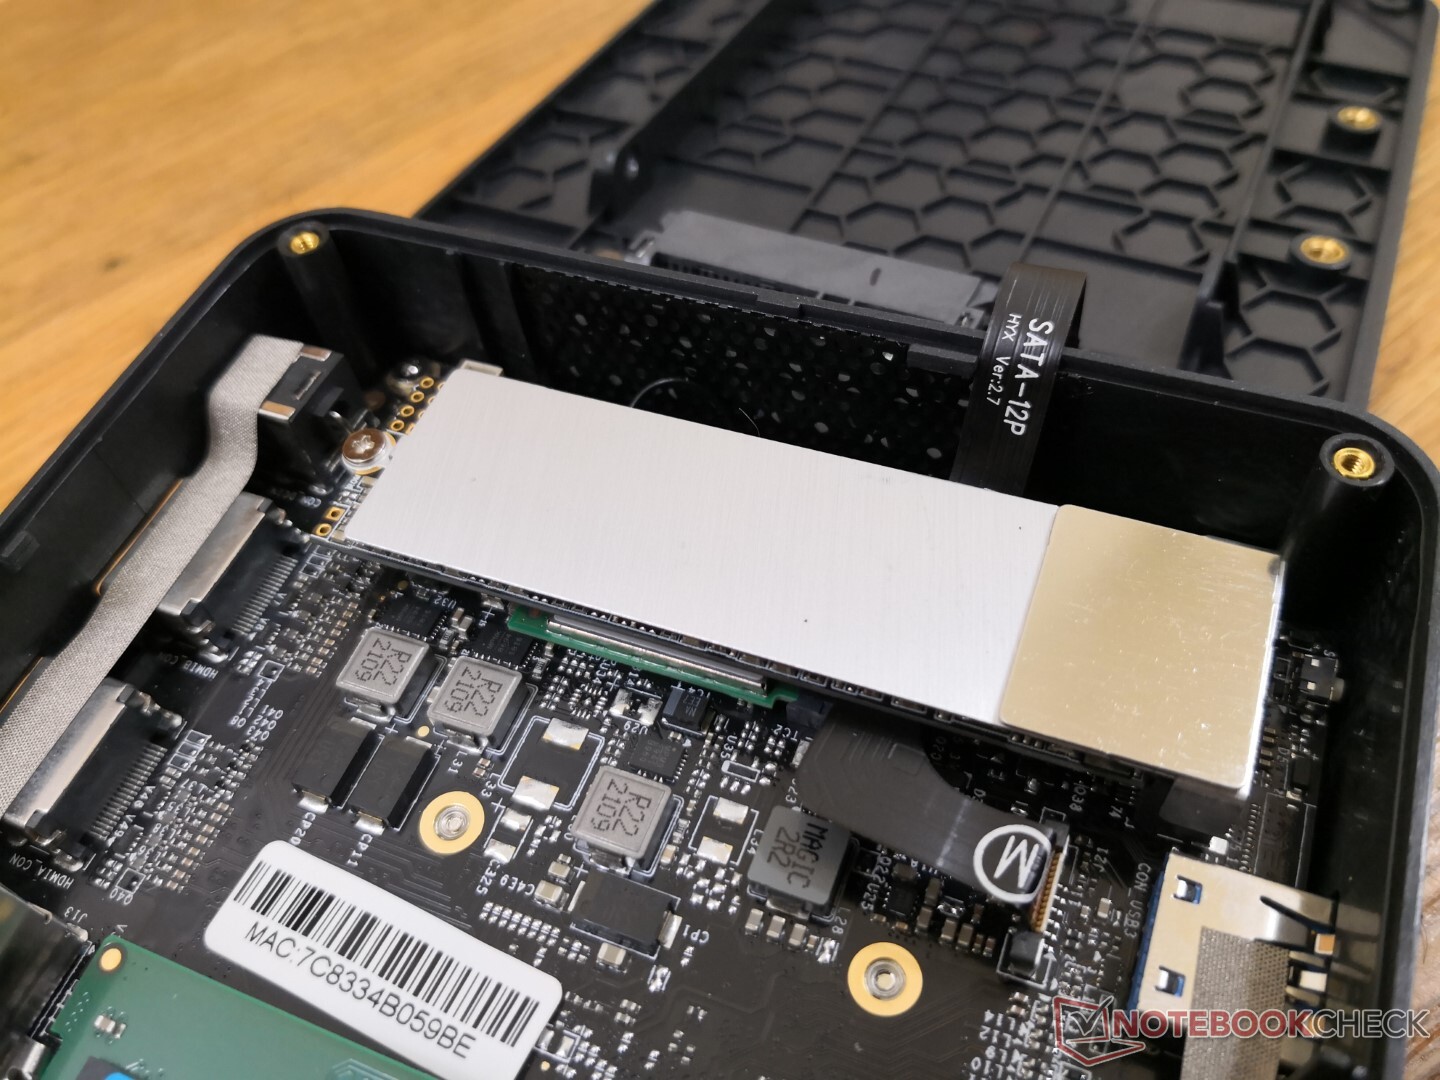
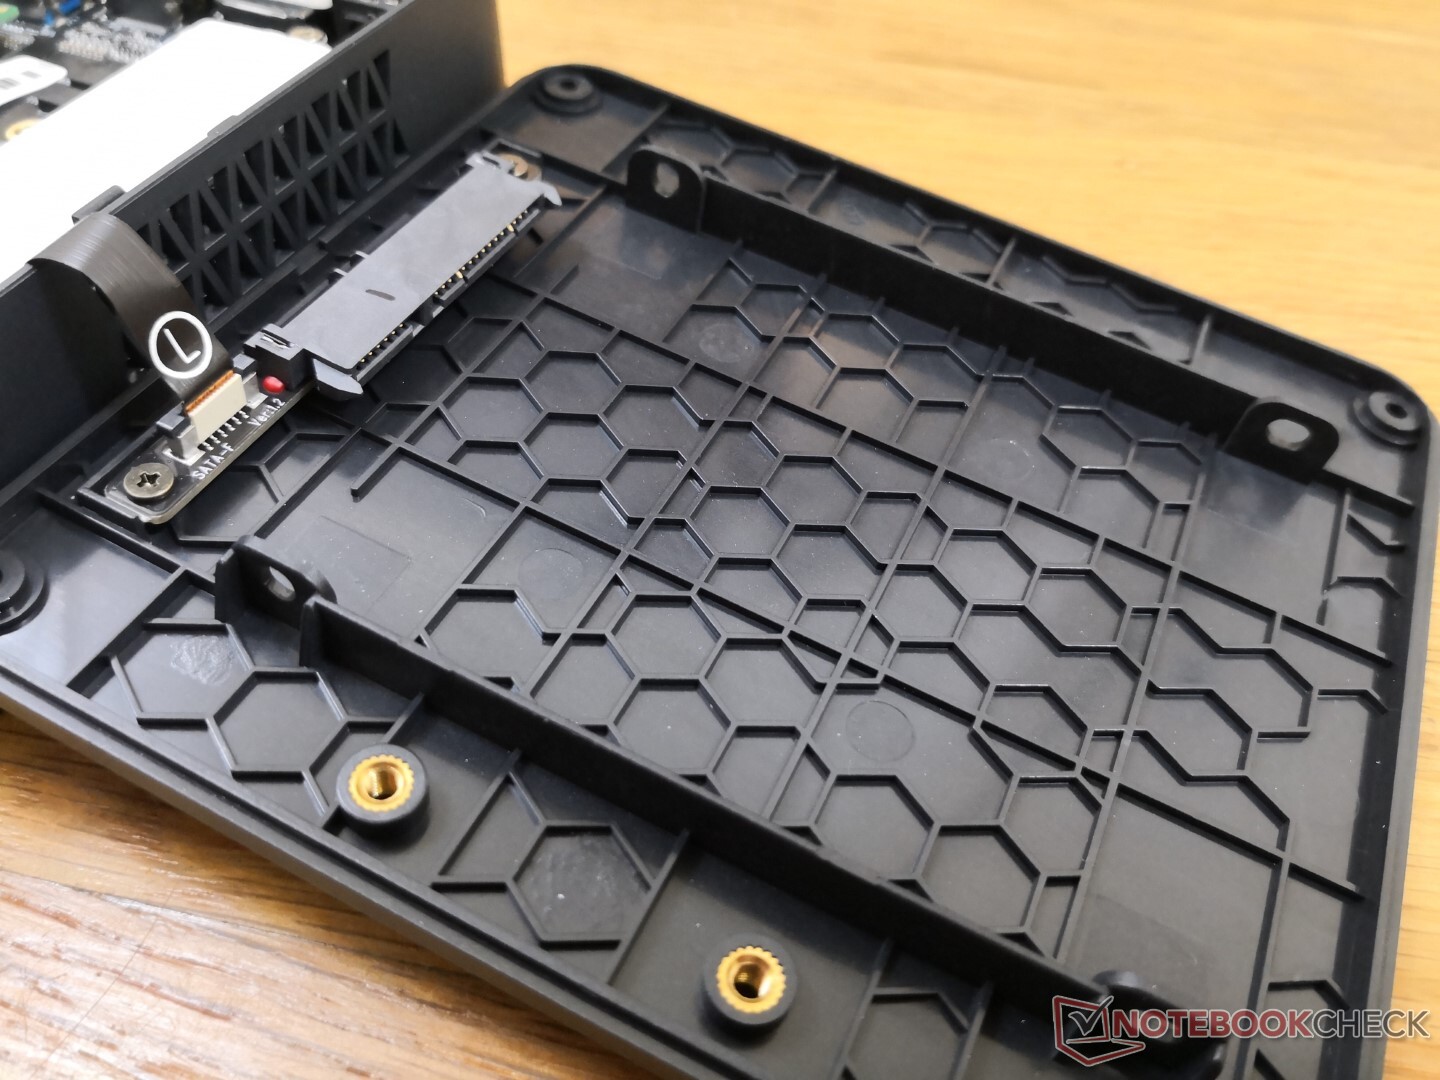
Manutenção
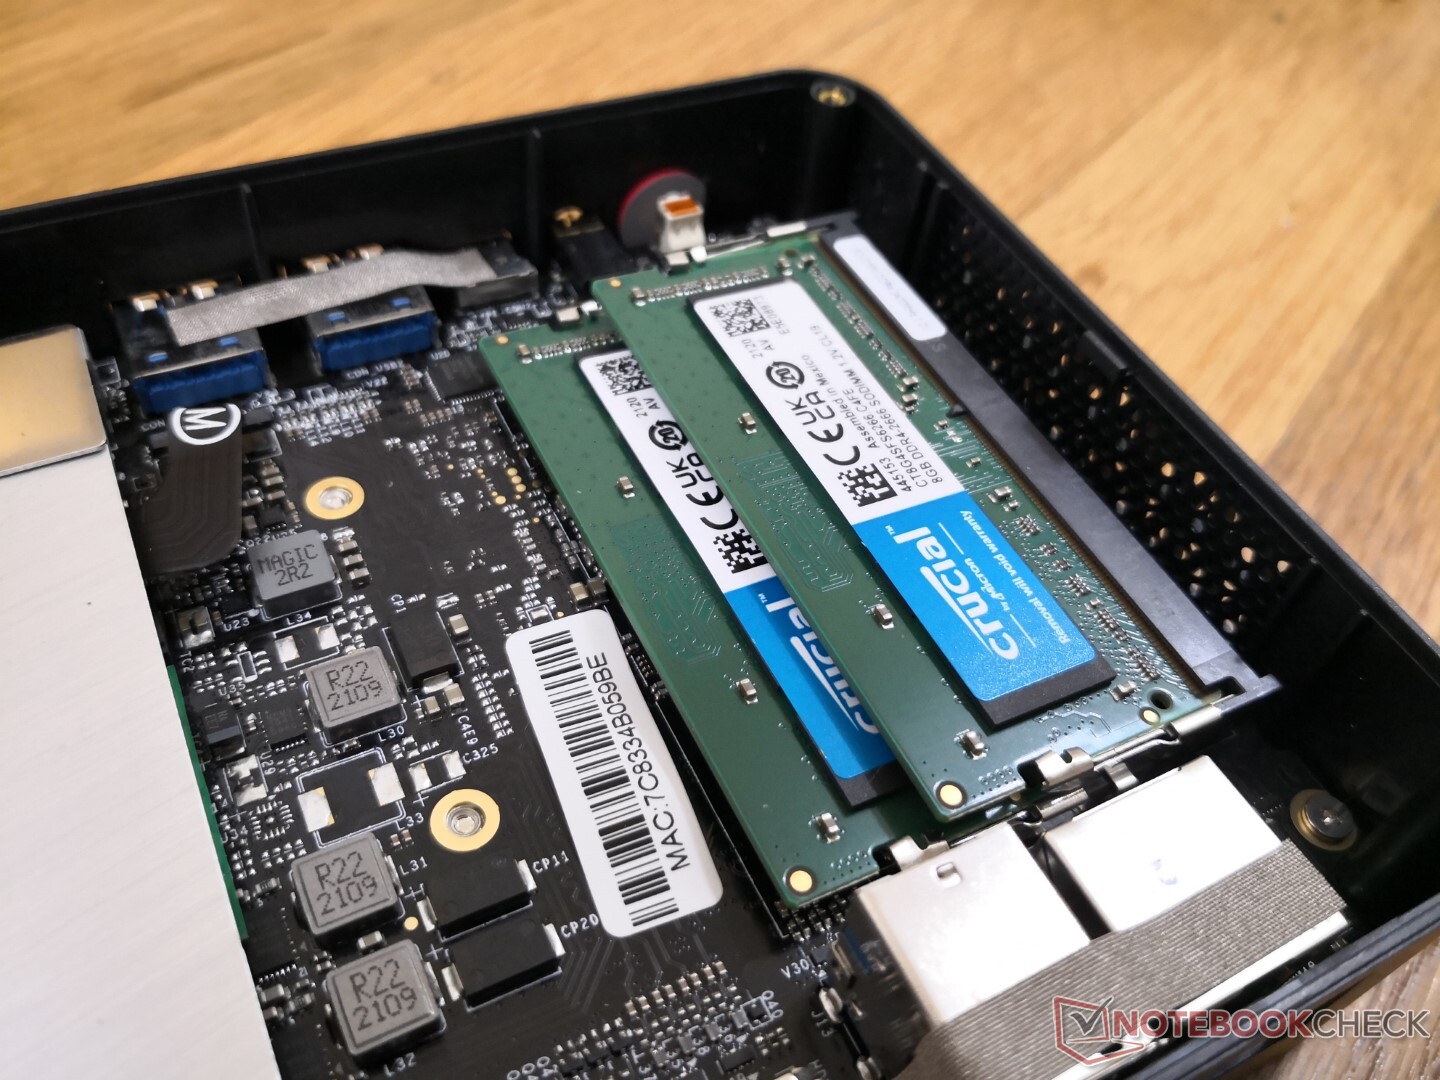
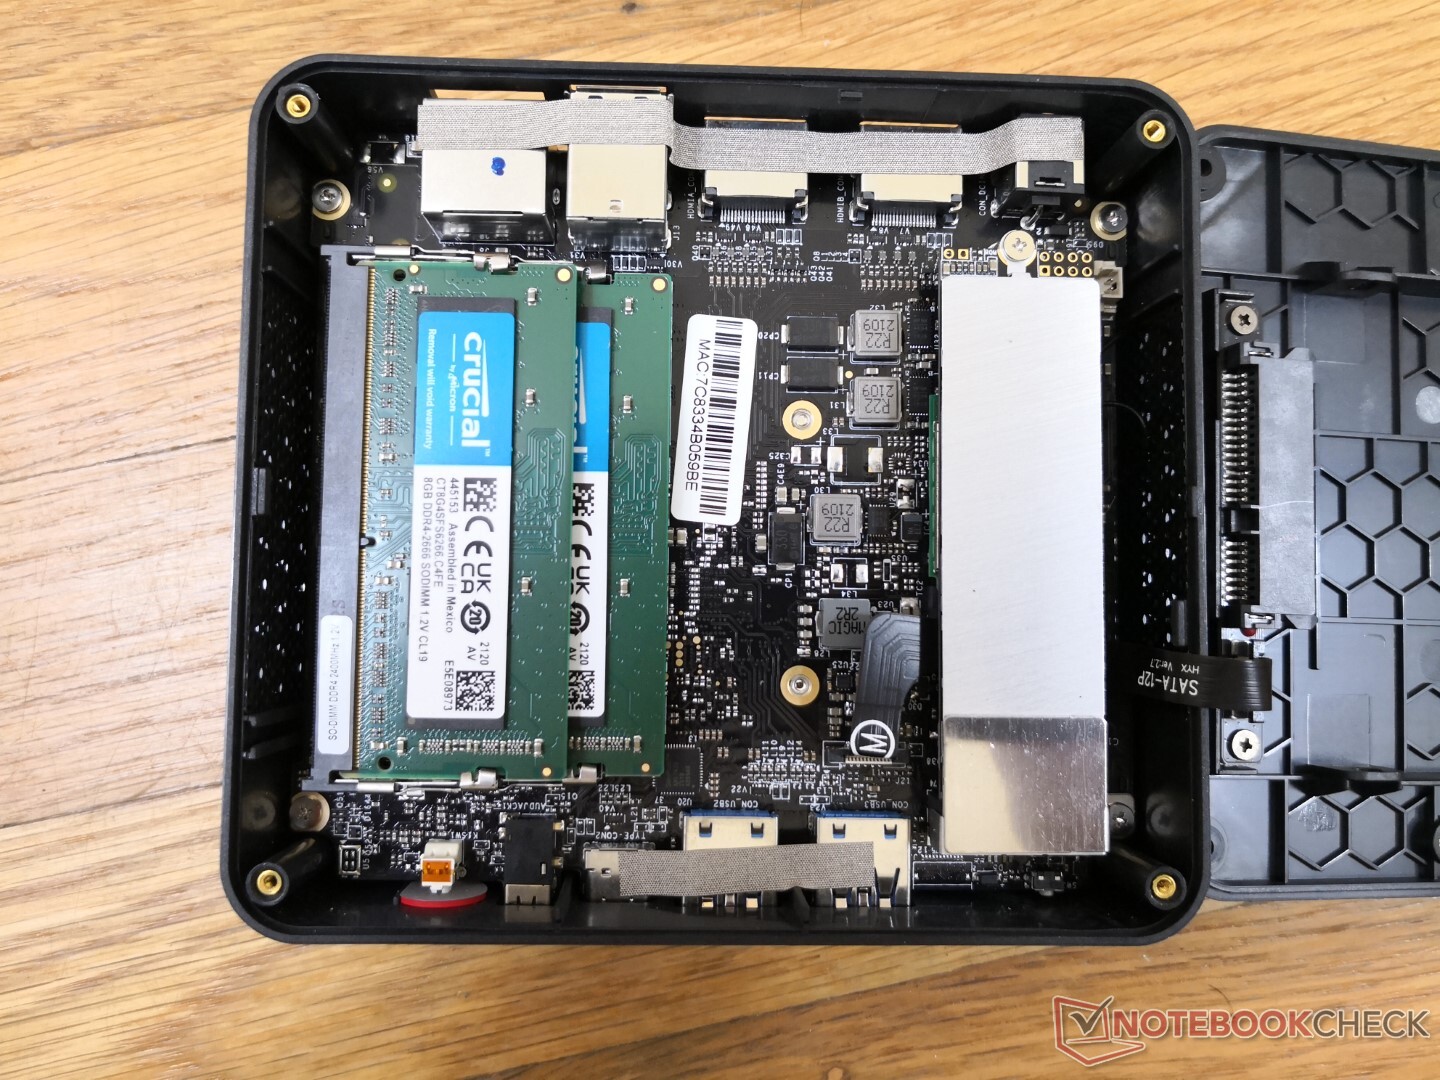
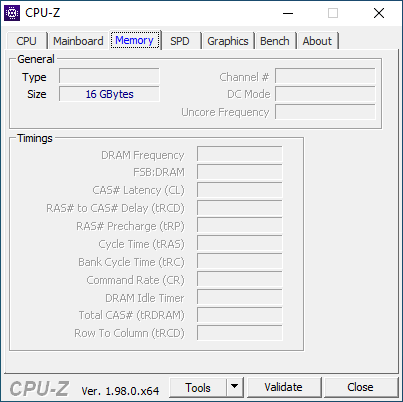
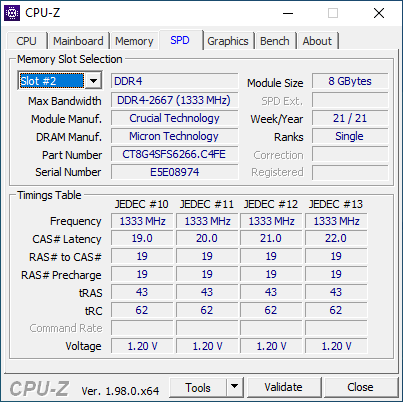
O painel inferior é fixado por apenas quatro parafusos Philips para fácil remoção. Os usuários têm acesso direto a 2x slots SODIMM, o módulo removível M.2 WLAN, e dois compartimentos de armazenamento (M.2 2280 SATA III + SATA III de 2,5 polegadas). Infelizmente, o processador e o ventilador requerem desmontagem adicional, pois ambos estão do outro lado da placa-mãe.
Acessórios e Garantia
A caixa de varejo inclui dois cabos HDMI, adaptador AC, papelaria e um suporte de montagem VESA removível. Aplica-se a garantia padrão limitada de um ano
Desempenho
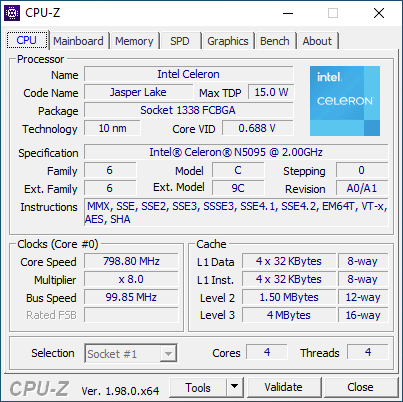
Processador
O desempenho da CPU de múltiplas roscas é surpreendentemente próximo ao do Ice LakeNúcleo i3-1005G1. Por outro lado, o desempenho com uma única linha é muito mais lento em cerca de 30 a 40 por cento. O Celeron N5095 tem quatro núcleos físicos sem Hyper-Threading enquanto o i3-1005G1 tem dois núcleos físicos com Hyper-Threading e, portanto, não é inesperado ver um desempenho mais rápido de rosca única no processador com menos núcleos. A sustentabilidade do desempenho ao longo do tempo é de outra forma excelente ao executar o CineBench R15 xT em loop.
Cinebench R15 Multi Loop
Cinebench R23: Multi Core | Single Core
Cinebench R20: CPU (Multi Core) | CPU (Single Core)
Cinebench R15: CPU Multi 64Bit | CPU Single 64Bit
Blender: v2.79 BMW27 CPU
7-Zip 18.03: 7z b 4 | 7z b 4 -mmt1
Geekbench 5.5: Multi-Core | Single-Core
HWBOT x265 Benchmark v2.2: 4k Preset
LibreOffice : 20 Documents To PDF
R Benchmark 2.5: Overall mean
| CPU Performance rating | |
| Intel NUC11TNKi5 | |
| Intel NUC8i7BE -3! | |
| Zotac ZBOX MI642 Nano -2! | |
| Beelink SEi10 -2! | |
| Beelink U59 -2! | |
| Média Intel Celeron N5095 | |
| GMK NucBox K1 -2! | |
| Blackview AceBook 1 -2! | |
| Jumper Tech Ez Book X3 Air -2! | |
| Asus BR1100FKA-BP0109RA | |
| Chuwi LapBook Plus -6! | |
| Cinebench R23 / Multi Core | |
| Intel NUC11TNKi5 | |
| Beelink U59 | |
| Média Intel Celeron N5095 (2150 - 2219, n=5) | |
| Blackview AceBook 1 | |
| Asus BR1100FKA-BP0109RA | |
| Cinebench R23 / Single Core | |
| Intel NUC11TNKi5 | |
| Beelink U59 | |
| Média Intel Celeron N5095 (587 - 621, n=5) | |
| Asus BR1100FKA-BP0109RA | |
| Blackview AceBook 1 | |
| Cinebench R20 / CPU (Multi Core) | |
| Intel NUC11TNKi5 | |
| Intel NUC8i7BE | |
| Zotac ZBOX MI642 Nano | |
| Beelink SEi10 | |
| Beelink U59 | |
| Média Intel Celeron N5095 (804 - 844, n=5) | |
| Jumper Tech Ez Book X3 Air | |
| Blackview AceBook 1 | |
| Asus BR1100FKA-BP0109RA | |
| GMK NucBox K1 | |
| Chuwi LapBook Plus | |
| Cinebench R20 / CPU (Single Core) | |
| Intel NUC11TNKi5 | |
| Intel NUC8i7BE | |
| Zotac ZBOX MI642 Nano | |
| Beelink SEi10 | |
| Beelink U59 | |
| Média Intel Celeron N5095 (228 - 239, n=5) | |
| Asus BR1100FKA-BP0109RA | |
| GMK NucBox K1 | |
| Blackview AceBook 1 | |
| Jumper Tech Ez Book X3 Air | |
| Chuwi LapBook Plus | |
| Cinebench R15 / CPU Multi 64Bit | |
| Intel NUC8i7BE | |
| Intel NUC11TNKi5 | |
| Zotac ZBOX MI642 Nano | |
| Beelink SEi10 | |
| Beelink U59 | |
| Média Intel Celeron N5095 (221 - 379, n=6) | |
| GMK NucBox K1 | |
| Blackview AceBook 1 | |
| Jumper Tech Ez Book X3 Air | |
| Asus BR1100FKA-BP0109RA | |
| Chuwi LapBook Plus | |
| Cinebench R15 / CPU Single 64Bit | |
| Intel NUC11TNKi5 | |
| Intel NUC8i7BE | |
| Zotac ZBOX MI642 Nano | |
| Beelink SEi10 | |
| Beelink U59 | |
| Média Intel Celeron N5095 (95.4 - 109, n=5) | |
| Asus BR1100FKA-BP0109RA | |
| GMK NucBox K1 | |
| Blackview AceBook 1 | |
| Jumper Tech Ez Book X3 Air | |
| Chuwi LapBook Plus | |
| Blender / v2.79 BMW27 CPU | |
| Chuwi LapBook Plus | |
| Asus BR1100FKA-BP0109RA | |
| Jumper Tech Ez Book X3 Air | |
| Blackview AceBook 1 | |
| GMK NucBox K1 | |
| Média Intel Celeron N5095 (1502 - 1624, n=5) | |
| Beelink U59 | |
| Beelink SEi10 | |
| Zotac ZBOX MI642 Nano | |
| Intel NUC8i7BE | |
| Intel NUC8i7BE | |
| Intel NUC11TNKi5 | |
| 7-Zip 18.03 / 7z b 4 | |
| Intel NUC8i7BE | |
| Intel NUC8i7BE | |
| Intel NUC11TNKi5 | |
| Zotac ZBOX MI642 Nano | |
| Beelink U59 | |
| Média Intel Celeron N5095 (10924 - 11168, n=5) | |
| Beelink SEi10 | |
| GMK NucBox K1 | |
| Blackview AceBook 1 | |
| Jumper Tech Ez Book X3 Air | |
| Asus BR1100FKA-BP0109RA | |
| Chuwi LapBook Plus | |
| 7-Zip 18.03 / 7z b 4 -mmt1 | |
| Intel NUC8i7BE | |
| Intel NUC8i7BE | |
| Intel NUC11TNKi5 | |
| Zotac ZBOX MI642 Nano | |
| Beelink SEi10 | |
| Beelink U59 | |
| Média Intel Celeron N5095 (2935 - 3124, n=5) | |
| Asus BR1100FKA-BP0109RA | |
| Blackview AceBook 1 | |
| GMK NucBox K1 | |
| Jumper Tech Ez Book X3 Air | |
| Chuwi LapBook Plus | |
| Geekbench 5.5 / Multi-Core | |
| Intel NUC11TNKi5 | |
| Zotac ZBOX MI642 Nano | |
| Intel NUC8i7BE | |
| Beelink SEi10 | |
| Média Intel Celeron N5095 (1933 - 2052, n=4) | |
| Jumper Tech Ez Book X3 Air | |
| GMK NucBox K1 | |
| Asus BR1100FKA-BP0109RA | |
| Geekbench 5.5 / Single-Core | |
| Intel NUC11TNKi5 | |
| Beelink SEi10 | |
| Zotac ZBOX MI642 Nano | |
| Intel NUC8i7BE | |
| Média Intel Celeron N5095 (637 - 659, n=4) | |
| GMK NucBox K1 | |
| Jumper Tech Ez Book X3 Air | |
| Asus BR1100FKA-BP0109RA | |
| HWBOT x265 Benchmark v2.2 / 4k Preset | |
| Intel NUC11TNKi5 | |
| Intel NUC8i7BE | |
| Intel NUC8i7BE | |
| Zotac ZBOX MI642 Nano | |
| Beelink SEi10 | |
| Beelink U59 | |
| Média Intel Celeron N5095 (1.9 - 2.05, n=5) | |
| GMK NucBox K1 | |
| Jumper Tech Ez Book X3 Air | |
| Blackview AceBook 1 | |
| Chuwi LapBook Plus | |
| Asus BR1100FKA-BP0109RA | |
| LibreOffice / 20 Documents To PDF | |
| Asus BR1100FKA-BP0109RA | |
| Blackview AceBook 1 | |
| Jumper Tech Ez Book X3 Air | |
| GMK NucBox K1 | |
| Média Intel Celeron N5095 (97 - 107.9, n=5) | |
| Beelink U59 | |
| Zotac ZBOX MI642 Nano | |
| Beelink SEi10 | |
| Intel NUC11TNKi5 | |
| R Benchmark 2.5 / Overall mean | |
| Asus BR1100FKA-BP0109RA | |
| Jumper Tech Ez Book X3 Air | |
| Blackview AceBook 1 | |
| GMK NucBox K1 | |
| Média Intel Celeron N5095 (1.16 - 1.2, n=5) | |
| Beelink U59 | |
| Beelink SEi10 | |
| Zotac ZBOX MI642 Nano | |
| Intel NUC8i7BE | |
| Intel NUC11TNKi5 | |
* ... menor é melhor
AIDA64: FP32 Ray-Trace | FPU Julia | CPU SHA3 | CPU Queen | FPU SinJulia | FPU Mandel | CPU AES | CPU ZLib | FP64 Ray-Trace | CPU PhotoWorxx
| Performance rating | |
| Intel NUC11TNKi5 | |
| Intel NUC8i7BE -1! | |
| Zotac ZBOX MI642 Nano | |
| Beelink U59 | |
| AIDA64 / FP32 Ray-Trace | |
| Intel NUC11TNKi5 | |
| Intel NUC8i7BE | |
| Zotac ZBOX MI642 Nano | |
| Beelink U59 | |
| AIDA64 / FPU Julia | |
| Intel NUC11TNKi5 | |
| Intel NUC8i7BE | |
| Zotac ZBOX MI642 Nano | |
| Beelink U59 | |
| AIDA64 / CPU SHA3 | |
| Intel NUC11TNKi5 | |
| Zotac ZBOX MI642 Nano | |
| Beelink U59 | |
| AIDA64 / CPU Queen | |
| Intel NUC8i7BE | |
| Zotac ZBOX MI642 Nano | |
| Intel NUC11TNKi5 | |
| Beelink U59 | |
| AIDA64 / FPU SinJulia | |
| Intel NUC8i7BE | |
| Intel NUC11TNKi5 | |
| Zotac ZBOX MI642 Nano | |
| Beelink U59 | |
| AIDA64 / FPU Mandel | |
| Intel NUC11TNKi5 | |
| Intel NUC8i7BE | |
| Zotac ZBOX MI642 Nano | |
| Beelink U59 | |
| AIDA64 / CPU AES | |
| Intel NUC11TNKi5 | |
| Beelink U59 | |
| Intel NUC8i7BE | |
| Zotac ZBOX MI642 Nano | |
| AIDA64 / CPU ZLib | |
| Intel NUC11TNKi5 | |
| Intel NUC8i7BE | |
| Zotac ZBOX MI642 Nano | |
| Beelink U59 | |
| AIDA64 / FP64 Ray-Trace | |
| Intel NUC11TNKi5 | |
| Intel NUC8i7BE | |
| Zotac ZBOX MI642 Nano | |
| Beelink U59 | |
| AIDA64 / CPU PhotoWorxx | |
| Intel NUC8i7BE | |
| Intel NUC11TNKi5 | |
| Zotac ZBOX MI642 Nano | |
| Beelink U59 | |
Desempenho do sistema
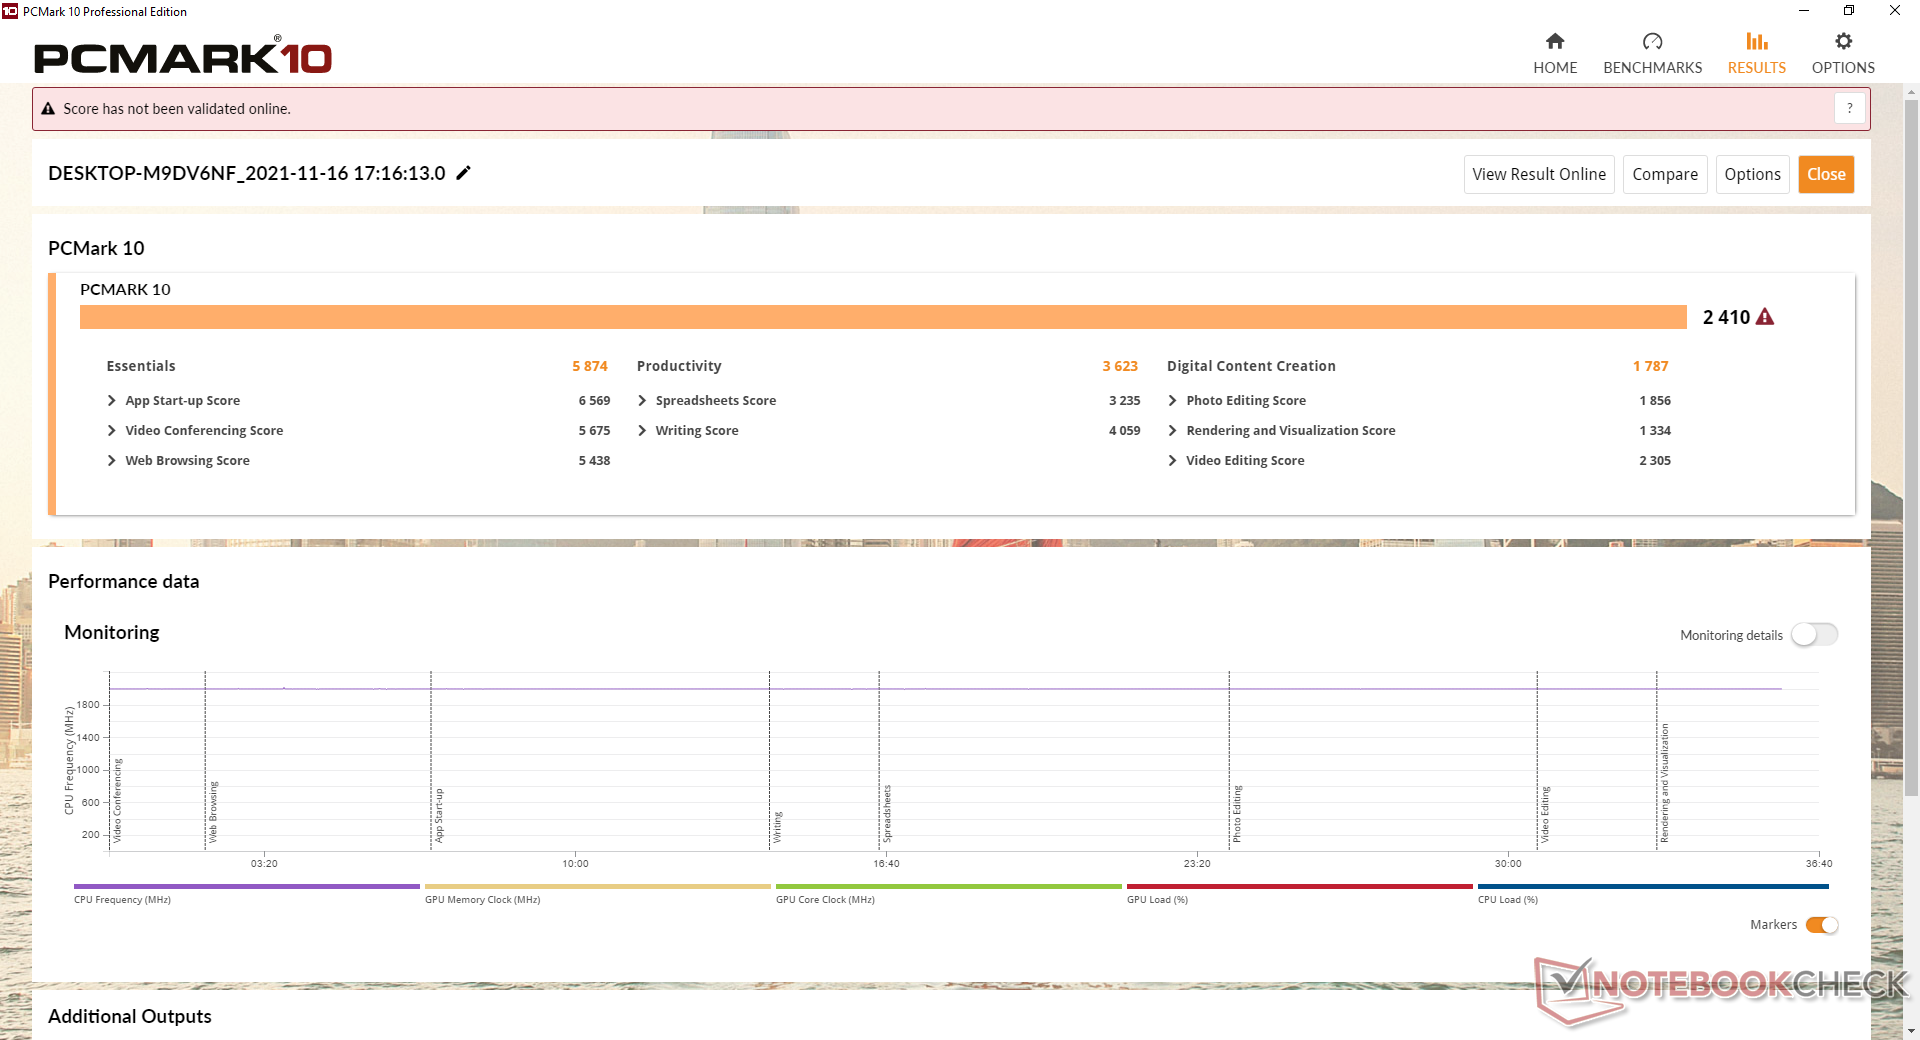
A pontuação PCMark 10 é consistentemente mais alta do que aGMK NucBox K1 enquanto é mais lento que o Core i3-powered Beelink SEi10.
| PCMark 10 / Score | |
| Intel NUC8i7BE | |
| Intel NUC11TNKi5 | |
| Zotac ZBOX MI642 Nano | |
| Beelink SEi10 | |
| Beelink U59 | |
| Média Intel Celeron N5095, Intel UHD Graphics (Jasper Lake 16 EU) (2317 - 2417, n=5) | |
| GMK NucBox K1 | |
| PCMark 10 / Essentials | |
| Intel NUC11TNKi5 | |
| Intel NUC8i7BE | |
| Zotac ZBOX MI642 Nano | |
| Beelink SEi10 | |
| Beelink U59 | |
| Média Intel Celeron N5095, Intel UHD Graphics (Jasper Lake 16 EU) (5516 - 5874, n=5) | |
| GMK NucBox K1 | |
| PCMark 10 / Productivity | |
| Intel NUC8i7BE | |
| Zotac ZBOX MI642 Nano | |
| Intel NUC11TNKi5 | |
| Beelink SEi10 | |
| Beelink U59 | |
| Média Intel Celeron N5095, Intel UHD Graphics (Jasper Lake 16 EU) (3454 - 3666, n=5) | |
| GMK NucBox K1 | |
| PCMark 10 / Digital Content Creation | |
| Intel NUC11TNKi5 | |
| Intel NUC8i7BE | |
| Zotac ZBOX MI642 Nano | |
| Beelink SEi10 | |
| Beelink U59 | |
| Média Intel Celeron N5095, Intel UHD Graphics (Jasper Lake 16 EU) (1752 - 1787, n=5) | |
| GMK NucBox K1 | |
| PCMark 10 Score | 2410 pontos | |
Ajuda | ||
| AIDA64 / Memory Copy | |
| Intel NUC8i7BE | |
| Zotac ZBOX MI642 Nano | |
| Beelink U59 | |
| Intel NUC11TNKi5 | |
| AIDA64 / Memory Read | |
| Intel NUC8i7BE | |
| Zotac ZBOX MI642 Nano | |
| Intel NUC11TNKi5 | |
| Beelink U59 | |
| AIDA64 / Memory Write | |
| Intel NUC8i7BE | |
| Zotac ZBOX MI642 Nano | |
| Beelink U59 | |
| Intel NUC11TNKi5 | |
| AIDA64 / Memory Latency | |
| Zotac ZBOX MI642 Nano | |
| Intel NUC11TNKi5 | |
| Beelink U59 | |
| Intel NUC8i7BE | |
* ... menor é melhor
Latência do DPC
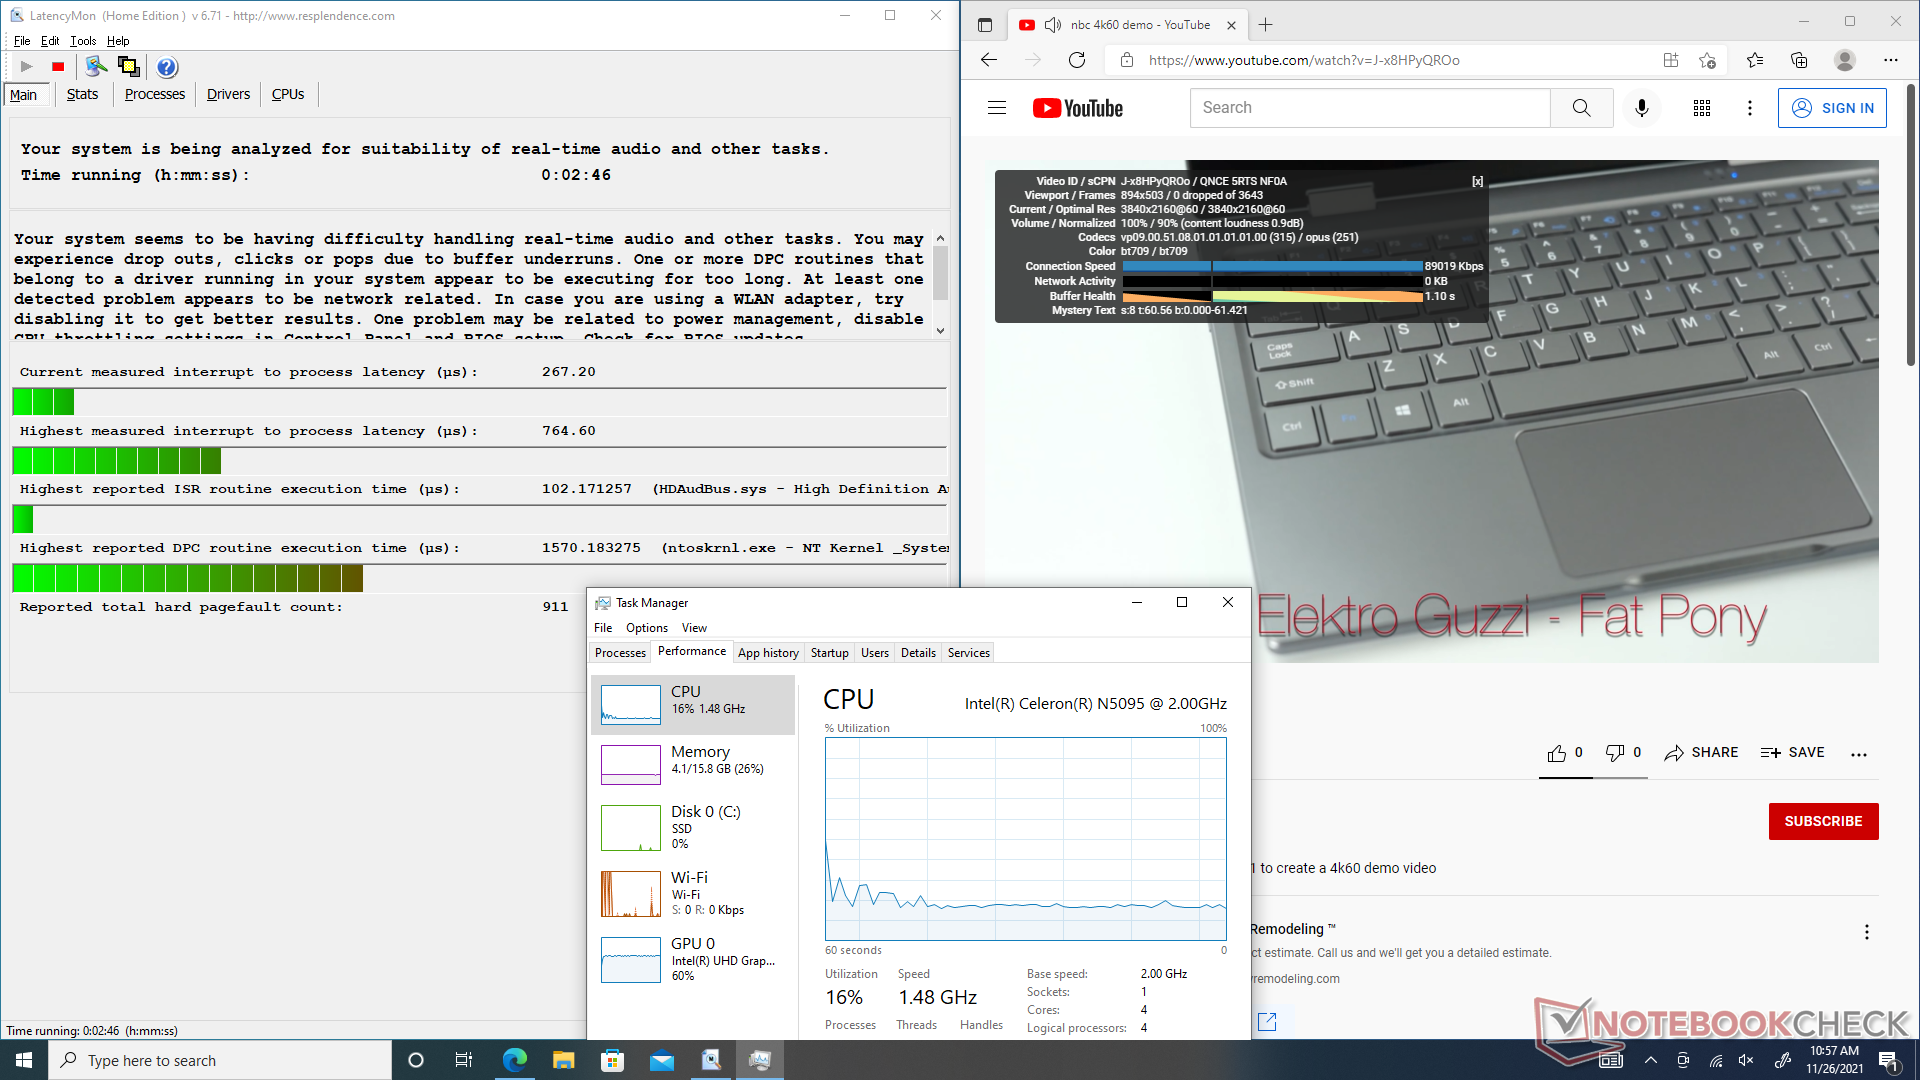
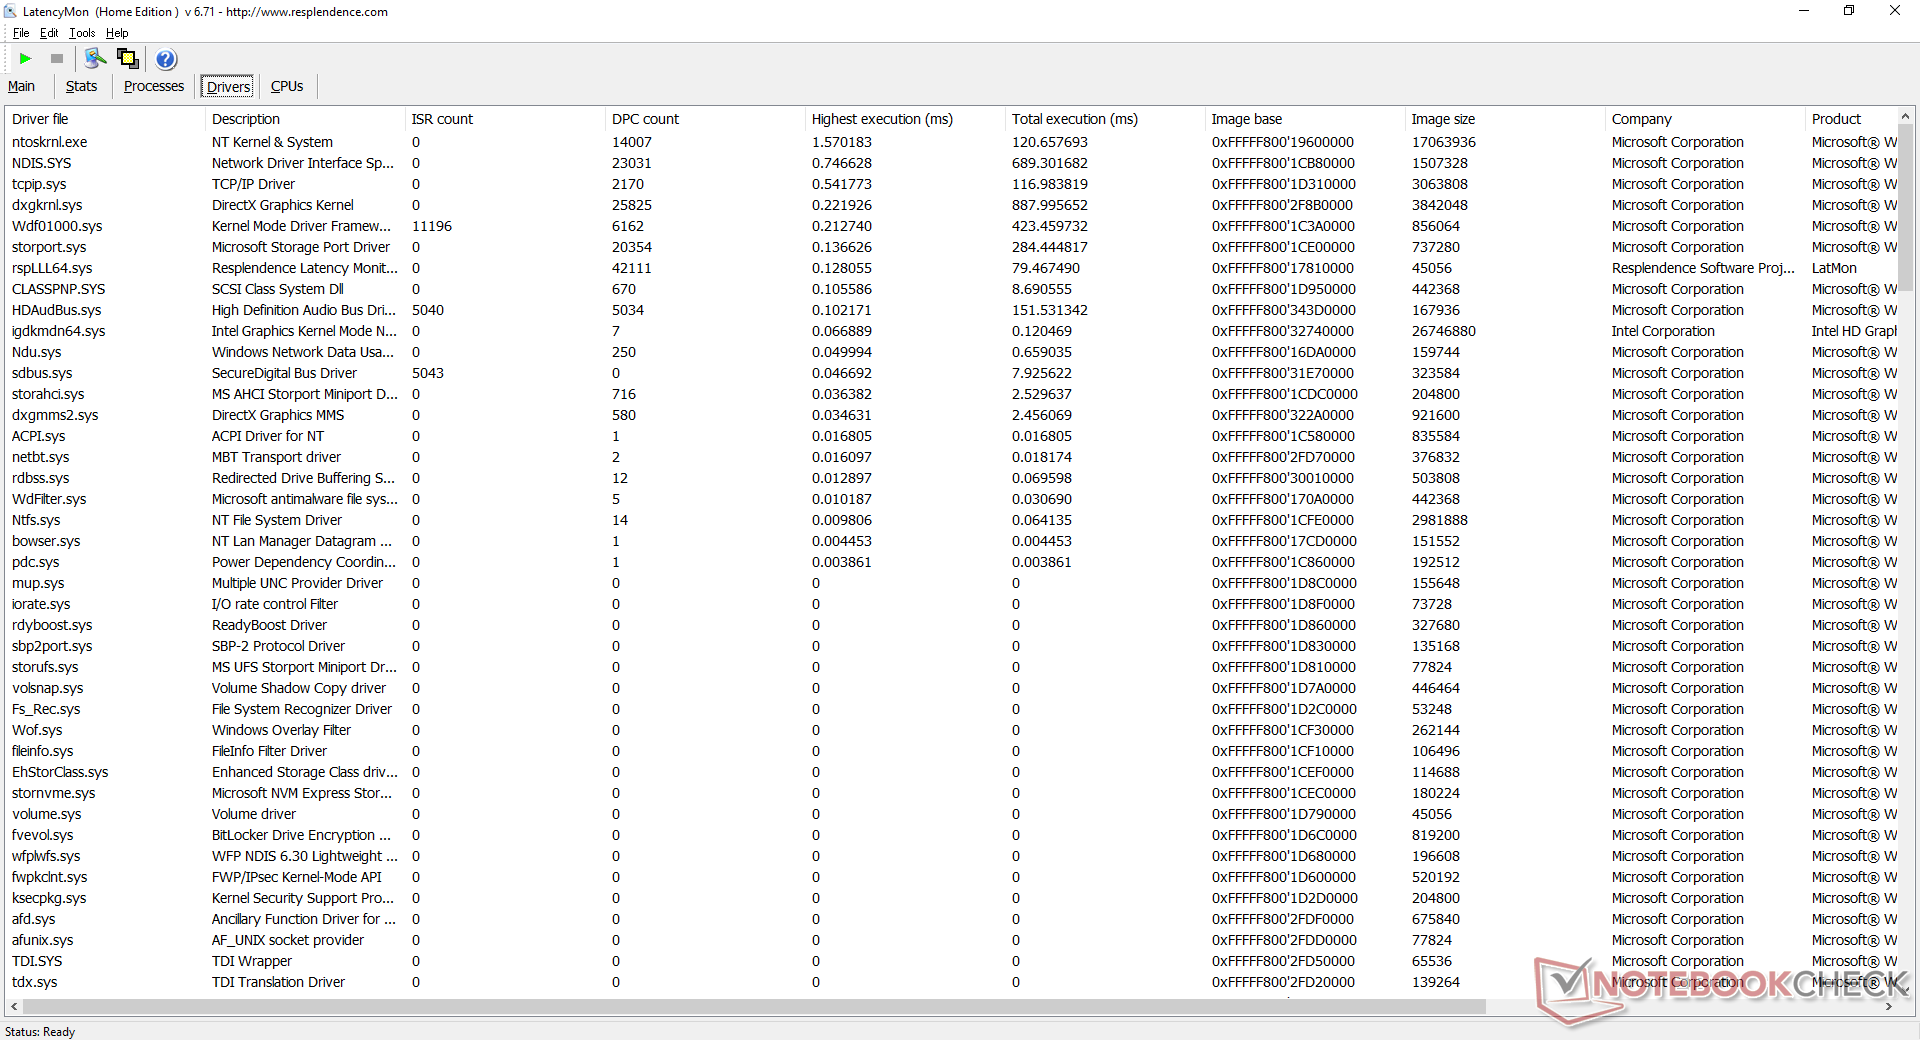
LatencyMon revela pequenos problemas de latência do DPC ao abrir várias abas do navegador em nossa página inicial. A reprodução do vídeo 4K é excelente, sem queda de quadros durante nosso teste de minutos. A utilização da GPU seria relativamente alta, com 60 por cento.
| DPC Latencies / LatencyMon - interrupt to process latency (max), Web, Youtube, Prime95 | |
| GMK NucBox K1 | |
| Beelink SEi10 | |
| Beelink U59 | |
| Intel NUC11TNKi5 | |
* ... menor é melhor
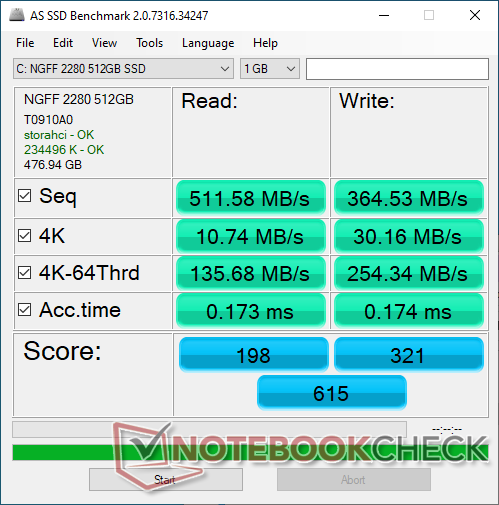
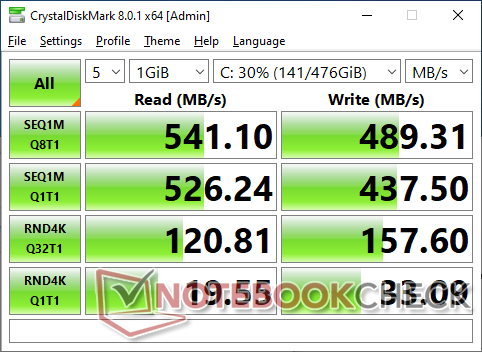
Dispositivos de armazenamento
Nossa unidade de teste vem com um 512 GB AZW M.2 2280 SSD SSD SATA III que é uma marca relativamente desconhecida, com probabilidade de economizar em custos. A maioria dos outros PCs utiliza marcas SSD mais conhecidas, tais como Samsung, Intel, Kingston ou outras. No entanto, as taxas de transferência são excelentes para um drive SATA III com taxas de leitura e escrita sequenciais de cerca de 500 MB/s cada.

| Drive Performance rating - Percent | |
| Beelink SEi10 | |
| Zotac ZBOX MI642 Nano | |
| Intel NUC11TNKi5 | |
| Beelink U59 | |
| GMK NucBox K1 | |
| DiskSpd | |
| seq read | |
| Beelink SEi10 | |
| Intel NUC11TNKi5 | |
| Zotac ZBOX MI642 Nano | |
| Beelink U59 | |
| GMK NucBox K1 | |
| seq write | |
| Beelink SEi10 | |
| Zotac ZBOX MI642 Nano | |
| Intel NUC11TNKi5 | |
| Beelink U59 | |
| GMK NucBox K1 | |
| seq q8 t1 read | |
| Beelink SEi10 | |
| Intel NUC11TNKi5 | |
| Zotac ZBOX MI642 Nano | |
| Beelink U59 | |
| GMK NucBox K1 | |
| seq q8 t1 write | |
| Beelink SEi10 | |
| Zotac ZBOX MI642 Nano | |
| Intel NUC11TNKi5 | |
| GMK NucBox K1 | |
| Beelink U59 | |
| 4k q1 t1 read | |
| Beelink SEi10 | |
| Zotac ZBOX MI642 Nano | |
| Intel NUC11TNKi5 | |
| Beelink U59 | |
| GMK NucBox K1 | |
| 4k q1 t1 write | |
| Beelink SEi10 | |
| Zotac ZBOX MI642 Nano | |
| GMK NucBox K1 | |
| Intel NUC11TNKi5 | |
| Beelink U59 | |
| 4k q32 t16 read | |
| Beelink SEi10 | |
| Zotac ZBOX MI642 Nano | |
| Intel NUC11TNKi5 | |
| Beelink U59 | |
| GMK NucBox K1 | |
| 4k q32 t16 write | |
| Beelink SEi10 | |
| Intel NUC11TNKi5 | |
| Zotac ZBOX MI642 Nano | |
| GMK NucBox K1 | |
| Beelink U59 | |
| AS SSD | |
| Score Total | |
| Zotac ZBOX MI642 Nano | |
| Beelink SEi10 | |
| Intel NUC11TNKi5 | |
| Beelink U59 | |
| GMK NucBox K1 | |
| Score Read | |
| Beelink SEi10 | |
| Zotac ZBOX MI642 Nano | |
| Intel NUC11TNKi5 | |
| Beelink U59 | |
| GMK NucBox K1 | |
| Score Write | |
| Intel NUC11TNKi5 | |
| Zotac ZBOX MI642 Nano | |
| Beelink U59 | |
| Beelink SEi10 | |
| GMK NucBox K1 | |
| Seq Read | |
| Beelink SEi10 | |
| Intel NUC11TNKi5 | |
| Beelink U59 | |
| Zotac ZBOX MI642 Nano | |
| GMK NucBox K1 | |
| Seq Write | |
| Intel NUC11TNKi5 | |
| Zotac ZBOX MI642 Nano | |
| GMK NucBox K1 | |
| Beelink U59 | |
| Beelink SEi10 | |
| 4K Read | |
| Zotac ZBOX MI642 Nano | |
| Beelink SEi10 | |
| Intel NUC11TNKi5 | |
| Beelink U59 | |
| GMK NucBox K1 | |
| 4K Write | |
| Zotac ZBOX MI642 Nano | |
| Beelink SEi10 | |
| GMK NucBox K1 | |
| Intel NUC11TNKi5 | |
| Beelink U59 | |
| 4K-64 Read | |
| Zotac ZBOX MI642 Nano | |
| Beelink SEi10 | |
| Intel NUC11TNKi5 | |
| Beelink U59 | |
| GMK NucBox K1 | |
| 4K-64 Write | |
| Intel NUC11TNKi5 | |
| Beelink U59 | |
| Zotac ZBOX MI642 Nano | |
| Beelink SEi10 | |
| GMK NucBox K1 | |
| Access Time Read | |
| GMK NucBox K1 | |
| Beelink U59 | |
| Intel NUC11TNKi5 | |
| Zotac ZBOX MI642 Nano | |
| Beelink SEi10 | |
| Access Time Write | |
| Beelink SEi10 | |
| GMK NucBox K1 | |
| Intel NUC11TNKi5 | |
| Beelink U59 | |
| Zotac ZBOX MI642 Nano | |
* ... menor é melhor
Disk Throttling: DiskSpd Read Loop, Queue Depth 8
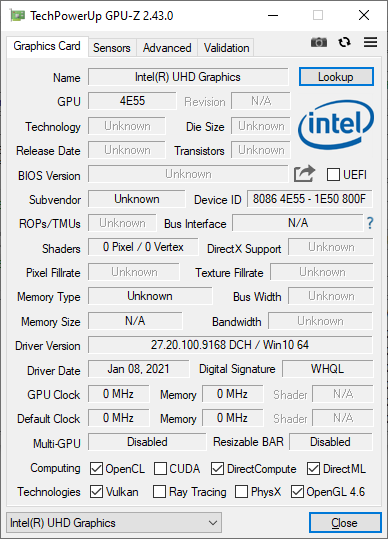
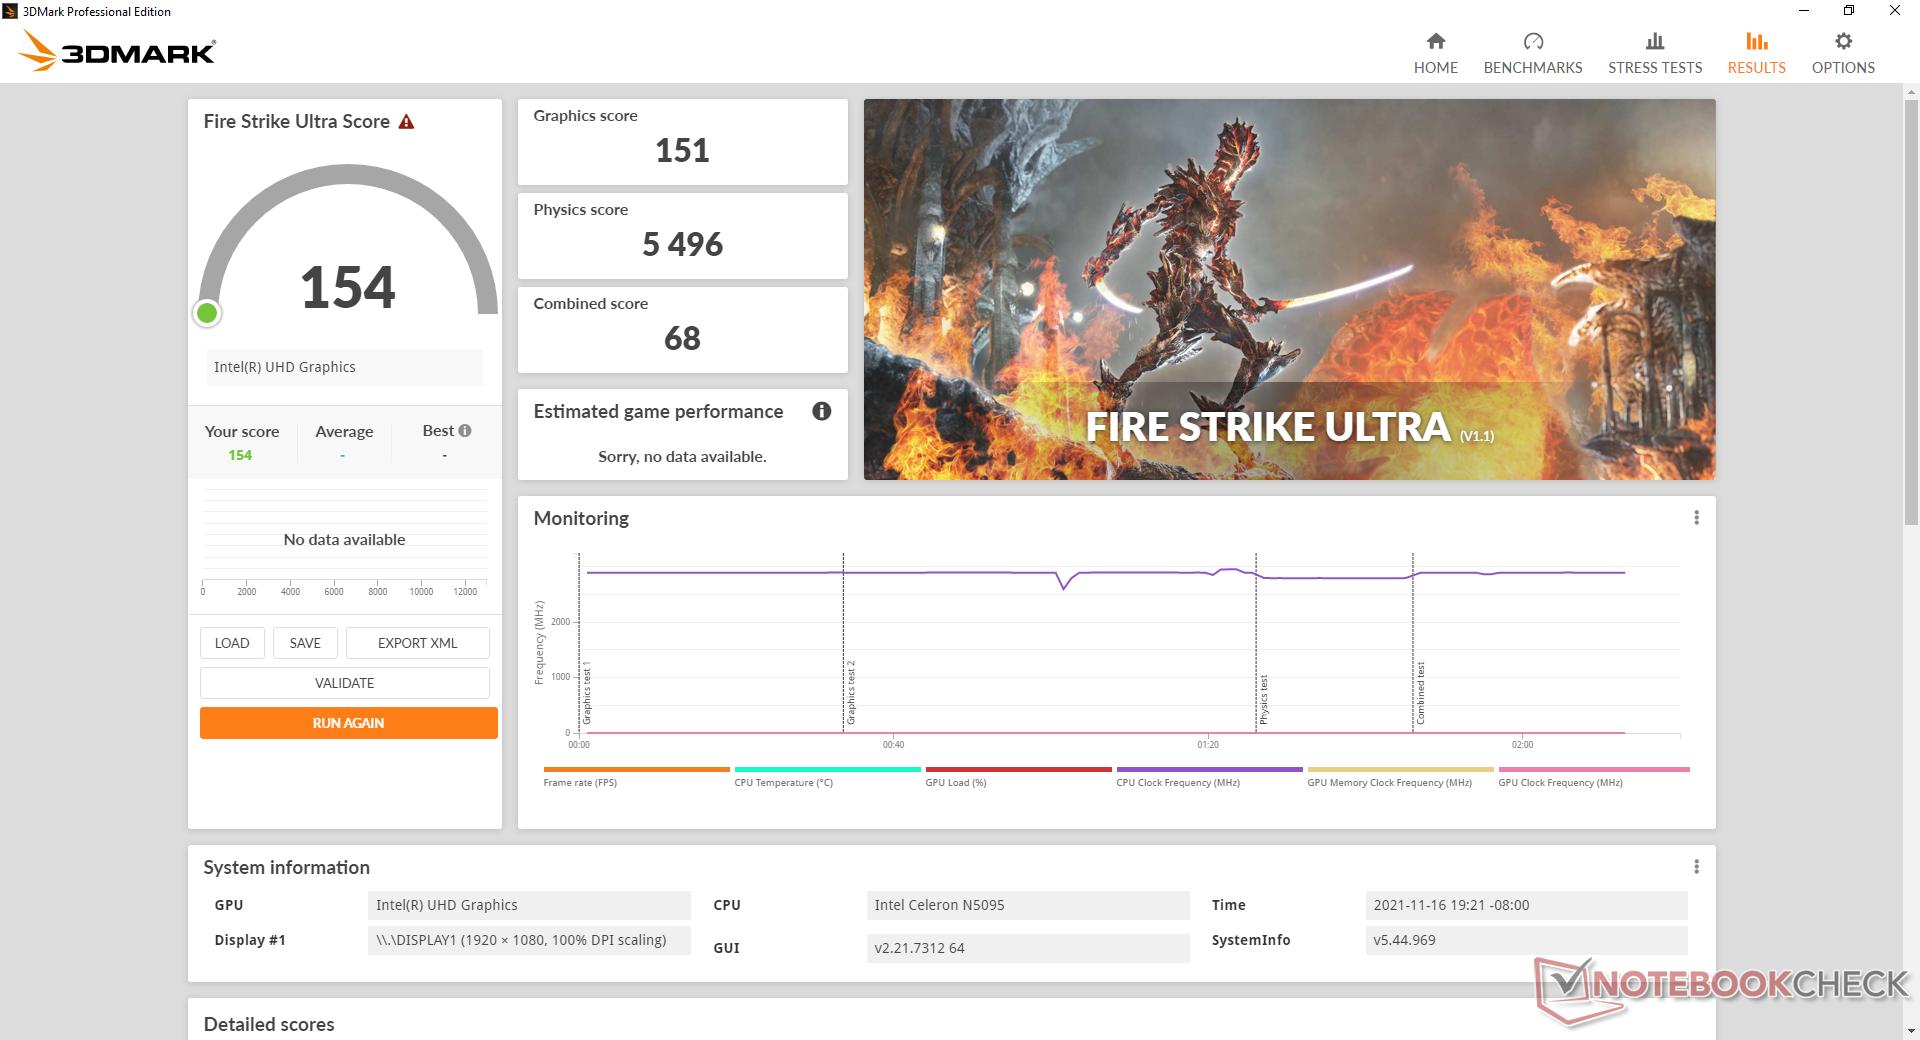
Desempenho da GPU
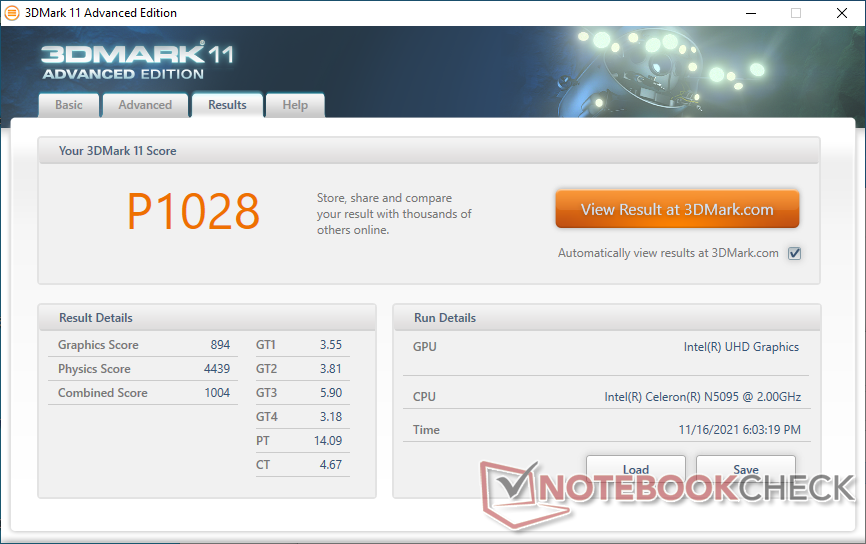
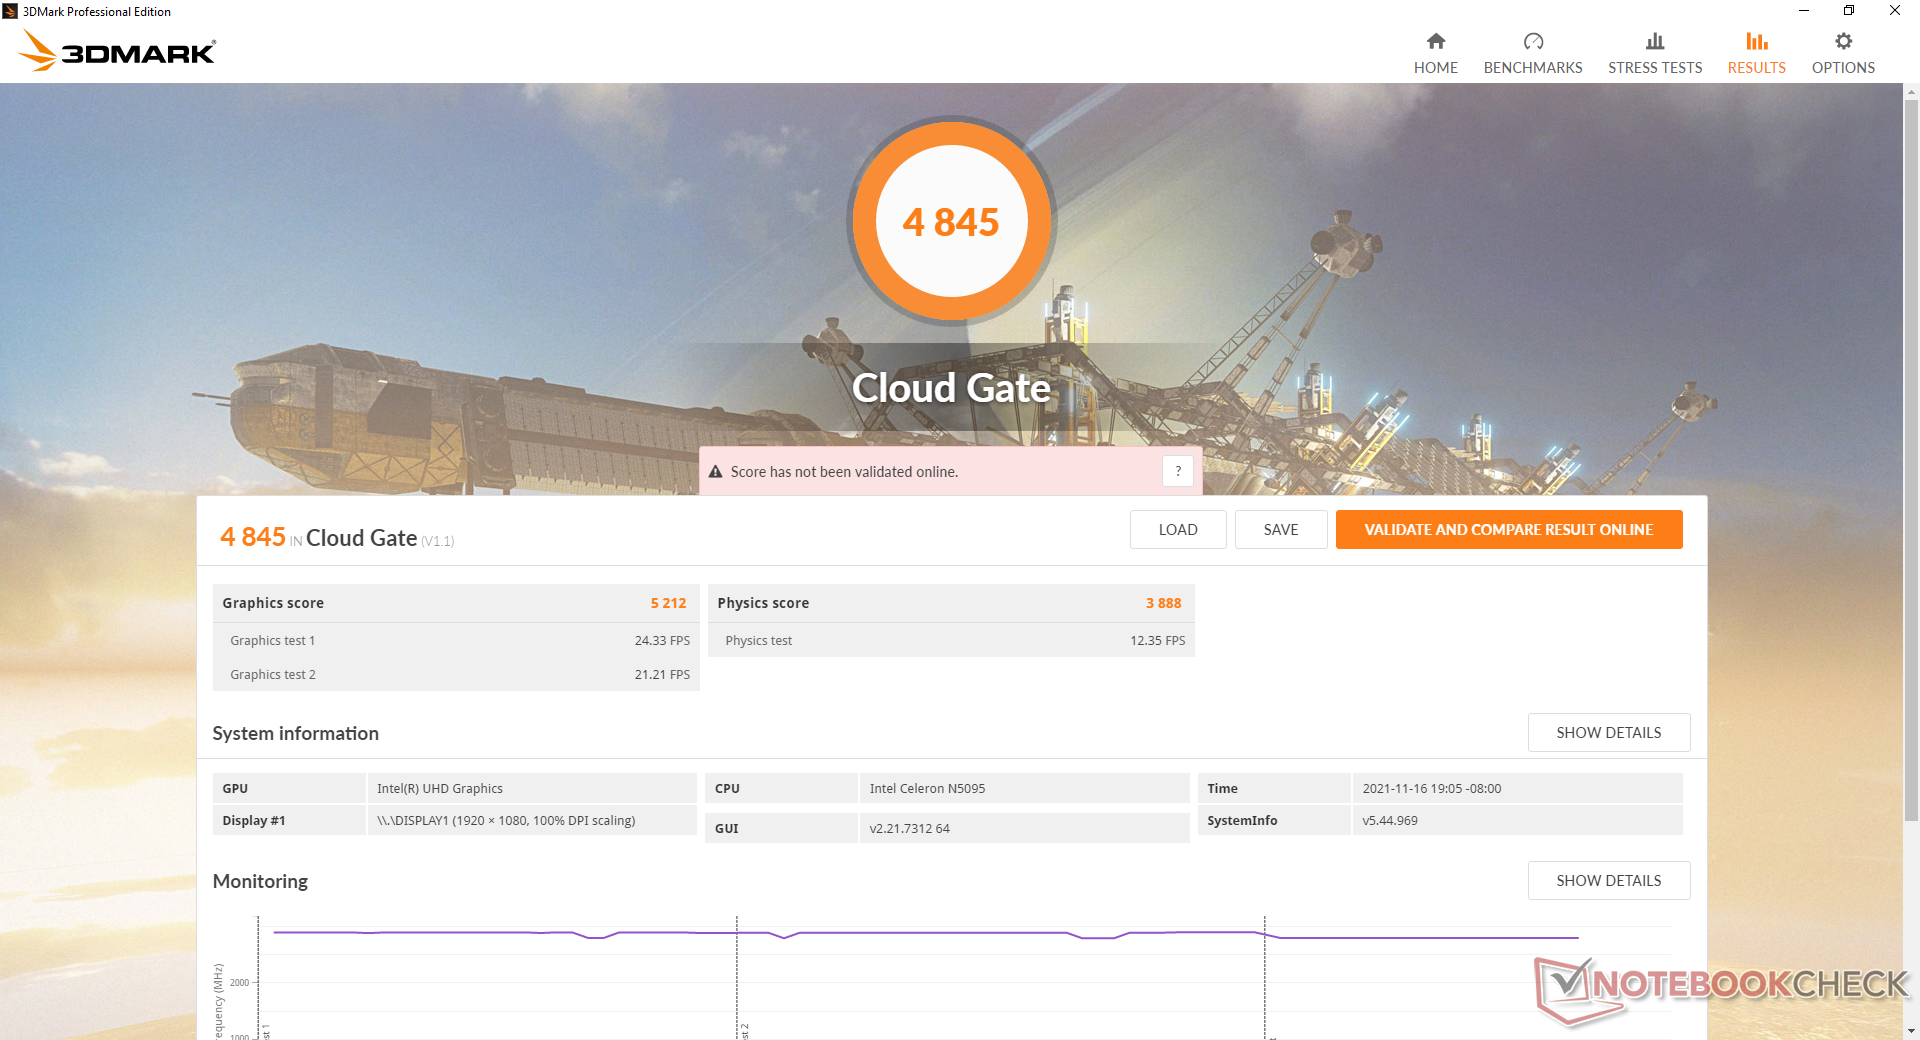
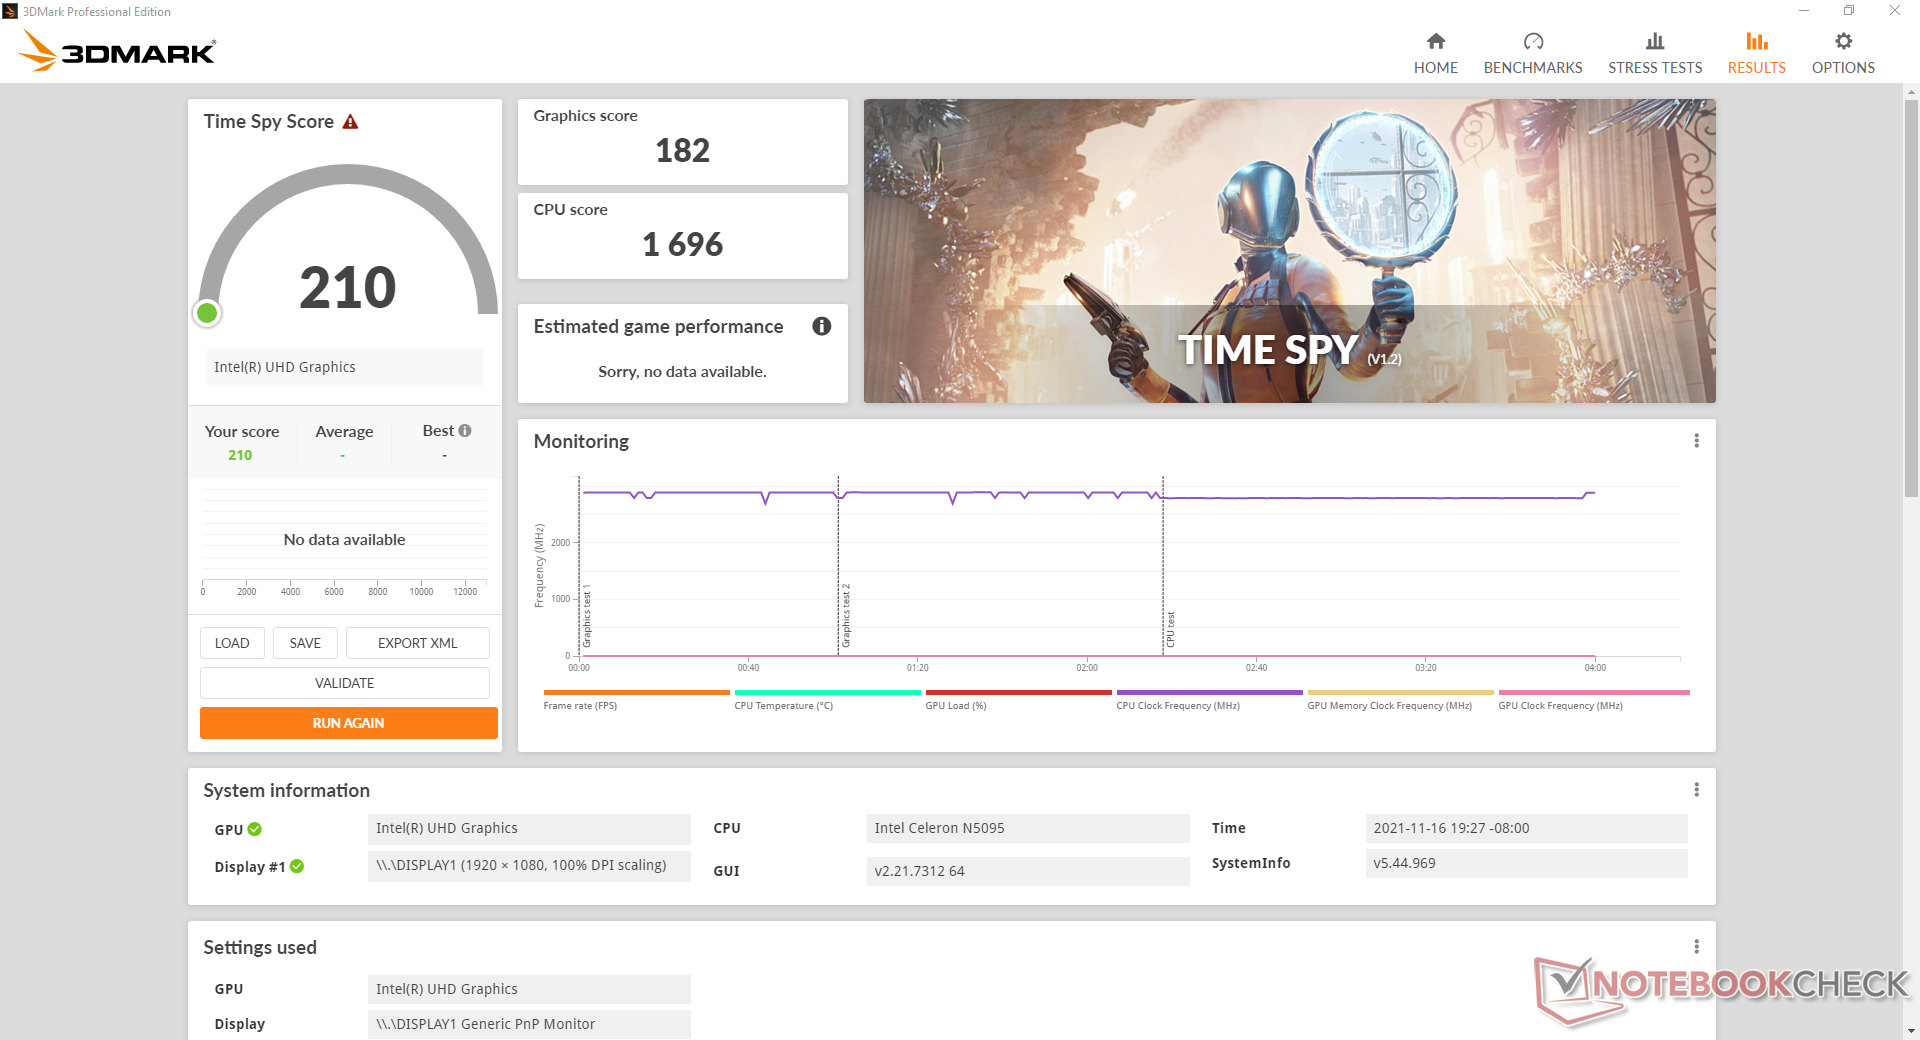
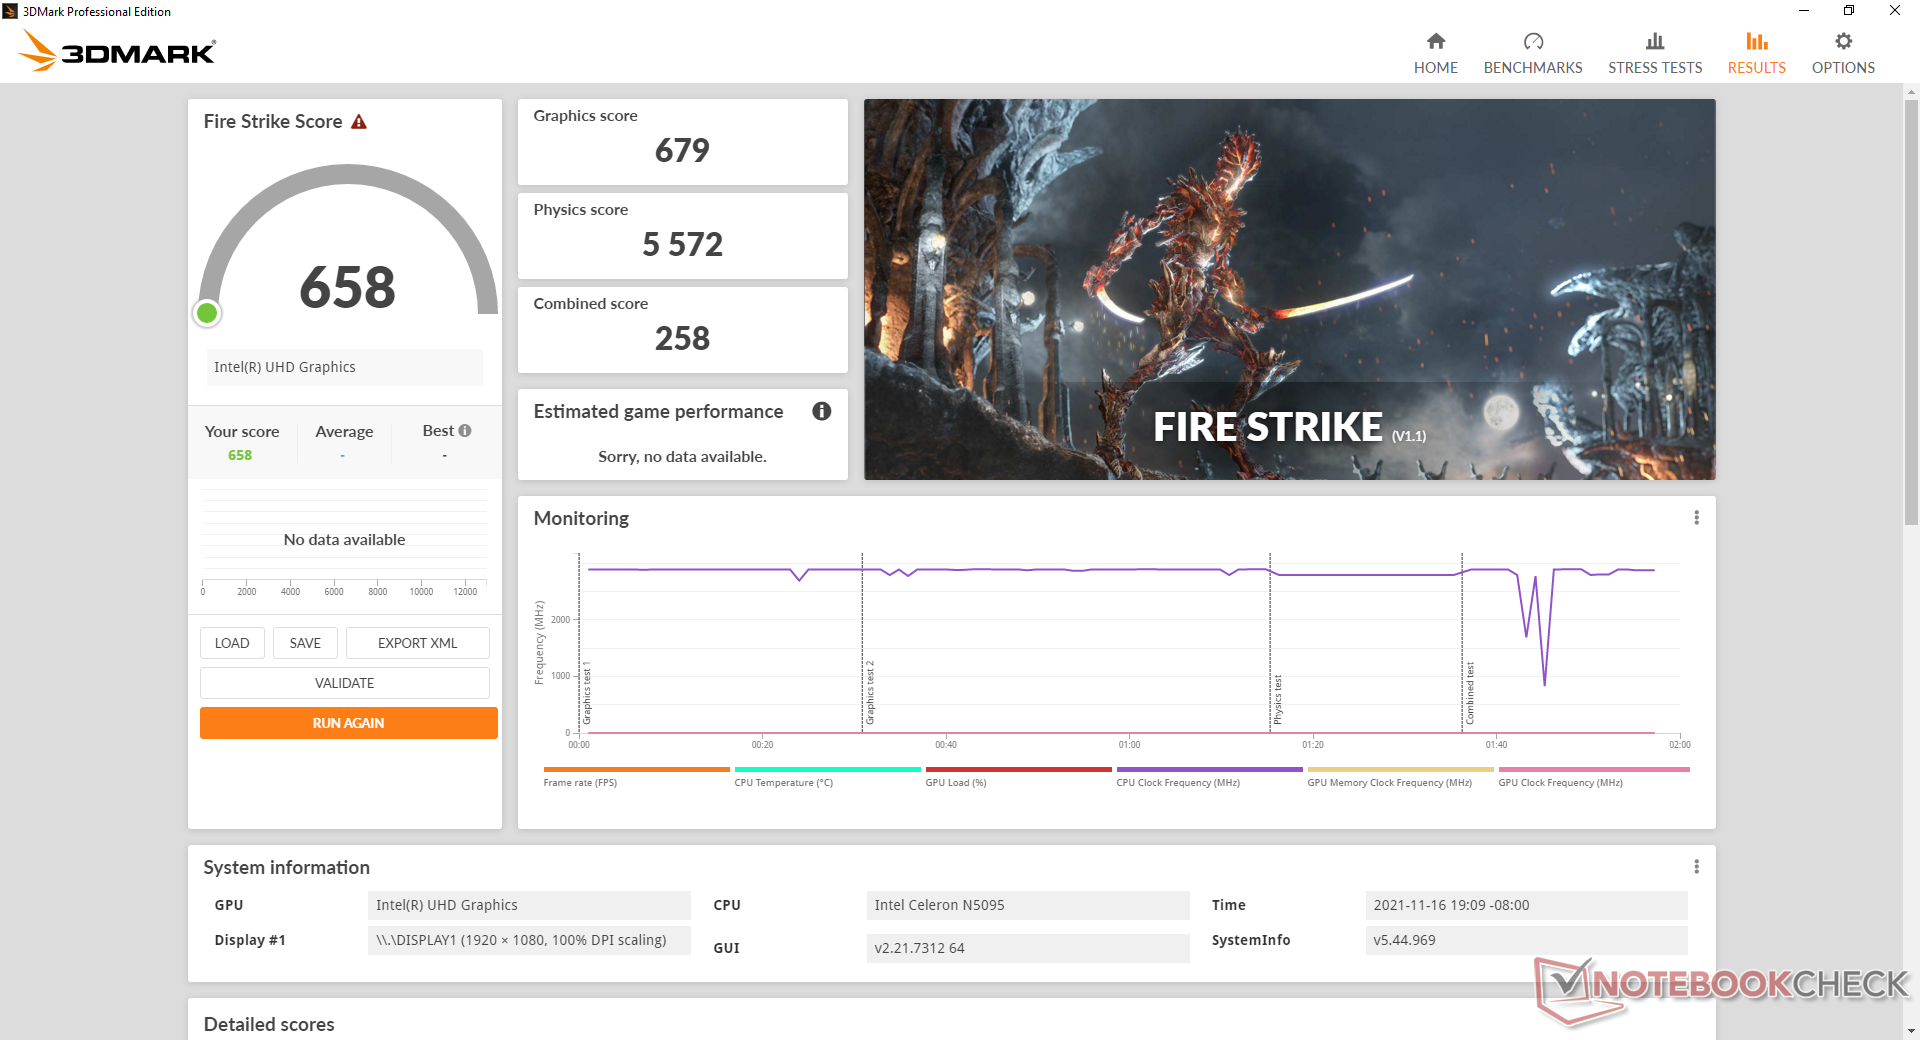
O desempenho gráfico é cerca de 40% a 50% mais lento do que o comum UHD Graphics 620 encontrados em laptops e mini PCs mais antigos antes do advento do Iris Xe. Embora capaz de transmitir, não espere que a maioria dos jogos nativos corra bem.
| 3DMark Performance rating - Percent | |
| Intel NUC11TNKi5 | |
| Intel NUC8i7BE | |
| Zotac ZBOX MI642 Nano -3! | |
| Prime Computer PrimeMini 5 i7 NUC8v7PNB | |
| Beelink SEi10 | |
| Beelink U59 | |
| Média Intel UHD Graphics (Jasper Lake 16 EU) | |
| Chuwi LapBook Plus -1! | |
| Blackview AceBook 1 -2! | |
| Asus BR1100FKA-BP0109RA | |
| GMK NucBox K1 | |
| Jumper Tech Ez Book X3 Air -1! | |
| 3DMark 11 - 1280x720 Performance GPU | |
| Intel NUC11TNKi5 | |
| Intel NUC8i7BE | |
| Prime Computer PrimeMini 5 i7 NUC8v7PNB | |
| Beelink SEi10 | |
| Beelink U59 | |
| Média Intel UHD Graphics (Jasper Lake 16 EU) (554 - 894, n=8) | |
| Chuwi LapBook Plus | |
| Jumper Tech Ez Book X3 Air | |
| GMK NucBox K1 | |
| Blackview AceBook 1 | |
| Asus BR1100FKA-BP0109RA | |
| 3DMark 11 Performance | 1028 pontos | |
| 3DMark Cloud Gate Standard Score | 4845 pontos | |
| 3DMark Fire Strike Score | 658 pontos | |
| 3DMark Time Spy Score | 210 pontos | |
Ajuda | ||
Witcher 3 FPS Chart
| baixo | média | alto | ultra | |
|---|---|---|---|---|
| The Witcher 3 (2015) | 14 | |||
| Dota 2 Reborn (2015) | 57.3 | 26.6 | 12 | 11.2 |
| Final Fantasy XV Benchmark (2018) | 7.17 | |||
| X-Plane 11.11 (2018) | 10.8 | 9.18 | 8.62 |
Emissões
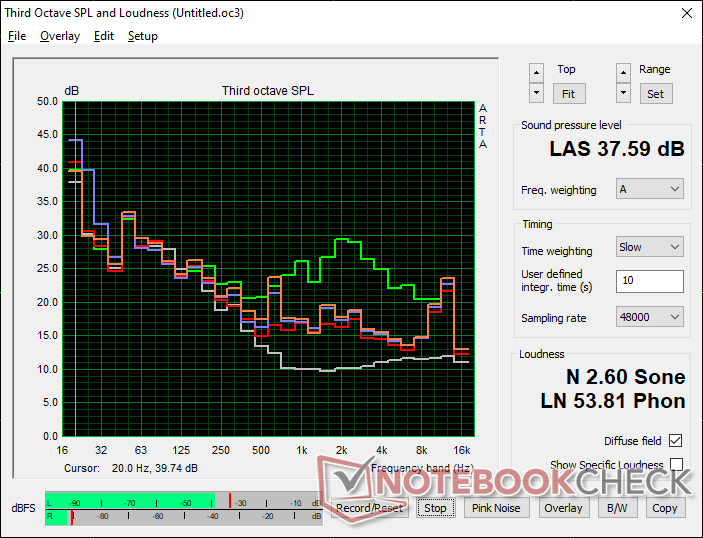
Ruído do sistema
O ventilador interno é silencioso a 24,5 dB(A) quando o sistema não está rodando nenhuma aplicação. Na maioria das vezes, no entanto, os usuários provavelmente estarão fazendo streaming de vídeo ou navegação na web e, portanto, o ventilador ocasionalmente saltará para 28,6 dB(A) ou 30,4 dB(A). Outros mini PCs são muito mais altos, incluindo o próprio SEi10 da Beelink.
O Running Prime95 induz um ruído máximo do ventilador de 37,6 dB(A) a ser perceptível, mas não distrai em um ambiente HTPC.
Barulho
| Ocioso |
| 24.5 / 24.5 / 28.6 dB |
| Carga |
| 29.7 / 37.6 dB |
 | ||
30 dB silencioso 40 dB(A) audível 50 dB(A) ruidosamente alto |
||
min: | ||
| Beelink U59 UHD Graphics (Jasper Lake 16 EU), Celeron N5095, Silicon Motion AZW 512G NV428 | Intel NUC11TNKi5 Iris Xe G7 80EUs, i5-1135G7, Transcend M.2 SSD 430S TS512GMTS430S | Intel NUC8i7BE Iris Plus Graphics 655, i7-8559U | Beelink SEi10 UHD Graphics G1 (Ice Lake 32 EU), i3-1005G1, Silicon Motion AZW 256G M.2280 NVMe 4X 200725 D | Zotac ZBOX MI642 Nano UHD Graphics 620, i5-10210U, Western Digital WD Blue 3D WDBNCE5000PNC | GMK NucBox K1 UHD Graphics 600, Celeron J4125, HIKVision C100 NGFF SSD 128GB | |
|---|---|---|---|---|---|---|
| Noise | -27% | -19% | -27% | -24% | -20% | |
| desligado / ambiente * (dB) | 24.5 | 24.8 -1% | 28.7 -17% | 27.5 -12% | 27.8 -13% | 27.8 -13% |
| Idle Minimum * (dB) | 24.5 | 35.6 -45% | 28.7 -17% | 30.9 -26% | 27.8 -13% | 27.8 -13% |
| Idle Average * (dB) | 24.5 | 35.6 -45% | 29.3 -20% | 33.5 -37% | 33.9 -38% | 27.8 -13% |
| Idle Maximum * (dB) | 28.6 | 35.6 -24% | 31.8 -11% | 33.5 -17% | 33.9 -19% | 27.8 3% |
| Load Average * (dB) | 29.7 | 36.2 -22% | 39 -31% | 38.5 -30% | 43.7 -47% | 46.8 -58% |
| Witcher 3 ultra * (dB) | 30.4 | 38 -25% | 39 -28% | |||
| Load Maximum * (dB) | 37.6 | 47.6 -27% | 41.4 -10% | 51.6 -37% | 43.7 -16% | 46.8 -24% |
* ... menor é melhor
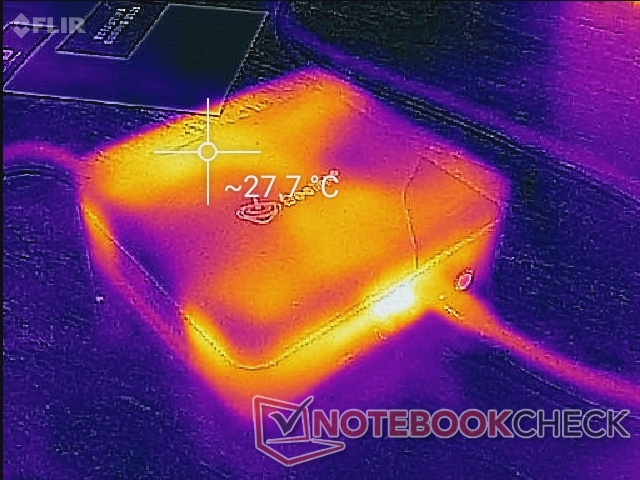
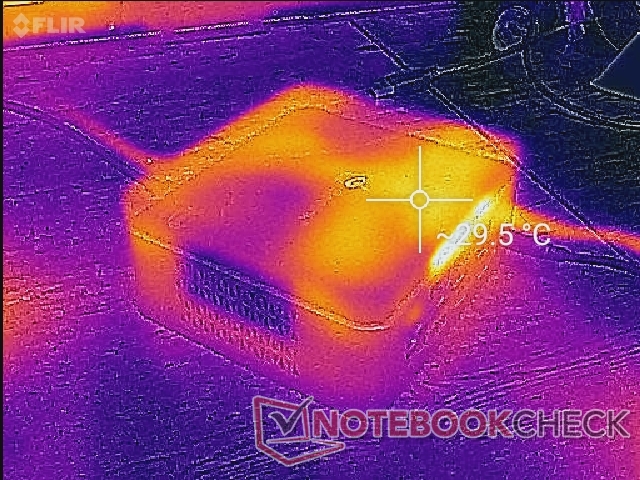
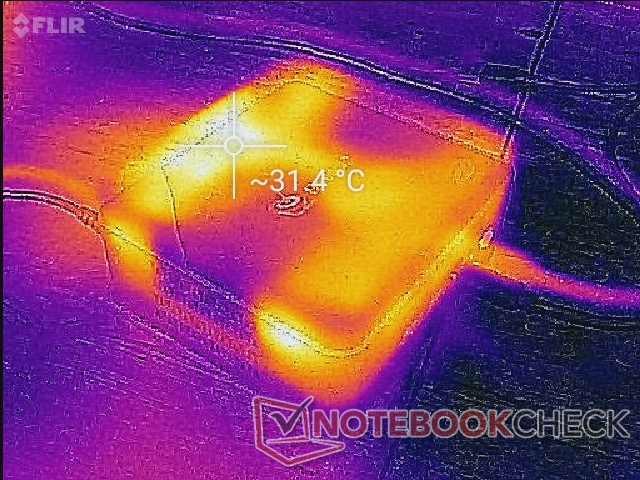
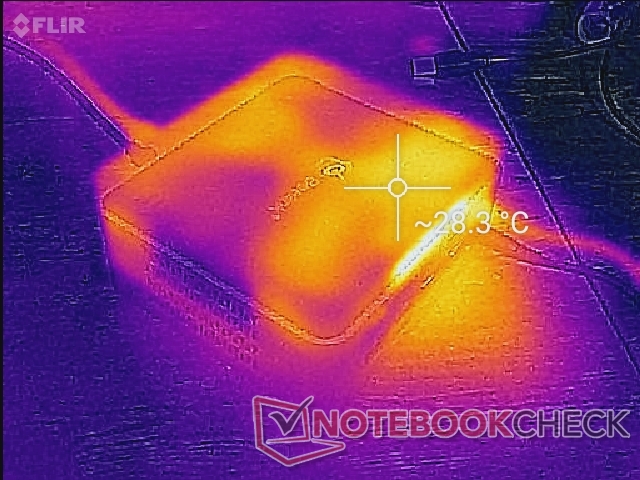
Temperatura
As temperaturas não são um problema no U59. Os pontos quentes quase não são mais quentes, mesmo quando o sistema está totalmente estressado.
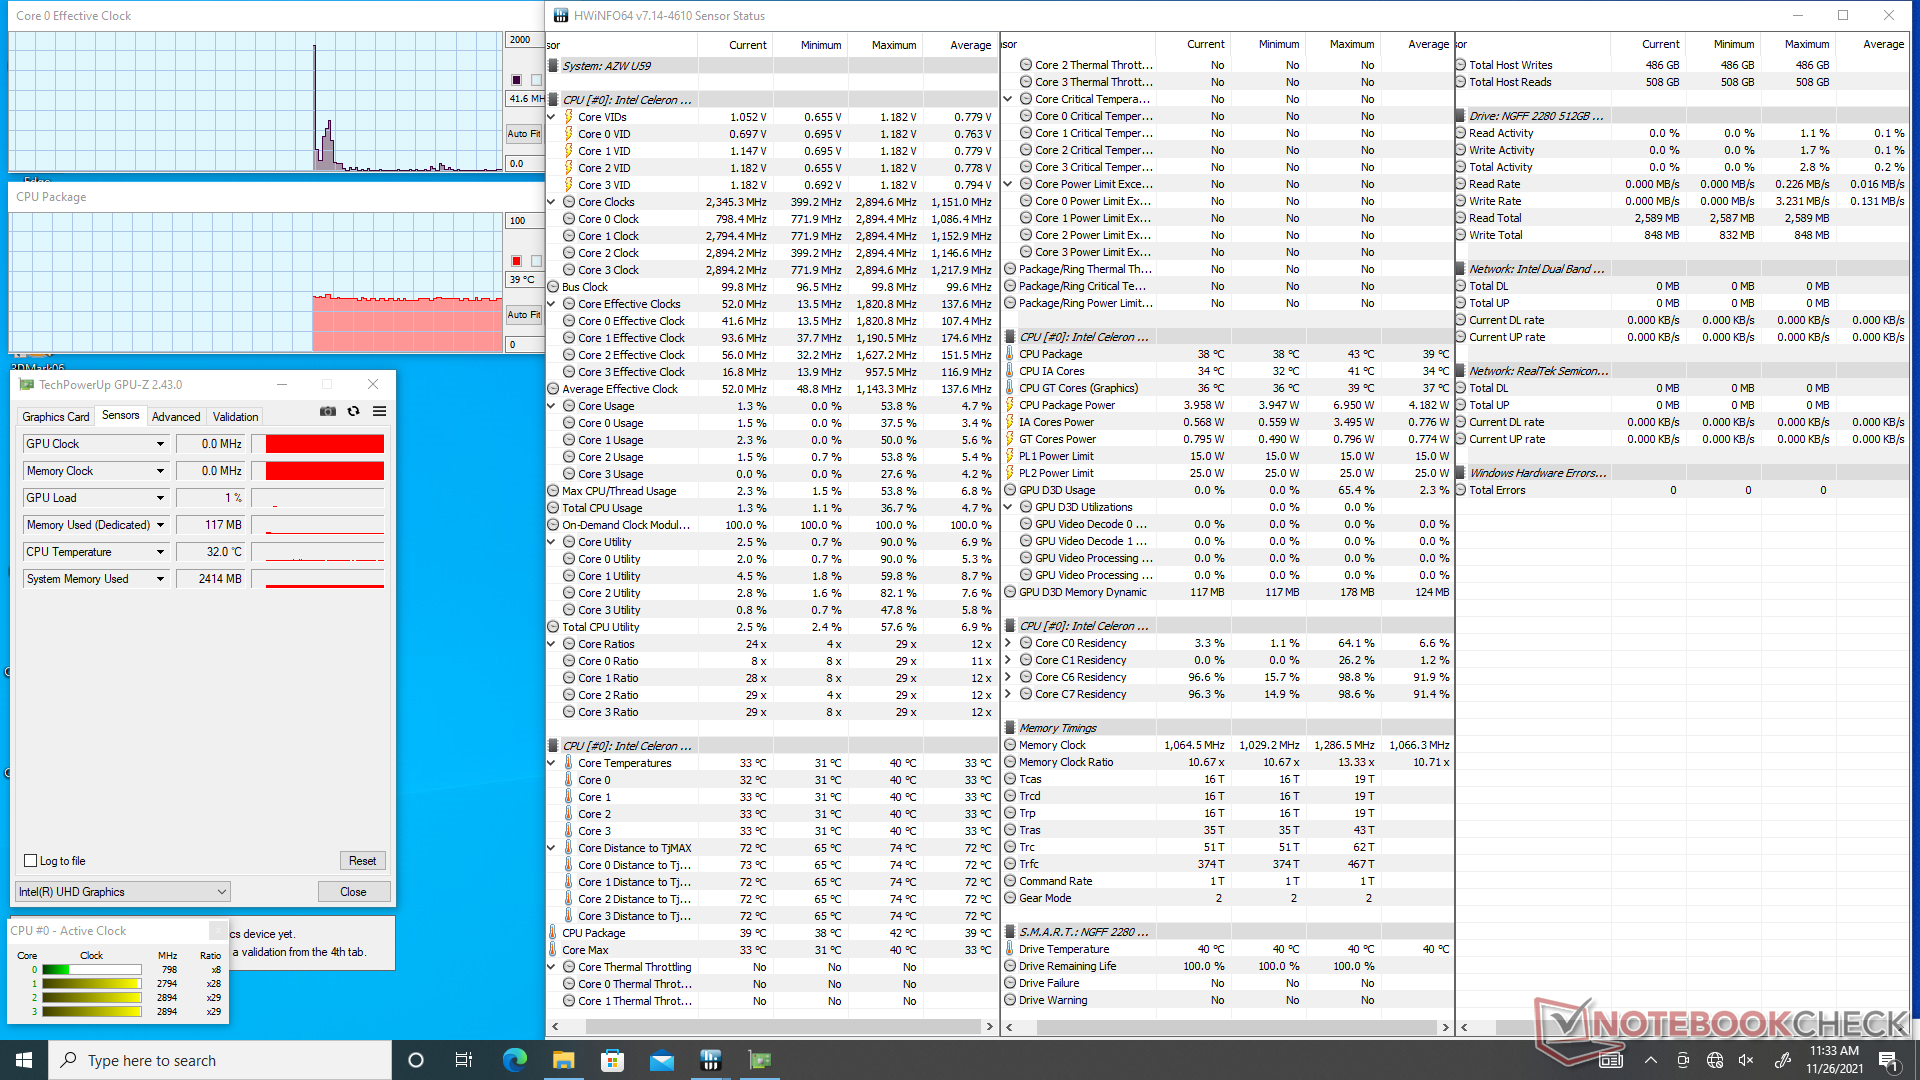
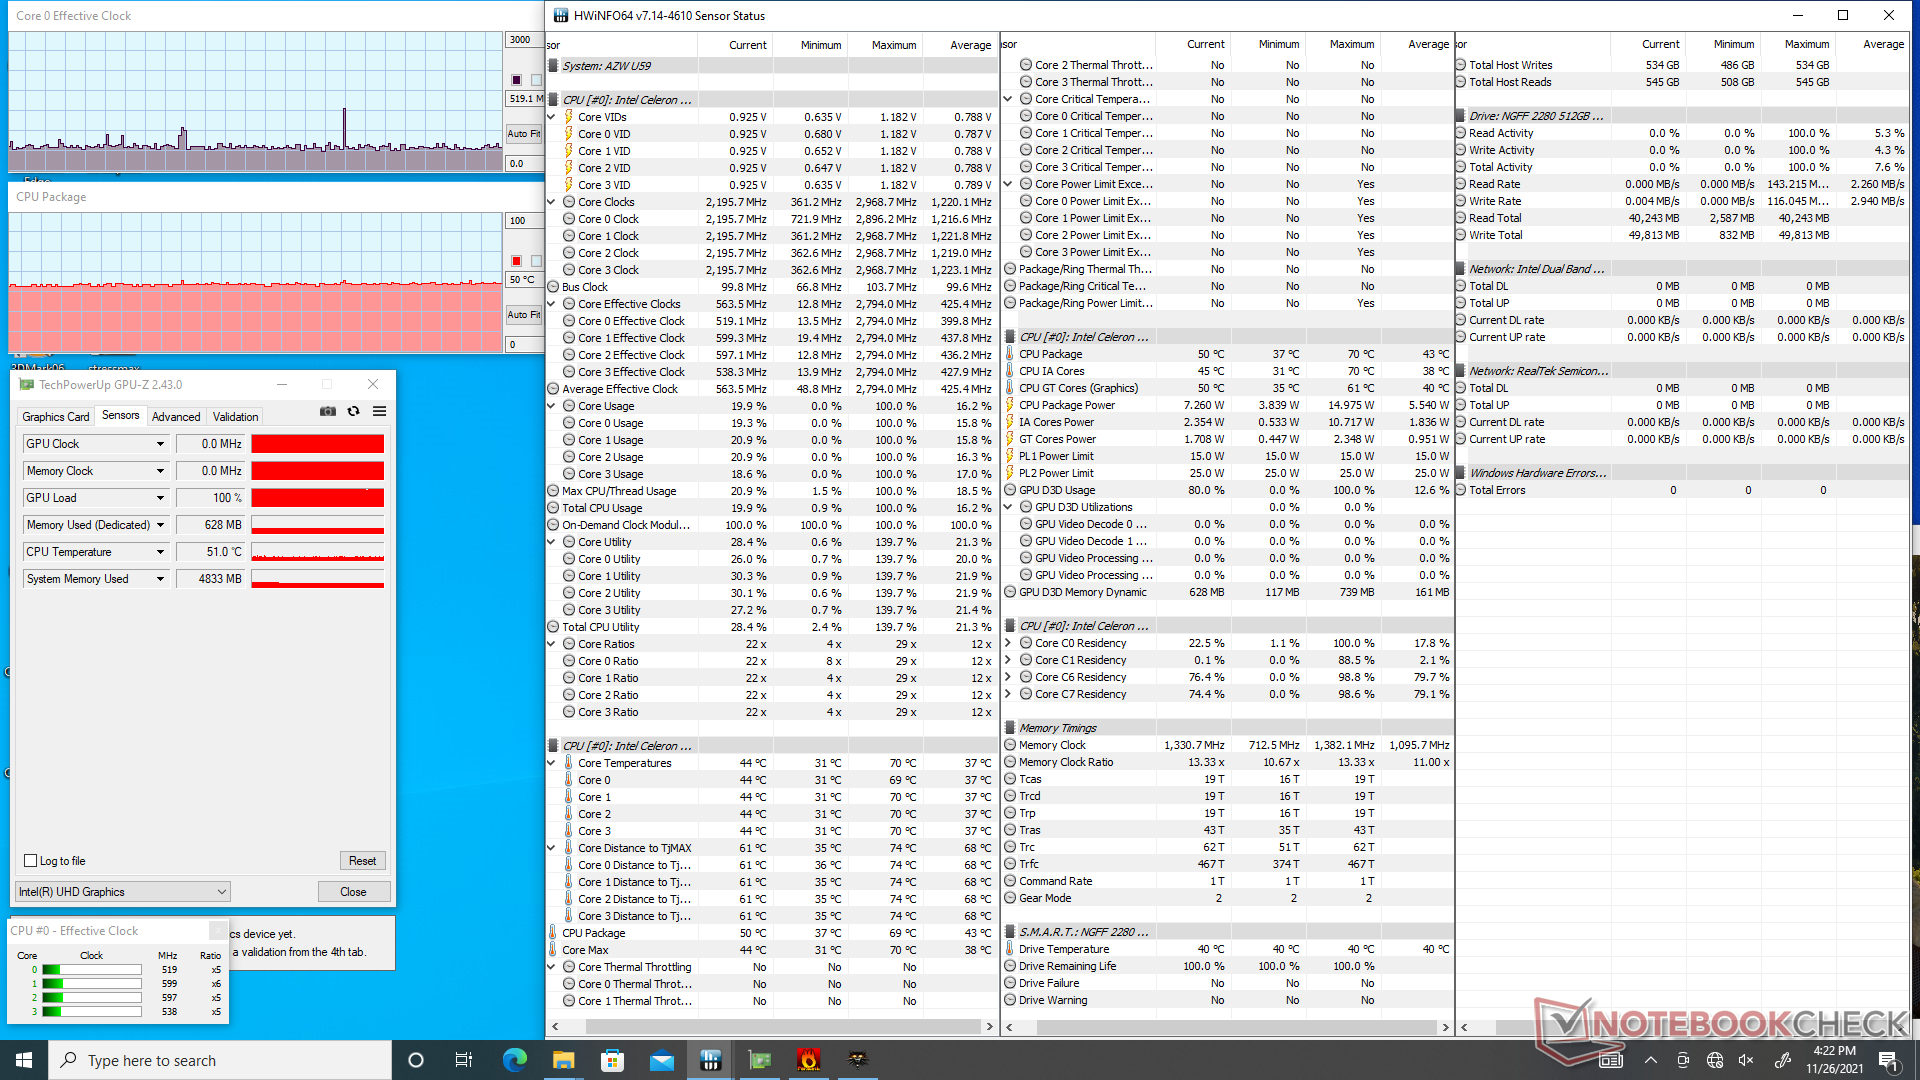
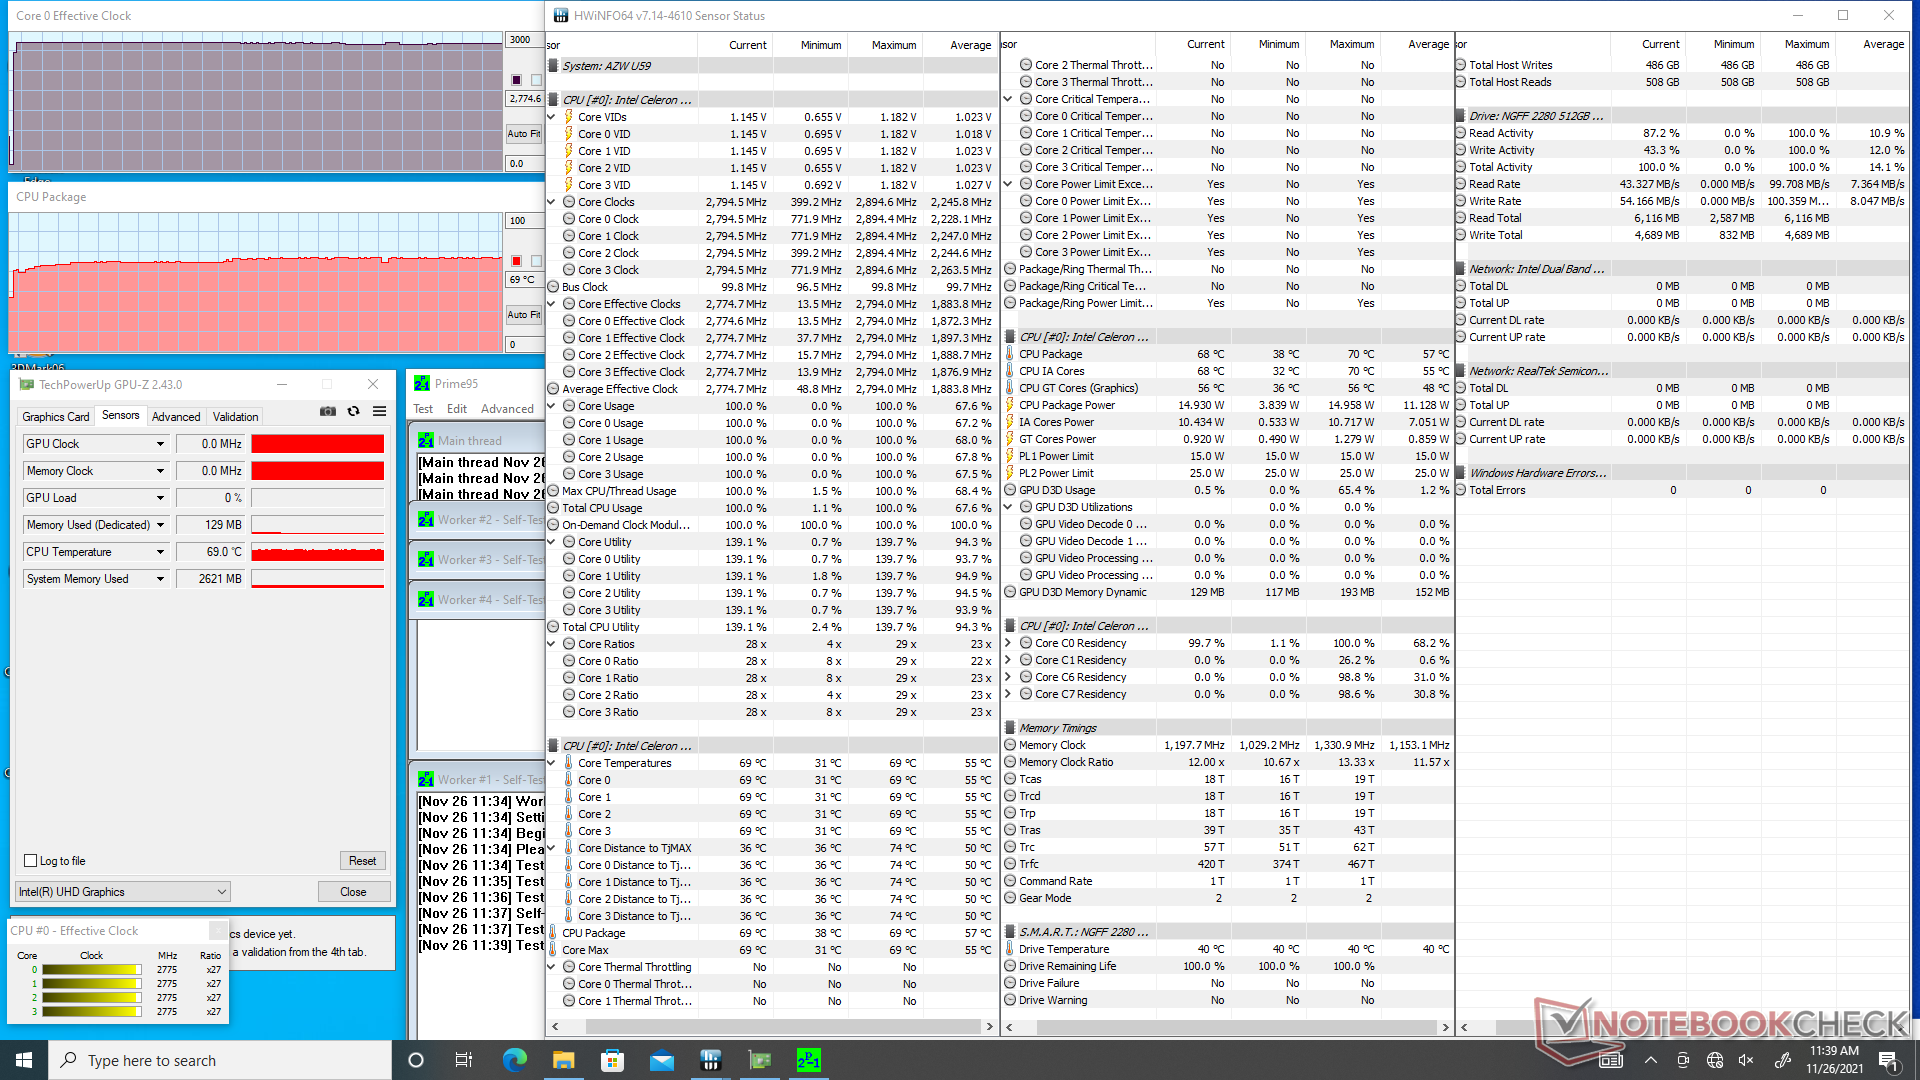
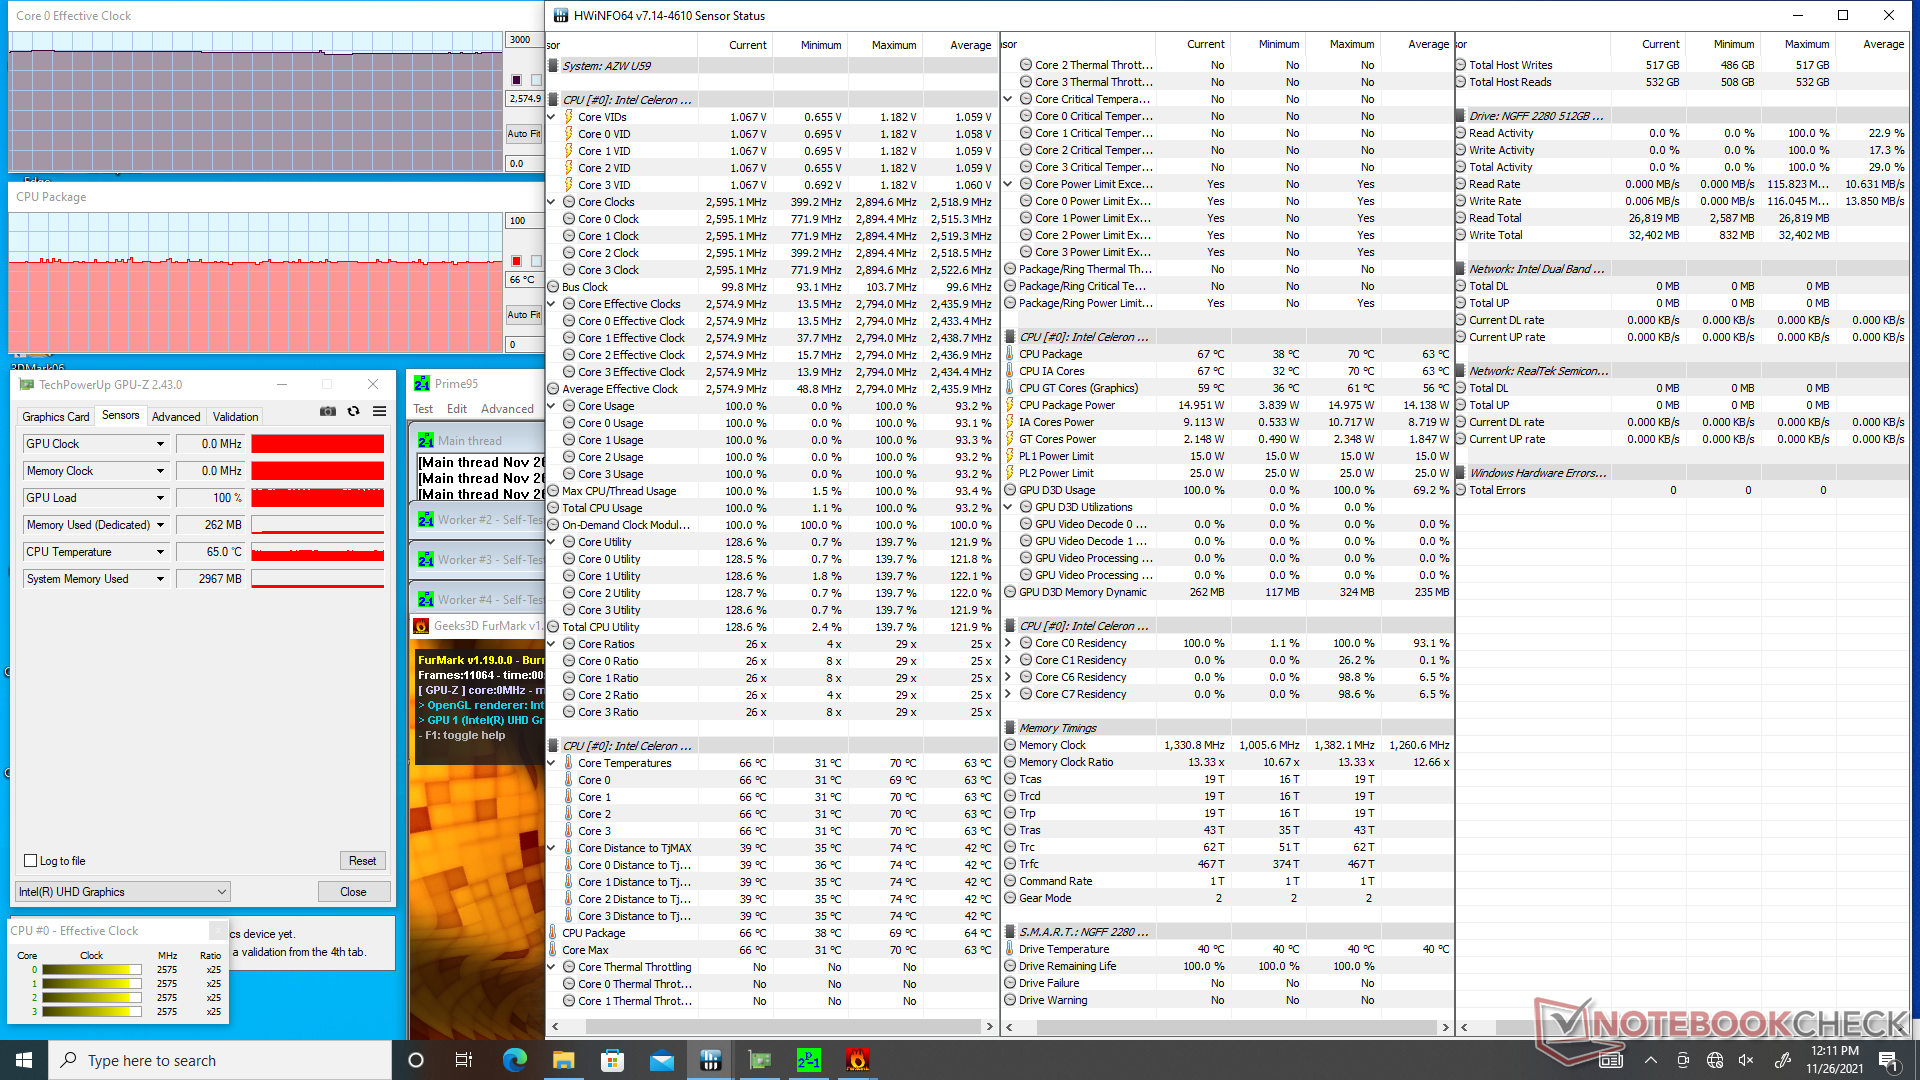
Teste de estresse
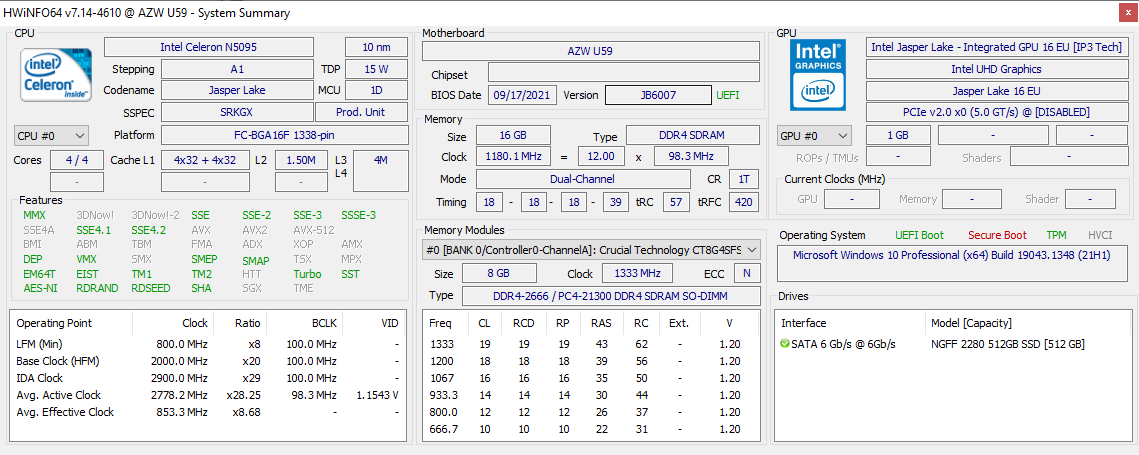
A CPU se estabilizaria em 2,8 GHz e 69 C quando sob estresse Prime95. O fato de o sistema utilizar um ventilador ativo para refrigeração é provavelmente responsável pelas temperaturas mais baixas do que o esperado e pelo desempenho estável ao longo do tempo. HWiNFO relata níveis PL1 e PL2 de 15 W e 25 W, respectivamente, mas só somos capazes de atingir um estável 15 W quando executamos cargas tão extremas. Executando este mesmo teste no Core i3-powered Beelink SEi10 resultaria em uma temperatura central significativamente mais quente de 90 C
| RelógioCPU (GHz) | RelógioGPU (MHz) | Temperaturamédiada CPU (°C) | |
| System Idle | -- | --39 | |
| Prime95 Stress | 2.8 | ----69 | |
| Prime95 + FurMark Stress | 2.6 | ----66 | |
| Witcher 3 Stress | 0.5 | ----50 |
Gestão de energia
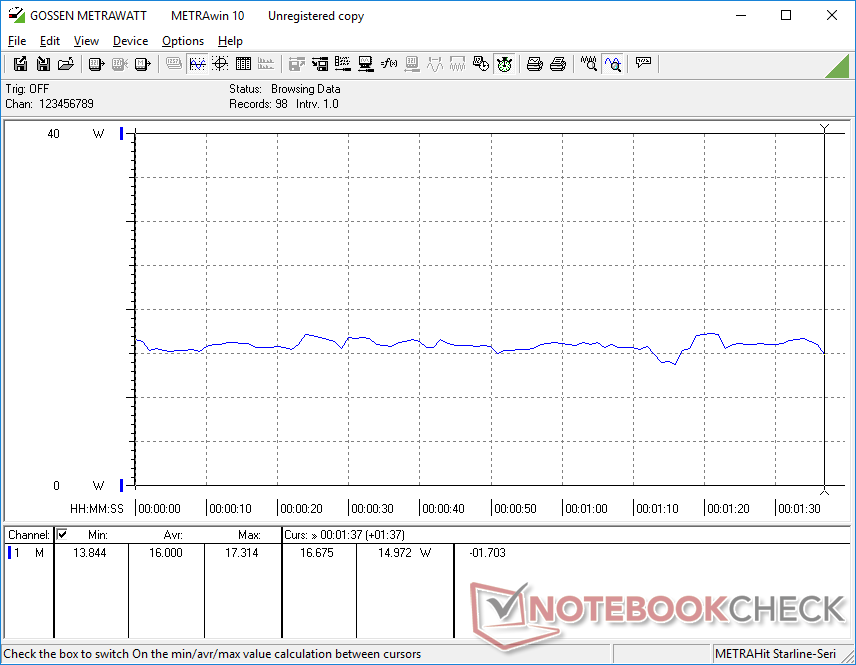
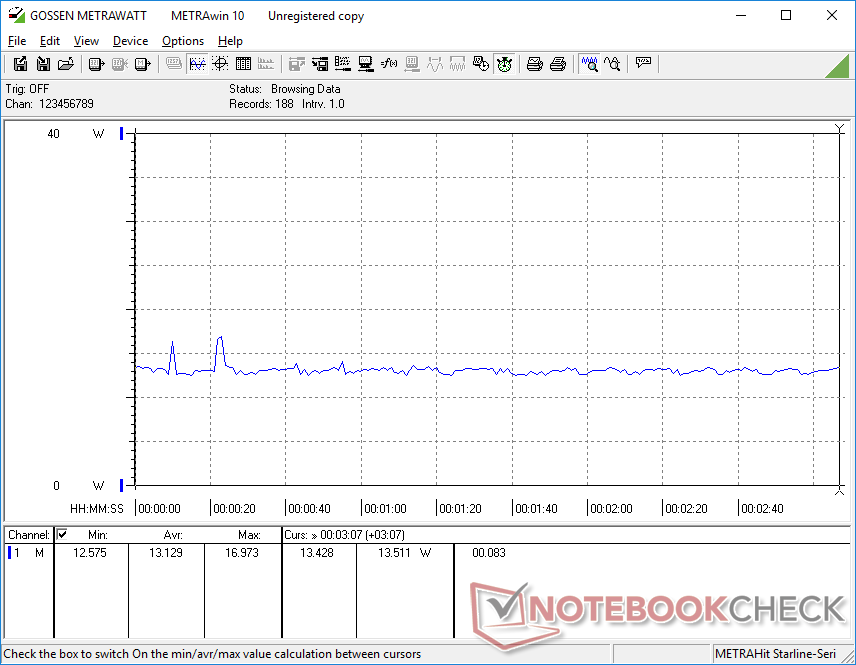
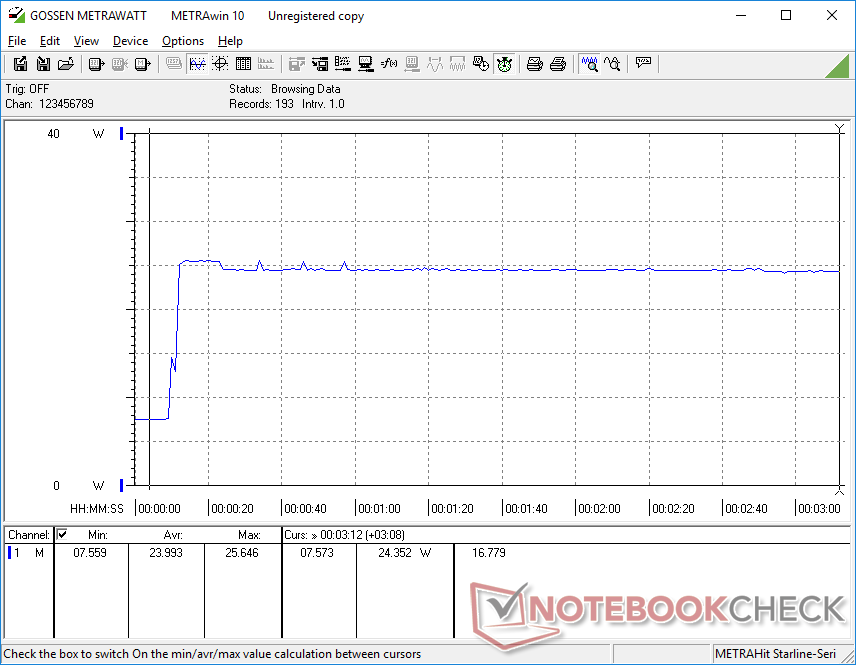
Consumo de energia
A manipulação no desktop sem aplicações em execução consumiria mais do que o esperado em torno de 7 W, enquanto que a Intel NUC8 ou GMK NucBox K1 poderia consumir tão pouco quanto 3 W cada. Cargas maiores, como jogos, consumiriam muito menos em nossos U59 com apenas 13 W a 16 W em média, em comparação com 2x ou mais em mini PCs com GPUs mais rápidas UHD Graphics 620 ou Iris Xe.

| desligado | |
| Ocioso | |
| Carga |
|
Key:
min: | |
| Beelink U59 Celeron N5095, UHD Graphics (Jasper Lake 16 EU), Silicon Motion AZW 512G NV428, , x, | Intel NUC11TNKi5 i5-1135G7, Iris Xe G7 80EUs, Transcend M.2 SSD 430S TS512GMTS430S, , x, | Intel NUC8i7BE i7-8559U, Iris Plus Graphics 655, , , x, | Beelink SEi10 i3-1005G1, UHD Graphics G1 (Ice Lake 32 EU), Silicon Motion AZW 256G M.2280 NVMe 4X 200725 D, , x, | Zotac ZBOX MI642 Nano i5-10210U, UHD Graphics 620, Western Digital WD Blue 3D WDBNCE5000PNC, , x, | GMK NucBox K1 Celeron J4125, UHD Graphics 600, HIKVision C100 NGFF SSD 128GB, , x, | |
|---|---|---|---|---|---|---|
| Power Consumption | -135% | -102% | -26% | -67% | 34% | |
| Idle Minimum * (Watt) | 6.7 | 11.5 -72% | 2.7 60% | 6.3 6% | 8.9 -33% | 3.4 49% |
| Idle Average * (Watt) | 6.7 | 12.4 -85% | 3.1 54% | 6.6 1% | 9 -34% | 3.8 43% |
| Idle Maximum * (Watt) | 7.4 | 12.9 -74% | 6.3 15% | 6.7 9% | 9.9 -34% | 3.9 47% |
| Load Average * (Watt) | 16 | 40.7 -154% | 59.7 -273% | 25.9 -62% | 33 -106% | 12.5 22% |
| Witcher 3 ultra * (Watt) | 13.1 | 43.9 -235% | 47.2 -260% | |||
| Load Maximum * (Watt) | 25.6 | 73.5 -187% | 78 -205% | 46.7 -82% | 58 -127% | 22.7 11% |
* ... menor é melhor
Power Consumption Witcher 3 / Stresstest
Power Consumption external Monitor
Pro
Contra
Veredicto
O baixo preço de US$ 279 a US$ 349 completos com RAM, armazenamento e Windows 11 Pro é o ponto de venda mais convincente do Beelink U59. O desempenho por dólar é visivelmente maior do que a geração anterior de mini PCs Celeron também por até 2x a 2,5x em termos de desempenho multi-tarefa ou 50% em termos de desempenho de uma única linha e gráficos. Apreciamos que ambos os compartimentos de armazenamento, ambos os slots de RAM e o módulo WLAN são facilmente acessíveis e atualizáveis, o que significa que os compradores interessados não precisam sair para a configuração superior se não se importarem em atualizar tais componentes eles mesmos.
Não é bem um Core i3, mas o Jasper Lake Celeron N5095 está pelo menos muito mais próximo de um do que qualquer outra CPUs Celeron móvel antes dele. O Beelink U59 oferece um desempenho notavelmente melhor do que a maioria dos outros mini PCs na faixa de preços de US$ 200 a US$ 350.
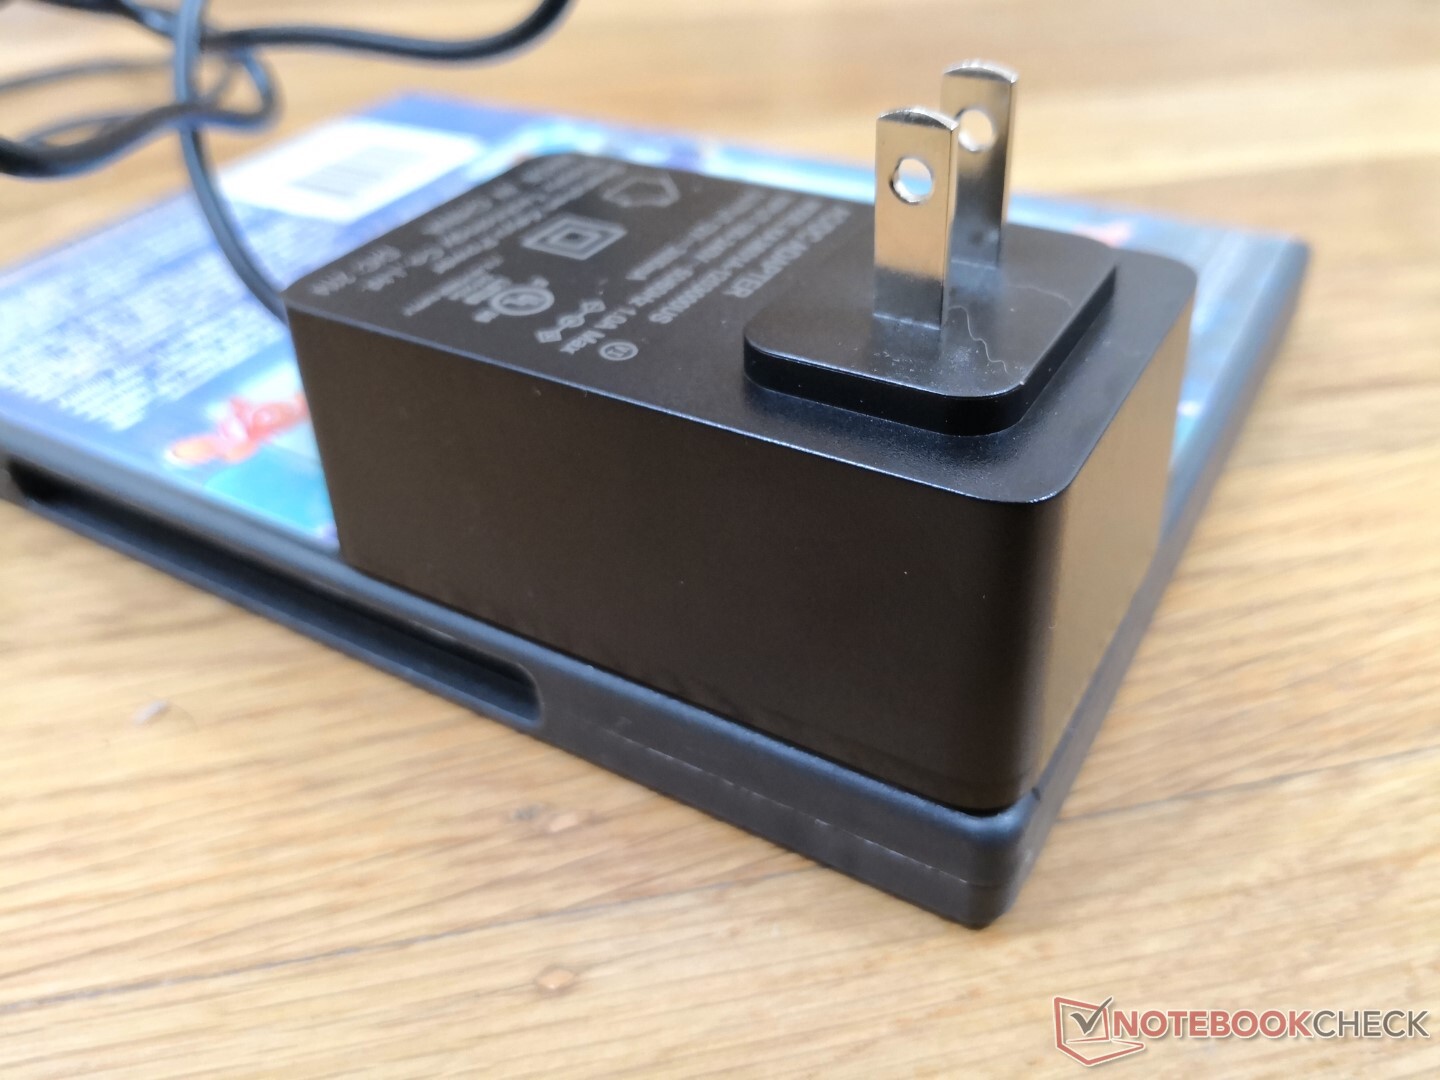
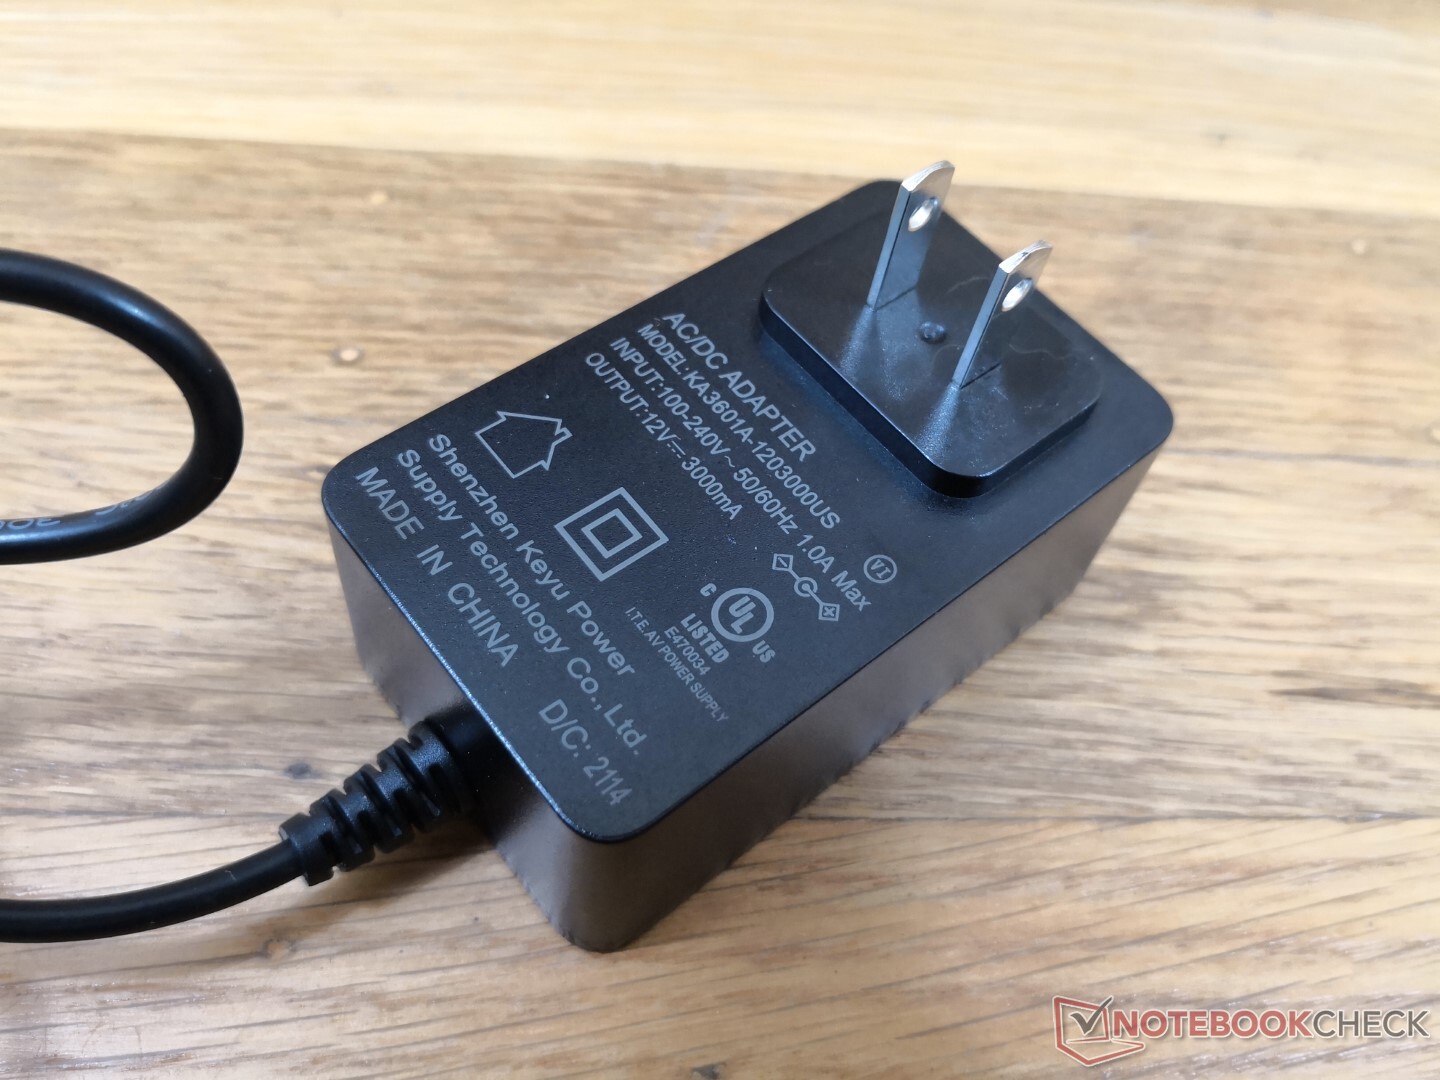
Os inconvenientes são menores, mas se somam. O fato de o sistema requerer um adaptador de barril AC proprietário é um incômodo quando poderia ter sido alimentado pelo USB-C mais universal. O ventilador, embora geralmente silencioso, tende a pulsar com freqüência em resposta a cargas de trabalho. A falta de um leitor de cartões SD pode irritar os usuários que dependem dele enquanto a placa de plástico superior parece barata e propensa a arranhar. No entanto, se você tiver que adquirir um Celeron mini PC, então o Jasper Lake-powered Beelink U59 pode ser uma boa opção simplesmente por causa dos notáveis benefícios de desempenho sobre os chips Celeron mais antigos, como os doGMK NucBox K1 ou Chuwi GBox.
Preço e Disponibilidade
Amazônia está enviando atualmente o Beelink U59 a partir de US$ 279 até US$ 349, dependendo da RAM e da opção de armazenamento.
Price comparison

