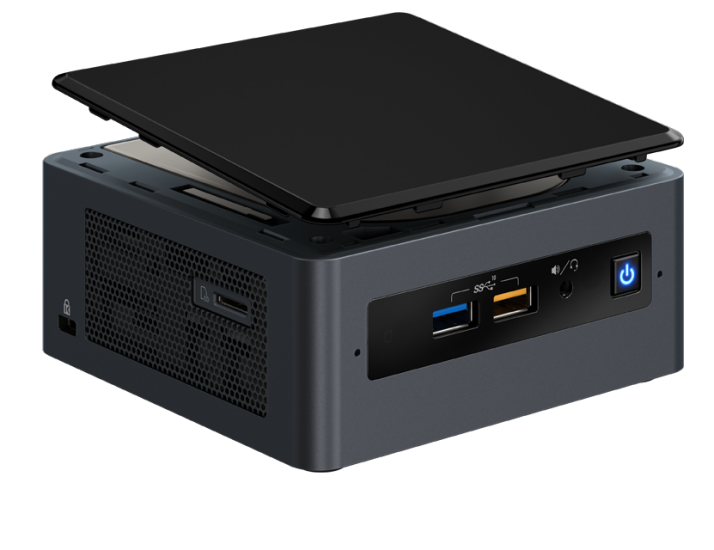
Breve Análise do Mini PC Intel NUC Kit NUC8i7BEH (i7-8559U)
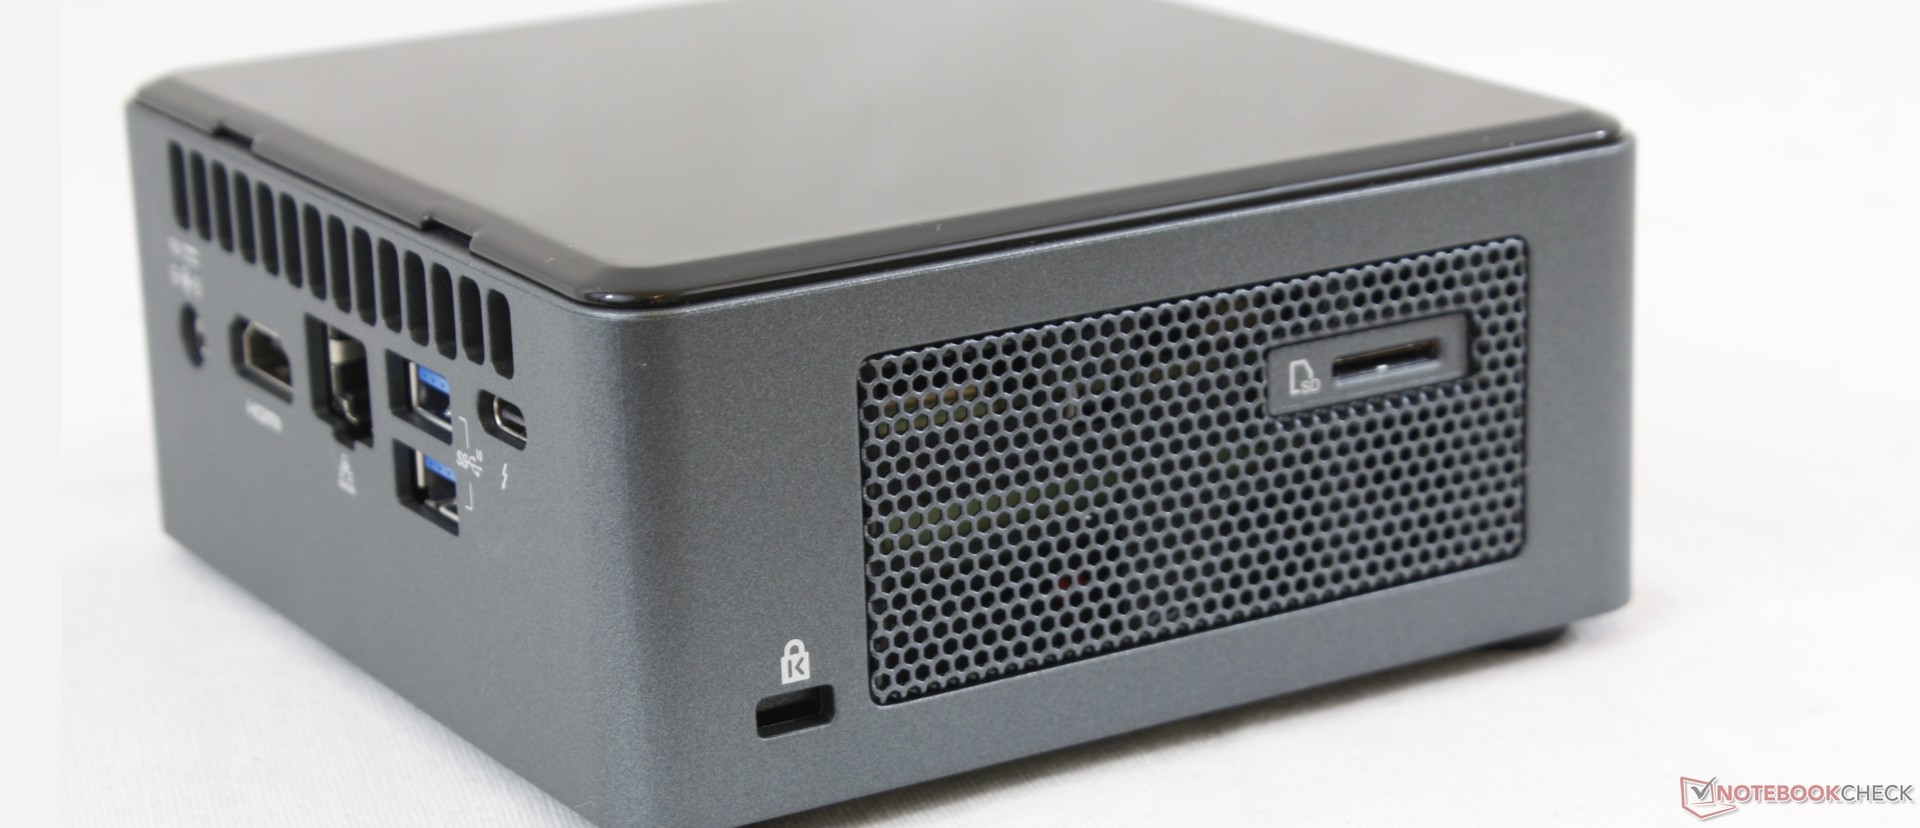
| SD Card Reader | |
| average JPG Copy Test (av. of 3 runs) | |
| Intel Hades Canyon NUC8i7HVK (Toshiba Exceria Pro SDXC 64 GB UHS-II) | |
| Intel NUC8i7BE (Toshiba Exceria Pro M501 UHS-II) | |
| Zotac ZBOX-QK7P3000 (Toshiba Exceria Pro SDXC 64 GB UHS-II) | |
| Zotac ZBOX-CI660 Nano (Toshiba Exceria Pro SDXC 64 GB UHS-II) | |
| maximum AS SSD Seq Read Test (1GB) | |
| Intel Hades Canyon NUC8i7HVK (Toshiba Exceria Pro SDXC 64 GB UHS-II) | |
| Intel NUC8i7BE (Toshiba Exceria Pro M501 UHS-II) | |
| Zotac ZBOX-QK7P3000 (Toshiba Exceria Pro SDXC 64 GB UHS-II) | |
| Zotac ZBOX-CI660 Nano (Toshiba Exceria Pro SDXC 64 GB UHS-II) | |
| Networking | |
| iperf3 transmit AX12 | |
| Intel NUC8i7BE | |
| Intel Hades Canyon NUC8i7HVK | |
| Zotac ZBOX-QK7P3000 | |
| Zotac ZBOX-CI660 Nano | |
| iperf3 receive AX12 | |
| Intel NUC8i7BE | |
| Intel Hades Canyon NUC8i7HVK | |
| Zotac ZBOX-CI660 Nano | |
| Zotac ZBOX-QK7P3000 | |
| Cinebench R15 | |
| CPU Single 64Bit | |
| Intel NUC8i7BE | |
| Intel Hades Canyon NUC8i7HVK | |
| Dell Latitude 5591 | |
| Zotac ZBOX Magnus EK71080 | |
| Zotac ZBOX-CI660 Nano | |
| Zotac ZBOX-QK7P3000 | |
| Dell XPS 13 9360 FHD i7 Iris | |
| Lenovo Yoga C930-13IKB | |
| Apple MacBook Pro 13 2017 Touchbar i5 | |
| Intel Skull Canyon NUC6i7KYK | |
| HP Pavilion 15-cw0003ng | |
| Intel NUC6i5SYH | |
| Intel NUC7CJYH | |
| CPU Multi 64Bit | |
| Dell Latitude 5591 | |
| Intel Hades Canyon NUC8i7HVK | |
| Intel NUC8i7BE | |
| Zotac ZBOX Magnus EK71080 | |
| Zotac ZBOX-QK7P3000 | |
| Intel Skull Canyon NUC6i7KYK | |
| Zotac ZBOX-CI660 Nano | |
| Lenovo Yoga C930-13IKB | |
| HP Pavilion 15-cw0003ng | |
| Apple MacBook Pro 13 2017 Touchbar i5 | |
| Dell XPS 13 9360 FHD i7 Iris | |
| Intel NUC6i5SYH | |
| Intel NUC7CJYH | |
| Cinebench R11.5 | |
| CPU Single 64Bit | |
| Intel NUC8i7BE | |
| Dell Latitude 5591 | |
| Intel Hades Canyon NUC8i7HVK | |
| Zotac ZBOX Magnus EK71080 | |
| Zotac ZBOX-QK7P3000 | |
| Intel Skull Canyon NUC6i7KYK | |
| Lenovo Yoga C930-13IKB | |
| Apple MacBook Pro 13 2017 Touchbar i5 | |
| Intel NUC6i5SYH | |
| Intel NUC7CJYH | |
| CPU Multi 64Bit | |
| Dell Latitude 5591 | |
| Intel Hades Canyon NUC8i7HVK | |
| Zotac ZBOX Magnus EK71080 | |
| Intel Skull Canyon NUC6i7KYK | |
| Zotac ZBOX-QK7P3000 | |
| Intel NUC8i7BE | |
| Lenovo Yoga C930-13IKB | |
| Apple MacBook Pro 13 2017 Touchbar i5 | |
| Intel NUC6i5SYH | |
| Intel NUC7CJYH | |
| Cinebench R10 | |
| Rendering Multiple CPUs 32Bit | |
| Dell Latitude 5591 | |
| Intel Hades Canyon NUC8i7HVK | |
| Intel NUC8i7BE | |
| Zotac ZBOX Magnus EK71080 | |
| Zotac ZBOX-QK7P3000 | |
| Intel Skull Canyon NUC6i7KYK | |
| Lenovo Yoga C930-13IKB | |
| Apple MacBook Pro 13 2017 Touchbar i5 | |
| Intel NUC6i5SYH | |
| Intel NUC7CJYH | |
| Rendering Single 32Bit | |
| Intel NUC8i7BE | |
| Zotac ZBOX-QK7P3000 | |
| Dell Latitude 5591 | |
| Intel Hades Canyon NUC8i7HVK | |
| Zotac ZBOX Magnus EK71080 | |
| Lenovo Yoga C930-13IKB | |
| Intel Skull Canyon NUC6i7KYK | |
| Apple MacBook Pro 13 2017 Touchbar i5 | |
| Intel NUC6i5SYH | |
| Intel NUC7CJYH | |
| wPrime 2.10 - 1024m | |
| Intel NUC7CJYH | |
| Intel NUC6i5SYH | |
| Apple MacBook Pro 13 2017 Touchbar i5 | |
| Intel NUC8i7BE | |
| Zotac ZBOX-QK7P3000 | |
| Intel Skull Canyon NUC6i7KYK | |
| Zotac ZBOX Magnus EK71080 | |
| Intel Hades Canyon NUC8i7HVK | |
* ... menor é melhor
| PCMark 10 | |
| Score | |
| Intel Hades Canyon NUC8i7HVK | |
| Intel NUC8i7BE | |
| Zotac ZBOX-CI660 Nano | |
| Intel NUC7CJYH | |
| Essentials | |
| Intel Hades Canyon NUC8i7HVK | |
| Intel NUC8i7BE | |
| Zotac ZBOX-CI660 Nano | |
| Intel NUC7CJYH | |
| Productivity | |
| Intel Hades Canyon NUC8i7HVK | |
| Intel NUC8i7BE | |
| Zotac ZBOX-CI660 Nano | |
| Intel NUC7CJYH | |
| Digital Content Creation | |
| Intel Hades Canyon NUC8i7HVK | |
| Intel NUC8i7BE | |
| Zotac ZBOX-CI660 Nano | |
| Intel NUC7CJYH | |
| PCMark 8 | |
| Home Score Accelerated v2 | |
| Intel Hades Canyon NUC8i7HVK | |
| Intel NUC8i7BE | |
| Intel NUC6i5SYH | |
| Zotac ZBOX-CI660 Nano | |
| Intel NUC7CJYH | |
| Work Score Accelerated v2 | |
| Intel Hades Canyon NUC8i7HVK | |
| Intel NUC6i5SYH | |
| Intel NUC7CJYH | |
| Creative Score Accelerated v2 | |
| Intel Hades Canyon NUC8i7HVK | |
| Intel NUC6i5SYH | |
| Intel NUC7CJYH | |
| PCMark 8 Home Score Accelerated v2 | 4674 pontos | |
| PCMark 10 Score | 4580 pontos | |
Ajuda | ||
| 3DMark 11 | |
| 1280x720 Performance GPU | |
| Zotac ZBOX-QK7P3000 | |
| Intel Hades Canyon NUC8i7HVK | |
| MSI Prestige PS42 8RB-059 | |
| Intel Skull Canyon NUC6i7KYK | |
| Intel NUC8i7BE | |
| Dell Latitude 5591 | |
| Apple MacBook Pro 13 2017 Touchbar i5 | |
| Média Intel Iris Plus Graphics 655 (1365 - 3081, n=8) | |
| Asus VivoBook S410UQ-NH74 | |
| HP Pavilion 15-cw0003ng | |
| Intel NUC6i5SYH | |
| Dell XPS 13 9360 FHD i7 Iris | |
| Zotac ZBOX-CI660 Nano | |
| Intel NUC7CJYH | |
| 1280x720 Performance Combined | |
| Intel Hades Canyon NUC8i7HVK | |
| Zotac ZBOX-QK7P3000 | |
| MSI Prestige PS42 8RB-059 | |
| Dell Latitude 5591 | |
| Intel Skull Canyon NUC6i7KYK | |
| Intel NUC8i7BE | |
| Apple MacBook Pro 13 2017 Touchbar i5 | |
| Asus VivoBook S410UQ-NH74 | |
| Média Intel Iris Plus Graphics 655 (1245 - 2688, n=8) | |
| Intel NUC6i5SYH | |
| HP Pavilion 15-cw0003ng | |
| Dell XPS 13 9360 FHD i7 Iris | |
| Zotac ZBOX-CI660 Nano | |
| Intel NUC7CJYH | |
| 3DMark Vantage P Result | 12093 pontos | |
| 3DMark 11 Performance | 3349 pontos | |
| 3DMark Ice Storm Standard Score | 87906 pontos | |
| 3DMark Cloud Gate Standard Score | 13037 pontos | |
| 3DMark Fire Strike Score | 2040 pontos | |
| 3DMark Fire Strike Extreme Score | 1011 pontos | |
| 3DMark Time Spy Score | 722 pontos | |
Ajuda | ||
| The Witcher 3 - 1024x768 Low Graphics & Postprocessing | |
| Média da turma Desktop (39.3 - 841, n=30, últimos 2 anos) | |
| Intel NUC8i7BE | |
| Média Intel Iris Plus Graphics 655 (23.2 - 27.9, n=4) | |
| baixo | média | alto | ultra | QHD | 4K | |
|---|---|---|---|---|---|---|
| Counter-Strike: GO (2012) | 93.7 | 49.6 | 12.4 | |||
| BioShock Infinite (2013) | 116.6 | 64.8 | 55 | 17 | ||
| GTA V (2015) | 68 | 62.1 | 15.8 | 6.22 | 4.17 | |
| The Witcher 3 (2015) | 27.4 | |||||
| Dota 2 Reborn (2015) | 95 | 68 | 34.7 | 30.4 | 12.2 | |
| Rainbow Six Siege (2015) | 75.8 | 0 | ||||
| Rise of the Tomb Raider (2016) | 39.2 | 22.3 | 10.8 | 8.9 | ||
| Ashes of the Singularity (2016) | 19.4 | 11.3 | 10.5 | |||
| Deus Ex Mankind Divided (2016) | 28.7 | 21.1 | ||||
| For Honor (2017) | 41.3 | 16.1 | ||||
| Ghost Recon Wildlands (2017) | 22.7 | |||||
| Rocket League (2017) | 133.3 | 59.1 | 38.8 | |||
| Final Fantasy XV Benchmark (2018) | 16.9 | |||||
| X-Plane 11.11 (2018) | 32.6 | 23.3 | 19.8 | |||
| World of Tanks enCore (2018) | 15.7 | 40.3 | ||||
| Far Cry 5 (2018) | 23 | 11 | ||||
| Shadow of the Tomb Raider (2018) | 22 | |||||
| FIFA 19 (2018) | 82 | 45.8 | 40.3 | 36.7 | ||
| Assassin´s Creed Odyssey (2018) | 18 | |||||
| Battlefield V (2018) | 19.9 | |||||
| Far Cry New Dawn (2019) | 22 | 11 | ||||
| Metro Exodus (2019) | 18.3 | |||||
| Anthem (2019) | 16.6 | |||||
| Dirt Rally 2.0 (2019) | 64 | 22.8 | ||||
| The Division 2 (2019) | 35 | |||||
| Anno 1800 (2019) | 30.2 | |||||
| Rage 2 (2019) | 24.5 | |||||
| Total War: Three Kingdoms (2019) | 56.7 | 18.5 | 10.5 | |||
| F1 2019 (2019) | 51.2 | 21.9 | 19.3 | |||
| Control (2019) | 25 problemas gráficos graves | |||||
| Borderlands 3 (2019) | 23.5 | 10.2 | 6.4 | |||
| FIFA 20 (2019) | 92 | 55.9 | 46.3 | 34.9 | 26.5 | 13.6 |
| Ghost Recon Breakpoint (2019) | 0 o jogo não começa | |||||
| GRID 2019 (2019) | 36 problemas gráficos graves | 20 problemas gráficos graves | ||||
| Call of Duty Modern Warfare 2019 (2019) | 0 o jogo não começa | |||||
| Red Dead Redemption 2 (2019) | 15.8 | |||||
| Hearthstone (2020) | 59.8 | 27.2 | ||||
| Escape from Tarkov (2020) | 29.1 | 16.2 | 14.1 | 6.59 | ||
| Doom Eternal (2020) | 0 o jogo não começa | |||||
| Gears Tactics (2020) | 54.8 | 17.3 | 11.6 |
| Intel NUC8i7BE Iris Plus Graphics 655, i7-8559U | Intel Hades Canyon NUC8i7HVK Vega M GH, i7-8809G, Intel Optane 120 GB SSDPEK1W120GA | Intel Skull Canyon NUC6i7KYK Iris Pro Graphics 580, 6770HQ, Samsung SSD 850 EVO m.2 120GB | Lenovo Yoga C930-13IKB 81C4 UHD Graphics 620, i5-8550U, SK hynix PC401 HFS256GD9TNG | Apple MacBook Pro 13 2018 Touchbar i5 Iris Plus Graphics 655, i5-8259U | |
|---|---|---|---|---|---|
| Noise | -1% | -7% | 7% | 1% | |
| desligado / ambiente * (dB) | 28.7 | 28.7 -0% | 29.5 -3% | 27.9 3% | 29.6 -3% |
| Idle Minimum * (dB) | 28.7 | 29 -1% | 31.6 -10% | 27.9 3% | 29.6 -3% |
| Idle Average * (dB) | 29.3 | 29 1% | 32.2 -10% | 27.9 5% | 29.6 -1% |
| Idle Maximum * (dB) | 31.8 | 29 9% | 32.3 -2% | 29.3 8% | 29.6 7% |
| Load Average * (dB) | 39 | 36 8% | 43 -10% | 32 18% | 36.7 6% |
| Witcher 3 ultra * (dB) | 39 | 42 -8% | 32.5 17% | ||
| Load Maximum * (dB) | 41.4 | 49.4 -19% | 43.2 -4% | 39.3 5% | 46.7 -13% |
* ... menor é melhor
Barulho
| Ocioso |
| 28.7 / 29.3 / 31.8 dB |
| Carga |
| 39 / 41.4 dB |
 | ||
30 dB silencioso 40 dB(A) audível 50 dB(A) ruidosamente alto |
||
min: | ||
| desligado | |
| Ocioso | |
| Carga |
|
Key:
min: | |
| Intel NUC8i7BE i7-8559U, Iris Plus Graphics 655, , , x, | Intel Hades Canyon NUC8i7HVK i7-8809G, Vega M GH, Intel Optane 120 GB SSDPEK1W120GA, , x, | Intel NUC6i5SYH 6260U, Iris Graphics 540, Samsung SSD XP941 MZHPU256HCGL, , x, 0" | Zotac ZBOX-CI660 Nano i5-8550U, UHD Graphics 620, OCZ Vertex OCZSSD2-1VTX120G, , x, | Lenovo Yoga C930-13IKB i5-8250U, UHD Graphics 620, SK hynix PC401 HFS256GD9TNG, IPS, 1920x1080, 13.9" | Lenovo Ideapad 720S-13ARR R7 2700U, Vega 10, Samsung PM961 MZVLW256HEHP, IPS, 1920x1080, 13.3" | |
|---|---|---|---|---|---|---|
| Power Consumption | -230% | -64% | -106% | -27% | -59% | |
| Idle Minimum * (Watt) | 2.7 | 15.5 -474% | 8.7 -222% | 9.7 -259% | 3.3 -22% | 5.4 -100% |
| Idle Average * (Watt) | 3.1 | 16.2 -423% | 8.7 -181% | 9.8 -216% | 6.8 -119% | 9.8 -216% |
| Idle Maximum * (Watt) | 6.3 | 16.5 -162% | 8.7 -38% | 11.8 -87% | 9.5 -51% | 11.3 -79% |
| Load Average * (Watt) | 59.7 | 83.4 -40% | 18.2 70% | 51.6 14% | 40.8 32% | 29.3 51% |
| Witcher 3 ultra * (Watt) | 47.2 | 121.7 -158% | ||||
| Load Maximum * (Watt) | 78 | 173.5 -122% | 36.6 53% | 63.2 19% | 57 27% | 38.5 51% |
* ... menor é melhor
Pro
Contra
Os usuários podem esperar um nível de desempenho geral muito próximo ao do NUC Skull Canyon de última geração, enquanto funciona de forma mais silenciosa, mais fria, e por um preço inicial mais baixo. A adição do Thunderbolt 3 significa que os usuários podem emparelhar o sistema com um dock gráfico externo para jogos ou outras tarefas exigentes para expandir ainda mais a versatilidade do sistema.
A série NUC8 será notável por suas opções de CPU Coffee Lake-U e os resultados são mais diversos a esse respeito. O Iris Plus Graphics 655 é 5 a 30 por cento mais veloz que um AMD Vega 10 desde que você equipe o NUC com RAM de dois canais, mas o desempenho da CPU não é muito melhor do que o do mais barato i7-8550U. Seu TDP mais alto é principalmente para alimentar a GPU da Iris e, assim, a CPU se beneficia pouco do limite TDP mais alto, exceto pela breve aceleração inicial das velocidades do Turbo Boost.
Para o streaming 4K e HTPC, um ZBox mais barato ou um mini PC NUC7 com o i5-8250U ou i7-8550U seria suficiente. O NUC8 é o melhor para aqueles que exploram a porta Thunderbolt 3 e desejam utilizar o potencial máximo dos gráficos Iris Plus.
Price comparison
