Notebookcheck Logo

Intel Celeron N5095

Intel Celeron N5095

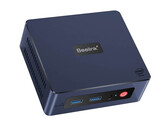
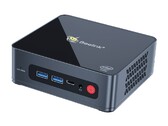
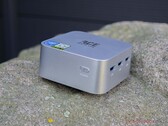
O Intel Celeron N5095 é um SoC quad-core da família de produtos Jasper Lake projetado para desktops e laptops SFF de baixo custo. O Celeron foi anunciado no início de 2021. Ele tem quatro núcleos de CPU Tremont rodando a 2 GHz (velocidade do relógio base) Boosting até 2,9 GHz (Single-core Boost) com 1,5 MB de L2 e 4 MB de cache L3, mas sem suporte Hyper-Threading thread-doubling. Um N5095 é fabricado no processo Intel de primeira geração de 10 nm não muito diferente dos processadores Ice Lake-U Core i3/i5/i7. O Celeron N5105 mais rápido é notável por ser mais eficiente energeticamente (10 W TDP vs. 15 W do N5095), mas com um iGPU mais rápido (24 EUs vs. 16 EUs, relógio 50 MHz mais alto também).

Arquitetura

A arquitetura Tremont traz muitas melhorias em relação à arquitetura Goldmont utilizada no Pentium N5030 e em tantas outras CPUs da série N. De acordo com a Intel, o desempenho da rosca única teve um aumento de até 30% (de +10% a +80% na SPECint e SPECfp, dependendo do teste).

Os Celerons e Pentiums anteriores da série N tinham que estar contidos com até 8 GB de DDR4-2400, entretanto, um N5095 é oficialmente compatível com até 16 GB de DDR4-2933 ou LPDDR4x-2933 de RAM de canal duplo. O suporte Wi-Fi 6 (Gig+) é parcialmente cozido dentro do chip. Um N5095 suporta até 8 pistas PCI-Express 3.0, até 14 portas USB 2.0/3.2 e até duas portas SATA III. O pacote do processador Jasper Lake é maior que o dos processadores Gemini Lake (35 x 24 mm vs. 25 x 24 mm). Um N5095 é soldado diretamente à placa mãe (soquete BGA1338) e é extremamente difícil de substituir.

Desempenho

O aumento da sustentabilidade depende muito do desempenho do sistema de refrigeração, bem como das configurações do TDP. Com isso em mente, um N5095 deve ser ligeiramente mais rápido do que o antigo Pentium N5030, graças às melhorias na arquitetura da CPU e maior potência. Um Athlon 3050e também deve ser significativamente mais lento do que o Celeron. O Pentium N6000, por outro lado, tem velocidades de relógio mais altas e um iGPU mais rápido, de modo que será capaz de superar o Celeron na maioria das cargas de trabalho. Esperamos que o Celeron fique atrás dos processadores quad-core Core i3/i5/i7 das famílias Tiger Lake-U e Ice Lake-U, apesar das melhorias arquitetônicas. Em suma, a CPU terá dificuldades com tudo, menos com as tarefas básicas como processamento de texto e navegação na Web.

Gráficos

Além dos quatro núcleos da CPU, a CPU apresenta o DirectX 12-capable UHD Graphics (16 EUs) iGPU clock em 450 MHz a 750 MHz. Esperamos que o adaptador gráfico tenha um desempenho de jogo próximo ao UHD Graphics 620. Embora não seja uma GPU para jogos por qualquer extensão de imaginação, o UHD Graphics é capaz de dirigir até 3 monitores com resoluções de até 4096x2160. Ele terá poucos problemas para decodificar o AVC, HEVC, VP9, mas não o AV1.

Consumo de energia

Os processadores Celeron da série N e Pentium tendem a ter um TDP de 6 W. Um N5095, no entanto, tem um TDP de 15 W, não muito diferente dos processadores U-series Core i3/i5/i7 mais rápidos. A sustentabilidade do desempenho provavelmente será um problema nas configurações resfriadas passivamente, o que poderia tornar a CPU impopular entre os fabricantes de laptop/tábulos.

SérieIntel Jasper Lake
CodinomeJasper Lake

Serie: Jasper Lake Jasper Lake

Intel Pentium Silver N60052 - 3.3 GHz4 / 4 cores4 MB L3
Intel Pentium Silver N60001.1 - 3.3 GHz4 / 4 cores4 MB L3
Intel Celeron N5095 « 2 - 2.9 GHz4 / 4 cores4 MB L3
Intel Celeron N51052 - 2.9 GHz4 / 4 cores4 MB L3
Intel Celeron N51001.1 - 2.8 GHz4 / 4 cores4 MB L3
Intel Celeron N45052 - 2.9 GHz2 / 2 cores4 MB L3
Intel Celeron N45001.1 - 2.8 GHz2 / 2 cores4 MB L3
Frequência2000 - 2900 MHz
Cache de Nível 21.5 MB
Cache de Nível 34 MB
Número de Núcelos / Subprocessos4 / 4
Consumo de Energia (TDP = Thermal Design Power)15 Watt
Tecnologia de Produção10 nm
Tempratura Máx.105 °C
ConectorBGA1338
CaracterísticasDDR4-2933/LPDDR4x-2933 RAM, PCIe 3, GNA, MMX, SSE, SSE2, SSE3, SSSE3, SSE4.1, SSE4.2, VMX, SMEP, SMAP, EIST, TM1, TM2, Turbo, SST, AES-NI, RDRAND, RDSEED, SHA
GPUIntel UHD Graphics (Jasper Lake 16 EU) (450 - 750 MHz)
64 BitSuporte para 64 Bit
Architecturex86
Data do Anúncio01/11/2021
Link do Produto (externo)ark.intel.com

Benchmarks

Performance Rating - CB R15 + R20 + 7-Zip + X265 + Blender + 3DM11 CPU
21.6 pt (30%)
Cinebench R23 - Cinebench R23 Multi Core
min: 2150     avg: 2174     median: 2164 (2%)     max: 2219 Points
202 -91%
...
1730 -20%
1786 -18%
1810 -17%
AMD Ryzen Embedded R1606G
1842 -15%
Intel Core i3-1110G4
1868 -14%
1944 -11%
1989 -9%
Intel Core i3-8109U
2004 -8%
2142 -1%
Intel Celeron N5095
2174
2175 0%
2303 6%
2546 17%
2600 20%
Intel Core i5-1140G7
2611 20%
Intel Core i7-2860QM
2699 24%
2711 25%
2729 26%
2730 26%
...
32782 1408%
max:
107681 4853%
0%
100%
Cinebench R23 - Cinebench R23 Single Core
min: 587     avg: 608     median: 611 (26%)     max: 621 Points
74.4 -88%
...
513 -16%
529 -13%
539 -11%
567 -7%
576 -5%
584 -4%
588 -3%
603 -1%
604 -1%
Intel Celeron N5095
608
618 2%
619 2%
Intel Core i5-8260U
629 3%
Intel Core m3-7Y32
637 5%
Intel Core i3-6157U
638 5%
Intel Core i5-5250U
660 9%
663 9%
669 10%
671 10%
...
2103 246%
max:
2351 287%
0%
100%
Cinebench R20 - Cinebench R20 CPU (Single Core)
min: 228     avg: 234     median: 234 (26%)     max: 239 Points
Cinebench R20 - Cinebench R20 CPU (Multi Core)
min: 804     avg: 825     median: 827 (2%)     max: 844 Points
Cinebench R15 - Cinebench R15 CPU Multi 64 Bit
min: 221     avg: 343     median: 364 (2%)     max: 379 Points
31 -91%
...
Intel Core i5-6267U
328.3 -4%
333 -3%
Intel Core i3-8130U
333.3 -3%
335 -2%
Intel Core i7-7560U
336 -2%
338 -1%
338.4 -1%
338.5 -1%
342 0%
Intel Celeron N5095
343
Intel Core i5-7300U
343.3 0%
Intel Core i5-6287U
345 1%
Intel Core i3-8145U
345.5 1%
351.8 3%
352 3%
Intel Core i3-8109U
352.5 3%
352.7 3%
Intel Core i7-5557U
353 3%
Intel Core i5-7360U
354 3%
...
5600 1533%
max:
15842 4519%
0%
100%
020406080100120140160180200220240260280300320340360Tooltip
Cinebench R15 - Cinebench R15 CPU Single 64 Bit
min: 95.4     avg: 103.9     median: 106 (32%)     max: 109 Points
19 -82%
...
Intel Core i3-6157U
98.8 -5%
Intel Core m5-6Y54
99.3 -4%
Intel Core i5-4210U
99.3 -4%
Intel Core i5-5250U
100.3 -3%
101 -3%
101.3 -3%
102 -2%
Intel Core m5-6Y57
102 -2%
102.8 -1%
Intel Celeron N5095
103.9
104 0%
104 0%
105 1%
Intel Core i5-4260U
105 1%
105.3 1%
106 2%
Intel Core i5-4310U
106.8 3%
107 3%
Intel Core i3-6100H
108 4%
...
311 199%
max:
332 220%
0%
100%
Cinebench R11.5 - Cinebench R11.5 CPU Multi 64 Bit
min: 4.65     avg: 4.7     median: 4.7 (6%)     max: 4.76 Points
Cinebench R11.5 - Cinebench R11.5 CPU Single 64 Bit
min: 1.25     avg: 1.3     median: 1.3 (32%)     max: 1.29 Points
Cinebench R10 - Cinebench R10 Rend. Single (32bit)
min: 3527     avg: 3545     median: 3544.5 (21%)     max: 3562 pontos
Cinebench R10 - Cinebench R10 Rend. Multi (32bit)
min: 12218     avg: 12283     median: 12283 (9%)     max: 12348 pontos
Cinebench R10 - Cinebench R10 Rend. Multi (64bit)
min: 16442     avg: 16860     median: 16860 (12%)     max: 17278 Points
Cinebench R10 - Cinebench R10 Rend. Single (64bit)
min: 5224     avg: 5338     median: 5337.5 (7%)     max: 5451 Points
wPrime 2.10 - wPrime 2.0 1024m *
min: 605.375     avg: 611     median: 611.4 (7%)     max: 617.326 s
wPrime 2.10 - wPrime 2.0 32m *
min: 19.202     avg: 19.5     median: 19.5 (4%)     max: 19.779 s
WinRAR - WinRAR 4.0
min: 1630     avg: 1706     median: 1705.5 (3%)     max: 1781 pontos
7-Zip 18.03 - 7-Zip 18.03 Multli Thread 4 runs
min: 10924     avg: 11024     median: 11013 (6%)     max: 11168 MIPS
7-Zip 18.03 - 7-Zip 18.03 Single Thread 4 runs
min: 2935     avg: 3074     median: 3100 (37%)     max: 3124 MIPS
X264 HD Benchmark 4.0 - x264 Pass 2
min: 24.75     avg: 25     median: 25 (9%)     max: 25.25 fps
X264 HD Benchmark 4.0 - x264 Pass 1
min: 112.75     avg: 116.5     median: 116.5 (27%)     max: 120.25 fps
HWBOT x265 Benchmark v2.2 - HWBOT x265 4k Preset
min: 1.9     avg: 2     median: 2 (4%)     max: 2.05 fps
00.20.40.60.811.11.31.51.71.92.12.32.52.72.93.13.23.43.6Tooltip
TrueCrypt - TrueCrypt Serpent
0.2 GB/s (0%)
TrueCrypt - TrueCrypt Twofish
0.4 GB/s (6%)
TrueCrypt - TrueCrypt AES
2.5 GB/s (7%)
Blender - Blender 3.3 Classroom CPU *
2936 Seconds (37%)
Blender - Blender 2.79 BMW27 CPU *
min: 1502     avg: 1548     median: 1547 (11%)     max: 1624 Seconds
R Benchmark 2.5 - R Benchmark 2.5 *
min: 1.16     avg: 1.2     median: 1.2 (25%)     max: 1.2 sec
3DMark 06 - CPU - 3DMark 06 - CPU
min: 5266     avg: 5272     median: 5272 (11%)     max: 5278 Points
Super Pi mod 1.5 XS 1M - Super Pi mod 1.5 XS 1M *
20.5 s (4%)
Super Pi mod 1.5 XS 2M - Super Pi mod 1.5 XS 2M *
45.7 s (2%)
Super Pi Mod 1.5 XS 32M - Super Pi mod 1.5 XS 32M *
1039 s (5%)
3DMark 11 - 3DM11 Performance Physics
min: 4224     avg: 4309     median: 4287 (12%)     max: 4439 Points
3DMark - 3DMark Ice Storm Physics
min: 41689     avg: 42092     median: 42091.5 (34%)     max: 42494 Points
3DMark - 3DMark Ice Storm Extreme Physics
min: 41654     avg: 42066     median: 42065.5 (34%)     max: 42477 Points
3DMark - 3DMark Ice Storm Unlimited Physics
min: 46730     avg: 47458     median: 47458 (40%)     max: 48186 Points
3DMark - 3DMark Cloud Gate Physics
min: 3720     avg: 3823     median: 3846 (10%)     max: 3888 Points
3DMark - 3DMark Fire Strike Standard Physics
min: 5400     avg: 5496     median: 5499 (10%)     max: 5572 Points
3DMark - 3DMark Time Spy CPU
min: 1595     avg: 1649     median: 1656 (7%)     max: 1696 Points
Geekbench 5.5 - Geekbench 5.1 - 5.4 64 Bit Single-Core
min: 637     avg: 649     median: 650.5 (27%)     max: 659 pontos
125 -81%
...
595 -8%
595 -8%
599 -8%
AMD Ryzen Embedded R1505G
612 -6%
626 -4%
631 -3%
638 -2%
638 -2%
Intel Core i5-8260U
639 -2%
Intel Celeron N5095
649
653 1%
654 1%
667 3%
Intel Core i3-6157U
668 3%
680 5%
Intel Core i5-5250U
691 6%
Qualcomm Snapdragon 8cx
700 8%
700 8%
Intel Core i7-8559U
723 11%
...
2331 259%
0%
100%
Geekbench 5.5 - Geekbench 5.1 - 5.4 64 Bit Multi-Core
min: 1933     avg: 2010     median: 2028 (4%)     max: 2052 pontos
Geekbench 5.0 - Geekbench 5.0 64 Bit Single-Core
min: 628     avg: 644     median: 646.5 (3%)     max: 655 pontos
Geekbench 5.0 - Geekbench 5.0 64 Bit Multi-Core
min: 1985     avg: 2029     median: 2030.5 (6%)     max: 2070 pontos
Geekbench 4.4 - Geekbench 4.1 - 4.4 64 Bit Single-Core
min: 2858     avg: 2896     median: 2900 (29%)     max: 2929 pontos
Geekbench 4.4 - Geekbench 4.1 - 4.4 64 Bit Multi-Core
min: 7759     avg: 7856     median: 7842 (9%)     max: 7968 pontos
Mozilla Kraken 1.1 - Kraken 1.1 Total Score *
min: 1557     avg: 1578     median: 1571.5 (2%)     max: 1619 ms
WebXPRT 4 - WebXPRT 4 Score
min: 94.2     avg: 95.2     median: 95.2 (27%)     max: 96.2 Points
WebXPRT 3 - WebXPRT 3 Score
min: 114.3     avg: 123.4     median: 125.3 (26%)     max: 127.2 Points
CrossMark - CrossMark Overall
min: 473     avg: 486     median: 490 (19%)     max: 495 Points
Power Consumption - Prime95 Power Consumption - external Monitor *
min: 24.1     avg: 24.4     median: 24.4 (4%)     max: 24.8 Watt
0510152025Tooltip
Power Consumption - Cinebench R15 Multi Power Consumption - external Monitor *
min: 20.7     avg: 22     median: 22.1 (4%)     max: 23 Watt
05101520Tooltip
Power Consumption - Idle Power Consumption - external Monitor *
4.9 Watt (3%)
012345Tooltip
Power Consumption - Cinebench R15 Multi Power Efficiency - external Monitor
min: 15.6     avg: 17     median: 17.2 (13%)     max: 18.3 Points per Watt
- Gama de valores benchmark para essa solução gráfica
- Média de valores benchmark para essa solução gráfica
* Smaller numbers mean a higher performance

v1.26
log 25. 17:27:53

#0 no ids found in url (should be separated by "_") +0s ... 0s

#1 not redirecting to Ajax server +0s ... 0s

#2 did not recreate cache, as it is less than 5 days old! Created at Thu, 25 Apr 2024 05:38:32 +0200 +0.001s ... 0.001s

#3 no comparison url found in template nbc.compare_page_2 needed +0.008s ... 0.009s

#4 no comparison url found in template nbc.compare_page_2 needed +0s ... 0.01s

#5 no comparison url found in template nbc.compare_page_2 needed +0s ... 0.01s

#6 no comparison url found in template nbc.compare_page_2 needed +0s ... 0.01s

#7 no comparison url found in template nbc.compare_page_2 needed +0s ... 0.011s

#8 no comparison url found in template nbc.compare_page_2 needed +0s ... 0.011s

#9 composed specs +0s ... 0.012s

#10 did output specs +0s ... 0.012s

#11 getting avg benchmarks for device 13189 +0.017s ... 0.029s

#12 got single benchmarks 13189 +0.02s ... 0.049s

#13 got avg benchmarks for devices +0s ... 0.049s

#14 min, max, avg, median took s +1.046s ... 1.094s

#15 no comparison url found in template nbc.compare_page_2 needed +0s ... 1.094s

#16 return log +0s ... 1.094s

Please share our article, every link counts!

» Comparação de CPUs Móveis
Comparação de todas as séries de CPUs móveis

» Processadores Móveis - Benchmarklist
Benchmarklist de todos os CPUs conhecidos que são usados em portáteis (CPUs de desktop e laptop)

Outras CPUs da série Jasper Lake

» Intel Pentium Silver N6005
   4x 2 GHz - 3.3 GHz
» Intel Pentium Silver N6000
   4x 1.1 GHz - 3.3 GHz
» Intel Celeron N5095
   4x 2 GHz - 2.9 GHz
» Intel Celeron N5105
   4x 2 GHz - 2.9 GHz
» Intel Celeron N5100
   4x 1.1 GHz - 2.8 GHz
» Intel Celeron N4505
   2x 2 GHz - 2.9 GHz
» Intel Celeron N4500
   2x 1.1 GHz - 2.8 GHz

CPUs de ao redor

+ Intel Pentium 3550M
   2x 2.3 GHz
+ Intel Core i7-660LM
   2x 2.27 GHz - 3.07 GHz
+ Intel Core 2 Extreme X7900
   2x 2.8 GHz
+ Intel Core 2 Quad Q9100
   4x 2.26 GHz
+ Intel Core i5-3317U
   2x 1.7 GHz - 2.6 GHz
» Intel Celeron N5095
   4x 2 GHz - 2.9 GHz
- Intel Celeron N5105
   4x 2 GHz - 2.9 GHz
- Intel Celeron N5100
   4x 1.1 GHz - 2.8 GHz
- AMD Athlon Silver 3050e
   2x 1.4 GHz - 2.8 GHz
- AMD 3020e
   2x 1.2 GHz - 2.6 GHz
- Intel Pentium Silver N5030
   4x 1.1 GHz - 3.1 GHz
> Análises e revisões de portáteis e celulares > FAQ/Técnica > Processadores de Notebook > Intel Jasper Lake Celeron N5095 Notebook Processor
Klaus Hinum (Update: 2021-08- 9)