Breve Análise do 2-em-1 Teclast Tbook 16 Power (x7-Z8750, 8 GB)
| SD Card Reader - average JPG Copy Test (av. of 3 runs) | |
| Apple MacBook Pro Retina 13 inch 2013-10 | |
| Acer Aspire S 13 S5-371-71QZ | |
| Teclast Tbook 16 Power | |
| Microsoft Surface Pro 4, Core i5, 256GB | |
| Lenovo ThinkPad Yoga 370-20JJS00100 | |
| Dell Latitude 12 5285 2-in-1 | |
| Asus Zenbook UX3410UA | |
| Chuwi Vi8 Plus (CWI519) | |
| Networking | |
| iperf3 transmit AX12 | |
| Microsoft Surface Pro 4, Core i5, 128GB (Klaus I211) | |
| Microsoft Surface Book with Performance Base | |
| Cube i7 Book CDK09 (Klaus I211) | |
| Teclast Tbook 16 Power | |
| Chuwi Hi10 Pro | |
| iperf3 receive AX12 | |
| Microsoft Surface Book with Performance Base | |
| Microsoft Surface Pro 4, Core i5, 128GB (Klaus I211) | |
| Cube i7 Book CDK09 (Klaus I211) | |
| Teclast Tbook 16 Power | |
| Chuwi Hi10 Pro | |
| |||||||||||||||||||||||||
iluminação: 79 %
iluminação com acumulador: 244 cd/m²
Contraste: 642:1 (Preto: 0.38 cd/m²)
ΔE ColorChecker Calman: 6.7 | ∀{0.5-29.43 Ø4.71}
ΔE Greyscale Calman: 7.4 | ∀{0.09-98 Ø4.96}
93% sRGB (Argyll 1.6.3 3D)
60.6% AdobeRGB 1998 (Argyll 1.6.3 3D)
67.4% AdobeRGB 1998 (Argyll 3D)
93.2% sRGB (Argyll 3D)
66.1% Display P3 (Argyll 3D)
Gamma: 2.15
CCT: 8867 K
| Teclast Tbook 16 Power 1920x1080, 11.6" | Microsoft Surface Pro 4 Core i7 Samsung 123YL01-001 ID: SDC3853, , 2736x1824, 12.3" | Cube i9 KDC0000, , 1920x1200, 12.2" | Chuwi Hi12 SEC3542, , 2160x1440, 12" | |
|---|---|---|---|---|
| Display | 3% | -3% | 1% | |
| Display P3 Coverage (%) | 66.1 | 66.9 1% | 65.7 -1% | 66 0% |
| sRGB Coverage (%) | 93.2 | 97.5 5% | 88.7 -5% | 95.3 2% |
| AdobeRGB 1998 Coverage (%) | 67.4 | 68.6 2% | 65.1 -3% | 68.1 1% |
| Response Times | -20% | 14% | 39% | |
| Response Time Grey 50% / Grey 80% * (ms) | 40 ? | 48.4 ? -21% | 37.2 ? 7% | 28 ? 30% |
| Response Time Black / White * (ms) | 30.2 ? | 35.6 ? -18% | 24 ? 21% | 16 ? 47% |
| PWM Frequency (Hz) | 12000 ? | 10420 | 200 ? | |
| Screen | 53% | 16% | 17% | |
| Brightness middle (cd/m²) | 244 | 436.7 79% | 263 8% | 293 20% |
| Brightness (cd/m²) | 215 | 433 101% | 263 22% | 277 29% |
| Brightness Distribution (%) | 79 | 87 10% | 77 -3% | 89 13% |
| Black Level * (cd/m²) | 0.38 | 0.326 14% | 0.28 26% | 0.256 33% |
| Contrast (:1) | 642 | 1340 109% | 939 46% | 1145 78% |
| Colorchecker dE 2000 * | 6.7 | 1.82 73% | 4.1 39% | 5.2 22% |
| Colorchecker dE 2000 max. * | 11.7 | 12.1 -3% | 11.4 3% | |
| Greyscale dE 2000 * | 7.4 | 1.44 81% | 3.8 49% | 8.5 -15% |
| Gamma | 2.15 102% | 2.1 105% | 2.25 98% | 2.21 100% |
| CCT | 8867 73% | 6560 99% | 6433 101% | 7048 92% |
| Color Space (Percent of AdobeRGB 1998) (%) | 60.6 | 62.3 3% | 57.7 -5% | 62 2% |
| Color Space (Percent of sRGB) (%) | 93 | 97.5 5% | 76.2 -18% | 82.5 -11% |
| Média Total (Programa/Configurações) | 12% /
32% | 9% /
12% | 19% /
17% |
* ... menor é melhor
Exibir tempos de resposta
| ↔ Tempo de resposta preto para branco | ||
|---|---|---|
| 30.2 ms ... ascensão ↗ e queda ↘ combinadas | ↗ 16.8 ms ascensão | |
| ↘ 13.4 ms queda | ||
| A tela mostra taxas de resposta lentas em nossos testes e será insatisfatória para os jogadores. Em comparação, todos os dispositivos testados variam de 0.1 (mínimo) a 240 (máximo) ms. » 82 % de todos os dispositivos são melhores. Isso significa que o tempo de resposta medido é pior que a média de todos os dispositivos testados (19.8 ms). | ||
| ↔ Tempo de resposta 50% cinza a 80% cinza | ||
| 40 ms ... ascensão ↗ e queda ↘ combinadas | ↗ 20 ms ascensão | |
| ↘ 20 ms queda | ||
| A tela mostra taxas de resposta lentas em nossos testes e será insatisfatória para os jogadores. Em comparação, todos os dispositivos testados variam de 0.165 (mínimo) a 636 (máximo) ms. » 61 % de todos os dispositivos são melhores. Isso significa que o tempo de resposta medido é pior que a média de todos os dispositivos testados (31 ms). | ||
Cintilação da tela / PWM (modulação por largura de pulso)
| Tela tremeluzindo/PWM detectado | 12000 Hz | ≤ 26 % configuração de brilho |
| ≤ 60 brilho cd/m² | ||
A luz de fundo da tela pisca em 12000 Hz (pior caso, por exemplo, utilizando PWM) Cintilação detectada em uma configuração de brilho de 26 % (60 cd/m²) e abaixo. Não deve haver cintilação ou PWM acima desta configuração de brilho. A frequência de 12000 Hz é bastante alta, então a maioria dos usuários sensíveis ao PWM não deve notar nenhuma oscilação. Como a oscilação ocorre apenas em configurações de brilho muito baixo, não deve ser um problema em ambientes típicos de escritório. No entanto, o uso em condições de pouca luz pode ser cansativo para os olhos. [pwm_comparison] Em comparação: 52 % de todos os dispositivos testados não usam PWM para escurecer a tela. Se PWM foi detectado, uma média de 7754 (mínimo: 5 - máximo: 343500) Hz foi medida. | ||
| Cinebench R15 | |
| CPU Single 64Bit | |
| Cube i7 Book CDK09 | |
| Microsoft Surface Pro 4, Core m3 | |
| Cube i9 | |
| Acer TravelMate B117-M-P16Q | |
| Chiligreen Mobilitas SF2600 | |
| Acer Swift 1 SF114-31-P6F6 | |
| HP Pavilion x360 11t T5M27AV | |
| Teclast Tbook 16 Power | |
| Microsoft Surface 3 | |
| Chuwi Hi12 | |
| VOYO VBook V3 | |
| Medion Akoya P2211T MD98602 | |
| CPU Multi 64Bit | |
| Cube i7 Book CDK09 | |
| Microsoft Surface Pro 4, Core m3 | |
| Cube i9 | |
| Acer Swift 1 SF114-31-P6F6 | |
| Acer TravelMate B117-M-P16Q | |
| Chiligreen Mobilitas SF2600 | |
| Microsoft Surface 3 | |
| Teclast Tbook 16 Power | |
| HP Pavilion x360 11t T5M27AV | |
| Teclast Tbook 10s | |
| Chuwi Hi12 | |
| Medion Akoya P2211T MD98602 | |
| VOYO VBook V3 | |
| Chuwi Hi10 Pro | |
| PCMark 8 - Home Score Accelerated v2 | |
| Cube i7 Book CDK09 | |
| Cube i9 | |
| Microsoft Surface Pro 4, Core m3 | |
| Acer Swift 1 SF114-31-P6F6 | |
| Acer TravelMate B117-M-P16Q | |
| Chiligreen Mobilitas SF2600 | |
| Microsoft Surface 3 | |
| HP Pavilion x360 11t T5M27AV | |
| Teclast Tbook 16 Power | |
| VOYO VBook V3 | |
| Acer Switch One 10 SW1-011-14UQ | |
| Medion Akoya E2215T | |
| Teclast Tbook 10s | |
| PCMark 8 Home Score Accelerated v2 | 1499 pontos | |
| PCMark 8 Creative Score Accelerated v2 | 1732 pontos | |
| PCMark 10 Score | 1006 pontos | |
Ajuda | ||
| Performance rating - Percent | |
| Microsoft Surface Pro 4, Core m3 | |
| Cube i9 | |
| Cube i7 Book CDK09 | |
| Microsoft Surface 3 | |
| Teclast Tbook 16 Power | |
| Medion Akoya P2211T MD98602 | |

| 3DMark 11 - 1280x720 Performance GPU | |
| Acer Aspire ES1-731G-P5UR | |
| Cube i9 | |
| Acer Swift 1 SF114-31-P6F6 | |
| Chiligreen Mobilitas SF2600 | |
| Acer TravelMate B117-M-P16Q | |
| HP Pavilion x360 11t T5M27AV | |
| Lenovo Yoga Book 2016 Windows 64GB LTE | |
| Teclast Tbook 16 Power | |
| HP 250 G5 Y1V08UT | |
| Acer Switch One 10 SW1-011-14UQ | |
| 3DMark | |
| 1280x720 Cloud Gate Standard Graphics | |
| Acer Aspire ES1-731G-P5UR | |
| Cube i9 | |
| Acer TravelMate B117-M-P16Q | |
| Lenovo Yoga Book 2016 Windows 64GB LTE | |
| Chiligreen Mobilitas SF2600 | |
| HP 250 G5 Y1V08UT | |
| HP Pavilion x360 11t T5M27AV | |
| Teclast Tbook 16 Power | |
| 1920x1080 Fire Strike Graphics | |
| Acer Aspire ES1-731G-P5UR | |
| Acer TravelMate B117-M-P16Q | |
| HP Pavilion x360 11t T5M27AV | |
| 3DMark 06 Standard Score | 2274 pontos | |
| 3DMark 11 Performance | 451 pontos | |
| 3DMark Cloud Gate Standard Score | 1743 pontos | |
Ajuda | ||
| Dota 2 Reborn - 1280x720 min (0/3) fastest | |
| Cube i9 | |
| Acer Swift 1 SF114-31-P6F6 | |
| Teclast Tbook 16 Power | |
| Chuwi Hi12 | |
| World of Warships - 1366x768 Low Preset AF:Trilinear | |
| Cube i9 | |
| Acer TravelMate B117-M-P16Q | |
| Teclast Tbook 16 Power | |
| Chuwi Hi12 | |
| Farming Simulator 17 - 1280x720 Low Preset | |
| Cube i9 | |
| Acer Swift 1 SF114-31-P6F6 | |
| Chuwi Hi12 | |
| Teclast Tbook 16 Power | |
| baixo | média | alto | ultra | |
|---|---|---|---|---|
| Dota 2 Reborn (2015) | 22.1 | 13.7 | ||
| World of Warships (2015) | 15 | |||
| Farming Simulator 17 (2016) | 17.6 | |||
| Rocket League (2017) | 18.7 | |||
| Team Fortress 2 (2017) | 19.6 | |||
| Battle Bay (2018) | 37 | |||
| World of Tanks Blitz (2018) | 37 | 24 | ||
| Arena of Valor (2018) | 25 | |||
| Shadow Fight 3 (2018) | 30 | |||
| PUBG Mobile (2018) | 0 o jogo não começa (Hangs after a few minutes) | |||
| League of Legends (2019) | 23.6 | 18 | 13.9 | |
| Hearthstone (2020) | 17.8 | 18 | 9.91 |
(±) A temperatura máxima no lado superior é 43 °C / 109 F, em comparação com a média de 35.4 °C / 96 F , variando de 19.6 a 60 °C para a classe Convertible.
(±) A parte inferior aquece até um máximo de 40 °C / 104 F, em comparação com a média de 36.9 °C / 98 F
(+) Em uso inativo, a temperatura média para o lado superior é 27.9 °C / 82 F, em comparação com a média do dispositivo de 30.3 °C / ### class_avg_f### F.
(-) Os apoios para as mãos e o touchpad podem ficar muito quentes ao toque, com um máximo de 41 °C / 105.8 F.
(-) A temperatura média da área do apoio para as mãos de dispositivos semelhantes foi 28 °C / 82.4 F (-13 °C / -23.4 F).
Teclast Tbook 16 Power análise de áudio
(-) | alto-falantes não muito altos (###valor### dB)
Graves 100 - 315Hz
(±) | graves reduzidos - em média 14.3% menor que a mediana
(±) | a linearidade dos graves é média (8.4% delta para a frequência anterior)
Médios 400 - 2.000 Hz
(±) | médios mais altos - em média 13.2% maior que a mediana
(-) | médios não são lineares (26.2% delta para frequência anterior)
Altos 2 - 16 kHz
(±) | máximos mais altos - em média 12.2% maior que a mediana
(-) | os máximos não são lineares (22.3% delta da frequência anterior)
Geral 100 - 16.000 Hz
(-) | o som geral não é linear (56.8% diferença em relação à mediana)
Comparado com a mesma classe
» 100% de todos os dispositivos testados nesta classe foram melhores, 0% semelhantes, 0% piores
» O melhor teve um delta de 6%, a média foi 20%, o pior foi 57%
Comparado com todos os dispositivos testados
» 96% de todos os dispositivos testados foram melhores, 0% semelhantes, 4% piores
» O melhor teve um delta de 4%, a média foi 23%, o pior foi 134%
Apple MacBook 12 (Early 2016) 1.1 GHz análise de áudio
(+) | os alto-falantes podem tocar relativamente alto (###valor### dB)
Graves 100 - 315Hz
(±) | graves reduzidos - em média 11.3% menor que a mediana
(±) | a linearidade dos graves é média (14.2% delta para a frequência anterior)
Médios 400 - 2.000 Hz
(+) | médios equilibrados - apenas 2.4% longe da mediana
(+) | médios são lineares (5.5% delta para frequência anterior)
Altos 2 - 16 kHz
(+) | agudos equilibrados - apenas 2% longe da mediana
(+) | os máximos são lineares (4.5% delta da frequência anterior)
Geral 100 - 16.000 Hz
(+) | o som geral é linear (10.2% diferença em relação à mediana)
Comparado com a mesma classe
» 7% de todos os dispositivos testados nesta classe foram melhores, 2% semelhantes, 90% piores
» O melhor teve um delta de 5%, a média foi 18%, o pior foi 53%
Comparado com todos os dispositivos testados
» 5% de todos os dispositivos testados foram melhores, 1% semelhantes, 94% piores
» O melhor teve um delta de 4%, a média foi 23%, o pior foi 134%
| desligado | |
| Ocioso | |
| Carga |
|
Key:
min: | |
| Teclast Tbook 16 Power Z8750, HD Graphics 405 (Braswell), 64 GB eMMC Flash, IPS, 1920x1080, 11.6" | Chuwi Hi12 Z8300, HD Graphics (Cherry Trail), Hynix HCG8E 64 GB, IPS, 2160x1440, 12" | Cube i7 Book CDK09 6Y30, HD Graphics 515, FORESEE 64GB O1229B, IPS, 1920x1080, 10.6" | Cube i9 6Y30, HD Graphics 515, FORESEE 128GB O1229B, IPS, 1920x1200, 12.2" | Microsoft Surface 3 Z8700, HD Graphics (Cherry Trail), 128 GB eMMC Flash, IPS, 1920x1280, 10.8" | Acer Swift 1 SF114-31-P6F6 N3710, HD Graphics 405 (Braswell), 128 GB eMMC Flash, TN LED, 1366x768, 14" | |
|---|---|---|---|---|---|---|
| Power Consumption | 21% | -180% | -132% | -70% | -100% | |
| Idle Minimum * (Watt) | 2.6 | 1.7 35% | 6.6 -154% | 4.6 -77% | 2.5 4% | 4.1 -58% |
| Idle Average * (Watt) | 2.7 | 1.7 37% | 10 -270% | 9.6 -256% | 7 -159% | 8.3 -207% |
| Idle Maximum * (Watt) | 2.7 | 3.3 -22% | 12 -344% | 9.6 -256% | 8.4 -211% | 8.6 -219% |
| Load Average * (Watt) | 12.7 | 7.9 38% | 21.1 -66% | 18.6 -46% | 11.2 12% | 13.5 -6% |
| Load Maximum * (Watt) | 13.1 | 10.8 18% | 22 -68% | 16.3 -24% | 12.4 5% | 14.5 -11% |
* ... menor é melhor
| Battery Runtime - WiFi Websurfing | |
| Acer Swift 1 SF114-31-P6F6 | |
| Acer Switch One 10 SW1-011-14UQ | |
| Microsoft Surface Pro 4, Core m3 | |
| Chuwi Vi10 Ultimate 64GB | |
| Chuwi Hi12 | |
| Teclast Tbook 16 Power | |
| Chuwi Hi10 Pro | |
| Cube i7 Book CDK09 | |
| Cube i9 | |
| Teclast Tbook 10s | |
Pro
Contra
O maior atributo de venda do Teclast Tbook 16 Power é o seu veloz microprocessador Atom x7. Embora tenha superado o Atom x5 concorrente, também foi muito mais lento do que seus concorrentes Core m3 e Pentium N3710. Especialmente em jogos, o Intel HD Graphics 405 foi uma grande decepção.
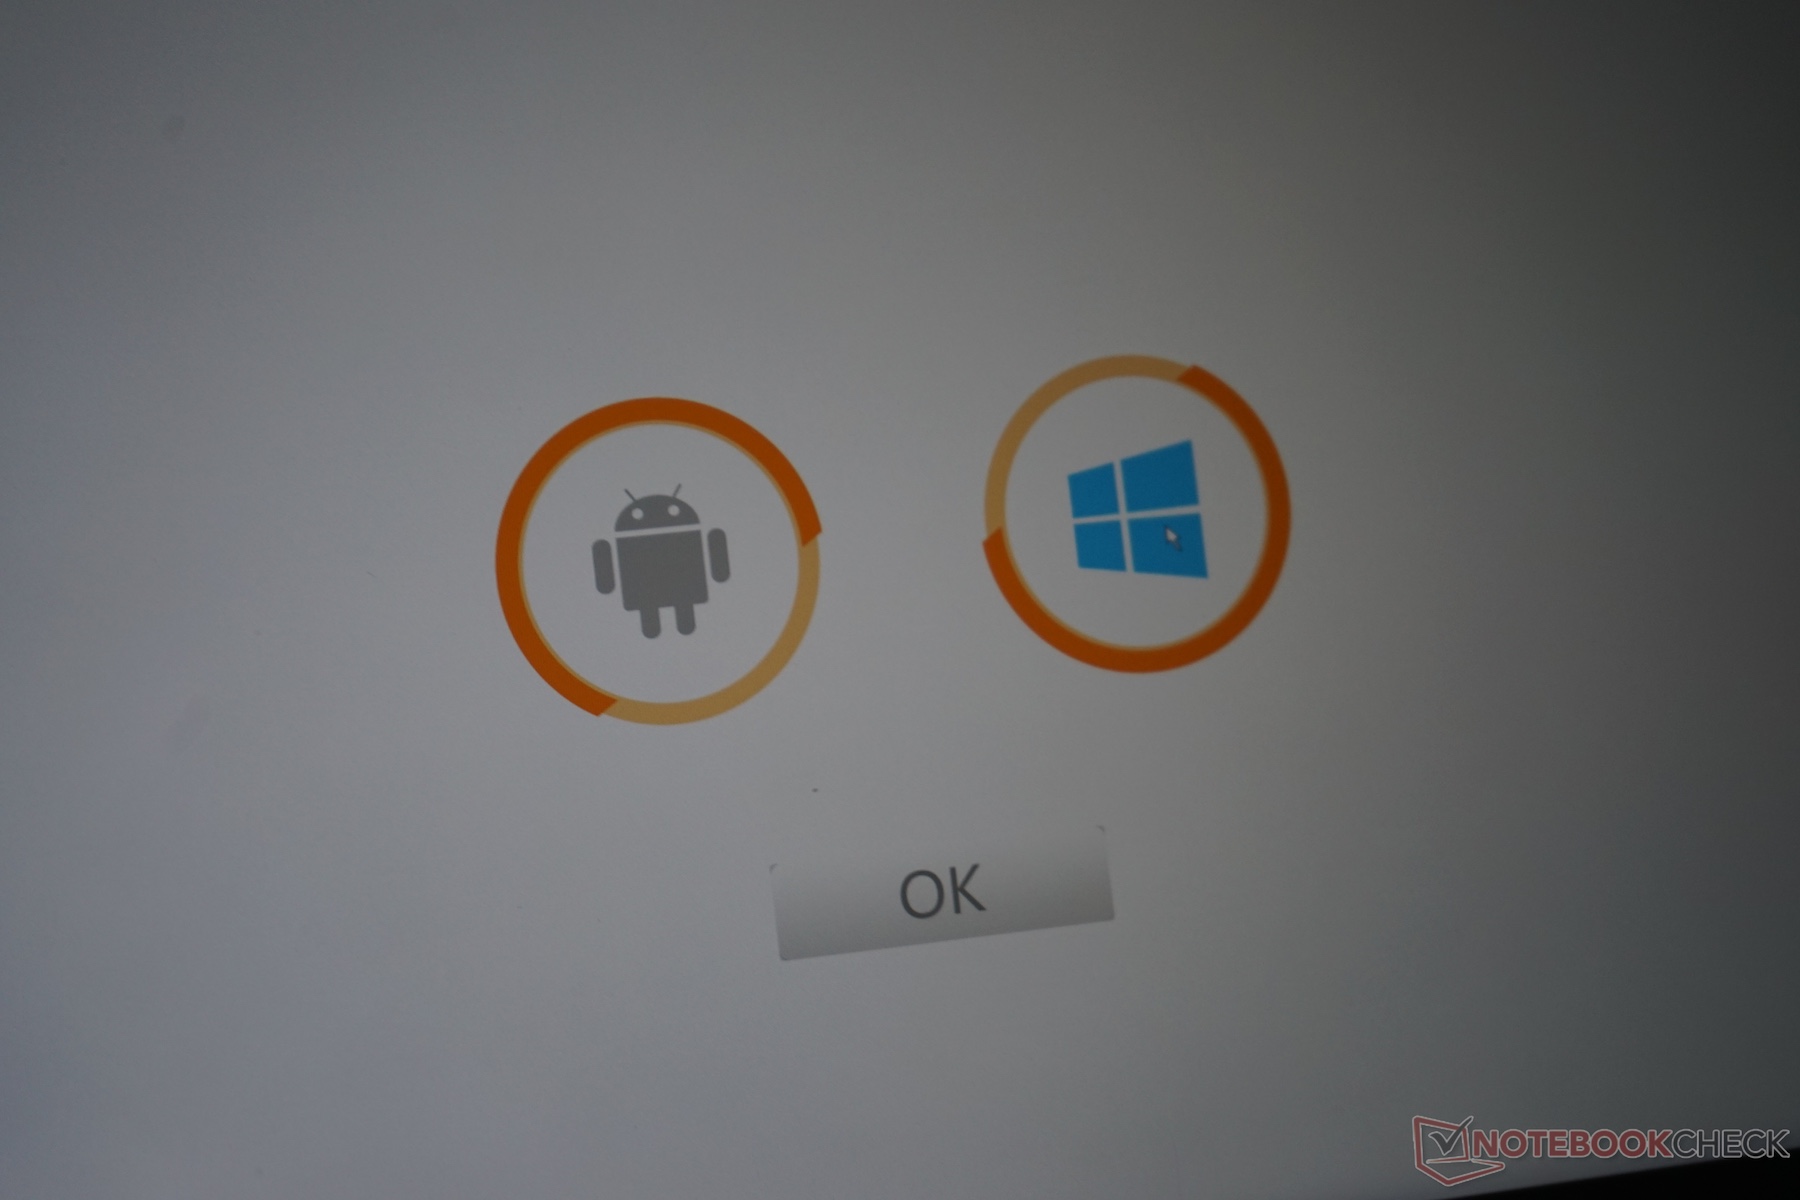
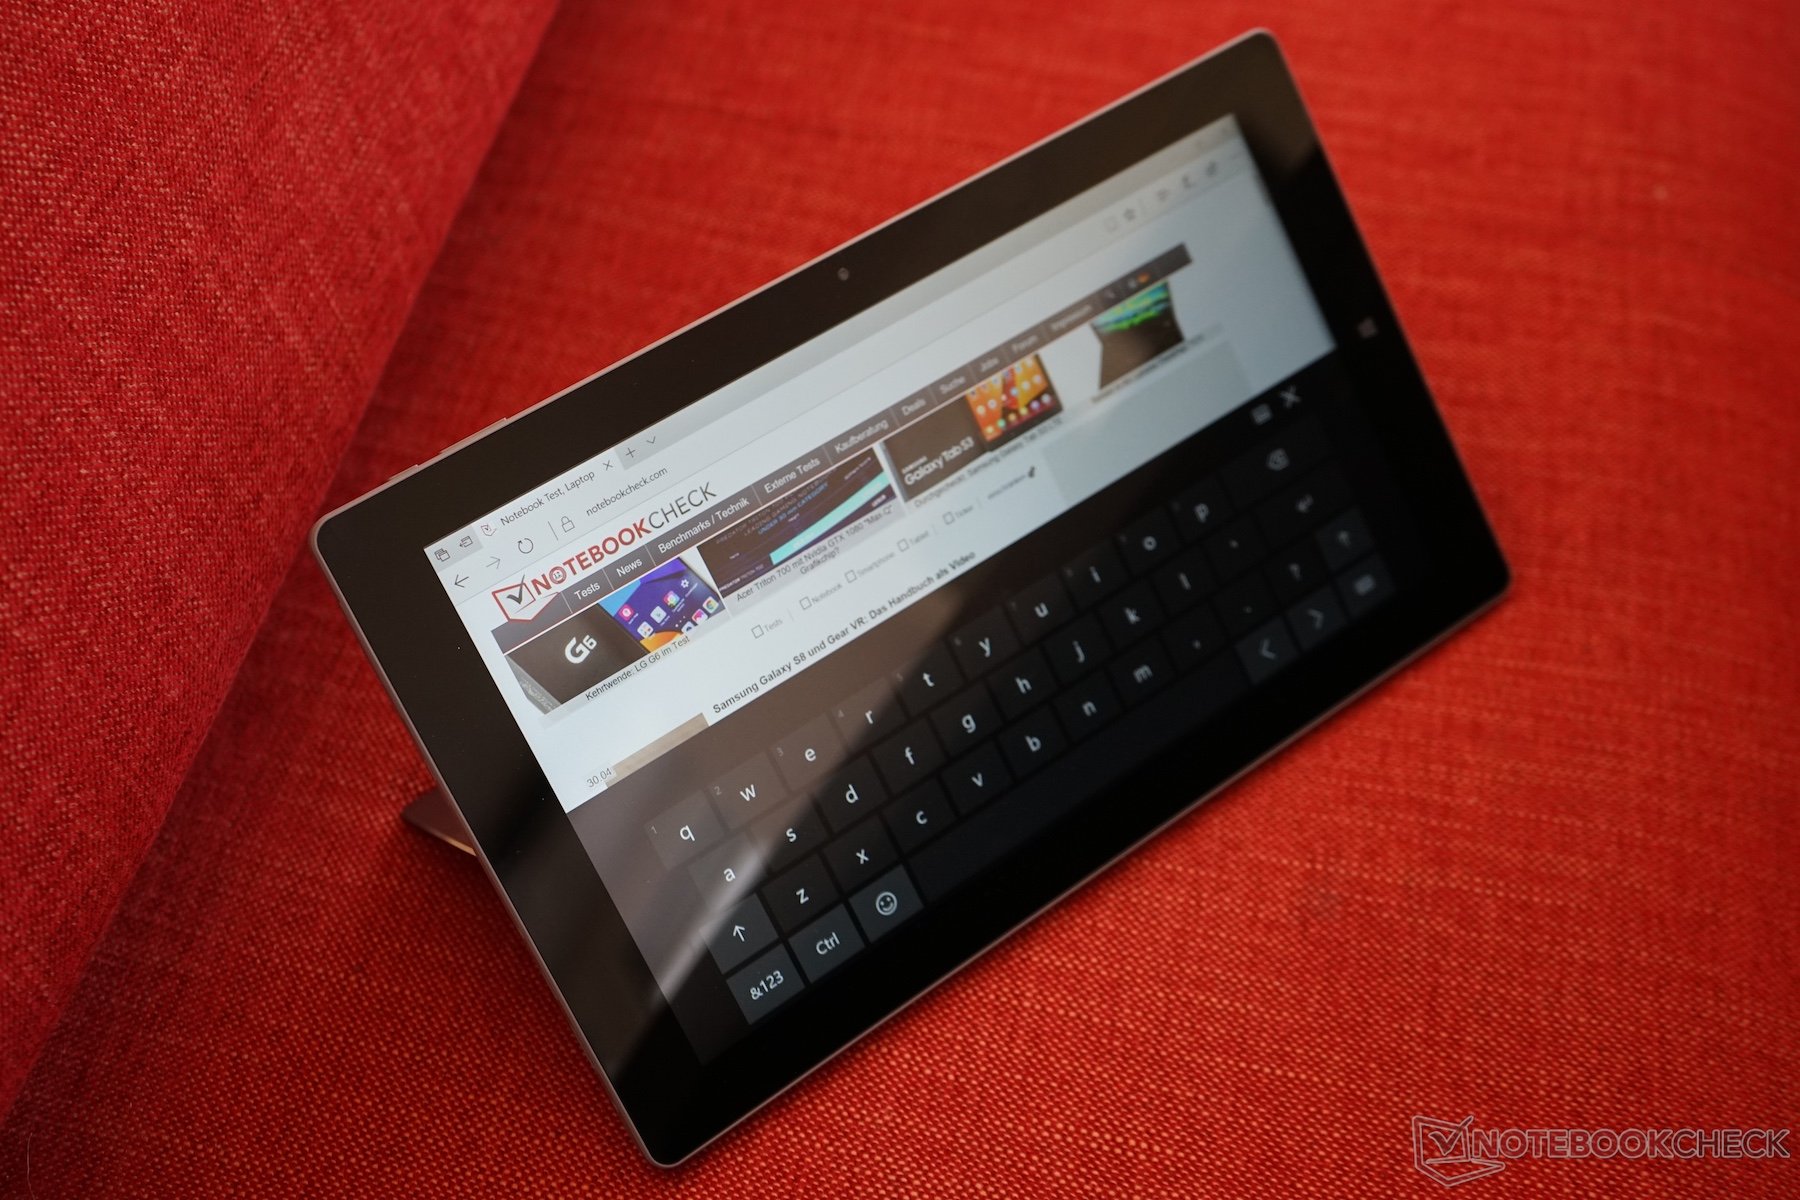
Outro grande ponto de venda é o sistema operacional pré-instalado do Android 6. Durante o curto período de tempo que pudemos usá-lo, ele se desempenhou muito bem e parecia rápido e suave. Infelizmente, a opção de dual-boot (inicialização dupla) desapareceu depois de fazer uma atualização do Windows, por isso não foi possível testá-lo mais.
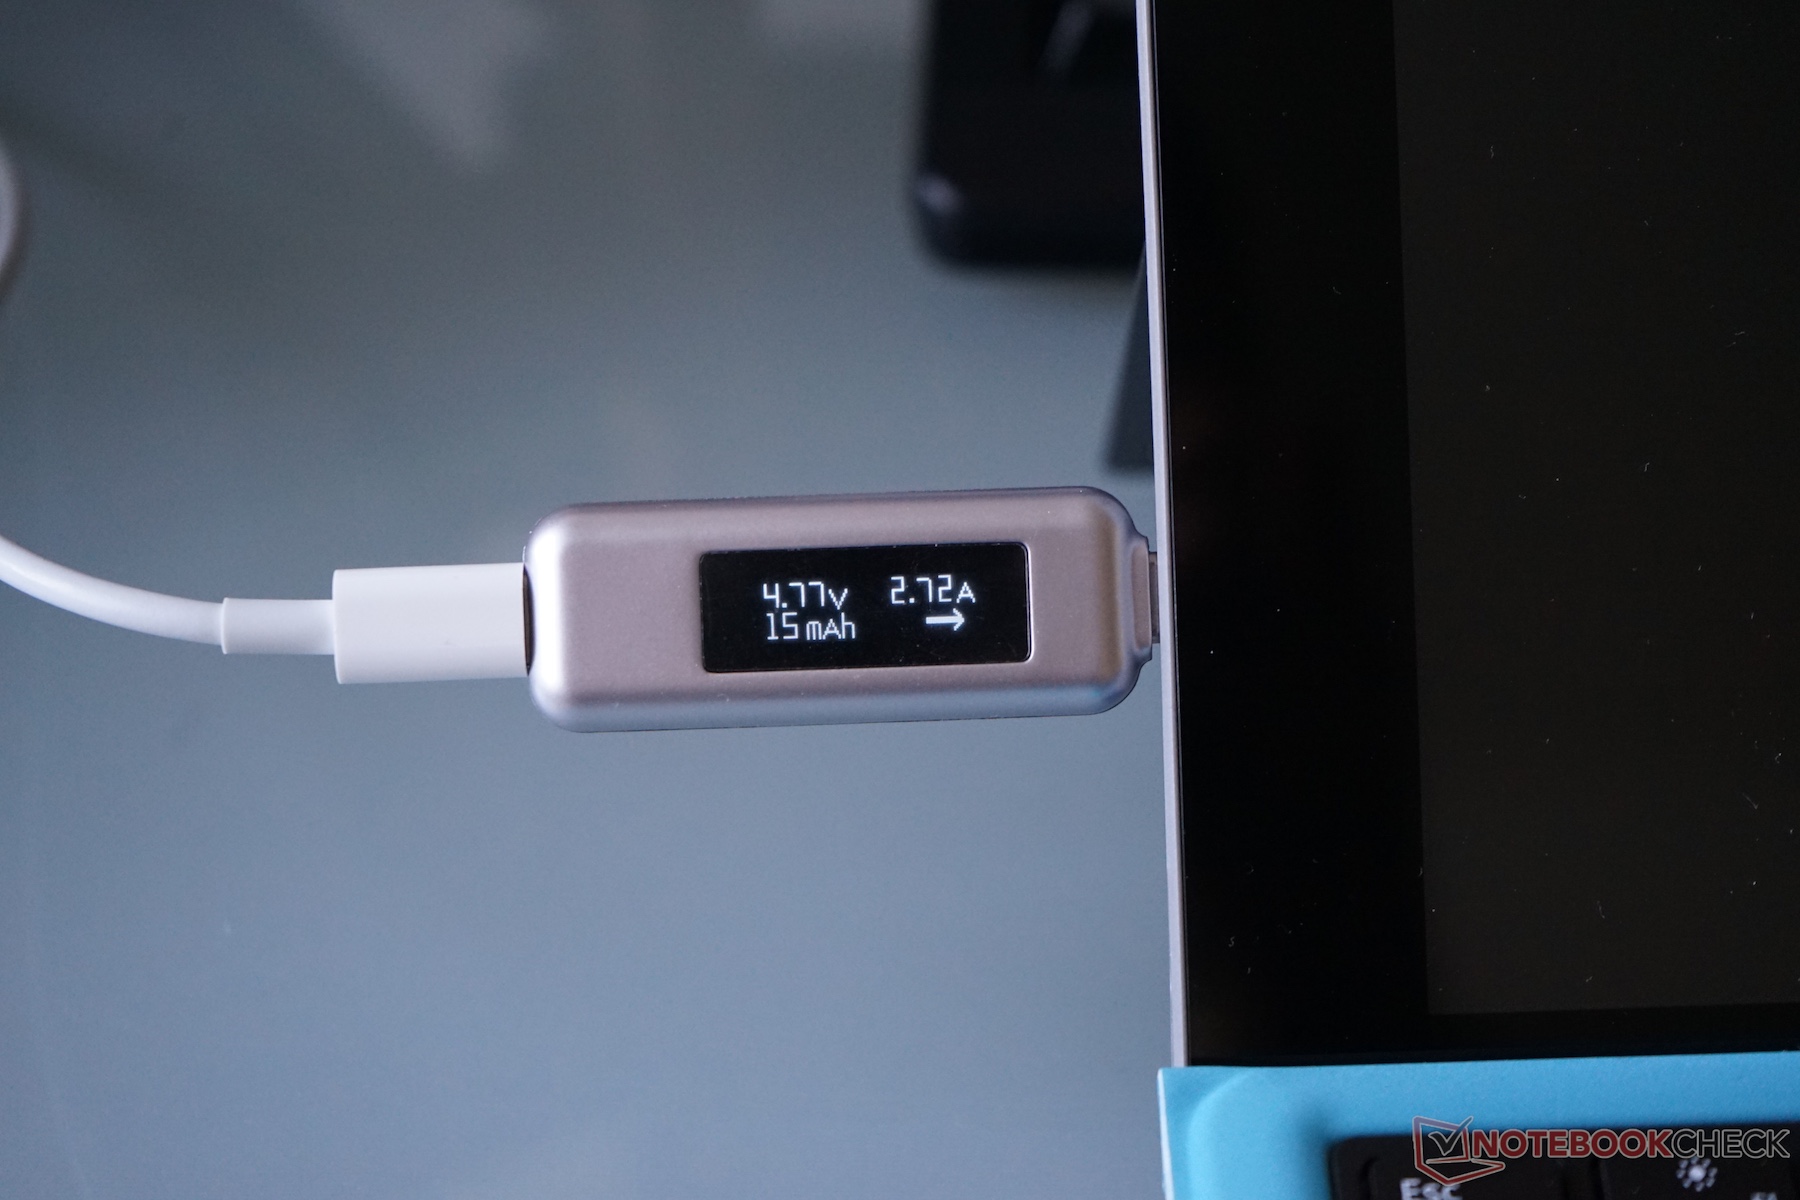
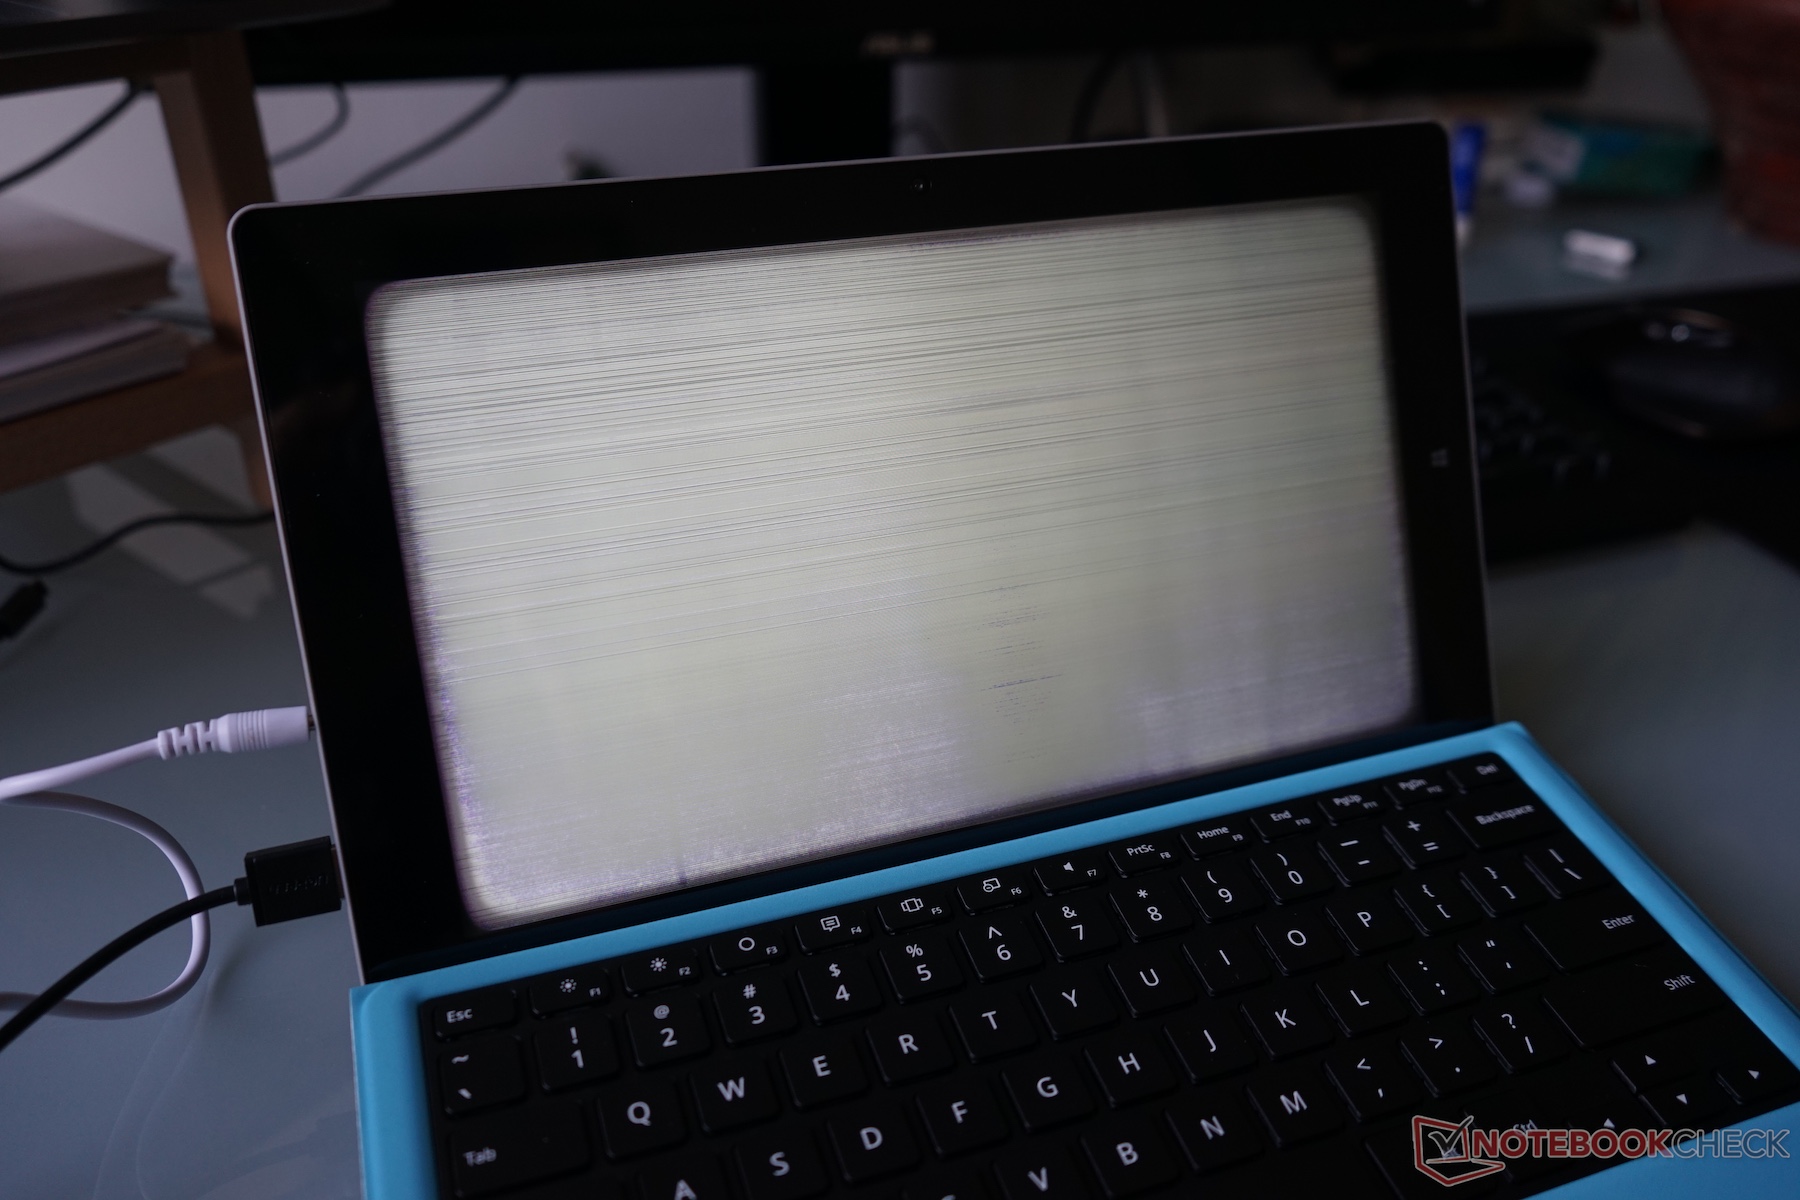
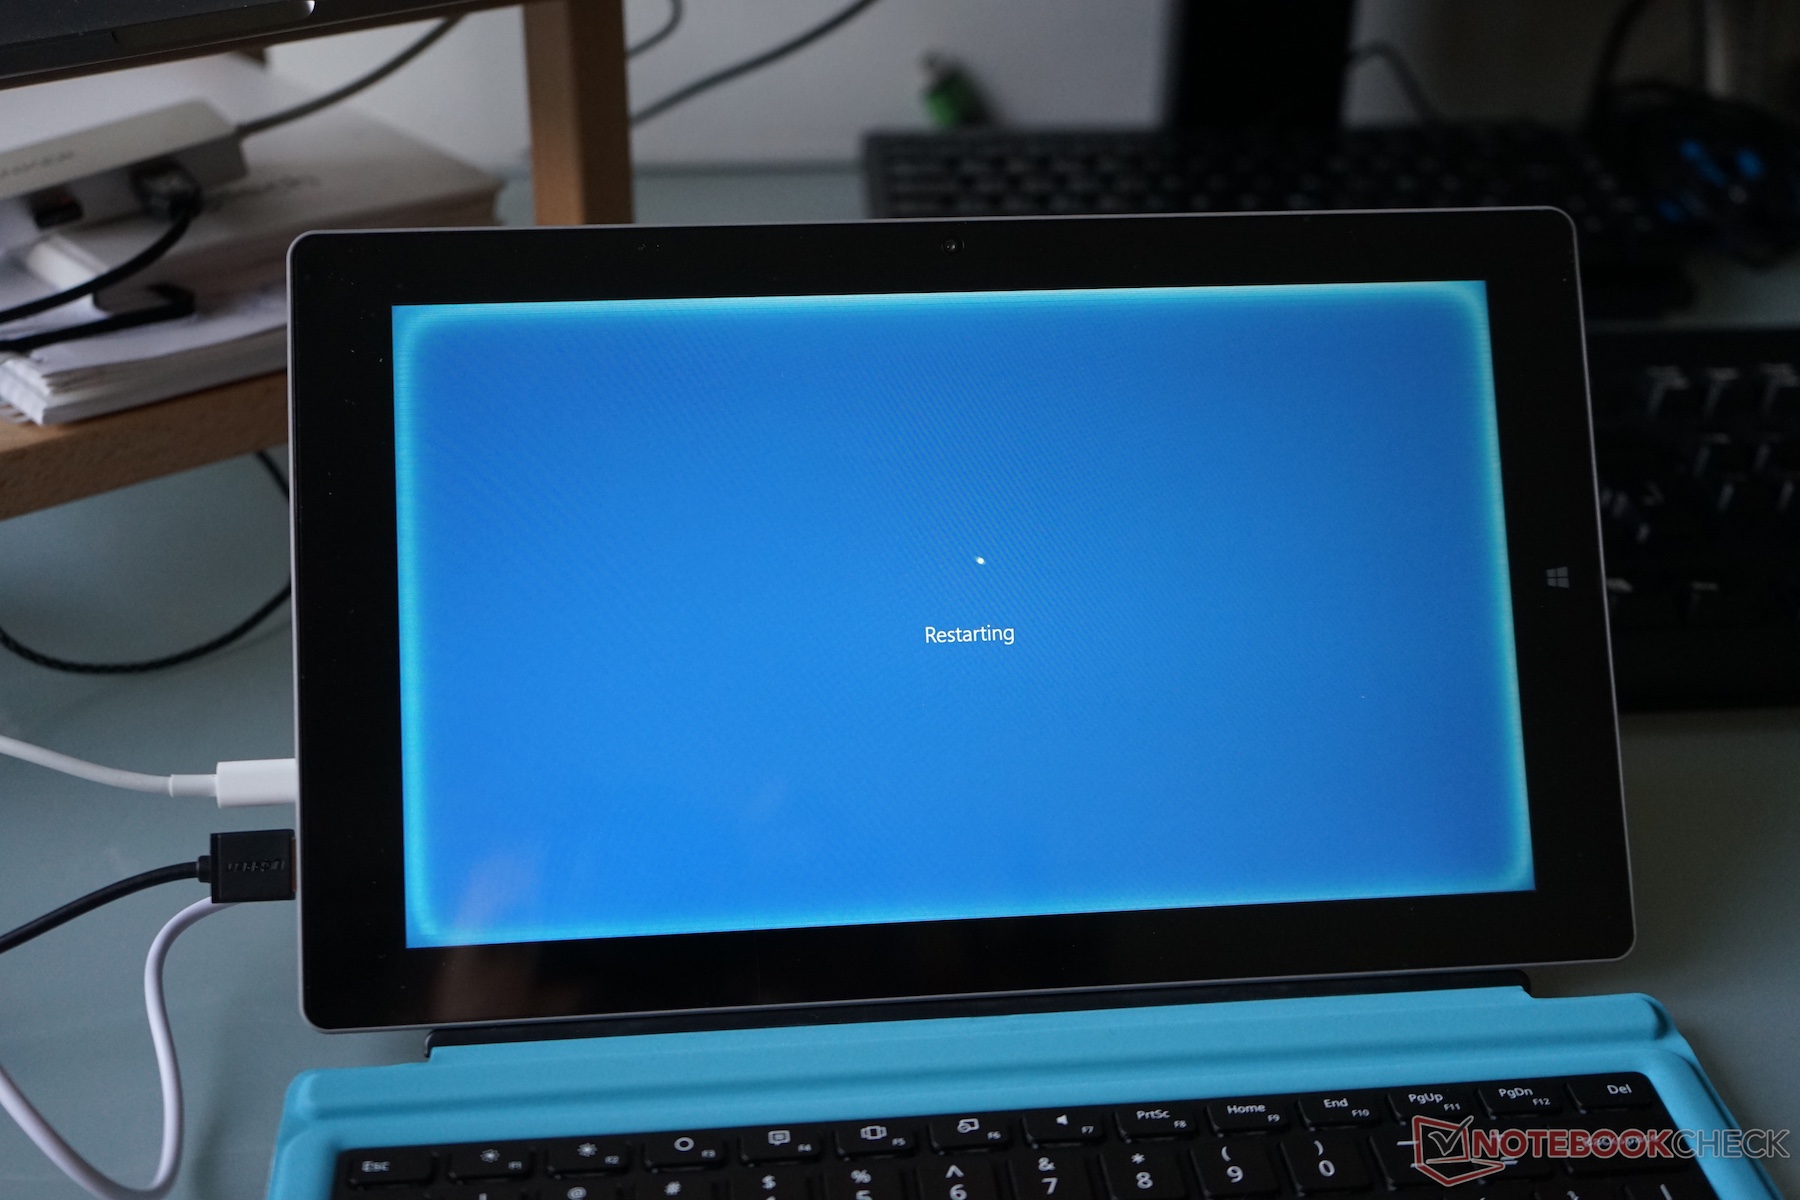
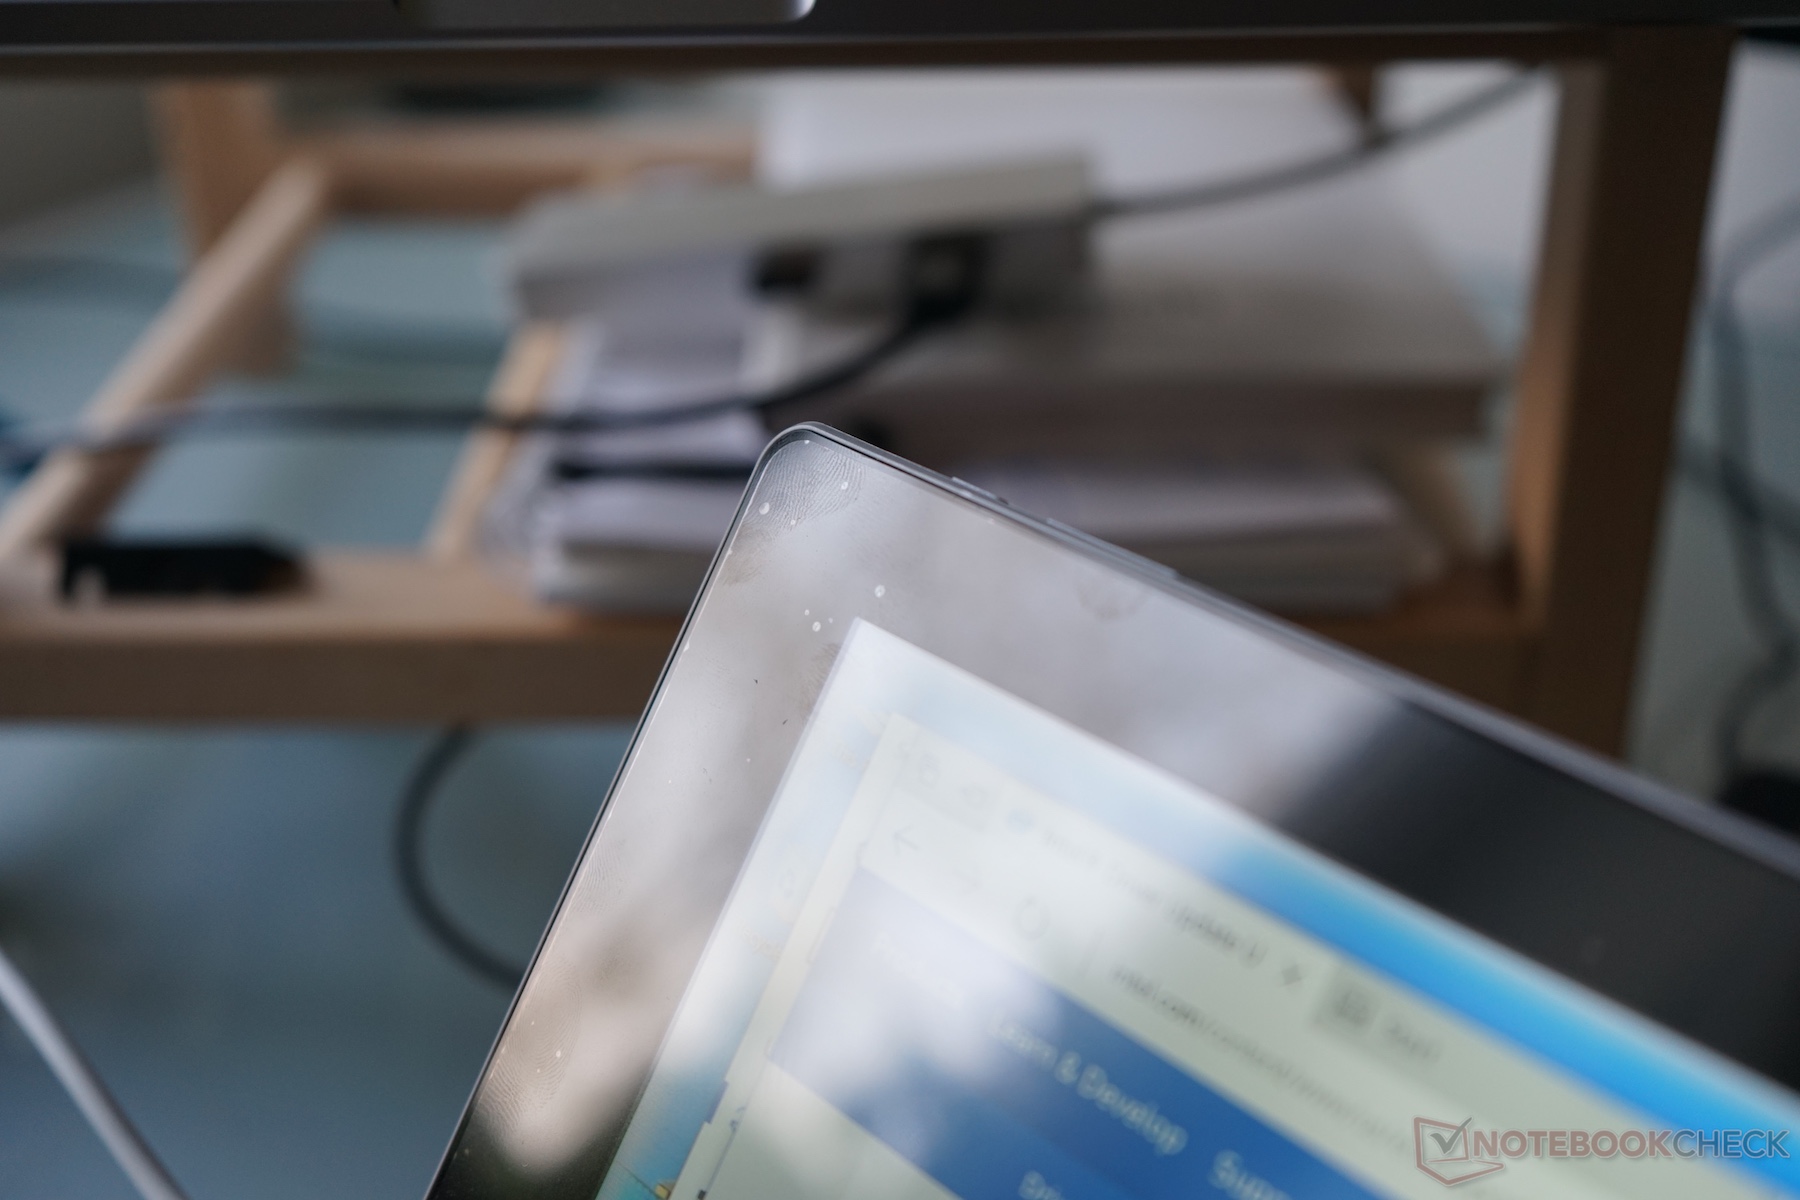
Em geral, sofremos com um conjunto de problemas grandes e menores, como a nossa unidade de teste. Uma manhã, a tela se recusou a mostrar nada além de ruído branco e o dispositivo teve que ser reiniciado. Por algum motivo, depois as bordas permaneceram mais brilhantes do que o resto da tela por algumas horas. O carregador faltante também causou algumas dores de cabeça importantes - nem o carregador USB-C da Apple nem o da Inateck nem o Anker funcionaram bem e consistentemente com o aparelho. Às vezes, ele recusava-se a carregar completamente; às vezes, ele mudava de idéia a cada segundo; e, às vezes, perdia conexão depois que a bateria estava completamente carregada.
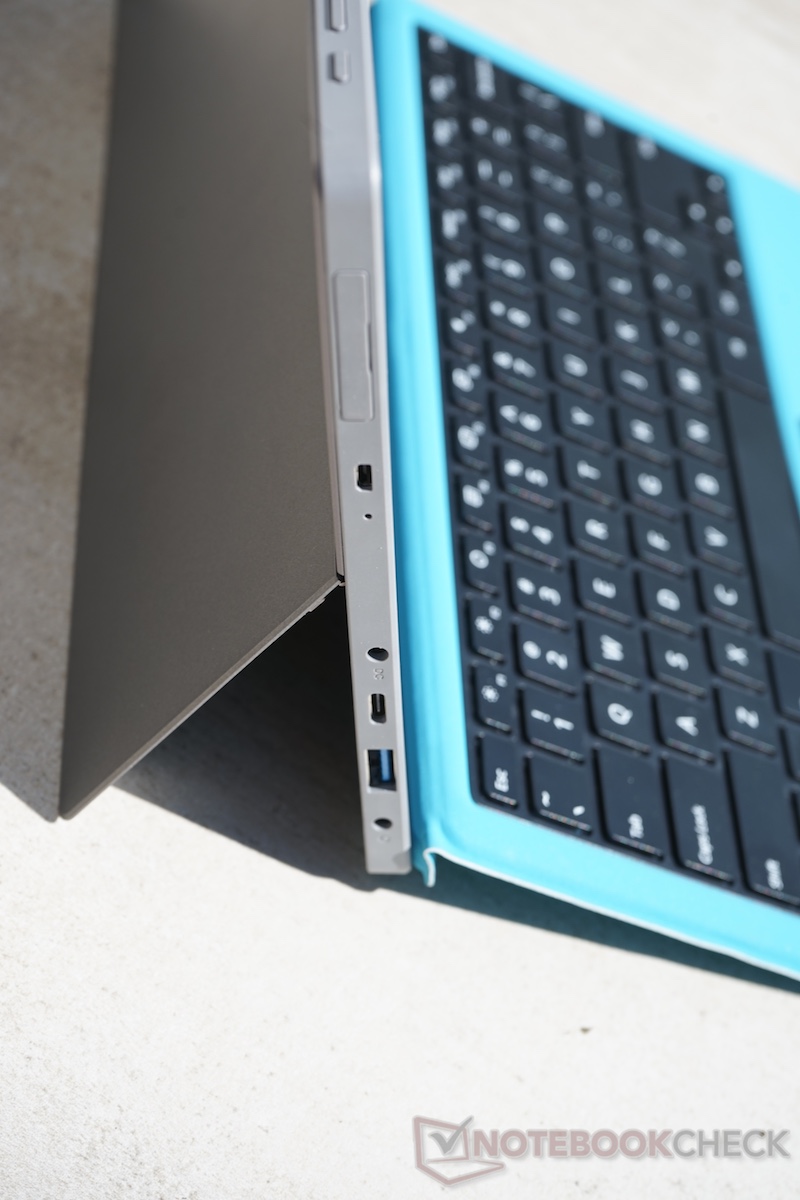
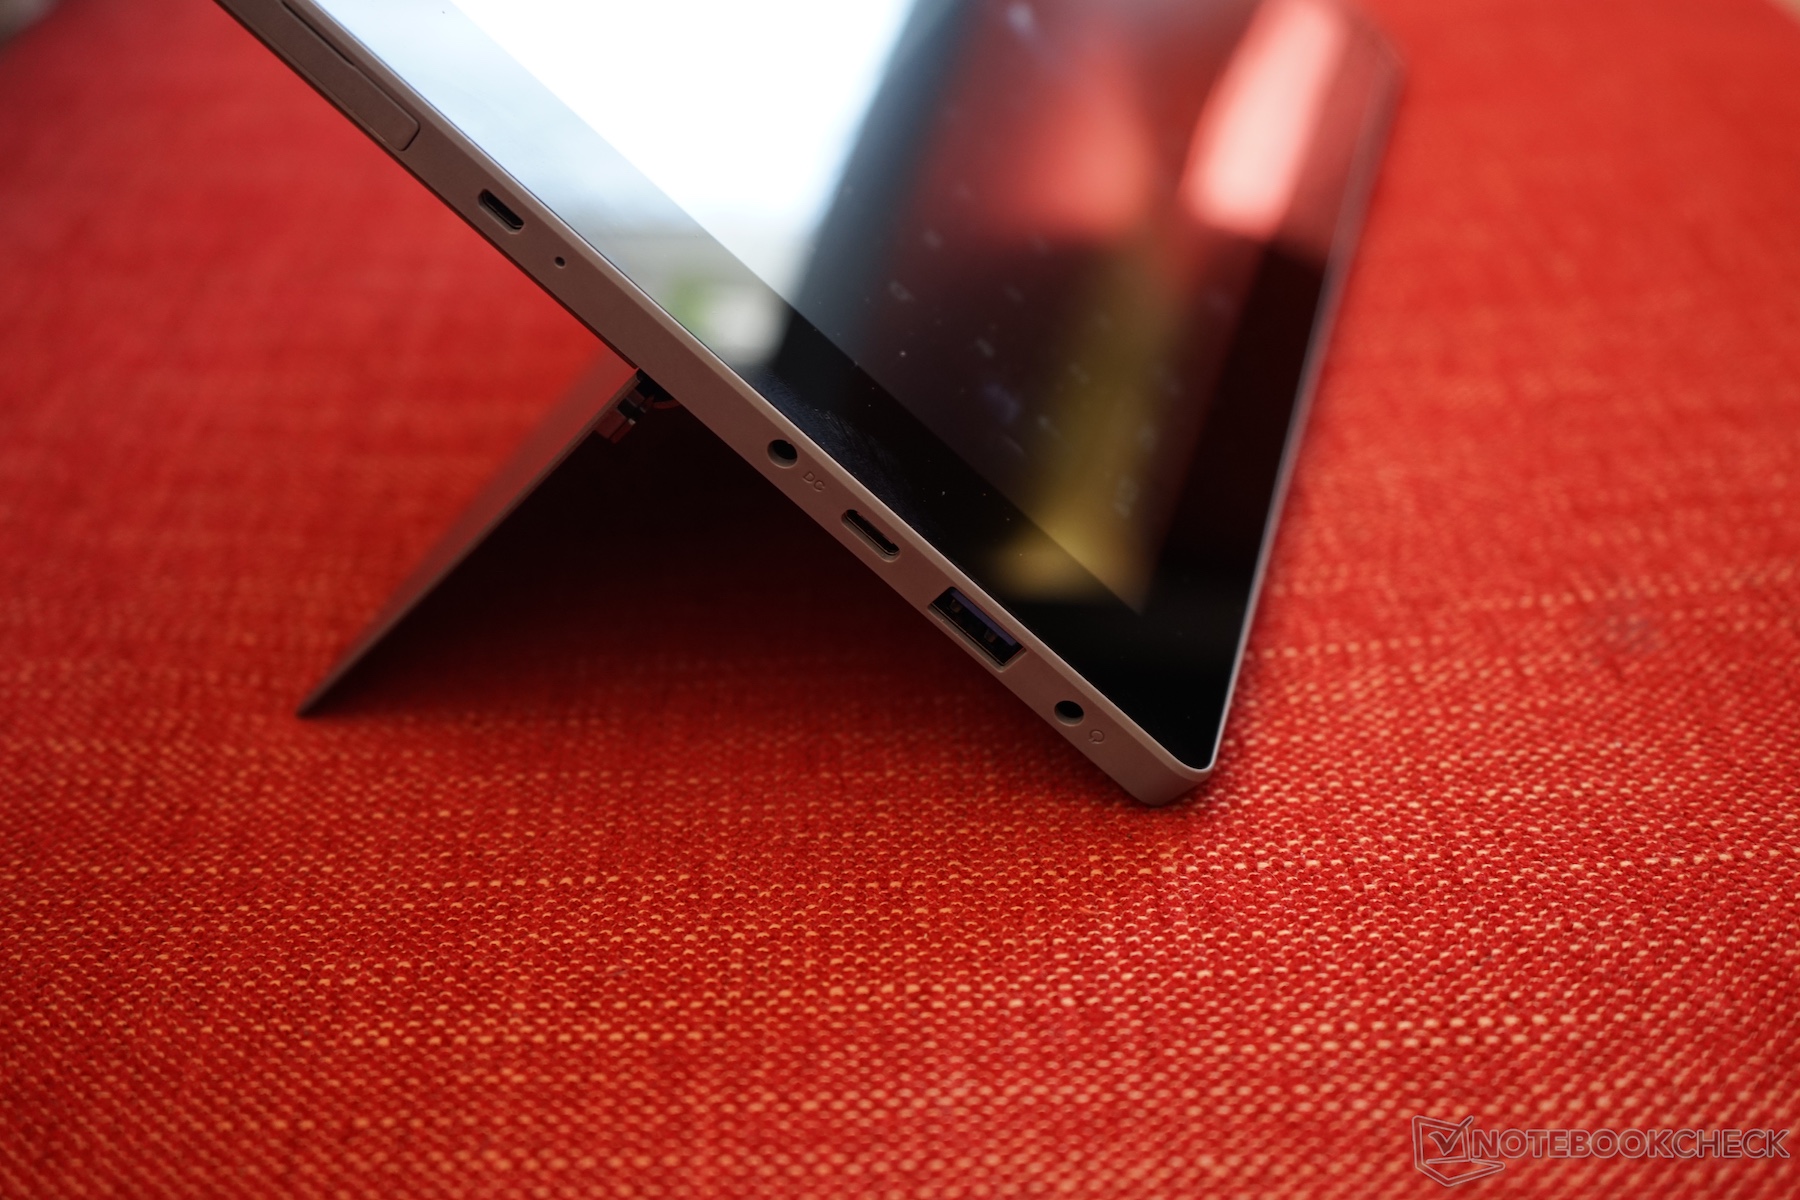
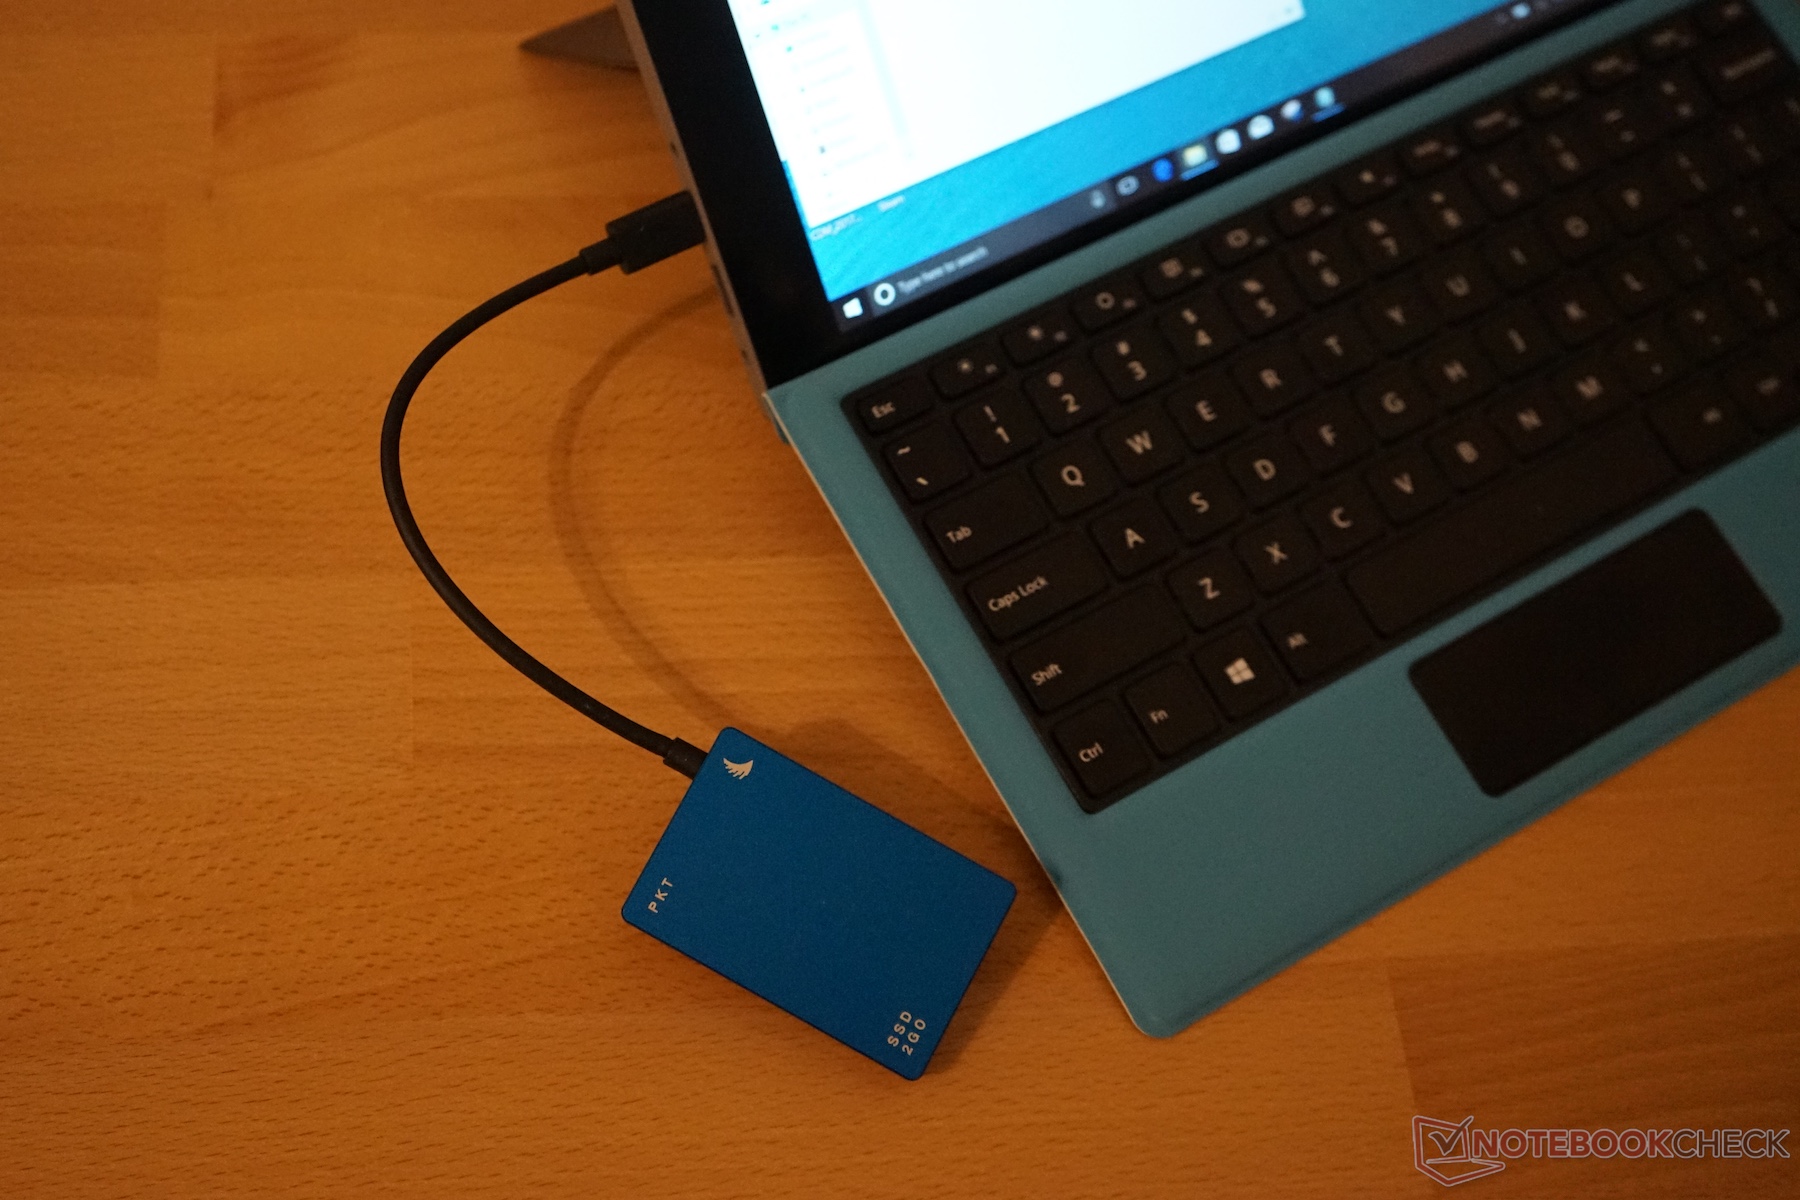
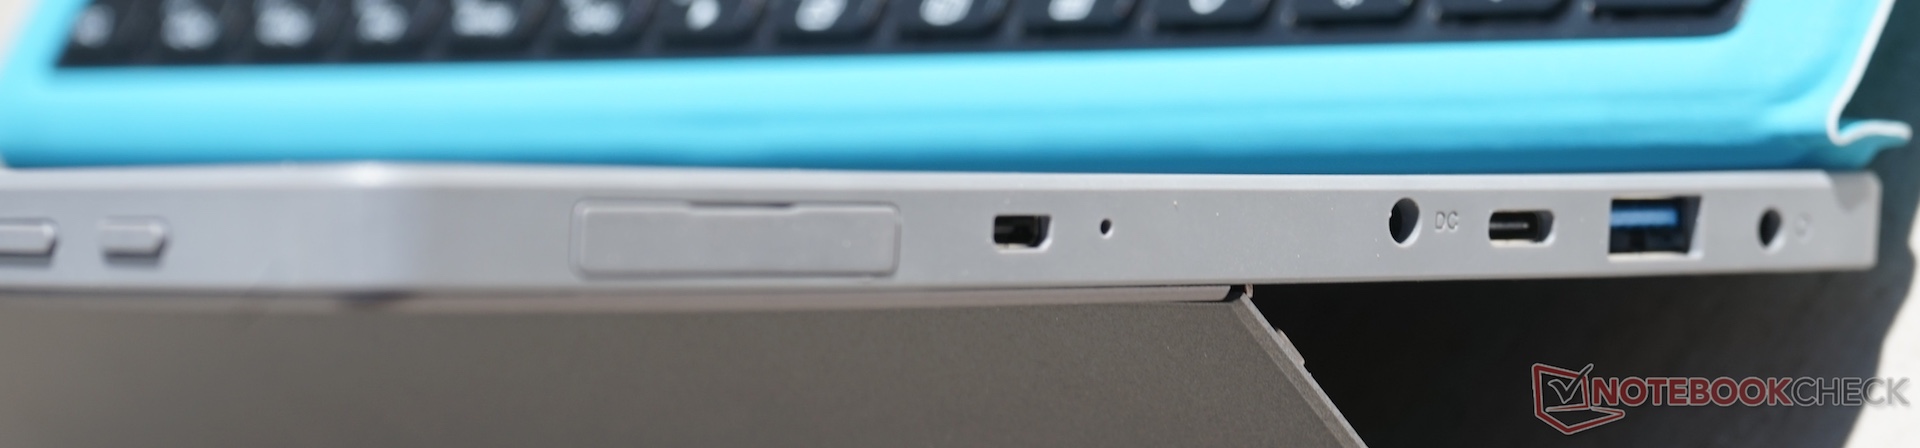
As portas USB integradas não funcionaram como o esperado, e não conseguimos usar um SSD externo SSDs, como o G-Drive, o Angelbird, ou o OCZ. Outros dispositivos, como um disco rígido externo ou o SanDisk Extreme 900, funcionaram perfeitamente. Nosso palpite é que as portas USB não são suficientemente potentes. O modo standby também foi um problema com este aparelho. Além do alto consumo de bateria no modo standby, o tablet às vezes simplesmente permaneceu ativo com a tela desligada e algum processo de fundo causando uma alta carga da CPU, drenando a bateria completamente em pouco tempo. Não conseguimos determinar a causa disto; nosso melhor palpite é que é um controlador defeituoso ou com bugs, do aparelho.
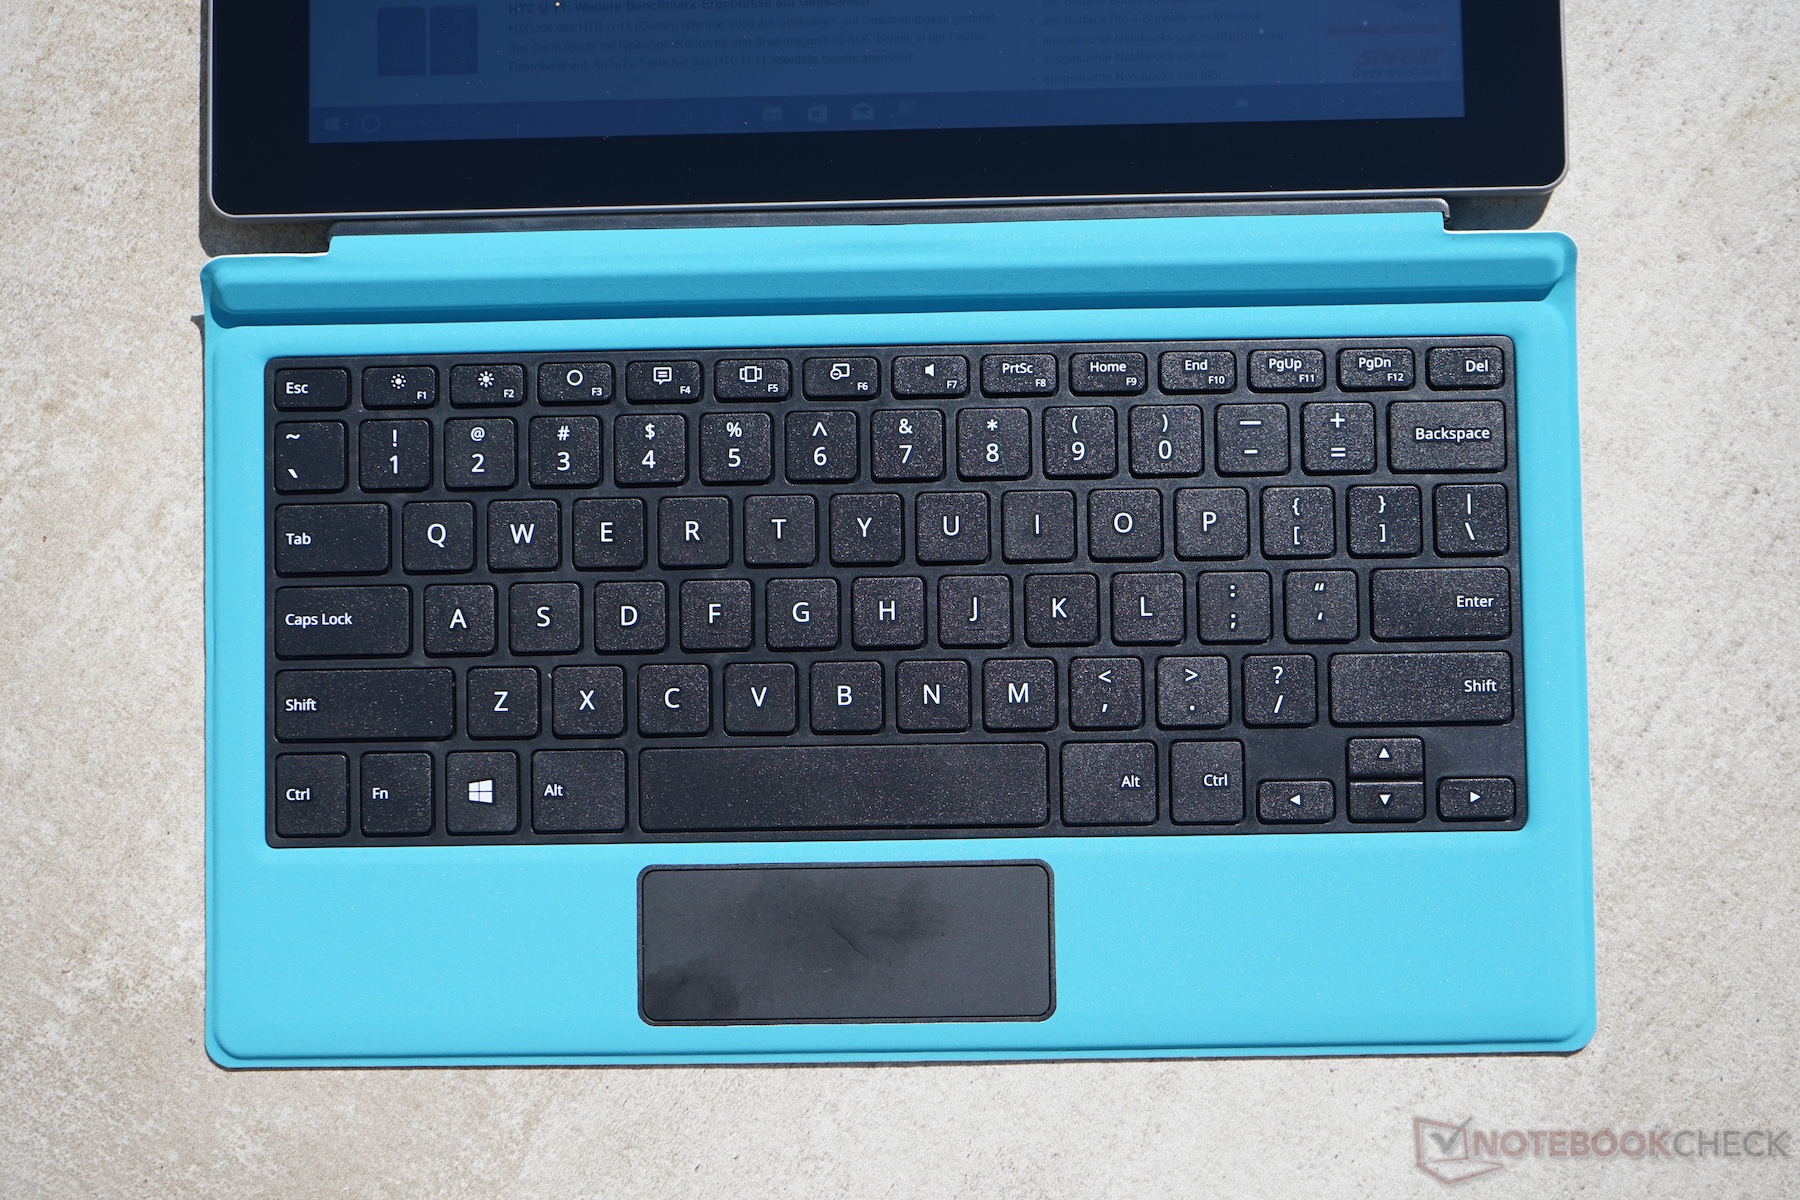
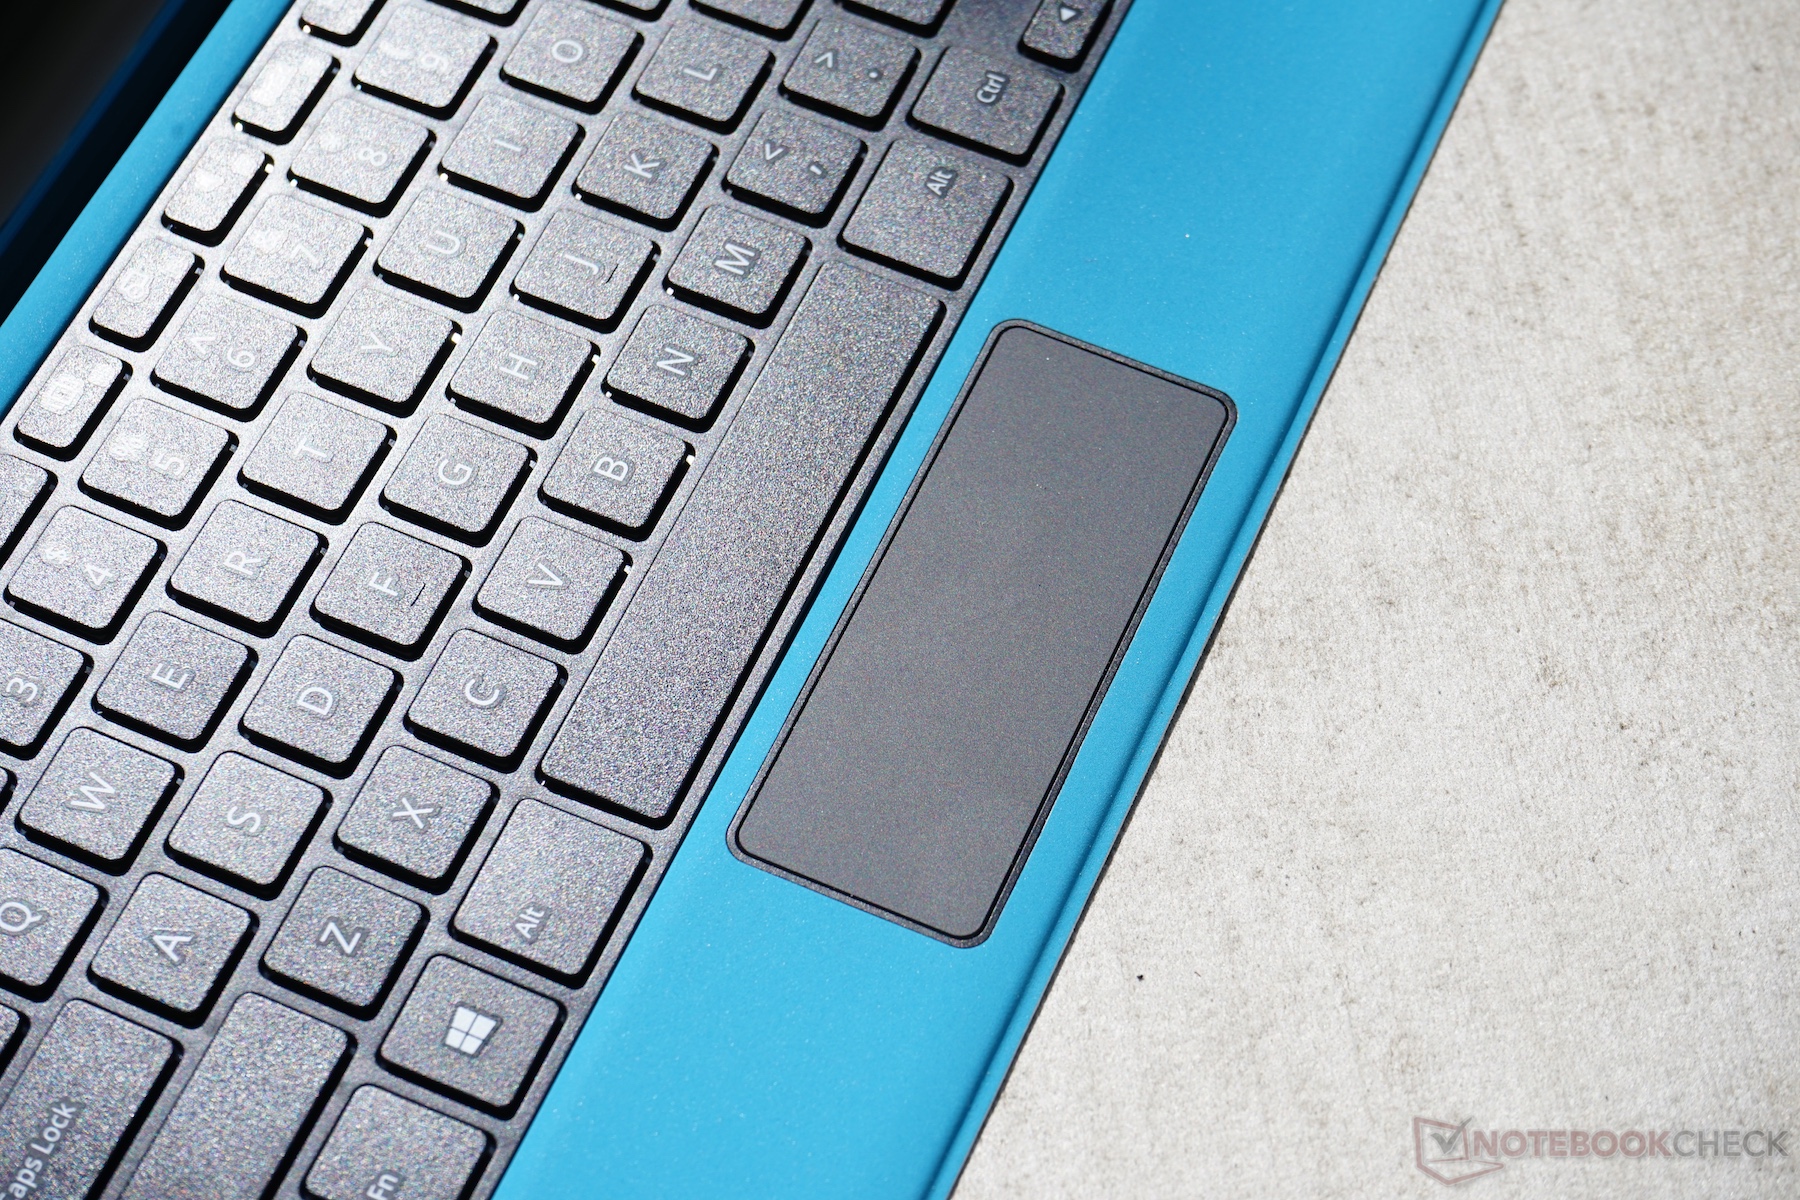
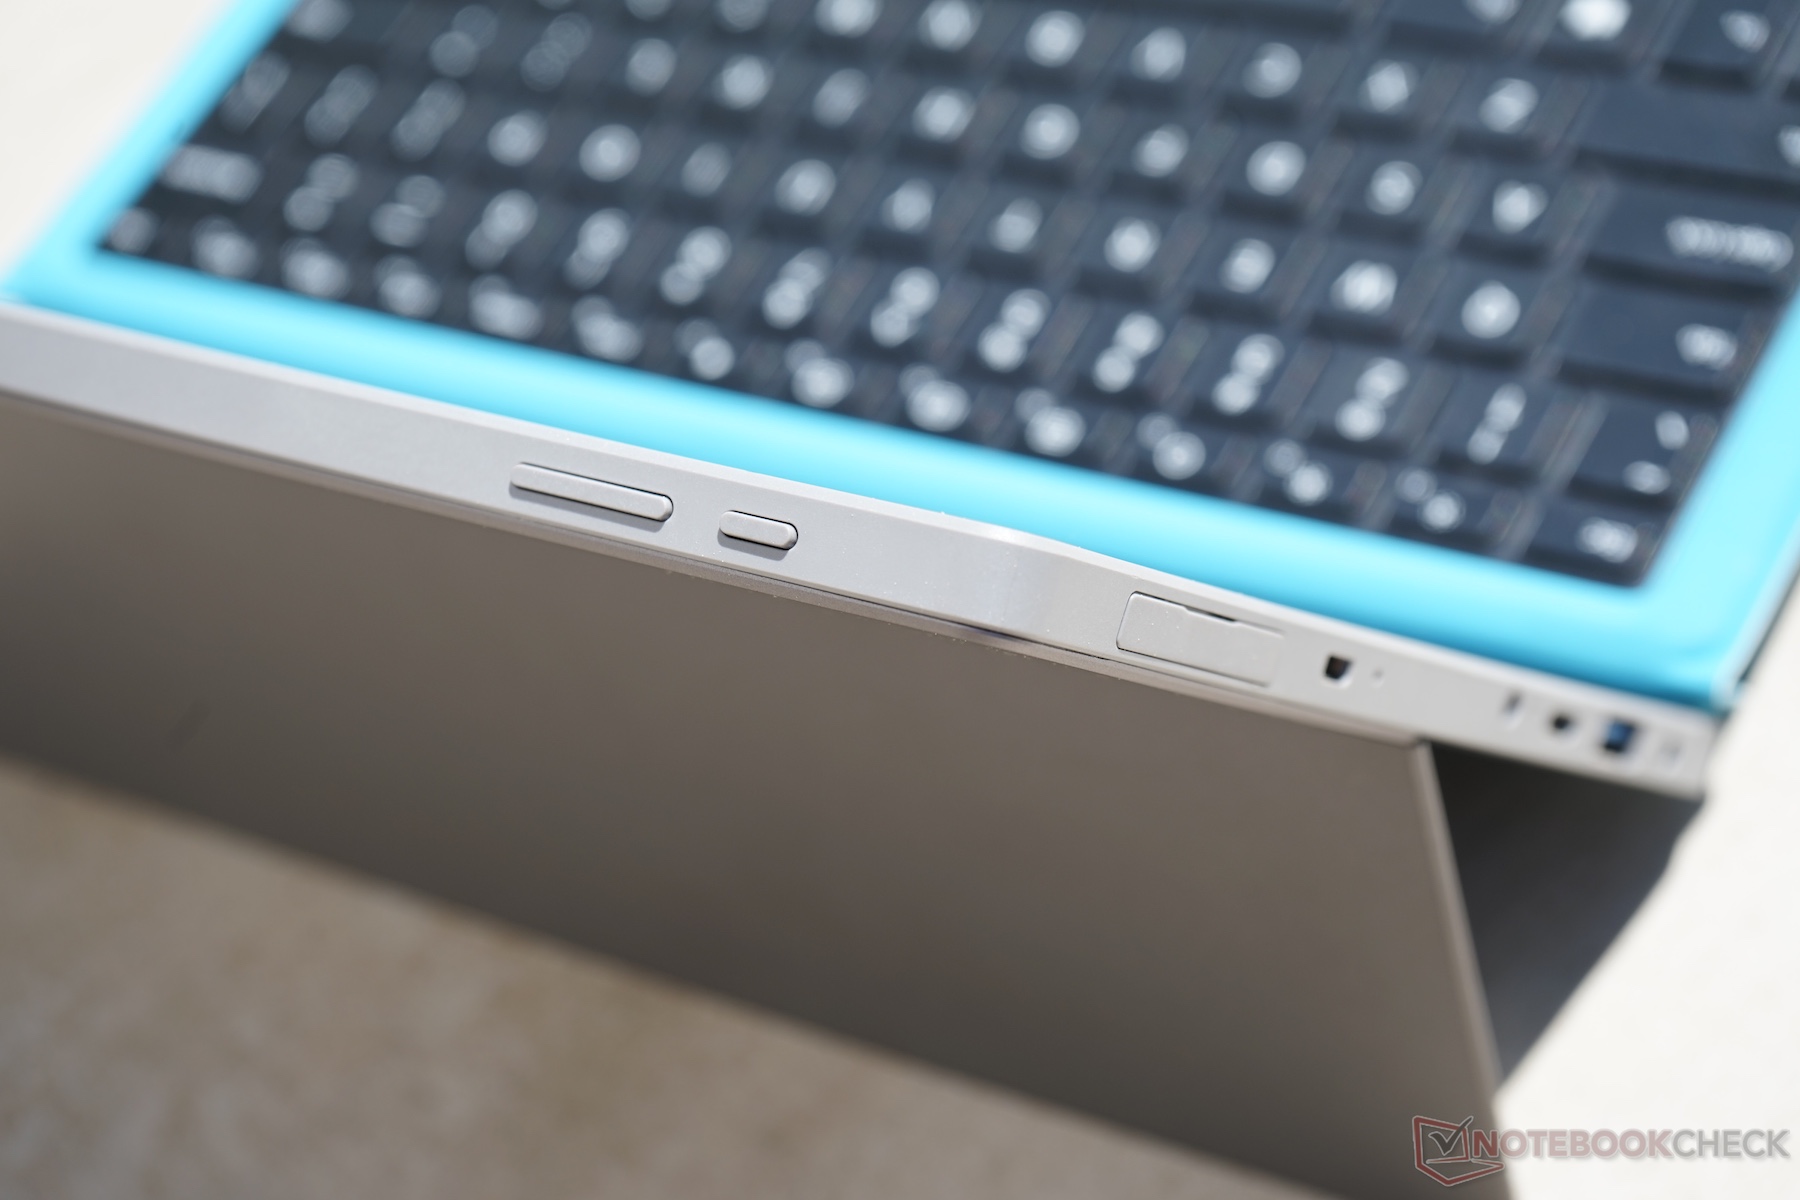
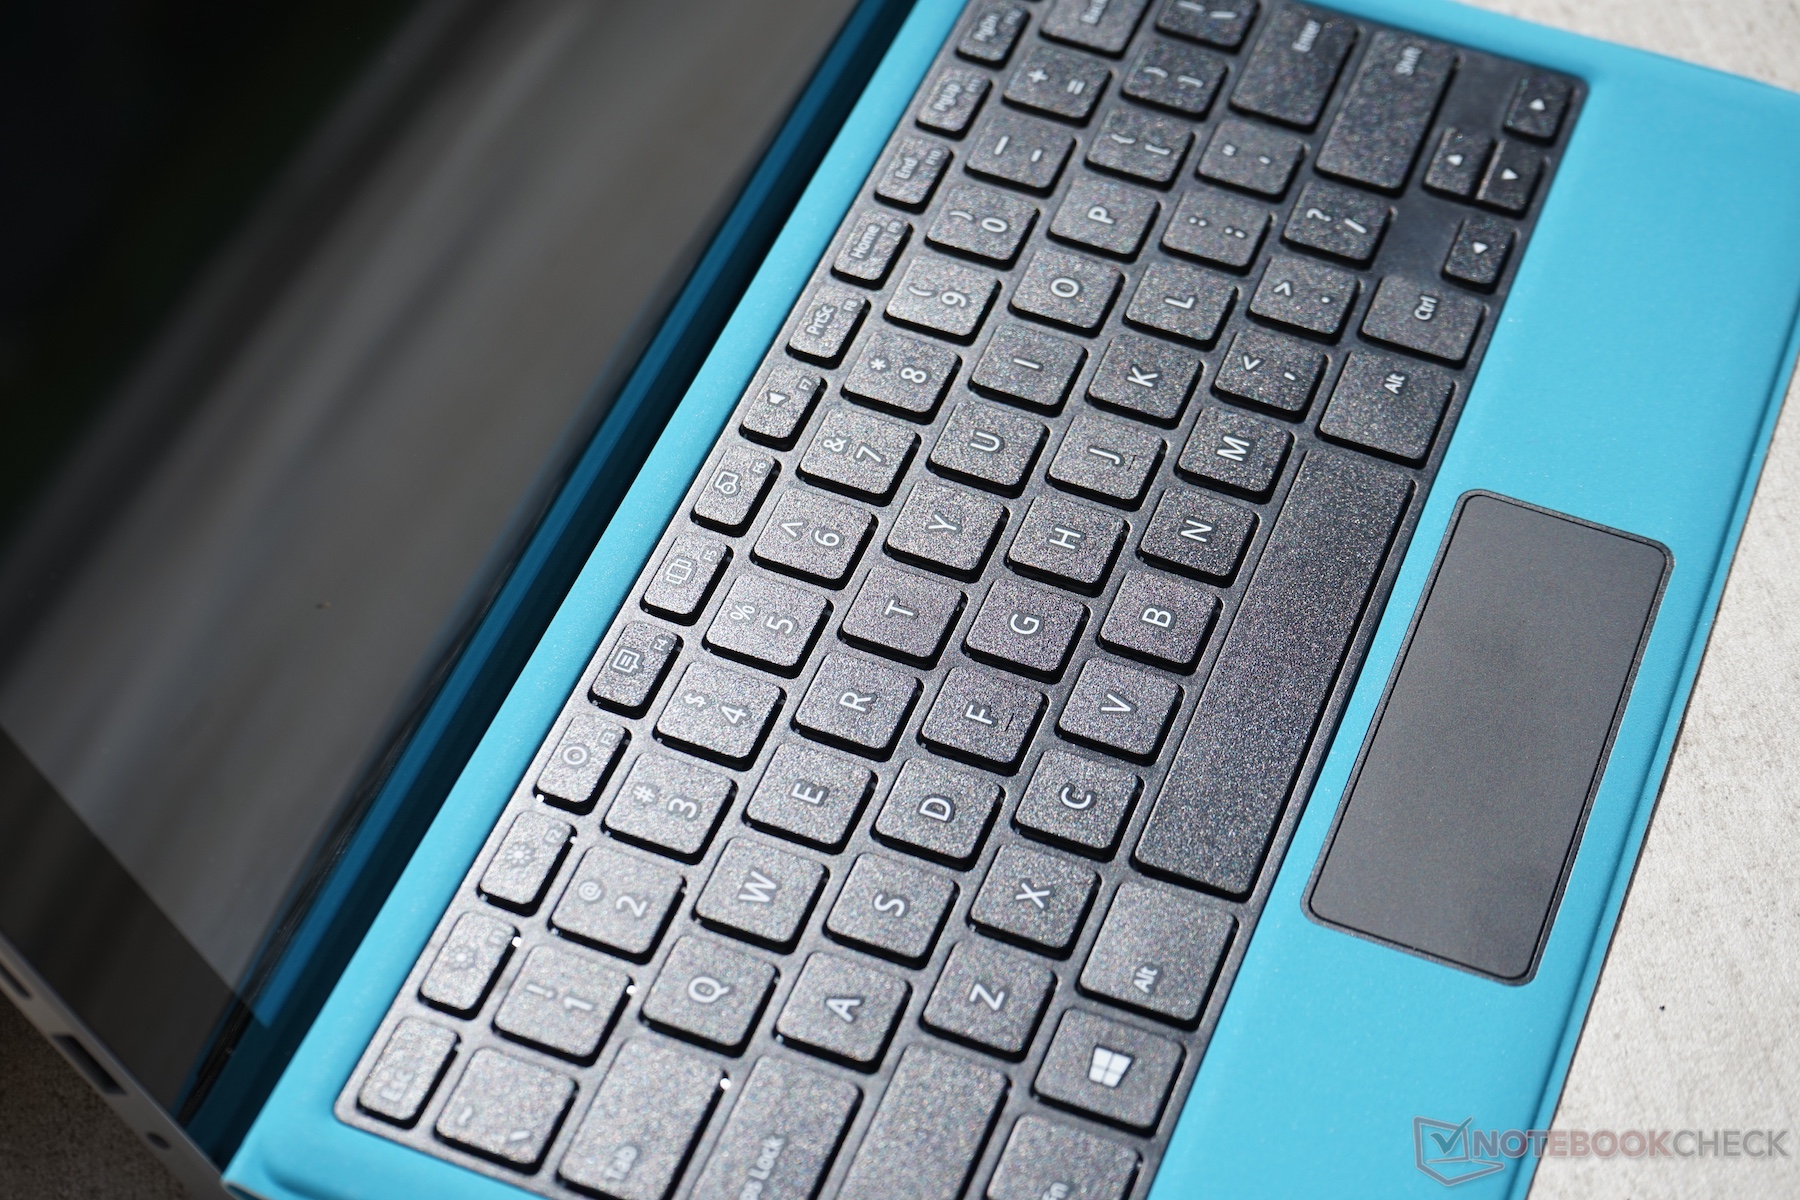
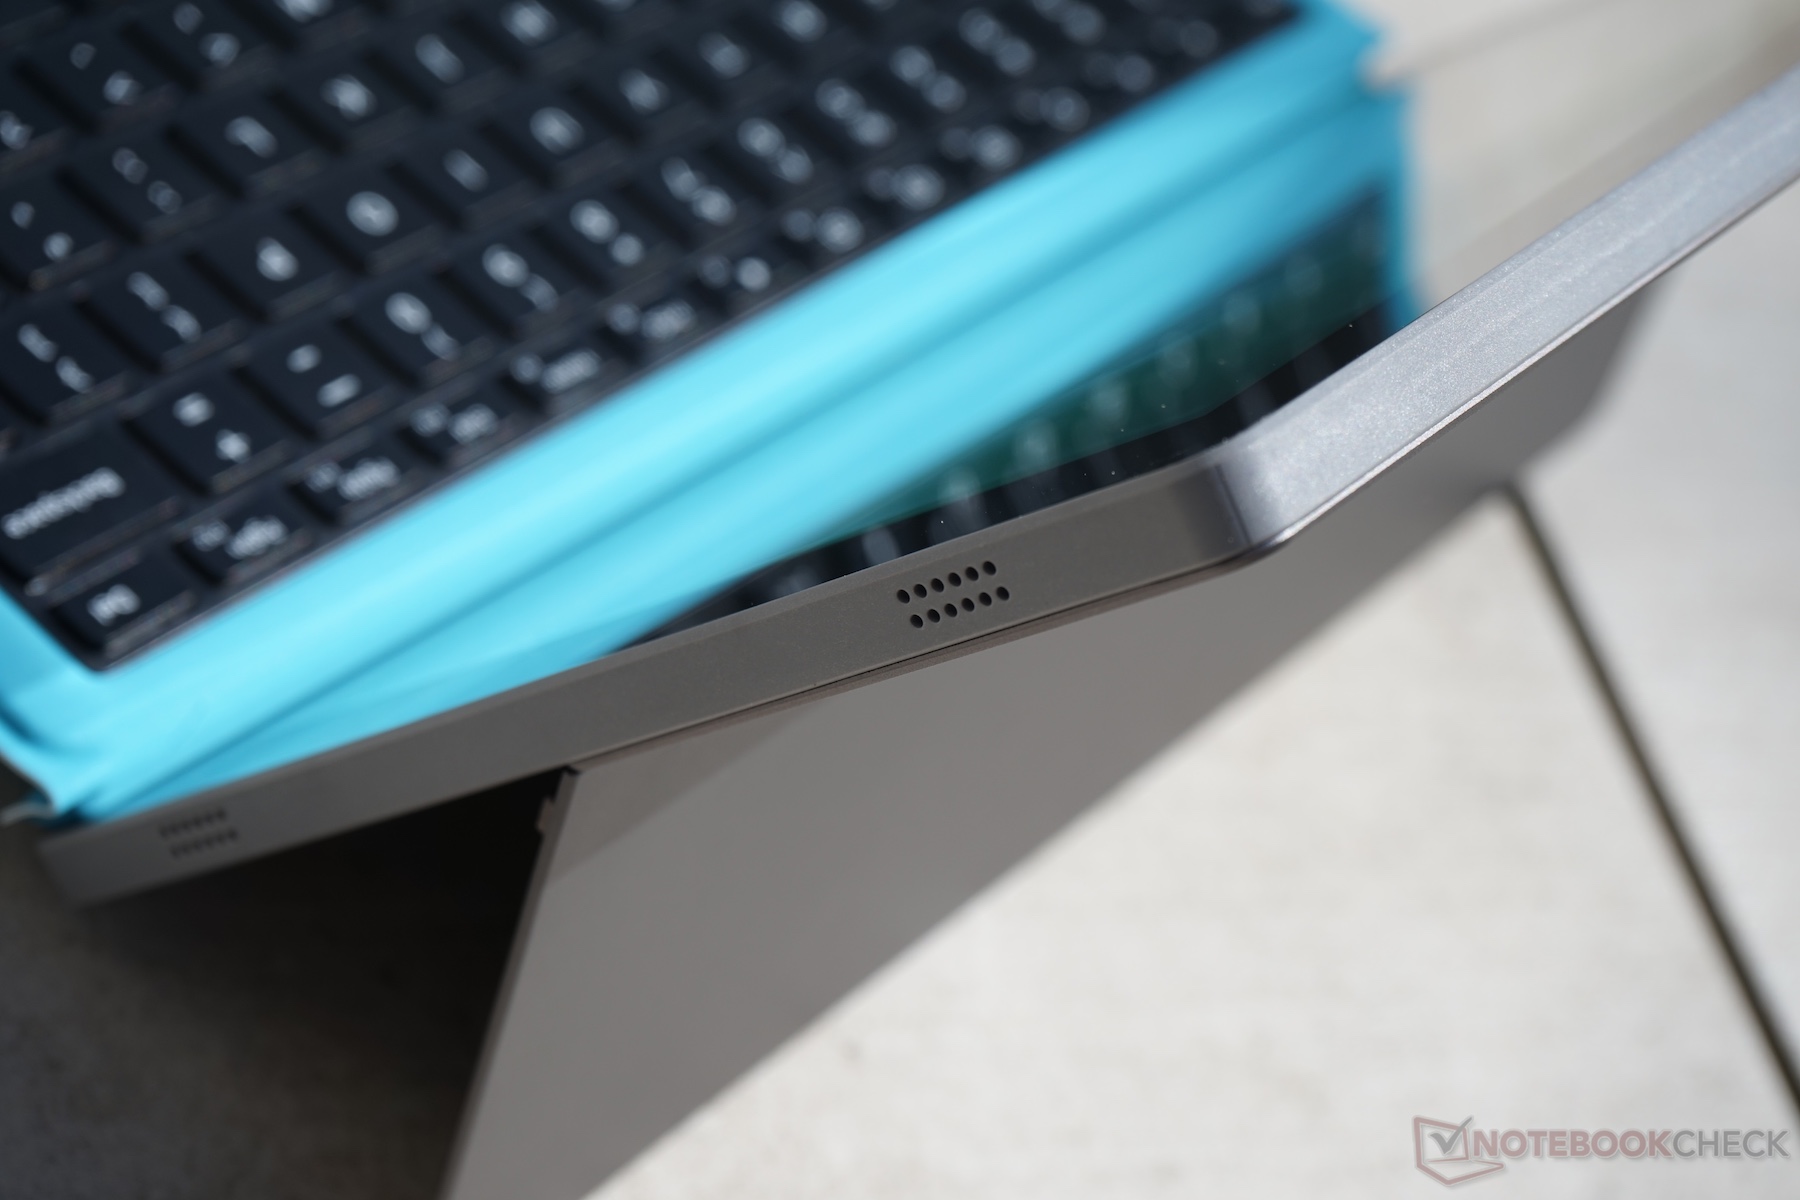
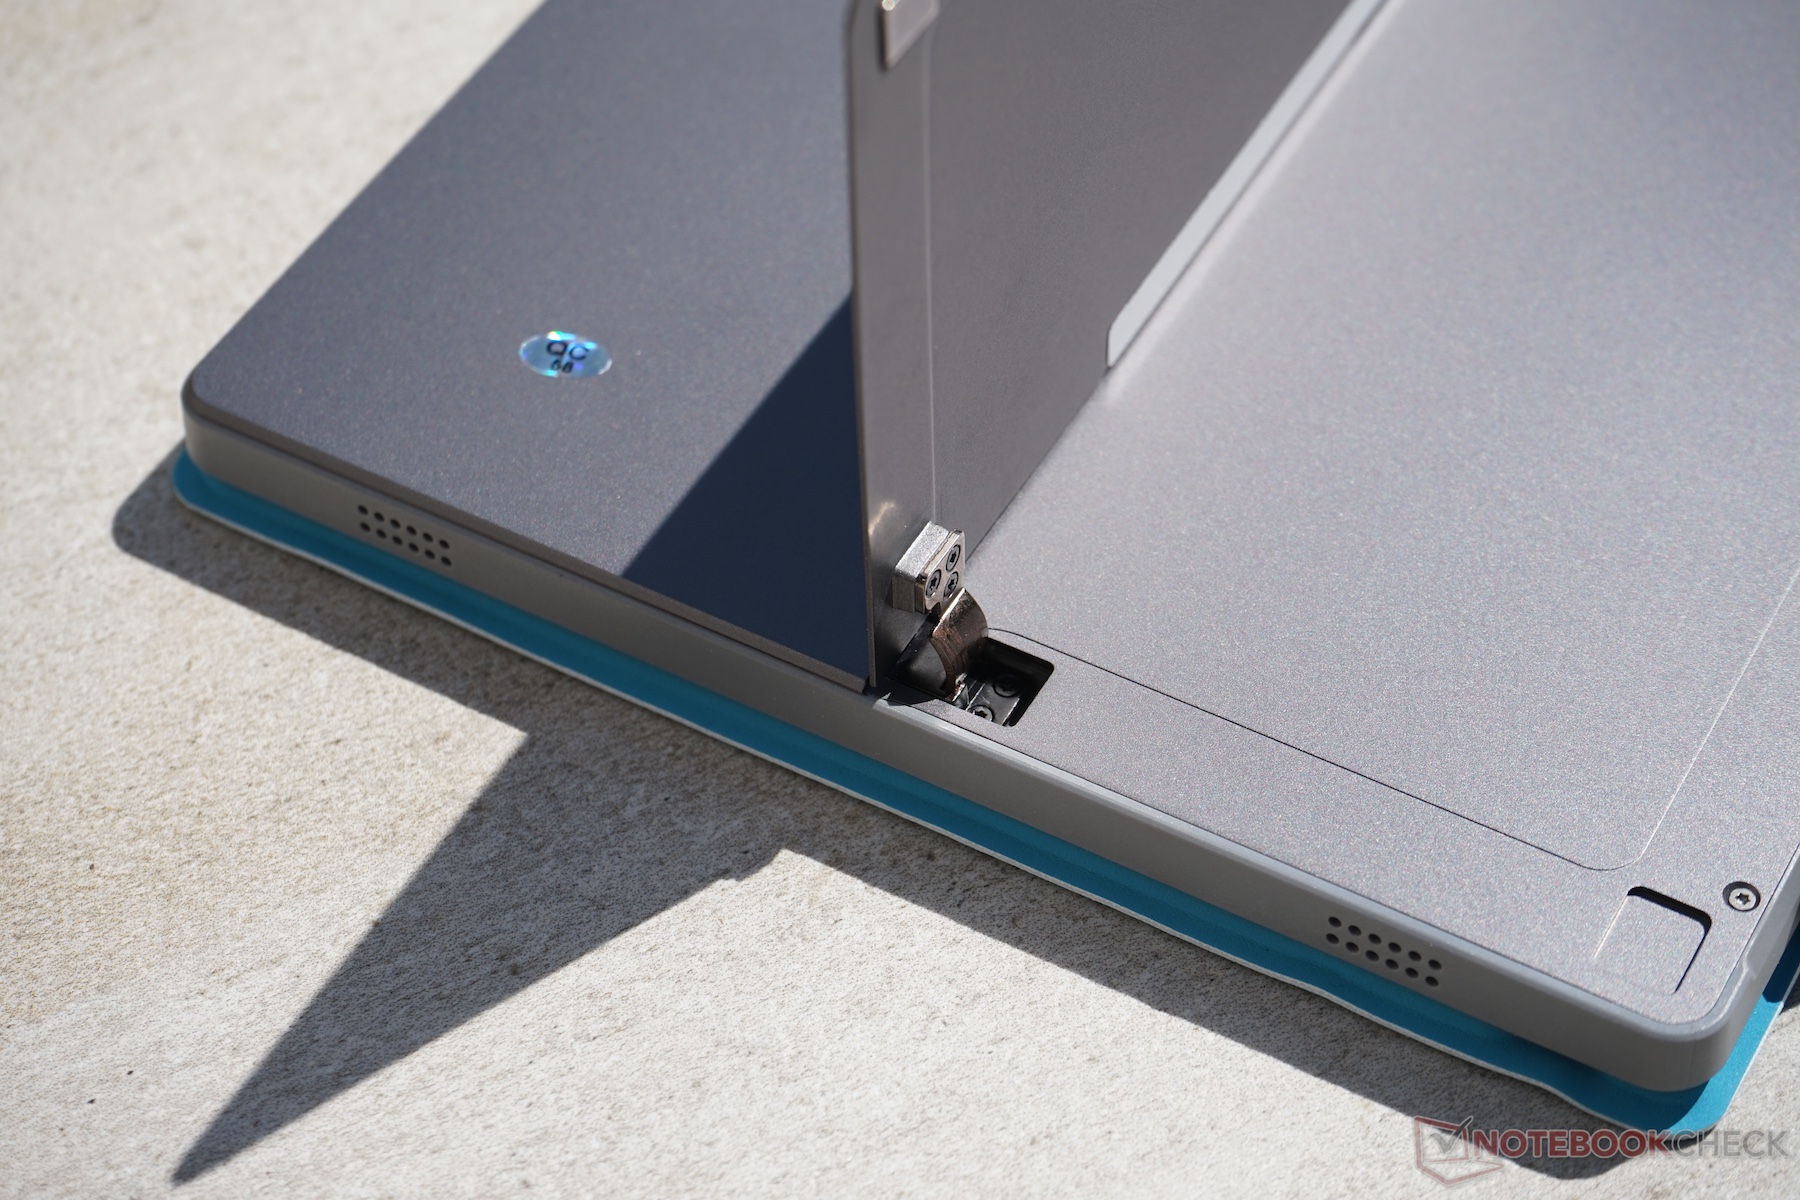
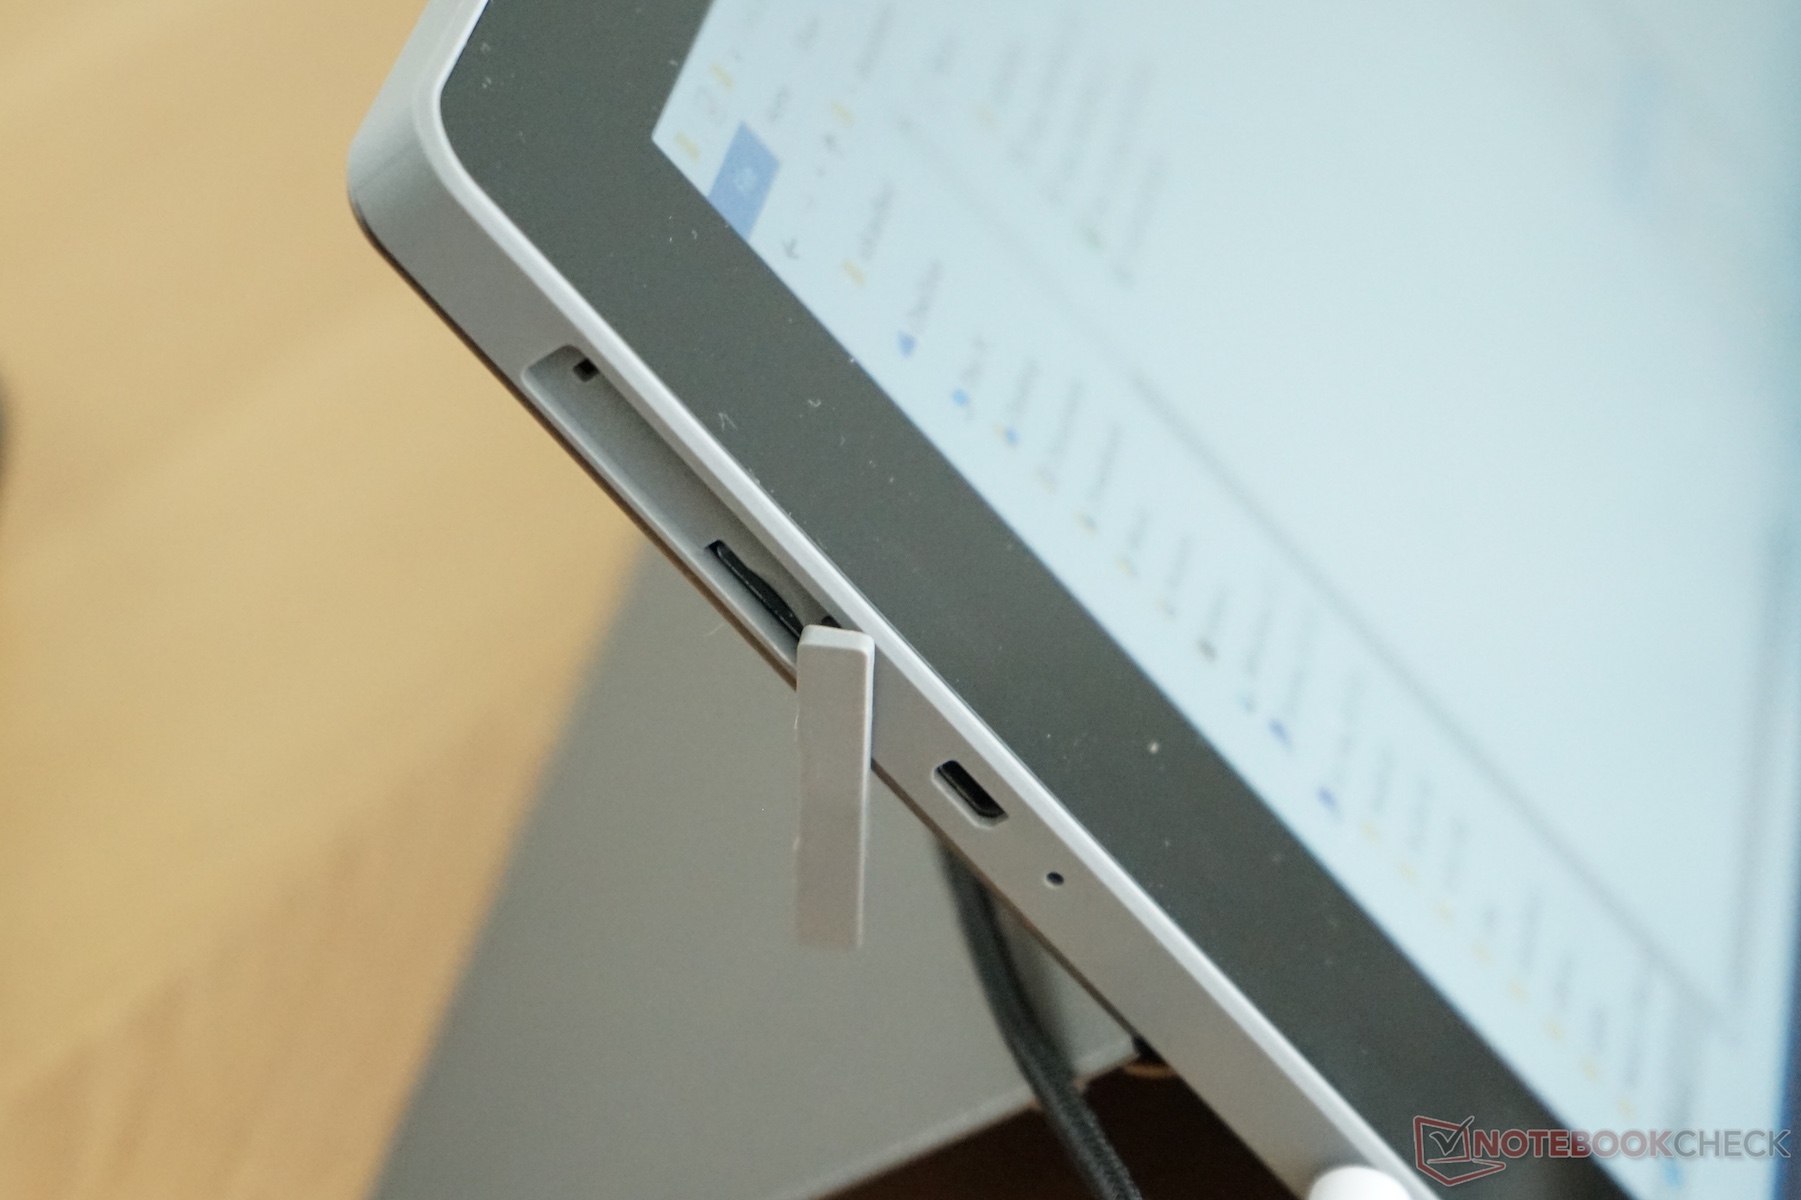
Além de todos esses problemas, o tablet também possui algumas desvantagens visíveis no design: câmeras, alto-falantes e touchpad. Além disso, o aparelho ainda não está disponível para compra na Europa devido à falta de certificação CE, e atualmente só pode ser importado da China. Portanto, a garantia e suporte dependem totalmente do revendedor, e vem com altas taxas e custos de envio.
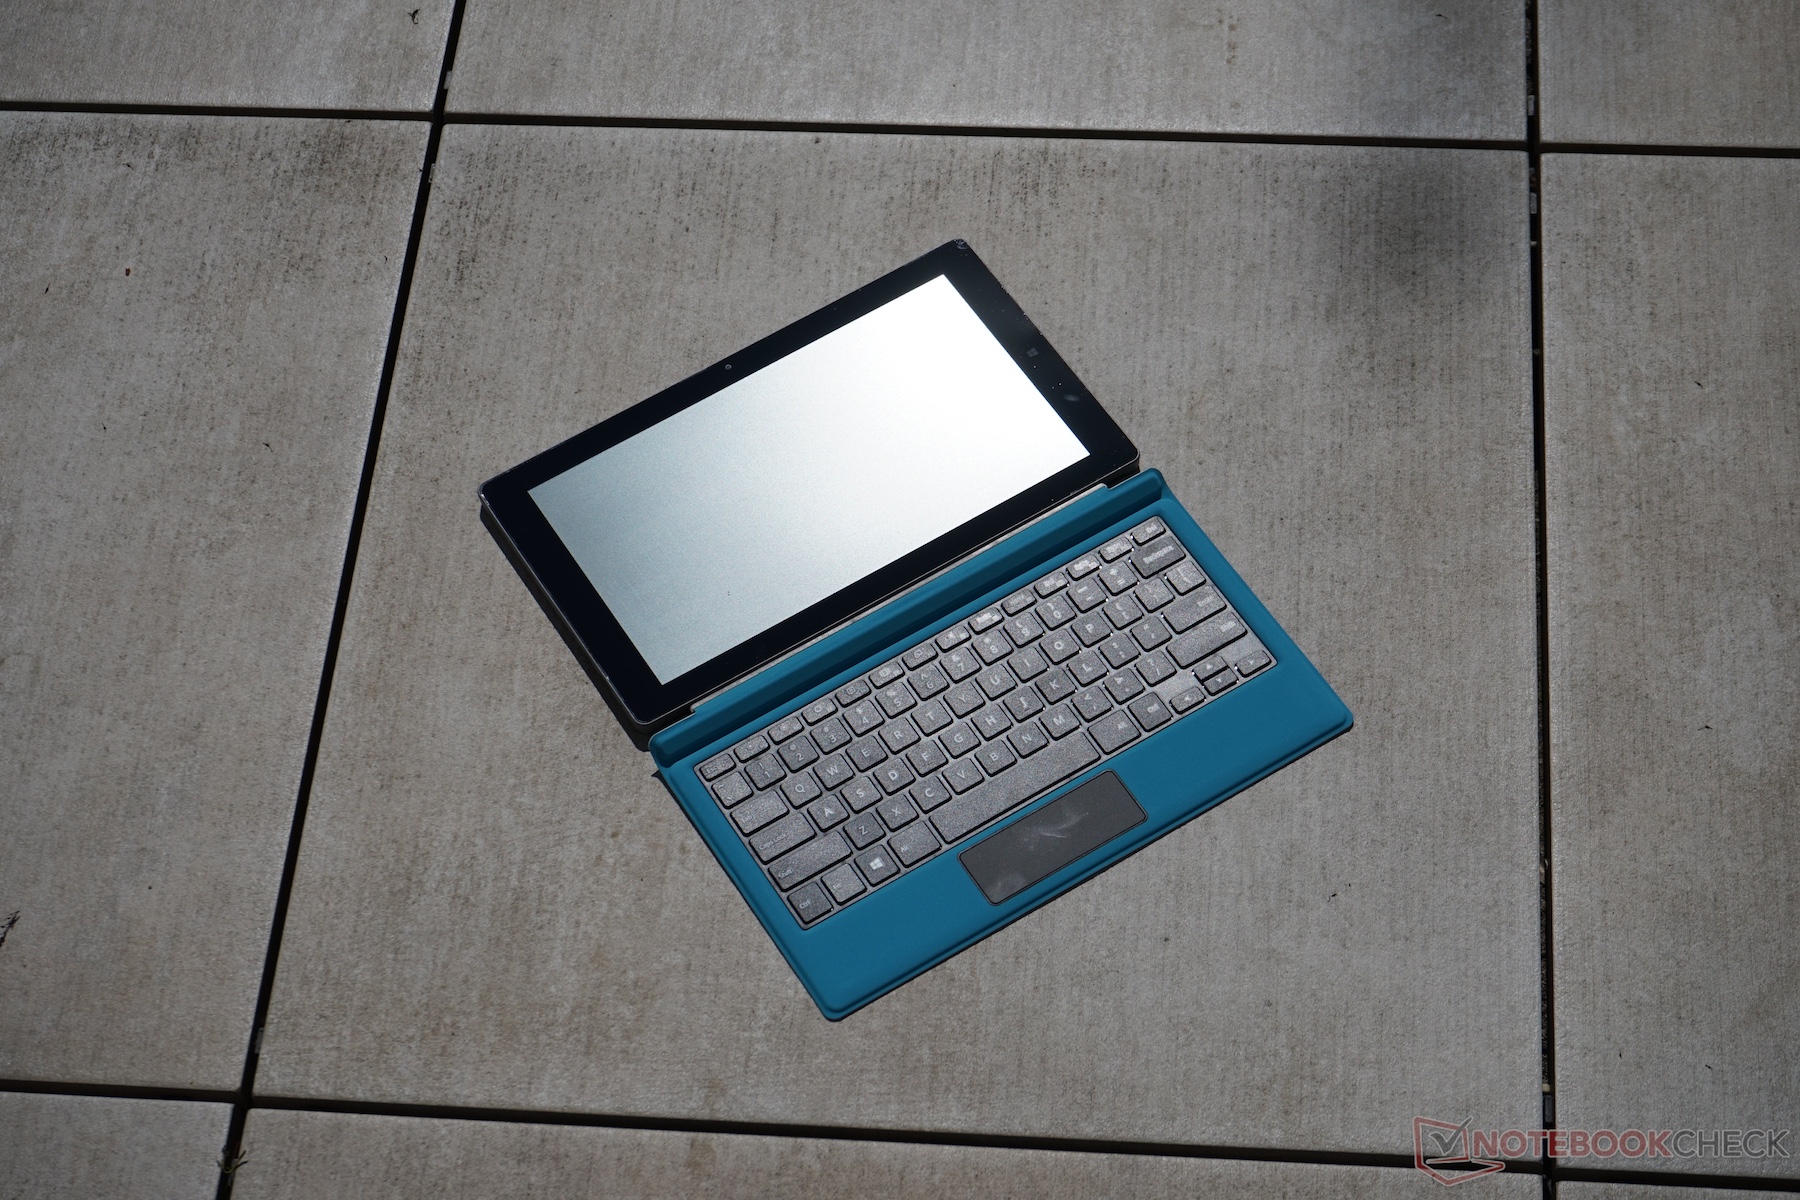
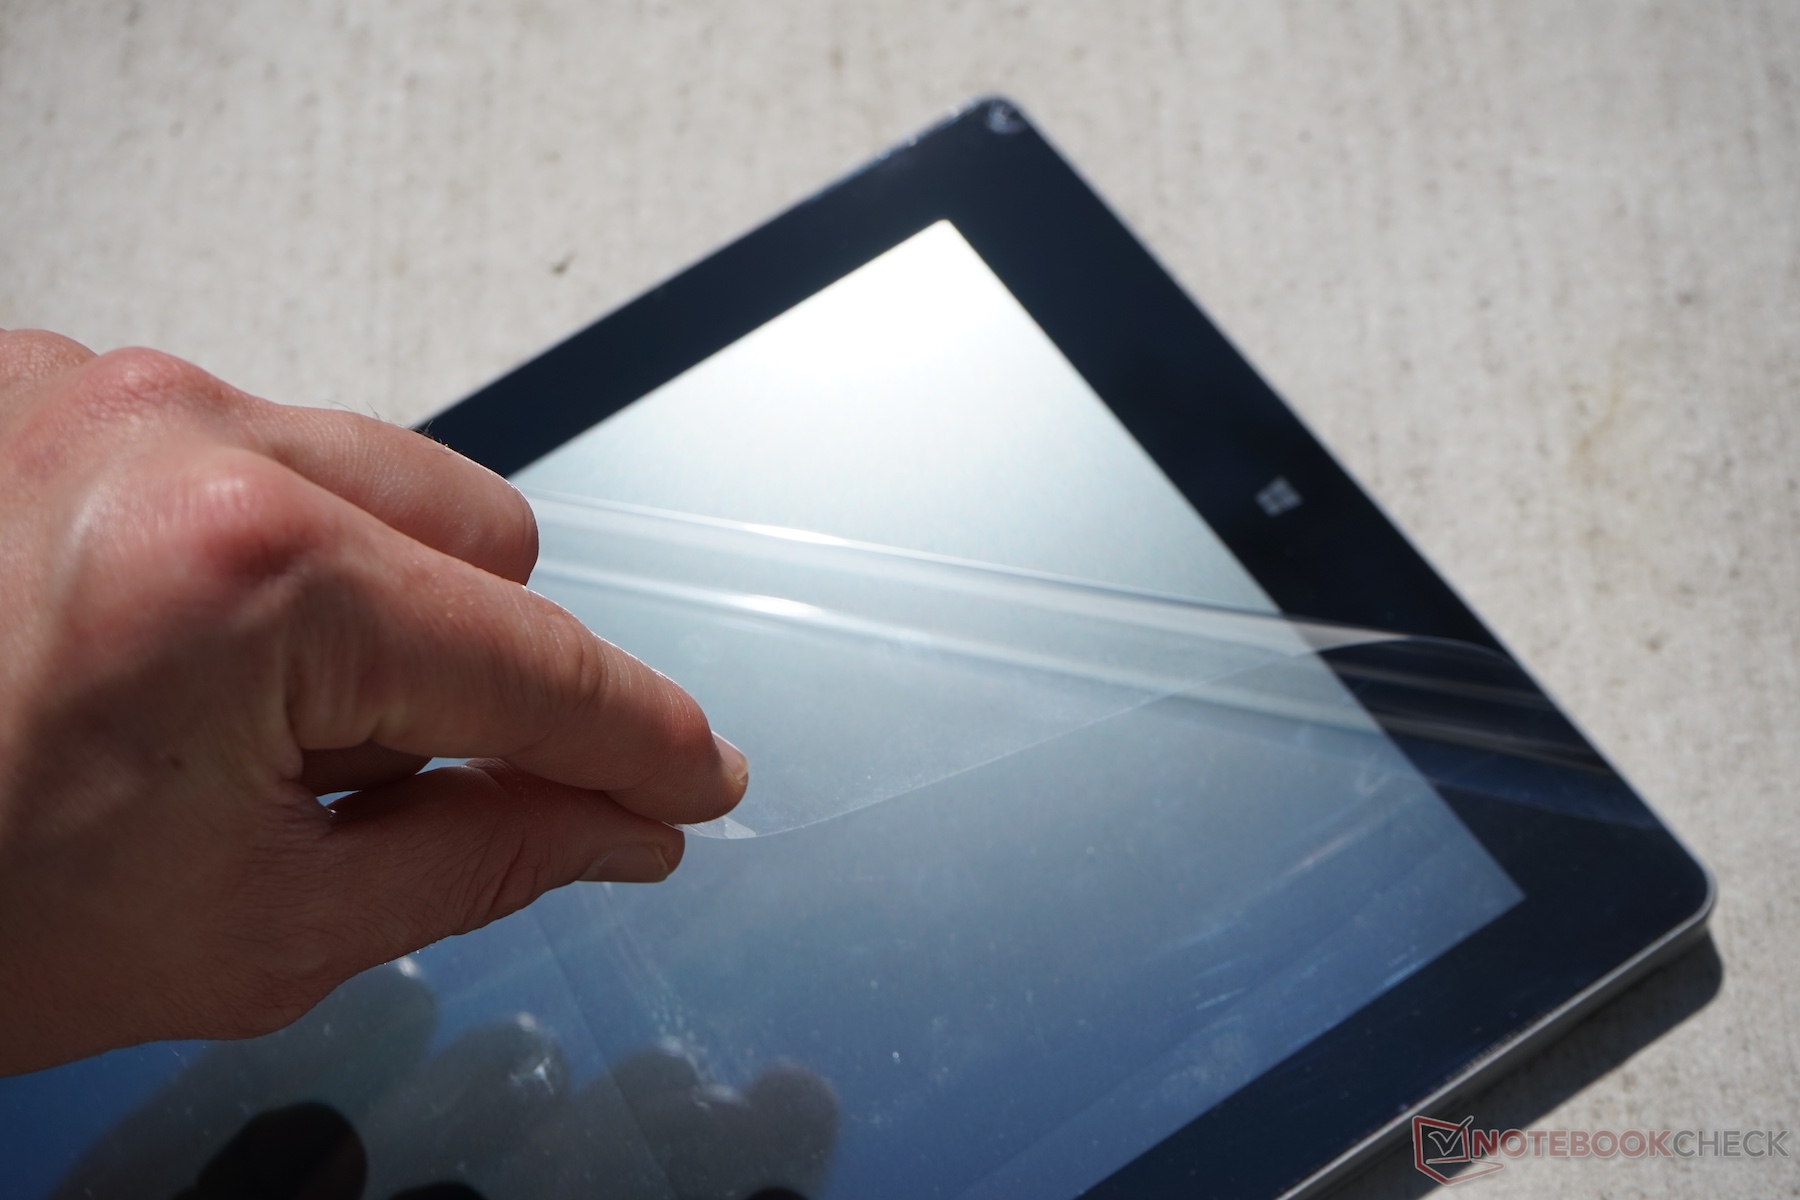
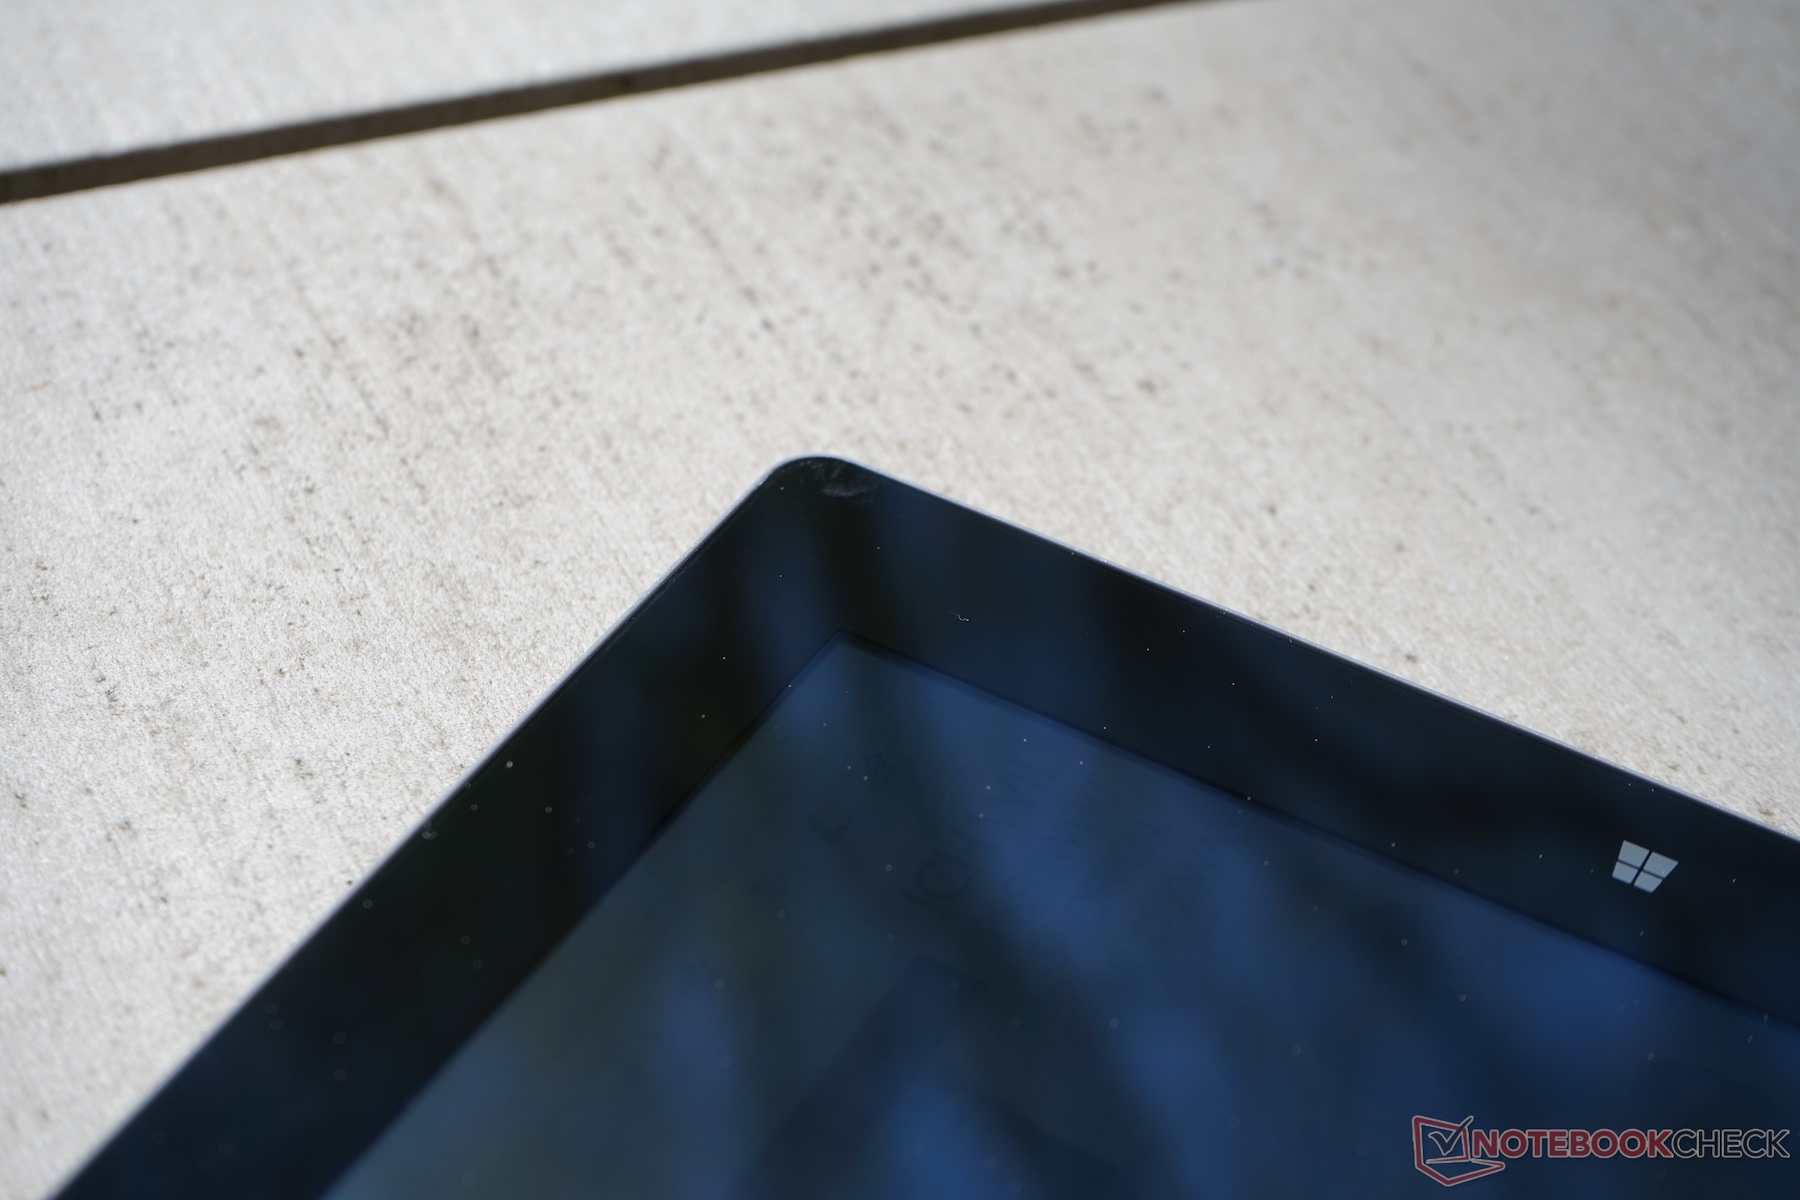
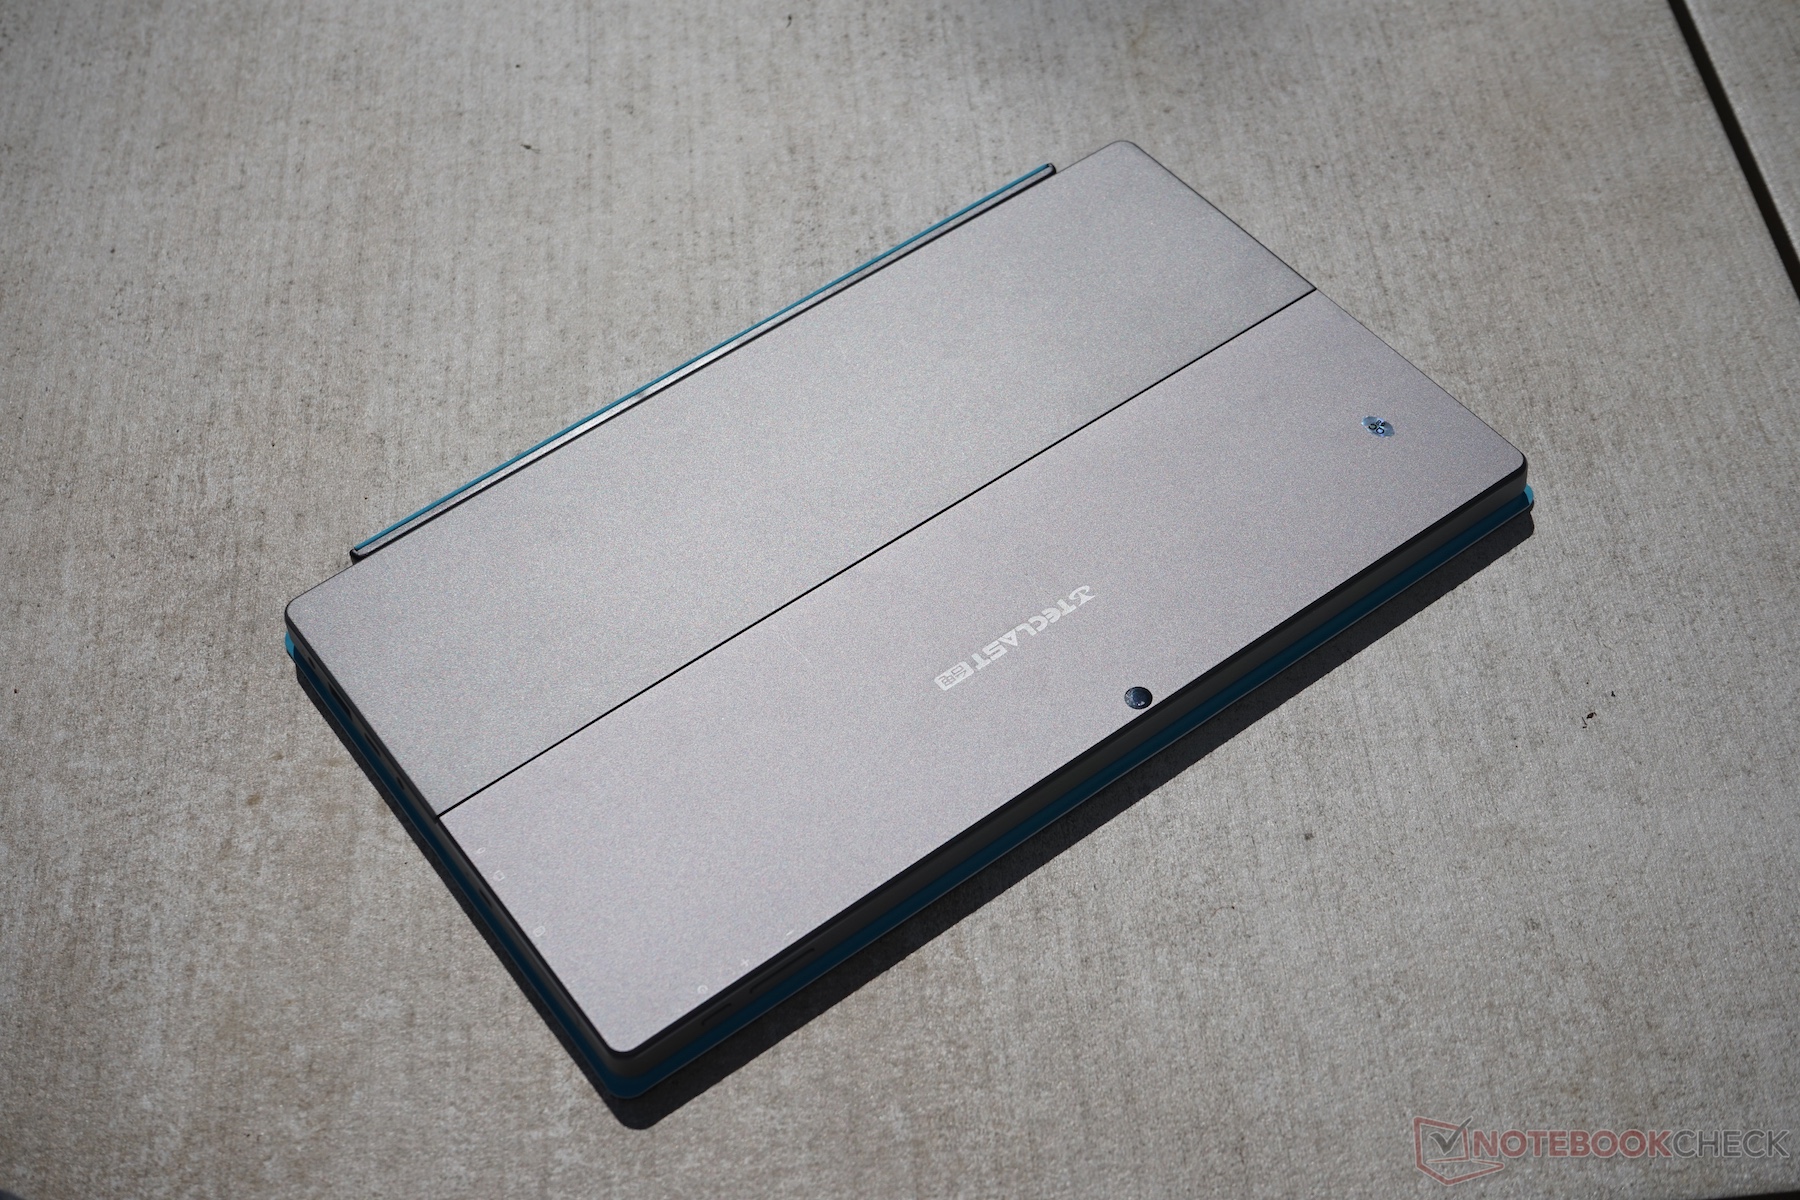
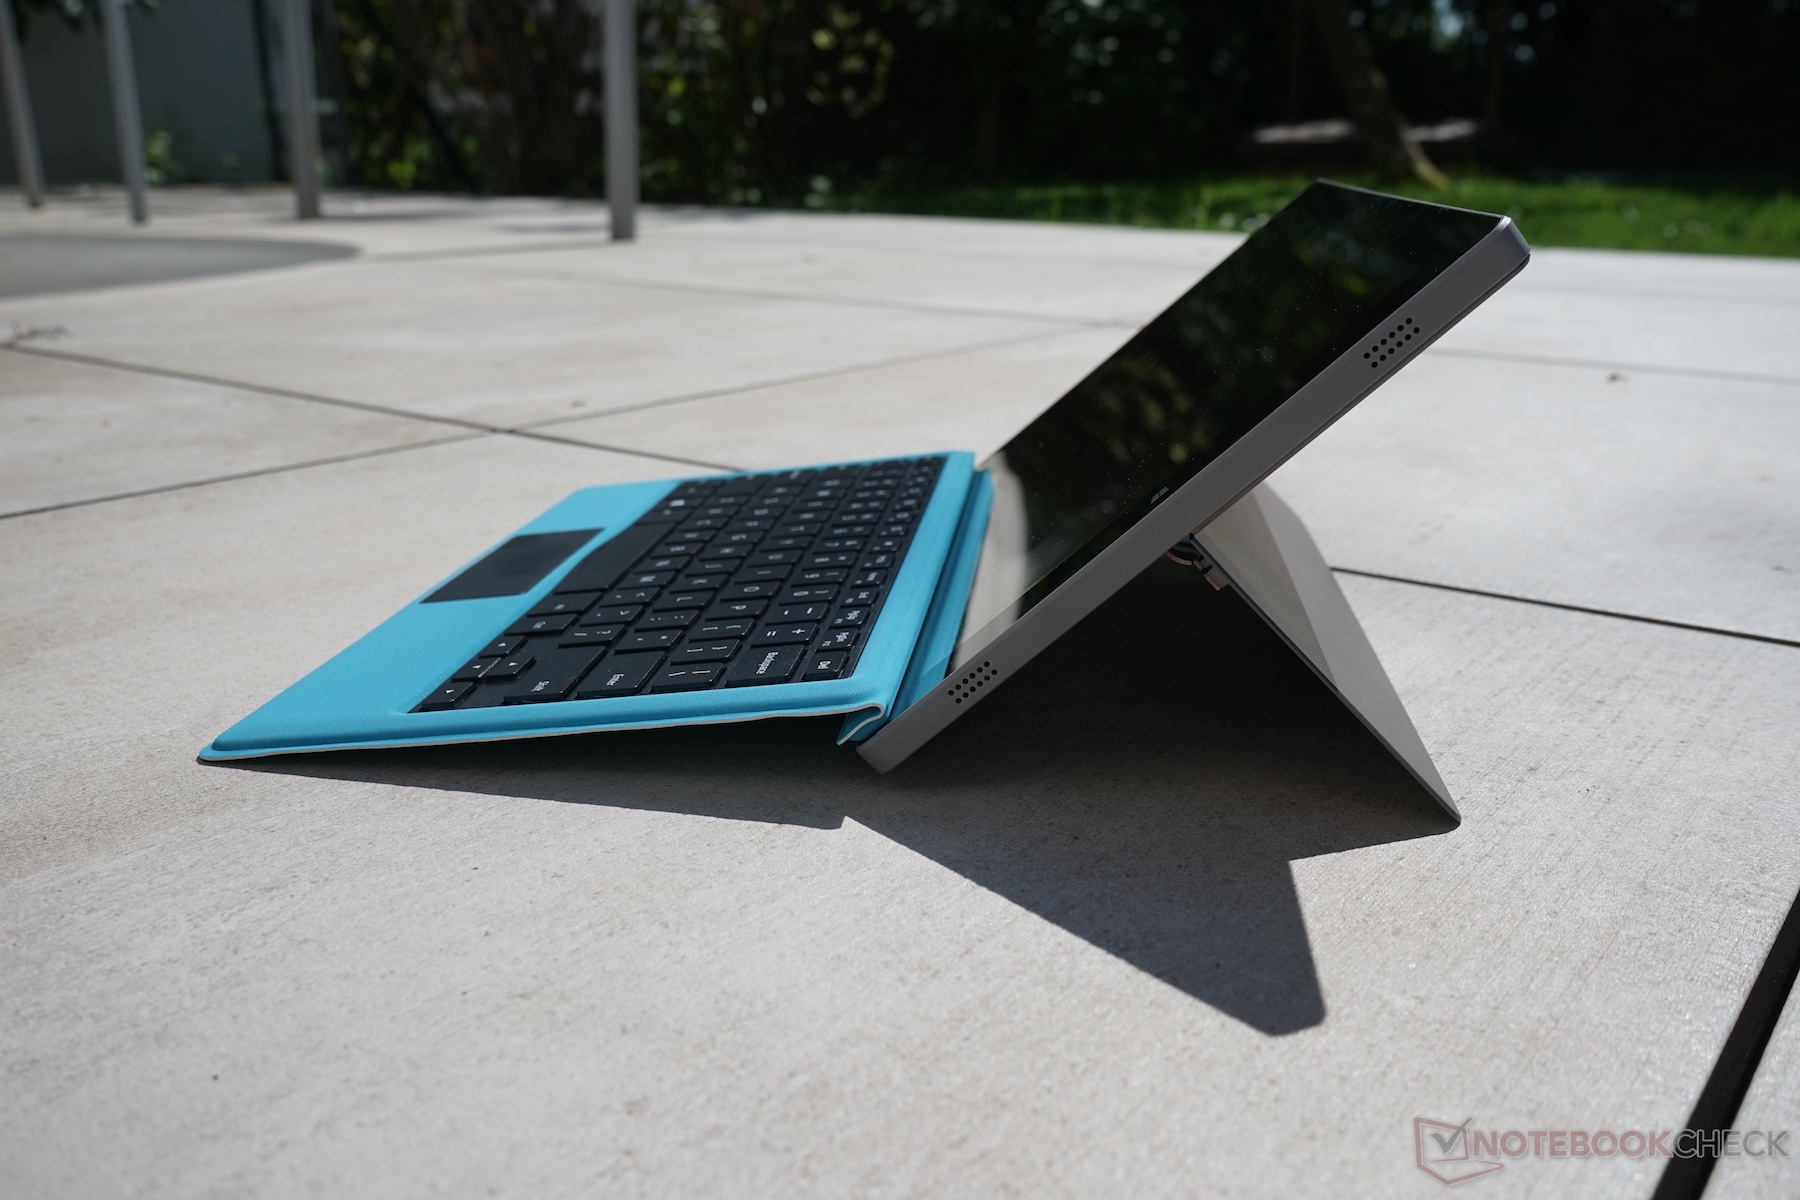
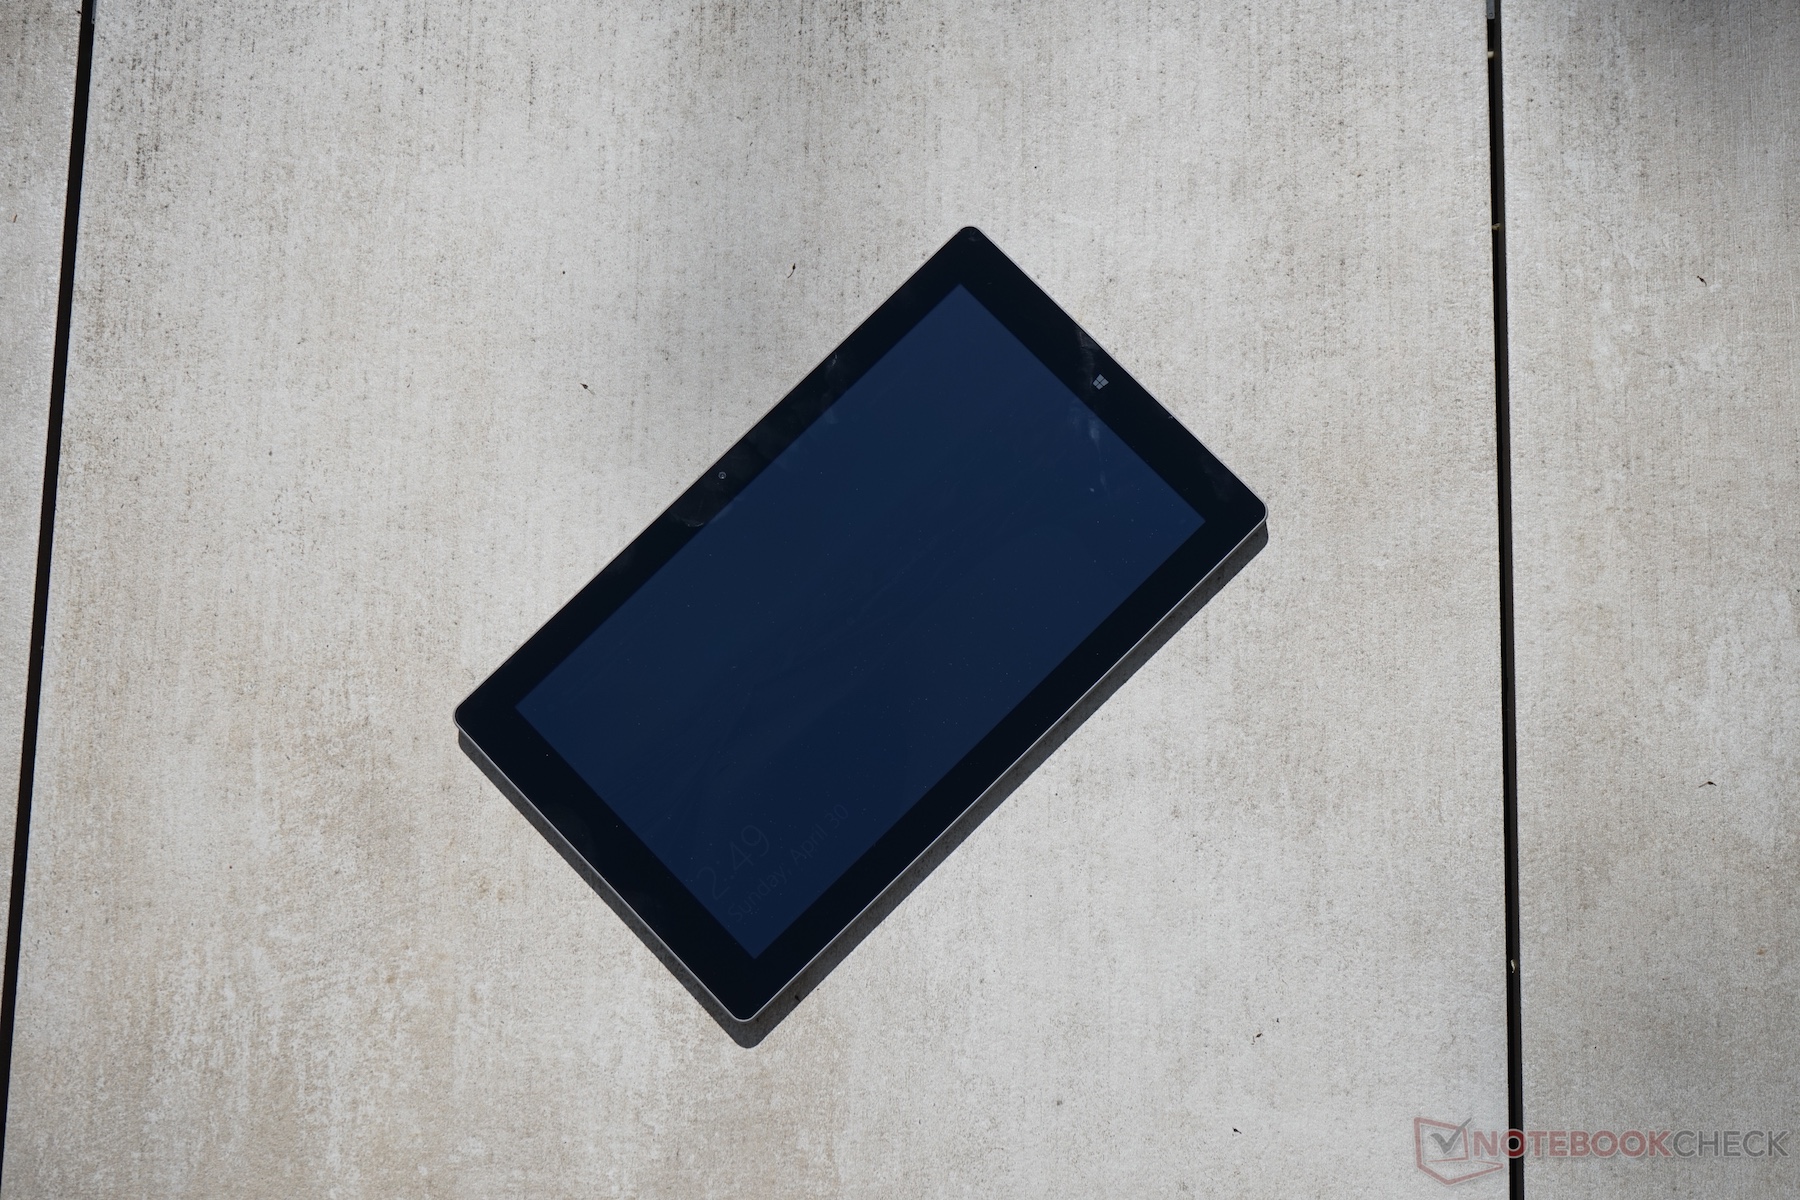
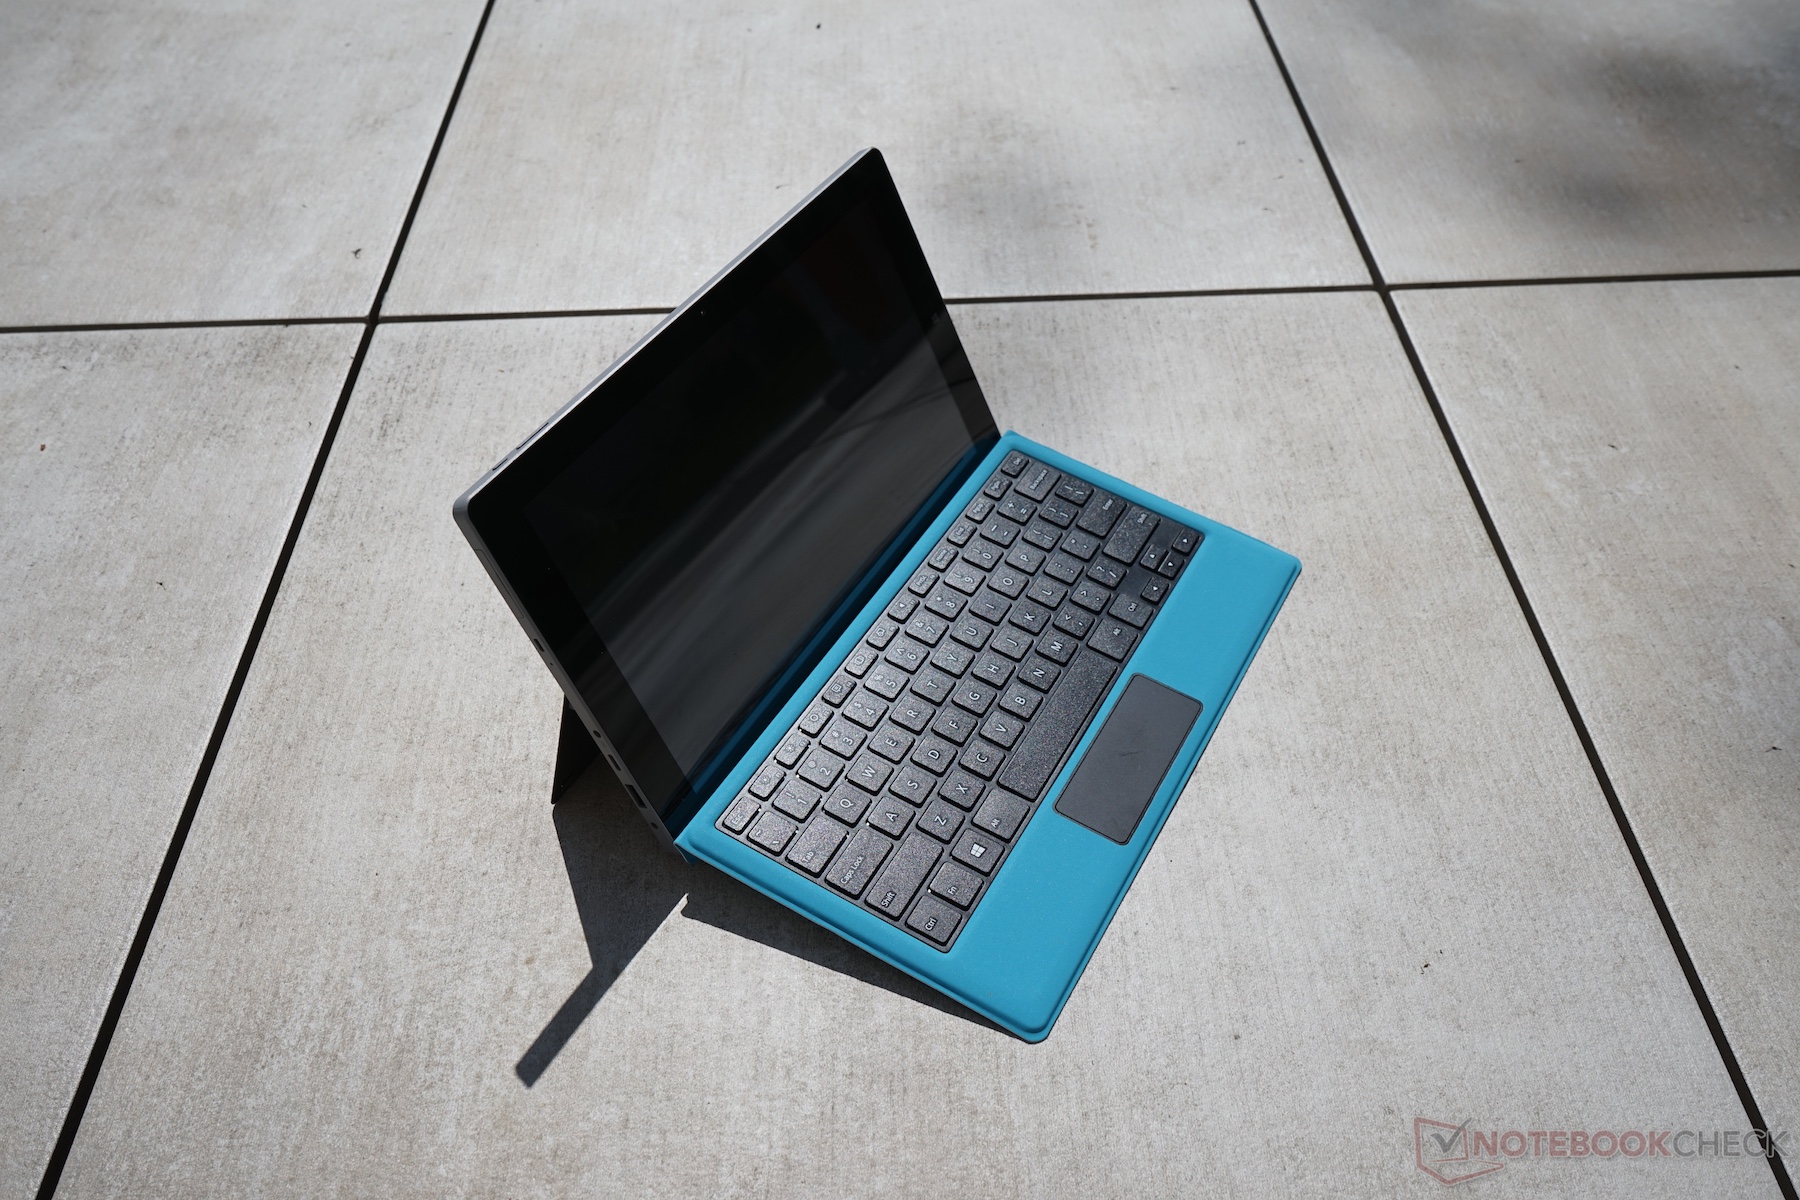
No entanto, também há alguns aspectos positivos: Apesar de ser inadequado para o seu uso em exteriores, a tela não era muito pobre. A rigidez da carcaça é excelente e oferece um toque e uma sensação muito agradáveis. Gostamos da completa ausência de ruído do sistema (sem ventoinha, sem ruído de bobina) e o leitor de cartões MicroSD foi comparativamente rápido.
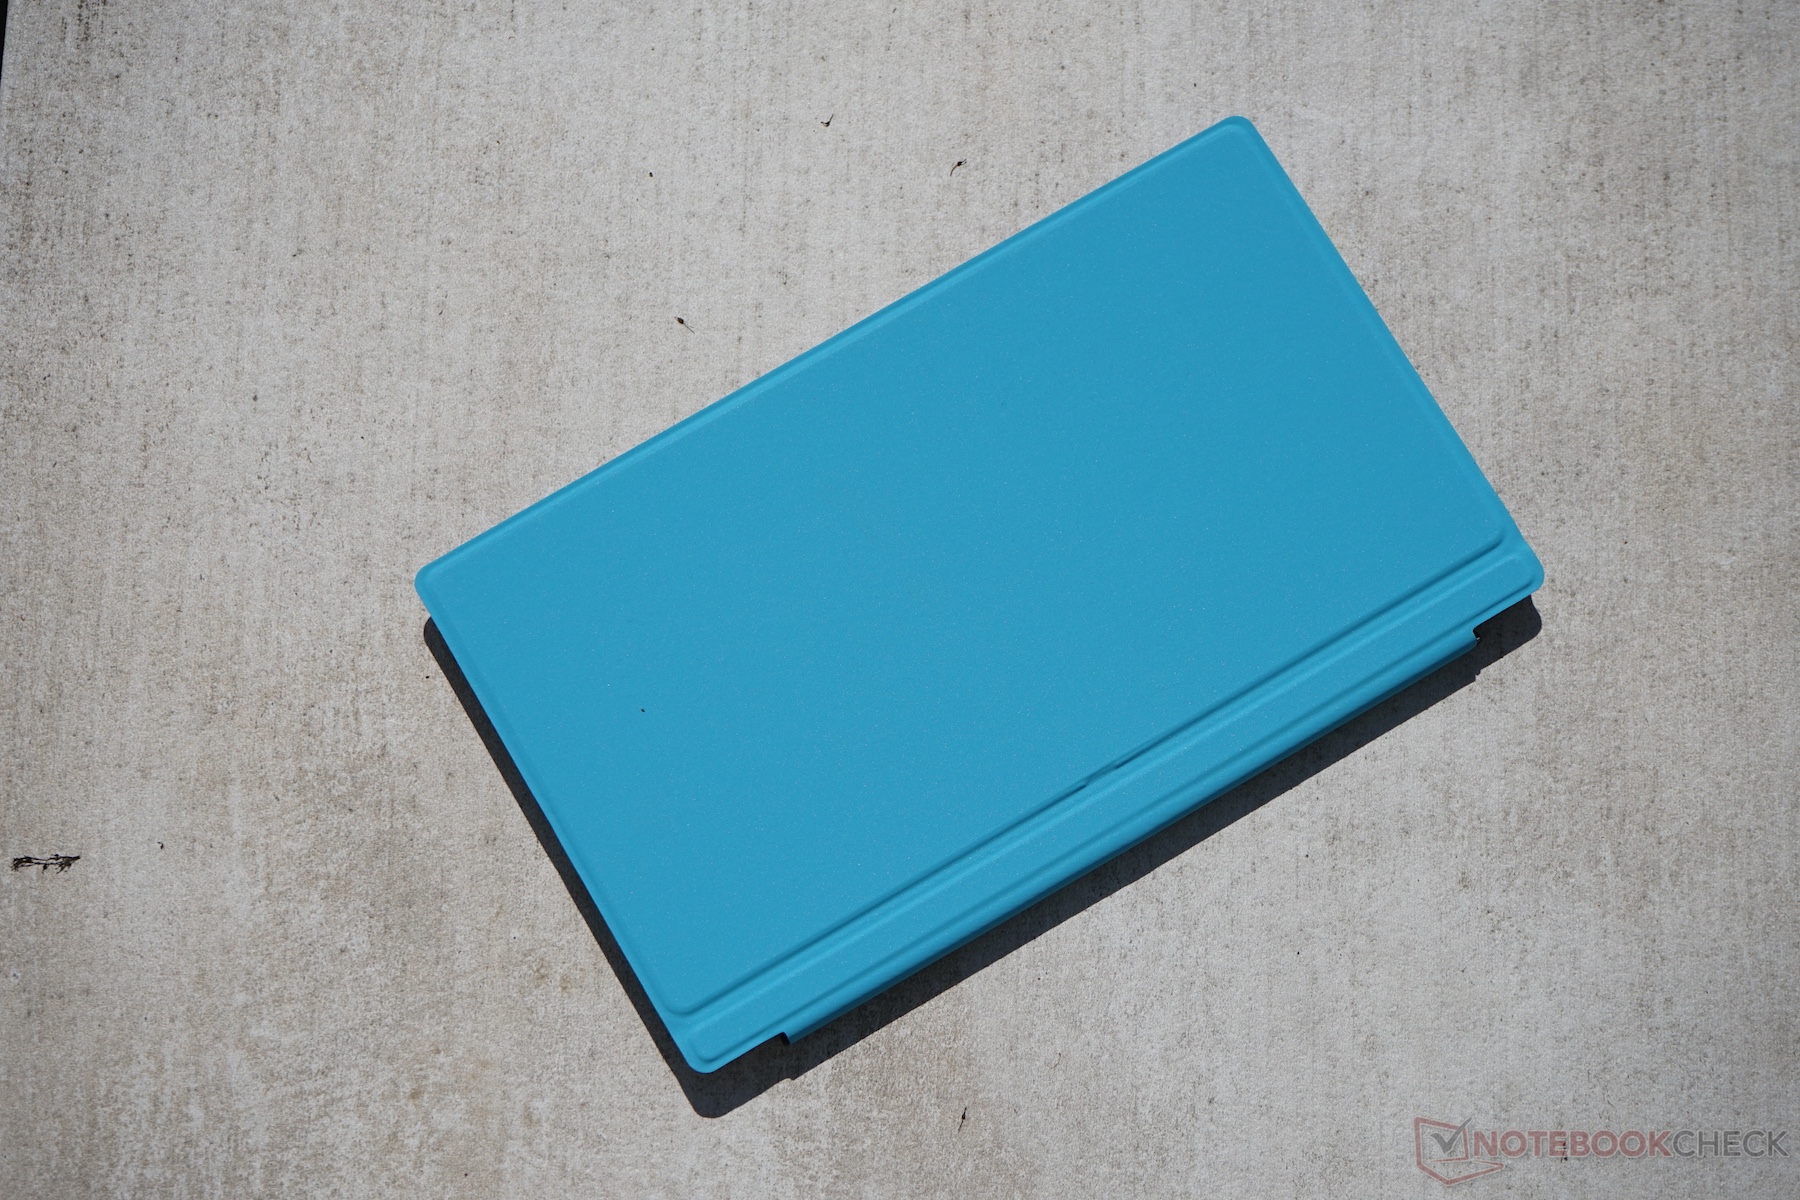
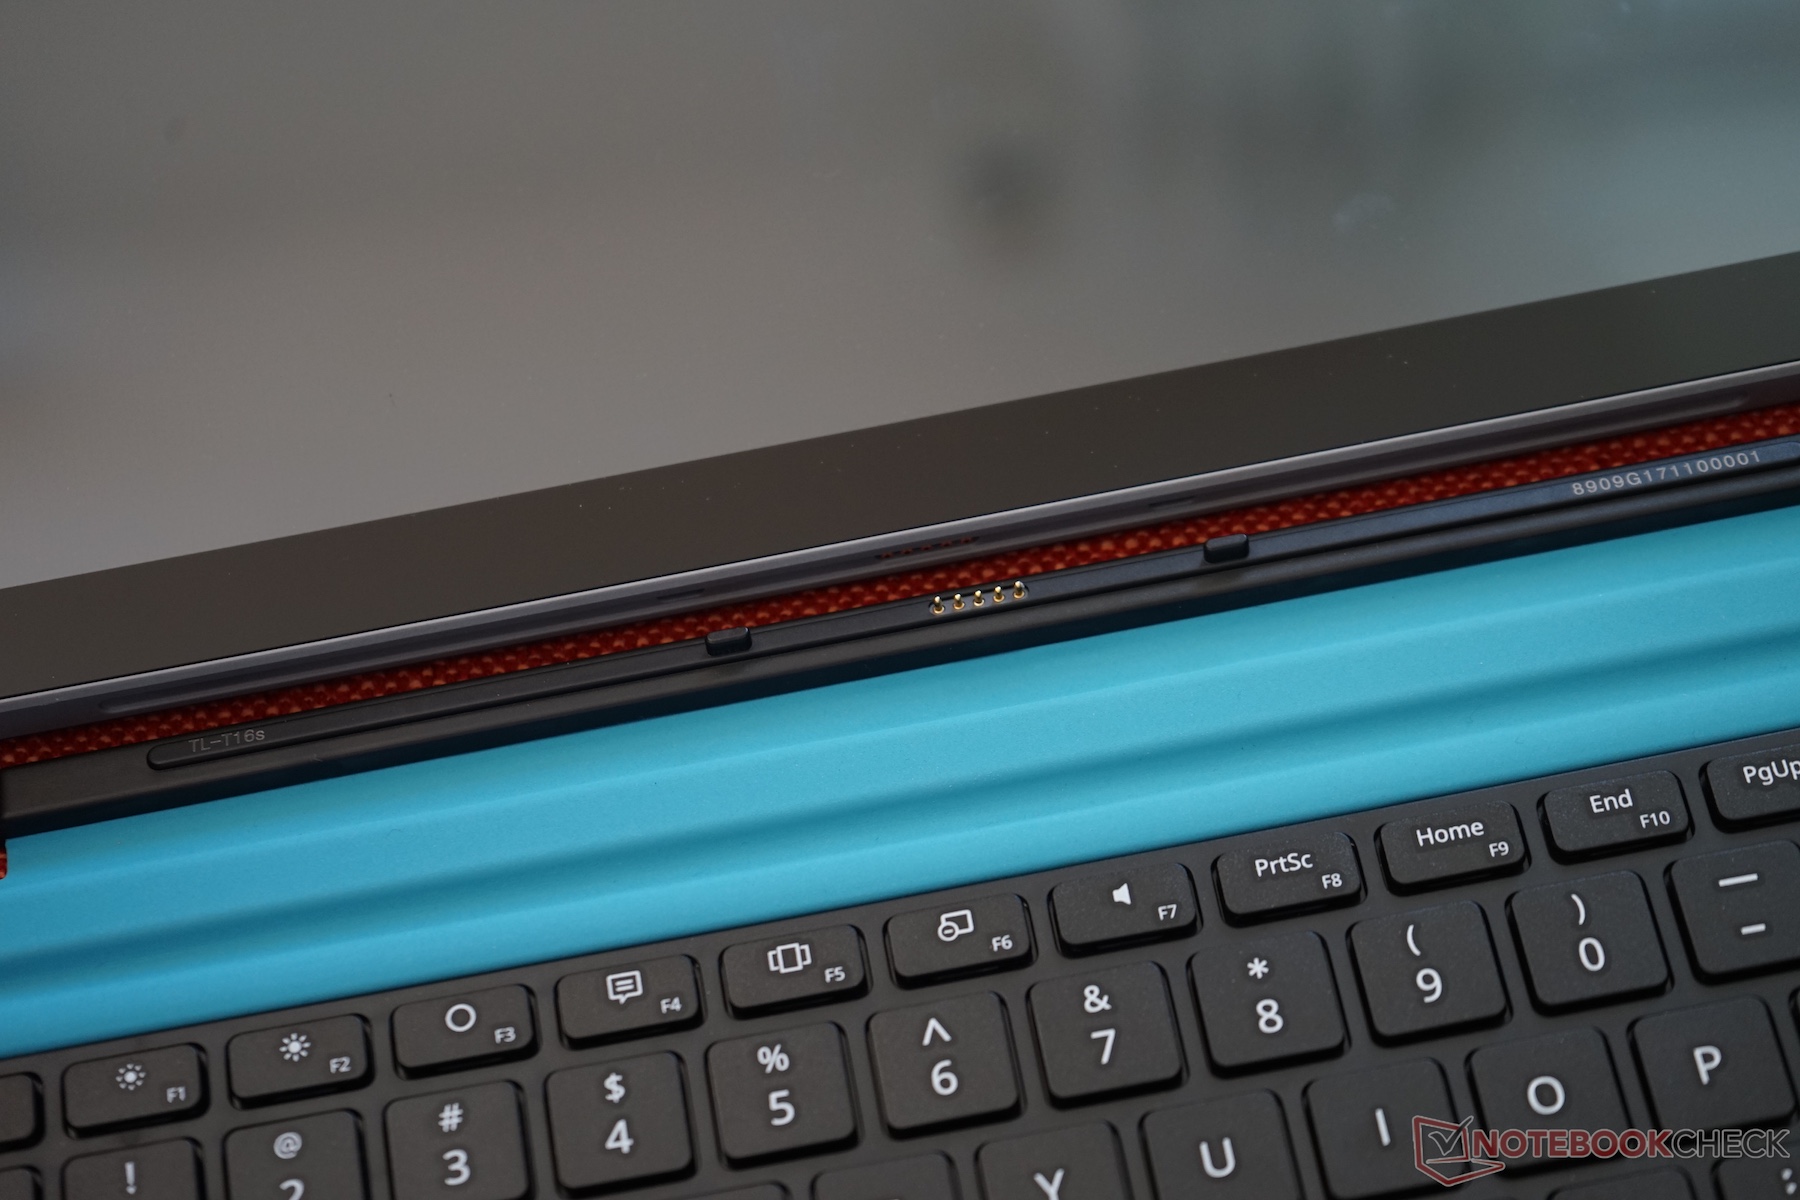
Recebemos nossa unidade de teste da Gearbest, diretamente da China, onde atualmente é vendido por volta dos $310. O dock de teclado são $35 extras e é, apesar de suas desvantagens, definitivamente recomendável.
Teclast Tbook 16 Power
- 05/15/2017 v6 (old)
Klaus Hinum
Price comparison
