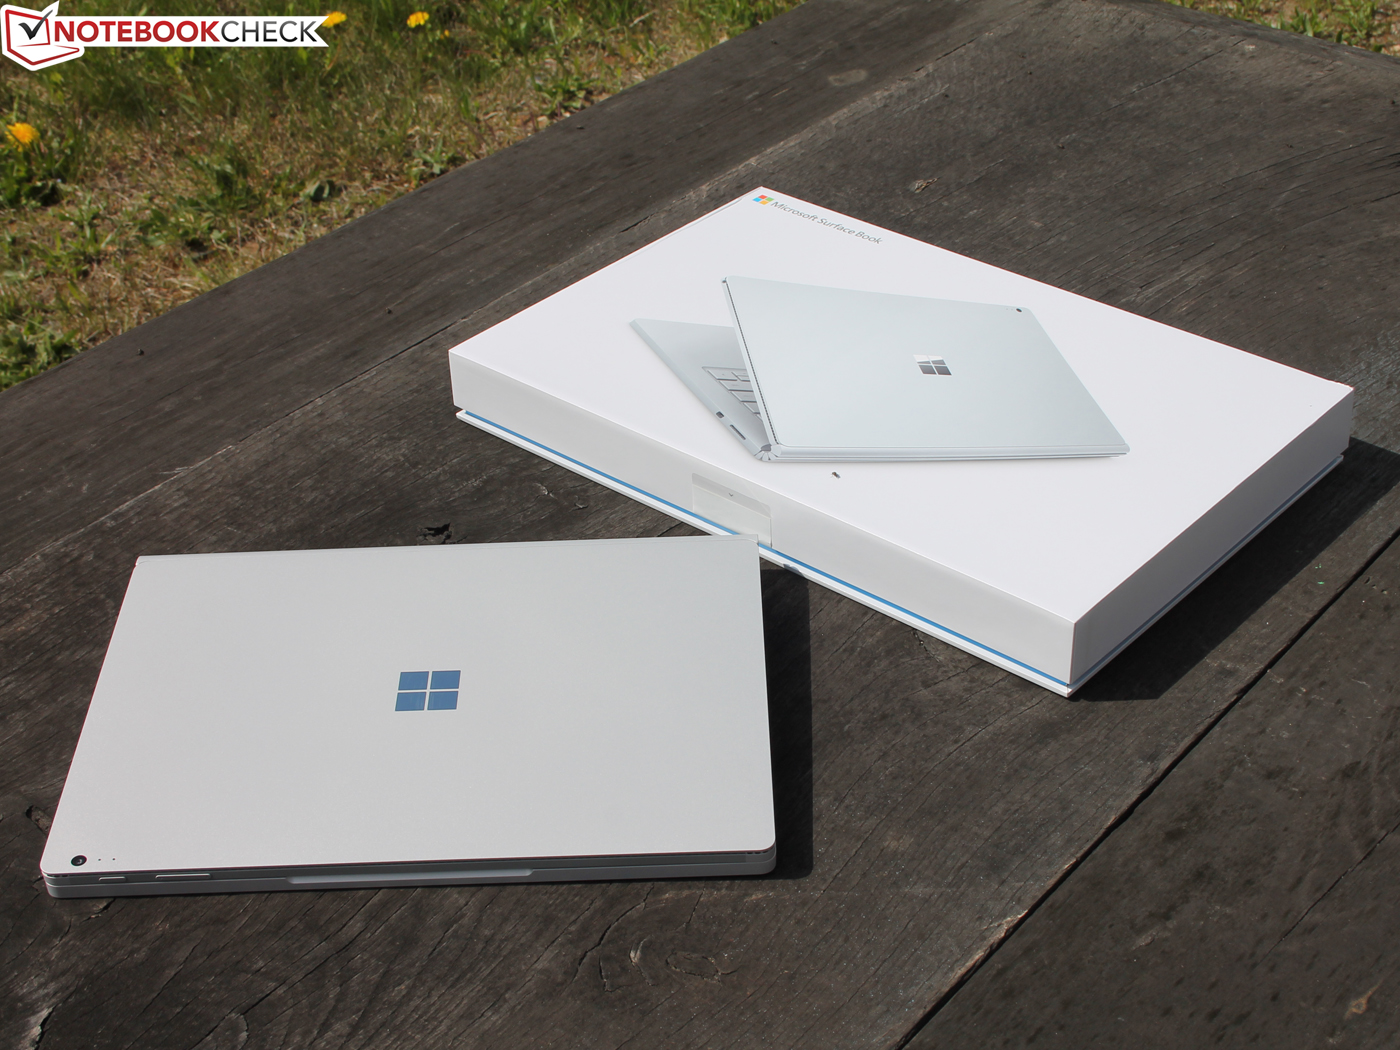
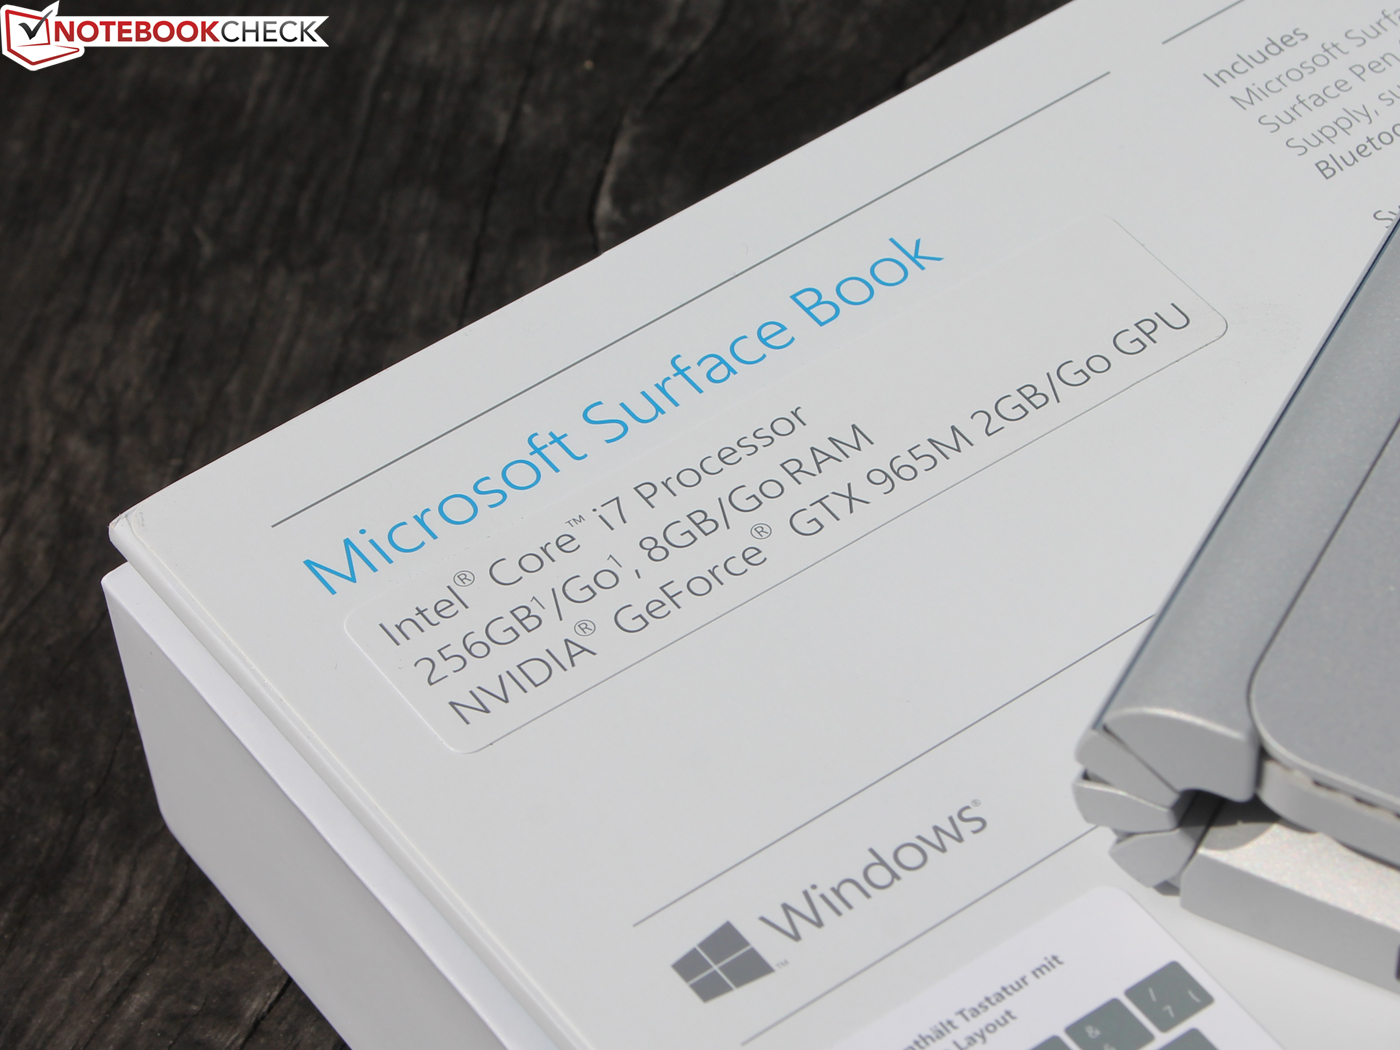
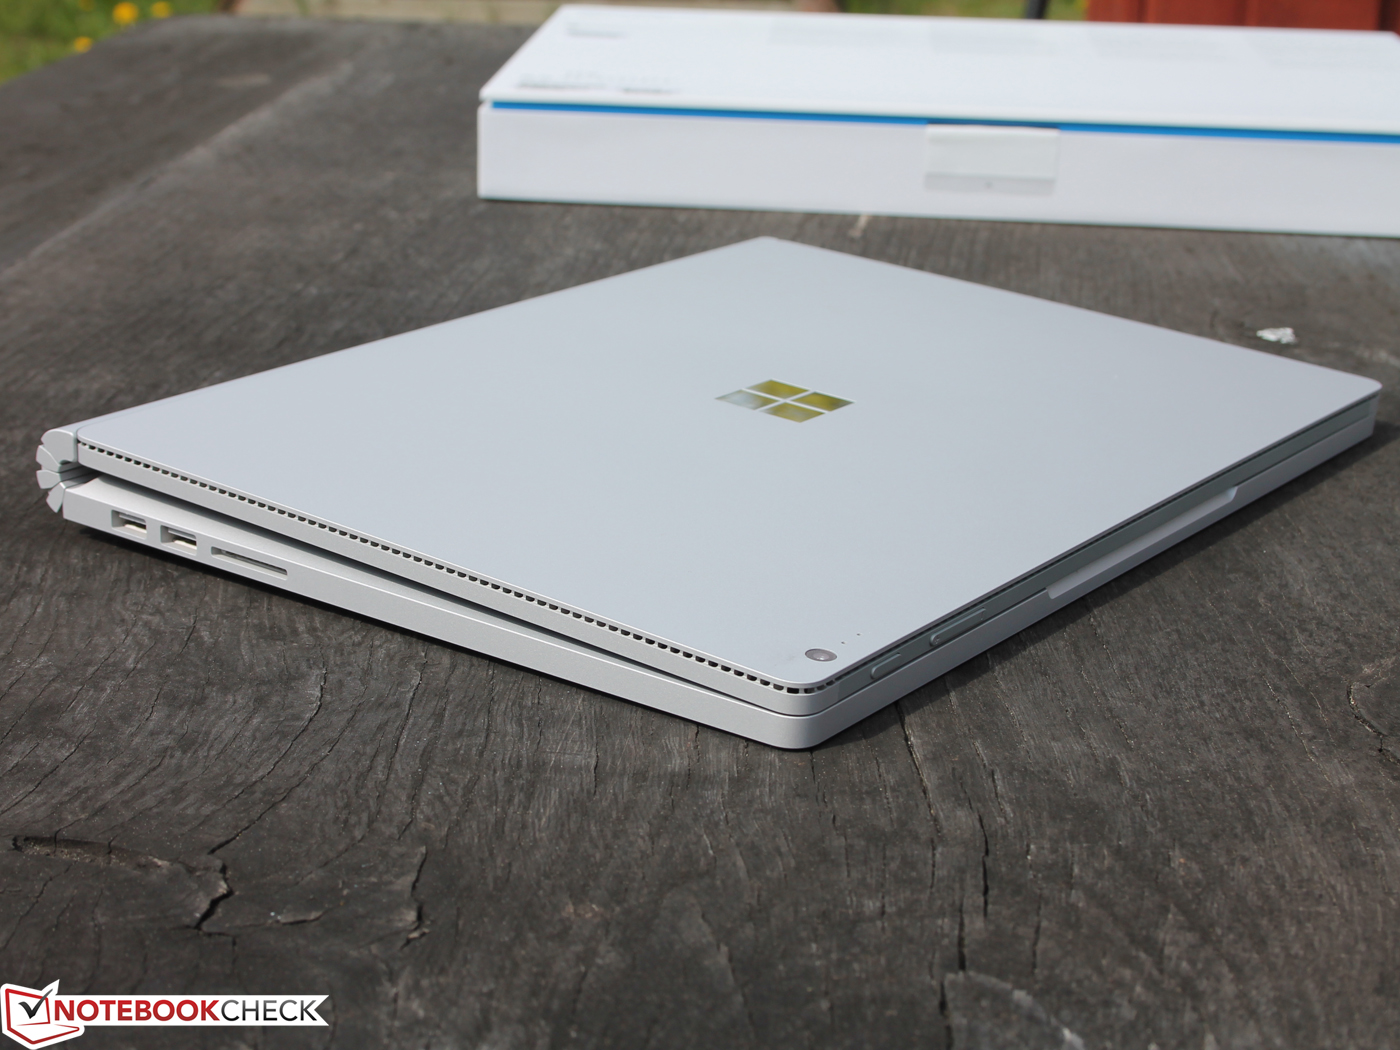
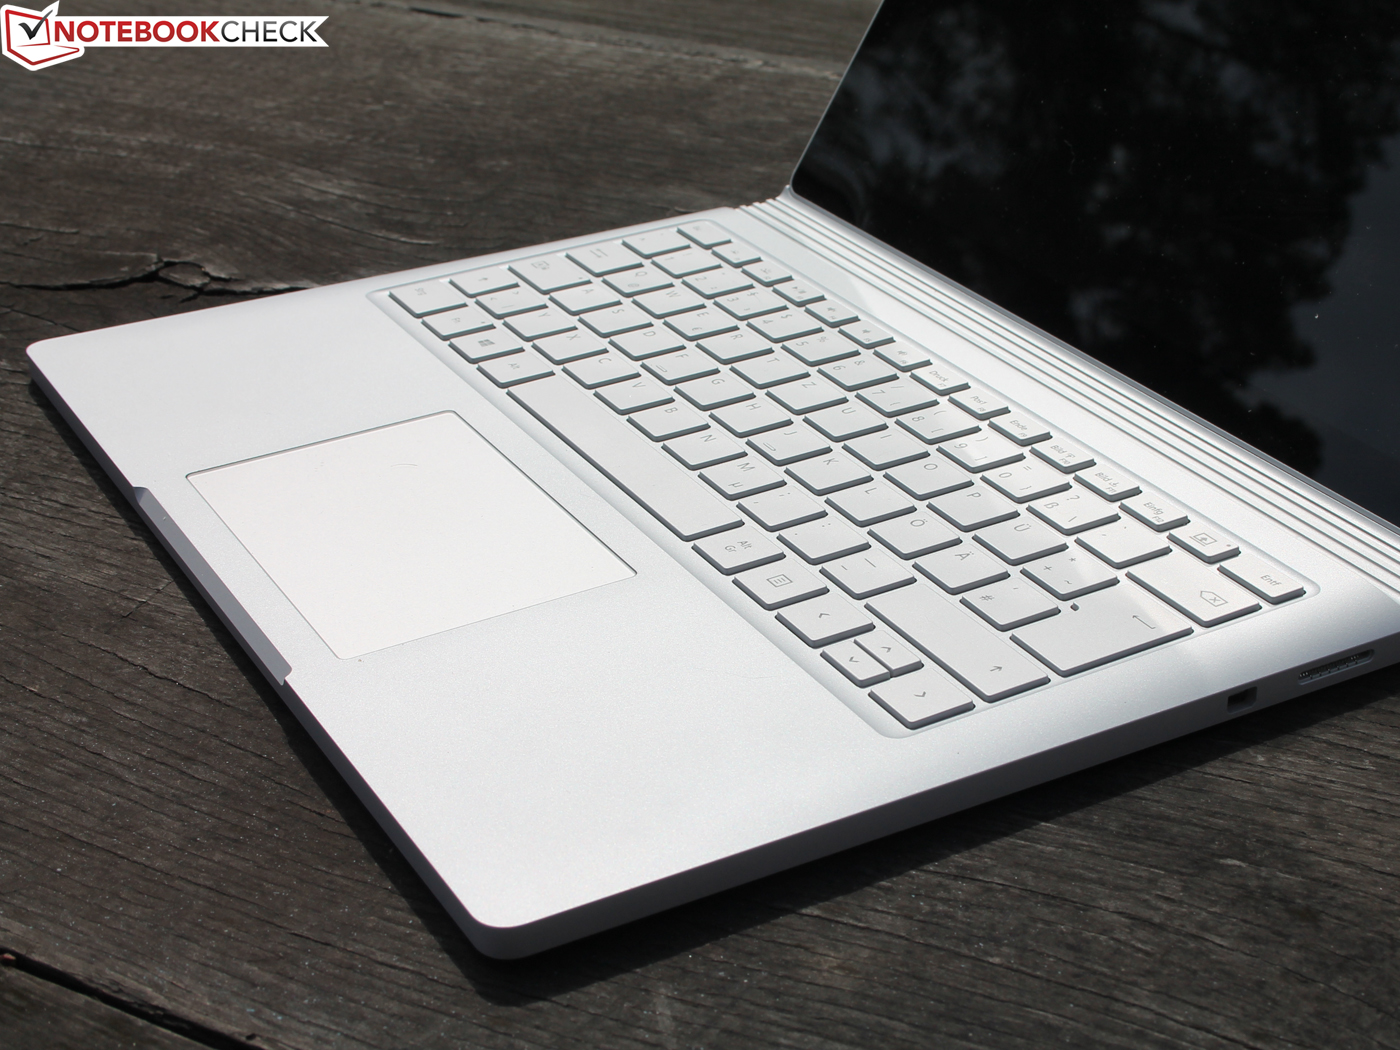
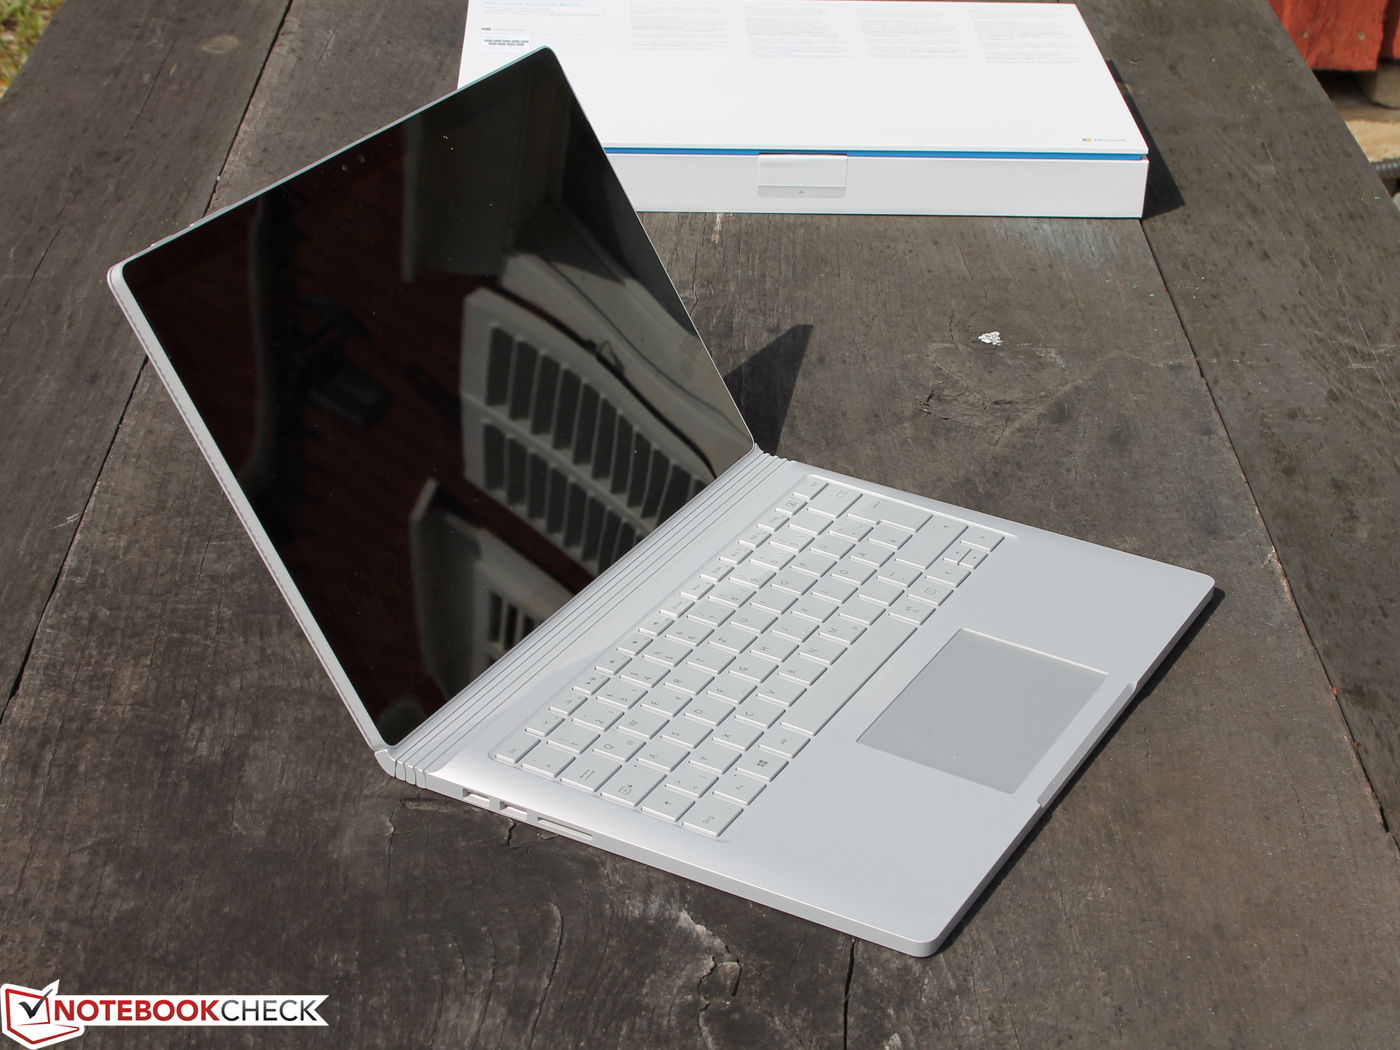
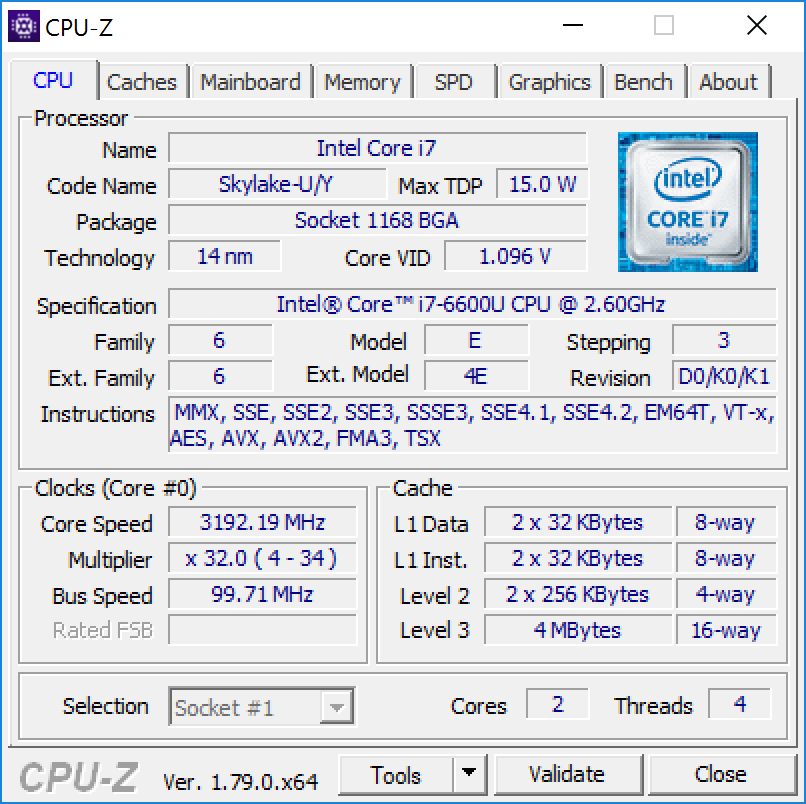
Breve Análise do Conversível Microsoft Surface Book com Base de Desempenho (GTX 965M)
| |||||||||||||||||||||||||
iluminação: 86 %
iluminação com acumulador: 459 cd/m²
Contraste: 1241:1 (Preto: 0.37 cd/m²)
ΔE ColorChecker Calman: 2.28 | ∀{0.5-29.43 Ø4.71}
ΔE Greyscale Calman: 2.48 | ∀{0.09-98 Ø4.96}
96% sRGB (Argyll 1.6.3 3D)
62% AdobeRGB 1998 (Argyll 1.6.3 3D)
67.6% AdobeRGB 1998 (Argyll 3D)
95.4% sRGB (Argyll 3D)
66.4% Display P3 (Argyll 3D)
Gamma: 2.5
CCT: 8602 K
| Microsoft Surface Book with Performance Base Panasonic MEI96A2, , 3000x2000, 13.5" | Microsoft Surface Book Core i5 3000x2000, 13.5" | Microsoft Surface Pro 4, Core i5, 128GB Samsung 123YL01-001 ID: SDC3853, , 2736x1824, 12.3" | HP Spectre x360 15-bl002xx UHD UWVA eDP BrightView WLED-backlit , , 3840x2160, 15.6" | Lenovo Yoga 710-14IKB 80V4002HGE AU Optronics B140HAN03.0, , 1920x1080, 14" | Asus UX310UQ-FC396T AU Optronics AUO272D, , 1920x1080, 13.3" | Apple MacBook Pro 13 2016 (2.9 GHz) APPA033, , 2560x1600, 13.3" | |
|---|---|---|---|---|---|---|---|
| Display | 1% | -1% | -4% | -6% | -3% | 28% | |
| Display P3 Coverage (%) | 66.4 | 67 1% | 65 -2% | 67.9 2% | 62 -7% | 64.1 -3% | 99.2 49% |
| sRGB Coverage (%) | 95.4 | 95.8 0% | 96.5 1% | 88.2 -8% | 89.5 -6% | 92.2 -3% | 99.9 5% |
| AdobeRGB 1998 Coverage (%) | 67.6 | 68.9 2% | 67 -1% | 64.4 -5% | 63.3 -6% | 65.3 -3% | 87.6 30% |
| Response Times | 16% | 21% | 12% | 12% | 46% | -10% | |
| Response Time Grey 50% / Grey 80% * (ms) | 61 ? | 48.4 ? 21% | 46 ? 25% | 44 ? 28% | 53 ? 13% | 31 ? 49% | 47.2 ? 23% |
| Response Time Black / White * (ms) | 37 ? | 32.8 ? 11% | 31.2 ? 16% | 38.8 ? -5% | 33 ? 11% | 21 ? 43% | 53 ? -43% |
| PWM Frequency (Hz) | 50 ? | 1000 ? | 50 ? | 192 ? | |||
| Screen | 10% | -13% | -12% | -76% | -43% | 10% | |
| Brightness middle (cd/m²) | 459 | 430.9 -6% | 413 -10% | 351.5 -23% | 340 -26% | 362 -21% | 569 24% |
| Brightness (cd/m²) | 423 | 410 -3% | 396 -6% | 336 -21% | 302 -29% | 343 -19% | 542 28% |
| Brightness Distribution (%) | 86 | 93 8% | 87 1% | 83 -3% | 77 -10% | 92 7% | 90 5% |
| Black Level * (cd/m²) | 0.37 | 0.254 31% | 0.36 3% | 0.24 35% | 0.31 16% | 0.28 24% | 0.56 -51% |
| Contrast (:1) | 1241 | 1696 37% | 1147 -8% | 1465 18% | 1097 -12% | 1293 4% | 1016 -18% |
| Colorchecker dE 2000 * | 2.28 | 2.06 10% | 3.09 -36% | 3.3 -45% | 6.75 -196% | 5.08 -123% | 1.4 39% |
| Colorchecker dE 2000 max. * | 3.61 | 7.3 -102% | 12.4 -243% | 8.95 -148% | 2.9 20% | ||
| Greyscale dE 2000 * | 2.48 | 2.22 10% | 3.92 -58% | 1.9 23% | 8.47 -242% | 6.21 -150% | 1.8 27% |
| Gamma | 2.5 88% | 2.13 103% | 2.3 96% | 2.09 105% | 2.22 99% | 2.4 92% | 2.16 102% |
| CCT | 8602 76% | 6520 100% | 7333 89% | 6784 96% | 6557 99% | 6817 95% | 6877 95% |
| Color Space (Percent of AdobeRGB 1998) (%) | 62 | 64 3% | 61 -2% | 64.4 4% | 58 -6% | 60 -3% | 78.4 26% |
| Color Space (Percent of sRGB) (%) | 96 | 96 0% | 97 1% | 88.2 -8% | 89 -7% | 92 -4% | 99.3 3% |
| Média Total (Programa/Configurações) | 9% /
9% | 2% /
-5% | -1% /
-7% | -23% /
-50% | 0% /
-23% | 9% /
11% |
* ... menor é melhor
Exibir tempos de resposta
| ↔ Tempo de resposta preto para branco | ||
|---|---|---|
| 37 ms ... ascensão ↗ e queda ↘ combinadas | ↗ 21 ms ascensão | 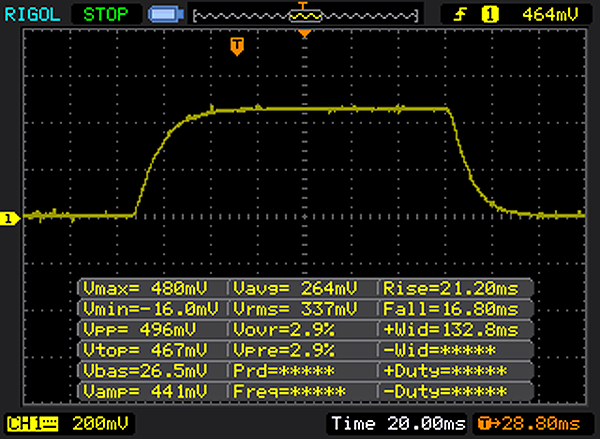 |
| ↘ 16 ms queda | ||
| A tela mostra taxas de resposta lentas em nossos testes e será insatisfatória para os jogadores. Em comparação, todos os dispositivos testados variam de 0.1 (mínimo) a 240 (máximo) ms. » 95 % de todos os dispositivos são melhores. Isso significa que o tempo de resposta medido é pior que a média de todos os dispositivos testados (19.8 ms). | ||
| ↔ Tempo de resposta 50% cinza a 80% cinza | ||
| 61 ms ... ascensão ↗ e queda ↘ combinadas | ↗ 28 ms ascensão | 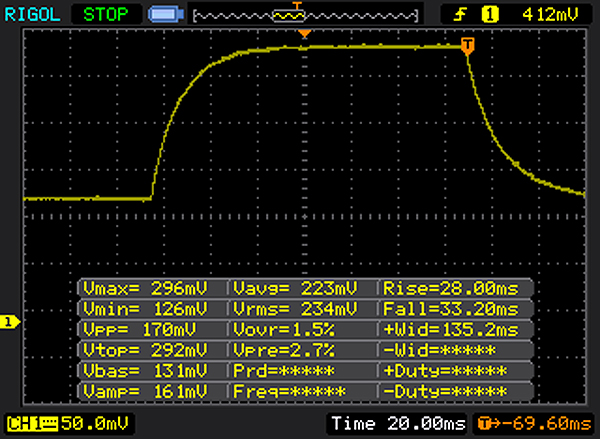 |
| ↘ 33 ms queda | ||
| A tela mostra taxas de resposta lentas em nossos testes e será insatisfatória para os jogadores. Em comparação, todos os dispositivos testados variam de 0.165 (mínimo) a 636 (máximo) ms. » 96 % de todos os dispositivos são melhores. Isso significa que o tempo de resposta medido é pior que a média de todos os dispositivos testados (30.9 ms). | ||
Cintilação da tela / PWM (modulação por largura de pulso)
| Tela tremeluzindo / PWM não detectado | ||
[pwm_comparison] Em comparação: 52 % de todos os dispositivos testados não usam PWM para escurecer a tela. Se PWM foi detectado, uma média de 7748 (mínimo: 5 - máximo: 343500) Hz foi medida. | ||
| PCMark 8 Home Score Accelerated v2 | 3040 pontos | |
| PCMark 8 Creative Score Accelerated v2 | 4136 pontos | |
| PCMark 8 Work Score Accelerated v2 | 3949 pontos | |
Ajuda | ||
| Microsoft Surface Book with Performance Base Toshiba NVMe THNSN5256GPU7 | Microsoft Surface Book Core i7 Samsung MZFLV512 NVMe | Lenovo Yoga 710-14IKB 80V4002HGE Samsung MZYTY256HDHP | HP Spectre x360 15-bl002xx Toshiba XG4 NVMe (THNSN5512GPUK) | Asus UX310UQ-FC396T SanDisk SD8SN8U512G1002 | Apple MacBook Pro 13 2016 (2.9 GHz) Apple SSD AP0256 | |
|---|---|---|---|---|---|---|
| CrystalDiskMark 3.0 | 11% | -35% | 21% | -37% | 36% | |
| Read Seq (MB/s) | 1017 | 953 -6% | 490.5 -52% | 1266 24% | 519 -49% | 1662 63% |
| Write Seq (MB/s) | 861 | 592 -31% | 452.3 -47% | 982 14% | 468 -46% | 1336 55% |
| Read 512 (MB/s) | 687 | 520 -24% | 386.2 -44% | 834 21% | 344.8 -50% | 1183 72% |
| Write 512 (MB/s) | 698 | 591 -15% | 219.9 -68% | 714 2% | 458 -34% | 1481 112% |
| Read 4k (MB/s) | 40.91 | 42.66 4% | 34.35 -16% | 40.72 0% | 28.45 -30% | 16.1 -61% |
| Write 4k (MB/s) | 108.6 | 136.3 26% | 91.2 -16% | 139.4 28% | 56.2 -48% | 23.5 -78% |
| Read 4k QD32 (MB/s) | 326.9 | 615 88% | 378.9 16% | 527 61% | 286 -13% | 657 101% |
| Write 4k QD32 (MB/s) | 347.1 | 517 49% | 152.2 -56% | 395.2 14% | 257.7 -26% | 419 21% |

| 3DMark 11 - 1280x720 Performance GPU | |
| Acer Aspire VN7-593G-73HP V15 Nitro BE | |
| HP Omen 15-ax007ng | |
| HP Omen 17-w010ng | |
| Asus G752VL-T7023T | |
| Microsoft Surface Book with Performance Base | |
| Acer TravelMate P658-M-59J7 Graphics Dock | |
| Asus Zenbook UX510UW-CN044T | |
| Acer Aspire V5-591G-50NC | |
| Asus F756UX-T7013T | |
| Apple MacBook Pro 13 2016 (2.9 GHz) | |
| HP Spectre x360 15-bl002xx | |
| Microsoft Surface Book Core i5 | |
| Asus UX310UQ-FC396T | |
| Lenovo Yoga 710-14IKB 80V4002HGE | |
| 3DMark | |
| 1280x720 Cloud Gate Standard Graphics | |
| Acer Aspire VN7-593G-73HP V15 Nitro BE | |
| HP Omen 15-ax007ng | |
| HP Omen 17-w010ng | |
| Dell XPS 15 9560 (i7-7700HQ, UHD) | |
| Dell XPS 15 9550 i7 FHD | |
| Acer TravelMate P658-M-59J7 Graphics Dock | |
| Asus Zenbook UX510UW-CN044T | |
| Acer Aspire V5-591G-50NC | |
| Asus F756UX-T7013T | |
| Asus G752VL-T7023T | |
| Microsoft Surface Book with Performance Base | |
| Apple MacBook Pro 13 2016 (2.9 GHz) | |
| HP Spectre x360 15-bl002xx | |
| Microsoft Surface Book Core i5 | |
| Asus UX310UQ-FC396T | |
| Lenovo Yoga 710-14IKB 80V4002HGE | |
| 1920x1080 Fire Strike Graphics | |
| Acer Aspire VN7-593G-73HP V15 Nitro BE | |
| Dell XPS 15 9560 (i7-7700HQ, UHD) | |
| HP Omen 15-ax007ng | |
| HP Omen 17-w010ng | |
| Asus G752VL-T7023T | |
| Microsoft Surface Book with Performance Base | |
| Dell XPS 15 9550 i7 FHD | |
| Asus Zenbook UX510UW-CN044T | |
| Acer TravelMate P658-M-59J7 Graphics Dock | |
| Acer Aspire V5-591G-50NC | |
| Asus F756UX-T7013T | |
| HP Spectre x360 15-bl002xx | |
| Microsoft Surface Book Core i5 | |
| Apple MacBook Pro 13 2016 (2.9 GHz) | |
| Asus UX310UQ-FC396T | |
| Lenovo Yoga 710-14IKB 80V4002HGE | |
| 3DMark 11 Performance | 5941 pontos | |
| 3DMark Cloud Gate Standard Score | 8836 pontos | |
| 3DMark Fire Strike Score | 4395 pontos | |
Ajuda | ||
| Rise of the Tomb Raider - 1920x1080 High Preset AA:FX AF:4x | |
| Acer Aspire VN7-593G-73HP V15 Nitro BE | |
| Dell XPS 15 9560 (i7-7700HQ, UHD) | |
| HP Omen 15-ax007ng | |
| Microsoft Surface Book with Performance Base | |
| Acer TravelMate P658-M-59J7 Graphics Dock | |
| Dell XPS 15 9550 i7 FHD | |
| HP Spectre x360 15-bl002xx | |
| Lenovo Yoga 710-14IKB 80V4002HGE | |
| Deus Ex Mankind Divided - 1920x1080 High Preset AF:4x | |
| Acer Aspire VN7-593G-73HP V15 Nitro BE | |
| Microsoft Surface Book with Performance Base | |
| Asus Zenbook UX510UW-CN044T | |
| The Witcher 3 - 1920x1080 Ultra Graphics & Postprocessing (HBAO+) | |
| Acer Aspire VN7-593G-73HP V15 Nitro BE | |
| Dell XPS 15 9560 (i7-7700HQ, UHD) | |
| Asus G752VL-T7023T | |
| Microsoft Surface Book with Performance Base | |
| Asus UX310UQ-FC396T | |
| baixo | média | alto | ultra | |
|---|---|---|---|---|
| BioShock Infinite (2013) | 128 | 118 | 49.9 | |
| The Witcher 3 (2015) | 31.3 | 17.4 | ||
| Rise of the Tomb Raider (2016) | 34.6 | 22.4 | ||
| Deus Ex Mankind Divided (2016) | 49 | 26.4 | 11.4 |
Barulho
| Ocioso |
| 29.4 / 29.4 / 29.7 dB |
| Carga |
| 39 / 40.2 dB |
 | ||
30 dB silencioso 40 dB(A) audível 50 dB(A) ruidosamente alto |
||
min: | ||
(-) A temperatura máxima no lado superior é 47 °C / 117 F, em comparação com a média de 35.4 °C / 96 F , variando de 19.6 a 60 °C para a classe Convertible.
(-) A parte inferior aquece até um máximo de 47 °C / 117 F, em comparação com a média de 36.9 °C / 98 F
(+) Em uso inativo, a temperatura média para o lado superior é 28.1 °C / 83 F, em comparação com a média do dispositivo de 30.3 °C / ### class_avg_f### F.
(±) Jogando The Witcher 3, a temperatura média para o lado superior é 33.7 °C / 93 F, em comparação com a média do dispositivo de 30.3 °C / ## #class_avg_f### F.
(-) Os apoios para as mãos e o touchpad podem ficar muito quentes ao toque, com um máximo de 47 °C / 116.6 F.
(-) A temperatura média da área do apoio para as mãos de dispositivos semelhantes foi 28 °C / 82.4 F (-19 °C / -34.2 F).
Microsoft Surface Book with Performance Base análise de áudio
(-) | alto-falantes não muito altos (###valor### dB)
Graves 100 - 315Hz
(±) | graves reduzidos - em média 5.9% menor que a mediana
(±) | a linearidade dos graves é média (7.1% delta para a frequência anterior)
Médios 400 - 2.000 Hz
(+) | médios equilibrados - apenas 4.3% longe da mediana
(±) | a linearidade dos médios é média (8.1% delta para frequência anterior)
Altos 2 - 16 kHz
(+) | agudos equilibrados - apenas 4.7% longe da mediana
(±) | a linearidade dos máximos é média (8% delta para frequência anterior)
Geral 100 - 16.000 Hz
(±) | a linearidade do som geral é média (19% diferença em relação à mediana)
Comparado com a mesma classe
» 45% de todos os dispositivos testados nesta classe foram melhores, 7% semelhantes, 48% piores
» O melhor teve um delta de 6%, a média foi 20%, o pior foi 57%
Comparado com todos os dispositivos testados
» 45% de todos os dispositivos testados foram melhores, 7% semelhantes, 47% piores
» O melhor teve um delta de 4%, a média foi 23%, o pior foi 134%
Apple MacBook Pro 13 2016 (2.9 GHz) análise de áudio
(+) | os alto-falantes podem tocar relativamente alto (###valor### dB)
Graves 100 - 315Hz
(±) | graves reduzidos - em média 13.2% menor que a mediana
(±) | a linearidade dos graves é média (10.7% delta para a frequência anterior)
Médios 400 - 2.000 Hz
(+) | médios equilibrados - apenas 4.1% longe da mediana
(+) | médios são lineares (6.3% delta para frequência anterior)
Altos 2 - 16 kHz
(+) | agudos equilibrados - apenas 2.9% longe da mediana
(+) | os máximos são lineares (4% delta da frequência anterior)
Geral 100 - 16.000 Hz
(+) | o som geral é linear (12.2% diferença em relação à mediana)
Comparado com a mesma classe
» 15% de todos os dispositivos testados nesta classe foram melhores, 5% semelhantes, 80% piores
» O melhor teve um delta de 5%, a média foi 18%, o pior foi 53%
Comparado com todos os dispositivos testados
» 10% de todos os dispositivos testados foram melhores, 2% semelhantes, 88% piores
» O melhor teve um delta de 4%, a média foi 23%, o pior foi 134%
HP Spectre x360 15-bl002xx análise de áudio
(±) | o volume do alto-falante é médio, mas bom (###valor### dB)
Graves 100 - 315Hz
(±) | graves reduzidos - em média 14.8% menor que a mediana
(±) | a linearidade dos graves é média (14% delta para a frequência anterior)
Médios 400 - 2.000 Hz
(+) | médios equilibrados - apenas 4.4% longe da mediana
(±) | a linearidade dos médios é média (10.1% delta para frequência anterior)
Altos 2 - 16 kHz
(+) | agudos equilibrados - apenas 1.2% longe da mediana
(+) | os máximos são lineares (4.9% delta da frequência anterior)
Geral 100 - 16.000 Hz
(±) | a linearidade do som geral é média (20.3% diferença em relação à mediana)
Comparado com a mesma classe
» 68% de todos os dispositivos testados nesta classe foram melhores, 9% semelhantes, 24% piores
» O melhor teve um delta de 5%, a média foi 17%, o pior foi 45%
Comparado com todos os dispositivos testados
» 53% de todos os dispositivos testados foram melhores, 8% semelhantes, 39% piores
» O melhor teve um delta de 4%, a média foi 23%, o pior foi 134%
| desligado | |
| Ocioso | |
| Carga |
|
Key:
min: | |
| Microsoft Surface Book with Performance Base 6600U, GeForce GTX 965M, Toshiba NVMe THNSN5256GPU7, IPS, 3000x2000, 13.5" | Microsoft Surface Book Core i7 6600U, Maxwell GPU (940M, GDDR5), Samsung MZFLV512 NVMe, IPS, 3000x2000, 13.5" | Microsoft Surface Pro 4, Core i5, 128GB 6300U, HD Graphics 520, Samsung MZFLV128 NVMe, IPS, 2736x1824, 12.3" | Lenovo Yoga 710-14IKB 80V4002HGE i5-7200U, HD Graphics 620, Samsung MZYTY256HDHP, a-Si WLED TFT, IPS, 1920x1080, 14" | Apple MacBook Pro 13 2016 (2.9 GHz) 6267U, Iris Graphics 550, Apple SSD AP0256, , 2560x1600, 13.3" | |
|---|---|---|---|---|---|
| Power Consumption | 5% | 27% | 33% | 24% | |
| Idle Minimum * (Watt) | 4.15 | 4.5 -8% | 4.4 -6% | 3.7 11% | 2.1 49% |
| Idle Average * (Watt) | 8 | 9.8 -23% | 9 -13% | 7.16 10% | 7.6 5% |
| Idle Maximum * (Watt) | 11.9 | 12.2 -3% | 10.7 10% | 8.3 30% | 8.2 31% |
| Load Average * (Watt) | 67 | 46 31% | 19.6 71% | 30.4 55% | 56.4 16% |
| Witcher 3 ultra * (Watt) | 58 | ||||
| Load Maximum * (Watt) | 76 | 56 26% | 19.9 74% | 30.3 60% | 59.8 21% |
* ... menor é melhor
| Microsoft Surface Book with Performance Base 6600U, GeForce GTX 965M, 78 Wh | Microsoft Surface Book Core i5 6300U, Maxwell GPU (940M, GDDR5), 78 Wh | Microsoft Surface Book Core i7 6600U, Maxwell GPU (940M, GDDR5), 78 Wh | Microsoft Surface Pro 4, Core i5, 128GB 6300U, HD Graphics 520, 38 Wh | Lenovo Yoga 710-14IKB 80V4002HGE i5-7200U, HD Graphics 620, 53 Wh | HP Spectre x360 15-bl002xx i7-7500U, GeForce 940MX, 79.2 Wh | Apple MacBook Pro 13 2016 (2.9 GHz) 6267U, Iris Graphics 550, 49.2 Wh | |
|---|---|---|---|---|---|---|---|
| Duração da bateria | 4% | 13% | -13% | 0% | 5% | -15% | |
| Reader / Idle (h) | 25.5 | 17.8 -30% | 15 -41% | 16 -37% | 14.4 -44% | ||
| WiFi v1.3 (h) | 9.6 | 6.7 -30% | 10.8 13% | 7.1 -26% | 9.4 -2% | 8.9 -7% | 9.4 -2% |
| Load (h) | 1.5 | 2.6 73% | 1.9 27% | 2.1 40% | 2.5 67% | 1.1 -27% | |
| H.264 (h) | 10.1 | 8.7 | 8.1 |
Pro
Contra
O chip GeForce dentro do teclado apenas pode utilizar todo o seu potencial turbo boost, e permanece em sua velocidade padrão de 950 MHz ao rodar o The Witcher 3. Enquanto o impacto em jogos atuais será bastante limitado, o impacto em benchmarks sintéticos é muito notório: é o motivo pelo qual o aparelho é um pouco mais lento que outros portáteis com GTX 965M.
A maioria dos jogos modernos será inviável em FHD com detalhes altos. Se estiver bem com isso, você receberá um desempenho acima da média para este nível de mobilidade. No entanto, não espere que o Surface Book esteja no nível de portáteis multimídia de 45 W - para poder chegar a isso, a Microsoft teria que melhorar o resfriamento e substituir a GPU com Nvidia Pascal.
Os gamers terão que pensar duas vezes antes de comprar o aparelho. Nossa unidade de teste custará cerca de 2.600 Euros na Europa e cerca de $2.400 mais impostos, nos Estados Unidos. Em comparação, a mesma quantidade de dinheiro compraria dois portáteis Acer V15 com GPU GTX 1060. Os gamers não são o alvo da Microsoft para o aparelho, e o foca da empresa está nos profissionais de design, arquitetura, CAD, vídeo, e pré-impressão, que requerem de muito poder da GPU para o trabalho.
Não é um Workstation
O Surface Book certamente não é um verdadeiro workstation. Ele não apenas não conta com as certificações CAD/CAM necessárias, mas também tem uma CPU de 15 W, que é algo inviável neste mercado em particular. Por isso a HP, Dell, e Lenovo não devem temer uma concorrência real aqui.
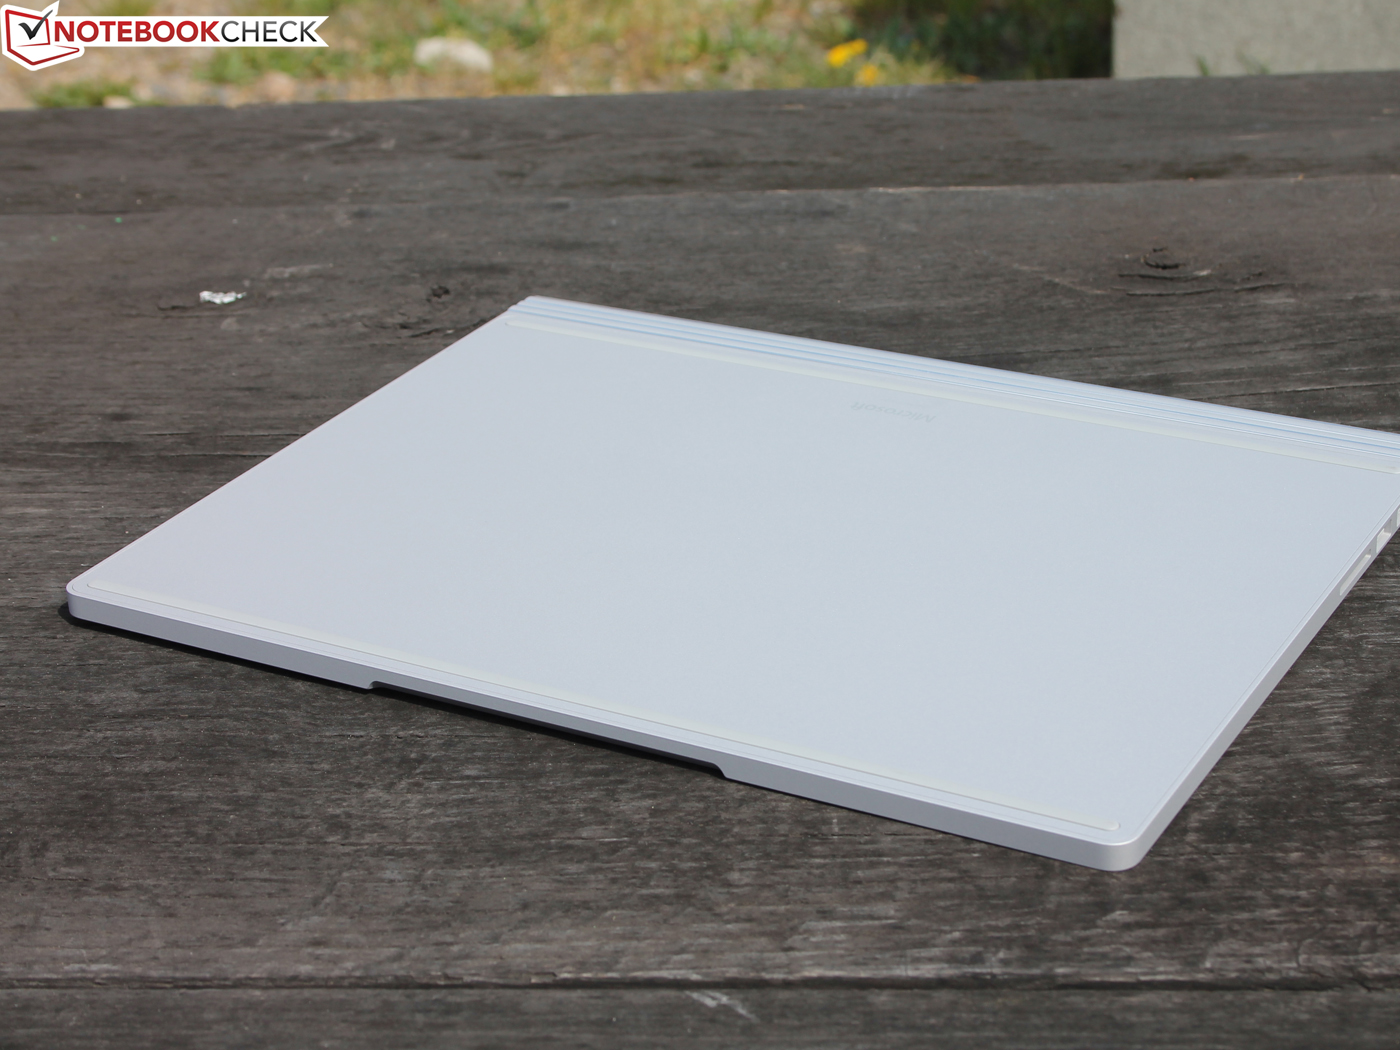
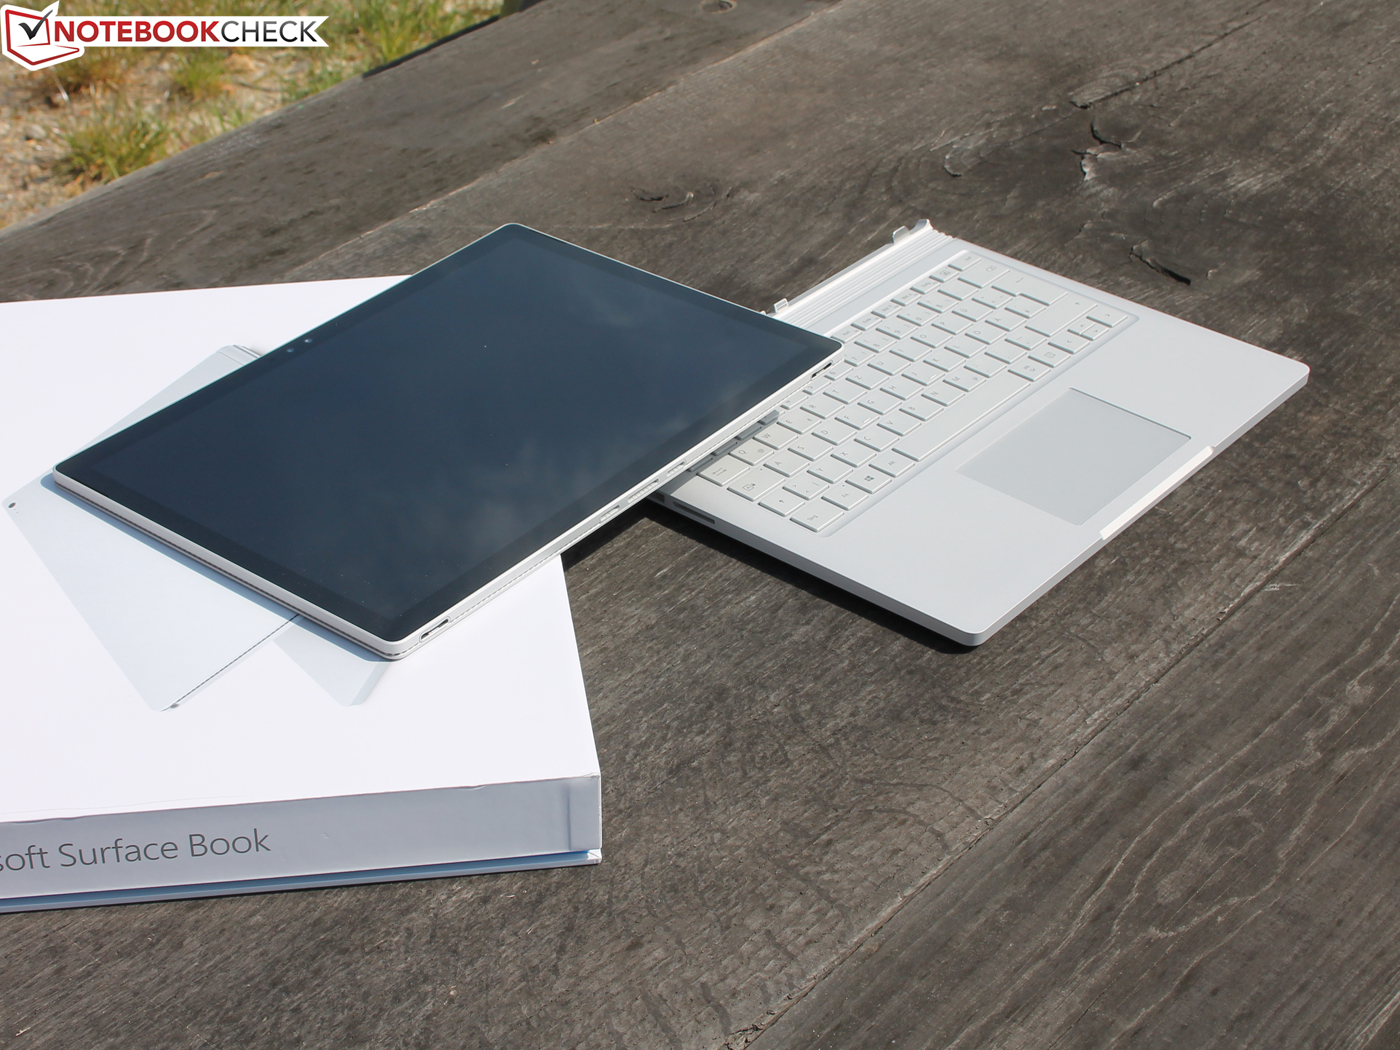
A fortaleza do Surface Book é a sua mobilidade: Desmontar e levar o tablet de 13 polegadas e sua stylus com você, onde quer que vá. Aqui é onde o Surface Book realmente brilha, com sua tela IPS muito brilhante (quase 100% e cobertura sRGB), seus excelentes dispositivos de entrada, sua carcaça de alta qualidade, suas muito boas câmeras e microfone, e uma duração de bateria impressionante, para começar. A montagem e desmontagem (docking e undocking) funcionaram perfeitamente durante nossos testes.
Suas fraquezas são a falta de portas e LTE, e o seu preço alto, que o leva além do que os clientes estão dispostos a pagar por um portátil. Um modelo com tela FHD, gráficos integrados, e um SSD de 256 GB por $1.000 poderia dominar o mercado. Infelizmente, o Surface Book mais barato, com Core i5-6300U e um SSD de 128 GB custa, pelo menos, $1.499, mais impostos.
GPU Thunderbolt 3 externo
Em teoria, todo portátil/tablet/conversível 2-em-1 com Thunderbolt 3 pode ser atualizado com um dock gráfico externo oferecido pela Razer, Acer, e Asus. Desta forma, inclusive os aparelhos ultra portáveis como o Dell XPS 13 2-em-1 ou o XPS 13 regular, podem ser transformados em potentes aparelhos gamers. Se quiser ler mais, dê uma olhada na nossa análise do Razer. Infelizmente, a Acer não vende mais o seu anexo eGPU, e a Asus e a Razer cobram $500 e $600 pelos seus modelos, respectivamente ($450 pelo modelo Razer em conjunto com um portátil). Isso sem uma placa de vídeo.
·Razer Core (GPU substituível)
·Acer Graphics Dock (GTX 960M, não substituível)
·Asus ROG XG Station 2 (GPU substituível)
As seguintes alternativas baseiam-se no mais recente controlador TI3 que, no entanto, ainda sofre com vários bugs e problemas de compatibilidade (veja aqui mais detalhes):
·Manitz Venus
·AKiTiO Node
Alternativa 2-em-1 com gráficos dedicados?
Não existem outras soluções docking que incluem uma GPU abaixo do teclado, disponíveis no mercado. O frequentemente mencionado Lenovo Yoga 710-14 pode parecer uma alternativa de baixo custo, mas, pelo menos de acordo com os Fóruns Lenovo, ele irrita os usuários com sua desagradável ventoinha. O HP Spectre x360 de 15 polegadas é muito mais portável.
Microsoft Surface Book with Performance Base
- 05/03/2017 v6 (old)
Sebastian Jentsch
Price comparison
