Em Análise o Razer Blade 15 Studio Edition: Workstation sólido com muito desempenho
Avaliação | Data | Modelo | Peso | Altura | Size | Resolução | Preço |
|---|---|---|---|---|---|---|---|
| 86.6 % v7 (old) | 12/2019 | Razer Blade 15 Studio Edition i7-9750H, Quadro RTX 5000 Max-Q | 2.2 kg | 17.8 mm | 15.60" | 3840x2160 | |
| 88.8 % v6 (old) | 05/2019 | Razer Blade 15 RTX 2080 Max-Q i7-9750H, GeForce RTX 2080 Max-Q | 2.2 kg | 17.8 mm | 15.60" | 1920x1080 | |
| 89.8 % v7 (old) | 11/2019 | Lenovo ThinkPad P53-20QN000YGE i7-9850H, Quadro RTX 5000 Max-Q | 2.7 kg | 29.4 mm | 15.60" | 1920x1080 | |
| 85 % v7 (old) | 06/2019 | MSI P65 Creator 9SF-657 i9-9880H, GeForce RTX 2070 Max-Q | 1.9 kg | 18 mm | 15.60" | 3840x2160 | |
| 86.9 % v7 (old) | 11/2019 | Dell Precision 5540 i9-9980HK, Quadro T2000 Max-Q | 2 kg | 17 mm | 15.60" | 3840x2160 | |
| 85.6 % v6 (old) | Fujitsu Celsius H780 i7-8850H, Quadro P2000 | 2.8 kg | 31.9 mm | 15.60" | 1920x1080 | ||
| 84.4 % v7 (old) | 11/2018 | HP ZBook Studio G5-4QH10EA i7-8750H, Quadro P1000 | 2.1 kg | 18.9 mm | 15.60" | 3840x2160 |
| SD Card Reader | |
| average JPG Copy Test (av. of 3 runs) | |
| Lenovo ThinkPad P53-20QN000YGE (Toshiba Exceria Pro SDXC 64 GB UHS-II) | |
| HP ZBook Studio G5-4QH10EA (Toshiba Exceria Pro SDXC 64 GB UHS-II) | |
| Dell Precision 5540 (Toshiba Exceria Pro SDXC 64 GB UHS-II) | |
| Fujitsu Celsius H780 (Toshiba Exceria Pro SDXC 64 GB UHS-II) | |
| Média da turma Workstation (49.6 - 681, n=14, últimos 2 anos) | |
| Razer Blade 15 Studio Edition (Toshiba Exceria Pro SDXC 64 GB UHS-II) | |
| maximum AS SSD Seq Read Test (1GB) | |
| Média da turma Workstation (87.6 - 1455, n=14, últimos 2 anos) | |
| HP ZBook Studio G5-4QH10EA (Toshiba Exceria Pro SDXC 64 GB UHS-II) | |
| Lenovo ThinkPad P53-20QN000YGE (Toshiba Exceria Pro SDXC 64 GB UHS-II) | |
| Dell Precision 5540 (Toshiba Exceria Pro SDXC 64 GB UHS-II) | |
| Fujitsu Celsius H780 (Toshiba Exceria Pro SDXC 64 GB UHS-II) | |
| Networking | |
| iperf3 transmit AX12 | |
| Razer Blade 15 Studio Edition (iperf 3.1.3) | |
| Lenovo ThinkPad P53-20QN000YGE (Intel X550-T2) | |
| Lenovo ThinkPad P53-20QN000YGE (Killer E2500) | |
| Razer Blade 15 RTX 2080 Max-Q | |
| Fujitsu Celsius H780 (iperf 3.1.3) | |
| MSI P65 Creator 9SF-657 | |
| HP ZBook Studio G5-4QH10EA (iperf 3.1.3) | |
| Dell Precision 5540 (Killer E2500) | |
| iperf3 receive AX12 | |
| Lenovo ThinkPad P53-20QN000YGE (Intel X550-T2) | |
| Lenovo ThinkPad P53-20QN000YGE (Killer E2500) | |
| Razer Blade 15 Studio Edition (iperf 3.1.3) | |
| Razer Blade 15 RTX 2080 Max-Q | |
| HP ZBook Studio G5-4QH10EA (iperf 3.1.3) | |
| Fujitsu Celsius H780 (iperf 3.1.3) | |
| Dell Precision 5540 (Killer E2500) | |
| MSI P65 Creator 9SF-657 (iperf 3.1.3) | |
| |||||||||||||||||||||||||
iluminação: 89 %
iluminação com acumulador: 361 cd/m²
Contraste: 24067:1 (Preto: 0.015 cd/m²)
ΔE ColorChecker Calman: 5.3 | ∀{0.5-29.43 Ø4.73}
calibrated: 4.7
ΔE Greyscale Calman: 2.1 | ∀{0.09-98 Ø4.97}
100% sRGB (Argyll 1.6.3 3D)
86% AdobeRGB 1998 (Argyll 1.6.3 3D)
96.4% AdobeRGB 1998 (Argyll 3D)
100% sRGB (Argyll 3D)
99.9% Display P3 (Argyll 3D)
Gamma: 2.14
CCT: 6149 K
| Razer Blade 15 Studio Edition OLED, 3840x2160, 15.6" | Razer Blade 15 RTX 2080 Max-Q IPS, 1920x1080, 15.6" | Lenovo ThinkPad P53-20QN000YGE IPS, 1920x1080, 15.6" | MSI P65 Creator 9SF-657 IPS, 3840x2160, 15.6" | Dell Precision 5540 OLED, 3840x2160, 15.6" | Fujitsu Celsius H780 IPS LED, 1920x1080, 15.6" | HP ZBook Studio G5-4QH10EA IPS LED, 3840x2160, 15.6" | |
|---|---|---|---|---|---|---|---|
| Display | -21% | -26% | -5% | 0% | -28% | -22% | |
| Display P3 Coverage (%) | 99.9 | 66.9 -33% | 63.2 -37% | 84.4 -16% | 99.9 0% | 66.3 -34% | 68.2 -32% |
| sRGB Coverage (%) | 100 | 98.1 -2% | 92.9 -7% | 100 0% | 100 0% | 85.9 -14% | 96.2 -4% |
| AdobeRGB 1998 Coverage (%) | 96.4 | 68.5 -29% | 64.3 -33% | 98.5 2% | 97.3 1% | 62.8 -35% | 68.8 -29% |
| Response Times | -244% | -855% | -1138% | 14% | -869% | -1324% | |
| Response Time Grey 50% / Grey 80% * (ms) | 3 ? | 12.8 ? -327% | 38.4 ? -1180% | 51 ? -1600% | 2.8 ? 7% | 38 ? -1167% | 60.8 ? -1927% |
| Response Time Black / White * (ms) | 4 ? | 10.4 ? -160% | 25.2 ? -530% | 31 ? -675% | 3.2 ? 20% | 26.8 ? -570% | 32.8 ? -720% |
| PWM Frequency (Hz) | 23810 ? | 26040 ? | 240.9 ? | 20830 ? | |||
| Screen | -164% | -203% | -336% | 17% | -180% | -177% | |
| Brightness middle (cd/m²) | 361 | 293 -19% | 510 41% | 445 23% | 427 18% | 271 -25% | 417 16% |
| Brightness (cd/m²) | 357 | 270 -24% | 468 31% | 462 29% | 411 15% | 260 -27% | 412 15% |
| Brightness Distribution (%) | 89 | 87 -2% | 89 0% | 83 -7% | 89 0% | 86 -3% | 85 -4% |
| Black Level * (cd/m²) | 0.015 | 0.29 -1833% | 0.36 -2300% | 0.5 -3233% | 0.29 -1833% | 0.29 -1833% | |
| Contrast (:1) | 24067 | 1010 -96% | 1417 -94% | 890 -96% | 934 -96% | 1438 -94% | |
| Colorchecker dE 2000 * | 5.3 | 1.69 68% | 2.3 57% | 4.75 10% | 3.2 40% | 3.9 26% | 4.4 17% |
| Colorchecker dE 2000 max. * | 11.5 | 3.37 71% | 5.5 52% | 7.79 32% | 8.4 27% | 10.2 11% | 6.7 42% |
| Colorchecker dE 2000 calibrated * | 4.7 | 1.24 74% | 1.2 74% | 2.8 40% | 2.9 38% | 1.9 60% | |
| Greyscale dE 2000 * | 2.1 | 2.3 -10% | 3.2 -52% | 4.49 -114% | 1.8 14% | 2.6 -24% | 5 -138% |
| Gamma | 2.14 103% | 2.3 96% | 2.34 94% | 2.49 88% | 2.15 102% | 2.29 96% | 2.28 96% |
| CCT | 6149 106% | 6758 96% | 7036 92% | 7374 88% | 6176 105% | 6517 100% | 7575 86% |
| Color Space (Percent of AdobeRGB 1998) (%) | 86 | 63 -27% | 59.4 -31% | 87 1% | 86.8 1% | 56.1 -35% | 62.3 -28% |
| Color Space (Percent of sRGB) (%) | 100 | 98.5 -1% | 93.1 -7% | 100 0% | 100 0% | 85.8 -14% | 96 -4% |
| Média Total (Programa/Configurações) | -143% /
-147% | -361% /
-251% | -493% /
-376% | 10% /
13% | -359% /
-238% | -508% /
-291% |
* ... menor é melhor
Exibir tempos de resposta
| ↔ Tempo de resposta preto para branco | ||
|---|---|---|
| 4 ms ... ascensão ↗ e queda ↘ combinadas | ↗ 2 ms ascensão |  |
| ↘ 2 ms queda | ||
| A tela mostra taxas de resposta muito rápidas em nossos testes e deve ser muito adequada para jogos em ritmo acelerado. Em comparação, todos os dispositivos testados variam de 0.1 (mínimo) a 240 (máximo) ms. » 16 % de todos os dispositivos são melhores. Isso significa que o tempo de resposta medido é melhor que a média de todos os dispositivos testados (19.9 ms). | ||
| ↔ Tempo de resposta 50% cinza a 80% cinza | ||
| 3 ms ... ascensão ↗ e queda ↘ combinadas | ↗ 1 ms ascensão |  |
| ↘ 2 ms queda | ||
| A tela mostra taxas de resposta muito rápidas em nossos testes e deve ser muito adequada para jogos em ritmo acelerado. Em comparação, todos os dispositivos testados variam de 0.165 (mínimo) a 636 (máximo) ms. » 13 % de todos os dispositivos são melhores. Isso significa que o tempo de resposta medido é melhor que a média de todos os dispositivos testados (31.1 ms). | ||
Cintilação da tela / PWM (modulação por largura de pulso)
| Tela tremeluzindo / PWM não detectado | 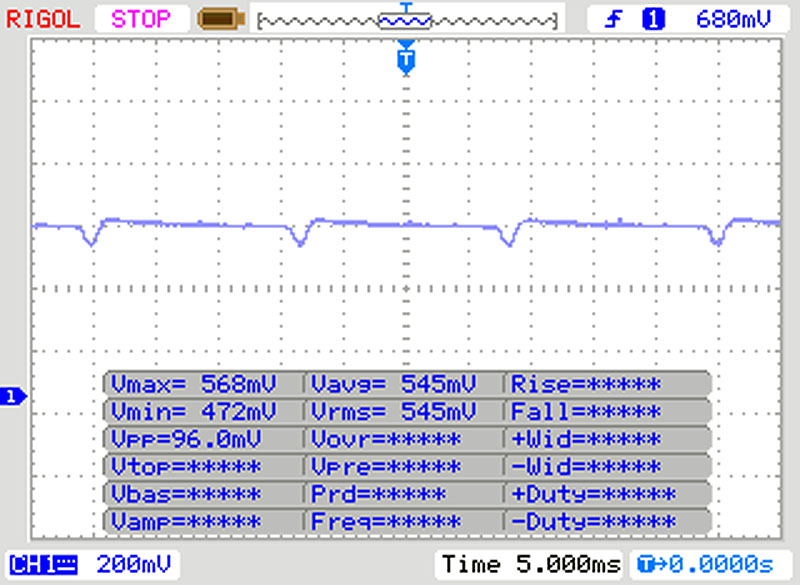 | ||
[pwm_comparison] Em comparação: 52 % de todos os dispositivos testados não usam PWM para escurecer a tela. Se PWM foi detectado, uma média de 7794 (mínimo: 5 - máximo: 343500) Hz foi medida. | |||
| Cinebench R15 | |
| CPU Single 64Bit | |
| Média da turma Workstation (191.4 - 328, n=25, últimos 2 anos) | |
| Lenovo ThinkPad P53-20QN000YGE | |
| MSI P65 Creator 9SF-657 | |
| Dell Precision 5540 | |
| Fujitsu Celsius H780 | |
| Média Intel Core i7-9750H (170 - 194, n=82) | |
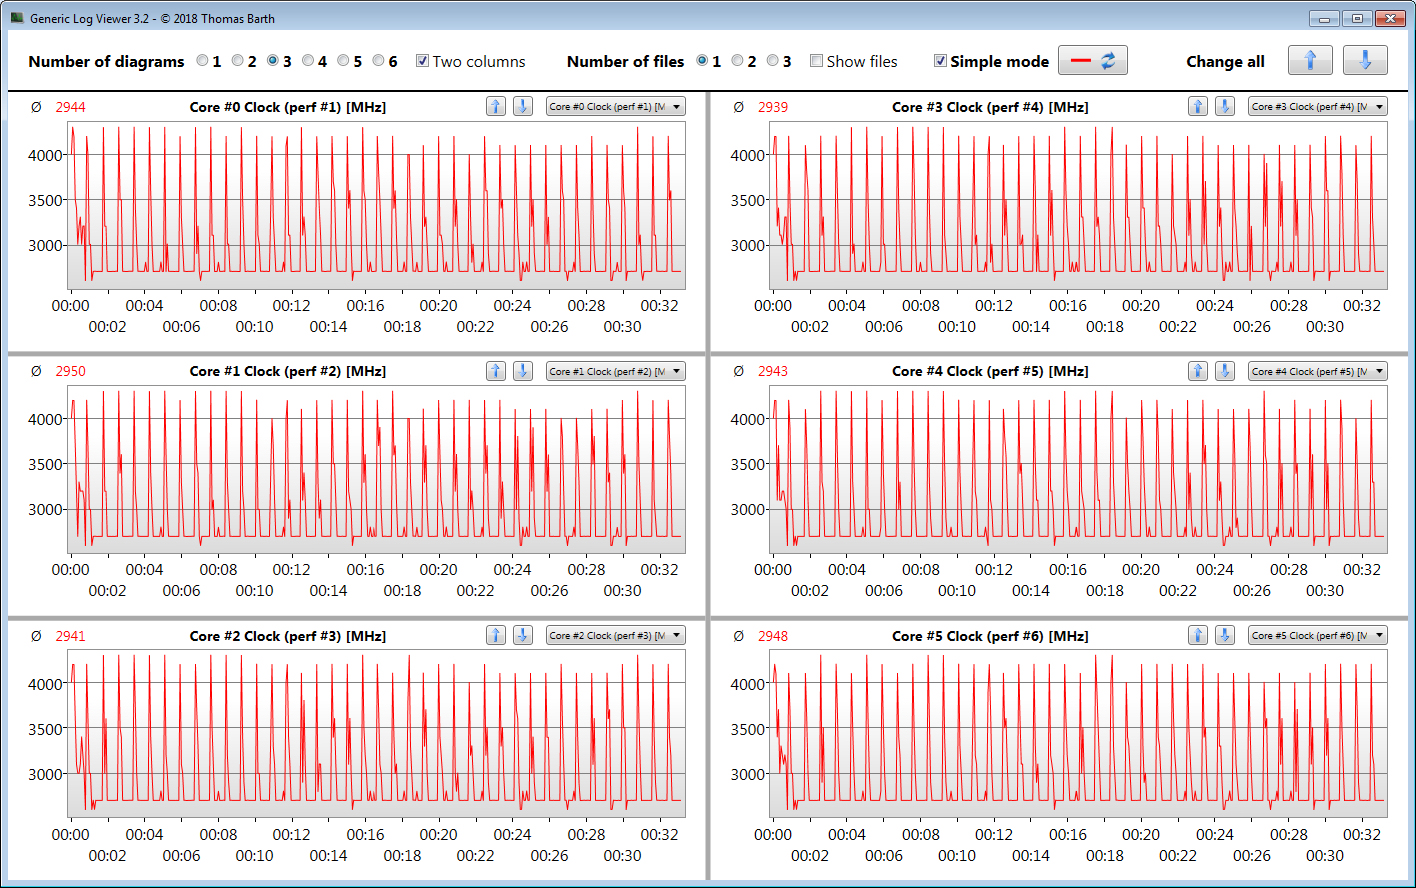
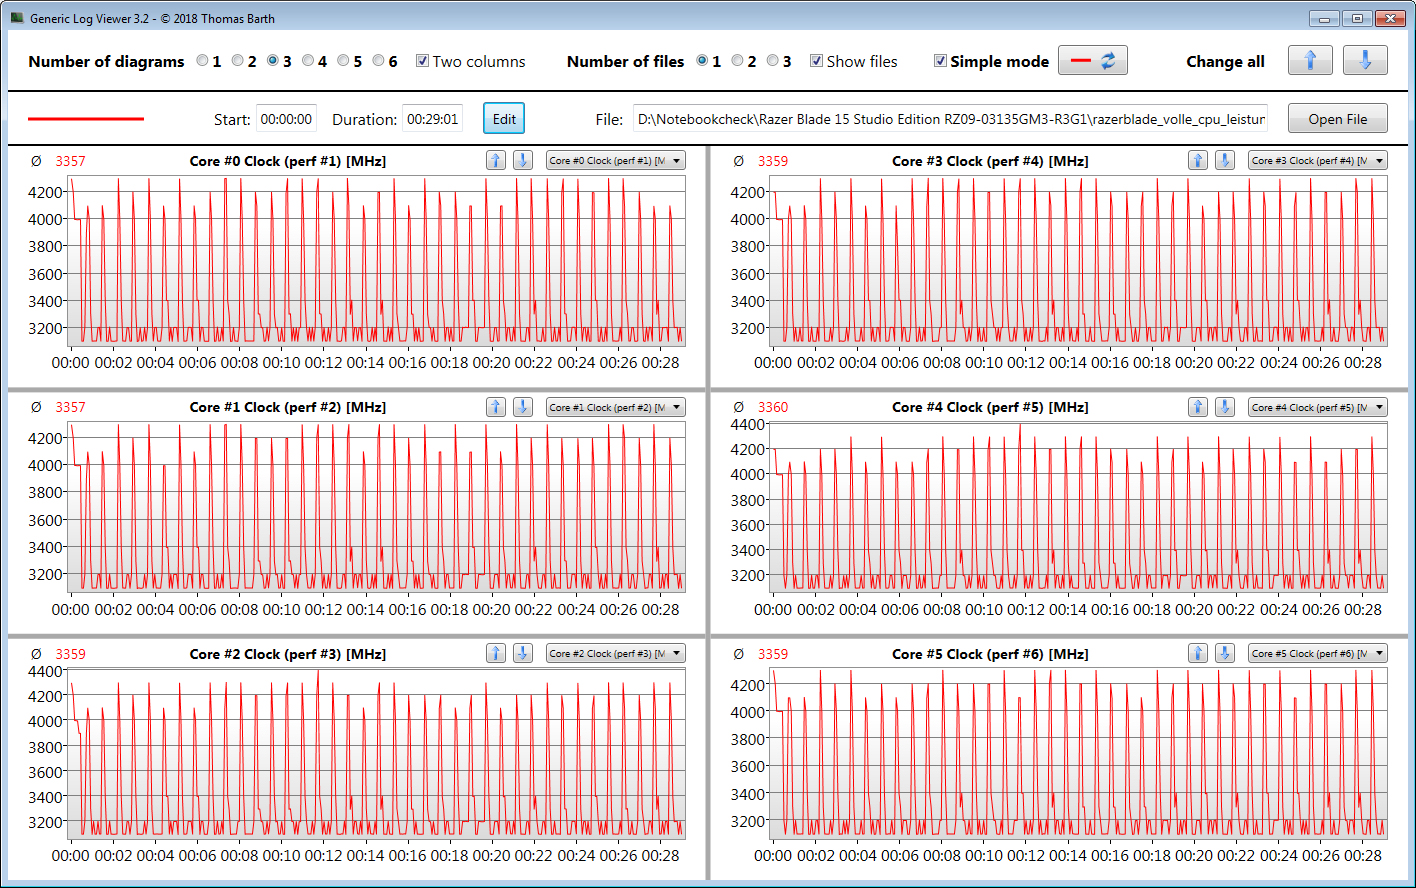
| Razer Blade 15 Studio Edition (Max. CPU-Leistung) | |
| Razer Blade 15 Studio Edition | |
| HP ZBook Studio G5-4QH10EA | |
| Razer Blade 15 RTX 2080 Max-Q | |
| CPU Multi 64Bit | |
| Média da turma Workstation (2489 - 5810, n=25, últimos 2 anos) | |
| MSI P65 Creator 9SF-657 | |
| Dell Precision 5540 | |
| Lenovo ThinkPad P53-20QN000YGE | |
| Média Intel Core i7-9750H (952 - 1306, n=85) | |
| Razer Blade 15 RTX 2080 Max-Q | |
| Razer Blade 15 Studio Edition (Max. CPU-Leistung) | |
| HP ZBook Studio G5-4QH10EA | |
| Fujitsu Celsius H780 | |
| Razer Blade 15 Studio Edition | |
| Cinebench R10 | |
| Rendering Single 32Bit | |
| Dell Precision 5540 | |
| Média da turma Workstation (n=1últimos 2 anos) | |
| Média Intel Core i7-9750H (6659 - 7214, n=13) | |
| Razer Blade 15 Studio Edition | |
| Rendering Multiple CPUs 32Bit | |
| Média da turma Workstation (n=1últimos 2 anos) | |
| Dell Precision 5540 | |
| Média Intel Core i7-9750H (28251 - 36304, n=13) | |
| Razer Blade 15 Studio Edition | |
| Cinebench R20 | |
| CPU (Single Core) | |
| Média da turma Workstation (671 - 857, n=25, últimos 2 anos) | |
| Média Intel Core i7-9750H (416 - 486, n=55) | |
| Razer Blade 15 Studio Edition (Max. CPU-Leistung) | |
| Razer Blade 15 Studio Edition | |
| CPU (Multi Core) | |
| Média da turma Workstation (5471 - 15043, n=25, últimos 2 anos) | |
| Média Intel Core i7-9750H (2017 - 3133, n=55) | |
| Razer Blade 15 Studio Edition (Max. CPU-Leistung) | |
| Razer Blade 15 Studio Edition | |
| Geekbench 3 | |
| 32 Bit Multi-Core Score | |
| Média Intel Core i7-9750H (21185 - 23587, n=8) | |
| Razer Blade 15 Studio Edition | |
| 32 Bit Single-Core Score | |
| Razer Blade 15 Studio Edition | |
| Média Intel Core i7-9750H (4137 - 4428, n=8) | |
| Geekbench 4.4 | |
| 64 Bit Multi-Core Score | |
| Média da turma Workstation (n=1últimos 2 anos) | |
| Dell Precision 5540 | |
| Lenovo ThinkPad P53-20QN000YGE | |
| Fujitsu Celsius H780 | |
| Média Intel Core i7-9750H (17054 - 25043, n=27) | |
| Razer Blade 15 Studio Edition | |
| 64 Bit Single-Core Score | |
| Média da turma Workstation (n=1últimos 2 anos) | |
| Dell Precision 5540 | |
| Lenovo ThinkPad P53-20QN000YGE | |
| Razer Blade 15 Studio Edition | |
| Média Intel Core i7-9750H (4440 - 5511, n=27) | |
| Fujitsu Celsius H780 | |
| Mozilla Kraken 1.1 - Total | |
| HP ZBook Studio G5-4QH10EA (Edge) | |
| Razer Blade 15 RTX 2080 Max-Q (Edge 44.17763.1.0) | |
| Razer Blade 15 Studio Edition (Edge 44) | |
| Média Intel Core i7-9750H (845 - 1713, n=54) | |
| Lenovo ThinkPad P53-20QN000YGE (Edge 44.18362.387.0) | |
| Dell Precision 5540 | |
| Média da turma Workstation (411 - 538, n=25, últimos 2 anos) | |
| Octane V2 - Total Score | |
| Média da turma Workstation (92715 - 129420, n=4, últimos 2 anos) | |
| Dell Precision 5540 | |
| Lenovo ThinkPad P53-20QN000YGE (Edge 44.18362.387.0) | |
| Razer Blade 15 RTX 2080 Max-Q (Edge 44.17763.1.0) | |
| Média Intel Core i7-9750H (22874 - 39708, n=47) | |
| Razer Blade 15 Studio Edition (Edge 44) | |
| HP ZBook Studio G5-4QH10EA (Edge) | |
| JetStream 1.1 - 1.1 Total | |
| Lenovo ThinkPad P53-20QN000YGE (Edge 44.18362.387.0) | |
| Razer Blade 15 RTX 2080 Max-Q (Edge 44.17763.1.0) | |
| Fujitsu Celsius H780 (Edge) | |
| Média Intel Core i7-9750H (212 - 280, n=47) | |
| Dell Precision 5540 | |
| Razer Blade 15 Studio Edition (Edge 44) | |
| HP ZBook Studio G5-4QH10EA (Edge) | |
* ... menor é melhor
| PCMark 8 Home Score Accelerated v2 | 3551 pontos | |
| PCMark 8 Creative Score Accelerated v2 | 3820 pontos | |
| PCMark 8 Work Score Accelerated v2 | 4454 pontos | |
| PCMark 10 Score | 5317 pontos | |
Ajuda | ||
| PCMark 8 | |
| Home Score Accelerated v2 | |
| Razer Blade 15 RTX 2080 Max-Q | |
| Fujitsu Celsius H780 | |
| Dell Precision 5540 | |
| Razer Blade 15 Studio Edition | |
| Média Intel Core i7-9750H, NVIDIA Quadro RTX 5000 Max-Q (3524 - 3551, n=2) | |
| MSI P65 Creator 9SF-657 | |
| HP ZBook Studio G5-4QH10EA | |
| Work Score Accelerated v2 | |
| Razer Blade 15 RTX 2080 Max-Q | |
| Fujitsu Celsius H780 | |
| Dell Precision 5540 | |
| MSI P65 Creator 9SF-657 | |
| Razer Blade 15 Studio Edition | |
| HP ZBook Studio G5-4QH10EA | |
| Média Intel Core i7-9750H, NVIDIA Quadro RTX 5000 Max-Q (4436 - 4454, n=2) | |

| Razer Blade 15 Studio Edition Samsung SSD PM981 MZVLB1T0HALR | Razer Blade 15 RTX 2080 Max-Q Samsung SSD PM981 MZVLB512HAJQ | Lenovo ThinkPad P53-20QN000YGE Samsung PM981a MZVLB1T0HBLR | MSI P65 Creator 9SF-657 2x Samsung SSD PM981 MZVLB512HAJQ (RAID 0) | Dell Precision 5540 SK hynix PC400 512 GB | Fujitsu Celsius H780 Samsung SSD PM981 MZVLB512HAJQ | HP ZBook Studio G5-4QH10EA Samsung SSD PM981 MZVLB512HAJQ | Média Samsung SSD PM981 MZVLB1T0HALR | |
|---|---|---|---|---|---|---|---|---|
| CrystalDiskMark 5.2 / 6 | 16% | 26% | 56% | -4% | -2% | -4% | 25% | |
| Write 4K (MB/s) | 100.4 | 137.2 37% | 147 46% | 105.6 5% | 98 -2% | 98.3 -2% | 102.7 2% | 165.7 ? 65% |
| Read 4K (MB/s) | 42.03 | 46.82 11% | 48.3 15% | 46.32 10% | 41.25 -2% | 40.18 -4% | 38.32 -9% | 44.6 ? 6% |
| Write Seq (MB/s) | 1185 | 1221 3% | 1402 18% | 2910 146% | 1295 9% | 1777 50% | 1417 20% | 1982 ? 67% |
| Read Seq (MB/s) | 1132 | 1217 8% | 1503 33% | 2820 149% | 1441 27% | 1247 10% | 1289 14% | 1764 ? 56% |
| Write 4K Q32T1 (MB/s) | 371.4 | 527 42% | 475.2 28% | 545 47% | 429.2 16% | 344.7 -7% | 278.9 -25% | 395 ? 6% |
| Read 4K Q32T1 (MB/s) | 422.6 | 614 45% | 581 37% | 632 50% | 400.1 -5% | 383.1 -9% | 348.8 -17% | 434 ? 3% |
| Write Seq Q32T1 (MB/s) | 2379 | 1986 -17% | 2936 23% | 3349 41% | 1366 -43% | 2019 -15% | 1895 -20% | 2351 ? -1% |
| Read Seq Q32T1 (MB/s) | 3222 | 3234 0% | 3539 10% | 3333 3% | 2201 -32% | 2076 -36% | 3352 4% | 3234 ? 0% |
| 3DMark Vantage P Result | 52289 pontos | |
| 3DMark 11 Performance | 19787 pontos | |
| 3DMark Ice Storm Standard Score | 66054 pontos | |
| 3DMark Cloud Gate Standard Score | 25769 pontos | |
| 3DMark Fire Strike Score | 16320 pontos | |
| 3DMark Time Spy Score | 6801 pontos | |
Ajuda | ||
| The Witcher 3 - 1920x1080 Ultra Graphics & Postprocessing (HBAO+) | |
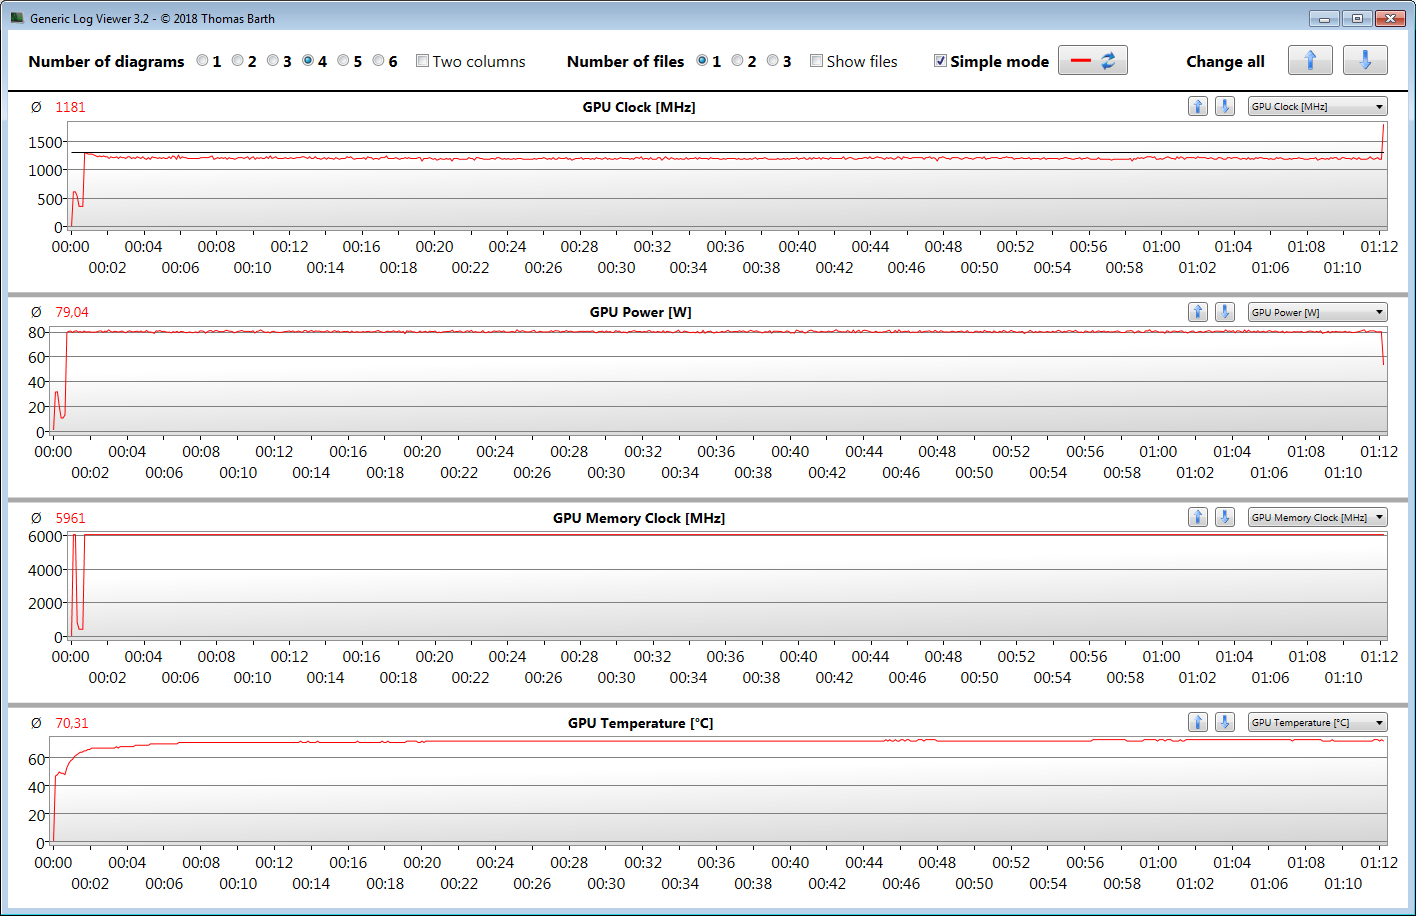
| Razer Blade 15 Studio Edition (Max. CPU, max. GPU) | |
| Razer Blade 15 Studio Edition | |
| Média NVIDIA Quadro RTX 5000 Max-Q (71 - 88.5, n=10) | |
| MSI P65 Creator 9SF-657 | |
| Razer Blade 15 RTX 2080 Max-Q | |
| Lenovo ThinkPad P53-20QN000YGE | |
| Média da turma Workstation (26.3 - 91.7, n=3, últimos 2 anos) | |
| Dell Precision 5540 | |
| Fujitsu Celsius H780 | |
| HP ZBook Studio G5-4QH10EA | |
| BioShock Infinite - 1920x1080 Ultra Preset, DX11 (DDOF) | |
| Razer Blade 15 RTX 2080 Max-Q | |
| Média NVIDIA Quadro RTX 5000 Max-Q (167.2 - 174.3, n=3) | |
| Razer Blade 15 Studio Edition | |
| MSI P65 Creator 9SF-657 | |
| Dell Precision 5540 | |
| HP ZBook Studio G5-4QH10EA | |
| Dirt Rally 2.0 - 1920x1080 Ultra Preset AA:T AF:16x | |
| Razer Blade 15 Studio Edition | |
| Média NVIDIA Quadro RTX 5000 Max-Q (89.3 - 90.7, n=2) | |
| Lenovo ThinkPad P53-20QN000YGE | |
| Total War: Three Kingdoms - 1920x1080 Ultra (incl textures) | |
| Razer Blade 15 Studio Edition | |
| Média NVIDIA Quadro RTX 5000 Max-Q (57.5 - 64.9, n=2) | |
| The Division 2 - 1920x1080 Ultra Preset | |
| Razer Blade 15 Studio Edition | |
| Média NVIDIA Quadro RTX 5000 Max-Q (n=1) | |
| Anno 1800 - 1920x1080 Ultra Graphics Quality (DX11) | |
| Lenovo ThinkPad P53-20QN000YGE | |
| Média NVIDIA Quadro RTX 5000 Max-Q (37.4 - 38.9, n=2) | |
| Razer Blade 15 Studio Edition | |
| baixo | média | alto | ultra | QHD | 4K | |
|---|---|---|---|---|---|---|
| BioShock Infinite (2013) | 320.5 | 283.2 | 265 | 167.2 | ||
| GTA V (2015) | 169.1 | 163.4 | 132.3 | 72 | 89.1 | |
| The Witcher 3 (2015) | 286.9 | 229.5 | 144.8 | 83.3 | 49.2 | |
| Rainbow Six Siege (2015) | 254.8 | 226.7 | 191.8 | 183.4 | 86.9 | |
| Ashes of the Singularity (2016) | 84.4 | 77.7 | 75.4 | 42.3 | ||
| For Honor (2017) | 246.1 | 162.1 | 156 | 123.2 | 48.1 | |
| Ghost Recon Wildlands (2017) | 130.4 | 91.9 | 85.7 | 58.7 | 38.6 | |
| Middle-earth: Shadow of War (2017) | 113 | 108 | 98 | 86 | 38 | |
| Final Fantasy XV Benchmark (2018) | 87 | 82.3 | 65.8 | 30.6 | ||
| X-Plane 11.11 (2018) | 96.3 | 84.9 | 72.2 | 56.6 | ||
| World of Tanks enCore (2018) | 595 | 367.5 | 175.5 | 109.6 | 52.3 | |
| Assassin´s Creed Odyssey (2018) | 95 | 80 | 75 | 54 | 47 | 30 |
| Battlefield V (2018) | 139.4 | 130.8 | 120.4 | 112.1 | 91.6 | 53.5 |
| Apex Legends (2019) | 144 | 144 | 144 | 142.8 | 104.9 | 53.4 |
| Far Cry New Dawn (2019) | 104 | 90 | 88 | 81 | 74 | 43 |
| Metro Exodus (2019) | 115.2 | 87.8 | 66.9 | 55.4 | 25.4 | 25.2 |
| Dirt Rally 2.0 (2019) | 241.2 | 169.4 | 153 | 90.7 | 70.2 | 39.8 |
| The Division 2 (2019) | 144 | 112 | 97 | 56 | 51 | 27 |
| Anno 1800 (2019) | 95.8 | 90.9 | 69.3 | 37.4 | 34.7 | 21.2 |
| Rage 2 (2019) | 224 | 114.8 | 96.4 | 94.3 | 59.4 | 28.7 |
| Total War: Three Kingdoms (2019) | 218.6 | 120.2 | 87.3 | 64.9 | 43.5 | 21.5 |
| F1 2019 (2019) | 192 | 165 | 131 | 118 | 86 | 56 |
| Control (2019) | 223.5 | 93.2 | 66.5 | 42.7 | 19.1 | |
| Borderlands 3 (2019) | 118.8 | 99.9 | 78.4 | 62.5 | 42.9 | 22.8 |
| Ghost Recon Breakpoint (2019) | 117 | 96 | 92 | 68 | 49 | 28 |
| GRID 2019 (2019) | 131.5 | 107.8 | 96.2 | 87.2 | 62.7 | 38.6 |
| Call of Duty Modern Warfare 2019 (2019) | 185.2 | 130.6 | 103.6 | 91.8 | 65.2 | 35.2 |
| Need for Speed Heat (2019) | 92.3 | 84.4 | 77.5 | 72.1 | 65.4 | 36.9 |
| Star Wars Jedi Fallen Order (2019) | 88.5 | 83.1 | 80.4 | 64 | 33.5 |
Barulho
| Ocioso |
| 30.6 / 30.6 / 30.6 dB |
| Carga |
| 43 / 41 dB |
 | ||
30 dB silencioso 40 dB(A) audível 50 dB(A) ruidosamente alto |
||
min: | ||
| Razer Blade 15 Studio Edition i7-9750H, Quadro RTX 5000 Max-Q | Razer Blade 15 RTX 2080 Max-Q i7-9750H, GeForce RTX 2080 Max-Q | Lenovo ThinkPad P53-20QN000YGE i7-9850H, Quadro RTX 5000 Max-Q | MSI P65 Creator 9SF-657 i9-9880H, GeForce RTX 2070 Max-Q | Dell Precision 5540 i9-9980HK, Quadro T2000 Max-Q | Fujitsu Celsius H780 i7-8850H, Quadro P2000 | HP ZBook Studio G5-4QH10EA i7-8750H, Quadro P1000 | Média NVIDIA Quadro RTX 5000 Max-Q | Média da turma Workstation | |
|---|---|---|---|---|---|---|---|---|---|
| Noise | 6% | 12% | -4% | 10% | -6% | 5% | 3% | 9% | |
| desligado / ambiente * (dB) | 30.6 | 28.3 8% | 28.3 8% | 30.2 1% | 28.6 7% | 29.6 3% | 28.6 7% | 27.5 ? 10% | 24.1 ? 21% |
| Idle Minimum * (dB) | 30.6 | 28.8 6% | 28.3 8% | 32.8 -7% | 28.6 7% | 29.6 3% | 28.6 7% | 28.7 ? 6% | 24.8 ? 19% |
| Idle Average * (dB) | 30.6 | 28.8 6% | 28.3 8% | 32.8 -7% | 28.6 7% | 32.2 -5% | 28.6 7% | 28.7 ? 6% | 25.4 ? 17% |
| Idle Maximum * (dB) | 30.6 | 29 5% | 28.3 8% | 33.6 -10% | 28.6 7% | 37 -21% | 30 2% | 28.7 ? 6% | 26.7 ? 13% |
| Load Average * (dB) | 43 | 33.5 22% | 29.8 31% | 40.9 5% | 33.3 23% | 40.3 6% | 38.1 11% | 41 ? 5% | 39.2 ? 9% |
| Load Maximum * (dB) | 41 | 45.2 -10% | 38.3 7% | 42.7 -4% | 38 7% | 49.4 -20% | 42.5 -4% | 46.7 ? -14% | 50.4 ? -23% |
| Witcher 3 ultra * (dB) | 45 | 38.3 | 34.7 | 35 |
* ... menor é melhor
(-) A temperatura máxima no lado superior é 46.1 °C / 115 F, em comparação com a média de 38.2 °C / 101 F , variando de 22.2 a 69.8 °C para a classe Workstation.
(-) A parte inferior aquece até um máximo de 45.2 °C / 113 F, em comparação com a média de 41.1 °C / 106 F
(+) Em uso inativo, a temperatura média para o lado superior é 27.9 °C / 82 F, em comparação com a média do dispositivo de 32 °C / ### class_avg_f### F.
(+) Os apoios para as mãos e o touchpad estão atingindo a temperatura máxima da pele (35.7 °C / 96.3 F) e, portanto, não estão quentes.
(-) A temperatura média da área do apoio para as mãos de dispositivos semelhantes foi 27.8 °C / 82 F (-7.9 °C / -14.3 F).
| Razer Blade 15 Studio Edition i7-9750H, Quadro RTX 5000 Max-Q | Razer Blade 15 RTX 2080 Max-Q i7-9750H, GeForce RTX 2080 Max-Q | Lenovo ThinkPad P53-20QN000YGE i7-9850H, Quadro RTX 5000 Max-Q | MSI P65 Creator 9SF-657 i9-9880H, GeForce RTX 2070 Max-Q | Dell Precision 5540 i9-9980HK, Quadro T2000 Max-Q | Fujitsu Celsius H780 i7-8850H, Quadro P2000 | HP ZBook Studio G5-4QH10EA i7-8750H, Quadro P1000 | Média NVIDIA Quadro RTX 5000 Max-Q | Média da turma Workstation | |
|---|---|---|---|---|---|---|---|---|---|
| Heat | -4% | 13% | -10% | 3% | 8% | 12% | -7% | -2% | |
| Maximum Upper Side * (°C) | 46.1 | 47 -2% | 41.8 9% | 49.7 -8% | 46.2 -0% | 43.7 5% | 42.3 8% | 49.4 ? -7% | 43.8 ? 5% |
| Maximum Bottom * (°C) | 45.2 | 49.2 -9% | 46.1 -2% | 60.4 -34% | 45.7 -1% | 45.3 -0% | 43.1 5% | 53 ? -17% | 45 ? -0% |
| Idle Upper Side * (°C) | 28.9 | 28.6 1% | 22.2 23% | 28.4 2% | 27.4 5% | 25.2 13% | 24.2 16% | 28.6 ? 1% | 30.6 ? -6% |
| Idle Bottom * (°C) | 29.6 | 31.4 -6% | 23 22% | 29.2 1% | 27.8 6% | 25.9 13% | 24.7 17% | 30.5 ? -3% | 31.6 ? -7% |
* ... menor é melhor
Razer Blade 15 Studio Edition análise de áudio
(-) | alto-falantes não muito altos (###valor### dB)
Graves 100 - 315Hz
(-) | quase nenhum baixo - em média 16.4% menor que a mediana
(±) | a linearidade dos graves é média (12.1% delta para a frequência anterior)
Médios 400 - 2.000 Hz
(±) | médios mais altos - em média 5.9% maior que a mediana
(+) | médios são lineares (6.9% delta para frequência anterior)
Altos 2 - 16 kHz
(+) | agudos equilibrados - apenas 1.9% longe da mediana
(+) | os máximos são lineares (5.6% delta da frequência anterior)
Geral 100 - 16.000 Hz
(±) | a linearidade do som geral é média (22.3% diferença em relação à mediana)
Comparado com a mesma classe
» 82% de todos os dispositivos testados nesta classe foram melhores, 2% semelhantes, 16% piores
» O melhor teve um delta de 7%, a média foi 17%, o pior foi 35%
Comparado com todos os dispositivos testados
» 65% de todos os dispositivos testados foram melhores, 6% semelhantes, 29% piores
» O melhor teve um delta de 4%, a média foi 24%, o pior foi 134%
Lenovo ThinkPad P53-20QN000YGE análise de áudio
(±) | o volume do alto-falante é médio, mas bom (###valor### dB)
Graves 100 - 315Hz
(±) | graves reduzidos - em média 11.6% menor que a mediana
(±) | a linearidade dos graves é média (13.6% delta para a frequência anterior)
Médios 400 - 2.000 Hz
(±) | médios mais altos - em média 7.8% maior que a mediana
(±) | a linearidade dos médios é média (7.5% delta para frequência anterior)
Altos 2 - 16 kHz
(+) | agudos equilibrados - apenas 1.9% longe da mediana
(+) | os máximos são lineares (4.8% delta da frequência anterior)
Geral 100 - 16.000 Hz
(±) | a linearidade do som geral é média (23.1% diferença em relação à mediana)
Comparado com a mesma classe
» 83% de todos os dispositivos testados nesta classe foram melhores, 3% semelhantes, 14% piores
» O melhor teve um delta de 7%, a média foi 17%, o pior foi 35%
Comparado com todos os dispositivos testados
» 69% de todos os dispositivos testados foram melhores, 5% semelhantes, 26% piores
» O melhor teve um delta de 4%, a média foi 24%, o pior foi 134%
| desligado | |
| Ocioso | |
| Carga |
|
Key:
min: | |
| Razer Blade 15 Studio Edition i7-9750H, Quadro RTX 5000 Max-Q | Razer Blade 15 RTX 2080 Max-Q i7-9750H, GeForce RTX 2080 Max-Q | Lenovo ThinkPad P53-20QN000YGE i7-9850H, Quadro RTX 5000 Max-Q | MSI P65 Creator 9SF-657 i9-9880H, GeForce RTX 2070 Max-Q | Dell Precision 5540 i9-9980HK, Quadro T2000 Max-Q | Fujitsu Celsius H780 i7-8850H, Quadro P2000 | HP ZBook Studio G5-4QH10EA i7-8750H, Quadro P1000 | Média NVIDIA Quadro RTX 5000 Max-Q | Média da turma Workstation | |
|---|---|---|---|---|---|---|---|---|---|
| Power Consumption | -10% | 8% | -10% | 20% | 13% | 25% | -12% | 5% | |
| Idle Minimum * (Watt) | 13.2 | 12.5 5% | 7.9 40% | 9.4 29% | 7.4 44% | 9.1 31% | 6.8 48% | 10.4 ? 21% | 8.94 ? 32% |
| Idle Average * (Watt) | 15 | 15.3 -2% | 11.8 21% | 17.4 -16% | 12.1 19% | 13.2 12% | 11.3 25% | 16.1 ? -7% | 13.8 ? 8% |
| Idle Maximum * (Watt) | 17.4 | 20.7 -19% | 14.9 14% | 19.6 -13% | 12.7 27% | 14.04 19% | 14.3 18% | 23.8 ? -37% | 17.5 ? -1% |
| Load Average * (Watt) | 99 | 90.2 9% | 96 3% | 103 -4% | 98 1% | 78.8 20% | 78 21% | 109.5 ? -11% | 95 ? 4% |
| Load Maximum * (Watt) | 148 | 209.3 -41% | 207.8 -40% | 216 -46% | 135.1 9% | 172.5 -17% | 126 15% | 189.5 ? -28% | 175.2 ? -18% |
| Witcher 3 ultra * (Watt) | 162 | 149 | 89.9 | 64 |
* ... menor é melhor
| Razer Blade 15 Studio Edition i7-9750H, Quadro RTX 5000 Max-Q, 80 Wh | Razer Blade 15 RTX 2080 Max-Q i7-9750H, GeForce RTX 2080 Max-Q, 80 Wh | Lenovo ThinkPad P53-20QN000YGE i7-9850H, Quadro RTX 5000 Max-Q, 90 Wh | MSI P65 Creator 9SF-657 i9-9880H, GeForce RTX 2070 Max-Q, 82 Wh | Dell Precision 5540 i9-9980HK, Quadro T2000 Max-Q, 97 Wh | Fujitsu Celsius H780 i7-8850H, Quadro P2000, 96 Wh | HP ZBook Studio G5-4QH10EA i7-8750H, Quadro P1000, 97 Wh | Média da turma Workstation | |
|---|---|---|---|---|---|---|---|---|
| Duração da bateria | 25% | 45% | -11% | 31% | 36% | 48% | 57% | |
| Reader / Idle (h) | 9.6 | 15.9 66% | 9.6 0% | 15 56% | 17.3 80% | 26.1 ? 172% | ||
| H.264 (h) | 7.6 | 9.8 29% | 10.6 39% | 9.1 20% | 9.51 ? 25% | |||
| WiFi v1.3 (h) | 5.5 | 6.6 20% | 11.1 102% | 6 9% | 7.7 40% | 7.5 36% | 9.7 76% | 8.53 ? 55% |
| Load (h) | 1.9 | 1.7 -11% | 2 5% | 1.1 -42% | 1.7 -11% | 2.2 16% | 1.429 ? -25% |
Pro
Contra
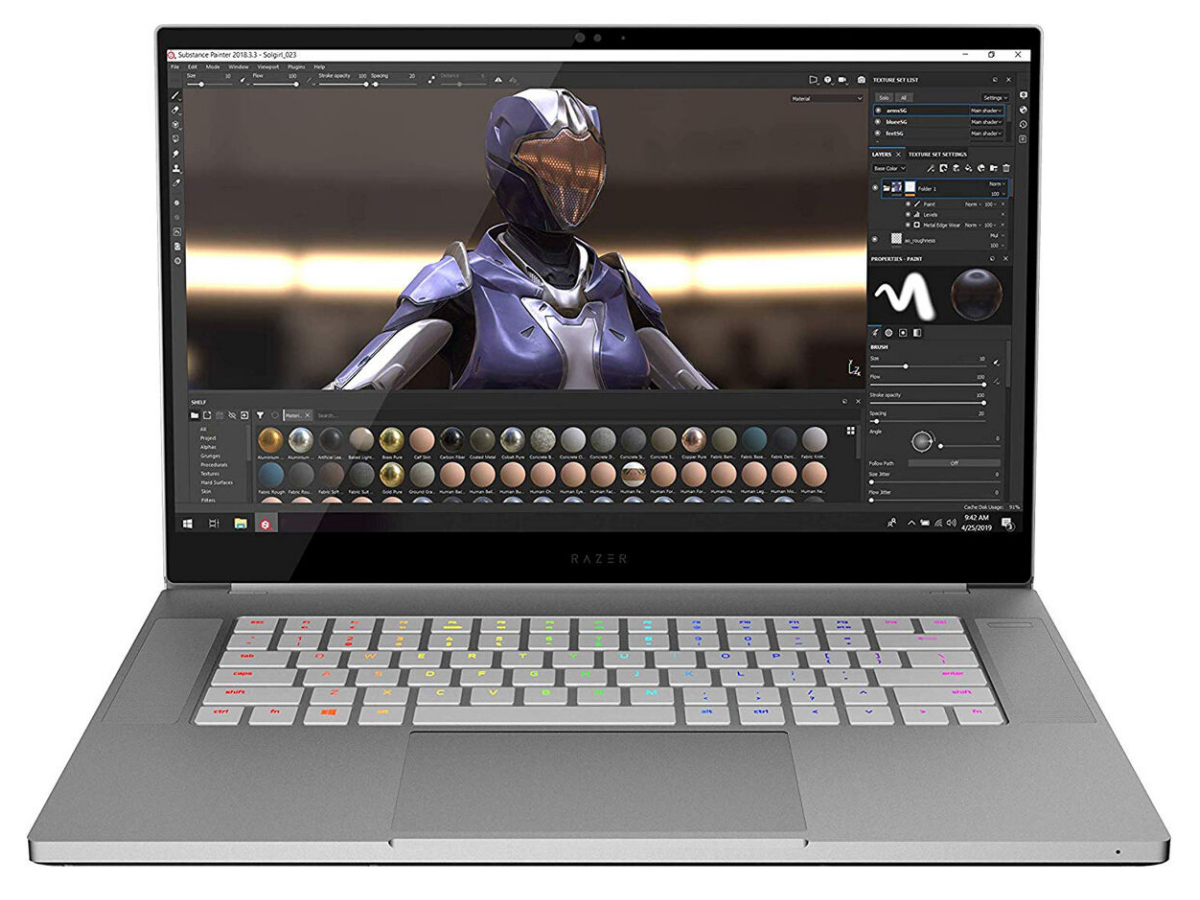
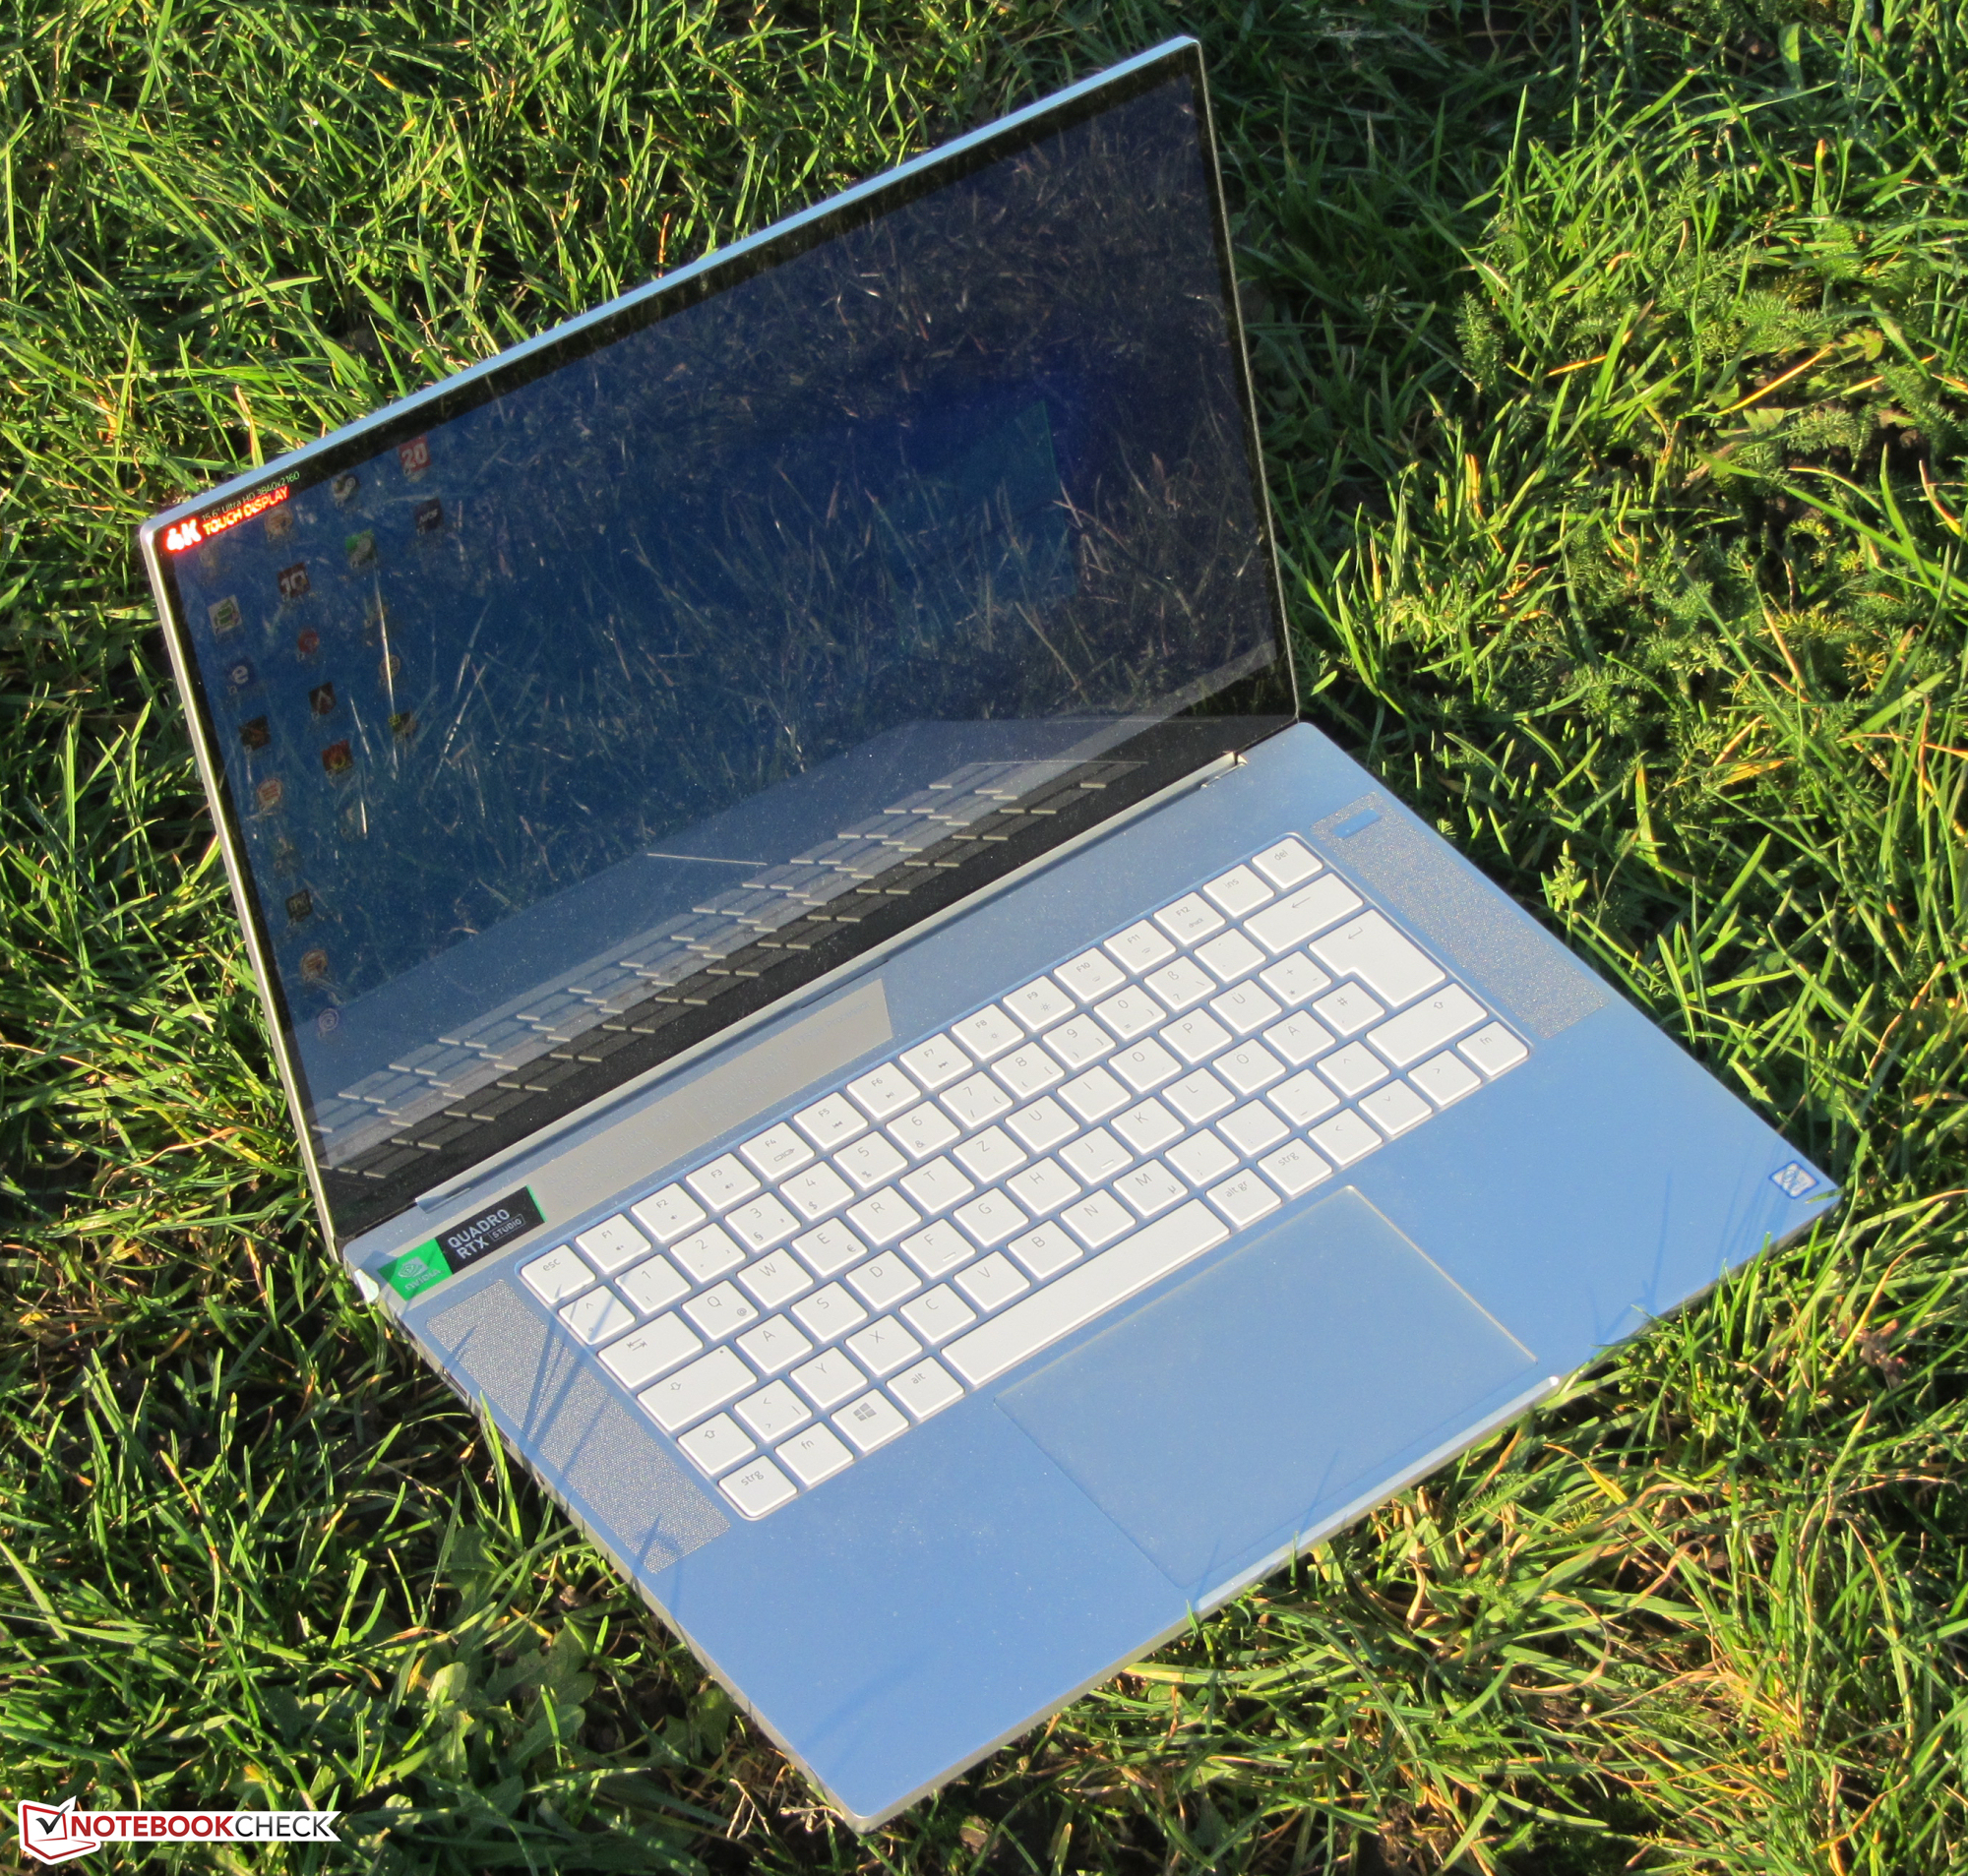
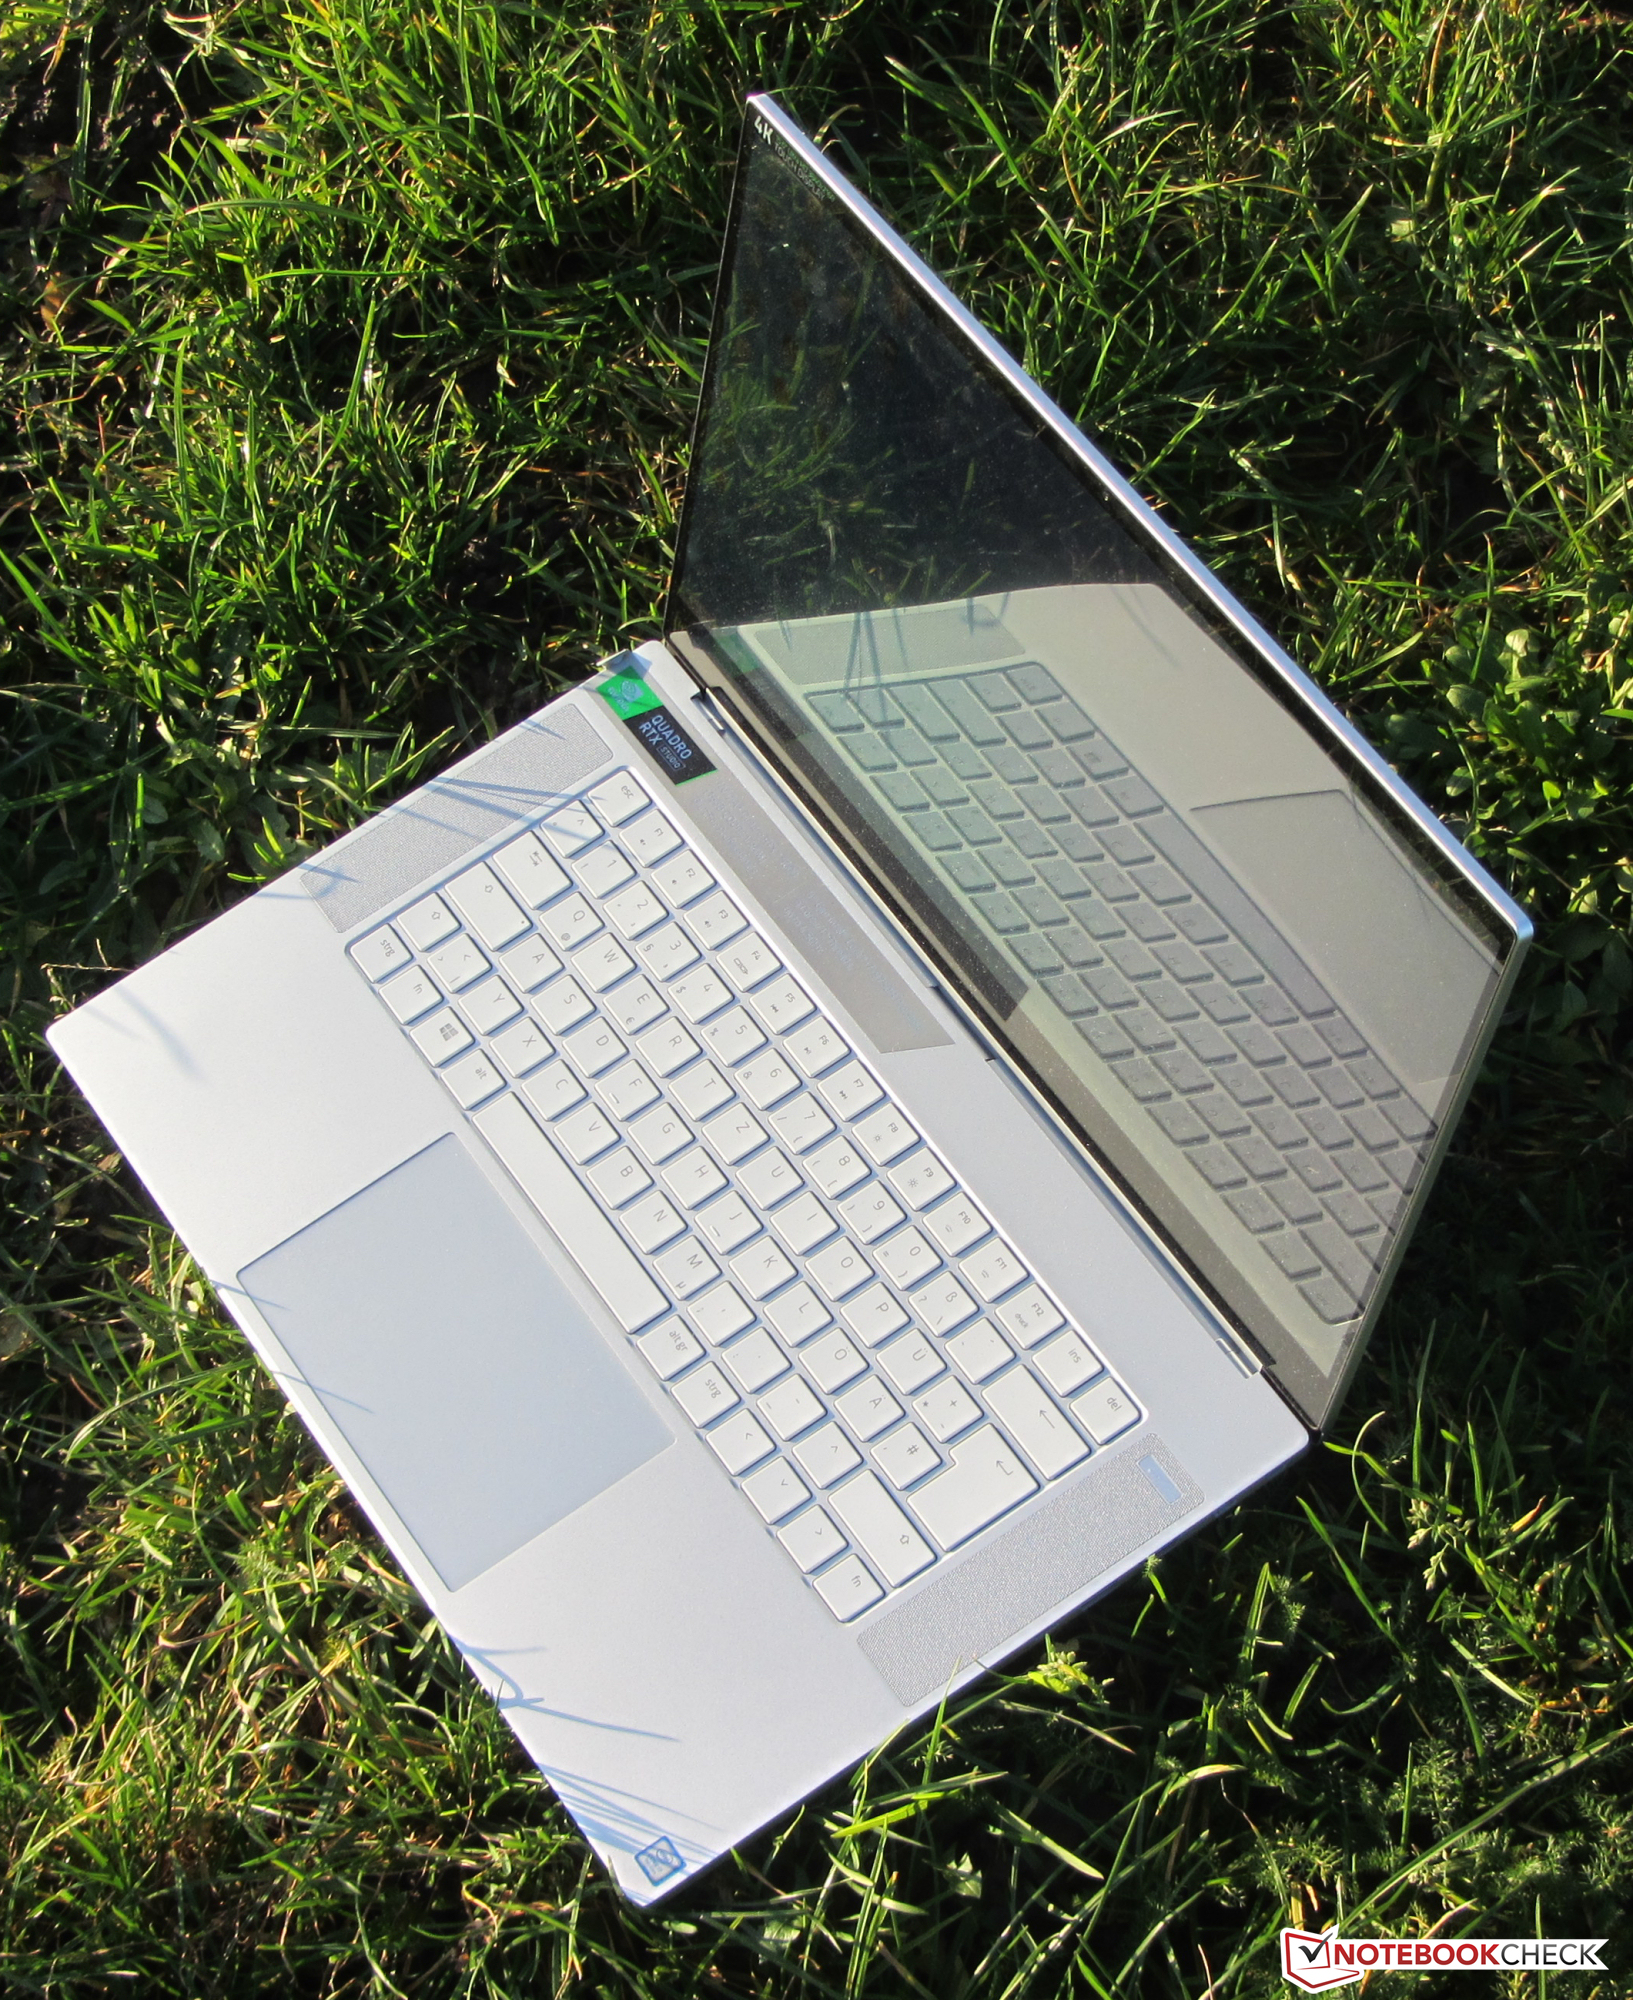
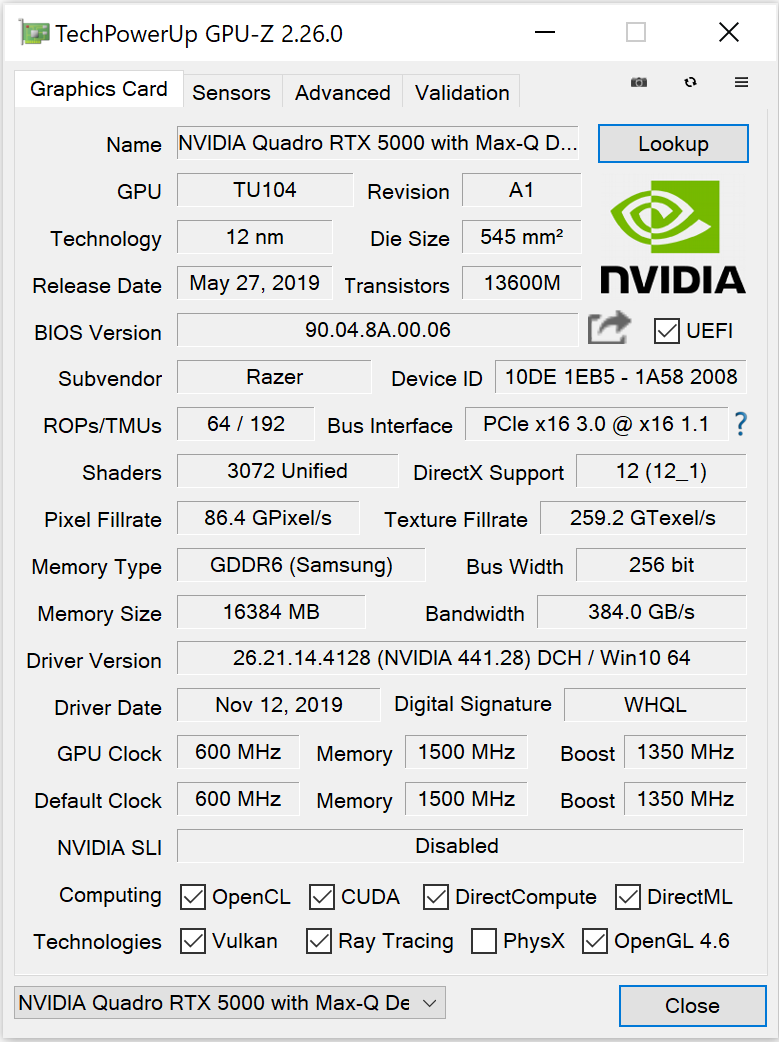
Com a Edição Studio do Blade 15, a Razer criou um workstation móvel de 15,6 polegadas. Baseia-se no Blade 15 Advanced Model que já testamos e com o qual ele compartilha seu chassi. Devido a isso, conta com a mesma construção metálica robusta.
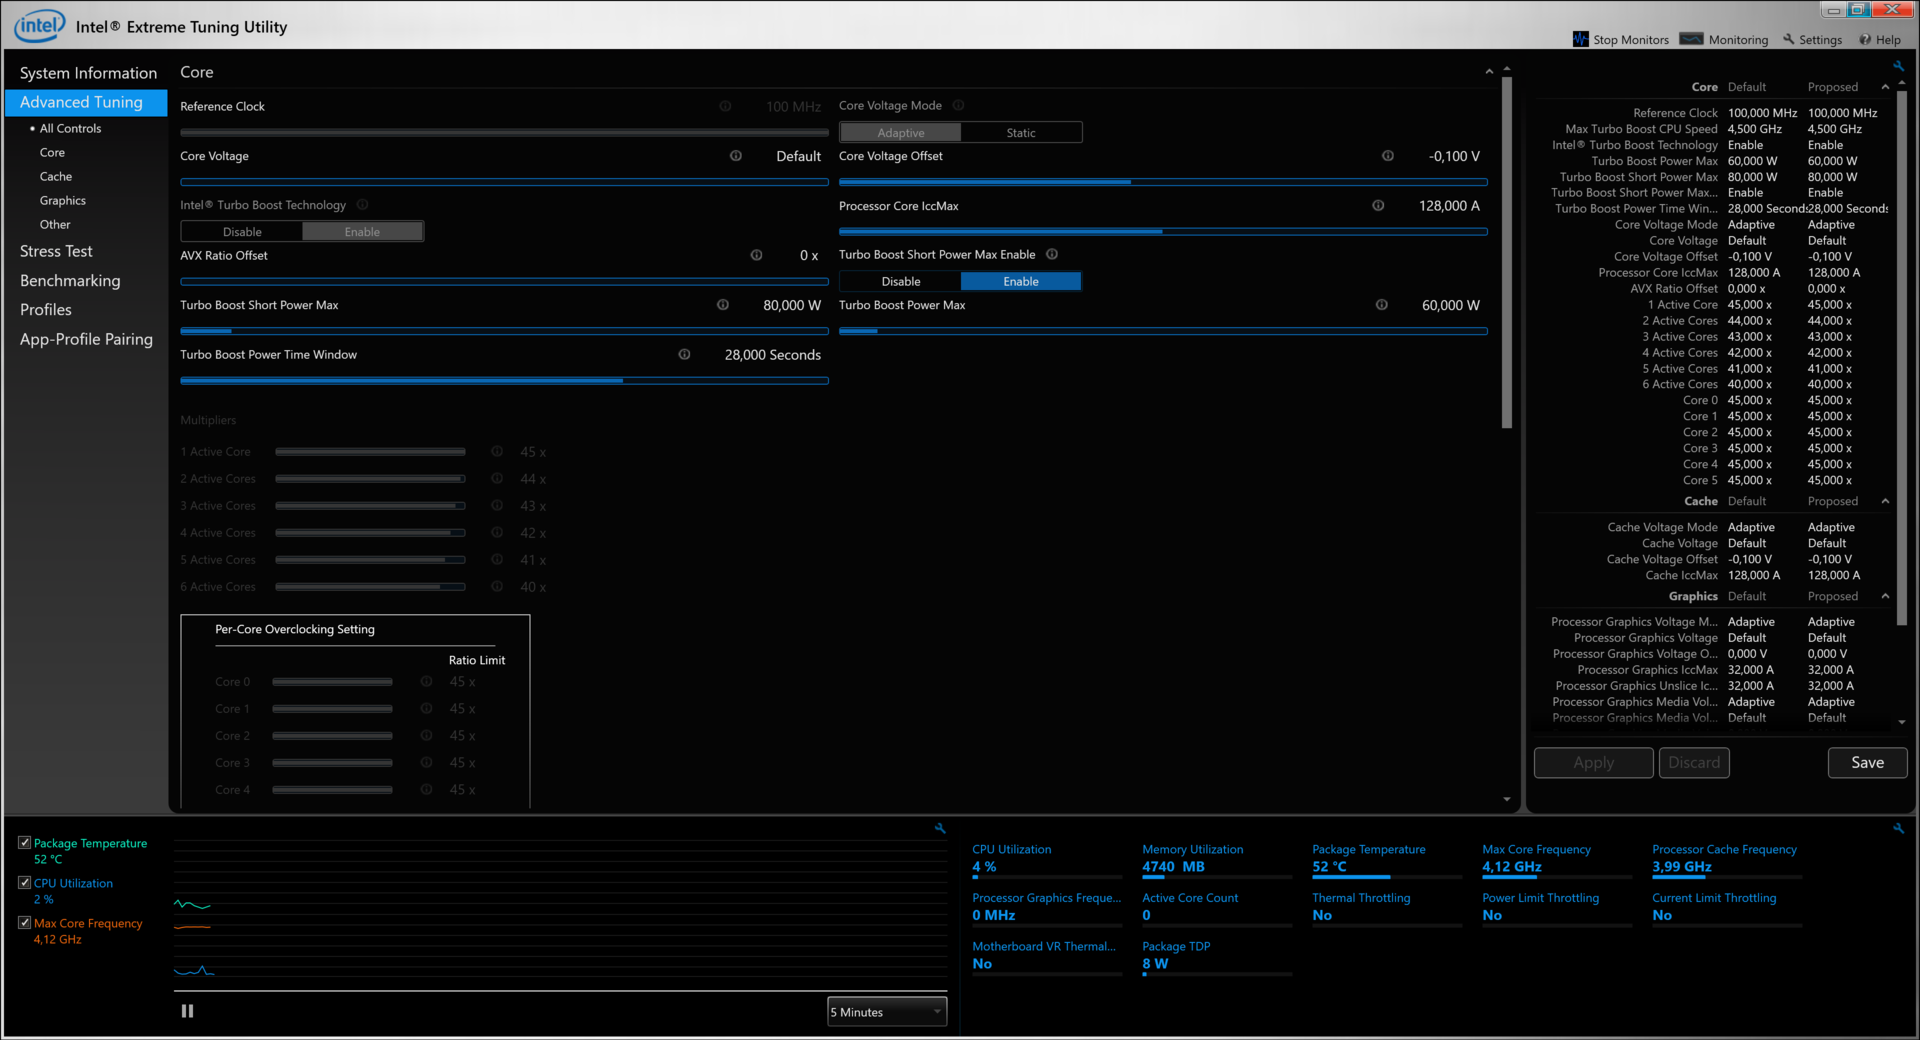
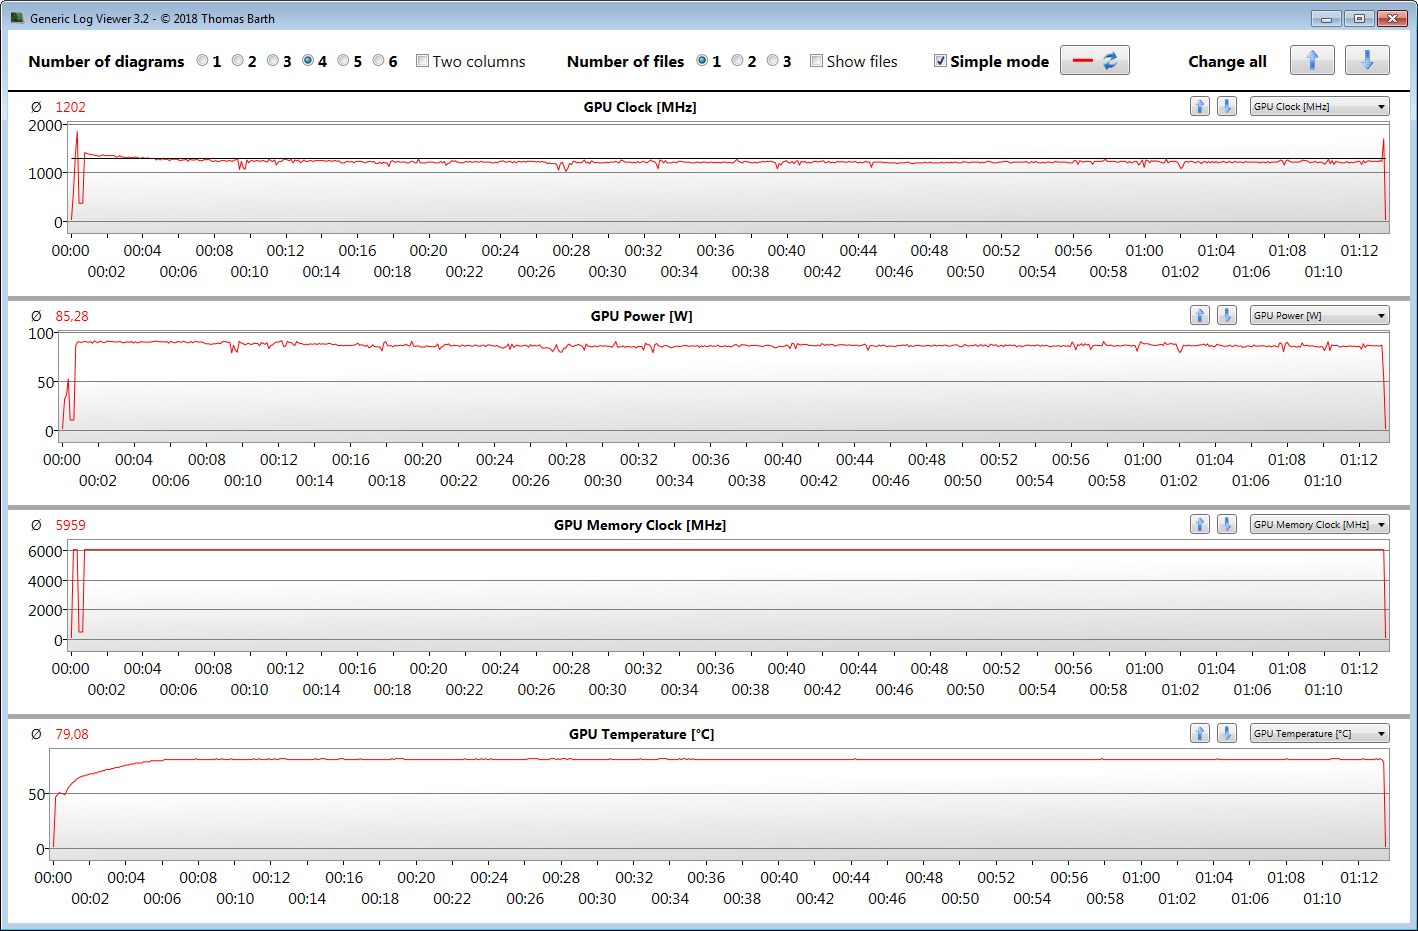
Em termos de hardware, o portátil está equipado com o processador atual Core i7-9750H e a GPU GeForce RTX 5000 Max-Q. Nas configurações padrão, os dois componentes não esgotam totalmente seus recursos. No entanto, o desempenho pleno pode ser desbloqueado no software Razer Synapse. Positivo: Apesar do hardware poderoso, os níveis de ruído e temperatura permanecem razoáveis.
O Blade 15 Studio da Razer é um workstation com excelentes recursos que consegue nos deixar com uma boa impressão geral em nossos testes.
Um SSD NVMe garante um sistema fluente e responsivo e também fornece aos usuários muito espaço de armazenamento. No entanto, não há espaço para unidades de armazenamento adicionais dentro do portátil. Se for necessário mais espaço de armazenamento, precisará trocar o SSD instalado.
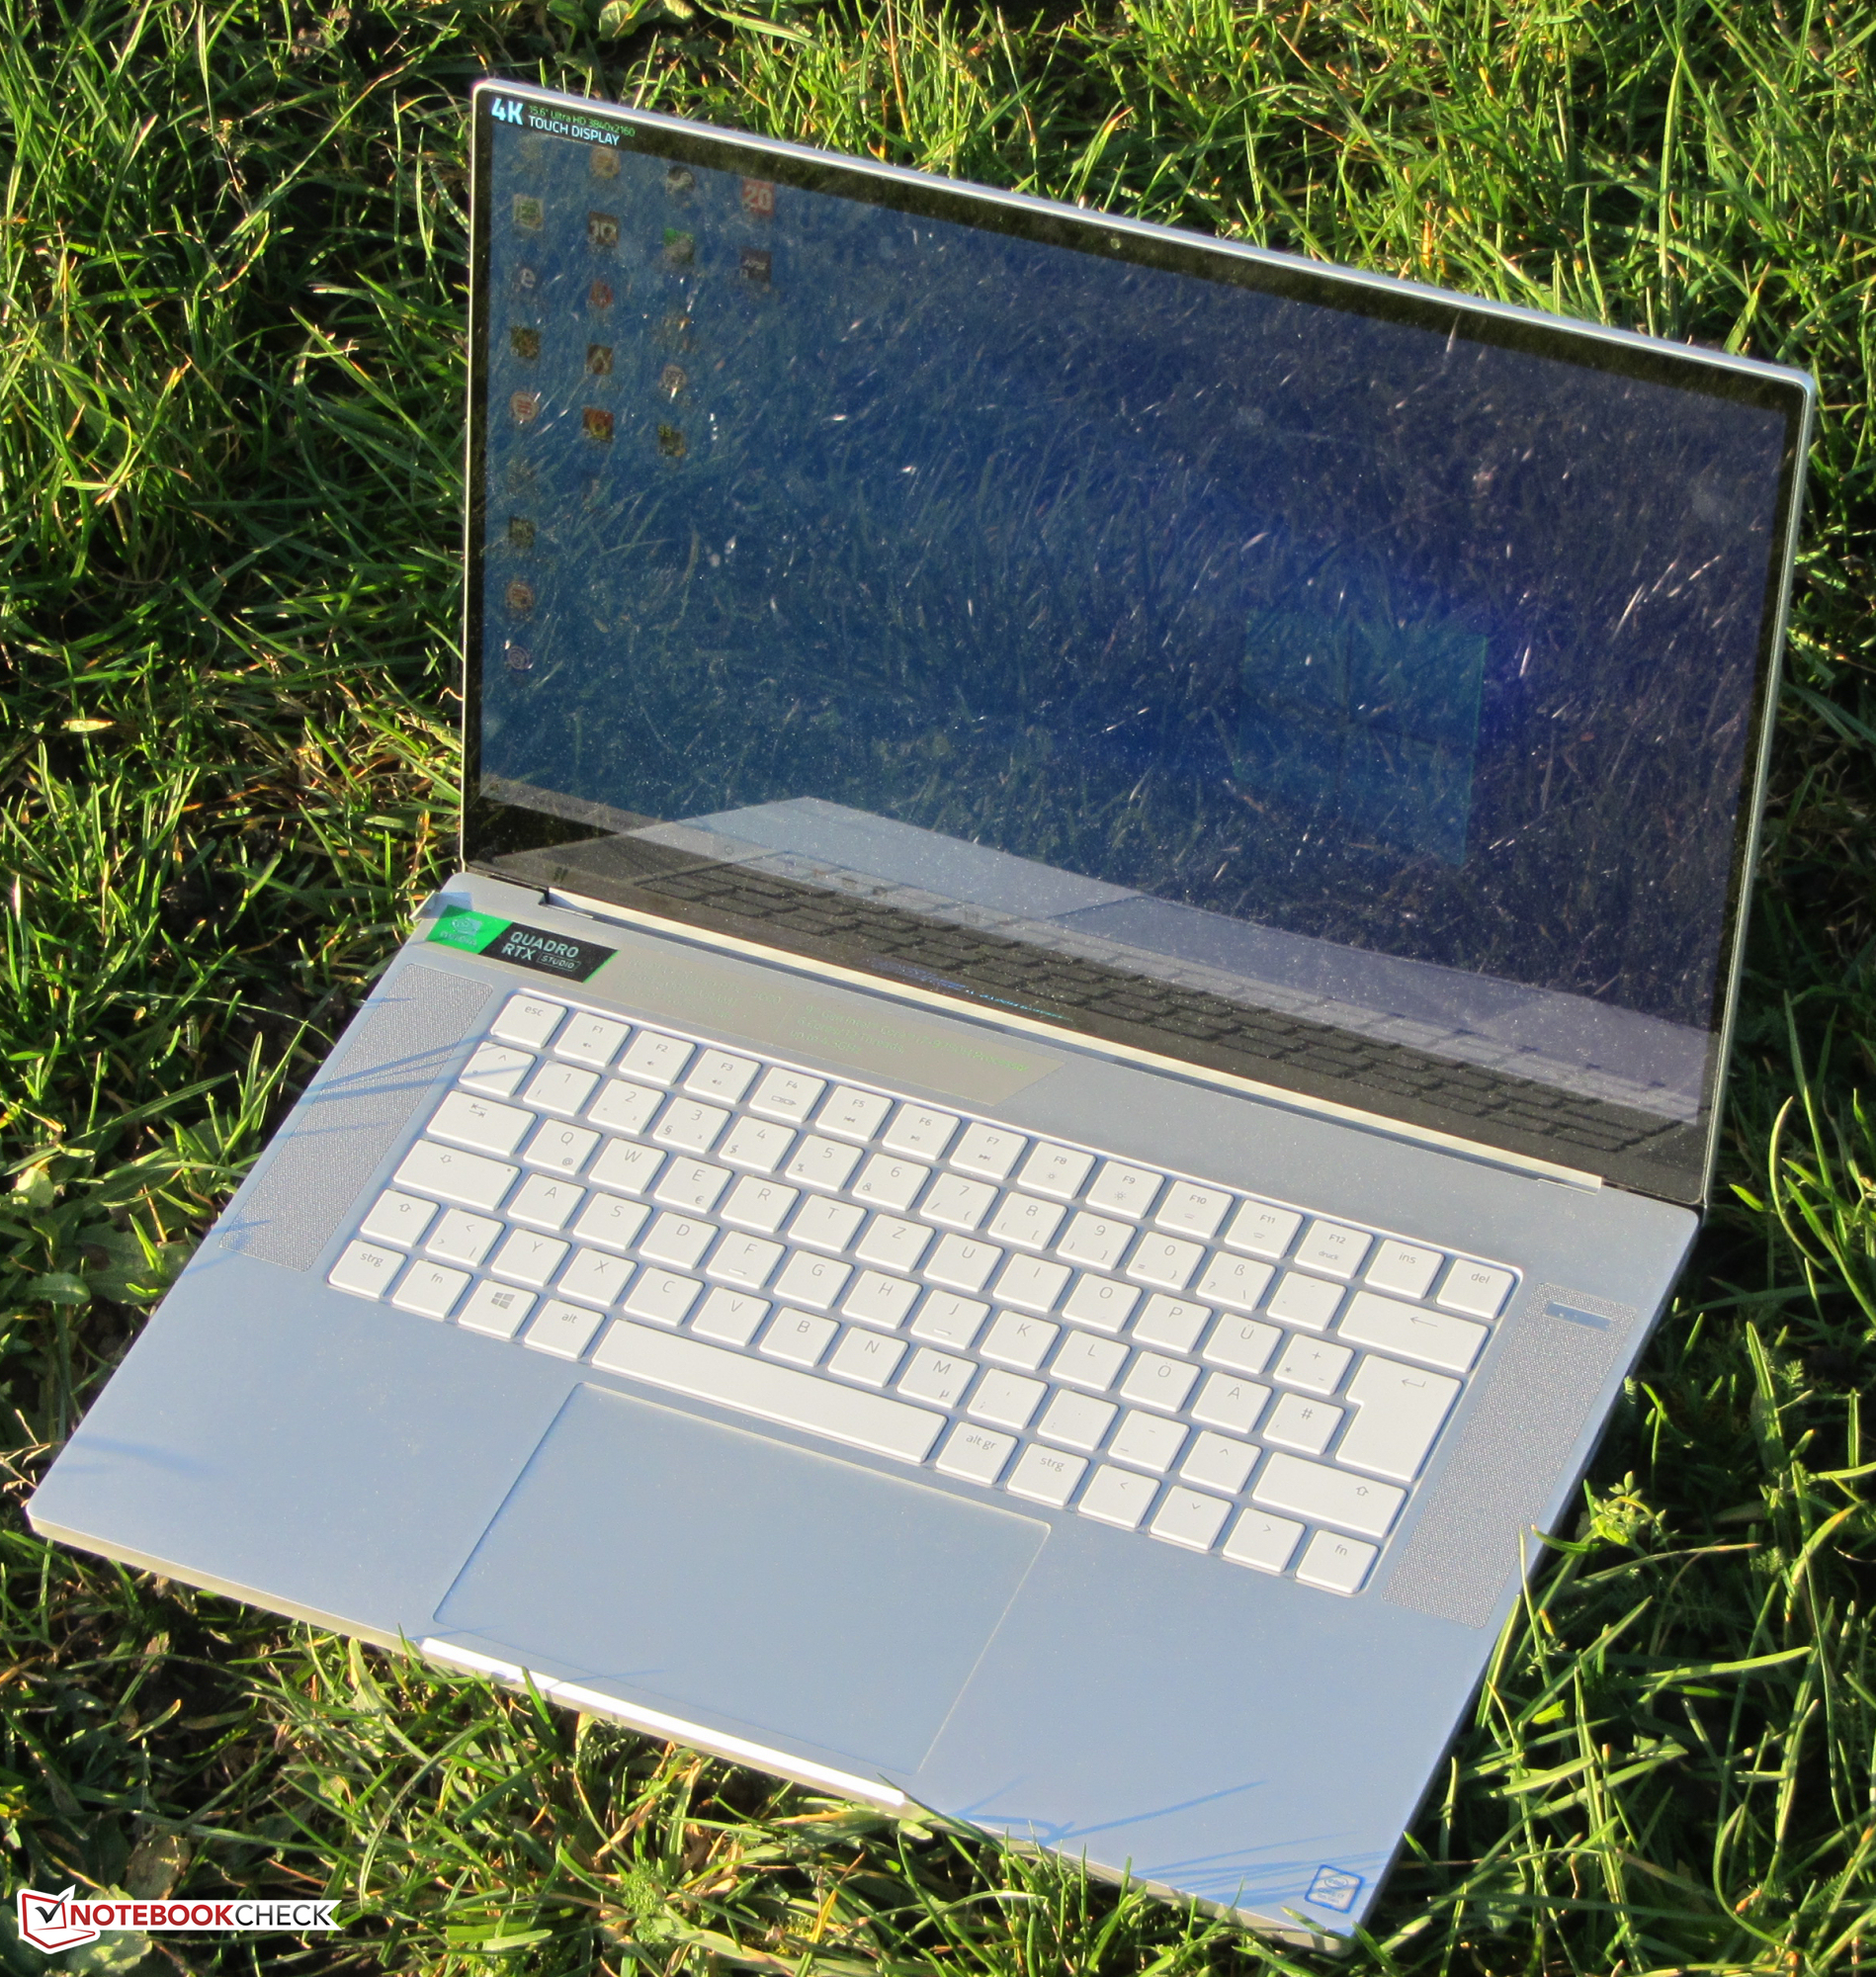
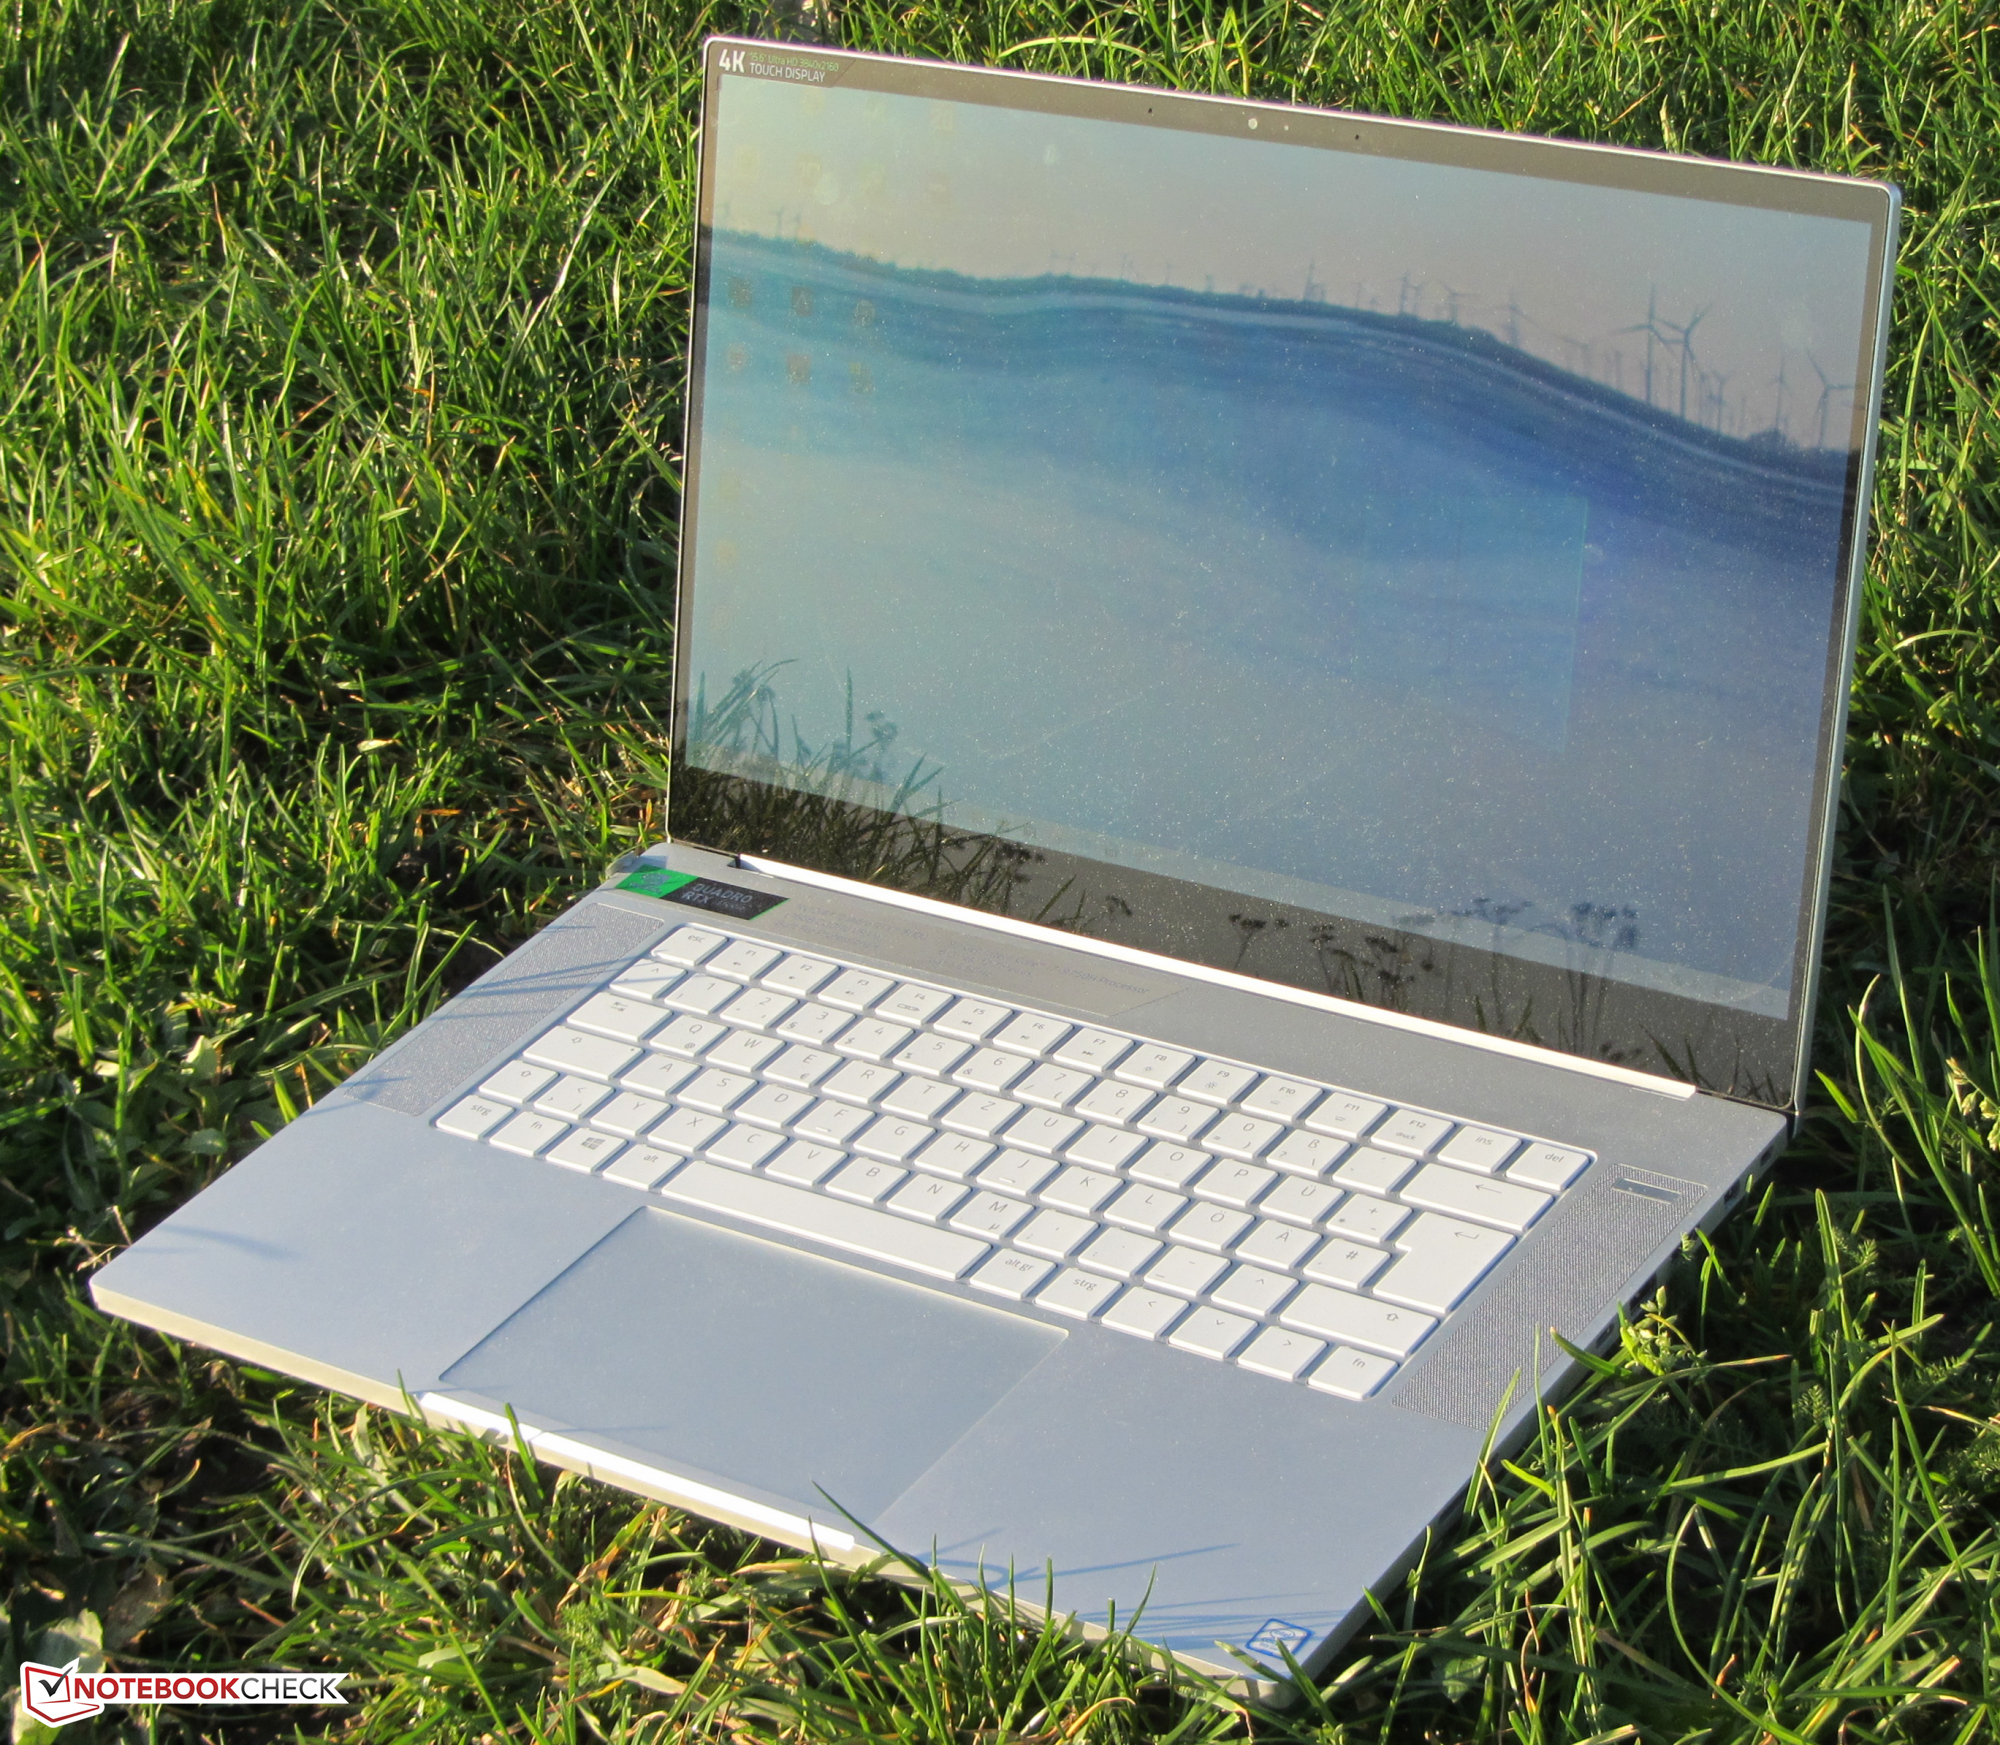
A tela táctil OLED 4K é a característica mais notável do portátil. Seu excelente valor de preto, o alto nível de brilho, bons ângulos de visão, tempos de resposta rápidos e boa cobertura do espaço de cores culminam em uma experiência visual impressionante. A representação de cores poderia ser um pouco melhor.
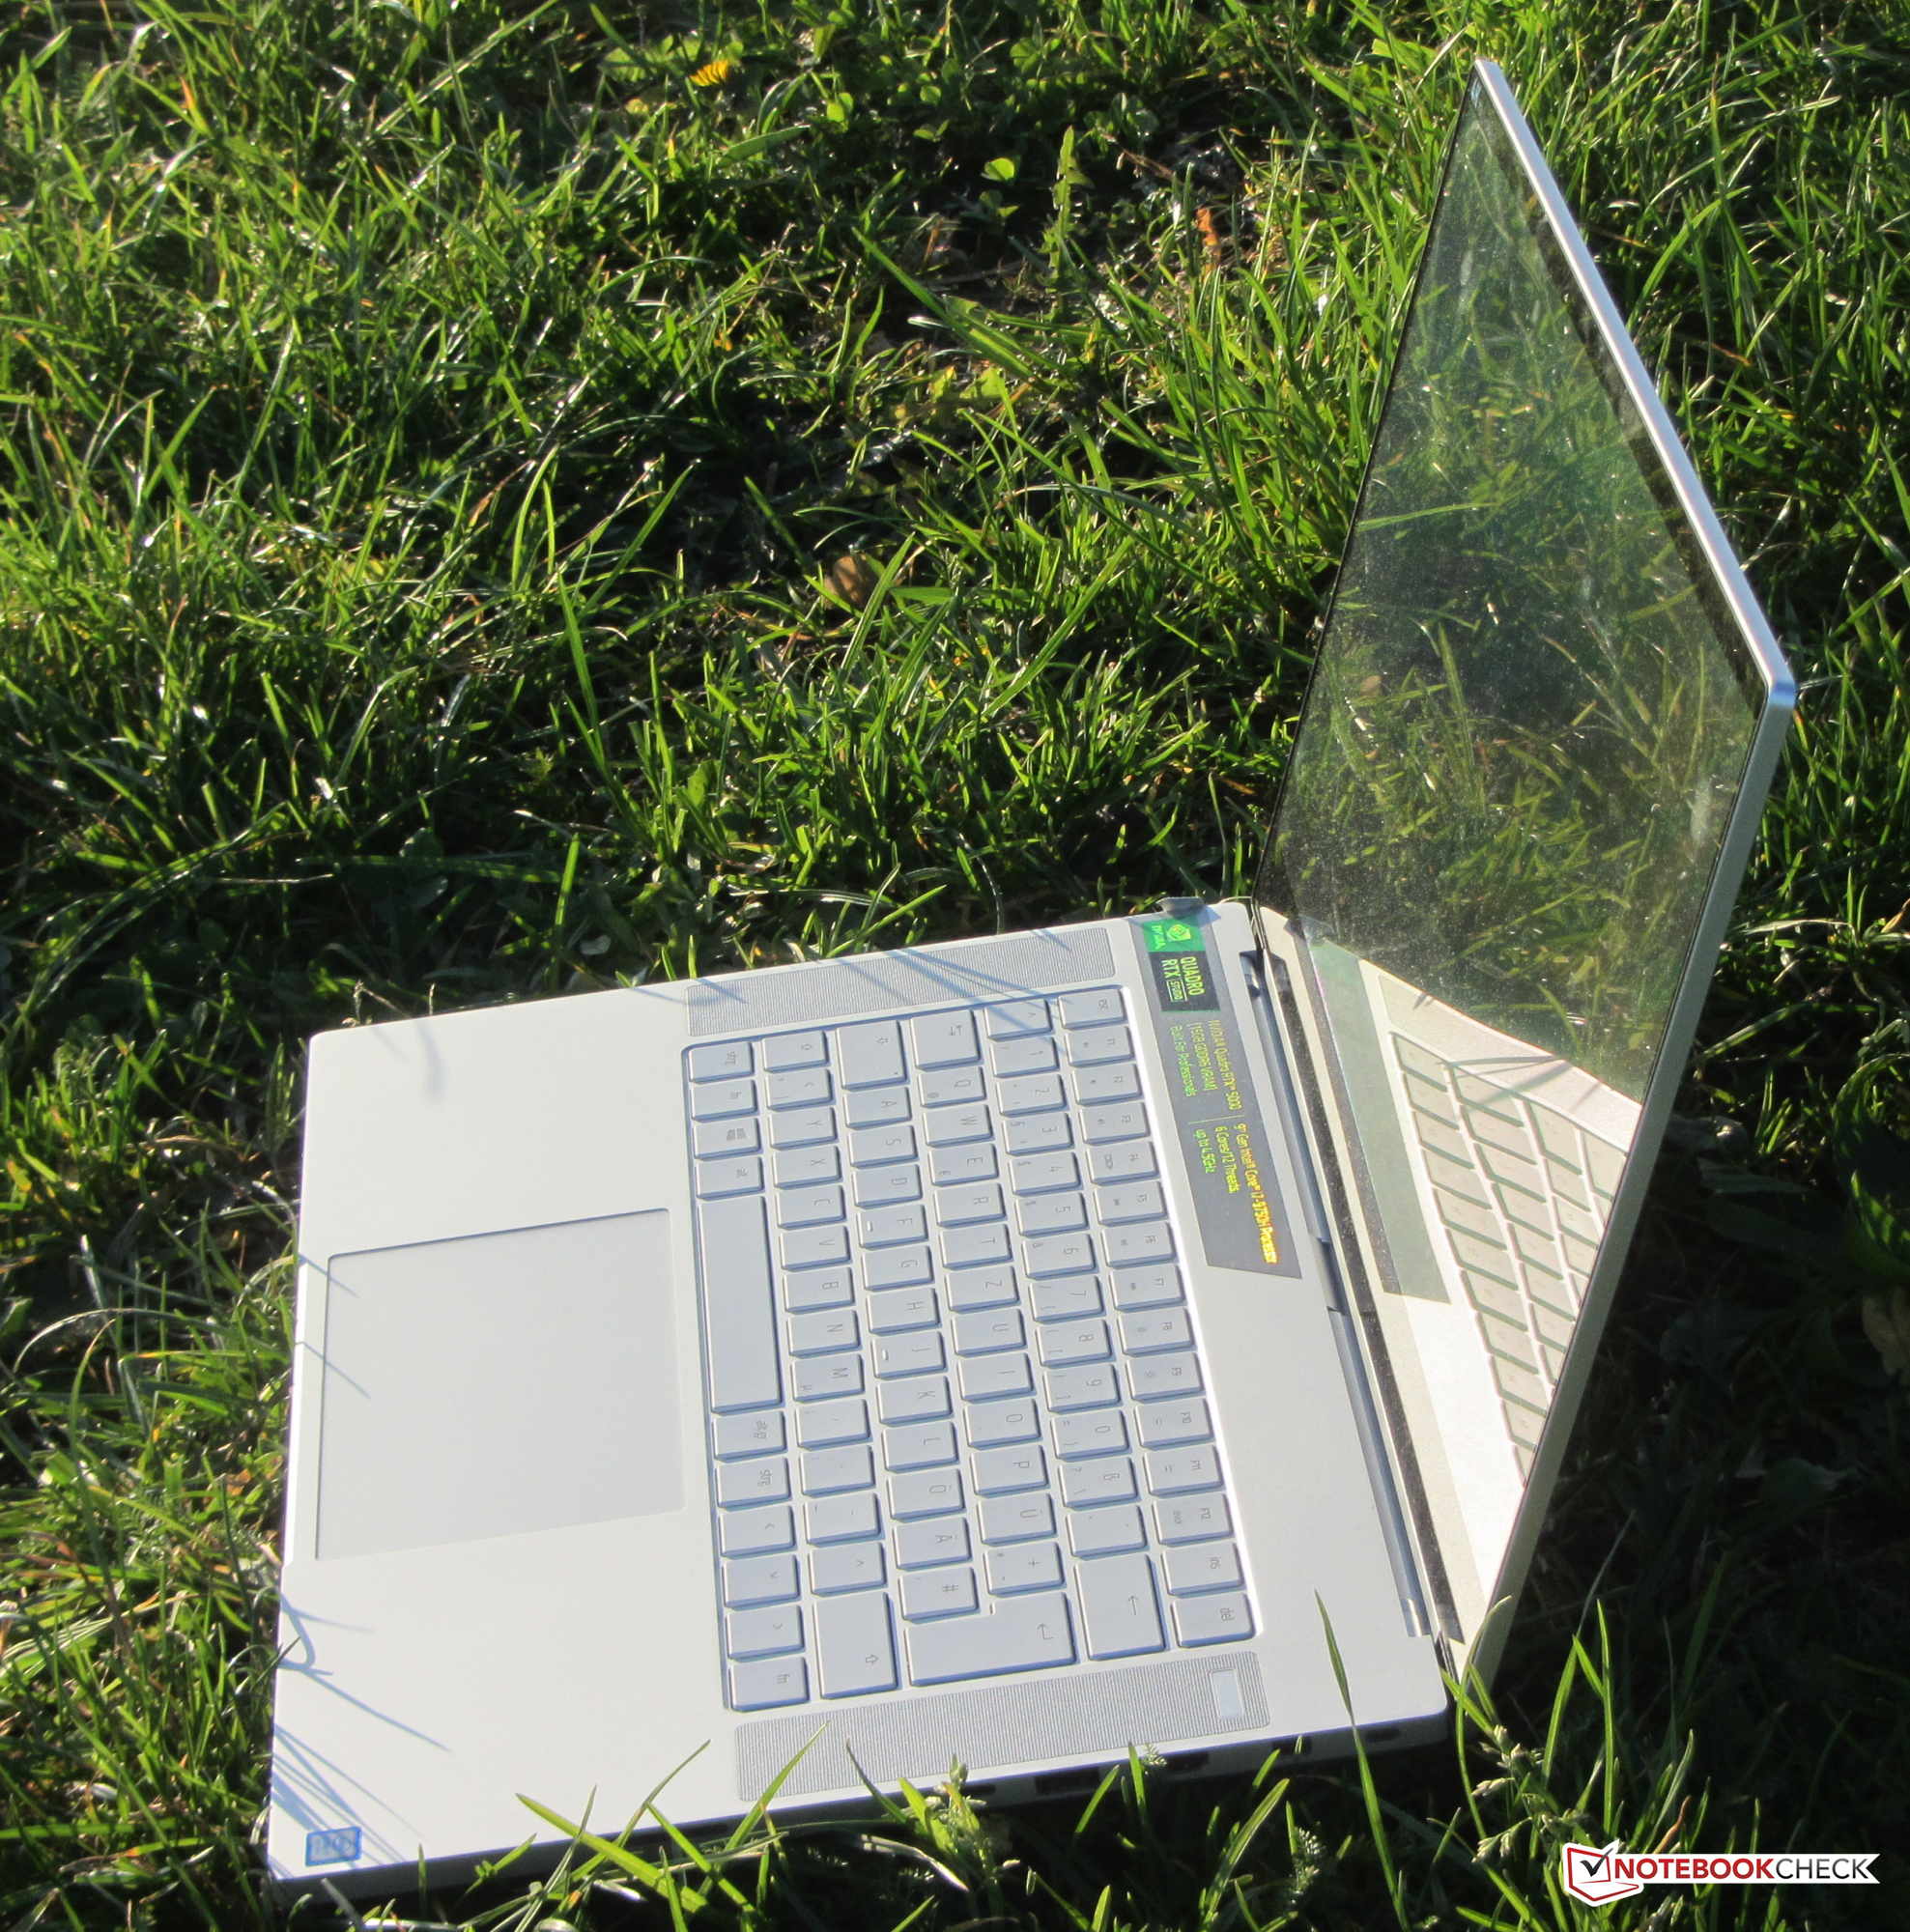
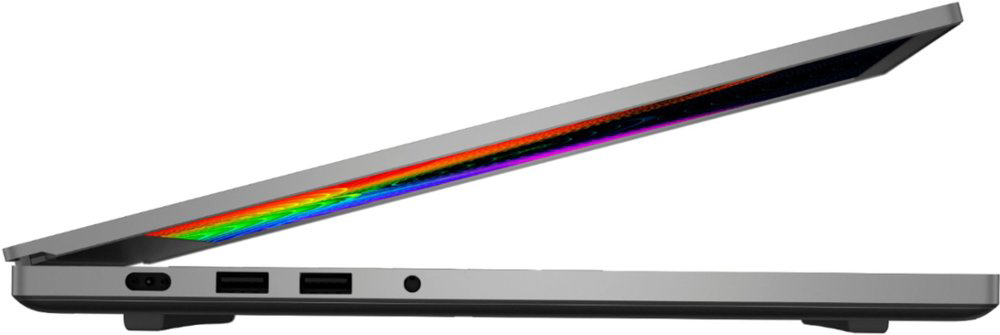
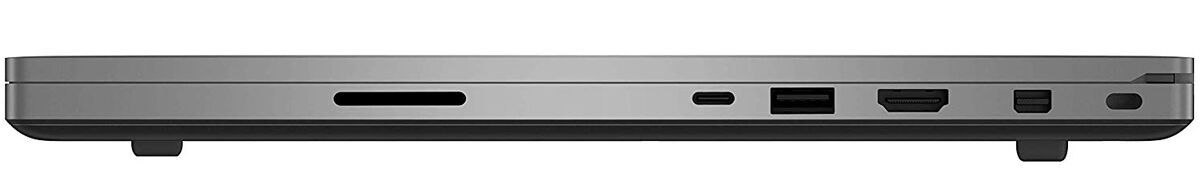
O teclado retro iluminado mostrou ser adequado para uso diário. No entanto, não é adequado para datilógrafos. Além disso, a duração da bateria é boa. Por fim, a porta Thunderbolt 3 permite que os usuários conectem estações docking ou uma GPU externa.
Razer Blade 15 Studio Edition
- 12/02/2019 v7 (old)
Sascha Mölck
Price comparison
