Breve Análise do Lenovo ThinkPad P53: Workstation clássico com muito desempenho da GPU
Avaliação | Data | Modelo | Peso | Altura | Size | Resolução | Preço |
|---|---|---|---|---|---|---|---|
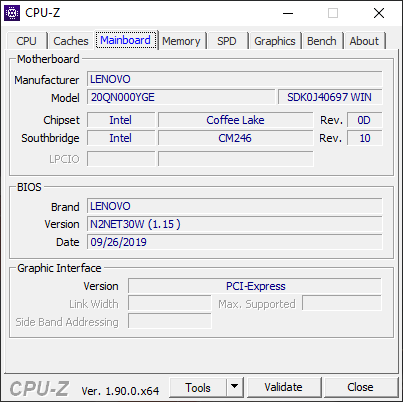
| 89.8 % v7 (old) | 11/2019 | Lenovo ThinkPad P53-20QN000YGE i7-9850H, Quadro RTX 5000 Max-Q | 2.7 kg | 29.4 mm | 15.60" | 1920x1080 | |
| 87.8 % v7 (old) | 08/2019 | Lenovo ThinkPad P1 2019-20QT000RGE i7-9850H, Quadro T1000 (Laptop) | 1.7 kg | 18.4 mm | 15.60" | 1920x1080 | |
| 86.9 % v7 (old) | 11/2018 | Dell Precision 7530 i9-8950HK, Quadro P3200 | 2.6 kg | 29.95 mm | 15.60" | 3840x2160 | |
| 85.6 % v6 (old) | Fujitsu Celsius H780 i7-8850H, Quadro P2000 | 2.8 kg | 31.9 mm | 15.60" | 1920x1080 | ||
| 85 % v7 (old) | 06/2019 | MSI P65 Creator 9SF-657 i9-9880H, GeForce RTX 2070 Max-Q | 1.9 kg | 18 mm | 15.60" | 3840x2160 |

| SD Card Reader | |
| average JPG Copy Test (av. of 3 runs) | |
| Dell Precision 7530 (Toshiba Exceria Pro SDXC 64 GB UHS-II) | |
| Lenovo ThinkPad P53-20QN000YGE (Toshiba Exceria Pro SDXC 64 GB UHS-II) | |
| Lenovo ThinkPad P1 2019-20QT000RGE (Toshiba Exceria Pro SDXC 64 GB UHS-II) | |
| Lenovo ThinkPad P52 20MAS03N00 (Toshiba Exceria Pro SDXC 64 GB UHS-II) | |
| Fujitsu Celsius H780 (Toshiba Exceria Pro SDXC 64 GB UHS-II) | |
| Média da turma Workstation (49.6 - 681, n=14, últimos 2 anos) | |
| maximum AS SSD Seq Read Test (1GB) | |
| Média da turma Workstation (87.6 - 1455, n=14, últimos 2 anos) | |
| Lenovo ThinkPad P53-20QN000YGE (Toshiba Exceria Pro SDXC 64 GB UHS-II) | |
| Lenovo ThinkPad P1 2019-20QT000RGE (Toshiba Exceria Pro SDXC 64 GB UHS-II) | |
| Dell Precision 7530 (Toshiba Exceria Pro SDXC 64 GB UHS-II) | |
| Lenovo ThinkPad P52 20MAS03N00 (Toshiba Exceria Pro SDXC 64 GB UHS-II) | |
| Fujitsu Celsius H780 (Toshiba Exceria Pro SDXC 64 GB UHS-II) | |
| Networking | |
| iperf3 transmit AX12 | |
| Lenovo ThinkPad P53-20QN000YGE | |
| Lenovo ThinkPad P53-20QN000YGE | |
| Lenovo ThinkPad P1 2019-20QT000RGE | |
| Dell Precision 7530 | |
| Lenovo ThinkPad P52 20MAS03N00 | |
| Fujitsu Celsius H780 | |
| MSI P65 Creator 9SF-657 | |
| iperf3 receive AX12 | |
| Lenovo ThinkPad P53-20QN000YGE | |
| Lenovo ThinkPad P53-20QN000YGE | |
| Dell Precision 7530 | |
| Fujitsu Celsius H780 | |
| Lenovo ThinkPad P52 20MAS03N00 | |
| Lenovo ThinkPad P1 2019-20QT000RGE | |
| MSI P65 Creator 9SF-657 | |
| |||||||||||||||||||||||||
iluminação: 89 %
iluminação com acumulador: 490 cd/m²
Contraste: 1417:1 (Preto: 0.36 cd/m²)
ΔE ColorChecker Calman: 2.3 | ∀{0.5-29.43 Ø4.72}
calibrated: 1.2
ΔE Greyscale Calman: 3.2 | ∀{0.09-98 Ø4.97}
93.1% sRGB (Argyll 1.6.3 3D)
59.4% AdobeRGB 1998 (Argyll 1.6.3 3D)
64.3% AdobeRGB 1998 (Argyll 3D)
92.9% sRGB (Argyll 3D)
63.2% Display P3 (Argyll 3D)
Gamma: 2.34
CCT: 7036 K
| Lenovo ThinkPad P53-20QN000YGE N156HCE-GN1, IPS, 1920x1080, 15.6" | Lenovo ThinkPad P52 20MAS03N00 N156HCE-EN1, IPS LED, 1920x1080, 15.6" | Lenovo ThinkPad P1 2019-20QT000RGE N156HCE-GN1, IPS LED, 1920x1080, 15.6" | Dell Precision 7530 Sharp LQ156D1, IPS, 3840x2160, 15.6" | Fujitsu Celsius H780 LP156WF6-SPP1, IPS LED, 1920x1080, 15.6" | MSI P65 Creator 9SF-657 AU Optronics AUO41EB, IPS, 3840x2160, 15.6" | |
|---|---|---|---|---|---|---|
| Display | 1% | -1% | 29% | -2% | 32% | |
| Display P3 Coverage (%) | 63.2 | 65.6 4% | 62.4 -1% | 82.5 31% | 66.3 5% | 84.4 34% |
| sRGB Coverage (%) | 92.9 | 90.3 -3% | 91.5 -2% | 99.4 7% | 85.9 -8% | 100 8% |
| AdobeRGB 1998 Coverage (%) | 64.3 | 65.9 2% | 63.4 -1% | 96.2 50% | 62.8 -2% | 98.5 53% |
| Response Times | -3% | 27% | 2% | -3% | -28% | |
| Response Time Grey 50% / Grey 80% * (ms) | 38.4 ? | 39.2 ? -2% | 34.4 ? 10% | 35.2 ? 8% | 38 ? 1% | 51 ? -33% |
| Response Time Black / White * (ms) | 25.2 ? | 26 ? -3% | 14 ? 44% | 26.4 ? -5% | 26.8 ? -6% | 31 ? -23% |
| PWM Frequency (Hz) | 26040 ? | 25250 ? | 26040 ? | 198.4 ? | 20830 ? | |
| Screen | -34% | -15% | -31% | -36% | -23% | |
| Brightness middle (cd/m²) | 510 | 304 -40% | 542 6% | 292.8 -43% | 271 -47% | 445 -13% |
| Brightness (cd/m²) | 468 | 293 -37% | 528 13% | 295 -37% | 260 -44% | 462 -1% |
| Brightness Distribution (%) | 89 | 88 -1% | 84 -6% | 85 -4% | 86 -3% | 83 -7% |
| Black Level * (cd/m²) | 0.36 | 0.26 28% | 0.41 -14% | 0.36 -0% | 0.29 19% | 0.5 -39% |
| Contrast (:1) | 1417 | 1169 -18% | 1322 -7% | 813 -43% | 934 -34% | 890 -37% |
| Colorchecker dE 2000 * | 2.3 | 4.5 -96% | 3.5 -52% | 3.48 -51% | 3.9 -70% | 4.75 -107% |
| Colorchecker dE 2000 max. * | 5.5 | 7.7 -40% | 7.8 -42% | 6.81 -24% | 10.2 -85% | 7.79 -42% |
| Colorchecker dE 2000 calibrated * | 1.2 | 2.4 -100% | 1.3 -8% | 3.13 -161% | 2.9 -142% | |
| Greyscale dE 2000 * | 3.2 | 5.2 -63% | 4.8 -50% | 4.1 -28% | 2.6 19% | 4.49 -40% |
| Gamma | 2.34 94% | 2.26 97% | 2.33 94% | 2.2 100% | 2.29 96% | 2.49 88% |
| CCT | 7036 92% | 6789 96% | 7690 85% | 6740 96% | 6517 100% | 7374 88% |
| Color Space (Percent of AdobeRGB 1998) (%) | 59.4 | 53.8 -9% | 58.8 -1% | 84.4 42% | 56.1 -6% | 87 46% |
| Color Space (Percent of sRGB) (%) | 93.1 | 90.1 -3% | 91.1 -2% | 99.6 7% | 85.8 -8% | 100 7% |
| Média Total (Programa/Configurações) | -12% /
-24% | 4% /
-7% | 0% /
-16% | -14% /
-26% | -6% /
-13% |
* ... menor é melhor
Exibir tempos de resposta
| ↔ Tempo de resposta preto para branco | ||
|---|---|---|
| 25.2 ms ... ascensão ↗ e queda ↘ combinadas | ↗ 15.2 ms ascensão | 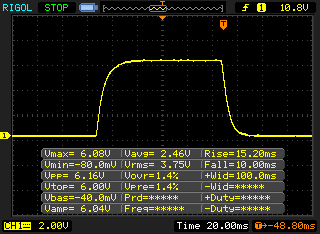 |
| ↘ 10 ms queda | ||
| A tela mostra taxas de resposta relativamente lentas em nossos testes e pode ser muito lenta para os jogadores. Em comparação, todos os dispositivos testados variam de 0.1 (mínimo) a 240 (máximo) ms. » 61 % de todos os dispositivos são melhores. Isso significa que o tempo de resposta medido é pior que a média de todos os dispositivos testados (19.8 ms). | ||
| ↔ Tempo de resposta 50% cinza a 80% cinza | ||
| 38.4 ms ... ascensão ↗ e queda ↘ combinadas | ↗ 18.8 ms ascensão | 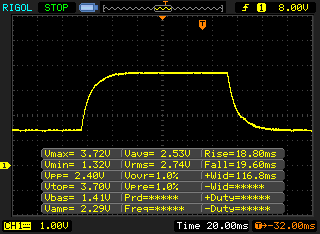 |
| ↘ 19.6 ms queda | ||
| A tela mostra taxas de resposta lentas em nossos testes e será insatisfatória para os jogadores. Em comparação, todos os dispositivos testados variam de 0.165 (mínimo) a 636 (máximo) ms. » 57 % de todos os dispositivos são melhores. Isso significa que o tempo de resposta medido é pior que a média de todos os dispositivos testados (31 ms). | ||
Cintilação da tela / PWM (modulação por largura de pulso)
| Tela tremeluzindo/PWM detectado | 26040 Hz | ≤ 77 % configuração de brilho | 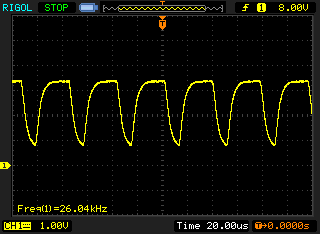 |
A luz de fundo da tela pisca em 26040 Hz (pior caso, por exemplo, utilizando PWM) Cintilação detectada em uma configuração de brilho de 77 % e abaixo. Não deve haver cintilação ou PWM acima desta configuração de brilho. A frequência de 26040 Hz é bastante alta, então a maioria dos usuários sensíveis ao PWM não deve notar nenhuma oscilação. [pwm_comparison] Em comparação: 52 % de todos os dispositivos testados não usam PWM para escurecer a tela. Se PWM foi detectado, uma média de 7763 (mínimo: 5 - máximo: 343500) Hz foi medida. | |||
| PCMark 10 | |
| Score | |
| Lenovo ThinkPad P53-20QN000YGE | |
| Dell Precision 7530 | |
| MSI P65 Creator 9SF-657 | |
| Fujitsu Celsius H780 | |
| Lenovo ThinkPad P1 2019-20QT000RGE | |
| Lenovo ThinkPad P52 20MAS03N00 | |
| Essentials | |
| Lenovo ThinkPad P53-20QN000YGE | |
| Lenovo ThinkPad P1 2019-20QT000RGE | |
| Dell Precision 7530 | |
| MSI P65 Creator 9SF-657 | |
| Fujitsu Celsius H780 | |
| Lenovo ThinkPad P52 20MAS03N00 | |
| Productivity | |
| Dell Precision 7530 | |
| Lenovo ThinkPad P53-20QN000YGE | |
| Fujitsu Celsius H780 | |
| Lenovo ThinkPad P1 2019-20QT000RGE | |
| Lenovo ThinkPad P52 20MAS03N00 | |
| MSI P65 Creator 9SF-657 | |
| Digital Content Creation | |
| MSI P65 Creator 9SF-657 | |
| Lenovo ThinkPad P53-20QN000YGE | |
| Dell Precision 7530 | |
| Fujitsu Celsius H780 | |
| Lenovo ThinkPad P1 2019-20QT000RGE | |
| Lenovo ThinkPad P52 20MAS03N00 | |

| 3DMark 11 - 1280x720 Performance GPU | |
| Média da turma Workstation (12535 - 69594, n=24, últimos 2 anos) | |
| Média NVIDIA Quadro RTX 5000 Max-Q (24156 - 28524, n=9) | |
| Lenovo ThinkPad P53-20QN000YGE | |
| MSI WS75 9TL-636 | |
| MSI P65 Creator 9SF-657 | |
| Dell Precision 7530 | |
| Lenovo ThinkPad P1 2019-20QT000RGE | |
| Fujitsu Celsius H780 | |
| Lenovo ThinkPad P52 20MAS03N00 | |
| 3DMark | |
| 1920x1080 Fire Strike Graphics | |
| Média da turma Workstation (8293 - 52560, n=24, últimos 2 anos) | |
| Média NVIDIA Quadro RTX 5000 Max-Q (18247 - 21115, n=10) | |
| Lenovo ThinkPad P53-20QN000YGE | |
| MSI WS75 9TL-636 | |
| MSI P65 Creator 9SF-657 | |
| Dell Precision 7530 | |
| Lenovo ThinkPad P1 2019-20QT000RGE | |
| Fujitsu Celsius H780 | |
| Lenovo ThinkPad P52 20MAS03N00 | |
| 2560x1440 Time Spy Graphics | |
| Média da turma Workstation (2725 - 24806, n=24, últimos 2 anos) | |
| Média NVIDIA Quadro RTX 5000 Max-Q (6999 - 7977, n=10) | |
| Lenovo ThinkPad P53-20QN000YGE | |
| MSI WS75 9TL-636 | |
| Dell Precision 7530 | |
| Lenovo ThinkPad P1 2019-20QT000RGE | |
| LuxMark v2.0 64Bit | |
| Room GPUs-only | |
| Média da turma Workstation (1760 - 6990, n=4, últimos 2 anos) | |
| MSI WS75 9TL-636 | |
| Dell Precision 7530 | |
| Média NVIDIA Quadro RTX 5000 Max-Q (1972 - 2008, n=2) | |
| Lenovo ThinkPad P53-20QN000YGE | |
| Lenovo ThinkPad P1 2019-20QT000RGE | |
| Fujitsu Celsius H780 | |
| Lenovo ThinkPad P52 20MAS03N00 | |
| Sala GPUs-only | |
| Média da turma Workstation (5177 - 13967, n=4, últimos 2 anos) | |
| MSI WS75 9TL-636 | |
| Média NVIDIA Quadro RTX 5000 Max-Q (4913 - 5053, n=2) | |
| Lenovo ThinkPad P53-20QN000YGE | |
| Dell Precision 7530 | |
| Lenovo ThinkPad P1 2019-20QT000RGE | |
| Fujitsu Celsius H780 | |
| Lenovo ThinkPad P52 20MAS03N00 | |
| 3DMark 06 Standard Score | 38739 pontos | |
| 3DMark Vantage P Result | 54153 pontos | |
| 3DMark 11 Performance | 19250 pontos | |
| 3DMark Ice Storm Standard Score | 98630 pontos | |
| 3DMark Cloud Gate Standard Score | 38066 pontos | |
| 3DMark Fire Strike Score | 16547 pontos | |
| 3DMark Time Spy Score | 6879 pontos | |
Ajuda | ||
| baixo | média | alto | ultra | QHD | 4K | |
|---|---|---|---|---|---|---|
| GTA V (2015) | 177 | 170 | 150.4 | 77.6 | 68.4 | |
| The Witcher 3 (2015) | 320 | 235 | 141 | 71 | 46.4 | |
| Dota 2 Reborn (2015) | 148 | 137 | 132 | 126 | 102 | |
| Rise of the Tomb Raider (2016) | 281.4 | 198.6 | 134.5 | 110.1 | 45.4 | |
| X-Plane 11.11 (2018) | 117 | 99 | 85 | |||
| Shadow of the Tomb Raider (2018) | 127 | 102 | 98 | 87 | 59 | 29 |
| Hitman 2 (2018) | 87.7 | 85.3 | 78.4 | 75.3 | 73.3 | 46.6 |
| Battlefield V (2018) | 153.6 | 105.4 | 88.2 | 81.2 | 68.3 | 42.5 |
| Far Cry New Dawn (2019) | 107 | 98 | 90 | 86 | 72 | 43 |
| Dirt Rally 2.0 (2019) | 275 | 188.9 | 160.3 | 89.3 | 66.8 | |
| Anno 1800 (2019) | 94.5 | 97.8 | 73.9 | 38.9 | 31.5 | |
| F1 2019 (2019) | 113 | 101 | 93 | 88 | 83 | 52 |
| Ghost Recon Breakpoint (2019) | 127 | 105 | 93 | 65 | 47 | 26 |
| GRID 2019 (2019) | 178.8 | 155.6 | 118.5 | 79.2 | 61.4 | 36.8 |
Barulho
| Ocioso |
| 28.3 / 28.3 / 28.3 dB |
| Carga |
| 29.8 / 38.3 dB |
 | ||
30 dB silencioso 40 dB(A) audível 50 dB(A) ruidosamente alto |
||
min: | ||
| Lenovo ThinkPad P53-20QN000YGE Quadro RTX 5000 Max-Q, i7-9850H, Samsung PM981a MZVLB1T0HBLR | Lenovo ThinkPad P1 2019-20QT000RGE Quadro T1000 (Laptop), i7-9850H, WDC PC SN720 SDAQNTW-512G | Dell Precision 7530 Quadro P3200, i9-8950HK, Samsung PM961 NVMe MZVLW512HMJP | Fujitsu Celsius H780 Quadro P2000, i7-8850H, Samsung SSD PM981 MZVLB512HAJQ | MSI P65 Creator 9SF-657 GeForce RTX 2070 Max-Q, i9-9880H, 2x Samsung SSD PM981 MZVLB512HAJQ (RAID 0) | Lenovo ThinkPad P52 20MAS03N00 Quadro P1000, i7-8750H, Samsung SSD PM981 MZVLB512HAJQ | |
|---|---|---|---|---|---|---|
| Noise | -4% | -12% | -20% | -18% | -3% | |
| desligado / ambiente * (dB) | 28.3 | 28.8 -2% | 28.3 -0% | 29.6 -5% | 30.2 -7% | 29.5 -4% |
| Idle Minimum * (dB) | 28.3 | 28.8 -2% | 28.3 -0% | 29.6 -5% | 32.8 -16% | 29.5 -4% |
| Idle Average * (dB) | 28.3 | 28.8 -2% | 28.3 -0% | 32.2 -14% | 32.8 -16% | 29.5 -4% |
| Idle Maximum * (dB) | 28.3 | 28.8 -2% | 30.5 -8% | 37 -31% | 33.6 -19% | 29.5 -4% |
| Load Average * (dB) | 29.8 | 36.1 -21% | 34.5 -16% | 40.3 -35% | 40.9 -37% | 34.7 -16% |
| Witcher 3 ultra * (dB) | 38.3 | 49.5 -29% | 33.1 14% | |||
| Load Maximum * (dB) | 38.3 | 36.7 4% | 49.5 -29% | 49.4 -29% | 42.7 -11% | 39.4 -3% |
* ... menor é melhor
(±) A temperatura máxima no lado superior é 41.8 °C / 107 F, em comparação com a média de 38.2 °C / 101 F , variando de 22.2 a 69.8 °C para a classe Workstation.
(-) A parte inferior aquece até um máximo de 46.1 °C / 115 F, em comparação com a média de 41.1 °C / 106 F
(+) Em uso inativo, a temperatura média para o lado superior é 21.9 °C / 71 F, em comparação com a média do dispositivo de 32 °C / ### class_avg_f### F.
(±) Jogando The Witcher 3, a temperatura média para o lado superior é 38 °C / 100 F, em comparação com a média do dispositivo de 32 °C / ## #class_avg_f### F.
(±) Os apoios para as mãos e o touchpad podem ficar muito quentes ao toque, com um máximo de 37.1 °C / 98.8 F.
(-) A temperatura média da área do apoio para as mãos de dispositivos semelhantes foi 27.8 °C / 82 F (-9.3 °C / -16.8 F).
Lenovo ThinkPad P53-20QN000YGE análise de áudio
(±) | o volume do alto-falante é médio, mas bom (###valor### dB)
Graves 100 - 315Hz
(±) | graves reduzidos - em média 11.6% menor que a mediana
(±) | a linearidade dos graves é média (13.6% delta para a frequência anterior)
Médios 400 - 2.000 Hz
(±) | médios mais altos - em média 7.8% maior que a mediana
(±) | a linearidade dos médios é média (7.5% delta para frequência anterior)
Altos 2 - 16 kHz
(+) | agudos equilibrados - apenas 1.9% longe da mediana
(+) | os máximos são lineares (4.8% delta da frequência anterior)
Geral 100 - 16.000 Hz
(±) | a linearidade do som geral é média (23.1% diferença em relação à mediana)
Comparado com a mesma classe
» 83% de todos os dispositivos testados nesta classe foram melhores, 3% semelhantes, 14% piores
» O melhor teve um delta de 7%, a média foi 17%, o pior foi 35%
Comparado com todos os dispositivos testados
» 69% de todos os dispositivos testados foram melhores, 5% semelhantes, 26% piores
» O melhor teve um delta de 4%, a média foi 24%, o pior foi 134%
Dell Precision 7530 análise de áudio
(±) | o volume do alto-falante é médio, mas bom (###valor### dB)
Graves 100 - 315Hz
(±) | graves reduzidos - em média 8% menor que a mediana
(±) | a linearidade dos graves é média (12.3% delta para a frequência anterior)
Médios 400 - 2.000 Hz
(+) | médios equilibrados - apenas 3.3% longe da mediana
(±) | a linearidade dos médios é média (7.8% delta para frequência anterior)
Altos 2 - 16 kHz
(+) | agudos equilibrados - apenas 2.3% longe da mediana
(+) | os máximos são lineares (5% delta da frequência anterior)
Geral 100 - 16.000 Hz
(+) | o som geral é linear (11.4% diferença em relação à mediana)
Comparado com a mesma classe
» 13% de todos os dispositivos testados nesta classe foram melhores, 4% semelhantes, 83% piores
» O melhor teve um delta de 7%, a média foi 17%, o pior foi 35%
Comparado com todos os dispositivos testados
» 7% de todos os dispositivos testados foram melhores, 2% semelhantes, 91% piores
» O melhor teve um delta de 4%, a média foi 24%, o pior foi 134%
| desligado | |
| Ocioso | |
| Carga |
|
Key:
min: | |
| Lenovo ThinkPad P53-20QN000YGE i7-9850H, Quadro RTX 5000 Max-Q, Samsung PM981a MZVLB1T0HBLR, IPS, 1920x1080, 15.6" | Lenovo ThinkPad P1 2019-20QT000RGE i7-9850H, Quadro T1000 (Laptop), WDC PC SN720 SDAQNTW-512G, IPS LED, 1920x1080, 15.6" | Dell Precision 7530 i9-8950HK, Quadro P3200, Samsung PM961 NVMe MZVLW512HMJP, IPS, 3840x2160, 15.6" | Fujitsu Celsius H780 i7-8850H, Quadro P2000, Samsung SSD PM981 MZVLB512HAJQ, IPS LED, 1920x1080, 15.6" | MSI P65 Creator 9SF-657 i9-9880H, GeForce RTX 2070 Max-Q, 2x Samsung SSD PM981 MZVLB512HAJQ (RAID 0), IPS, 3840x2160, 15.6" | Lenovo ThinkPad P52 20MAS03N00 i7-8750H, Quadro P1000, Samsung SSD PM981 MZVLB512HAJQ, IPS LED, 1920x1080, 15.6" | |
|---|---|---|---|---|---|---|
| Power Consumption | -20% | -40% | 3% | -22% | 35% | |
| Idle Minimum * (Watt) | 7.9 | 13.7 -73% | 15.7 -99% | 9.1 -15% | 9.4 -19% | 4.02 49% |
| Idle Average * (Watt) | 11.8 | 17.5 -48% | 20.3 -72% | 13.2 -12% | 17.4 -47% | 7.2 39% |
| Idle Maximum * (Watt) | 14.9 | 20.9 -40% | 25.7 -72% | 14.04 6% | 19.6 -32% | 11.46 23% |
| Load Average * (Watt) | 96 | 77.2 20% | 118.9 -24% | 78.8 18% | 103 -7% | 76.3 21% |
| Witcher 3 ultra * (Watt) | 149 | 131.2 12% | 74 50% | |||
| Load Maximum * (Watt) | 207.8 | 123.7 40% | 174 16% | 172.5 17% | 216 -4% | 154 26% |
* ... menor é melhor
| Lenovo ThinkPad P53-20QN000YGE i7-9850H, Quadro RTX 5000 Max-Q, 90 Wh | Lenovo ThinkPad P1 2019-20QT000RGE i7-9850H, Quadro T1000 (Laptop), 80 Wh | Dell Precision 7530 i9-8950HK, Quadro P3200, 97 Wh | Fujitsu Celsius H780 i7-8850H, Quadro P2000, 96 Wh | MSI P65 Creator 9SF-657 i9-9880H, GeForce RTX 2070 Max-Q, 82 Wh | Lenovo ThinkPad P52 20MAS03N00 i7-8750H, Quadro P1000, 96 Wh | Média da turma Workstation | |
|---|---|---|---|---|---|---|---|
| Duração da bateria | -20% | -40% | -32% | -46% | -5% | -18% | |
| H.264 (h) | 9.8 | 9.3 -5% | 12.2 24% | 9.51 ? -3% | |||
| WiFi v1.3 (h) | 11.1 | 8.9 -20% | 4.6 -59% | 7.5 -32% | 6 -46% | 10.6 -5% | 8.52 ? -23% |
| Load (h) | 2 | 1.3 -35% | 1.6 -20% | 1.1 -45% | 1.3 -35% | 1.429 ? -29% | |
| Reader / Idle (h) | 6.4 | 9.6 | 25.3 | 26.1 ? |
Pro
Contra
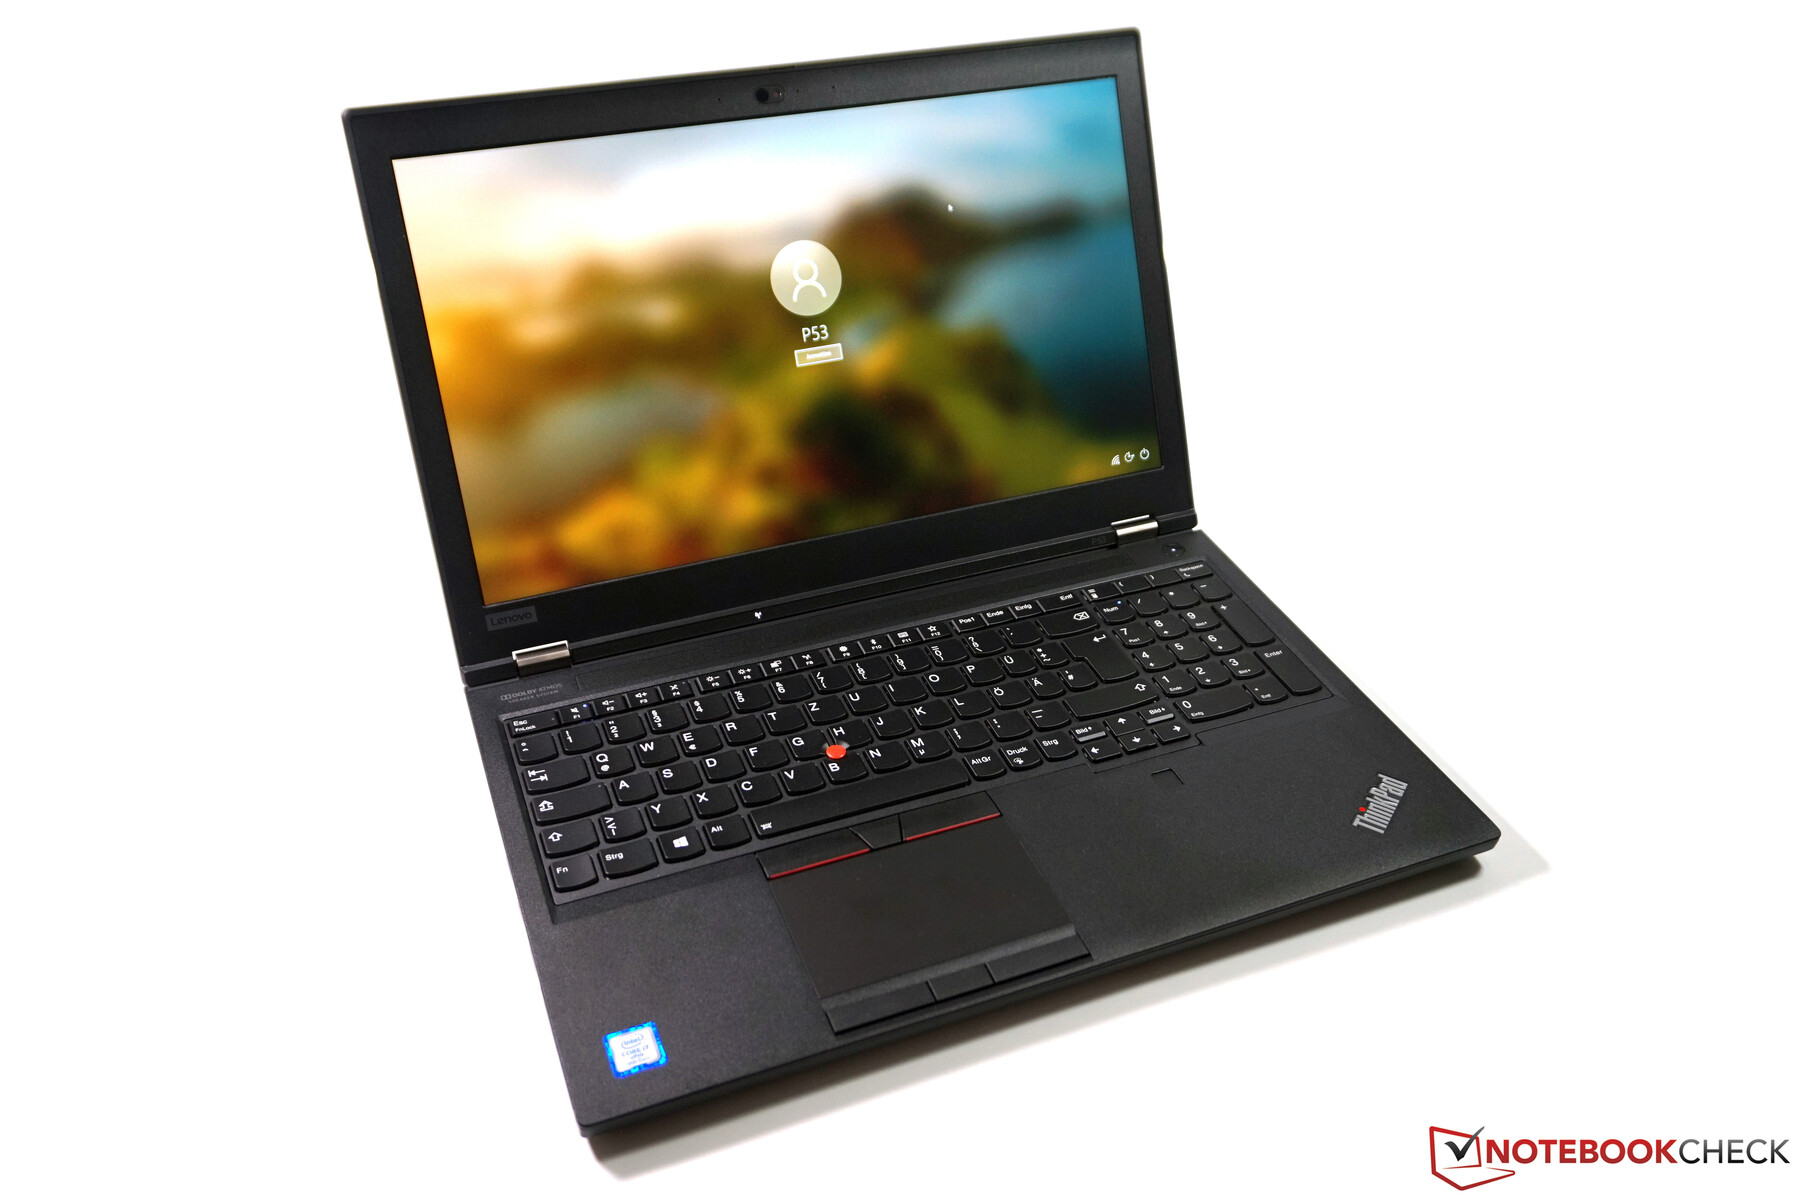
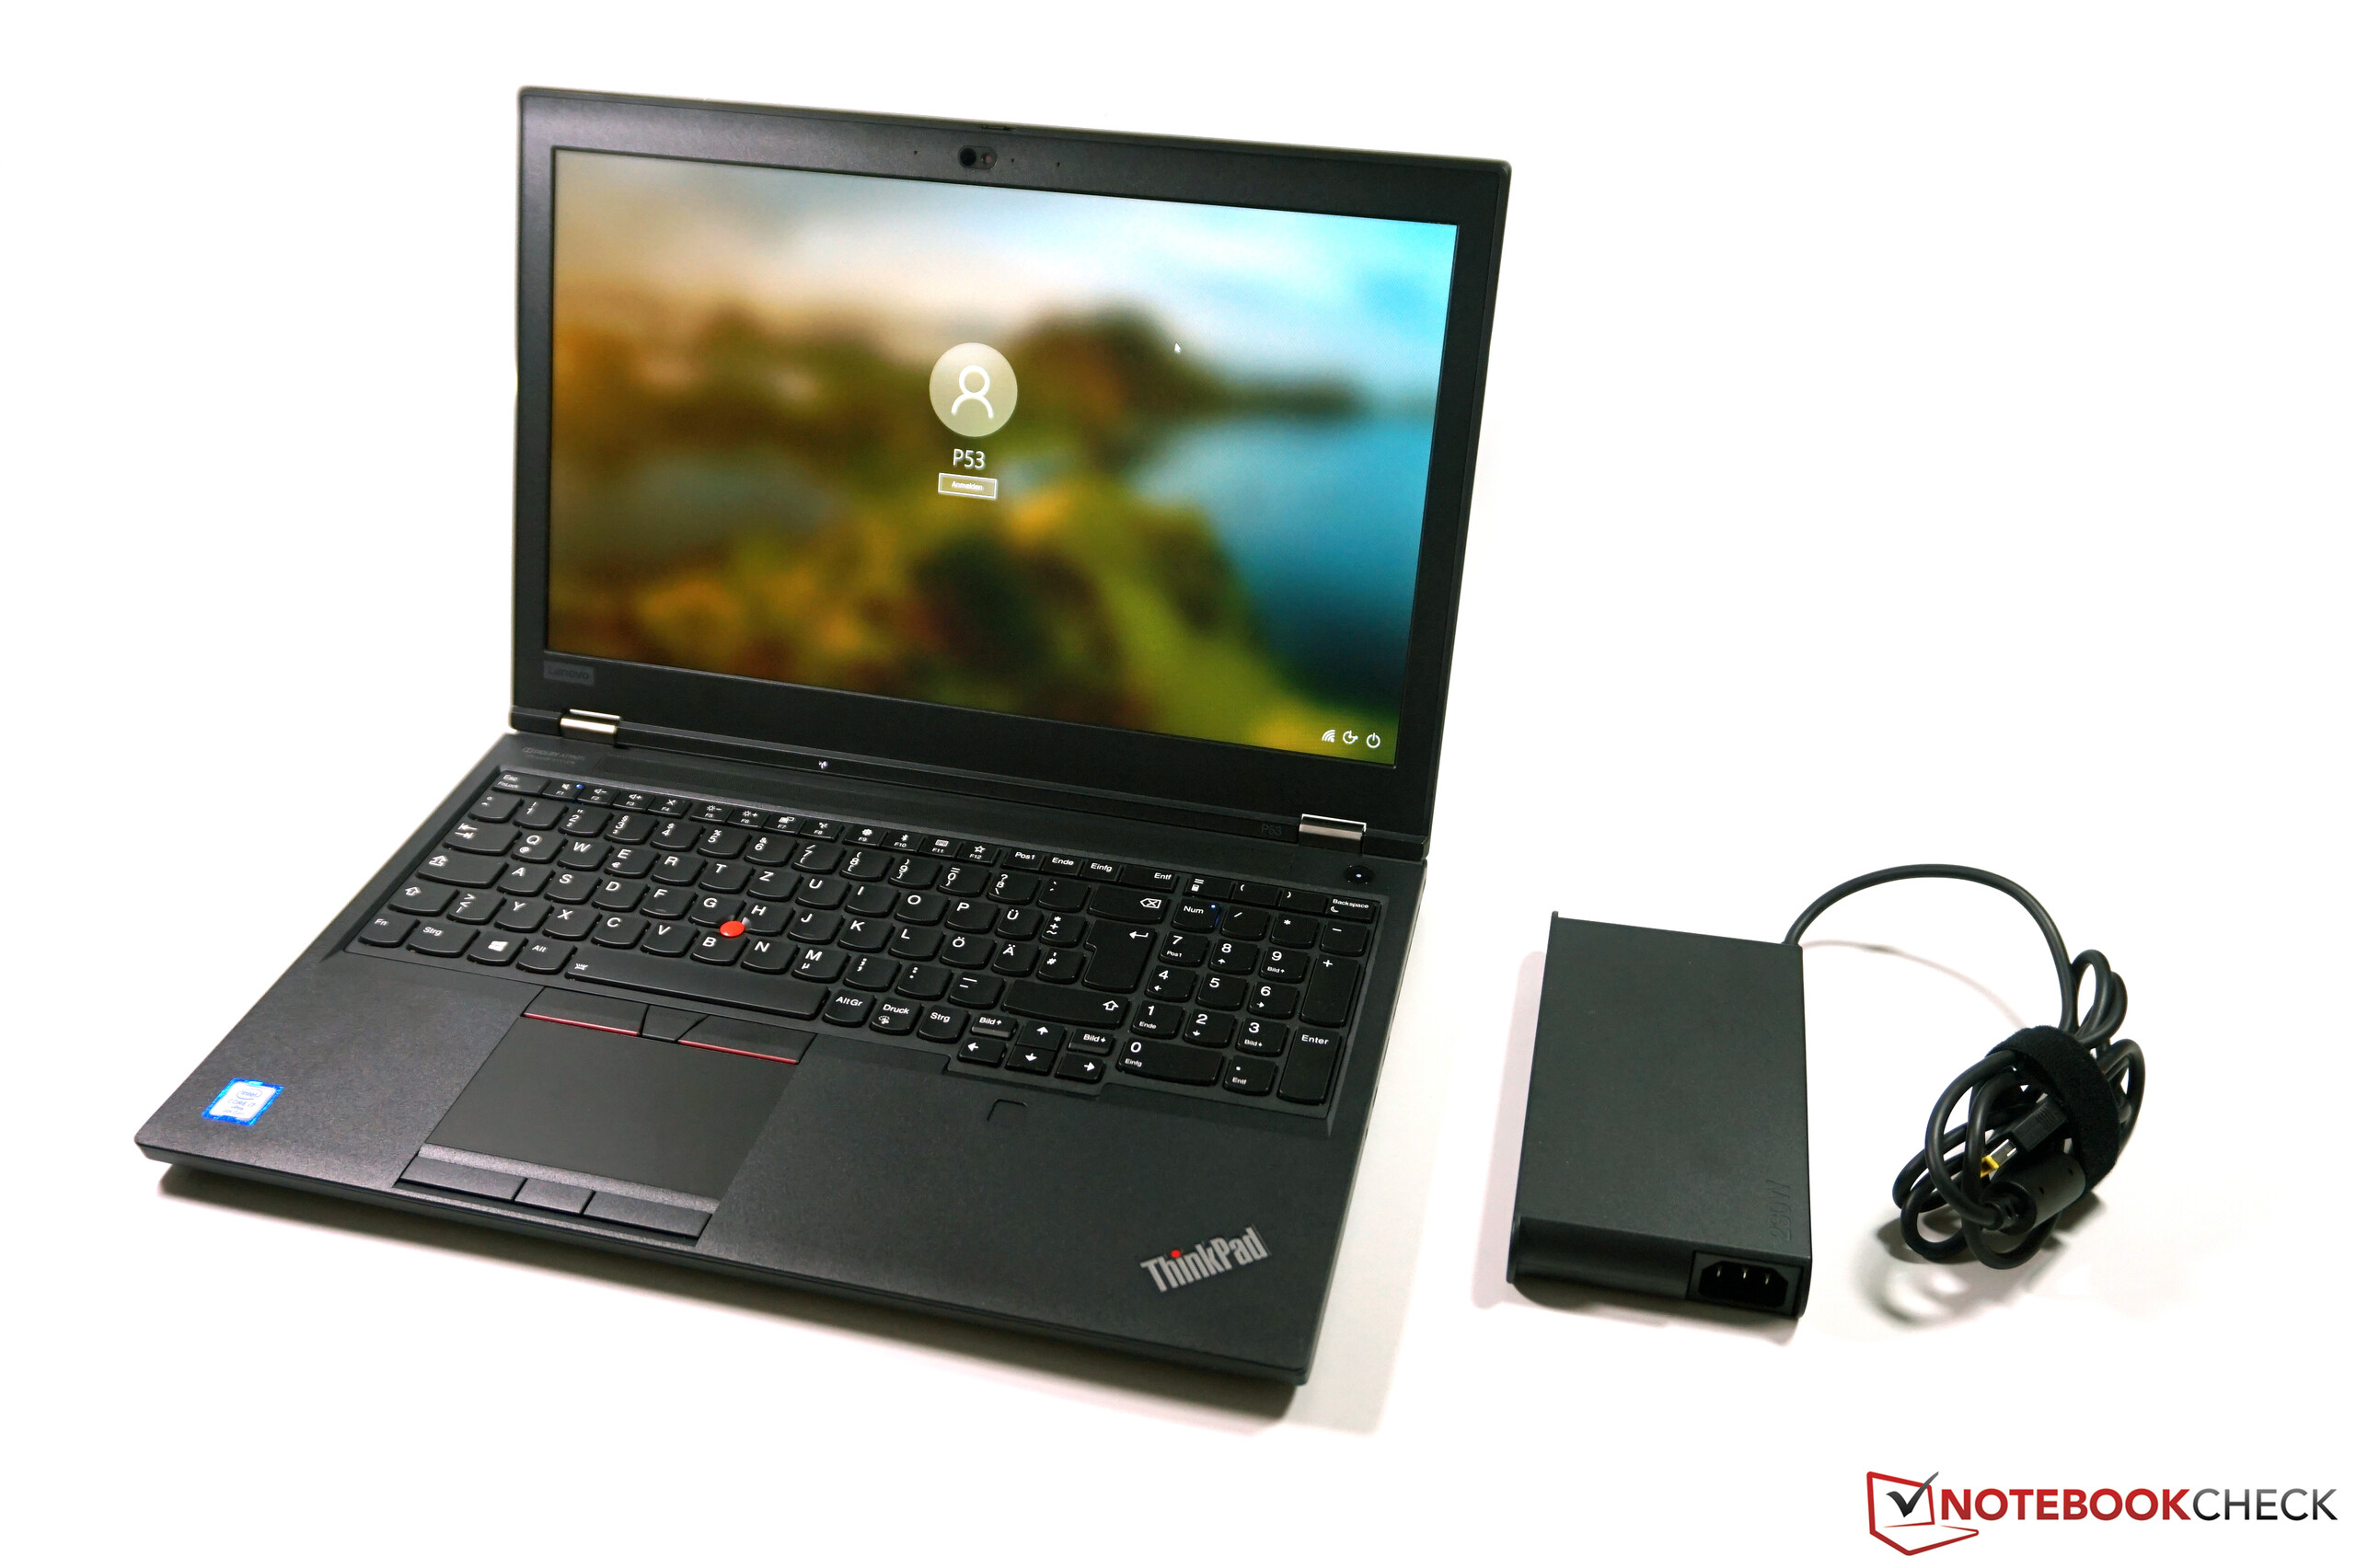
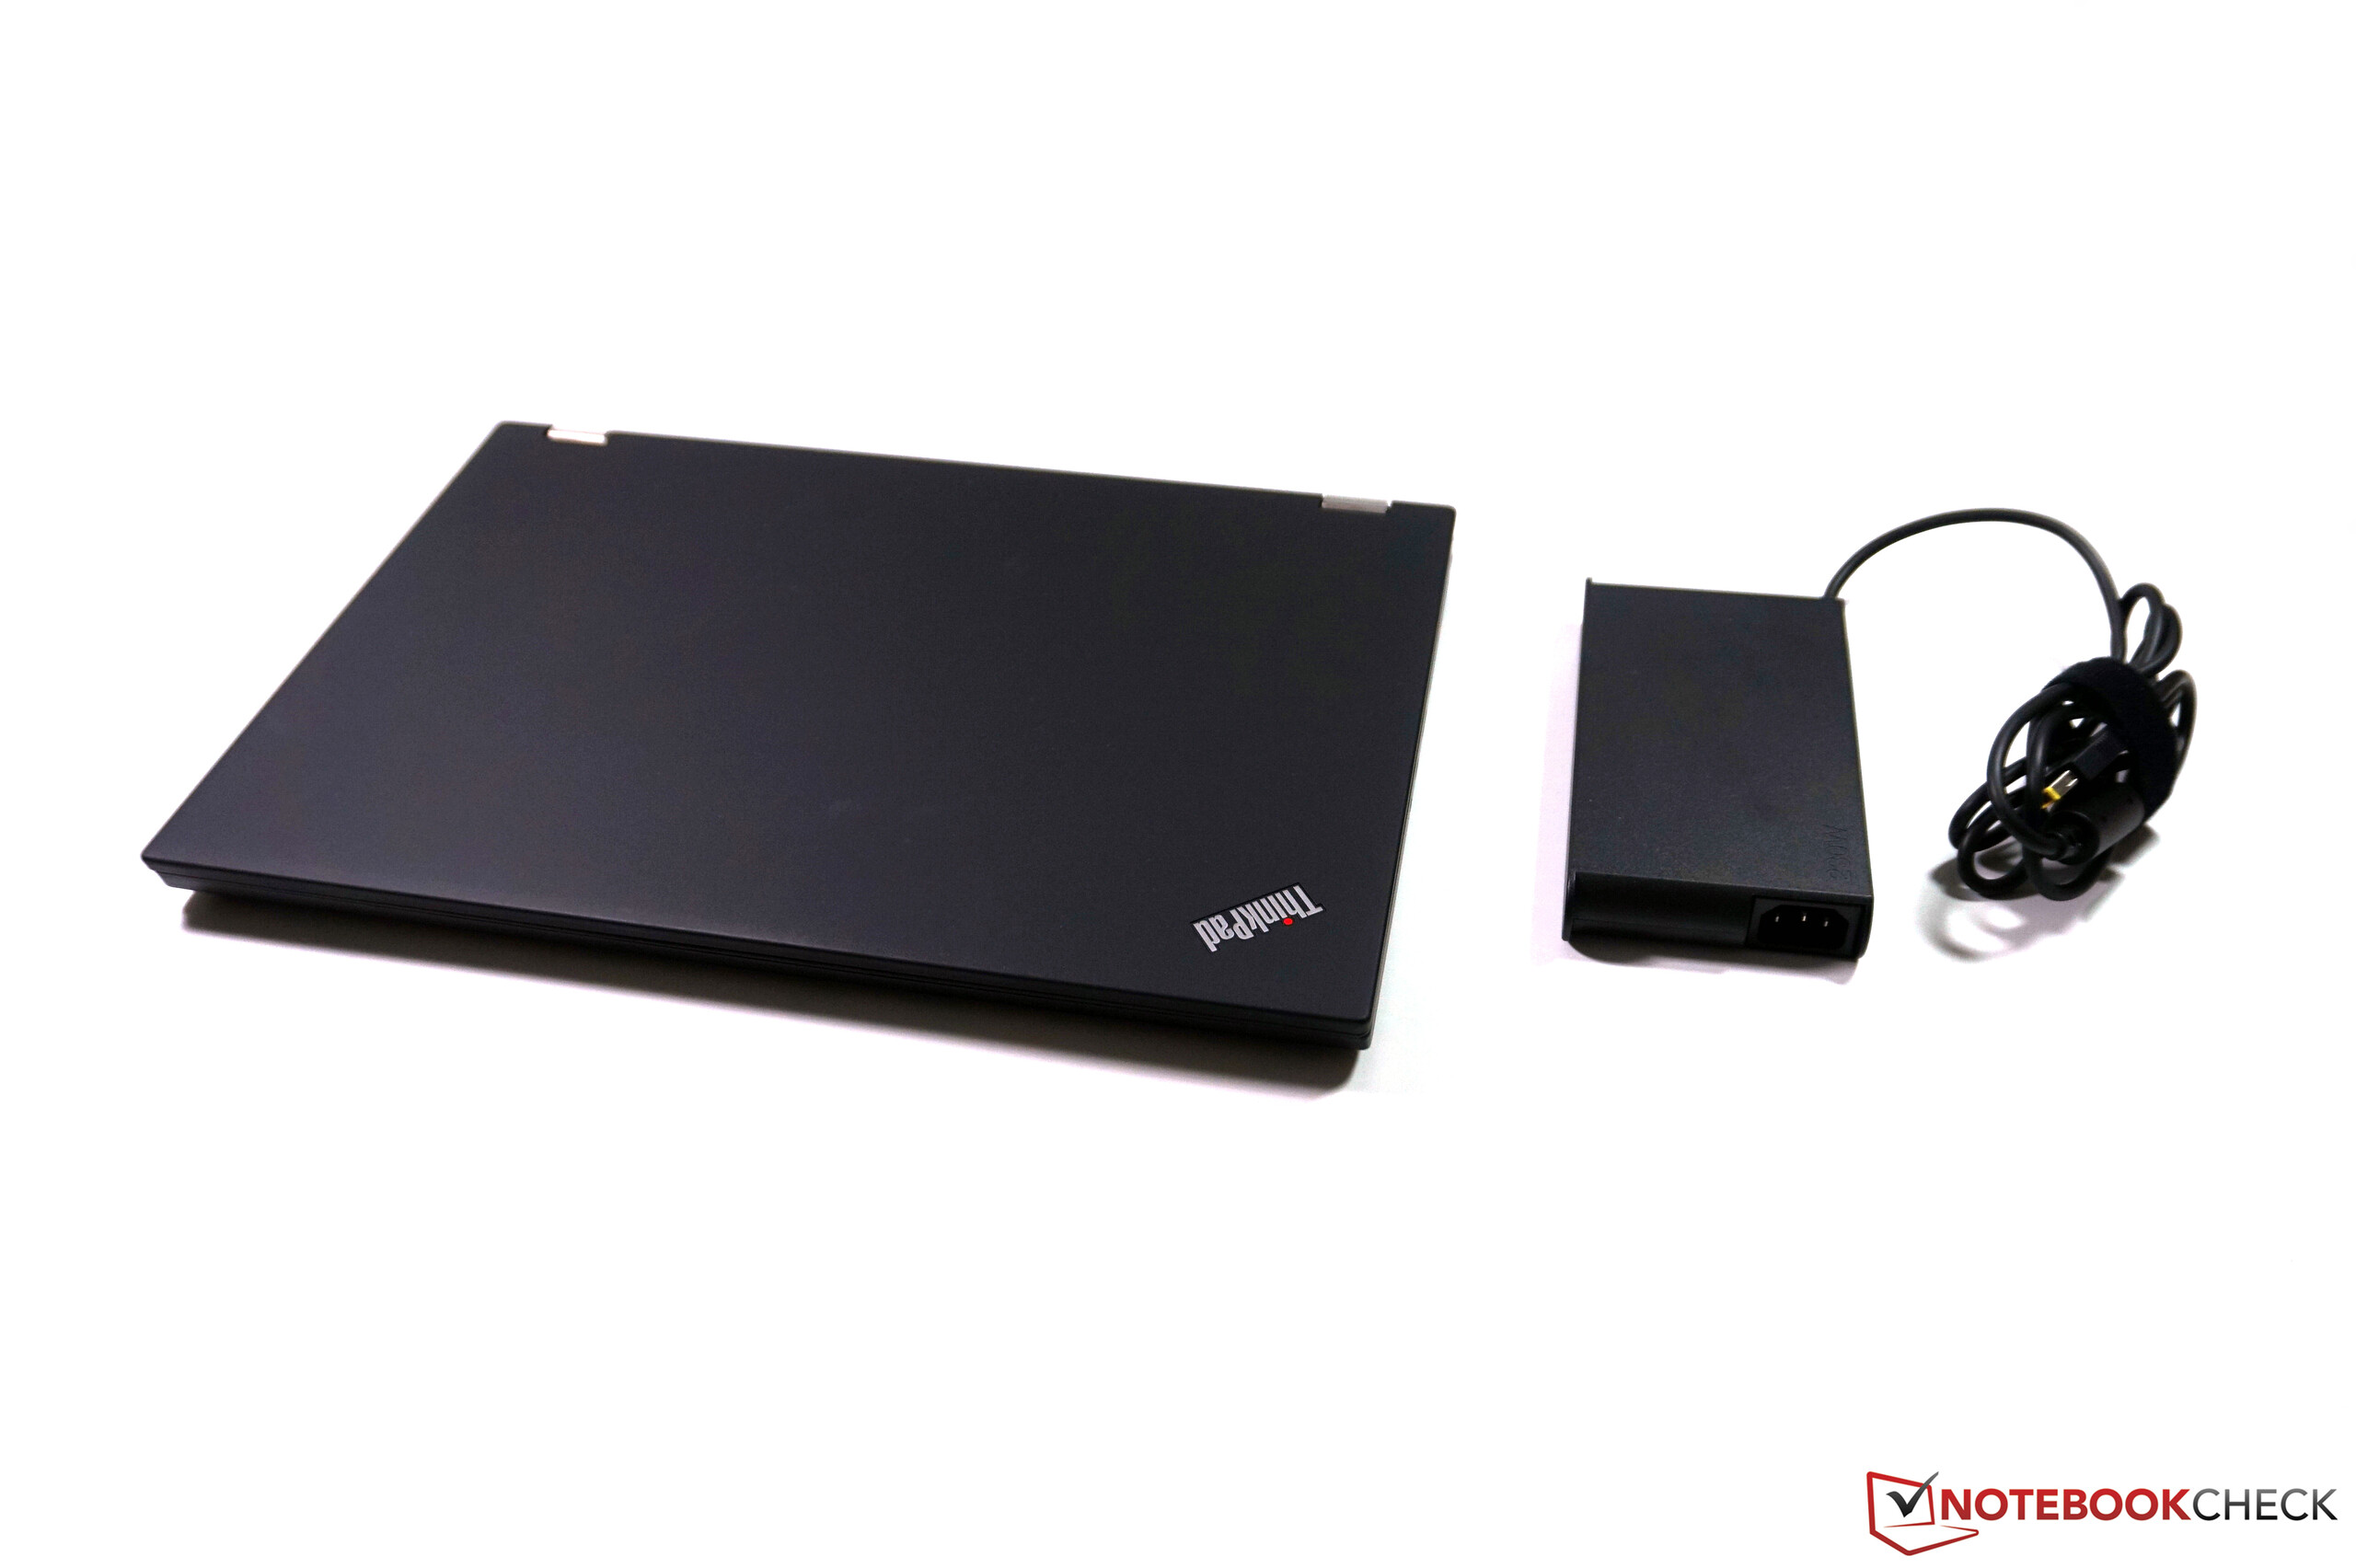
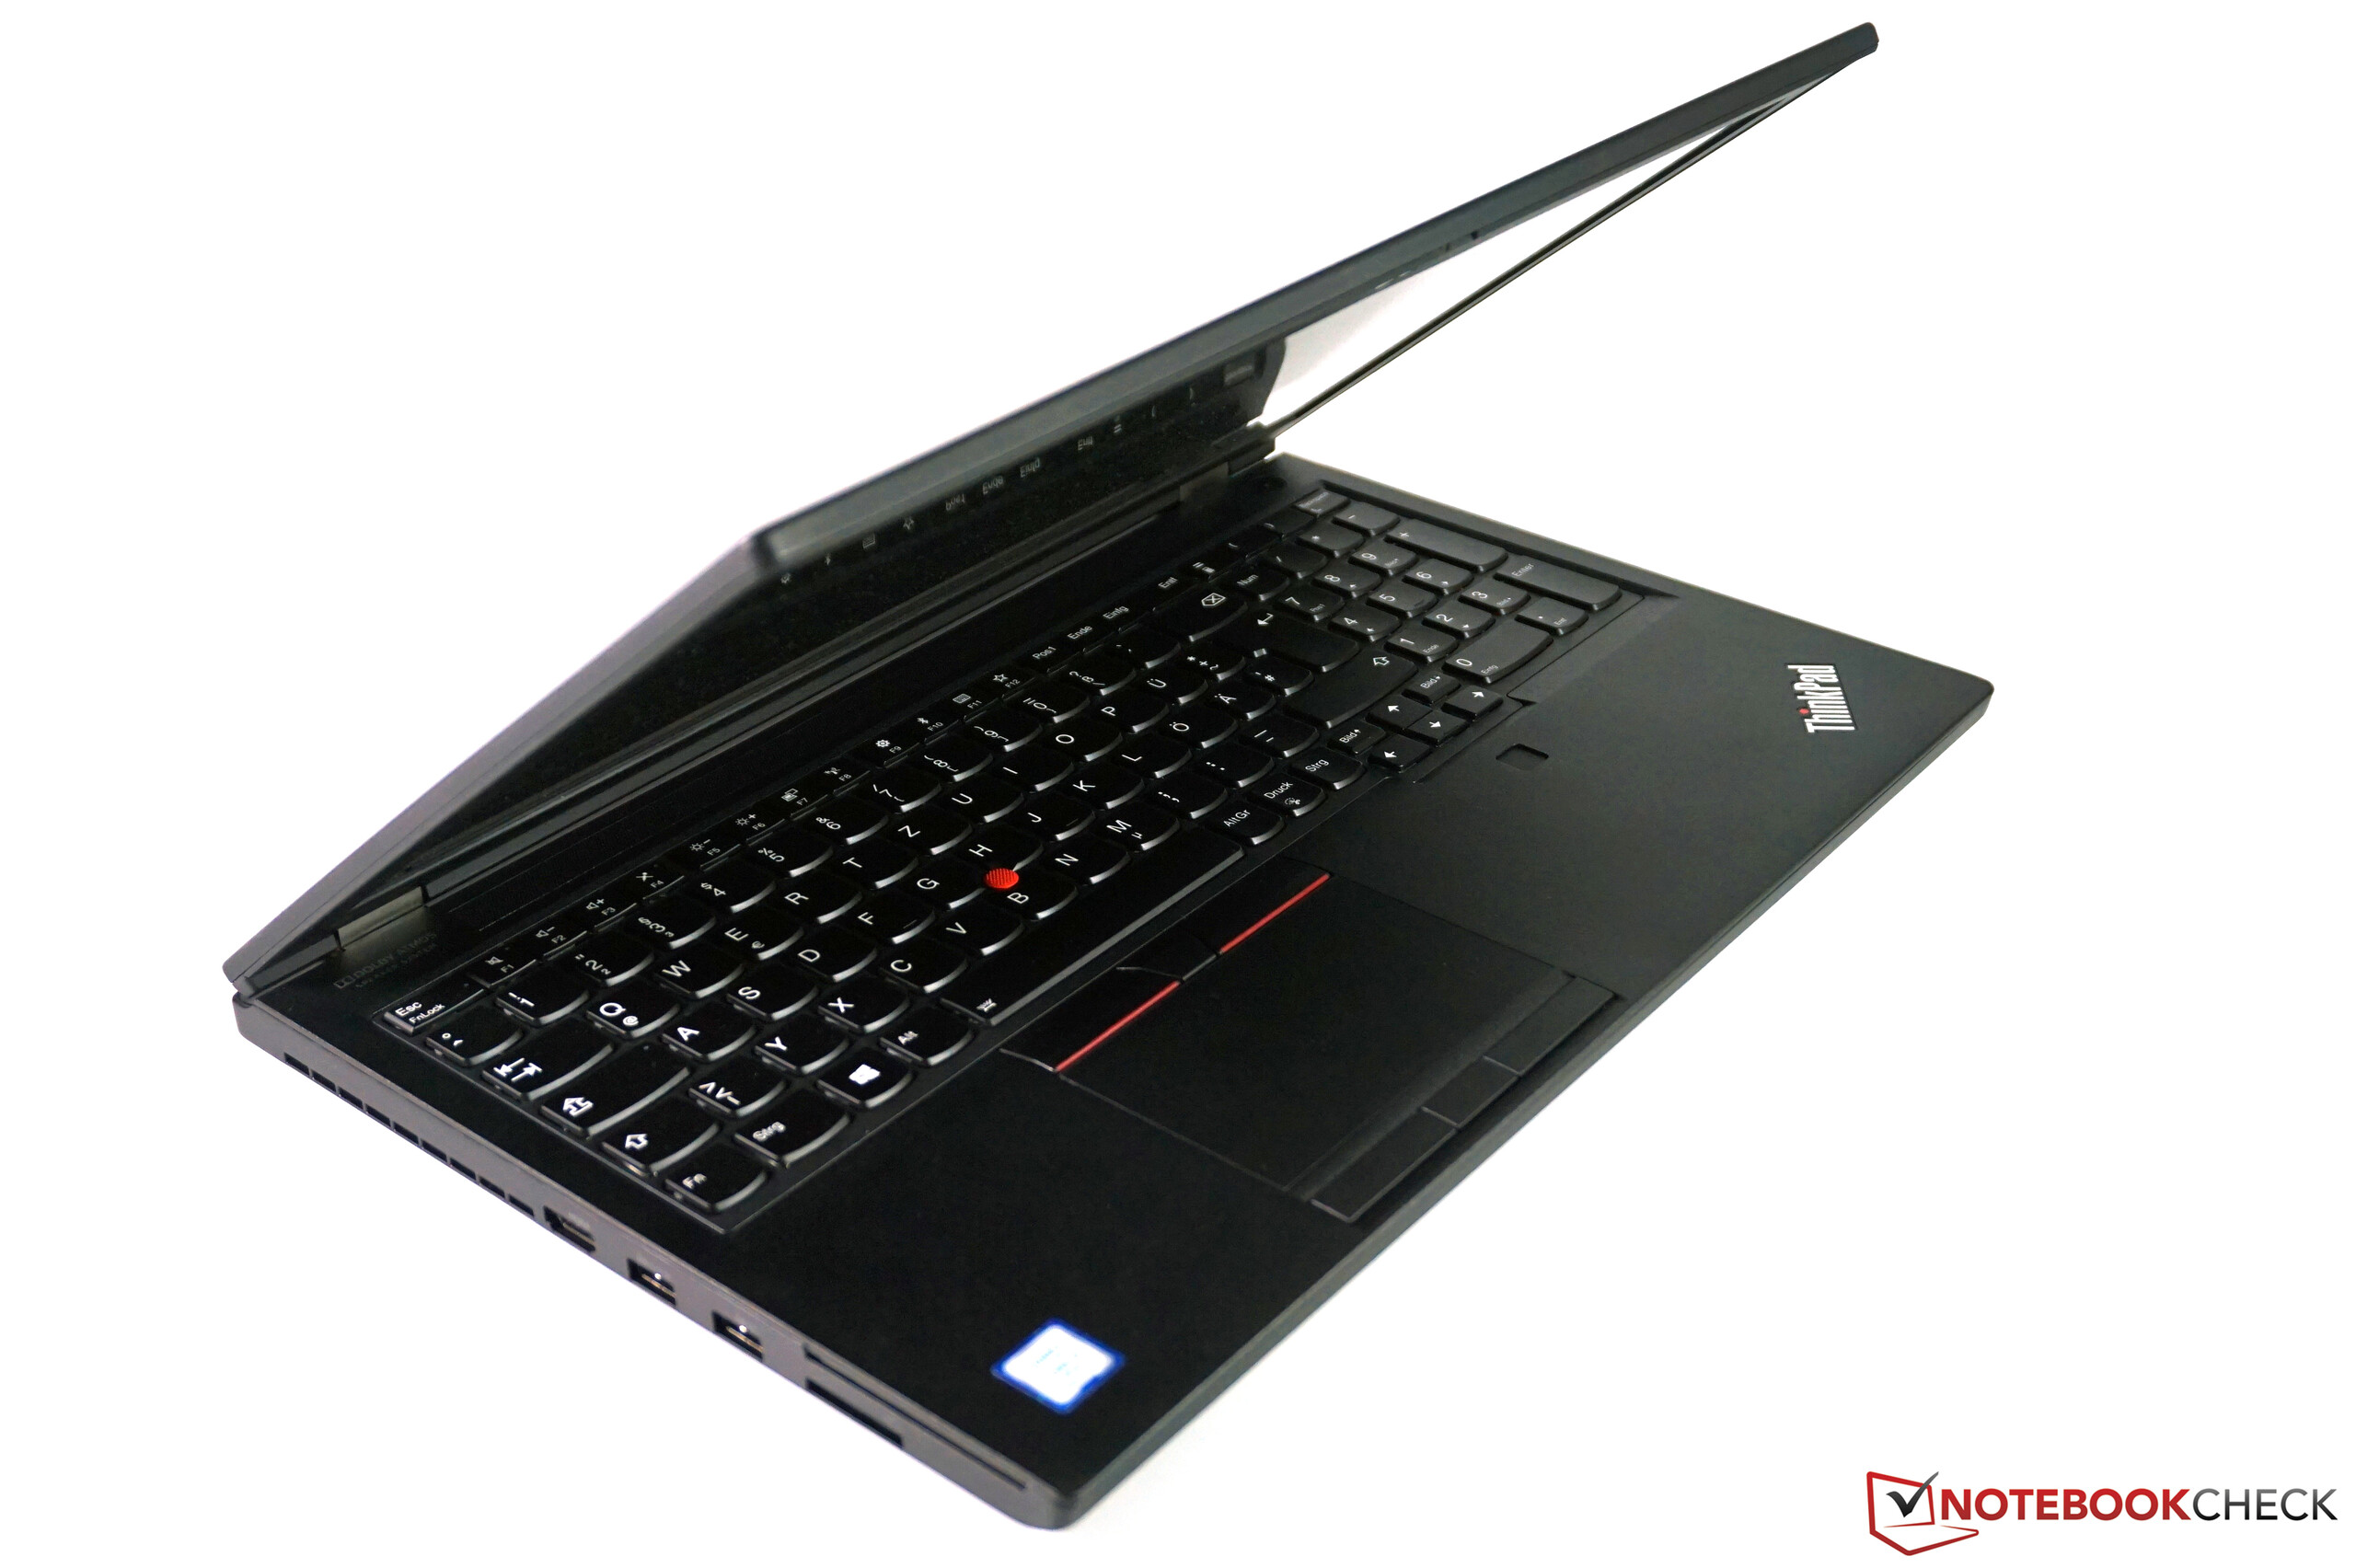
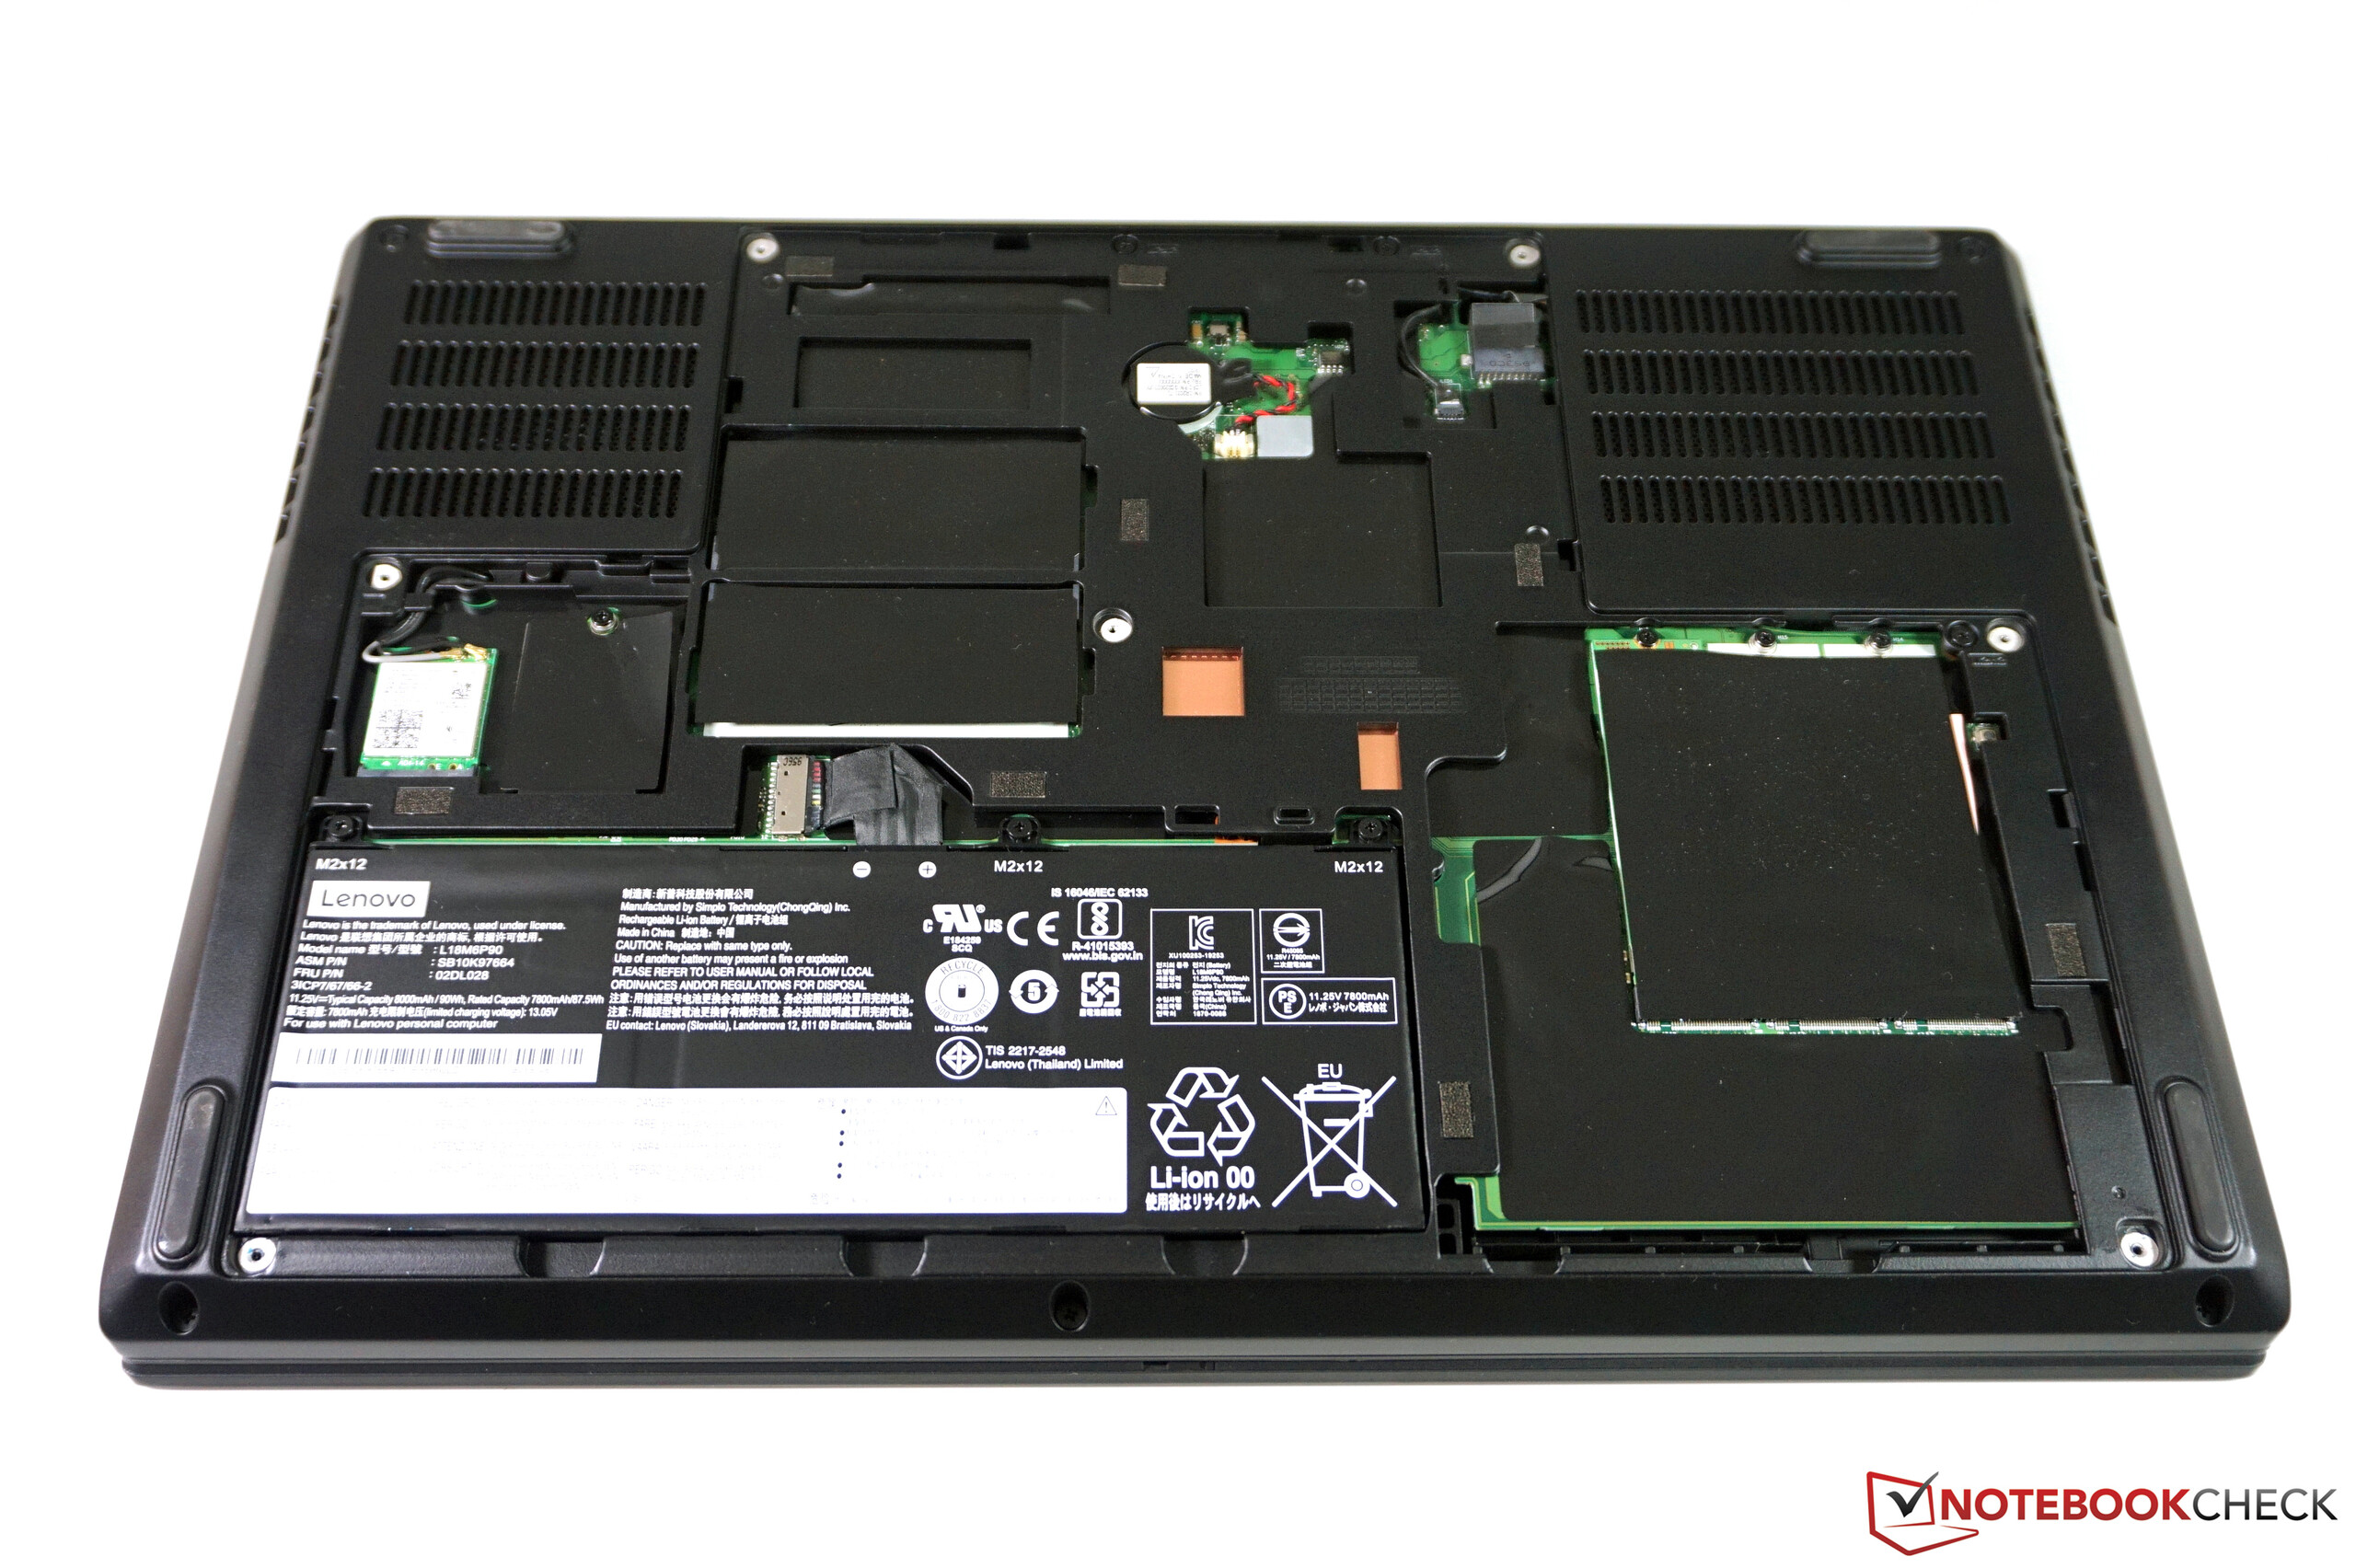
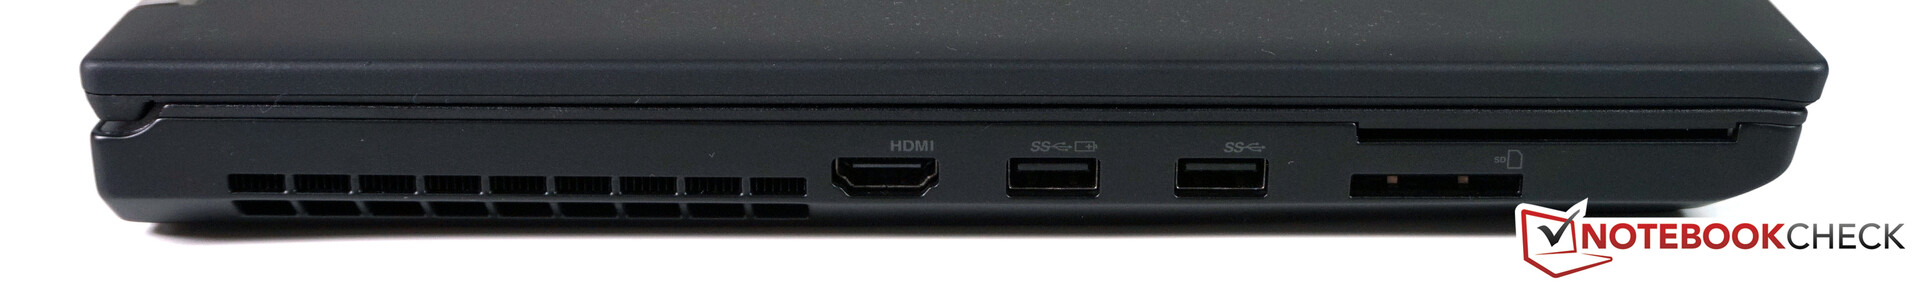
O ThinkPad P53 ainda é um workstation móvel tradicional que não presta muita atenção às tendências atuais de carcaças e marcos cada vez mais finos. Como resultado, no entanto, a carcaça é muito robusta, existem muitas portas, a atualização é facilmente possível e o hardware é muito poderoso, principalmente no departamento de gráficos.
No exterior, pouco mudou em comparação com o ThinkPad P52 do ano anterior, mas houve algumas mudanças. Os principais pontos de venda são as placas gráficas mais poderosas (Quadro RTX 4000 e 5000), que geralmente estão reservadas para workstations maiores de 17 polegadas. Aqui, algumas críticas são justificadas, uma vez que os clientes não sabem qual versão da placa gráfica devem esperar. Nem a Nvidia nem a Lenovo afirmam que a versão mais lenta de 80 watts está embutida no sistema. A Lenovo provavelmente também conta com a variante mais lenta do RTX 4000. Em suma, o desempenho gráfico ainda é impressionante, independentemente.
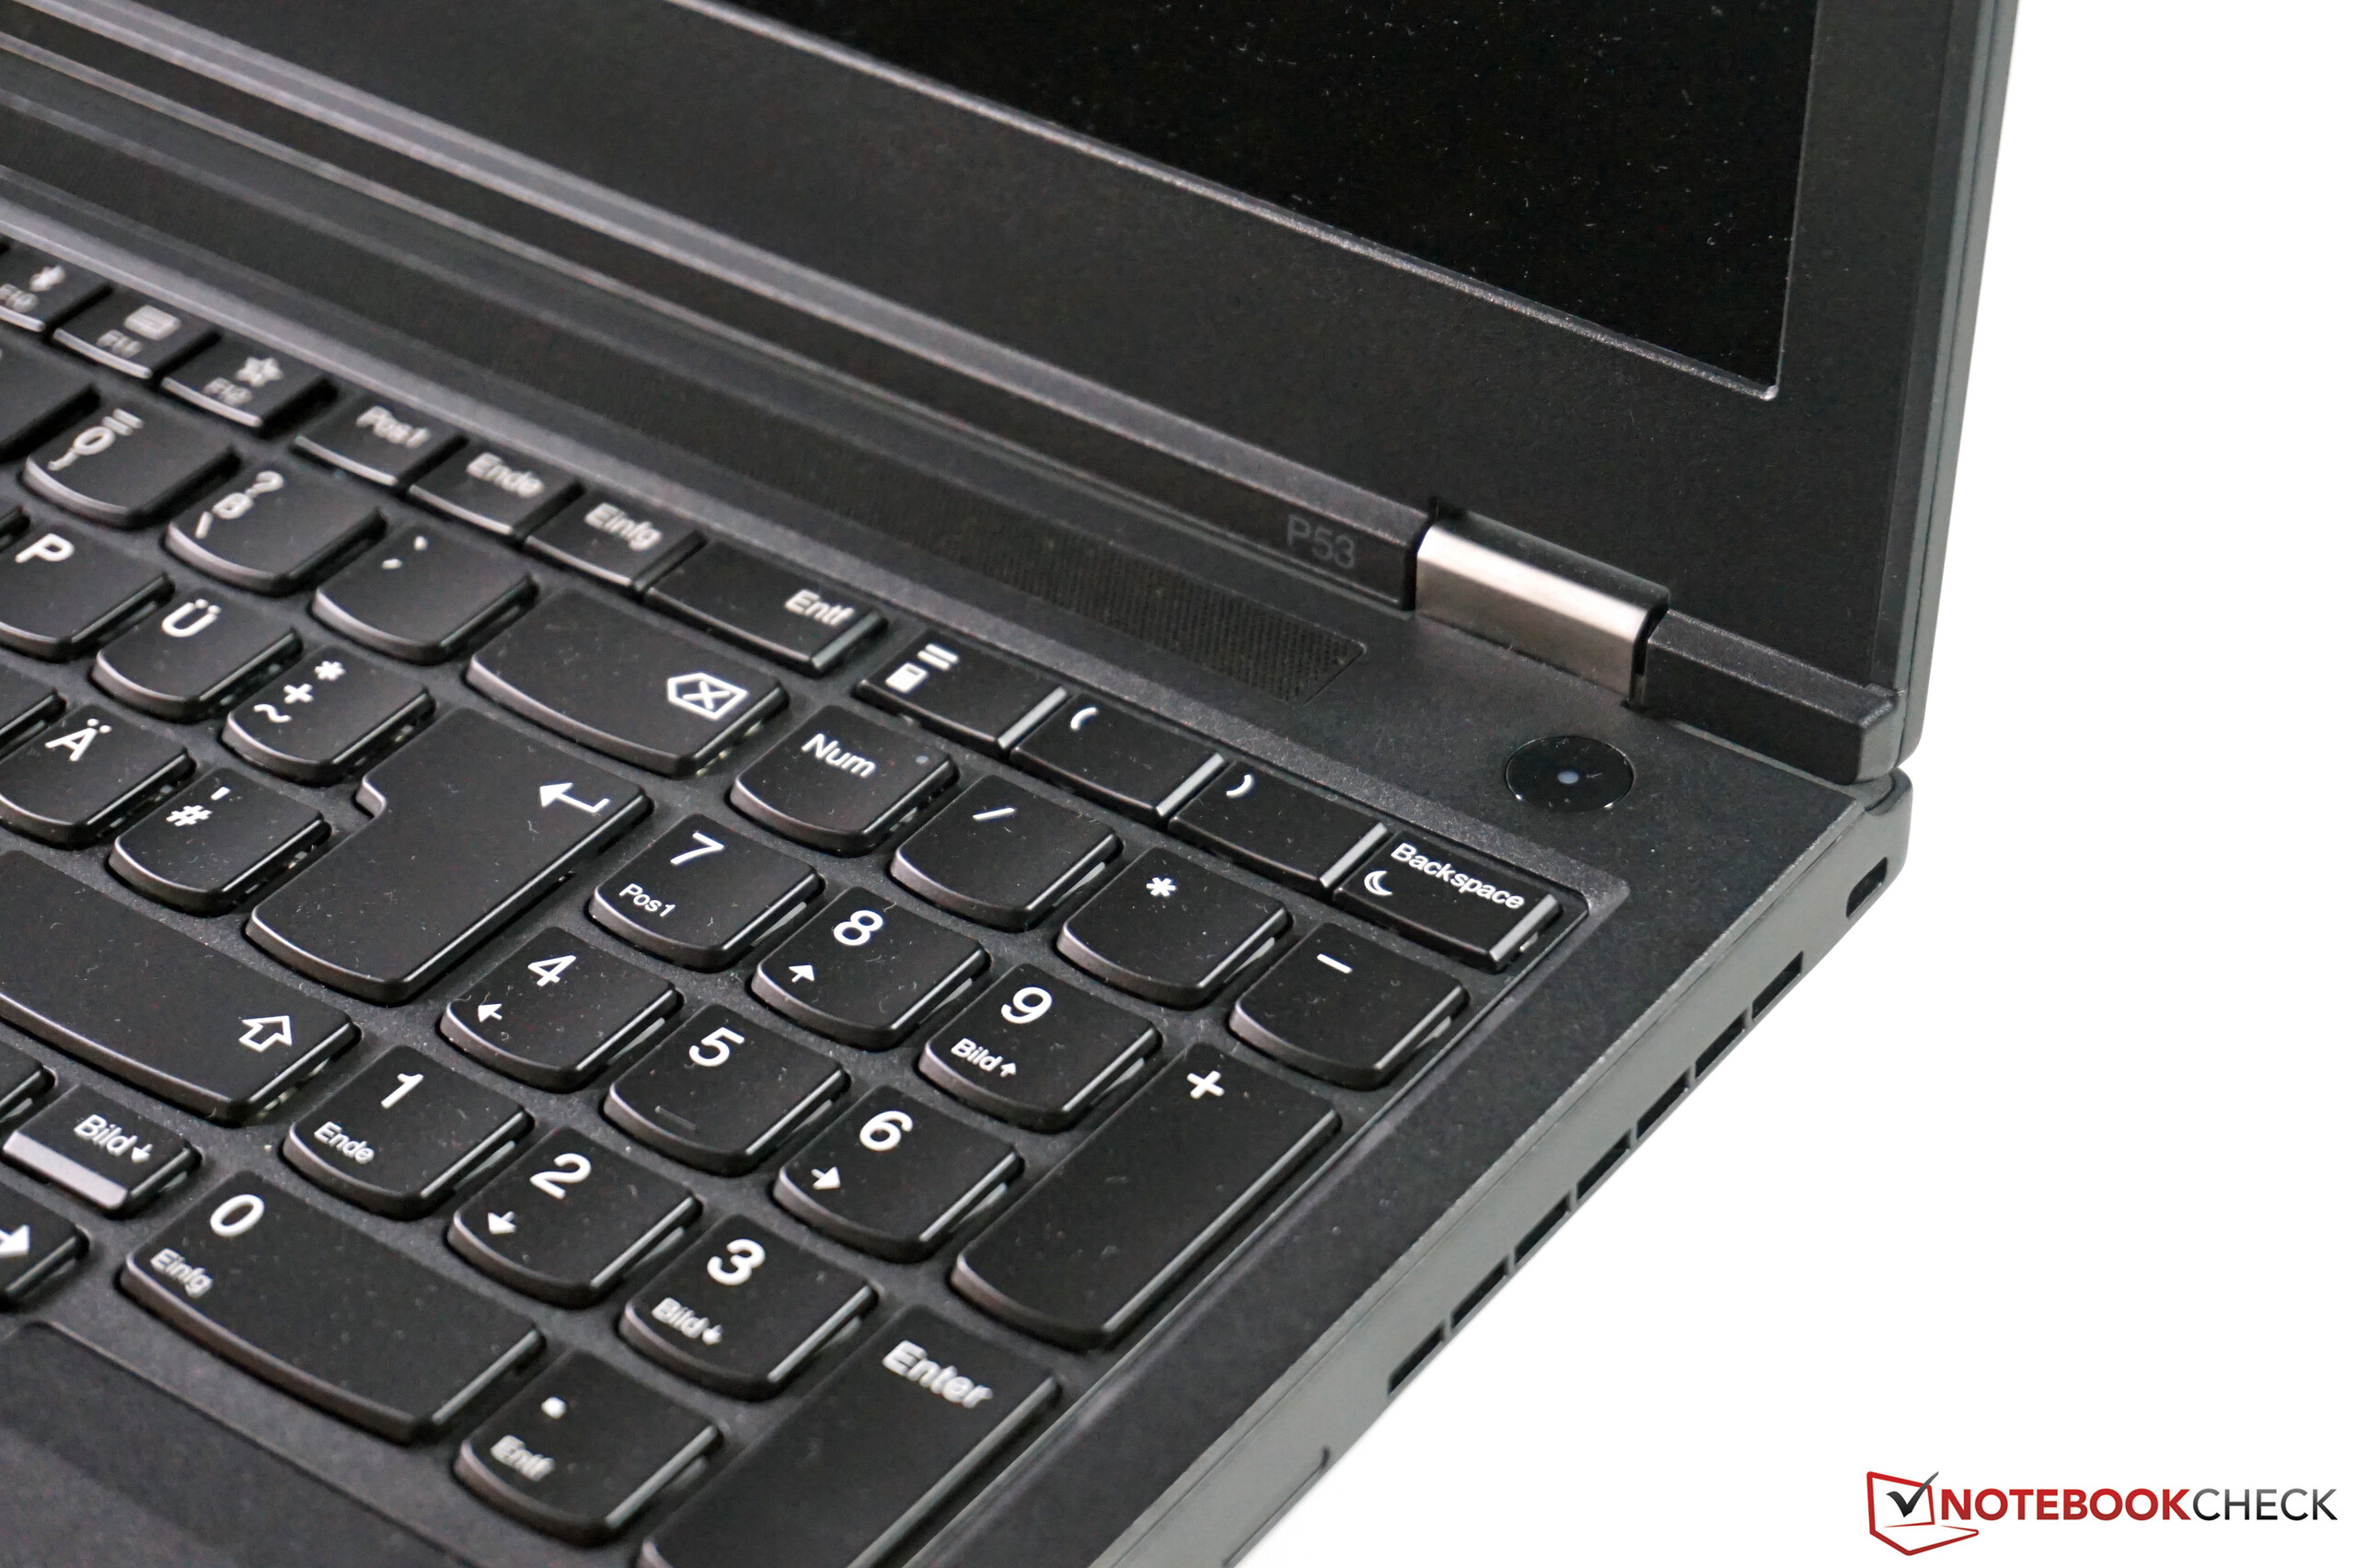
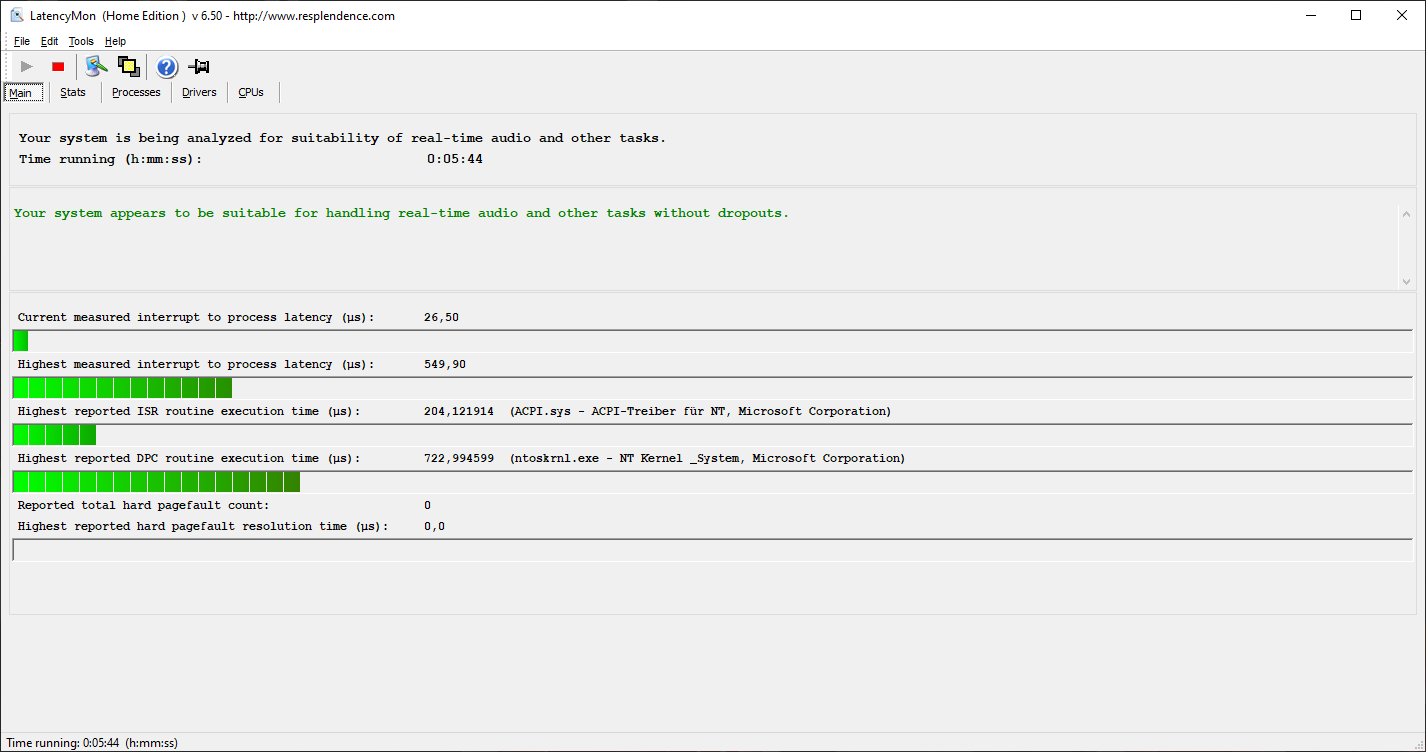
Painel 1080p brilhante, excelentes dispositivos de entrada e uma tonelada de desempenho: O ThinkPad P53 é um produto muito completo, sem fragilidades reais. A única coisa que podemos criticar é a solução de refrigeração que poderia ser um pouco melhor, otimizada para cargas combinadas de CPU e GPU.
A solução de refrigeração também não é perfeita. Gostamos do controle defensivo do ventilador, que impede que os ventiladores girem, mesmo após curtos períodos de estresse. No entanto, a solução de refrigeração não consegue acompanhar as cargas combinadas de CPU e GPU, resultando em desempenho reduzido do processador. Embora os ventiladores silenciosos sejam bons, os usuários que optam por componentes de gama alta nesta faixa de preço, provavelmente desejam que eles possam liberar seu potencial máximo. Estamos convencidos de que a solução de resfriamento é capaz de ser mais eficaz, mesmo que resulte em mais ruído do ventilador. Podemos apenas adivinhar quão bem se desempenham outras configurações do P53 neste momento. Esperamos que os modelos com GPUs menores em particular (como as séries RTX 3000 ou T) façam melhor uso da CPU.
Semelhante a muitos ThinkPads atuais, o P53 da Lenovo recebeu atualizações significativas para opções de telas. Embora a configuração básica ainda inclua um painel IPS com 300 cd/m², agora está disponível um modelo 1080p melhor e mais brilhante. Além disso, a Lenovo oferece duas telas de alta resolução (um painel 4K IPS ou 4K OLED), o que garante que todos os usuários encontrem o modelo que estão procurando.
Essas críticas são um tanto minuciosas, já que o ThinkPad P53 não possui nenhuma fraqueza real e merece sua boa pontuação geral.
Lenovo ThinkPad P53-20QN000YGE
- 11/14/2019 v7 (old)
Andreas Osthoff
Price comparison
