Breve Análise do Apple iPad 10.2 (2020) - Rejuvenescimento do tablet Apple de baixo preço
Avaliação | Data | Modelo | Peso | Altura | Size | Resolução | Preço |
|---|---|---|---|---|---|---|---|
| 88 % v7 (old) | 10/2020 | Apple iPad 10.2 2020 A12 Bionic, A12 Bionic GPU | 495 g | 7.5 mm | 10.20" | 2160x1620 | |
| 85.4 % v7 (old) | 10/2019 | Apple iPad 7 2019 A10 Fusion, A10 Fusion GPU | 483 g | 7.5 mm | 10.20" | 2160x1620 | |
| 87.5 % v7 (old) | 04/2019 | Apple iPad Air 3 2019 A12 Bionic, A12 Bionic GPU | 456 g | 6.1 mm | 10.50" | 2224x1668 | |
| 84.7 % v7 (old) | 10/2020 | Huawei MatePad 10.4 Kirin 810, Mali-G52 MP6 | 460 g | 7.35 mm | 10.40" | 2000x1200 | |
| 83.1 % v7 (old) | 06/2020 | Samsung Galaxy Tab S6 Lite Exynos 9611, Mali-G72 MP3 | 467 g | 7 mm | 10.40" | 2000x1200 |
Comparação de imagens
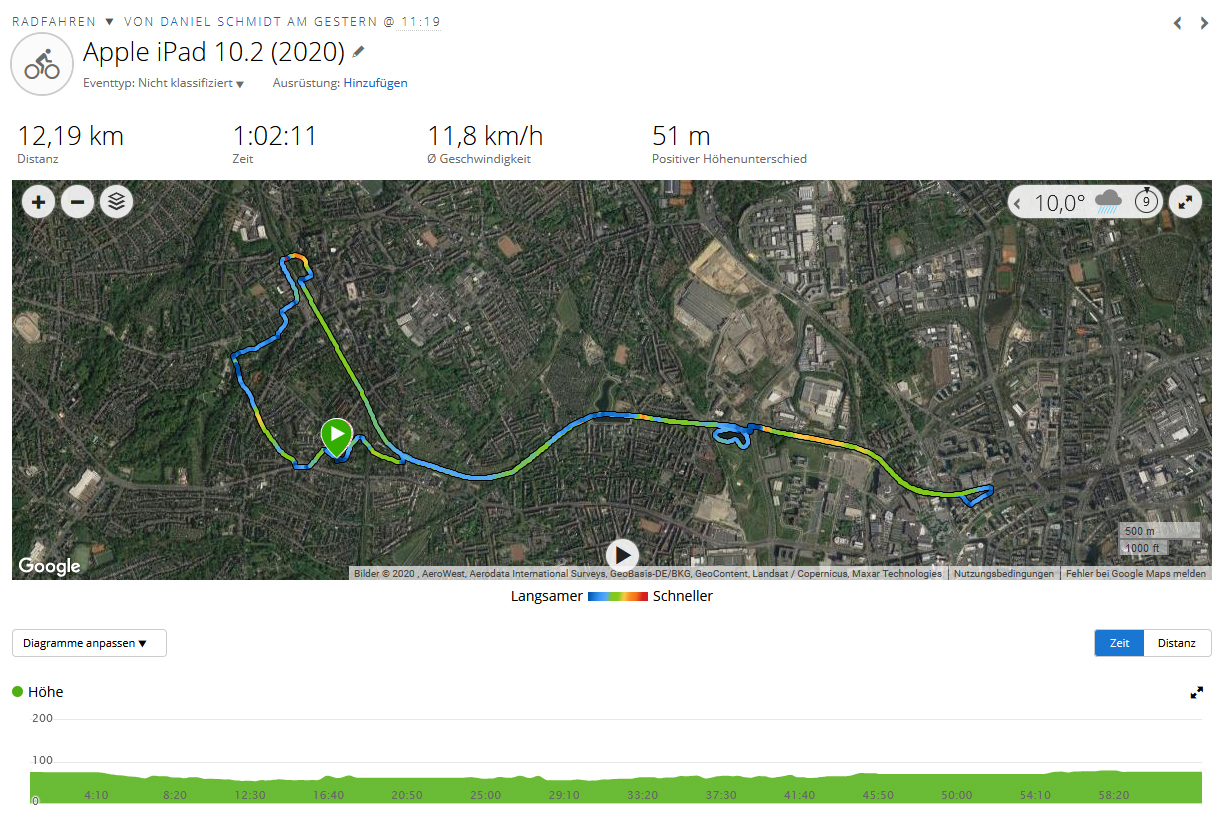
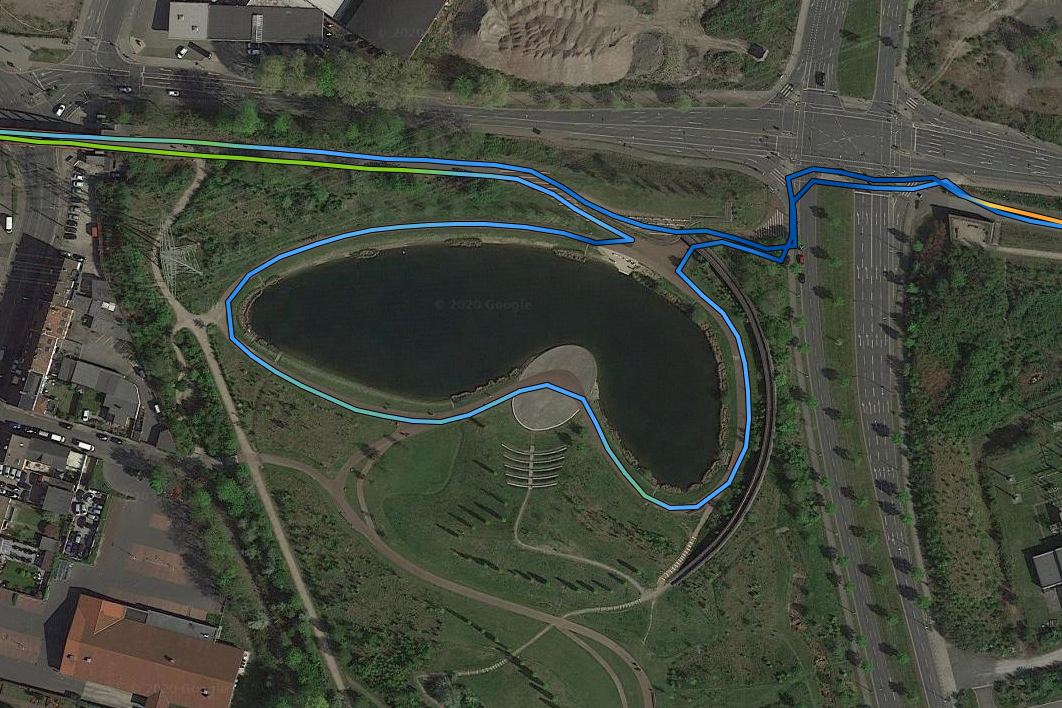
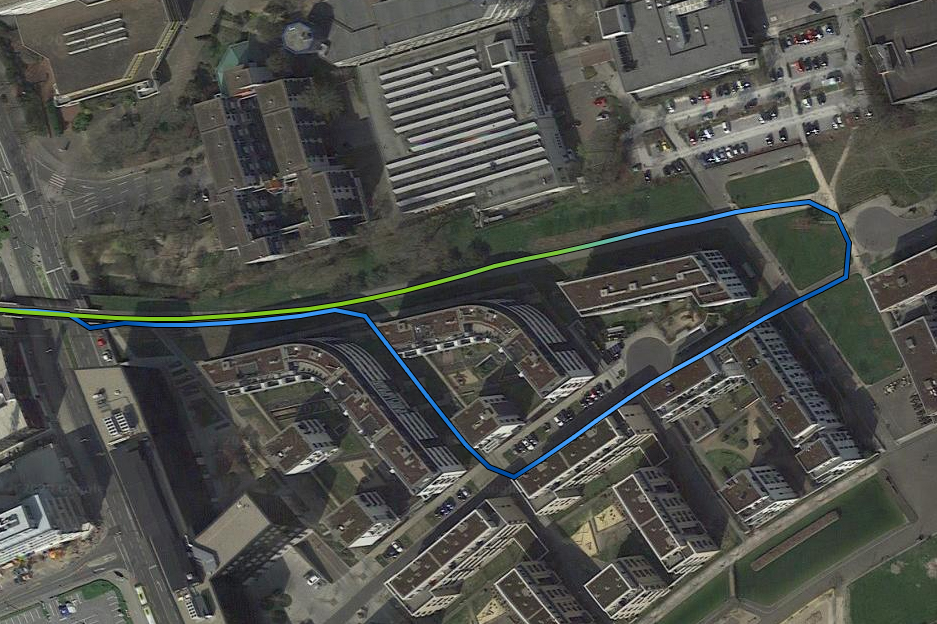
Escolha uma cena e navegue pela primeira imagem. Um clique muda a posição nas telas sensíveis ao toque. Um clique na imagem ampliada abre o original em uma nova janela. A primeira imagem mostra a fotografia em escala do dispositivo de teste.
WeitwinkelWeitwinkelZoom (5-fach)Low-Light


| |||||||||||||||||||||||||
iluminação: 86 %
iluminação com acumulador: 477 cd/m²
Contraste: 954:1 (Preto: 0.5 cd/m²)
ΔE ColorChecker Calman: 2.2 | ∀{0.5-29.43 Ø4.71}
ΔE Greyscale Calman: 3.3 | ∀{0.09-98 Ø4.96}
96.1% sRGB (Calman 2D)
Gamma: 2.23
CCT: 7019 K
| Apple iPad 10.2 2020 IPS, 2160x1620, 10.2" | Apple iPad 7 2019 IPS, 2160x1620, 10.2" | Apple iPad Air 3 2019 IPS, 2224x1668, 10.5" | Huawei MatePad 10.4 IPS, 2000x1200, 10.4" | Samsung Galaxy Tab S6 Lite TFT, 2000x1200, 10.4" | |
|---|---|---|---|---|---|
| Screen | 26% | 16% | -38% | -24% | |
| Brightness middle (cd/m²) | 477 | 499 5% | 515 8% | 511 7% | 503 5% |
| Brightness (cd/m²) | 452 | 470 4% | 483 7% | 472 4% | 477 6% |
| Brightness Distribution (%) | 86 | 87 1% | 90 5% | 85 -1% | 91 6% |
| Black Level * (cd/m²) | 0.5 | 0.49 2% | 0.41 18% | 0.53 -6% | 0.29 42% |
| Contrast (:1) | 954 | 1018 7% | 1256 32% | 964 1% | 1734 82% |
| Colorchecker dE 2000 * | 2.2 | 0.97 56% | 1.6 27% | 4.6 -109% | 4.4 -100% |
| Colorchecker dE 2000 max. * | 5 | 1.98 60% | 4.4 12% | 10.3 -106% | 10.4 -108% |
| Greyscale dE 2000 * | 3.3 | 0.9 73% | 2.8 15% | 6.5 -97% | 7.5 -127% |
| Gamma | 2.23 99% | 2.135 103% | 2.21 100% | 2.19 100% | 2.19 100% |
| CCT | 7019 93% | 6571 99% | 6944 94% | 7553 86% | 7700 84% |
* ... menor é melhor
Cintilação da tela / PWM (modulação por largura de pulso)
| Tela tremeluzindo / PWM não detectado |  | ||
[pwm_comparison] Em comparação: 52 % de todos os dispositivos testados não usam PWM para escurecer a tela. Se PWM foi detectado, uma média de 7748 (mínimo: 5 - máximo: 343500) Hz foi medida. | |||
Exibir tempos de resposta
| ↔ Tempo de resposta preto para branco | ||
|---|---|---|
| 20 ms ... ascensão ↗ e queda ↘ combinadas | ↗ 7.6 ms ascensão | 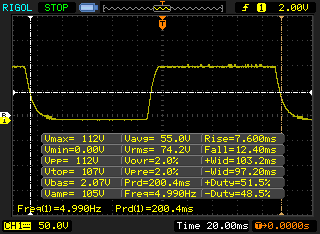 |
| ↘ 12.4 ms queda | ||
| A tela mostra boas taxas de resposta em nossos testes, mas pode ser muito lenta para jogadores competitivos. Em comparação, todos os dispositivos testados variam de 0.1 (mínimo) a 240 (máximo) ms. » 44 % de todos os dispositivos são melhores. Isso significa que o tempo de resposta medido é semelhante à média de todos os dispositivos testados (19.8 ms). | ||
| ↔ Tempo de resposta 50% cinza a 80% cinza | ||
| 39.2 ms ... ascensão ↗ e queda ↘ combinadas | ↗ 18.8 ms ascensão | 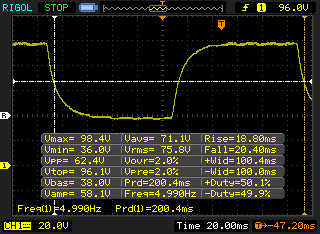 |
| ↘ 20.4 ms queda | ||
| A tela mostra taxas de resposta lentas em nossos testes e será insatisfatória para os jogadores. Em comparação, todos os dispositivos testados variam de 0.165 (mínimo) a 636 (máximo) ms. » 60 % de todos os dispositivos são melhores. Isso significa que o tempo de resposta medido é pior que a média de todos os dispositivos testados (30.9 ms). | ||
| GFXBench 3.1 | |
| on screen Manhattan ES 3.1 Onscreen | |
| Média da turma Tablet (9.2 - 160, n=57, últimos 2 anos) | |
| Média Apple A12 Bionic (48 - 60, n=5) | |
| Apple iPad Air 3 2019 | |
| Apple iPad 10.2 2020 | |
| Huawei MatePad 10.4 | |
| Apple iPad 7 2019 | |
| Samsung Galaxy Tab S6 Lite | |
| 1920x1080 Manhattan ES 3.1 Offscreen | |
| Média da turma Tablet (9.8 - 361, n=57, últimos 2 anos) | |
| Apple iPad Air 3 2019 | |
| Apple iPad 10.2 2020 | |
| Média Apple A12 Bionic (62 - 96, n=5) | |
| Apple iPad 7 2019 | |
| Huawei MatePad 10.4 | |
| Samsung Galaxy Tab S6 Lite | |
| AnTuTu v8 - Total Score | |
| Média Apple A12 Bionic (411764 - 430333, n=2) | |
| Apple iPad 10.2 2020 | |
| Huawei MatePad 10.4 | |
| Samsung Galaxy Tab S6 Lite | |
| Jetstream 2 - 2.0 Total | |
| Média da turma Tablet (35.8 - 420, n=55, últimos 2 anos) | |
| Apple iPad 10.2 2020 (Safari Mobile 14) | |
| Média Apple A12 Bionic (108.4 - 123.8, n=4) | |
| Apple iPad Air 3 2019 (Safari Mobile 12) | |
| Apple iPad 7 2019 (Safari 13) | |
| Huawei MatePad 10.4 (Huawei Browser 10.1.4.303) | |
| Samsung Galaxy Tab S6 Lite (Chrome 80.0.3987.99) | |
| JetStream 1.1 - 1.1 Total | |
| Média Apple A12 Bionic (267 - 273, n=4) | |
| Apple iPad 10.2 2020 (Safari Mobile 14) | |
| Apple iPad 7 2019 (Safari 13) | |
| Huawei MatePad 10.4 (Huawei Browser 10.1.4.303) | |
| Samsung Galaxy Tab S6 Lite (Chrome 80.0.3987.99) | |
| WebXPRT 3 - Overall | |
| Média da turma Tablet (168 - 520, n=10, últimos 2 anos) | |
| Apple iPad 10.2 2020 (Safari Mobile 14) | |
| Média Apple A12 Bionic (155 - 166, n=6) | |
| Apple iPad Air 3 2019 (Safari Mobile 12) | |
| Apple iPad 7 2019 (Safari 13) | |
| Huawei MatePad 10.4 (Huawei Browser 10.1.4.303) | |
| Samsung Galaxy Tab S6 Lite (Chrome 80.0.3987.99) | |
| Speedometer 2.0 - Result 2.0 | |
| Média da turma Tablet (6.8 - 790, n=33, últimos 2 anos) | |
| Apple iPad 10.2 2020 (Safari Mobile 14) | |
| Média Apple A12 Bionic (123 - 139, n=4) | |
| Apple iPad Air 3 2019 (Safari Mobile 12) | |
| Apple iPad 7 2019 (Safari 13) | |
| Huawei MatePad 10.4 (Huawei Browser 10.1.4.303) | |
| Samsung Galaxy Tab S6 Lite (Chrome 80.0.3987.99) | |
| Octane V2 - Total Score | |
| Média da turma Tablet (1633 - 138481, n=71, últimos 2 anos) | |
| Média Apple A12 Bionic (41367 - 43280, n=6) | |
| Apple iPad Air 3 2019 (Safari Mobile 12) | |
| Apple iPad 10.2 2020 (Safari Mobile 14) | |
| Apple iPad 7 2019 (Safari 13) | |
| Huawei MatePad 10.4 (Huawei Browser 10.1.4.303) | |
| Samsung Galaxy Tab S6 Lite (Chrome 80.0.3987.99) | |
| Mozilla Kraken 1.1 - Total | |
| Samsung Galaxy Tab S6 Lite (Chrome 80.0.3987.99) | |
| Huawei MatePad 10.4 (Huawei Browser 10.1.4.303) | |
| Média da turma Tablet (243 - 16233, n=65, últimos 2 anos) | |
| Apple iPad 7 2019 (Safari 13) | |
| Apple iPad 10.2 2020 (Safari Mobile 14) | |
| Apple iPad Air 3 2019 (Safari Mobile 12) | |
| Média Apple A12 Bionic (603 - 653, n=6) | |
* ... menor é melhor
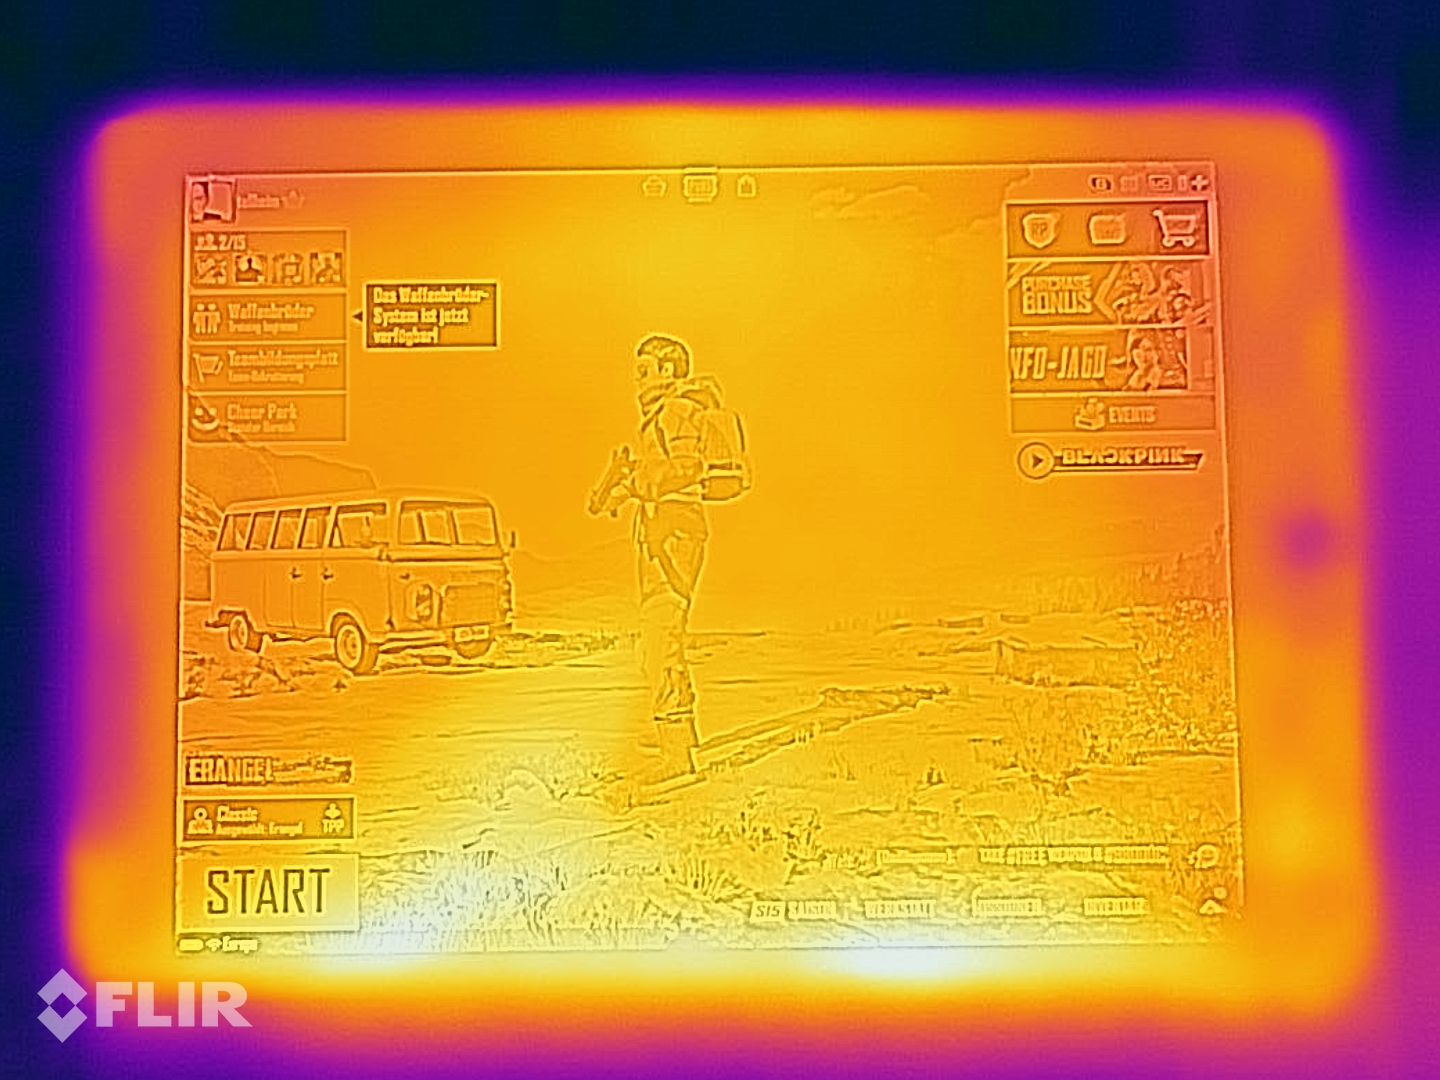
Gaming
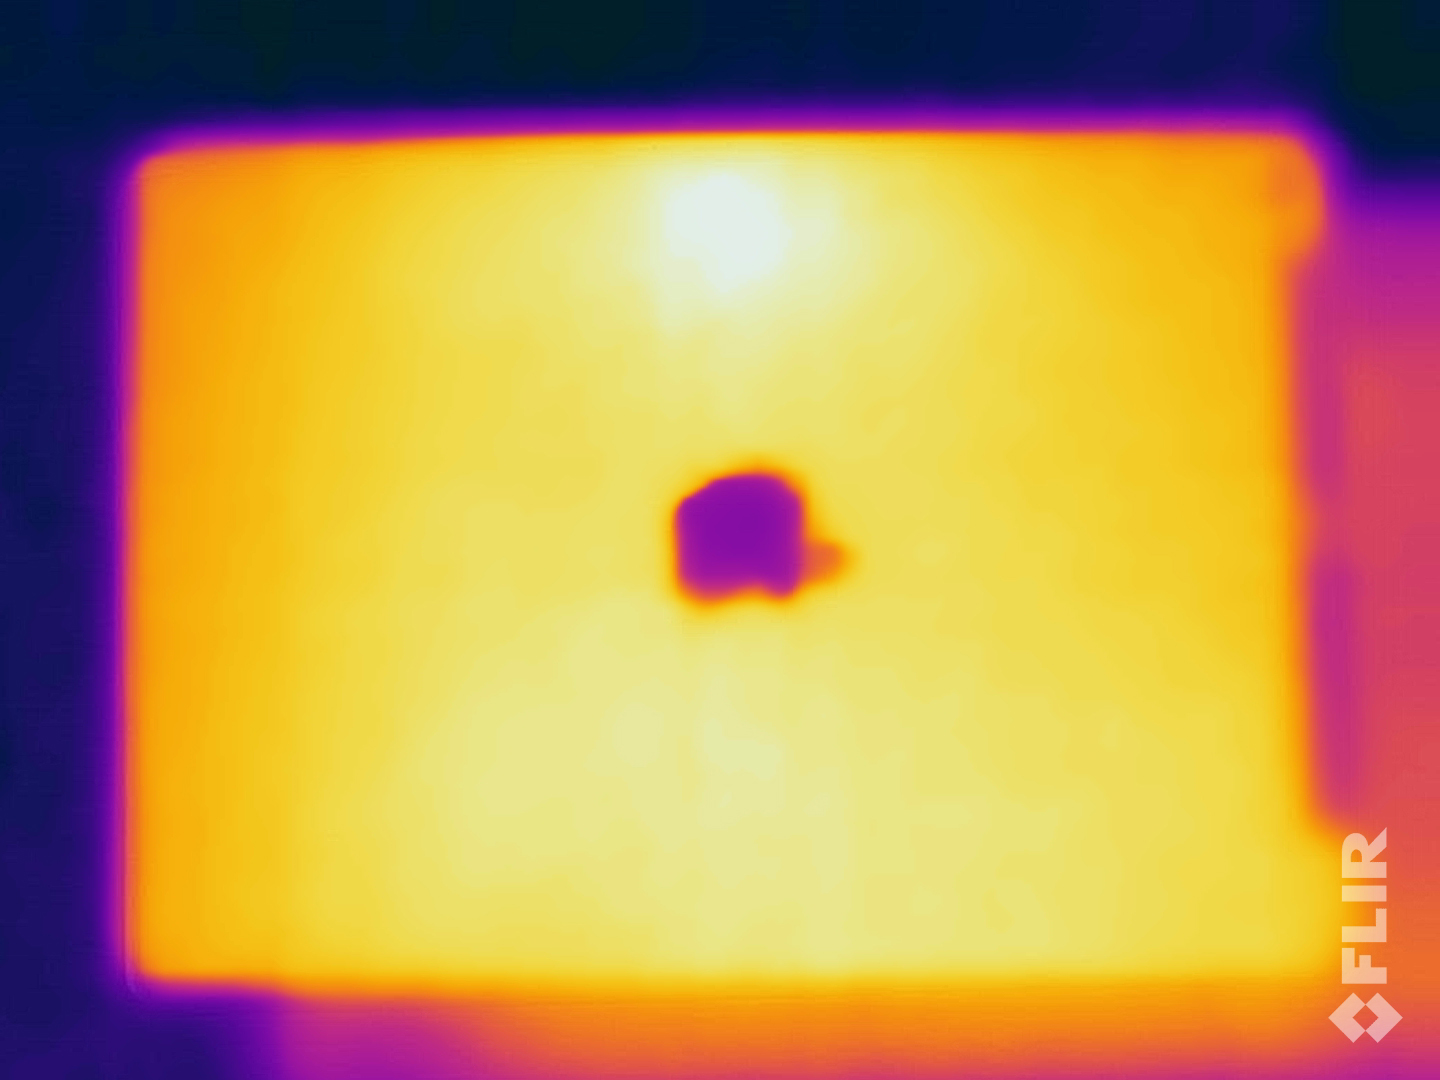
(+) A temperatura máxima no lado superior é 32.3 °C / 90 F, em comparação com a média de 33.7 °C / 93 F , variando de 20.7 a 53.2 °C para a classe Tablet.
(+) A parte inferior aquece até um máximo de 30.4 °C / 87 F, em comparação com a média de 33.2 °C / 92 F
(+) Em uso inativo, a temperatura média para o lado superior é 26.1 °C / 79 F, em comparação com a média do dispositivo de 30 °C / ### class_avg_f### F.
Apple iPad 10.2 2020 análise de áudio
(+) | os alto-falantes podem tocar relativamente alto (###valor### dB)
Graves 100 - 315Hz
(-) | quase nenhum baixo - em média 17.3% menor que a mediana
(+) | o baixo é linear (4.1% delta para a frequência anterior)
Médios 400 - 2.000 Hz
(±) | médios reduzidos - em média 5.6% menor que a mediana
(+) | médios são lineares (4.2% delta para frequência anterior)
Altos 2 - 16 kHz
(±) | máximos mais altos - em média 7.1% maior que a mediana
(+) | os máximos são lineares (6.9% delta da frequência anterior)
Geral 100 - 16.000 Hz
(±) | a linearidade do som geral é média (15.8% diferença em relação à mediana)
Comparado com a mesma classe
» 36% de todos os dispositivos testados nesta classe foram melhores, 5% semelhantes, 59% piores
» O melhor teve um delta de 7%, a média foi 20%, o pior foi 129%
Comparado com todos os dispositivos testados
» 24% de todos os dispositivos testados foram melhores, 5% semelhantes, 70% piores
» O melhor teve um delta de 4%, a média foi 23%, o pior foi 134%
Huawei MatePad 10.4 análise de áudio
(+) | os alto-falantes podem tocar relativamente alto (###valor### dB)
Graves 100 - 315Hz
(-) | quase nenhum baixo - em média 16.2% menor que a mediana
(±) | a linearidade dos graves é média (9.9% delta para a frequência anterior)
Médios 400 - 2.000 Hz
(+) | médios equilibrados - apenas 3.1% longe da mediana
(+) | médios são lineares (3% delta para frequência anterior)
Altos 2 - 16 kHz
(+) | agudos equilibrados - apenas 2.3% longe da mediana
(+) | os máximos são lineares (3.6% delta da frequência anterior)
Geral 100 - 16.000 Hz
(+) | o som geral é linear (12.8% diferença em relação à mediana)
Comparado com a mesma classe
» 22% de todos os dispositivos testados nesta classe foram melhores, 4% semelhantes, 75% piores
» O melhor teve um delta de 7%, a média foi 20%, o pior foi 129%
Comparado com todos os dispositivos testados
» 12% de todos os dispositivos testados foram melhores, 3% semelhantes, 85% piores
» O melhor teve um delta de 4%, a média foi 23%, o pior foi 134%
| desligado | |
| Ocioso | |
| Carga |
|
Key:
min: | |
| Apple iPad 10.2 2020 8827 mAh | Apple iPad 7 2019 mAh | Apple iPad Air 3 2019 8134 mAh | Huawei MatePad 10.4 7250 mAh | Samsung Galaxy Tab S6 Lite 7040 mAh | |
|---|---|---|---|---|---|
| Power Consumption | -15% | 4% | 31% | 30% | |
| Idle Minimum * (Watt) | 2.12 | 2.2 -4% | 2.18 -3% | 1.29 39% | 1.21 43% |
| Idle Average * (Watt) | 6.43 | 6.7 -4% | 6.4 -0% | 4.57 29% | 4.24 34% |
| Idle Maximum * (Watt) | 6.69 | 8.2 -23% | 6.43 4% | 4.64 31% | 4.34 35% |
| Load Average * (Watt) | 8.17 | 11.3 -38% | 7.48 8% | 6.01 26% | 6.99 14% |
| Load Maximum * (Watt) | 11.84 | 12.5 -6% | 10.65 10% | 8.06 32% | 8.79 26% |
* ... menor é melhor
| Apple iPad 10.2 2020 8827 mAh | Apple iPad 7 2019 mAh | Apple iPad Air 3 2019 8134 mAh | Huawei MatePad 10.4 7250 mAh | Samsung Galaxy Tab S6 Lite 7040 mAh | |
|---|---|---|---|---|---|
| Duração da bateria | -19% | -19% | 26% | 7% | |
| Reader / Idle (h) | 37.4 | 24.8 -34% | 25 -33% | 33.7 -10% | 35.3 -6% |
| H.264 (h) | 15.6 | 13.4 -14% | 11.4 -27% | 16.7 7% | 15.8 1% |
| WiFi v1.3 (h) | 13 | 11.8 -9% | 12.3 -5% | 19.8 52% | 13.2 2% |
| Load (h) | 4 | 3.3 -17% | 3.6 -10% | 6.1 53% | 5.2 30% |
Pro
Contra
Veredicto - Não há muita novidade, mas ainda está forte

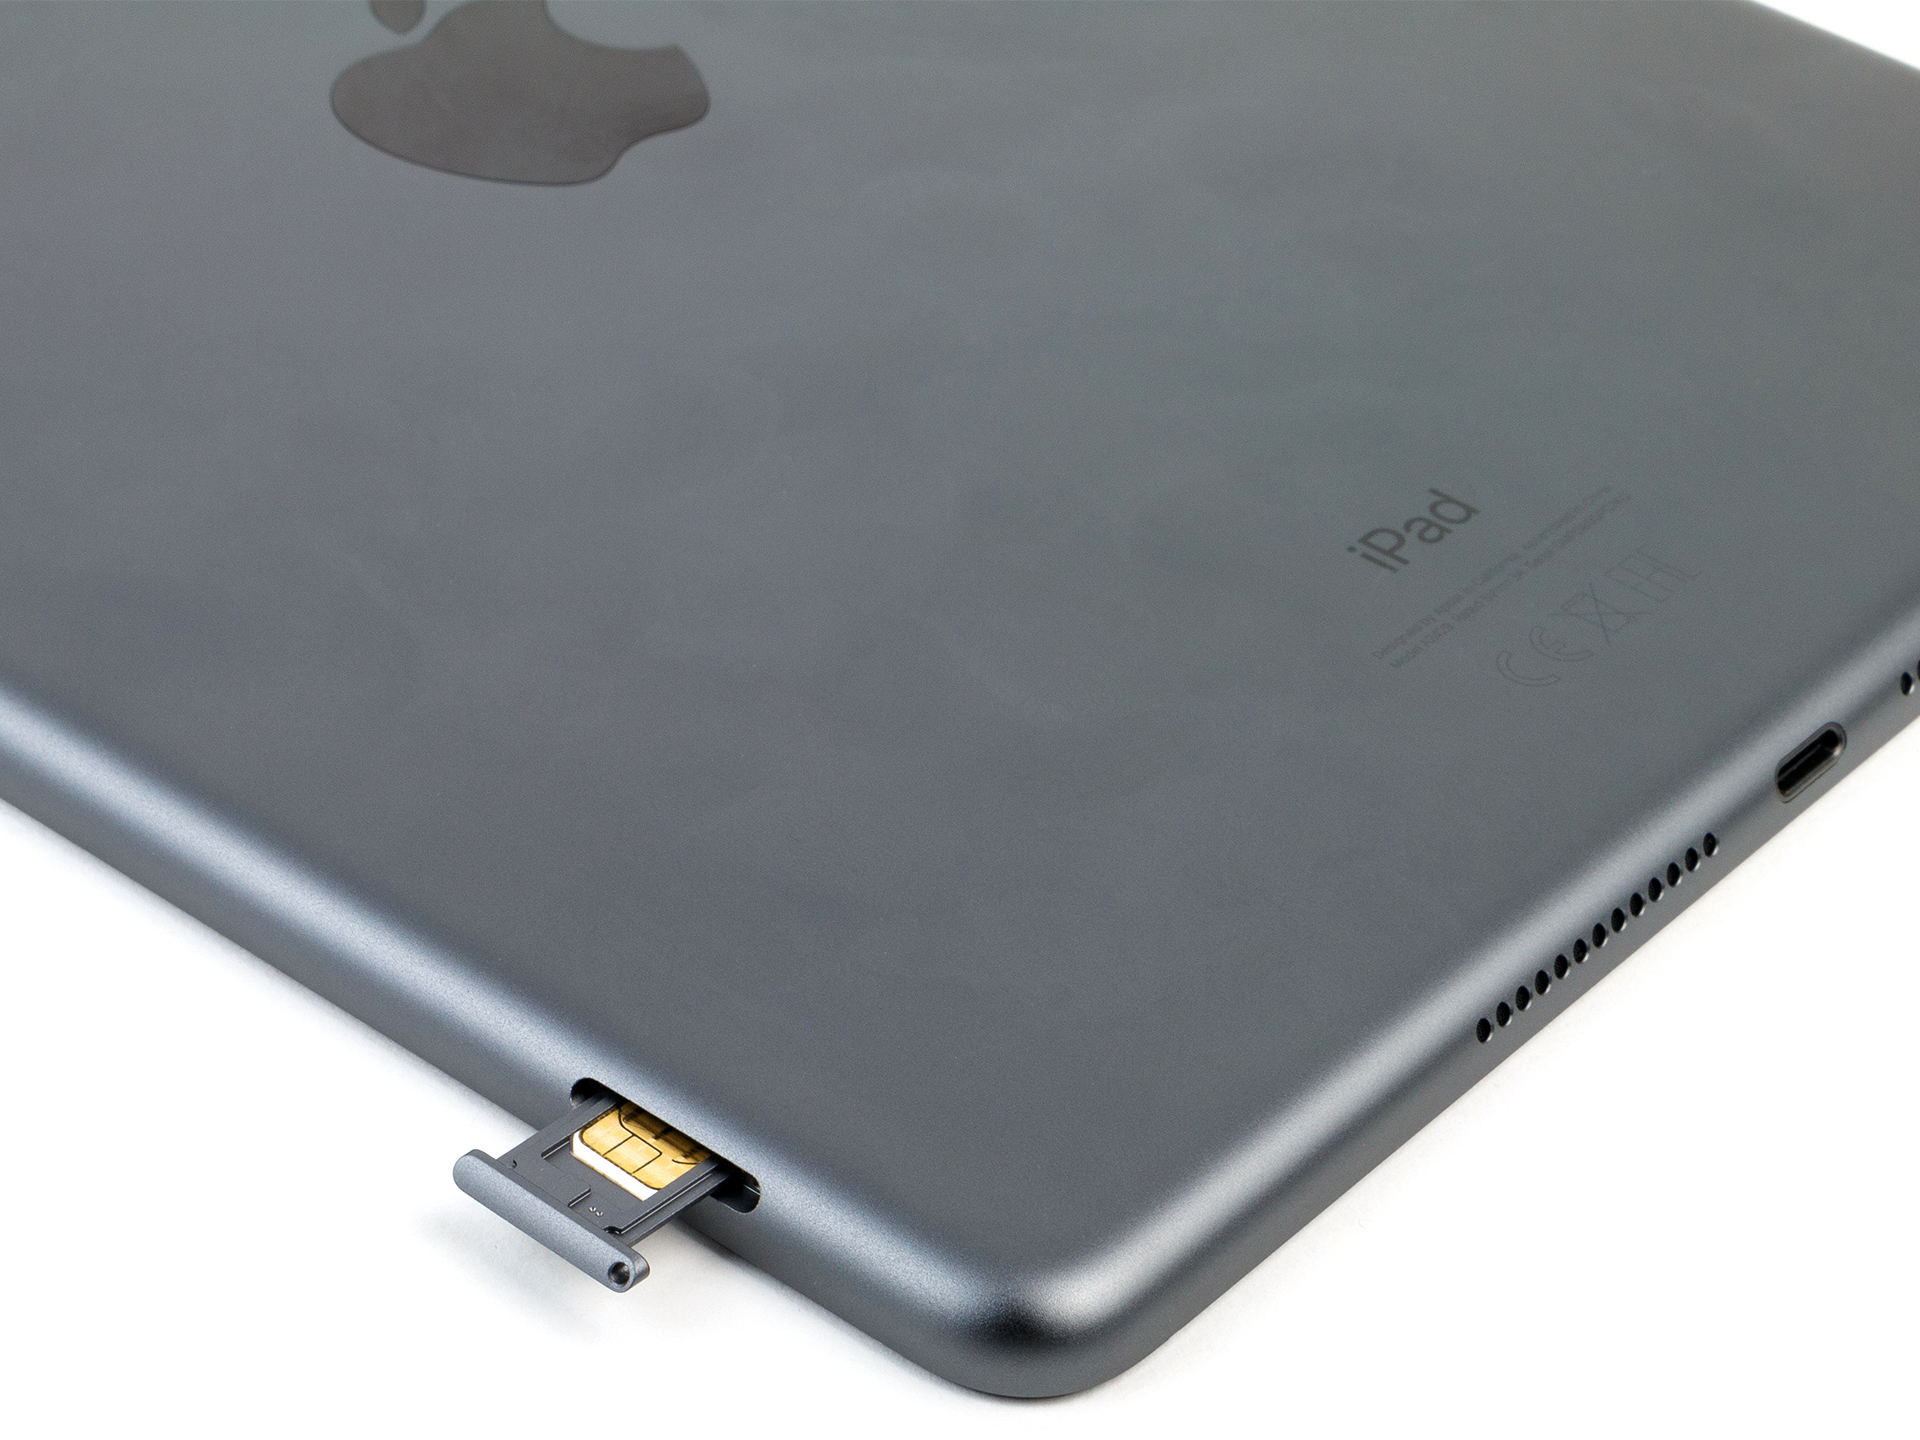
O iPad 2020 não é um grande salto em frente na série iPad 10.2. Além de um SoC mais poderoso, há um novo carregador USB-C 20-W (iPads da geração anterior fornecidos com adaptadores de energia USB-A). Aqueles que esperavam que a Apple substituísse a porta Lightning por uma porta USB Type-C ficarão desapontados. Presumivelmente, a Apple decidiu ficar com a porta Lightning para manter baixo o preço do iPad básico.
O iPad 10.2 ainda é o tablet mais poderoso em sua faixa de preço.
Além disso, mudar para uma porta USB-C significaria que acessórios mais antigos, como o Apple Pencil de primeira geração, não seriam mais utilizáveis. Em vez disso, os compradores podem continuar usando acessórios feitos para Pads de gerações anteriores, que não são apenas fáceis de usar, mas também estão em linha com o impulso de sustentabilidade da Apple. Quando comparado ao predecessor, o iPad 2020 tem uma pegada de carbono menor.
No entanto, a tela um pouco pior e o chip Bluetooth 4.2 merecem algumas críticas. No entanto, isso não influencia o desempenho do tablet. Você pode usar o iPad para estudar, trabalhar, jogar e fazer streaming de filmes. Tudo é possível com o iPad.
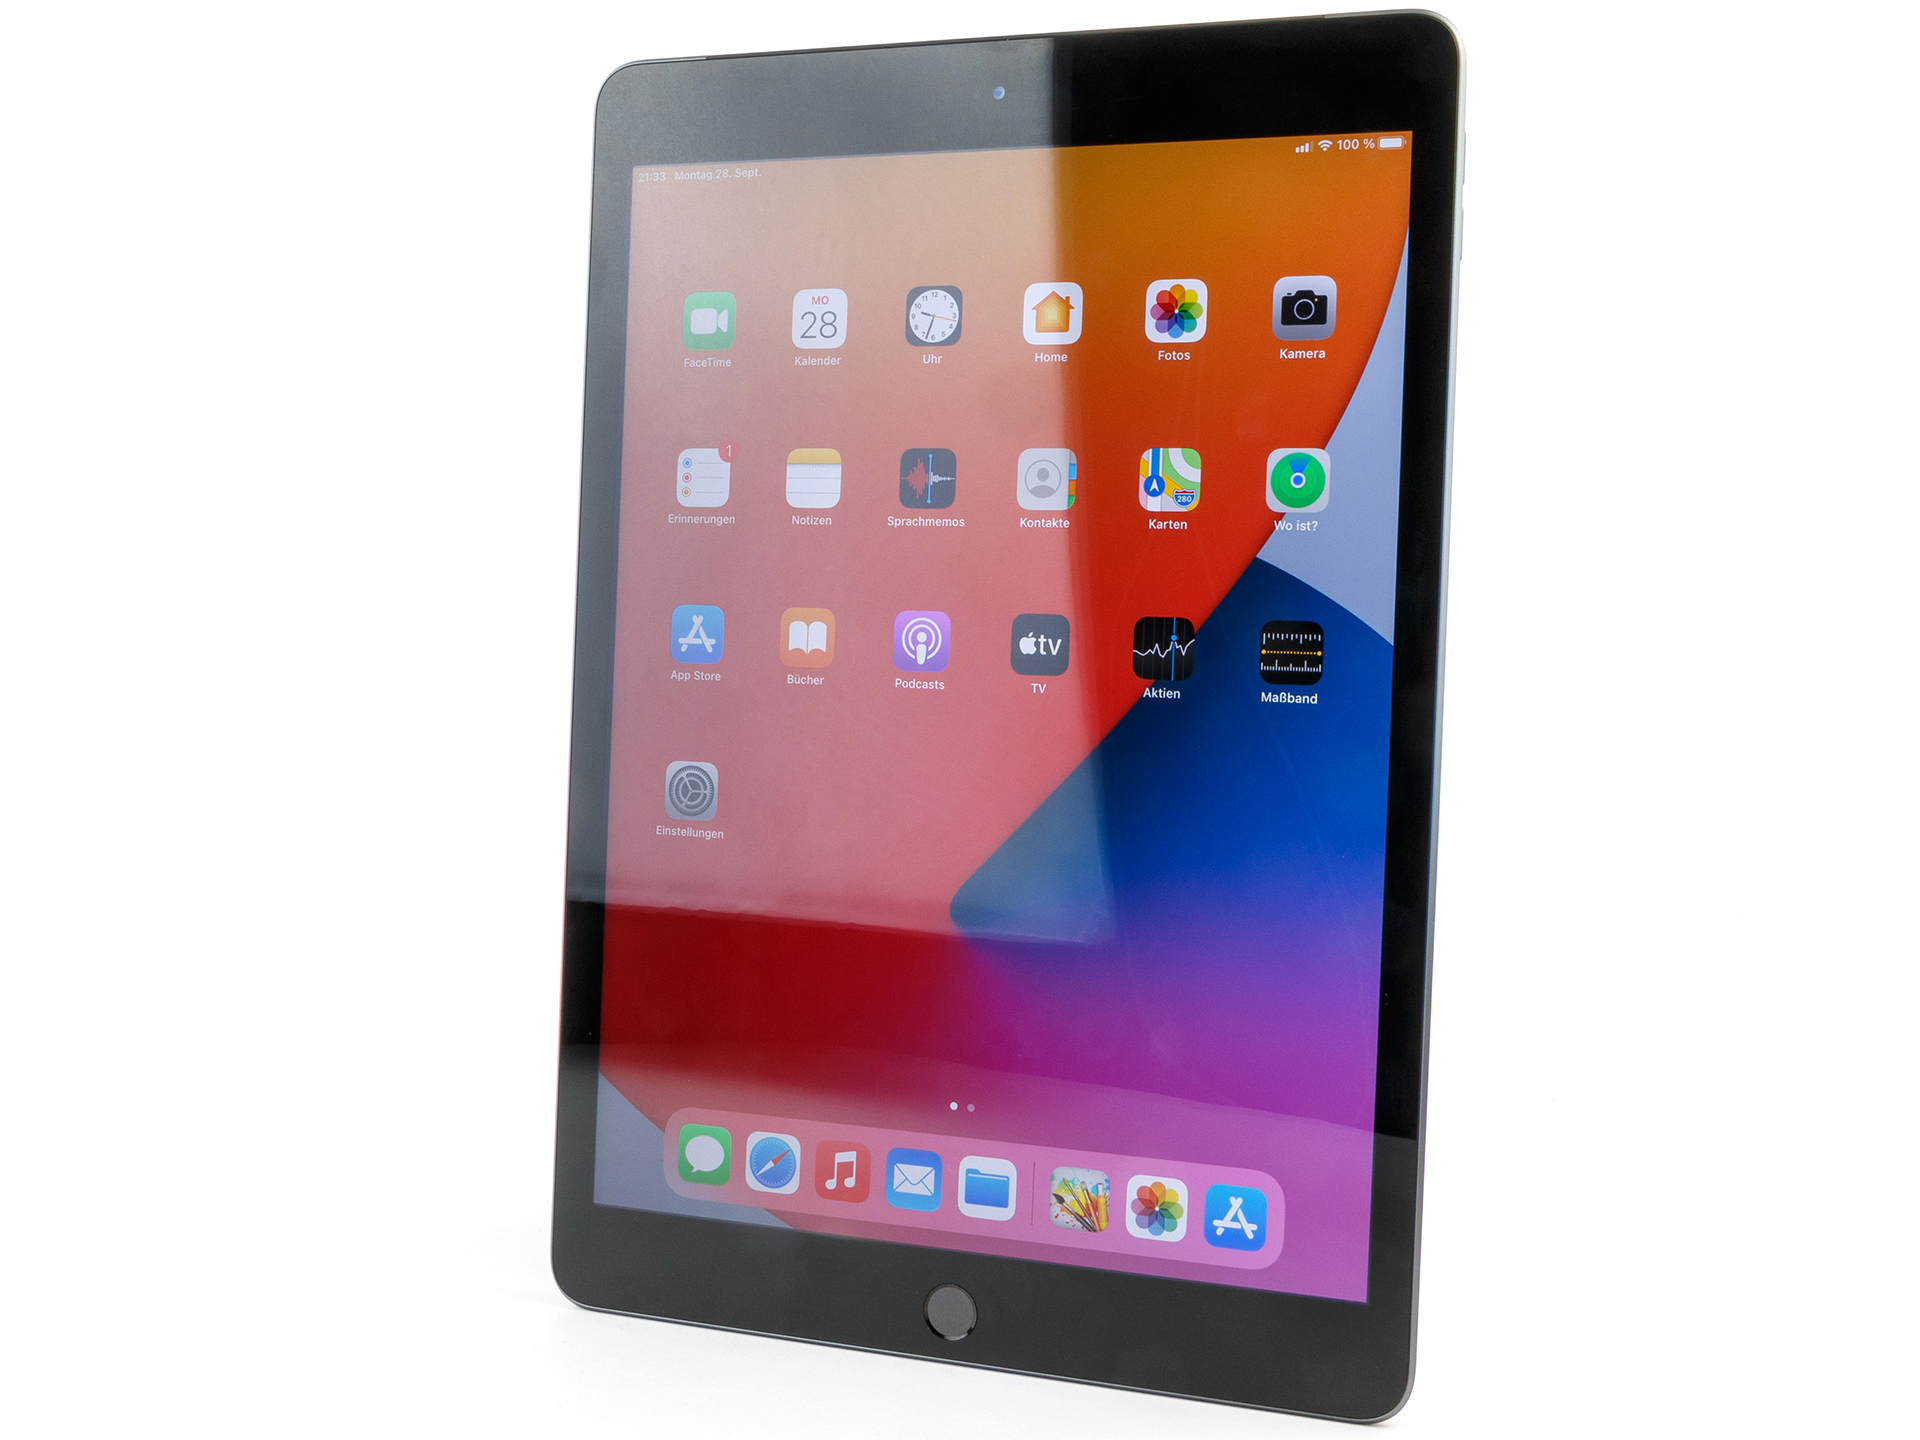
Apple iPad 10.2 2020
- 10/16/2020 v7 (old)
Daniel Schmidt