Breve Análise do Tablet Apple iPad Air (2019)


| |||||||||||||||||||||||||
iluminação: 90 %
iluminação com acumulador: 515 cd/m²
Contraste: 1256:1 (Preto: 0.41 cd/m²)
ΔE ColorChecker Calman: 1.6 | ∀{0.5-29.43 Ø4.72}
ΔE Greyscale Calman: 2.8 | ∀{0.09-98 Ø4.97}
99.7% sRGB (Calman 2D)
Gamma: 2.21
CCT: 6944 K
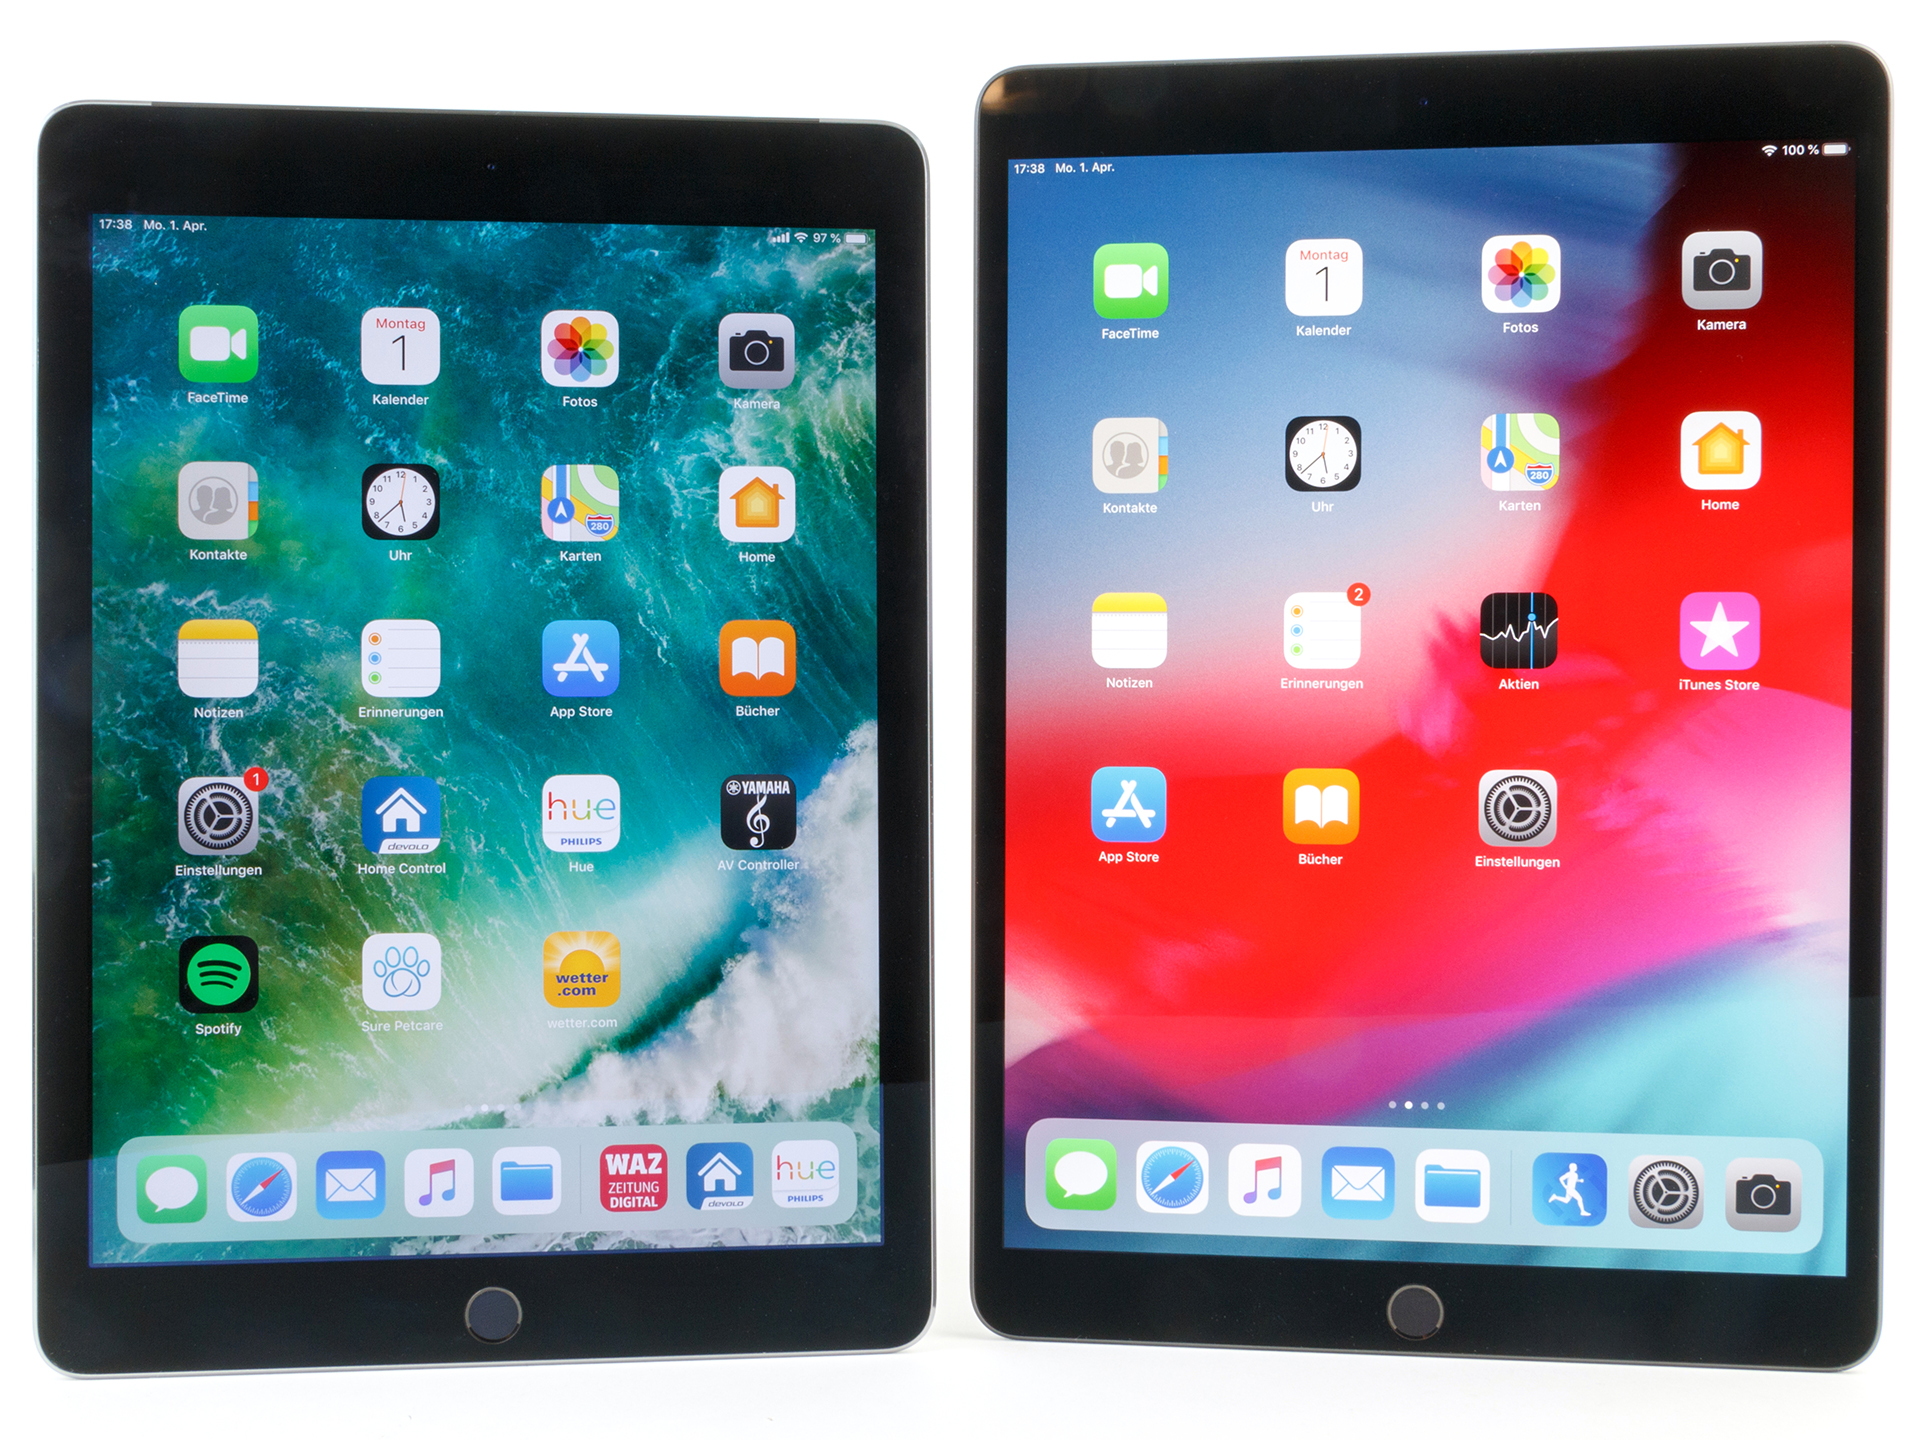
| Apple iPad Air 3 2019 IPS, 2224x1668, 10.5" | Apple iPad Air 2 2014 IPS, 2048x1536, 9.7" | Apple iPad 6 2018 IPS, 2048x1536, 9.7" | Apple iPad Pro 10.5 2017 IPS, 2224x1668, 10.5" | Huawei MediaPad M5 10.8 Pro IPS, 2560x1600, 10.8" | Samsung Galaxy Tab S4 Super AMOLED, 2560x1600, 10.5" | |
|---|---|---|---|---|---|---|
| Screen | -27% | 6% | 9% | -112% | -12% | |
| Brightness middle (cd/m²) | 515 | 423 -18% | 530 3% | 634 23% | 384 -25% | 474 -8% |
| Brightness (cd/m²) | 483 | 427 -12% | 513 6% | 625 29% | 360 -25% | 477 -1% |
| Brightness Distribution (%) | 90 | 92 2% | 92 2% | 87 -3% | 84 -7% | 91 1% |
| Black Level * (cd/m²) | 0.41 | 0.61 -49% | 0.61 -49% | 0.39 5% | 0.8 -95% | |
| Contrast (:1) | 1256 | 693 -45% | 869 -31% | 1626 29% | 480 -62% | |
| Colorchecker dE 2000 * | 1.6 | 2.86 -79% | 1.2 25% | 1.9 -19% | 6.83 -327% | 2.5 -56% |
| Colorchecker dE 2000 max. * | 4.4 | 3.2 27% | 3.9 11% | 12.7 -189% | 5.8 -32% | |
| Greyscale dE 2000 * | 2.8 | 2.37 15% | 1 64% | 2.8 -0% | 7.5 -168% | 2.1 25% |
| Gamma | 2.21 100% | 2.43 91% | 2.28 96% | 2.26 97% | 2.199 100% | 2.08 106% |
| CCT | 6944 94% | 6941 94% | 6588 99% | 7027 93% | 8544 76% | 6281 103% |
| Color Space (Percent of AdobeRGB 1998) (%) | 88 |
* ... menor é melhor
Cintilação da tela / PWM (modulação por largura de pulso)
| Tela tremeluzindo / PWM não detectado | 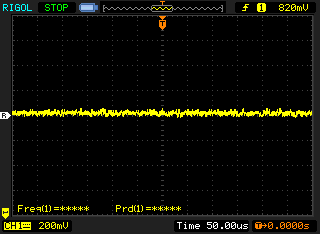 | ||
[pwm_comparison] Em comparação: 52 % de todos os dispositivos testados não usam PWM para escurecer a tela. Se PWM foi detectado, uma média de 7753 (mínimo: 5 - máximo: 343500) Hz foi medida. | |||
Exibir tempos de resposta
| ↔ Tempo de resposta preto para branco | ||
|---|---|---|
| 28 ms ... ascensão ↗ e queda ↘ combinadas | ↗ 10.4 ms ascensão | 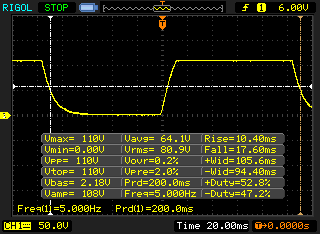 |
| ↘ 17.6 ms queda | ||
| A tela mostra taxas de resposta relativamente lentas em nossos testes e pode ser muito lenta para os jogadores. Em comparação, todos os dispositivos testados variam de 0.1 (mínimo) a 240 (máximo) ms. » 71 % de todos os dispositivos são melhores. Isso significa que o tempo de resposta medido é pior que a média de todos os dispositivos testados (19.8 ms). | ||
| ↔ Tempo de resposta 50% cinza a 80% cinza | ||
| 58 ms ... ascensão ↗ e queda ↘ combinadas | ↗ 27.6 ms ascensão | 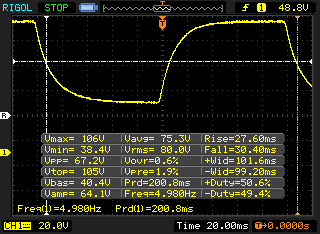 |
| ↘ 30.4 ms queda | ||
| A tela mostra taxas de resposta lentas em nossos testes e será insatisfatória para os jogadores. Em comparação, todos os dispositivos testados variam de 0.165 (mínimo) a 636 (máximo) ms. » 94 % de todos os dispositivos são melhores. Isso significa que o tempo de resposta medido é pior que a média de todos os dispositivos testados (31 ms). | ||
| AnTuTu v7 - Total Score | |
| Apple iPad Air 3 2019 | |
| Média Apple A12 Bionic (302955 - 370545, n=4) | |
| Samsung Galaxy Tab S4 | |
| Huawei MediaPad M5 10.8 Pro | |
| Apple iPad 6 2018 | |
| Basemark ES 3.1 / Metal - offscreen Overall Score | |
| Média da turma Tablet (255 - 5784, n=6, últimos 2 anos) | |
| Apple iPad Air 3 2019 | |
| Média Apple A12 Bionic (2407 - 2873, n=6) | |
| Apple iPad 6 2018 | |
| Apple iPad Air 2 2014 | |
| Jetstream 2 - 2.0 Total | |
| Média da turma Tablet (35.8 - 420, n=55, últimos 2 anos) | |
| Média Apple A12 Bionic (108.4 - 123.8, n=4) | |
| Apple iPad Air 3 2019 (Safari Mobile 12) | |
| WebXPRT 3 - Overall | |
| Média da turma Tablet (168 - 520, n=10, últimos 2 anos) | |
| Média Apple A12 Bionic (155 - 166, n=6) | |
| Apple iPad Air 3 2019 (Safari Mobile 12) | |
| Apple iPad 6 2018 (Safari Mobile 10) | |
| Samsung Galaxy Tab S4 (Samsung Browser 8.0) | |
| Huawei MediaPad M5 10.8 Pro (Chrome 68.0.3440.91) | |
| Speedometer 2.0 - Result 2.0 | |
| Média da turma Tablet (6.8 - 790, n=33, últimos 2 anos) | |
| Média Apple A12 Bionic (123 - 139, n=4) | |
| Apple iPad Air 3 2019 (Safari Mobile 12) | |
| Apple iPad 6 2018 (IOS 12.1.1) | |
| Octane V2 - Total Score | |
| Média da turma Tablet (1633 - 138481, n=69, últimos 2 anos) | |
| Média Apple A12 Bionic (41367 - 43280, n=6) | |
| Apple iPad Air 3 2019 (Safari Mobile 12) | |
| Apple iPad Pro 10.5 2017 (Safari Mobile 10) | |
| Apple iPad 6 2018 (Safari Mobile 11.3) | |
| Samsung Galaxy Tab S4 (Samsung Browser 8.0) | |
| Huawei MediaPad M5 10.8 Pro (Chrome 68.0.3440.91) | |
| Apple iPad Air 2 2014 (Safari 9.0 Mobile) | |
| Mozilla Kraken 1.1 - Total | |
| Huawei MediaPad M5 10.8 Pro (Chrome 68.0.3440.91) | |
| Samsung Galaxy Tab S4 (Samsung Browser 8.0) | |
| Apple iPad Air 2 2014 (Safari 9.0 Mobile) | |
| Média da turma Tablet (243 - 16233, n=63, últimos 2 anos) | |
| Apple iPad 6 2018 (Safari Mobile 11.3) | |
| Apple iPad Pro 10.5 2017 (Safari Mobile 10) | |
| Apple iPad Air 3 2019 (Safari Mobile 12) | |
| Média Apple A12 Bionic (603 - 653, n=6) | |
* ... menor é melhor
PUBG Mobile
Dead Trigger 2
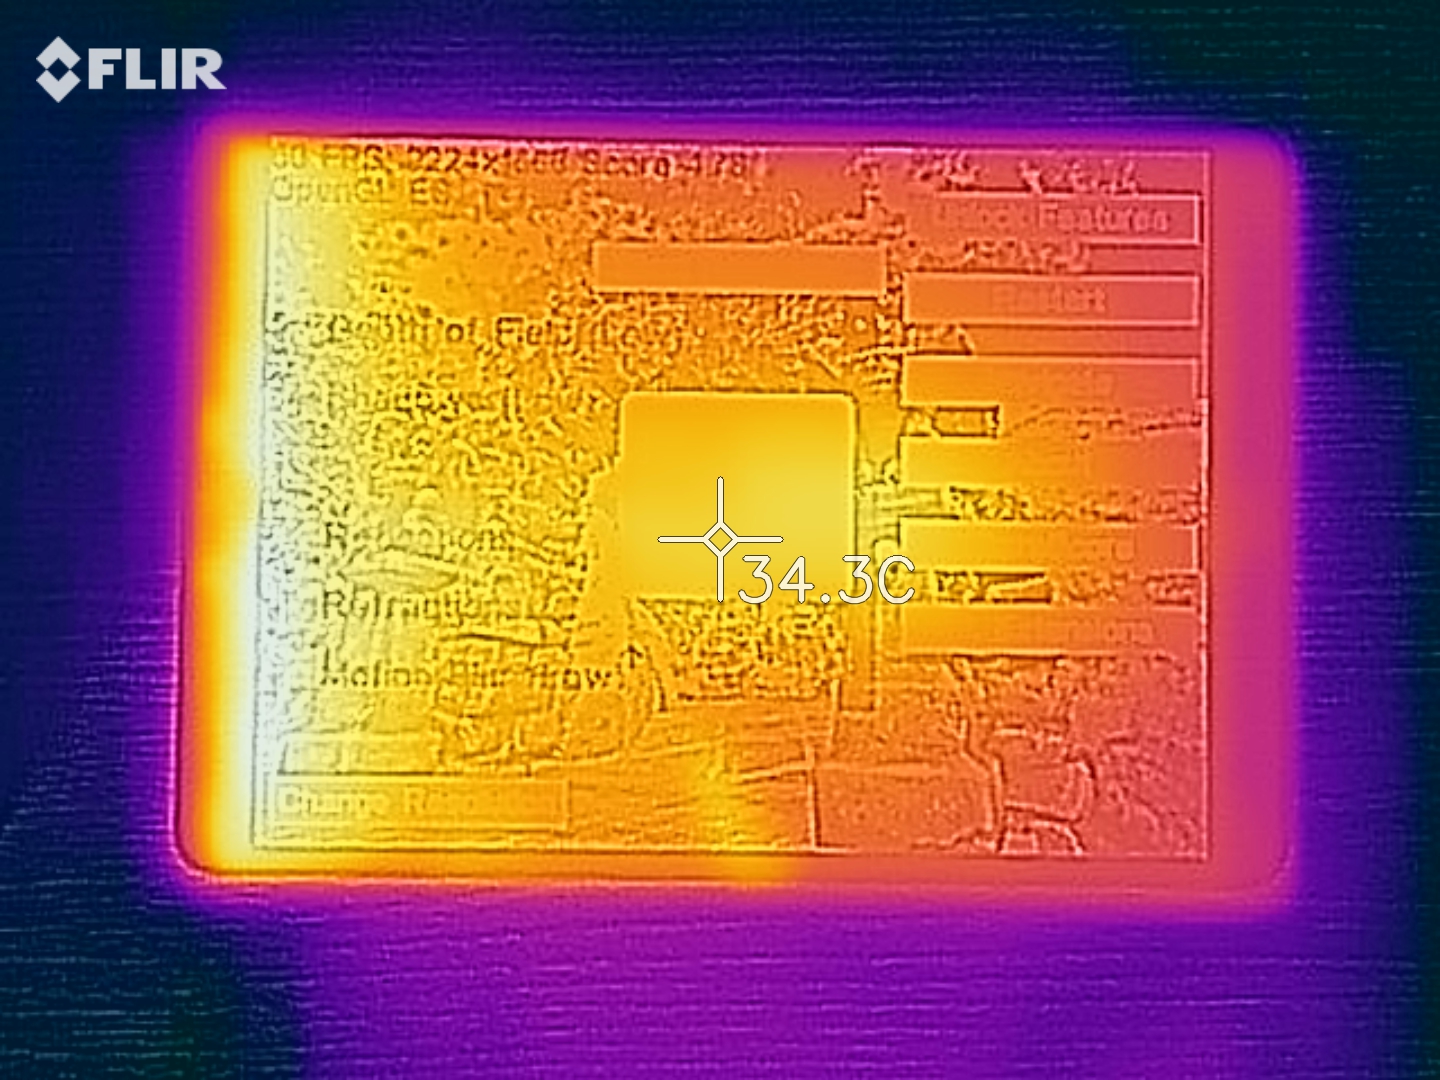
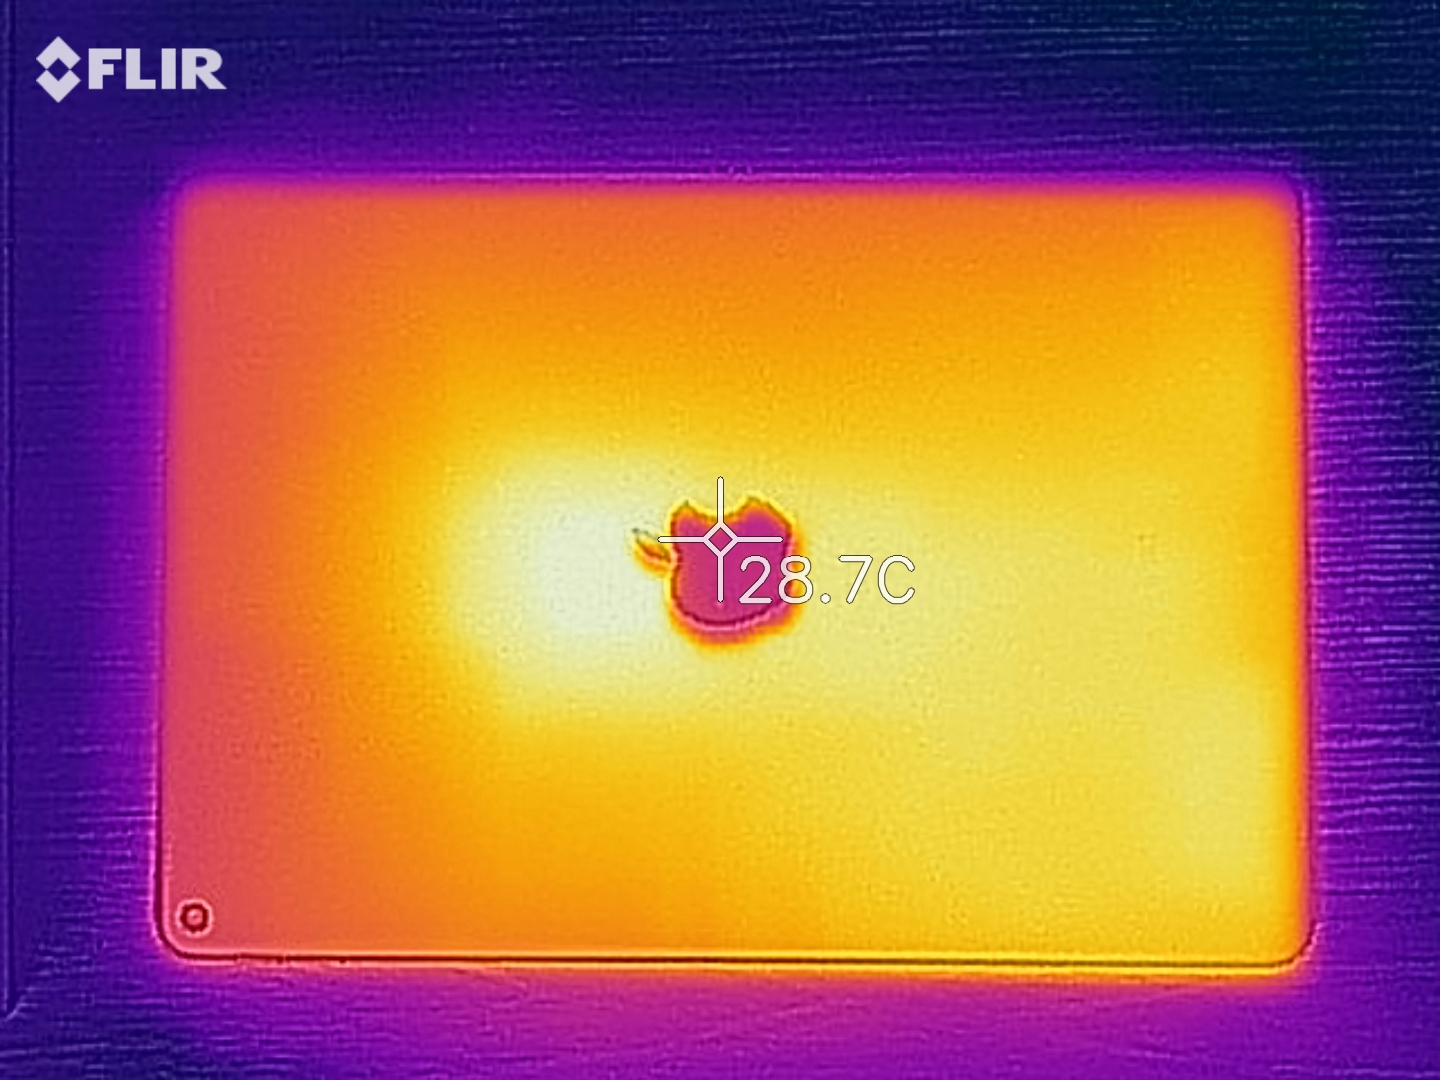
(+) A temperatura máxima no lado superior é 36.1 °C / 97 F, em comparação com a média de 33.7 °C / 93 F , variando de 20.7 a 53.2 °C para a classe Tablet.
(+) A parte inferior aquece até um máximo de 34.7 °C / 94 F, em comparação com a média de 33.2 °C / 92 F
(+) Em uso inativo, a temperatura média para o lado superior é 30.5 °C / 87 F, em comparação com a média do dispositivo de 30 °C / ### class_avg_f### F.
Apple iPad Air 3 2019 análise de áudio
(+) | os alto-falantes podem tocar relativamente alto (###valor### dB)
Graves 100 - 315Hz
(-) | quase nenhum baixo - em média 15.9% menor que a mediana
(±) | a linearidade dos graves é média (8.5% delta para a frequência anterior)
Médios 400 - 2.000 Hz
(+) | médios equilibrados - apenas 3% longe da mediana
(+) | médios são lineares (3% delta para frequência anterior)
Altos 2 - 16 kHz
(±) | máximos mais altos - em média 8.2% maior que a mediana
(+) | os máximos são lineares (4.3% delta da frequência anterior)
Geral 100 - 16.000 Hz
(+) | o som geral é linear (14.8% diferença em relação à mediana)
Comparado com a mesma classe
» 32% de todos os dispositivos testados nesta classe foram melhores, 4% semelhantes, 65% piores
» O melhor teve um delta de 7%, a média foi 20%, o pior foi 129%
Comparado com todos os dispositivos testados
» 20% de todos os dispositivos testados foram melhores, 4% semelhantes, 76% piores
» O melhor teve um delta de 4%, a média foi 23%, o pior foi 134%
Apple iPad Pro 10.5 2017 análise de áudio
(+) | os alto-falantes podem tocar relativamente alto (###valor### dB)
Graves 100 - 315Hz
(±) | graves reduzidos - em média 10.4% menor que a mediana
(±) | a linearidade dos graves é média (12.3% delta para a frequência anterior)
Médios 400 - 2.000 Hz
(±) | médios mais altos - em média 5.8% maior que a mediana
(+) | médios são lineares (4.3% delta para frequência anterior)
Altos 2 - 16 kHz
(±) | máximos mais altos - em média 6.6% maior que a mediana
(±) | a linearidade dos máximos é média (7% delta para frequência anterior)
Geral 100 - 16.000 Hz
(±) | a linearidade do som geral é média (16.1% diferença em relação à mediana)
Comparado com a mesma classe
» 37% de todos os dispositivos testados nesta classe foram melhores, 6% semelhantes, 58% piores
» O melhor teve um delta de 7%, a média foi 20%, o pior foi 129%
Comparado com todos os dispositivos testados
» 26% de todos os dispositivos testados foram melhores, 5% semelhantes, 69% piores
» O melhor teve um delta de 4%, a média foi 23%, o pior foi 134%
| desligado | |
| Ocioso | |
| Carga |
|
Key:
min: | |
| Apple iPad Air 3 2019 8134 mAh | Apple iPad Pro 10.5 2017 8134 mAh | Apple iPad 6 2018 mAh | Samsung Galaxy Tab S4 7300 mAh | Huawei MediaPad M5 10.8 Pro 7500 mAh | Apple iPad Air 2 2014 mAh | |
|---|---|---|---|---|---|---|
| Power Consumption | 6% | -27% | 32% | -19% | 14% | |
| Idle Minimum * (Watt) | 2.18 | 1.44 34% | 2.2 -1% | 1.76 19% | 3.3 -51% | 1.2 45% |
| Idle Average * (Watt) | 6.4 | 6.12 4% | 7.8 -22% | 4.22 34% | 4.2 34% | 5.1 20% |
| Idle Maximum * (Watt) | 6.43 | 6.14 5% | 7.9 -23% | 4.25 34% | 7 -9% | 5.4 16% |
| Load Average * (Watt) | 7.48 | 8.55 -14% | 12.6 -68% | 4.52 40% | 10.4 -39% | 7.9 -6% |
| Load Maximum * (Watt) | 10.65 | 10.62 -0% | 12.8 -20% | 7.35 31% | 13.8 -30% | 11.1 -4% |
* ... menor é melhor
| Apple iPad Air 3 2019 8134 mAh | Apple iPad Pro 10.5 2017 8134 mAh | Apple iPad 6 2018 mAh | Samsung Galaxy Tab S4 7300 mAh | Huawei MediaPad M5 10.8 Pro 7500 mAh | Apple iPad Air 2 2014 mAh | |
|---|---|---|---|---|---|---|
| Duração da bateria | 4% | -9% | -7% | -8% | -10% | |
| Reader / Idle (h) | 25 | 33.9 36% | 20.5 -18% | 20.9 -16% | 22.7 -9% | |
| H.264 (h) | 11.4 | 10.5 -8% | 12.3 8% | 10.5 -8% | 9.4 -18% | |
| WiFi v1.3 (h) | 12.3 | 11.6 -6% | 11.9 -3% | 8.3 -33% | 11.2 -9% | |
| Load (h) | 3.6 | 3.3 -8% | 3.1 -14% | 4.1 14% | 3.7 3% | 3.5 -3% |
| WiFi (h) | 10.5 |
Pro
Contra
Verdict - The iPad Air as an artificial stopgap
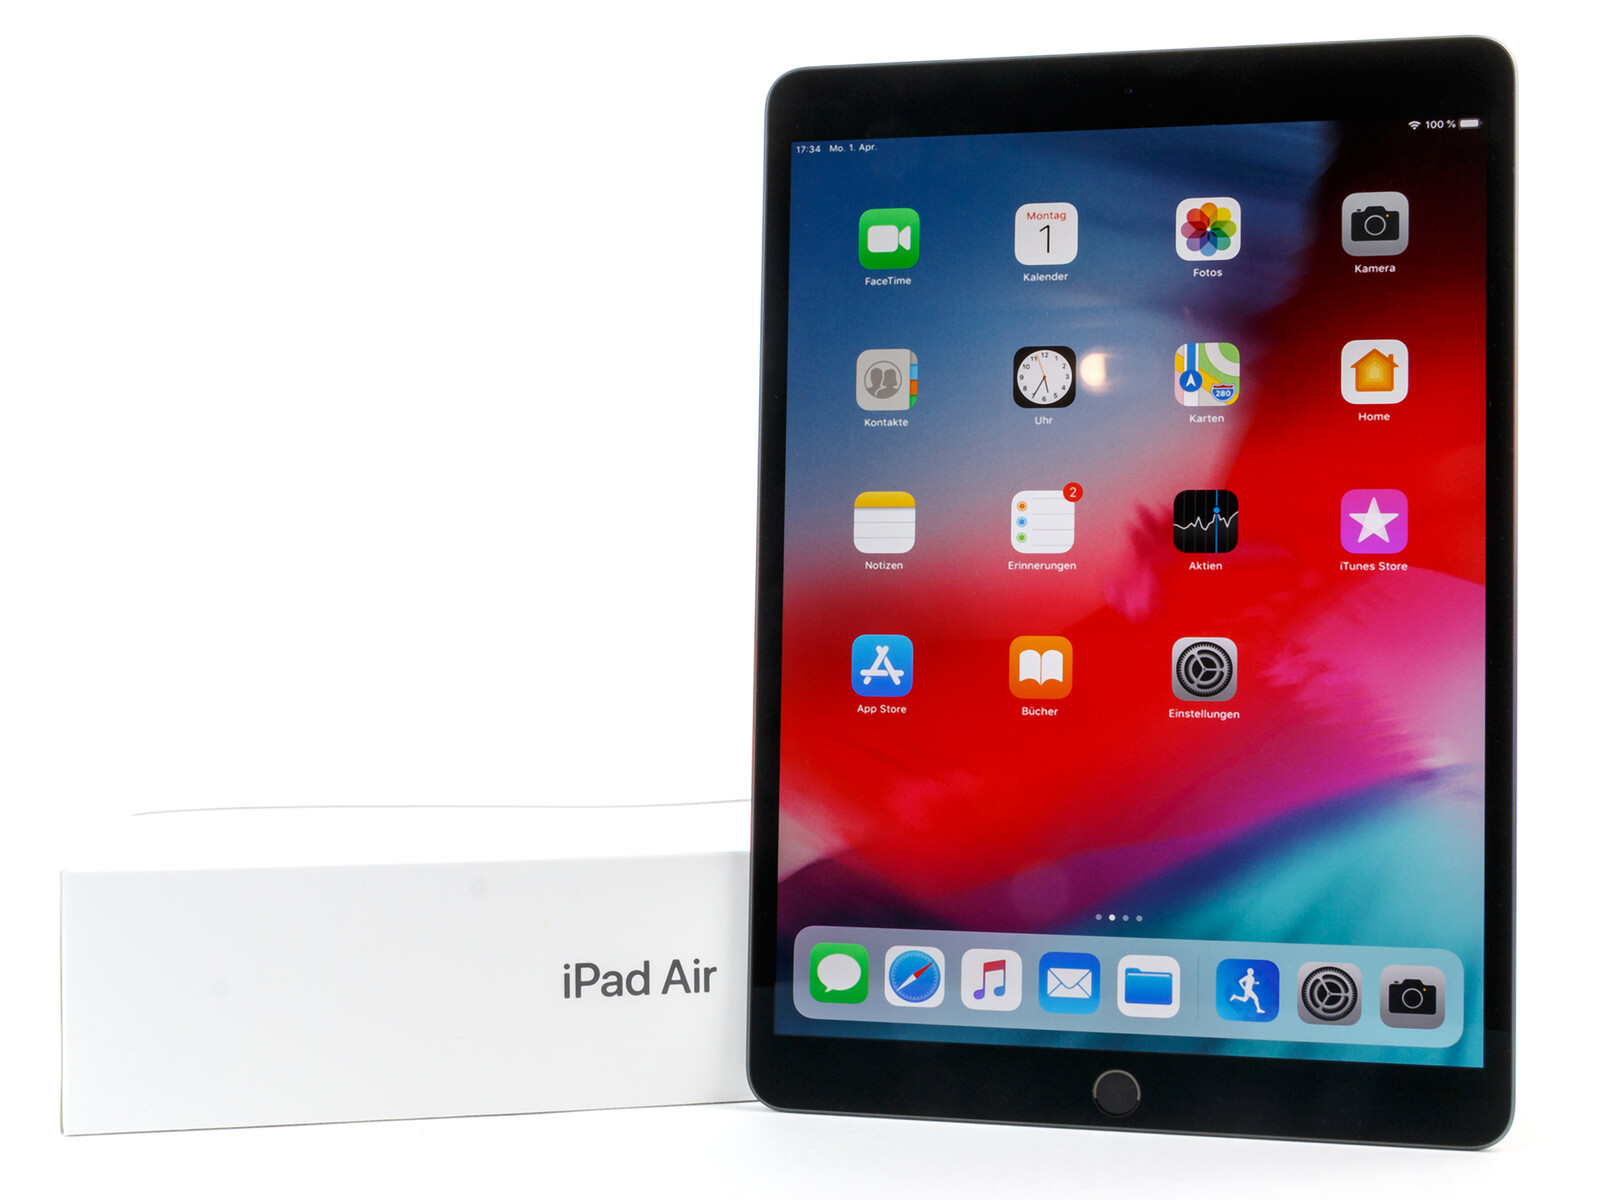
Enquanto o Apple iPad Air (2019) se posiciona entre o iPad Pro 11 e o iPad (2018), ele concorre diretamente contra os atuais tablets Android de gama alta em termos de preço. À diferença do iPad de nível de entrada, ele oferece uma tela maior e totalmente laminada, mais armazenamento, e possui um SoC mais potente por um preço adicional de 200 Euros (~$226).
Em termos de tecnologia, a Apple lançou outro excelente tablet que não possui falhas reais e usa a tecnologia comprovada em anos anteriores. No entanto, para os usuários, o portfólio de modelos torna-se mais difícil de entender com isto, o que se torna ainda mais difícil por haver várias gerações de Lápis simultaneamente.
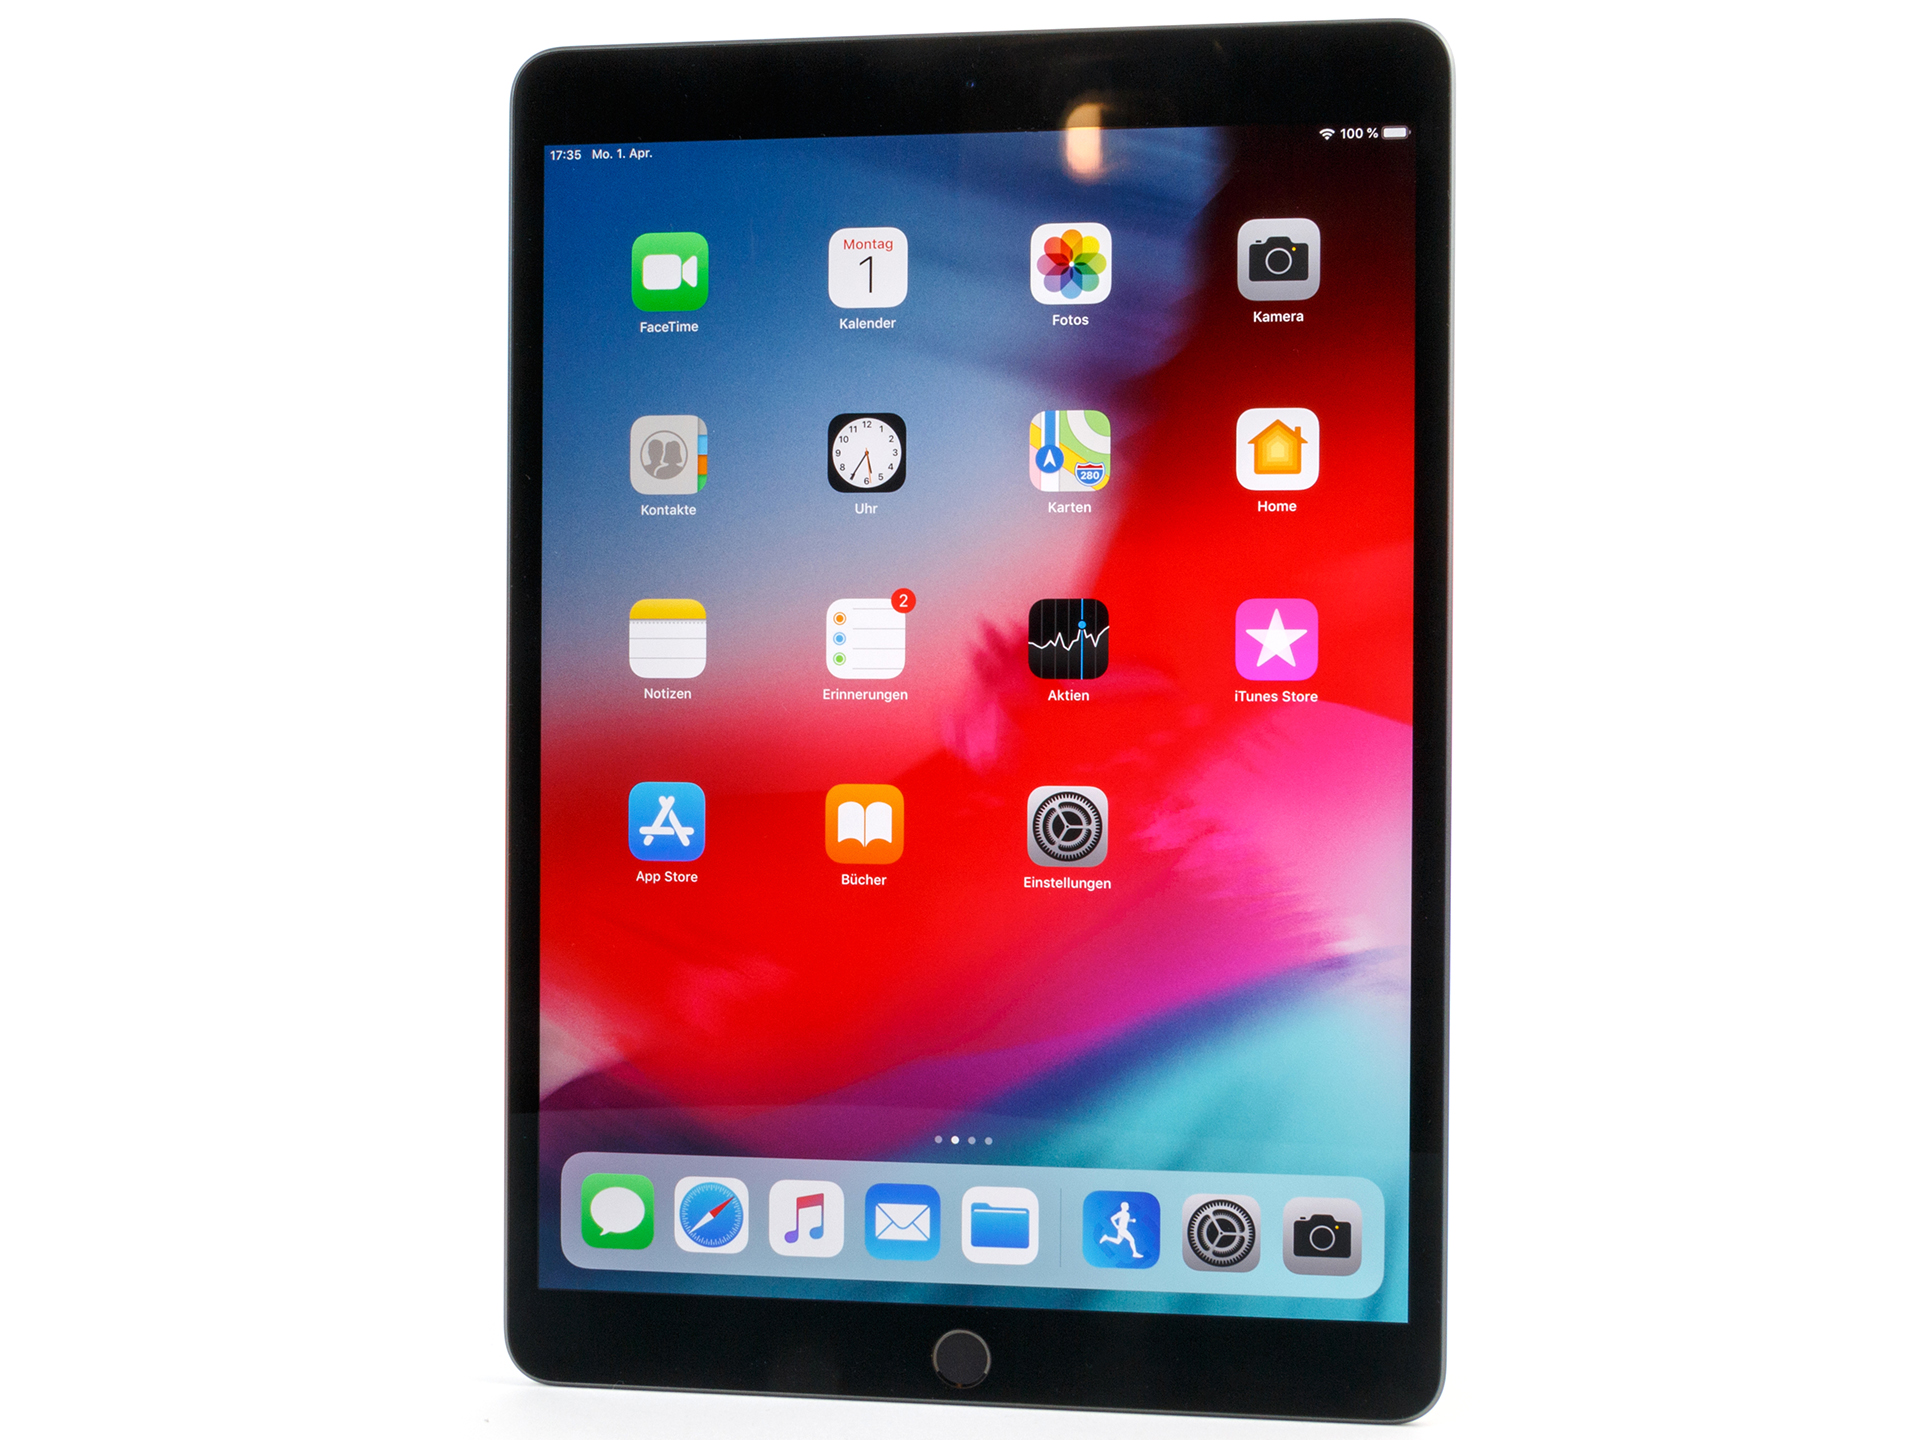
O Apple iPad Air (2019) combina um SoC moderno com tecnologia comprovada.
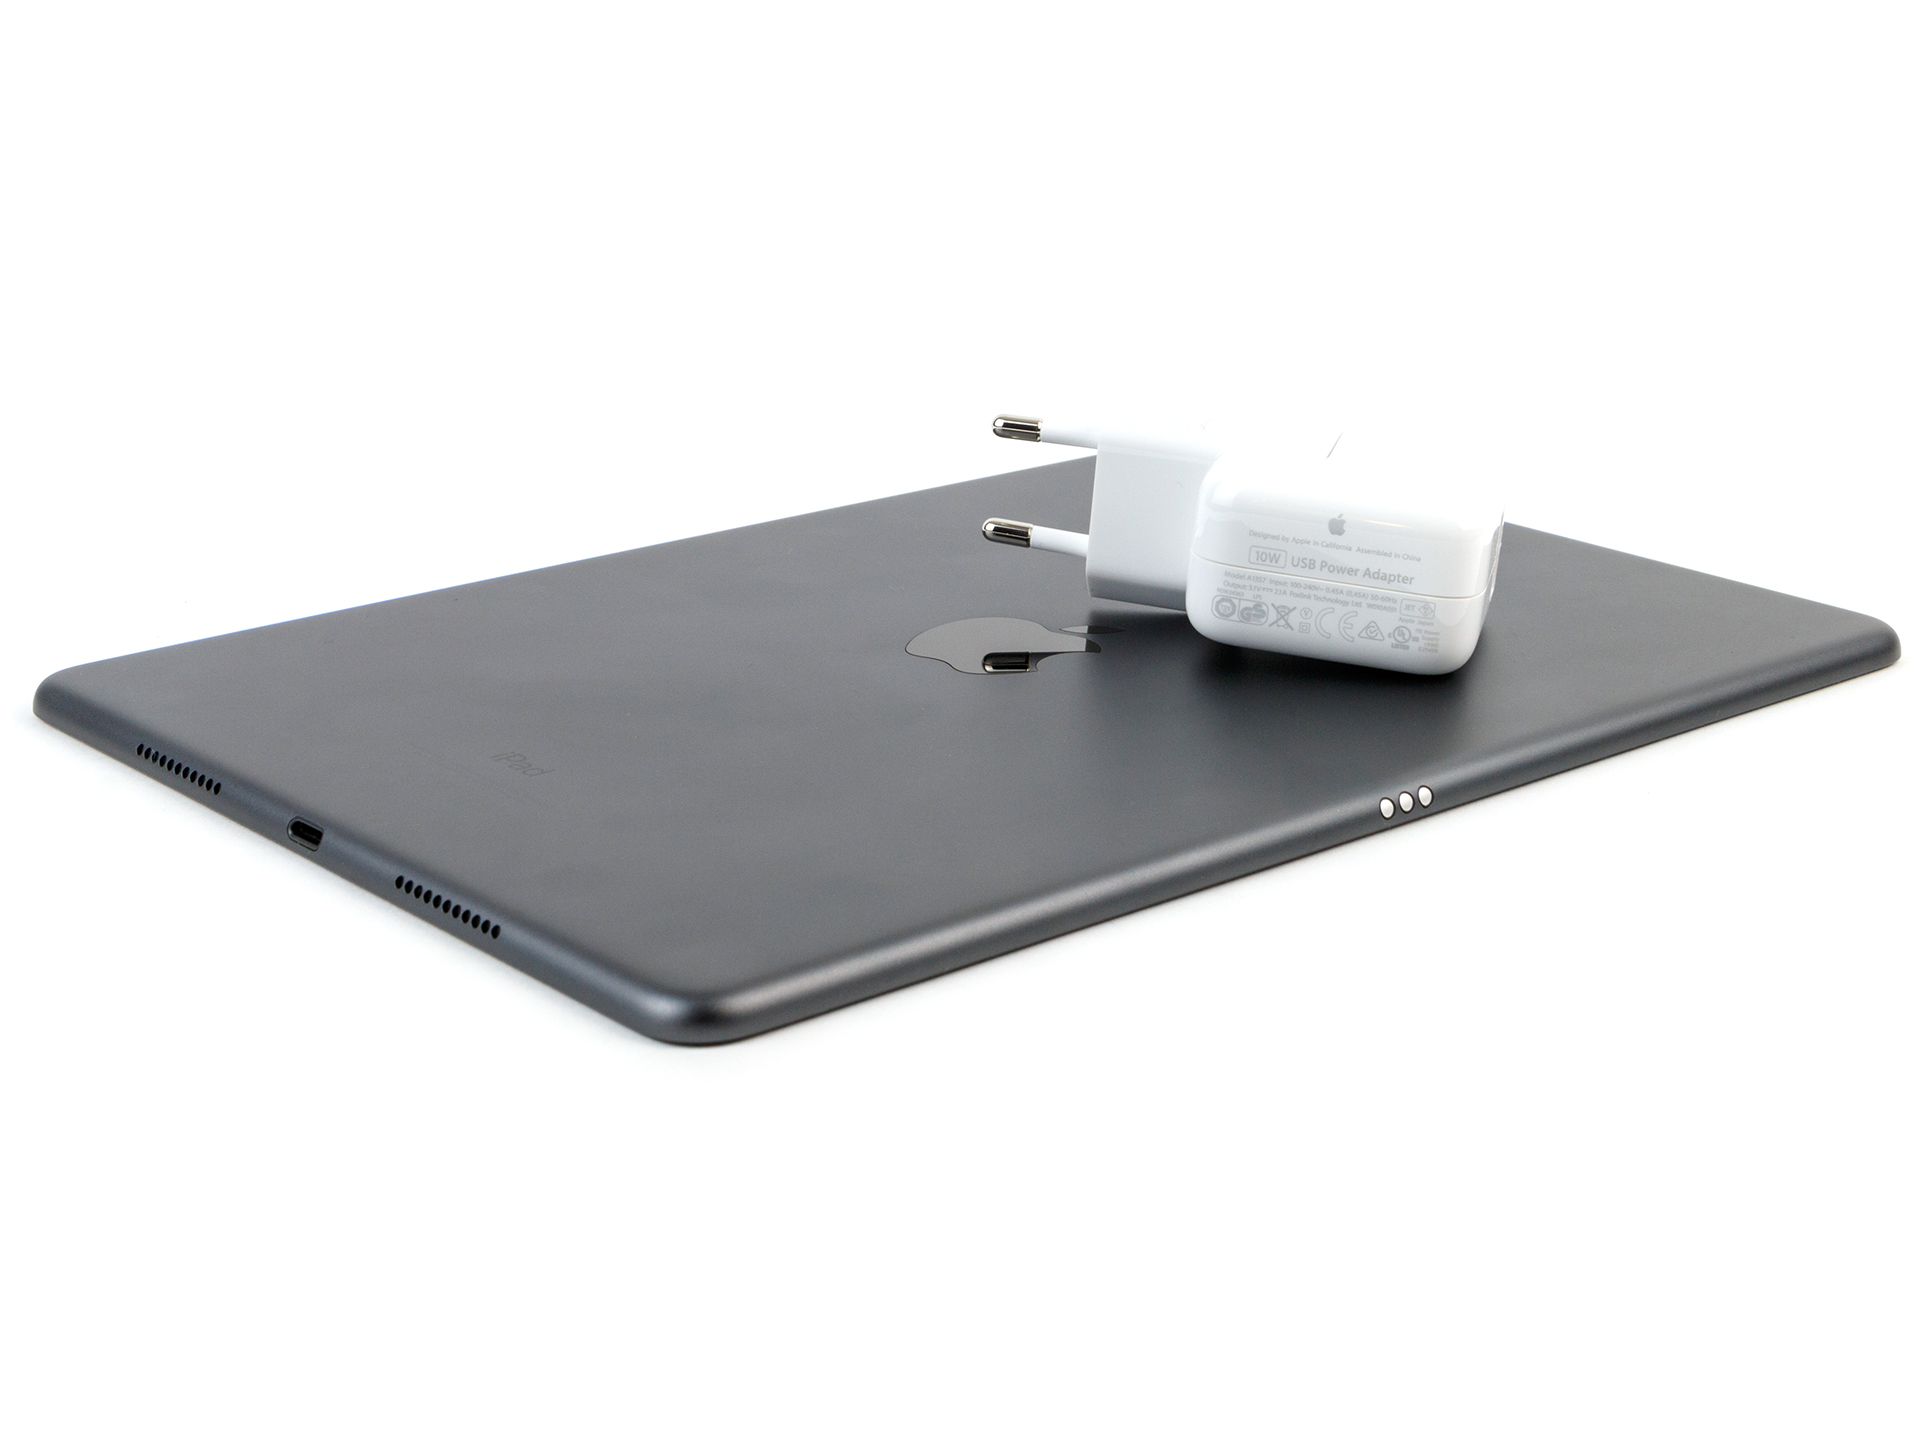
As principais reclamações sobre o tablet provavelmente sejam a dispersão dos acessórios incluídos e seus custos adicionais e os longos tempos de carregamento. No entanto, isto dificilmente importa na operação do dia a dia. Com o baixo preço inicial, Touch ID e sua porta de áudio, o iPad Air ainda é um produto atraente.
Apple iPad Air 3 2019
- 09/16/2019 v7 (old)
Daniel Schmidt
Price comparison
