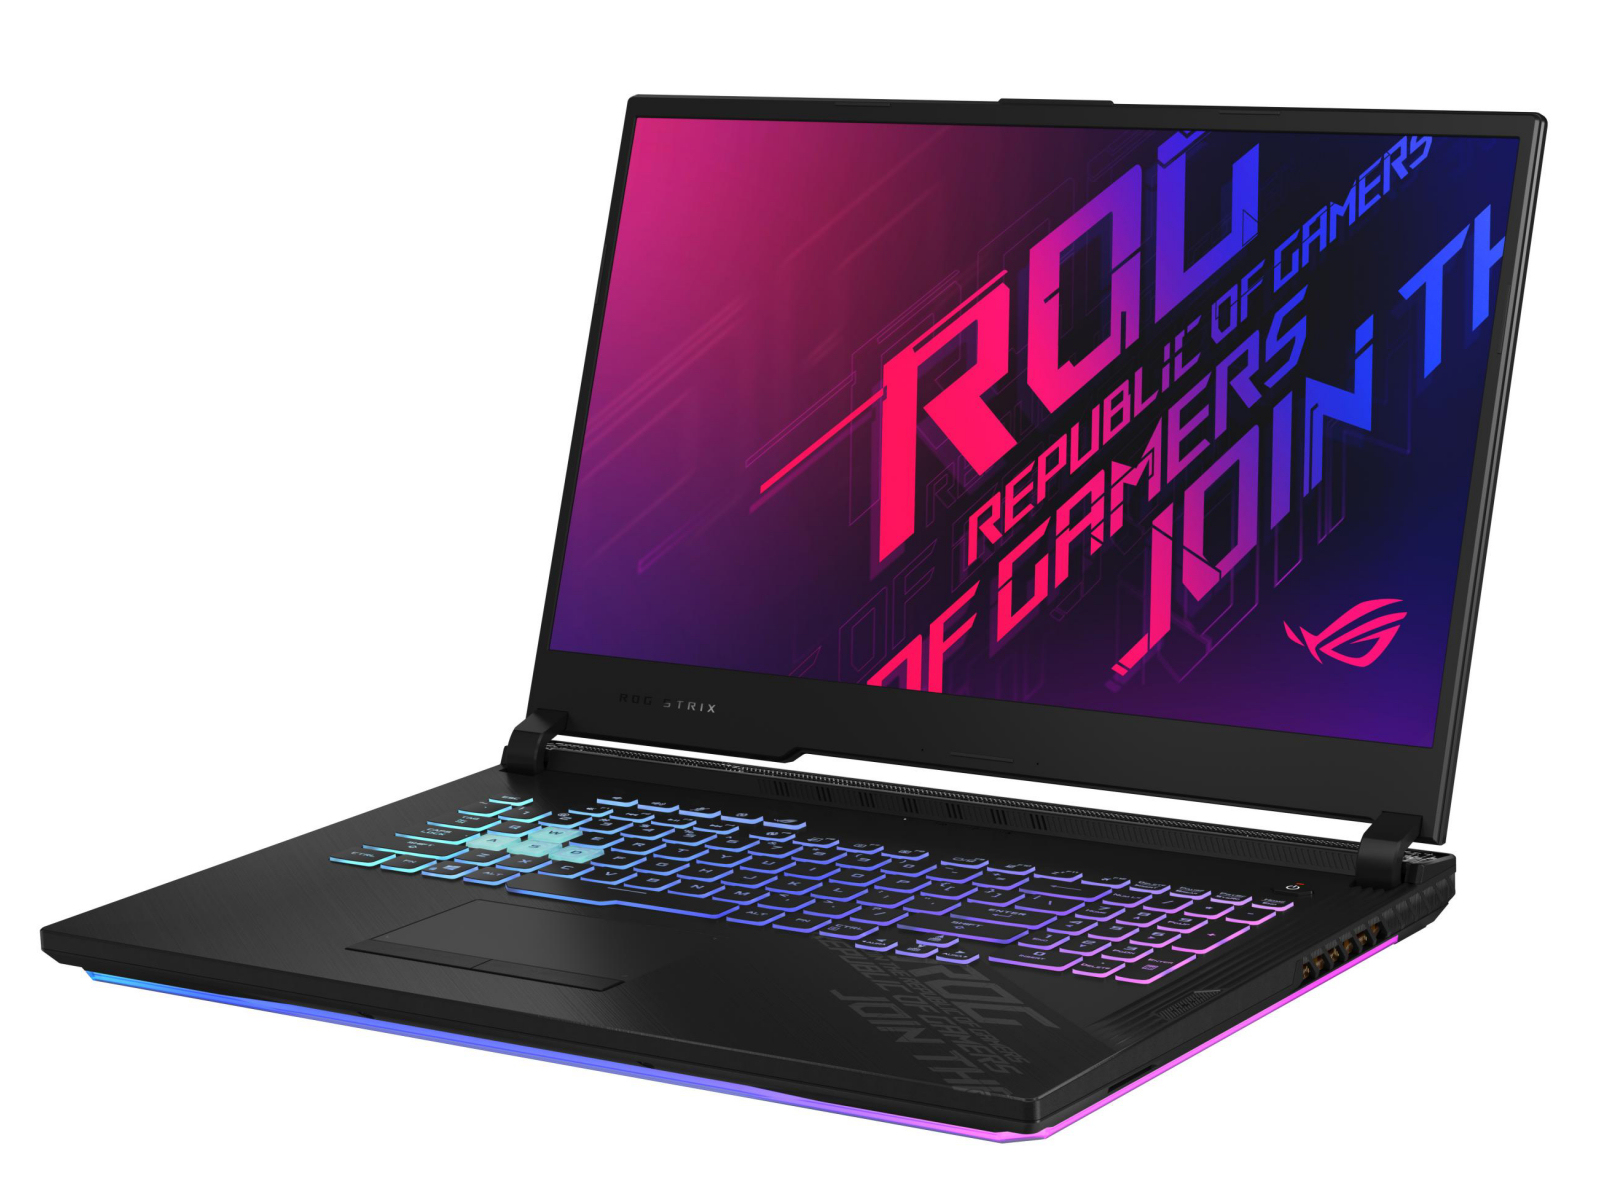
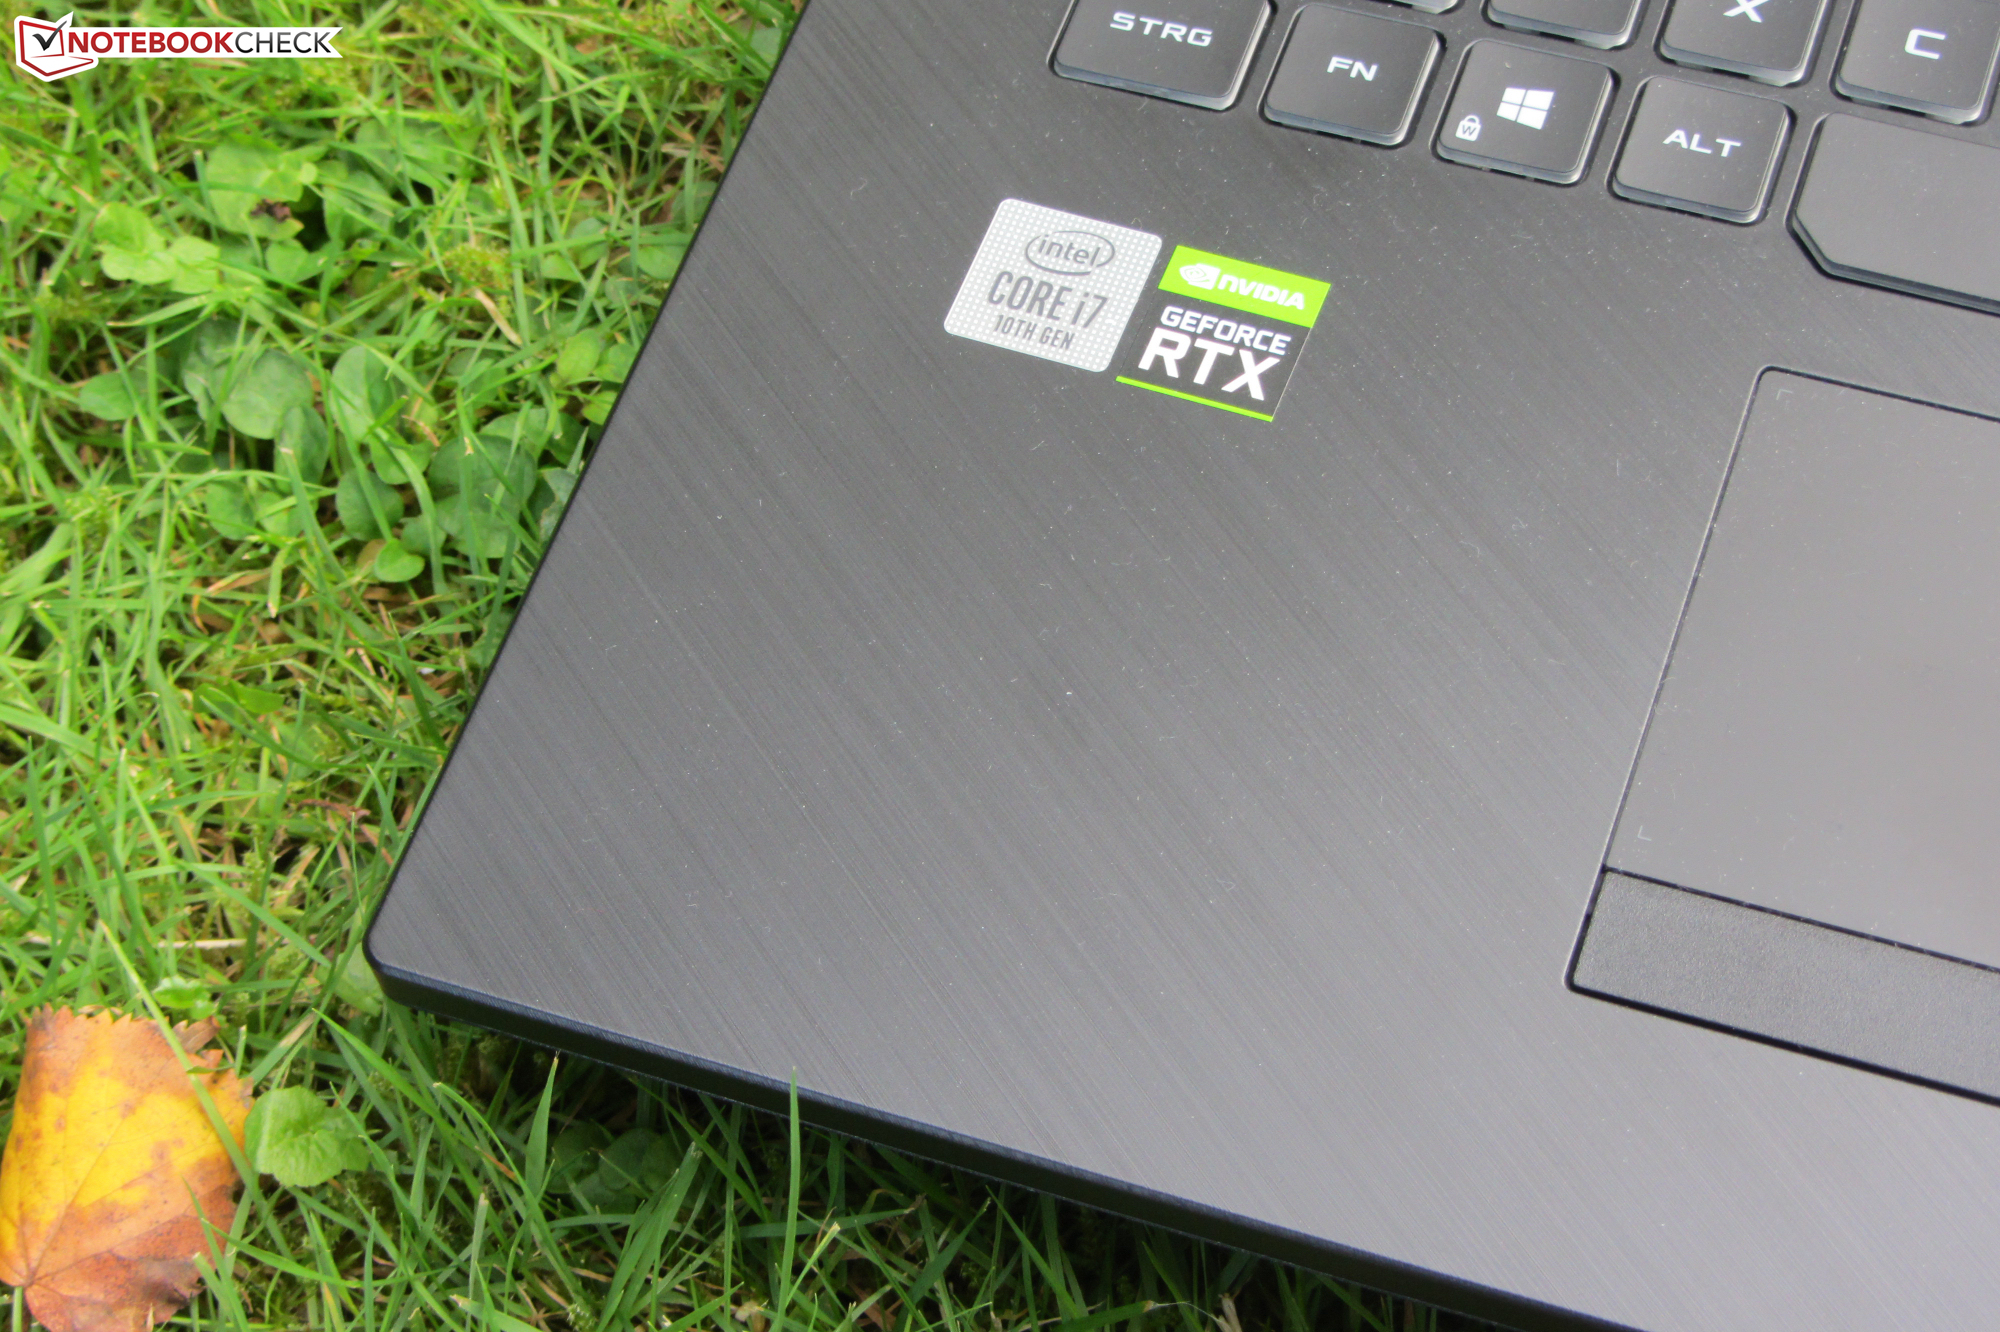
Breve Análise do Asus ROG Strix G17 G712LWS: Máquina de jogos poderosa com show de luzes integrado
Avaliação | Data | Modelo | Peso | Altura | Size | Resolução | Preço |
|---|---|---|---|---|---|---|---|
| 83.1 % v7 (old) | 10/2020 | Asus Strix G17 G712LWS i7-10750H, GeForce RTX 2070 Super Mobile | 2.8 kg | 26.5 mm | 17.30" | 1920x1080 | |
| 83.2 % v7 (old) | 03/2020 | Schenker XMG Pro 17 PB71RD-G i7-9750H, GeForce RTX 2060 Mobile | 2.8 kg | 30 mm | 17.30" | 1920x1080 | |
| 83.5 % v7 (old) | 08/2020 | MSI GL75 10SFR i7-10750H, GeForce RTX 2070 Mobile | 2.6 kg | 28 mm | 17.30" | 1920x1080 | |
| 84 % v7 (old) | 05/2020 | Lenovo Legion Y740-17IRHg-81UJ001VGE i7-9750H, GeForce RTX 2080 Max-Q | 3 kg | 25.5 mm | 17.30" | 1920x1080 | |
| 83.6 % v7 (old) | 10/2020 | Acer Predator Helios 300 PH317-54-75G8 i7-10750H, GeForce RTX 2060 Mobile | 2.8 kg | 25 mm | 17.30" | 1920x1080 |

| |||||||||||||||||||||||||
iluminação: 89 %
iluminação com acumulador: 323 cd/m²
Contraste: 1042:1 (Preto: 0.31 cd/m²)
ΔE ColorChecker Calman: 3.01 | ∀{0.5-29.43 Ø4.72}
calibrated: 1
ΔE Greyscale Calman: 3.8 | ∀{0.09-98 Ø4.97}
90% sRGB (Argyll 1.6.3 3D)
66% AdobeRGB 1998 (Argyll 1.6.3 3D)
66.4% AdobeRGB 1998 (Argyll 3D)
96.8% sRGB (Argyll 3D)
65.2% Display P3 (Argyll 3D)
Gamma: 2.154
CCT: 7507 K
| Asus Strix G17 G712LWS LG Philips LP173WFG-SPB3, IPS, 1920x1080, 17.3" | Asus ROG Strix G GL731GU-RB74 AU Optronics B173HAN04.0, IPS, 1920x1080, 17.3" | Acer Predator Helios 300 PH317-54-75G8 Chi Mei N173HCE-G33, IPS, 1920x1080, 17.3" | Schenker XMG Pro 17 PB71RD-G AU Optronics B173HAN04.0 (AUO409D), IPS, 1920x1080, 17.3" | MSI GL75 10SFR Chi Mei N173HCE-G33, IPS, 1920x1080, 17.3" | Lenovo Legion Y740-17IRHg-81UJ001VGE AUO_B173HAN03, IPS, 1920x1080, 17.3" | |
|---|---|---|---|---|---|---|
| Display | -6% | -3% | -5% | -1% | -3% | |
| Display P3 Coverage (%) | 65.2 | 61.9 -5% | 62.6 -4% | 62.8 -4% | 63.9 -2% | 63.8 -2% |
| sRGB Coverage (%) | 96.8 | 89.4 -8% | 94.3 -3% | 89.8 -7% | 96.2 -1% | 92.7 -4% |
| AdobeRGB 1998 Coverage (%) | 66.4 | 63.3 -5% | 64.7 -3% | 64.2 -3% | 66 -1% | 65.3 -2% |
| Response Times | 24% | -9% | -16% | 15% | -9% | |
| Response Time Grey 50% / Grey 80% * (ms) | 14.4 ? | 6.4 ? 56% | 16.4 ? -14% | 16.8 ? -17% | 12 ? 17% | 16 ? -11% |
| Response Time Black / White * (ms) | 10.4 ? | 11.2 ? -8% | 10.8 ? -4% | 12 ? -15% | 9 ? 13% | 11 ? -6% |
| PWM Frequency (Hz) | 24510 ? | 208 ? | ||||
| Screen | -23% | 27% | -18% | 7% | -7% | |
| Brightness middle (cd/m²) | 323 | 294.3 -9% | 322 0% | 274 -15% | 333 3% | 310 -4% |
| Brightness (cd/m²) | 300 | 289 -4% | 308 3% | 273 -9% | 309 3% | 281 -6% |
| Brightness Distribution (%) | 89 | 89 0% | 92 3% | 95 7% | 86 -3% | 85 -4% |
| Black Level * (cd/m²) | 0.31 | 0.3 3% | 0.18 42% | 0.26 16% | 0.215 31% | 0.31 -0% |
| Contrast (:1) | 1042 | 981 -6% | 1789 72% | 1054 1% | 1549 49% | 1000 -4% |
| Colorchecker dE 2000 * | 3.01 | 3.95 -31% | 1.53 49% | 4.62 -53% | 1.98 34% | 3.86 -28% |
| Colorchecker dE 2000 max. * | 7.65 | 6.49 15% | 3.14 59% | 7.66 -0% | 4.34 43% | 7.8 -2% |
| Colorchecker dE 2000 calibrated * | 1 | 3.08 -208% | 0.74 26% | 1.93 -93% | 2.01 -101% | |
| Greyscale dE 2000 * | 3.8 | 3.7 3% | 1.9 50% | 5.3 -39% | 2.97 22% | 4.48 -18% |
| Gamma | 2.154 102% | 2.07 106% | 2.144 103% | 2.34 94% | 2.41 91% | 2.5 88% |
| CCT | 7507 87% | 7155 91% | 6809 95% | 7619 85% | 6750 96% | 7542 86% |
| Color Space (Percent of AdobeRGB 1998) (%) | 66 | 57.7 -13% | 65 -2% | 58 -12% | 61 -8% | 60 -9% |
| Color Space (Percent of sRGB) (%) | 90 | 89 -1% | 87 -3% | 90 0% | 96 7% | 93 3% |
| Média Total (Programa/Configurações) | -2% /
-14% | 5% /
17% | -13% /
-15% | 7% /
7% | -6% /
-6% |
* ... menor é melhor
Exibir tempos de resposta
| ↔ Tempo de resposta preto para branco | ||
|---|---|---|
| 10.4 ms ... ascensão ↗ e queda ↘ combinadas | ↗ 5.2 ms ascensão | 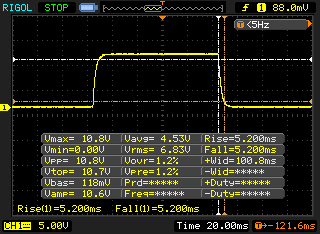 |
| ↘ 5.2 ms queda | ||
| A tela mostra boas taxas de resposta em nossos testes, mas pode ser muito lenta para jogadores competitivos. Em comparação, todos os dispositivos testados variam de 0.1 (mínimo) a 240 (máximo) ms. » 28 % de todos os dispositivos são melhores. Isso significa que o tempo de resposta medido é melhor que a média de todos os dispositivos testados (19.8 ms). | ||
| ↔ Tempo de resposta 50% cinza a 80% cinza | ||
| 14.4 ms ... ascensão ↗ e queda ↘ combinadas | ↗ 6.8 ms ascensão | 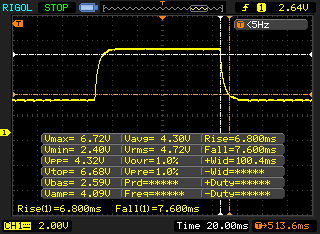 |
| ↘ 7.6 ms queda | ||
| A tela mostra boas taxas de resposta em nossos testes, mas pode ser muito lenta para jogadores competitivos. Em comparação, todos os dispositivos testados variam de 0.165 (mínimo) a 636 (máximo) ms. » 28 % de todos os dispositivos são melhores. Isso significa que o tempo de resposta medido é melhor que a média de todos os dispositivos testados (31 ms). | ||
Cintilação da tela / PWM (modulação por largura de pulso)
| Tela tremeluzindo / PWM não detectado | 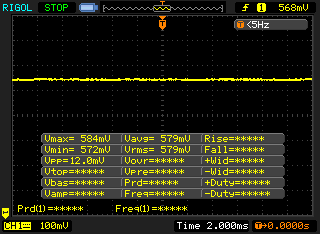 | ||
[pwm_comparison] Em comparação: 52 % de todos os dispositivos testados não usam PWM para escurecer a tela. Se PWM foi detectado, uma média de 7763 (mínimo: 5 - máximo: 343500) Hz foi medida. | |||

* ... menor é melhor
| PCMark 8 Home Score Accelerated v2 | 4412 pontos | |
| PCMark 8 Creative Score Accelerated v2 | 4201 pontos | |
| PCMark 8 Work Score Accelerated v2 | 5832 pontos | |
| PCMark 10 Score | 5262 pontos | |
Ajuda | ||
| DPC Latencies / LatencyMon - interrupt to process latency (max), Web, Youtube, Prime95 | |
| Asus Strix G17 G712LWS | |
| MSI GL75 10SFR | |
| Acer Predator Helios 300 PH317-54-75G8 | |
* ... menor é melhor

| Asus Strix G17 G712LWS Intel SSD 660p 1TB SSDPEKNW010T8 | Asus ROG Strix G GL731GU-RB74 Intel SSD 660p SSDPEKNW512G8 | Acer Predator Helios 300 PH317-54-75G8 WDC PC SN730 SDBQNTY-1T00 | Schenker XMG Pro 17 PB71RD-G Samsung SSD 970 EVO Plus 500GB | MSI GL75 10SFR Lite-On CL1-8D512 | Lenovo Legion Y740-17IRHg-81UJ001VGE Samsung SSD PM981 MZVLB1T0HALR | |
|---|---|---|---|---|---|---|
| CrystalDiskMark 5.2 / 6 | -16% | 27% | 20% | -4% | 16% | |
| Write 4K (MB/s) | 141.1 | 127.6 -10% | 141.9 1% | 117.5 -17% | 132.2 -6% | 101.2 -28% |
| Read 4K (MB/s) | 60.9 | 56 -8% | 48.75 -20% | 46.47 -24% | 45.62 -25% | 44.61 -27% |
| Write Seq (MB/s) | 1681 | 986 -41% | 2734 63% | 1345 -20% | 1511 -10% | 2295 37% |
| Read Seq (MB/s) | 1602 | 1605 0% | 1921 20% | 2804 75% | 1890 18% | 2174 36% |
| Write 4K Q32T1 (MB/s) | 406.6 | 451.5 11% | 422.6 4% | 368.2 -9% | 375.9 -8% | 401.2 -1% |
| Read 4K Q32T1 (MB/s) | 470.2 | 343.3 -27% | 509 8% | 412.9 -12% | 525 12% | 475.5 1% |
| Write Seq Q32T1 (MB/s) | 1759 | 983 -44% | 3055 74% | 3248 85% | 1505 -14% | 2397 36% |
| Read Seq Q32T1 (MB/s) | 1932 | 1810 -6% | 3257 69% | 3559 84% | 2008 4% | 3337 73% |
| AS SSD | -38% | 73% | 83% | -35% | 59% | |
| Seq Read (MB/s) | 1778 | 1319 -26% | 2828 59% | 2946 66% | 1923 8% | 2800 57% |
| Seq Write (MB/s) | 1478 | 930 -37% | 2677 81% | 2627 78% | 1065 -28% | 2424 64% |
| 4K Read (MB/s) | 49.76 | 49.43 -1% | 39.94 -20% | 56.9 14% | 25.43 -49% | 42.77 -14% |
| 4K Write (MB/s) | 117.9 | 104.3 -12% | 100.9 -14% | 151.7 29% | 101.9 -14% | 94.8 -20% |
| 4K-64 Read (MB/s) | 591 | 321.9 -46% | 1562 164% | 1222 107% | 477.9 -19% | 1406 138% |
| 4K-64 Write (MB/s) | 875 | 774 -12% | 1867 113% | 2444 179% | 563 -36% | 1697 94% |
| Access Time Read * (ms) | 0.082 | 0.055 33% | 0.051 38% | 0.053 35% | 0.05 39% | |
| Access Time Write * (ms) | 0.041 | 0.138 -237% | 0.037 10% | 0.025 39% | 0.126 -207% | 0.039 5% |
| Score Read (Points) | 818 | 503 -39% | 1885 130% | 1574 92% | 696 -15% | 1729 111% |
| Score Write (Points) | 1140 | 971 -15% | 2236 96% | 2859 151% | 771 -32% | 2034 78% |
| Score Total (Points) | 2377 | 1731 -27% | 5076 114% | 5232 120% | 1785 -25% | 4630 95% |
| Média Total (Programa/Configurações) | -27% /
-29% | 50% /
53% | 52% /
57% | -20% /
-22% | 38% /
41% |
* ... menor é melhor
Continuous load read: DiskSpd Read Loop, Queue Depth 8
| 3DMark 11 Performance | 20961 pontos | |
| 3DMark Cloud Gate Standard Score | 39220 pontos | |
| 3DMark Fire Strike Score | 18270 pontos | |
| 3DMark Time Spy Score | 8100 pontos | |
Ajuda | ||
| The Witcher 3 - 1920x1080 Ultra Graphics & Postprocessing (HBAO+) | |
| Média da turma Gaming (95 - 240, n=7, últimos 2 anos) | |
| Asus Strix G17 G712LWS (Turbo) | |
| Asus Strix G17 G712LWS | |
| Média NVIDIA GeForce RTX 2070 Super Mobile (76.3 - 94.6, n=8) | |
| Lenovo Legion Y740-17IRHg-81UJ001VGE | |
| MSI GL75 10SFR | |
| Acer Predator Helios 300 PH317-54-75G8 | |
| Schenker XMG Pro 17 PB71RD-G | |
| Asus ROG Strix G GL731GU-RB74 | |
| Horizon Zero Dawn - 1920x1080 Ultimate Quality | |
| Média NVIDIA GeForce RTX 2070 Super Mobile (77 - 98, n=3) | |
| Asus Strix G17 G712LWS (Turbo) | |
| Asus Strix G17 G712LWS | |
| Acer Predator Helios 300 PH317-54-75G8 | |
| Doom Eternal - 1920x1080 Ultra Preset | |
| Média NVIDIA GeForce RTX 2070 Super Mobile (151 - 190.4, n=5) | |
| Asus Strix G17 G712LWS (Turbo) | |
| Asus Strix G17 G712LWS | |
| MSI GL75 10SFR | |
| Acer Predator Helios 300 PH317-54-75G8 | |
| F1 2020 - 1920x1080 Ultra High Preset AA:T AF:16x | |
| Asus Strix G17 G712LWS (Turbo) | |
| Média NVIDIA GeForce RTX 2070 Super Mobile (118 - 124, n=2) | |
| Asus Strix G17 G712LWS | |
| MSI GL75 10SFR | |
| Acer Predator Helios 300 PH317-54-75G8 | |
| Death Stranding - 1920x1080 Very High Preset | |
| Asus Strix G17 G712LWS (Turbo) | |
| Média NVIDIA GeForce RTX 2070 Super Mobile (116.2 - 123.8, n=4) | |
| Asus Strix G17 G712LWS | |
| MSI GL75 10SFR | |
| Flight Simulator 2020 - 1920x1080 High-End AA:TAA AF:8x | |
| Média NVIDIA GeForce RTX 2070 Super Mobile (48.8 - 53.3, n=2) | |
| Asus Strix G17 G712LWS | |
| Acer Predator Helios 300 PH317-54-75G8 | |
| Serious Sam 4 - 1920x1080 Ultra (DX12) AA:2xMS | |
| Média NVIDIA GeForce RTX 2070 Super Mobile (71.1 - 82.1, n=4) | |
| Asus Strix G17 G712LWS | |
| Acer Predator Helios 300 PH317-54-75G8 | |
| Mafia Definitive Edition - 1920x1080 High Preset | |
| Média NVIDIA GeForce RTX 2070 Super Mobile (92 - 96.6, n=2) | |
| Asus Strix G17 G712LWS | |
| Acer Predator Helios 300 PH317-54-75G8 | |
| baixo | média | alto | ultra | |
|---|---|---|---|---|
| BioShock Infinite (2013) | 371.8 | 308.3 | 299 | 173.4 |
| The Witcher 3 (2015) | 296.3 | 236.7 | 154.3 | 87.8 |
| Shadow of the Tomb Raider (2018) | 121 | 110 | 107 | 100 |
| Doom Eternal (2020) | 219.1 | 165.7 | 158.5 | 155.4 |
| Gears Tactics (2020) | 249.1 | 172.4 | 122.2 | 90 |
| F1 2020 (2020) | 227 | 168 | 147 | 118 |
| Death Stranding (2020) | 145 | 128.2 | 117.8 | 116.2 |
| Horizon Zero Dawn (2020) | 139 | 107 | 94 | 77 |
| Flight Simulator 2020 (2020) | 66.6 | 58 | 48.8 | 37.8 |
| Serious Sam 4 (2020) | 124 | 94 | 81.6 | 71.1 |
| Mafia Definitive Edition (2020) | 123.7 | 95.2 | 92 | |
| Star Wars Squadrons (2020) | 263.1 | 224.6 | 211.5 | 202.4 |
Barulho
| Ocioso |
| 32 / 34 / 37 dB |
| Carga |
| 51 / 53 dB |
 | ||
30 dB silencioso 40 dB(A) audível 50 dB(A) ruidosamente alto |
||
min: | ||
| Asus Strix G17 G712LWS i7-10750H, GeForce RTX 2070 Super Mobile | Asus ROG Strix G GL731GU-RB74 i7-9750H, GeForce GTX 1660 Ti Mobile | Schenker XMG Pro 17 PB71RD-G i7-9750H, GeForce RTX 2060 Mobile | MSI GL75 10SFR i7-10750H, GeForce RTX 2070 Mobile | Lenovo Legion Y740-17IRHg-81UJ001VGE i7-9750H, GeForce RTX 2080 Max-Q | Acer Predator Helios 300 PH317-54-75G8 i7-10750H, GeForce RTX 2060 Mobile | |
|---|---|---|---|---|---|---|
| Noise | -0% | -3% | -2% | 11% | 7% | |
| desligado / ambiente * (dB) | 25 | 28.2 -13% | 30 -20% | 30.1 -20% | 30.3 -21% | 24 4% |
| Idle Minimum * (dB) | 32 | 31.8 1% | 30 6% | 32.2 -1% | 30.3 5% | 25 22% |
| Idle Average * (dB) | 34 | 32 6% | 32 6% | 32.2 5% | 30.3 11% | 30 12% |
| Idle Maximum * (dB) | 37 | 40.6 -10% | 39 -5% | 32.2 13% | 30.5 18% | 37 -0% |
| Load Average * (dB) | 51 | 48 6% | 51 -0% | 52.8 -4% | 40.8 20% | 48 6% |
| Witcher 3 ultra * (dB) | 50 | 48 4% | 54 -8% | 53.8 -8% | 40.5 19% | 50 -0% |
| Load Maximum * (dB) | 53 | 51.5 3% | 54 -2% | 53.2 -0% | 40.8 23% | 52 2% |
* ... menor é melhor
(-) A temperatura máxima no lado superior é 53 °C / 127 F, em comparação com a média de 40.4 °C / 105 F , variando de 21.2 a 68.8 °C para a classe Gaming.
(-) A parte inferior aquece até um máximo de 56 °C / 133 F, em comparação com a média de 43.2 °C / 110 F
(+) Em uso inativo, a temperatura média para o lado superior é 27.7 °C / 82 F, em comparação com a média do dispositivo de 33.9 °C / ### class_avg_f### F.
(-) Jogando The Witcher 3, a temperatura média para o lado superior é 39.6 °C / 103 F, em comparação com a média do dispositivo de 33.9 °C / ## #class_avg_f### F.
(+) Os apoios para as mãos e o touchpad são mais frios que a temperatura da pele, com um máximo de 28 °C / 82.4 F e, portanto, são frios ao toque.
(±) A temperatura média da área do apoio para as mãos de dispositivos semelhantes foi 28.8 °C / 83.8 F (+0.8 °C / 1.4 F).
| Asus Strix G17 G712LWS i7-10750H, GeForce RTX 2070 Super Mobile | Asus ROG Strix G GL731GU-RB74 i7-9750H, GeForce GTX 1660 Ti Mobile | Schenker XMG Pro 17 PB71RD-G i7-9750H, GeForce RTX 2060 Mobile | MSI GL75 10SFR i7-10750H, GeForce RTX 2070 Mobile | Lenovo Legion Y740-17IRHg-81UJ001VGE i7-9750H, GeForce RTX 2080 Max-Q | Acer Predator Helios 300 PH317-54-75G8 i7-10750H, GeForce RTX 2060 Mobile | |
|---|---|---|---|---|---|---|
| Heat | 4% | 3% | 12% | 7% | -2% | |
| Maximum Upper Side * (°C) | 53 | 44.6 16% | 47 11% | 44 17% | 40.7 23% | 53 -0% |
| Maximum Bottom * (°C) | 56 | 51.6 8% | 48 14% | 42.5 24% | 42.2 25% | 59 -5% |
| Idle Upper Side * (°C) | 29 | 31.6 -9% | 30 -3% | 29.1 -0% | 31.9 -10% | 29 -0% |
| Idle Bottom * (°C) | 31 | 31.4 -1% | 34 -10% | 29.5 5% | 33.9 -9% | 32 -3% |
* ... menor é melhor
Asus Strix G17 G712LWS análise de áudio
(±) | o volume do alto-falante é médio, mas bom (###valor### dB)
Graves 100 - 315Hz
(±) | graves reduzidos - em média 9.8% menor que a mediana
(±) | a linearidade dos graves é média (8.3% delta para a frequência anterior)
Médios 400 - 2.000 Hz
(±) | médios mais altos - em média 5.5% maior que a mediana
(+) | médios são lineares (5.8% delta para frequência anterior)
Altos 2 - 16 kHz
(+) | agudos equilibrados - apenas 2.4% longe da mediana
(+) | os máximos são lineares (3.4% delta da frequência anterior)
Geral 100 - 16.000 Hz
(+) | o som geral é linear (12.9% diferença em relação à mediana)
Comparado com a mesma classe
» 17% de todos os dispositivos testados nesta classe foram melhores, 4% semelhantes, 79% piores
» O melhor teve um delta de 6%, a média foi 18%, o pior foi 132%
Comparado com todos os dispositivos testados
» 12% de todos os dispositivos testados foram melhores, 3% semelhantes, 85% piores
» O melhor teve um delta de 4%, a média foi 24%, o pior foi 134%
| desligado | |
| Ocioso | |
| Carga |
|
Key:
min: | |
| Asus Strix G17 G712LWS i7-10750H, GeForce RTX 2070 Super Mobile | Asus ROG Strix G GL731GU-RB74 i7-9750H, GeForce GTX 1660 Ti Mobile | Schenker XMG Pro 17 PB71RD-G i7-9750H, GeForce RTX 2060 Mobile | MSI GL75 10SFR i7-10750H, GeForce RTX 2070 Mobile | Lenovo Legion Y740-17IRHg-81UJ001VGE i7-9750H, GeForce RTX 2080 Max-Q | Acer Predator Helios 300 PH317-54-75G8 i7-10750H, GeForce RTX 2060 Mobile | |
|---|---|---|---|---|---|---|
| Power Consumption | -18% | 1% | -2% | -20% | 25% | |
| Idle Minimum * (Watt) | 10 | 13.6 -36% | 11 -10% | 12 -20% | 15.7 -57% | 6 40% |
| Idle Average * (Watt) | 14 | 26.2 -87% | 18 -29% | 16.6 -19% | 26.3 -88% | 11 21% |
| Idle Maximum * (Watt) | 25 | 35 -40% | 28 -12% | 18 28% | 28 -12% | 19 24% |
| Load Average * (Watt) | 134 | 113.6 15% | 99 26% | 130 3% | 136 -1% | 96 28% |
| Witcher 3 ultra * (Watt) | 186 | 134.1 28% | 146 22% | 203 -9% | 160 14% | 144 23% |
| Load Maximum * (Watt) | 230 | 200.2 13% | 210 9% | 224 3% | 177 23% | 197 14% |
* ... menor é melhor
| Asus Strix G17 G712LWS i7-10750H, GeForce RTX 2070 Super Mobile, 66 Wh | Asus ROG Strix G GL731GU-RB74 i7-9750H, GeForce GTX 1660 Ti Mobile, 66 Wh | Schenker XMG Pro 17 PB71RD-G i7-9750H, GeForce RTX 2060 Mobile, 62 Wh | MSI GL75 10SFR i7-10750H, GeForce RTX 2070 Mobile, 51 Wh | Lenovo Legion Y740-17IRHg-81UJ001VGE i7-9750H, GeForce RTX 2080 Max-Q, 76 Wh | Acer Predator Helios 300 PH317-54-75G8 i7-10750H, GeForce RTX 2060 Mobile, 59 Wh | |
|---|---|---|---|---|---|---|
| Duração da bateria | -5% | -29% | -34% | -47% | 1% | |
| Reader / Idle (h) | 9.1 | 8.6 -5% | 5.2 -43% | 6.4 -30% | 3.8 -58% | 8.2 -10% |
| H.264 (h) | 7.1 | 5.2 -27% | 2.8 -61% | 5.9 -17% | ||
| WiFi v1.3 (h) | 5.5 | 4.9 -11% | 4.1 -25% | 3.9 -29% | 3 -45% | 5.1 -7% |
| Load (h) | 1.6 | 1.6 0% | 1.3 -19% | 0.8 -50% | 1.2 -25% | 2.2 38% |
Pro
Contra
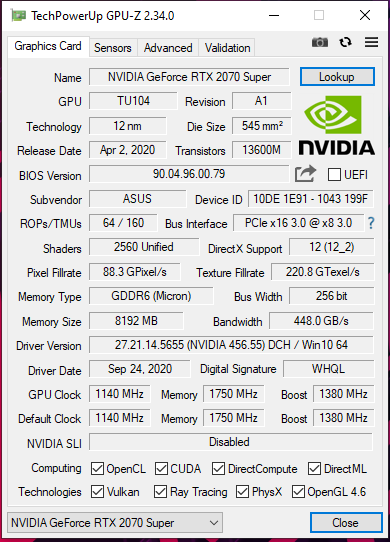
O poderoso hardware do Strix G17 roda todos os jogos de computador mais recentes fluentemente na tela. Você não precisa se comprometer quando se trata de resolução e nível de qualidade.
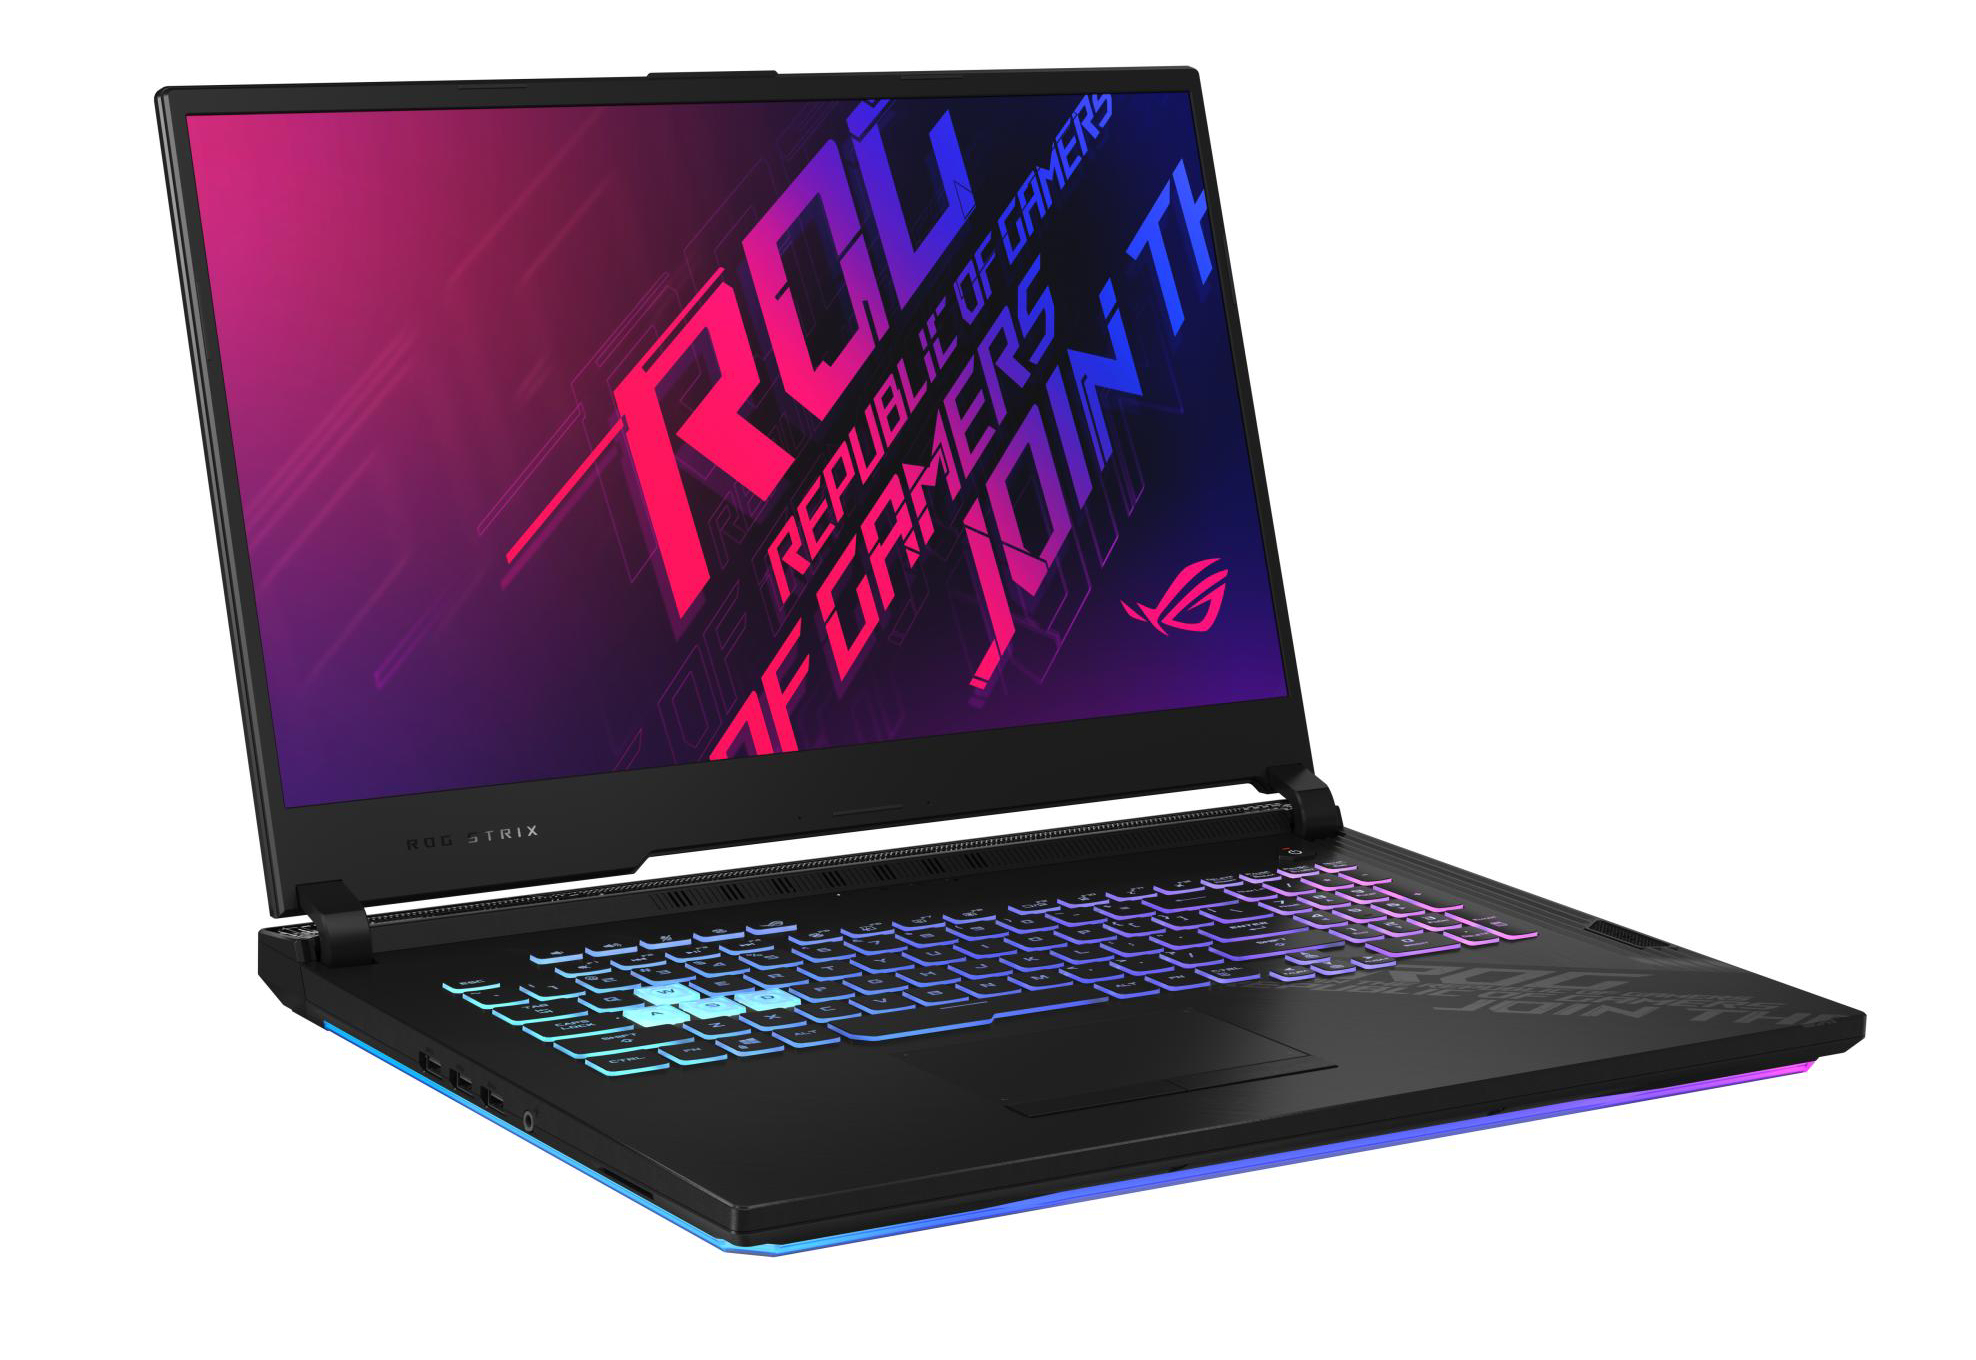
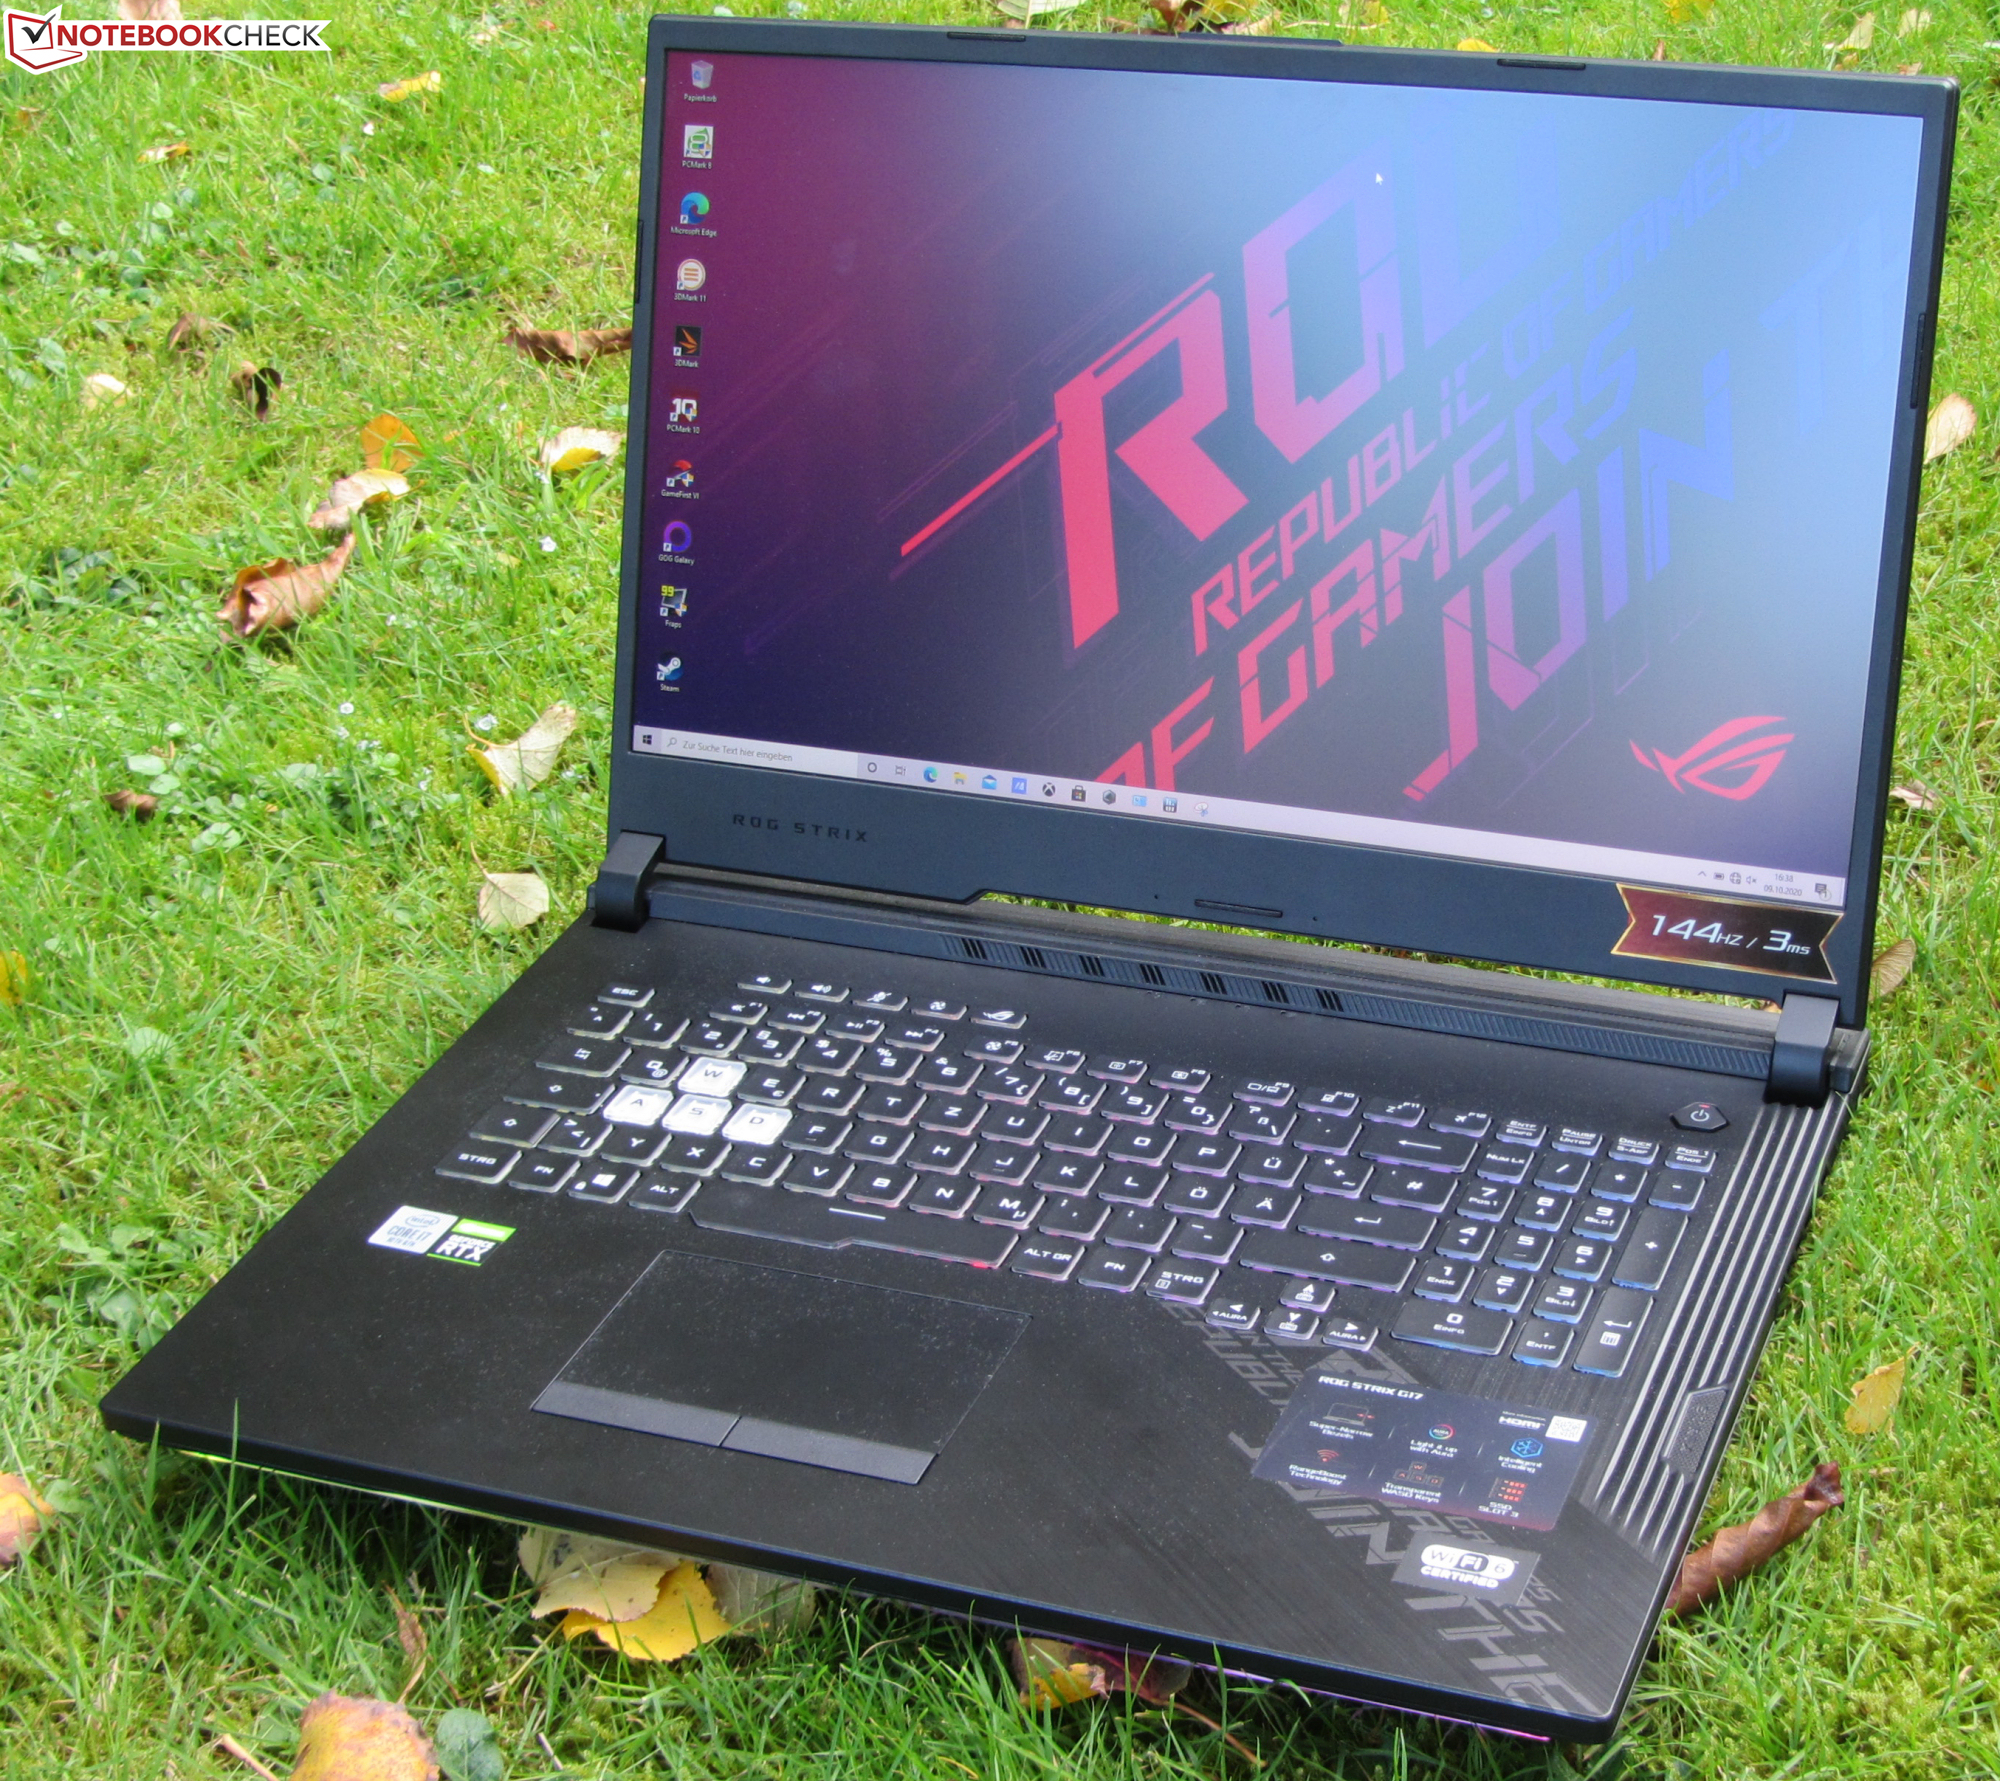
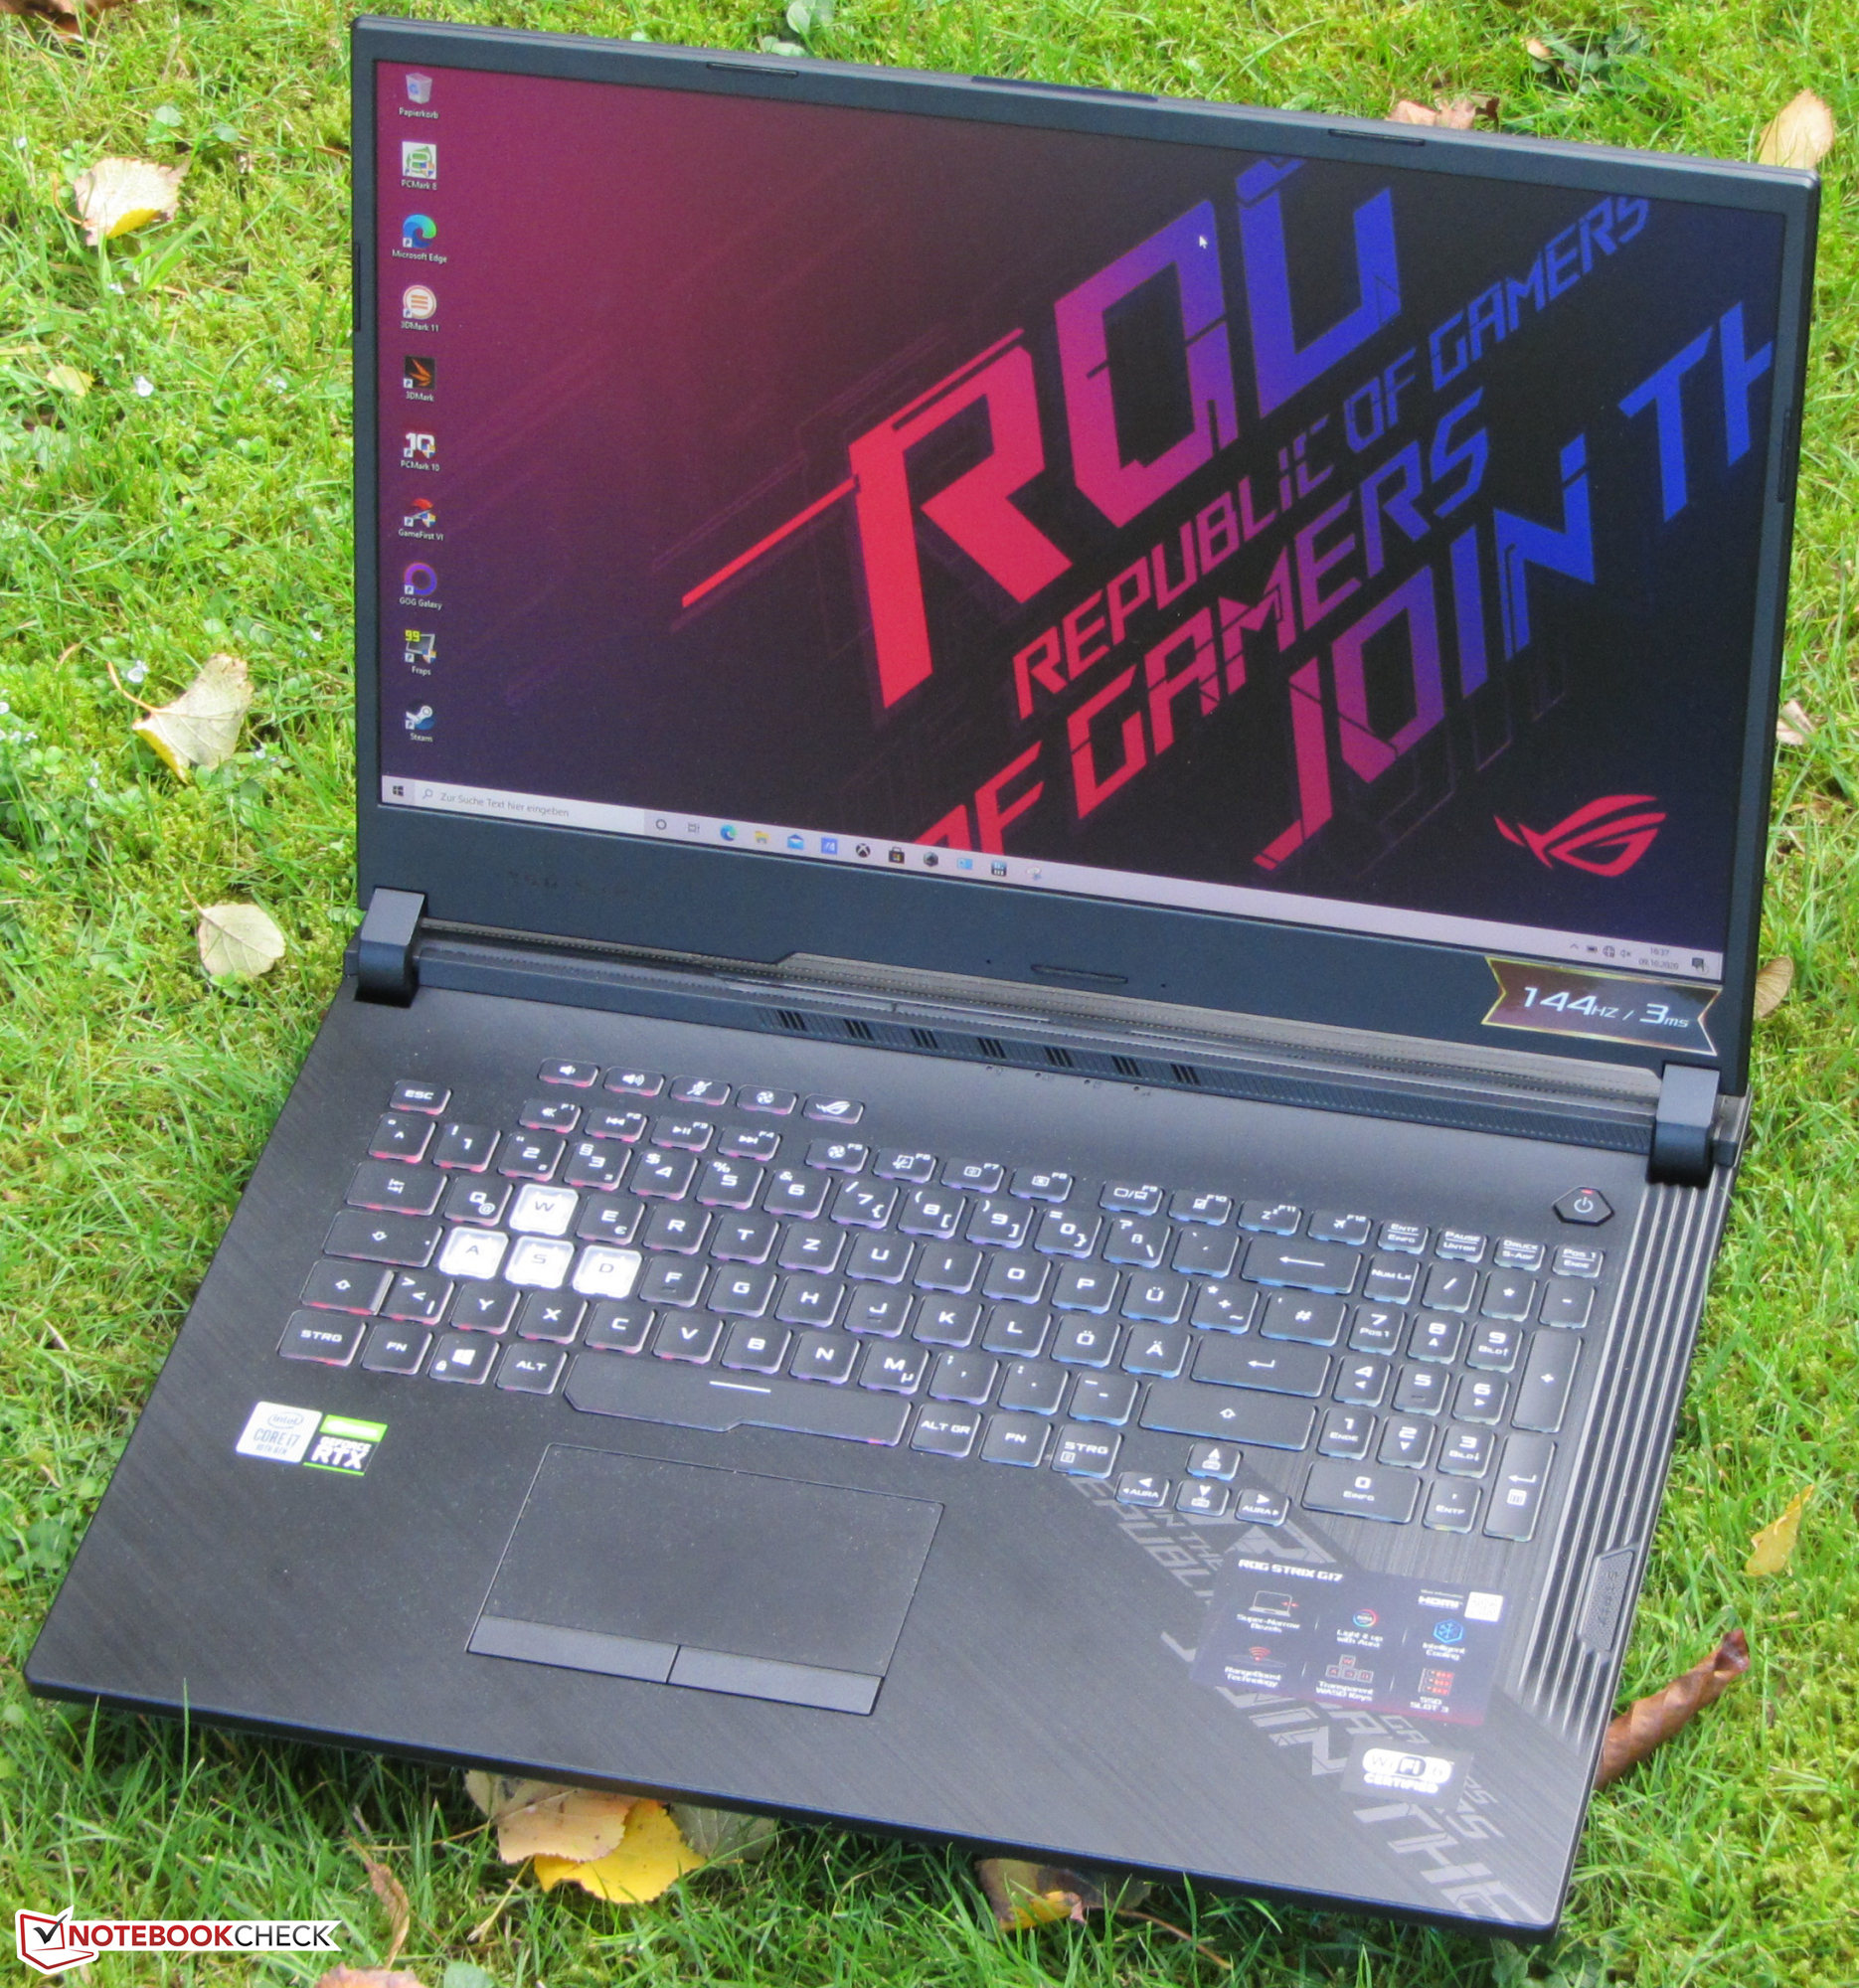
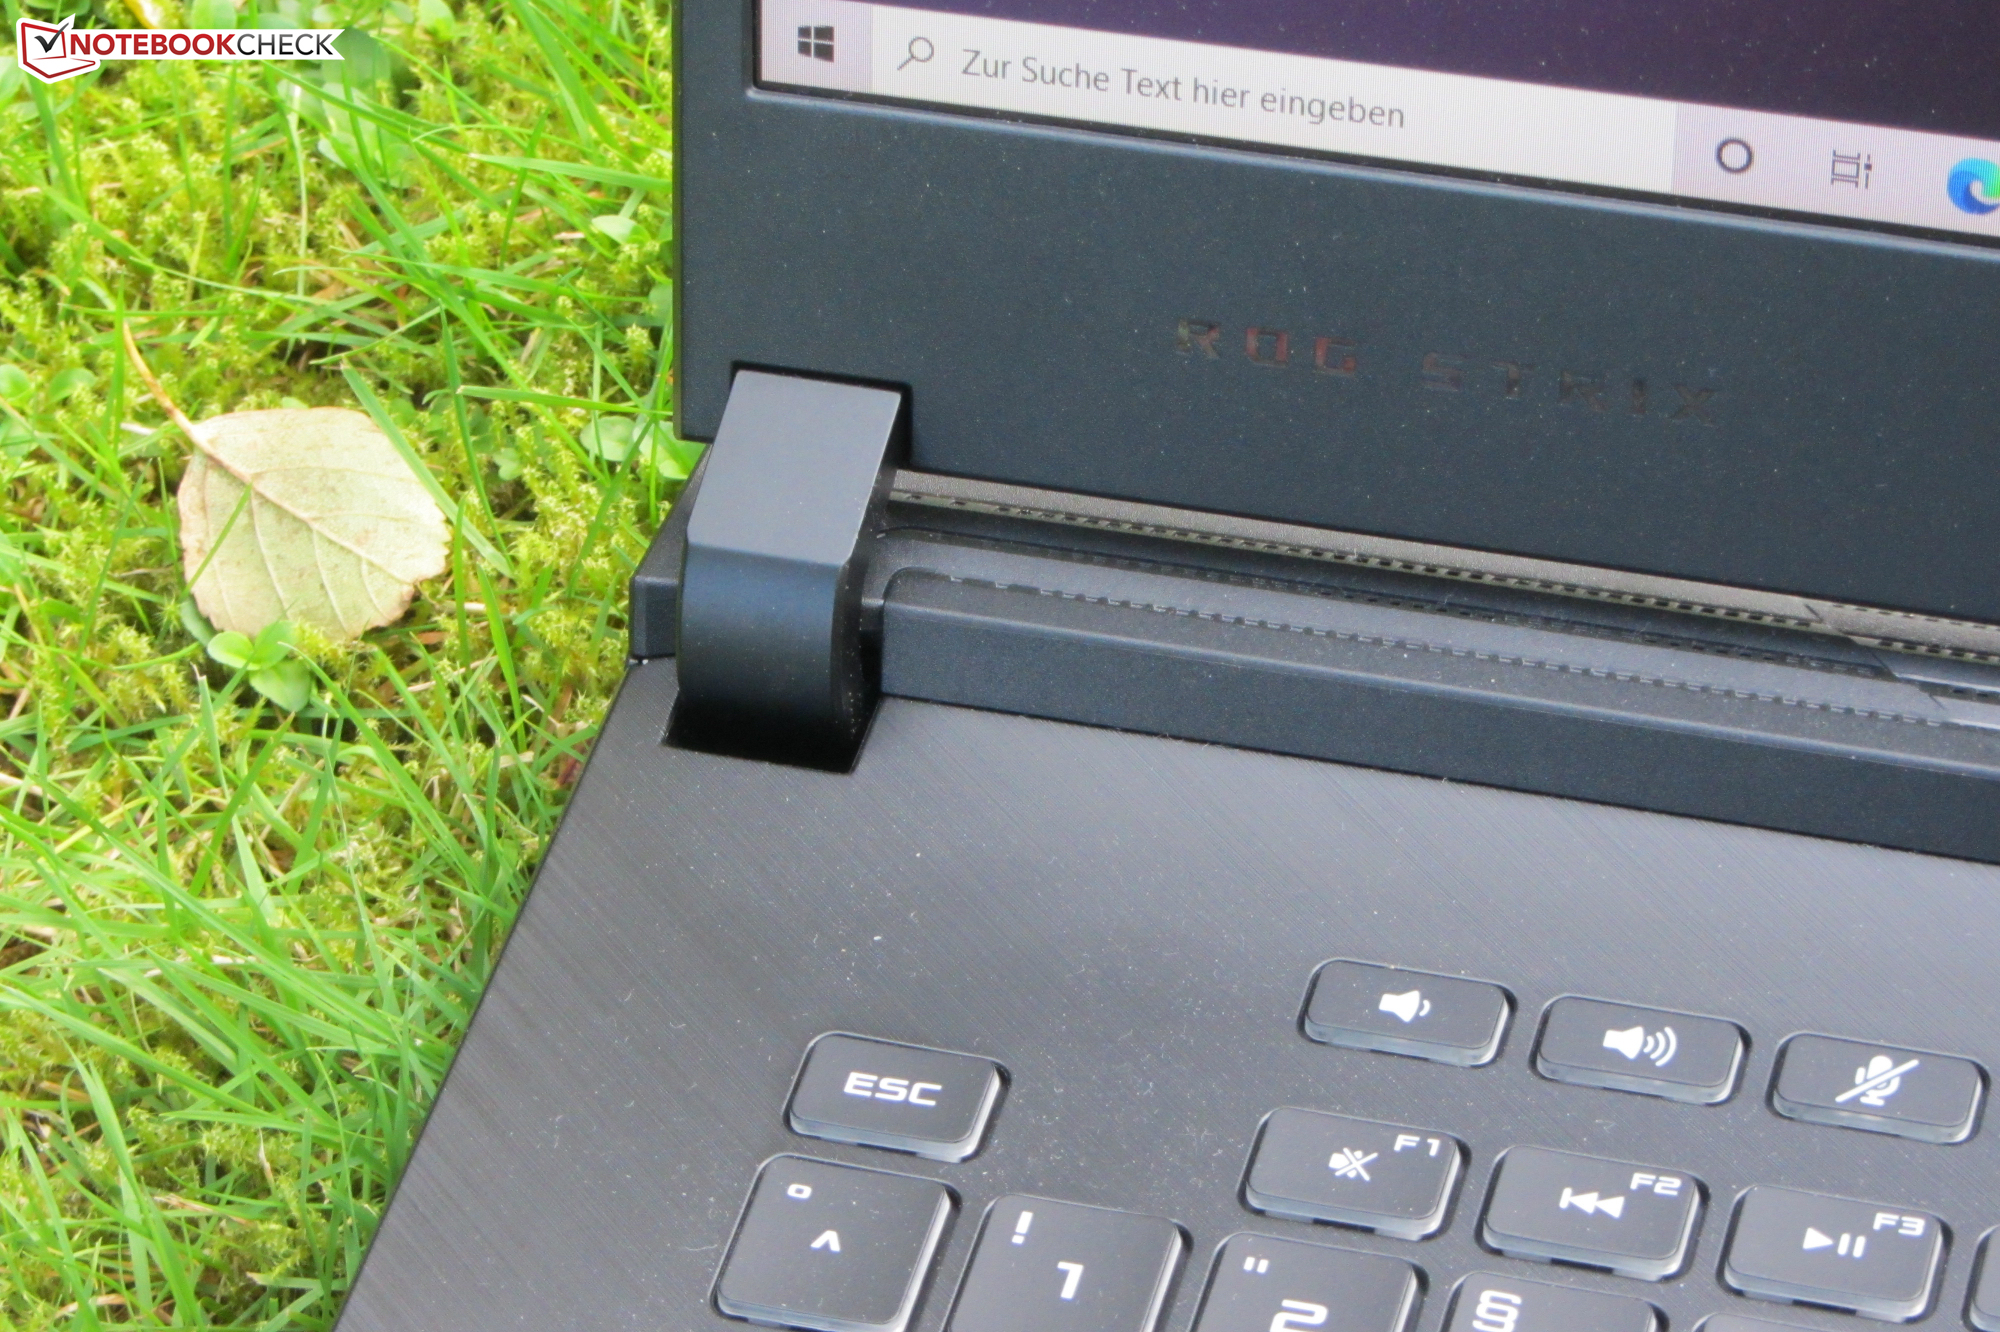
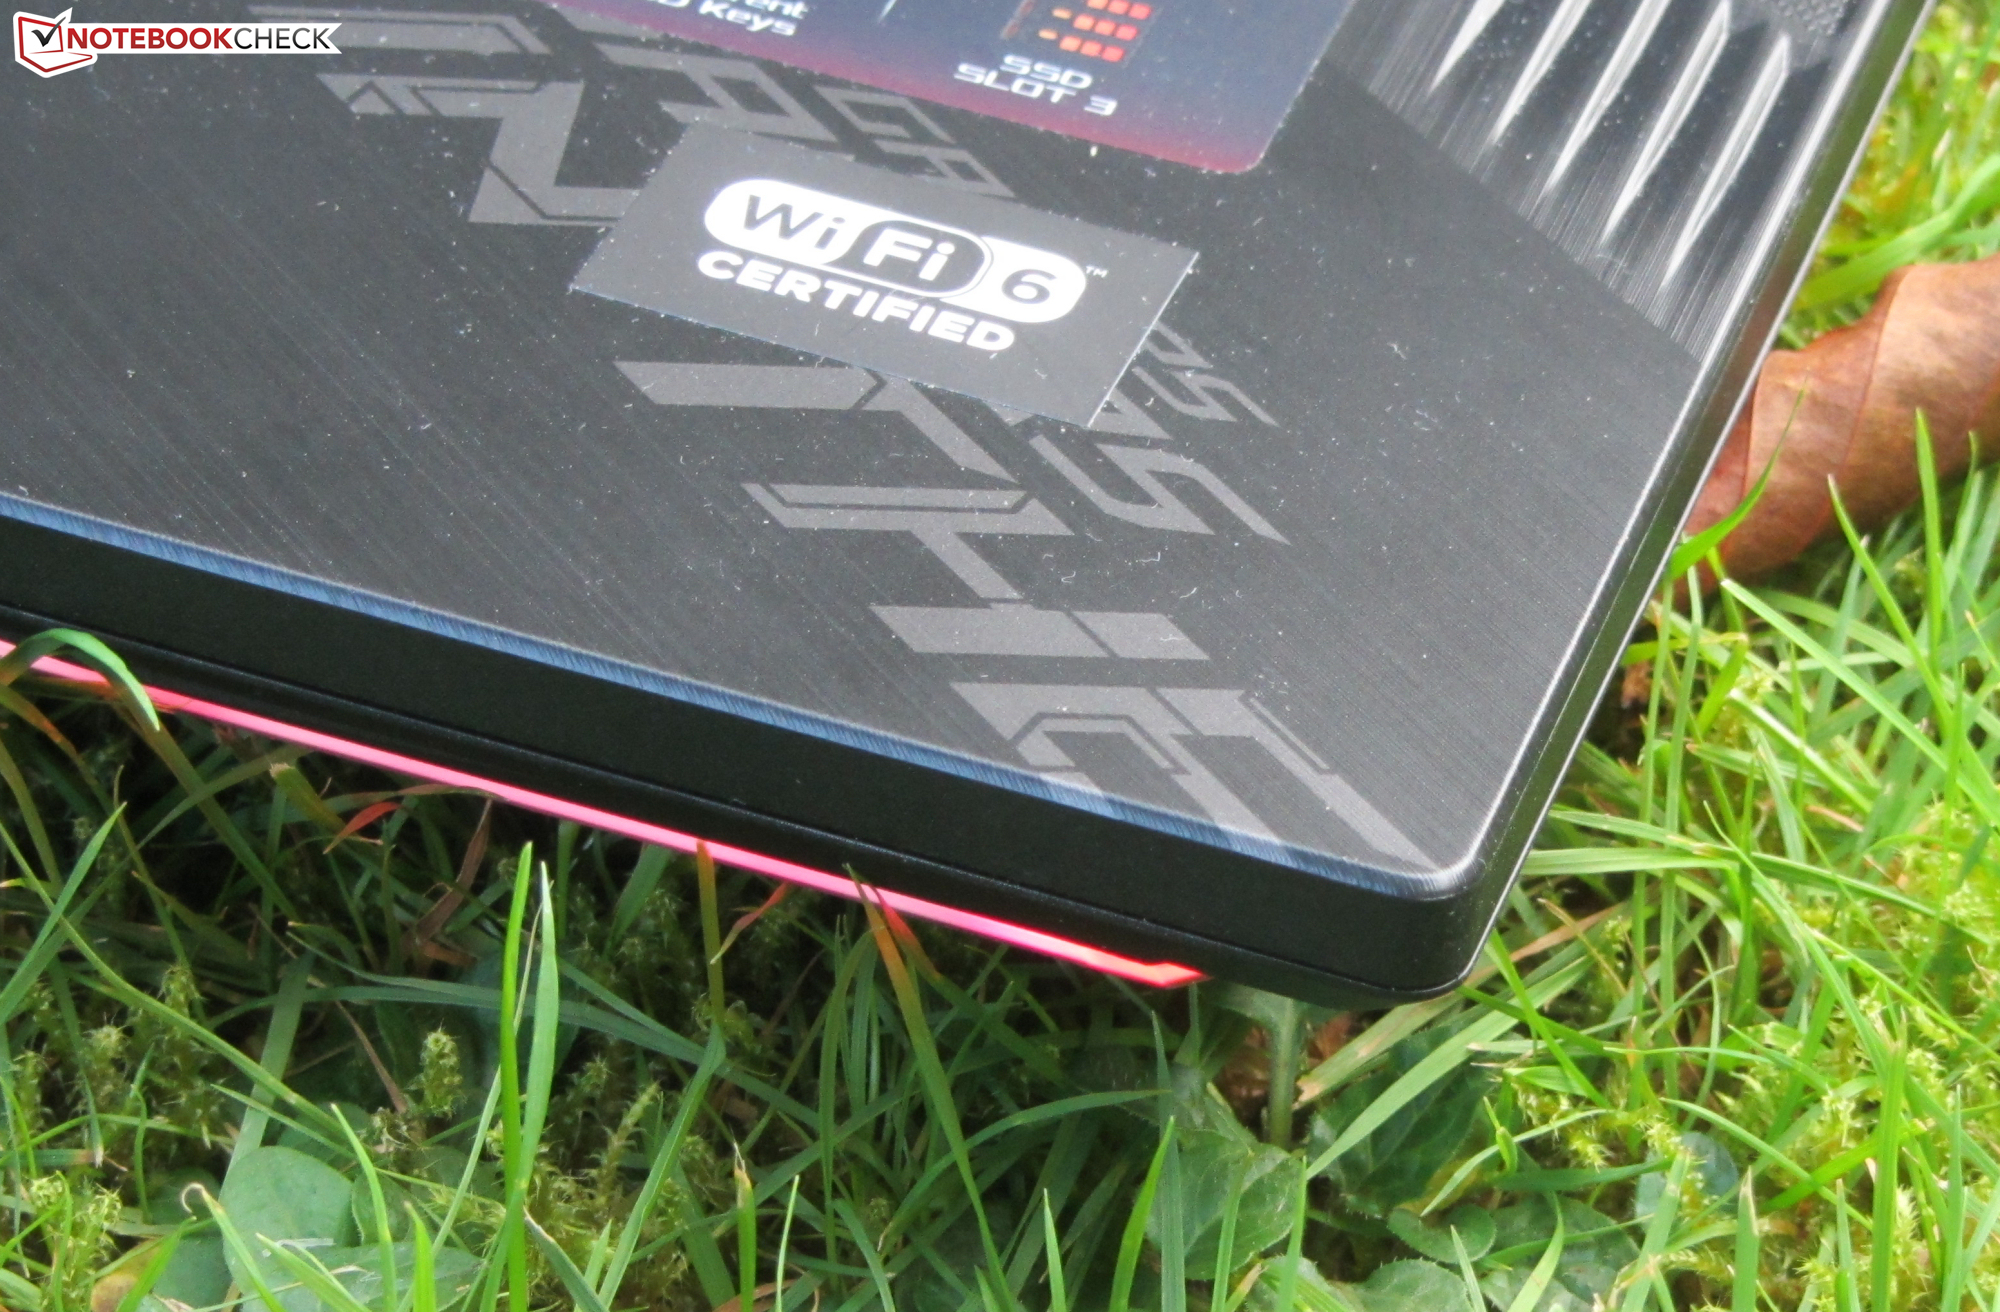
O que chama a atenção do portátil é a barra de LED que se estende ao longo de três lados da tampa inferior. O esquema de cores pode ser ajustado individualmente ao seu gosto.
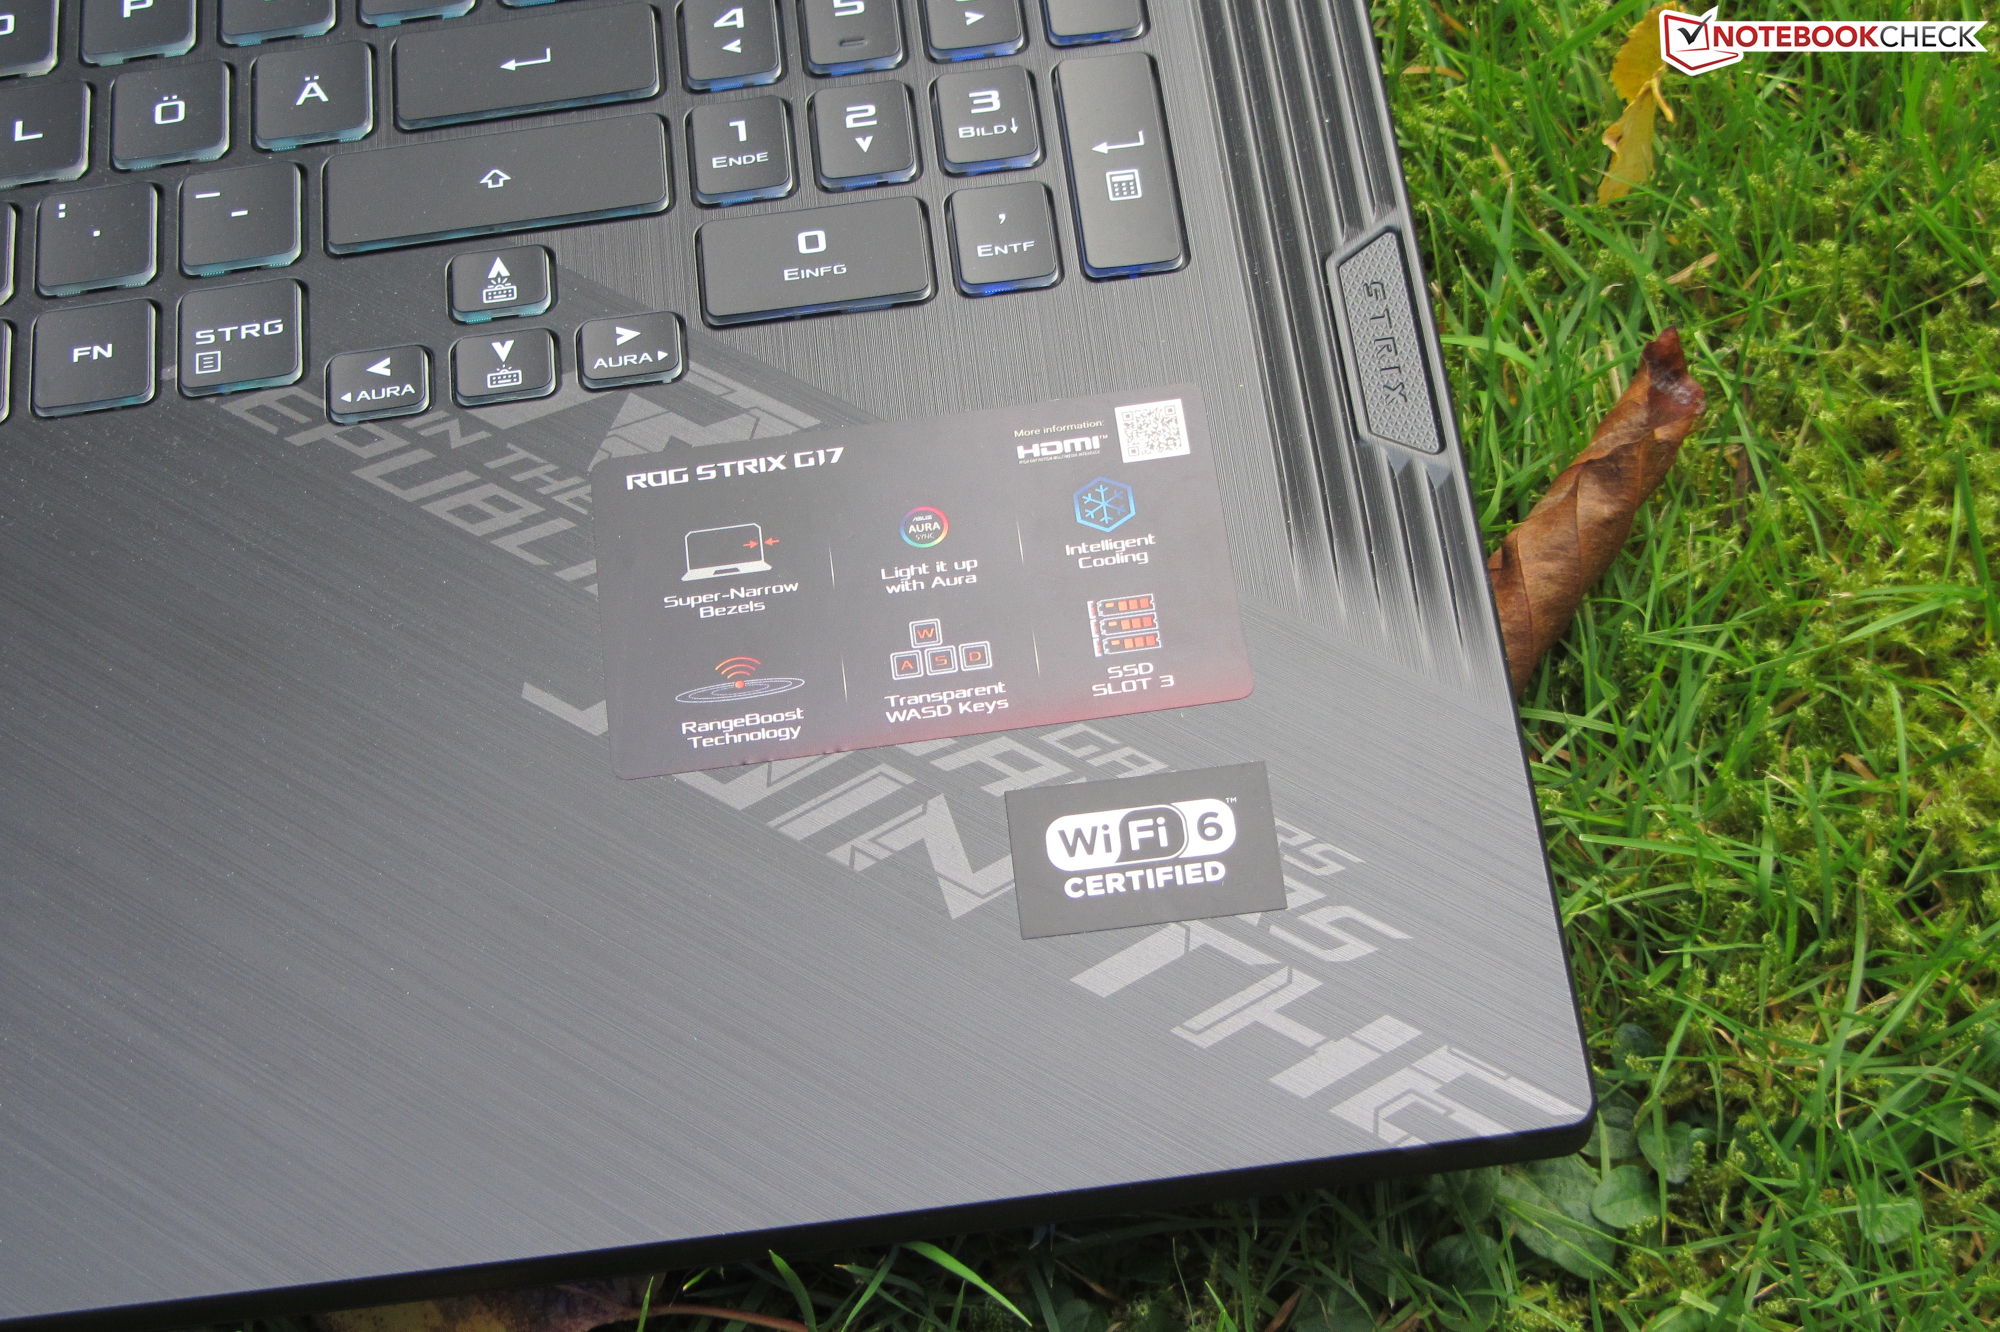
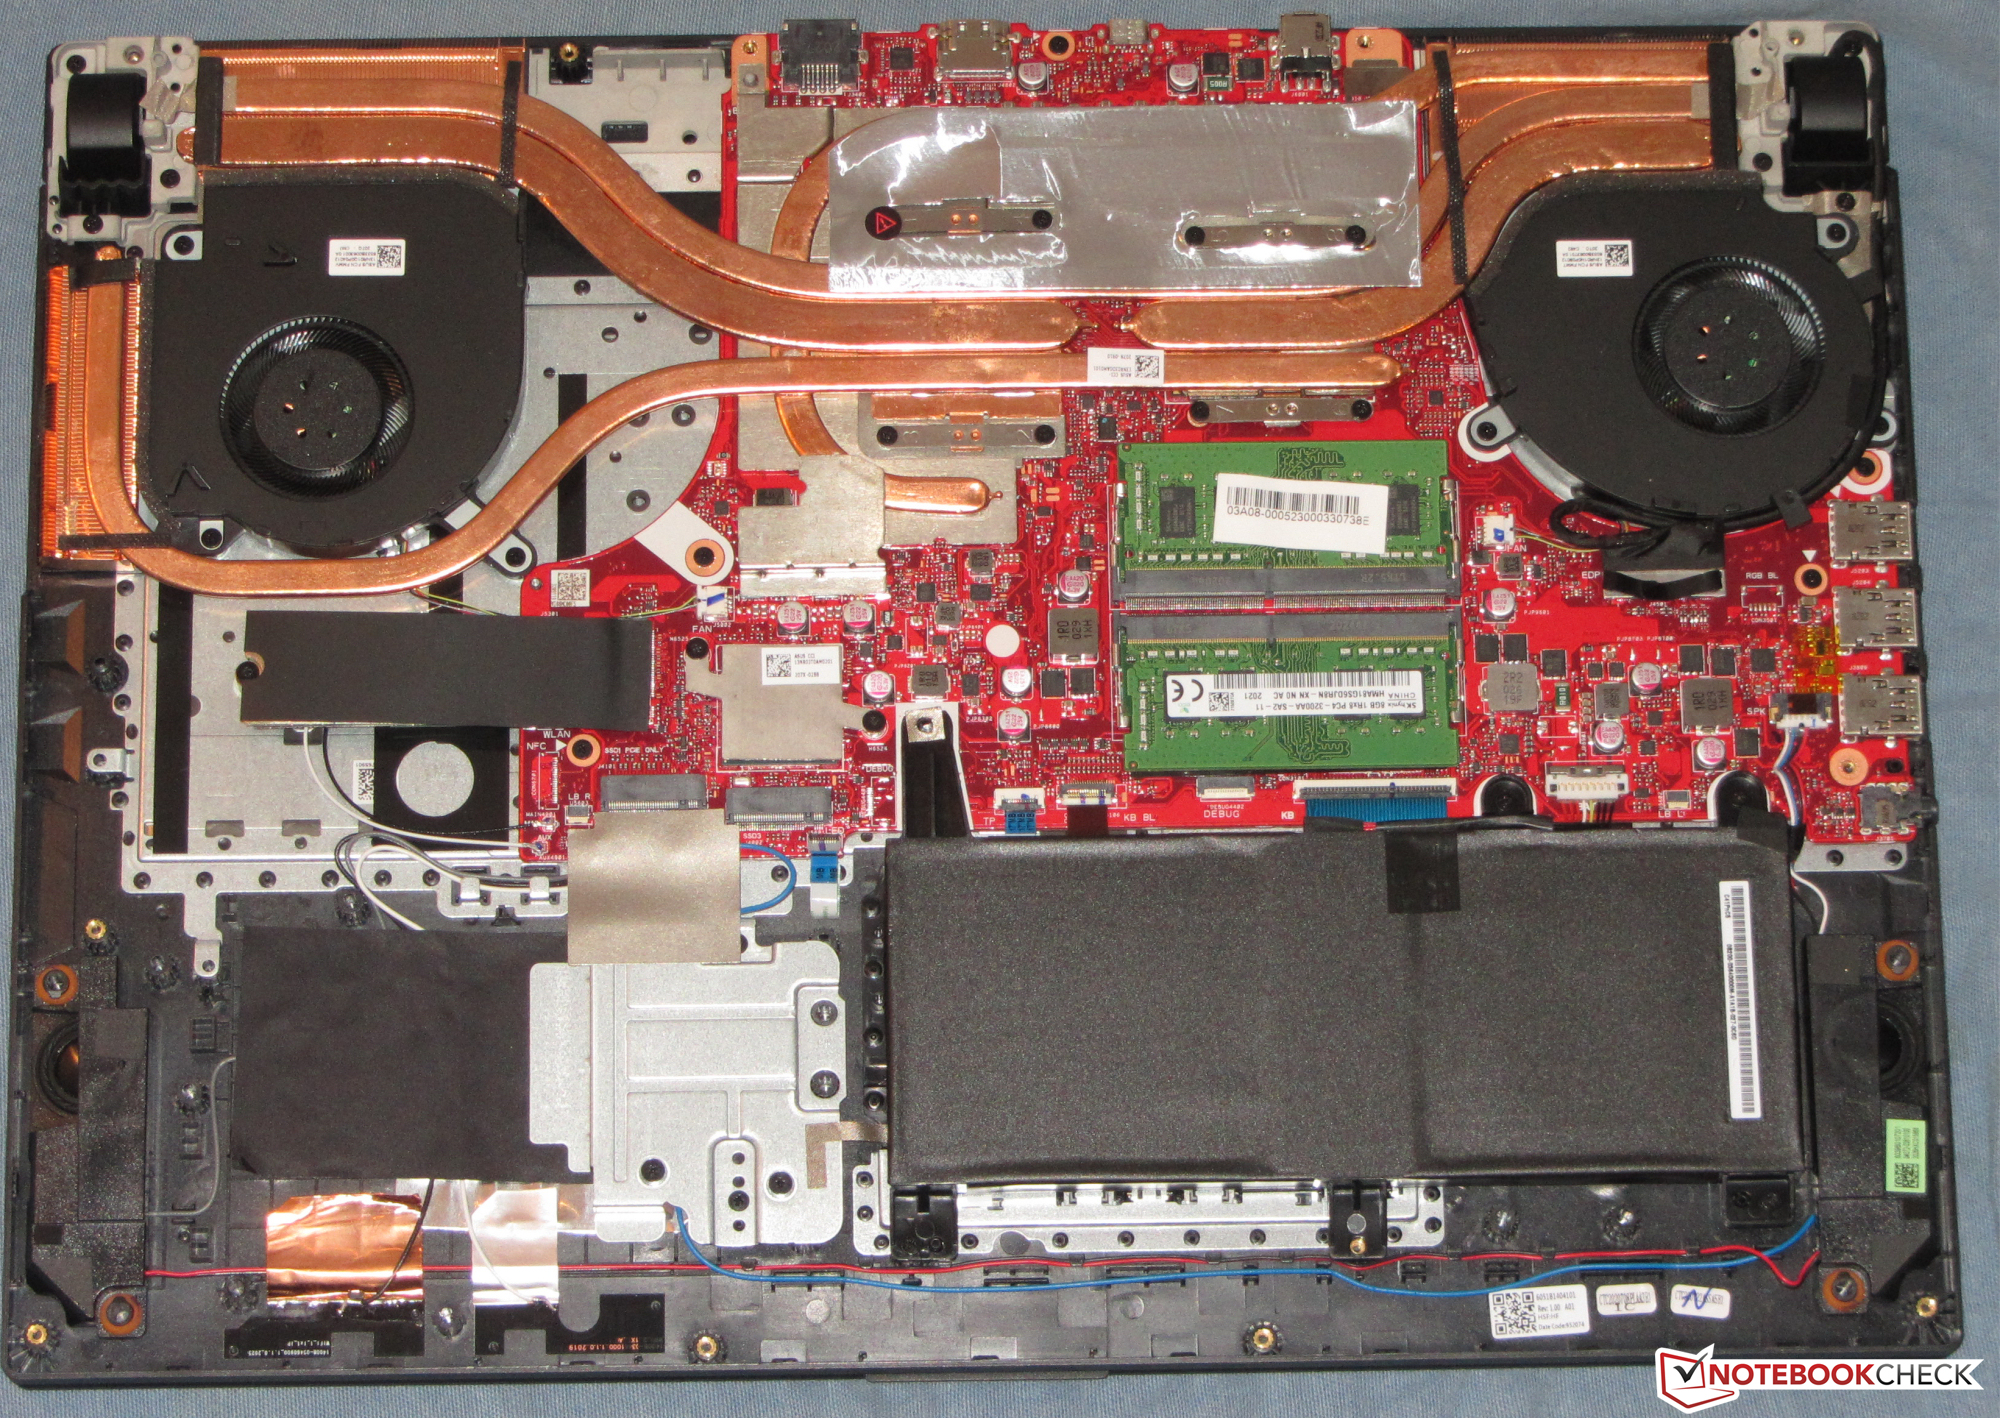
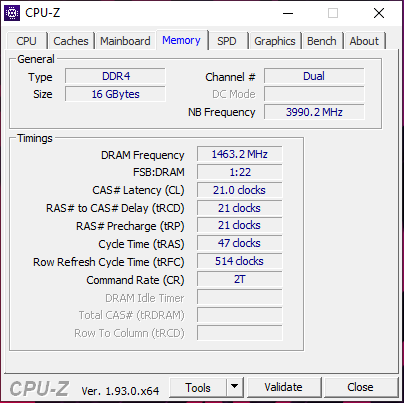
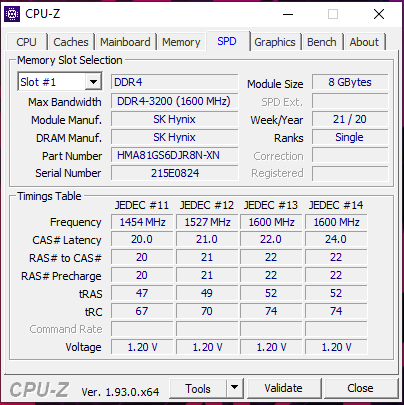
A capacidade de armazenamento (1 TB) pode ser expandida. Além do SSD NVMe existente, há espaço para mais dois modelos M.2. Suporte para RAID 0. A memória (2x 8 GB, modo de dois canais) também pode ser expandida. No entanto, de acordo com o website da Asuse, 32 GB é o limite. Muitos concorrentes suportam até 64 GB.
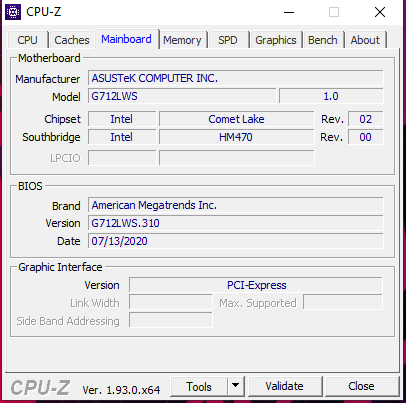
Os procedimentos de manutenção e atualização requerem a remoção da tampa inferior. Isso é factível em princípio. No entanto, a tampa inferior está conectada à placa-mãe com dois cabos de fita, portanto, você deve proceder com cuidado. Os cabos podem ser afrouxados e reconectados com um pouco de habilidade.
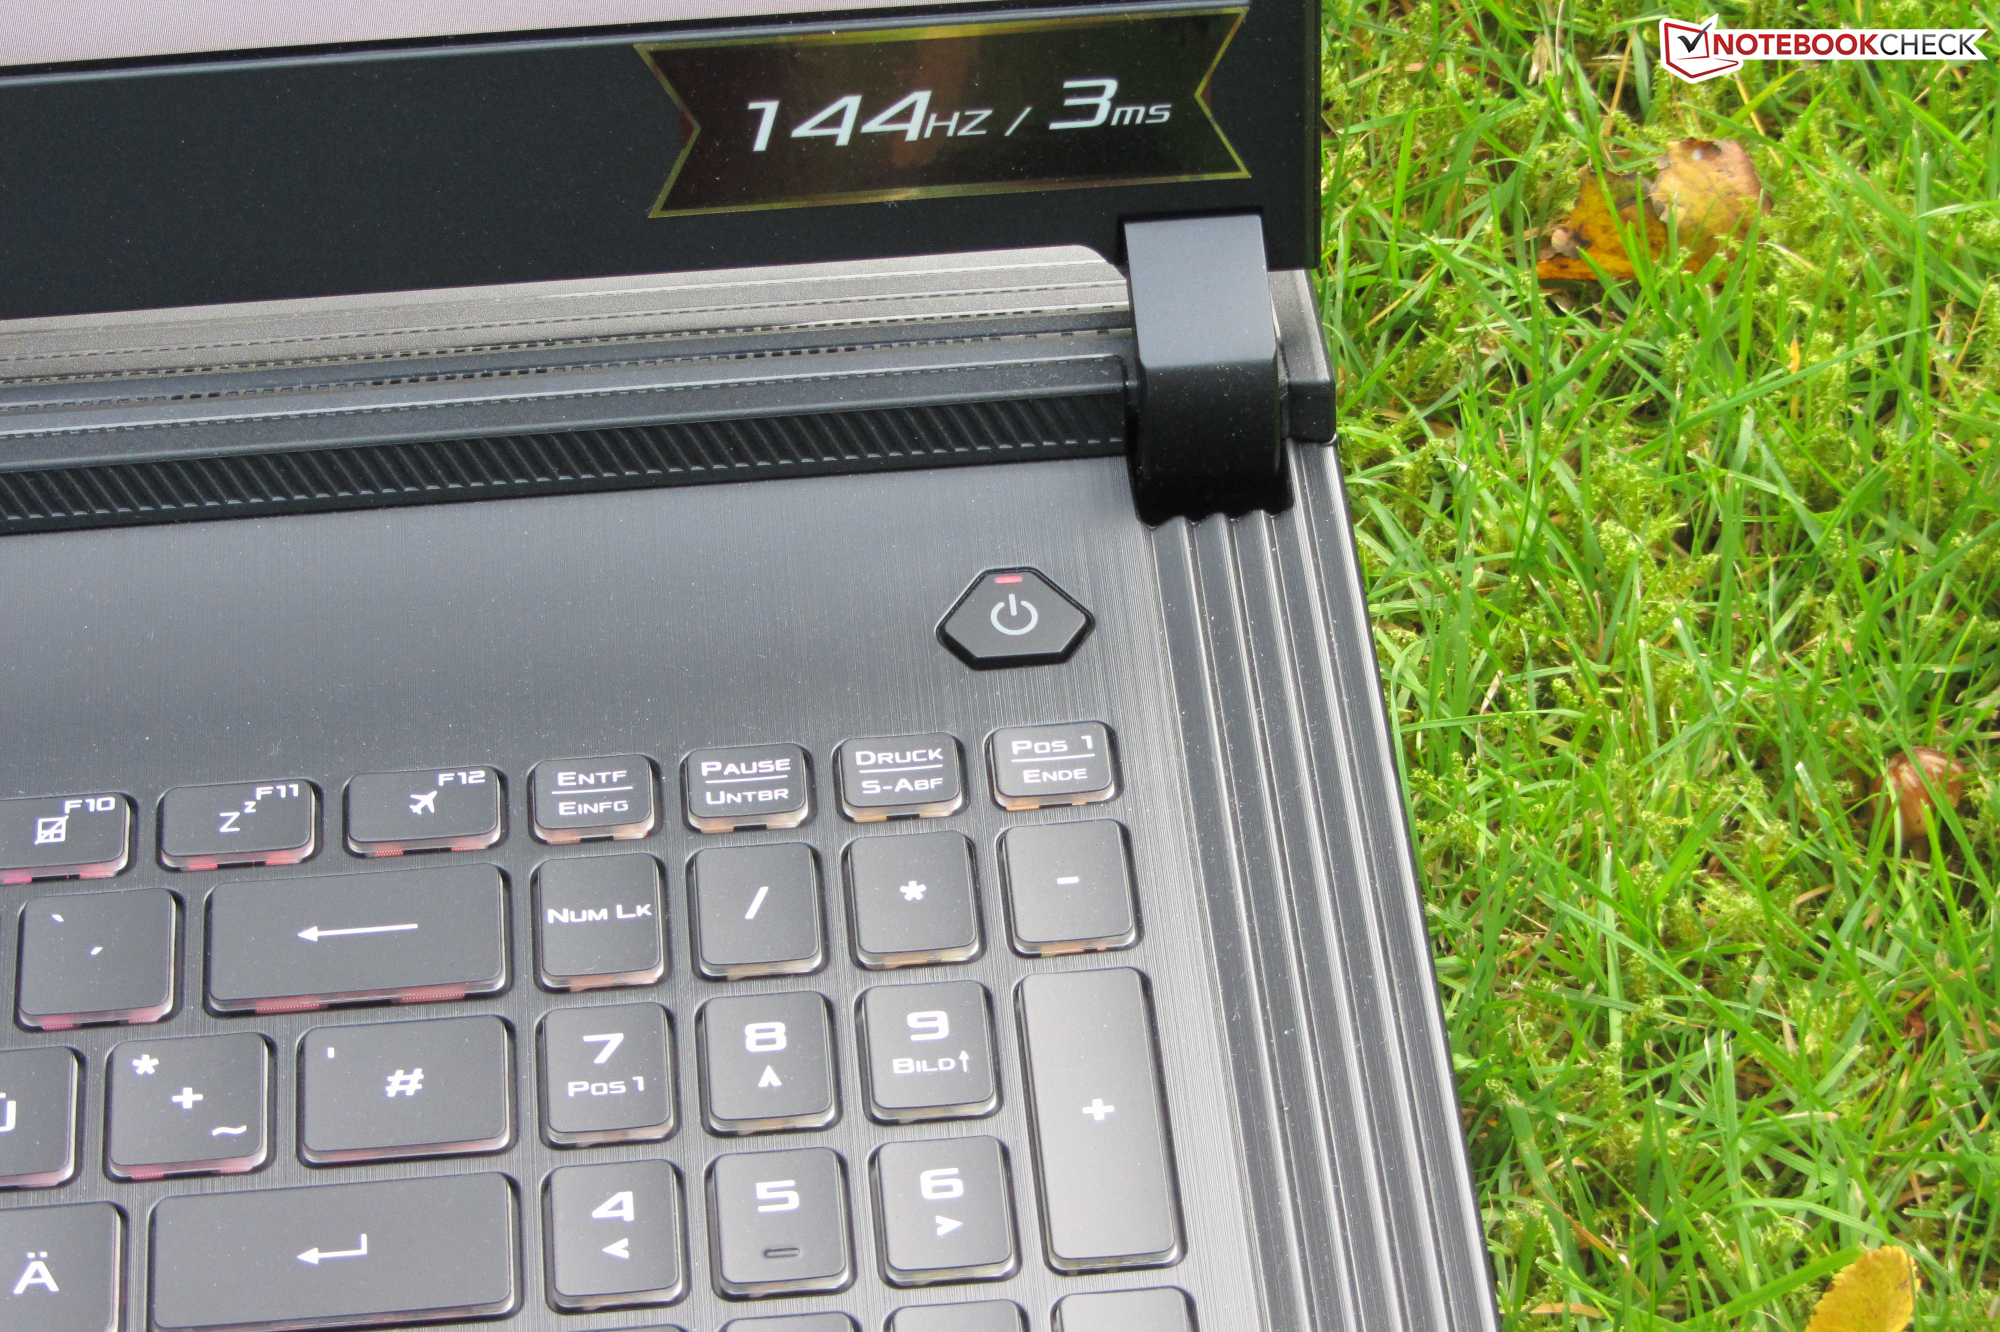
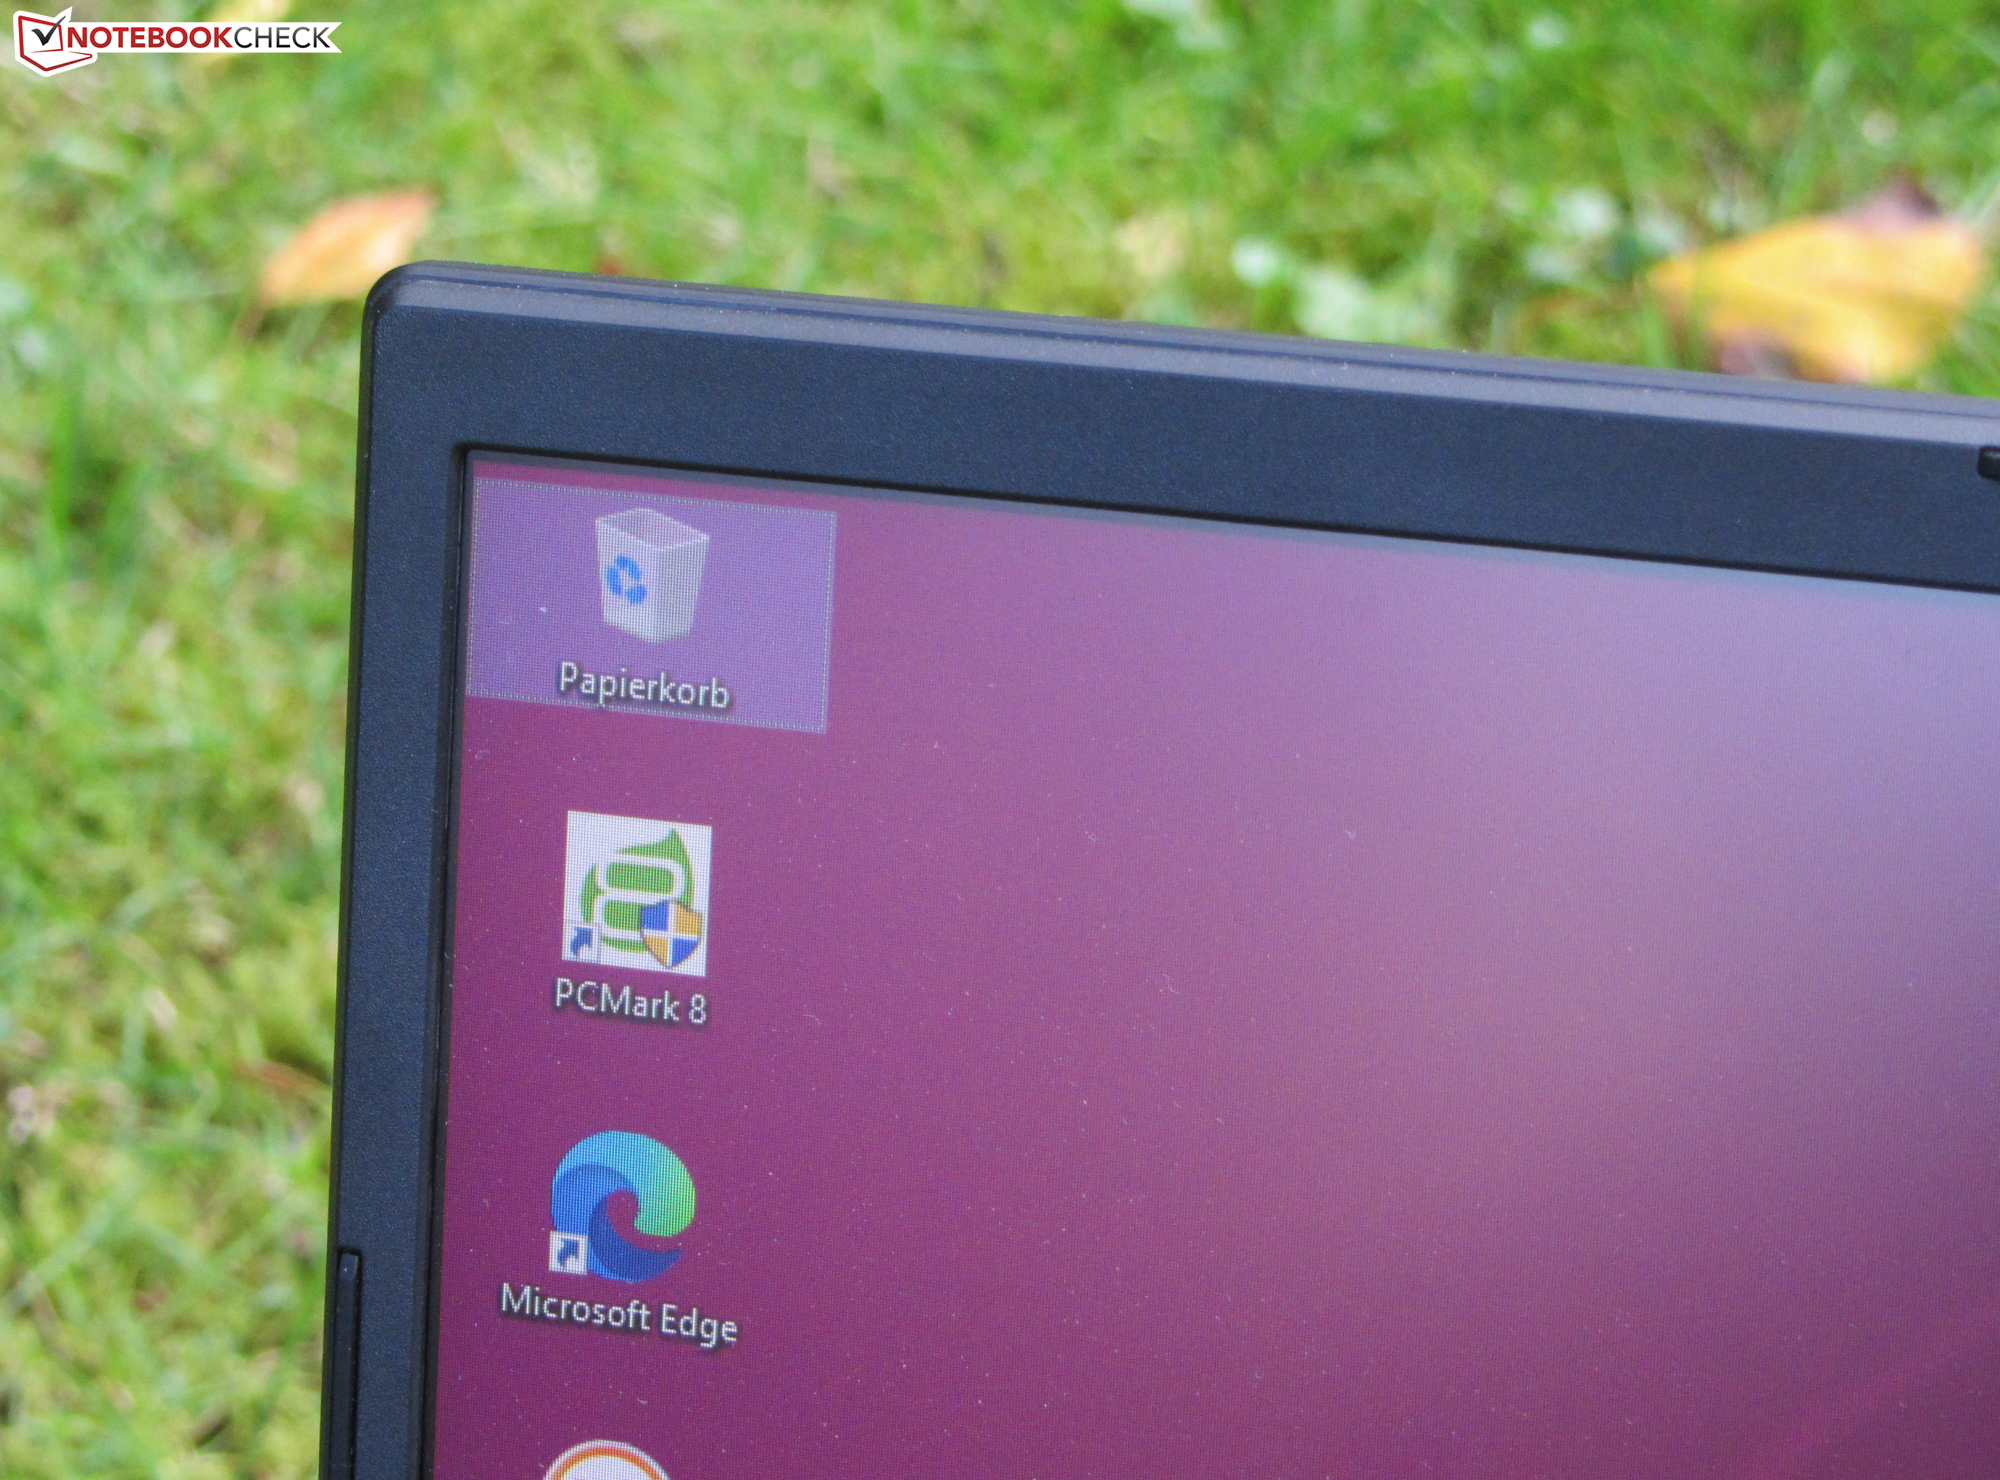
A tela Full HD (IPS, 144 Hz) marca pontos com uma superfície mate, ângulos de visão estáveis, brilho suficiente, bom contraste, tempos de resposta rápidos e uma reprodução de cores muito decente.
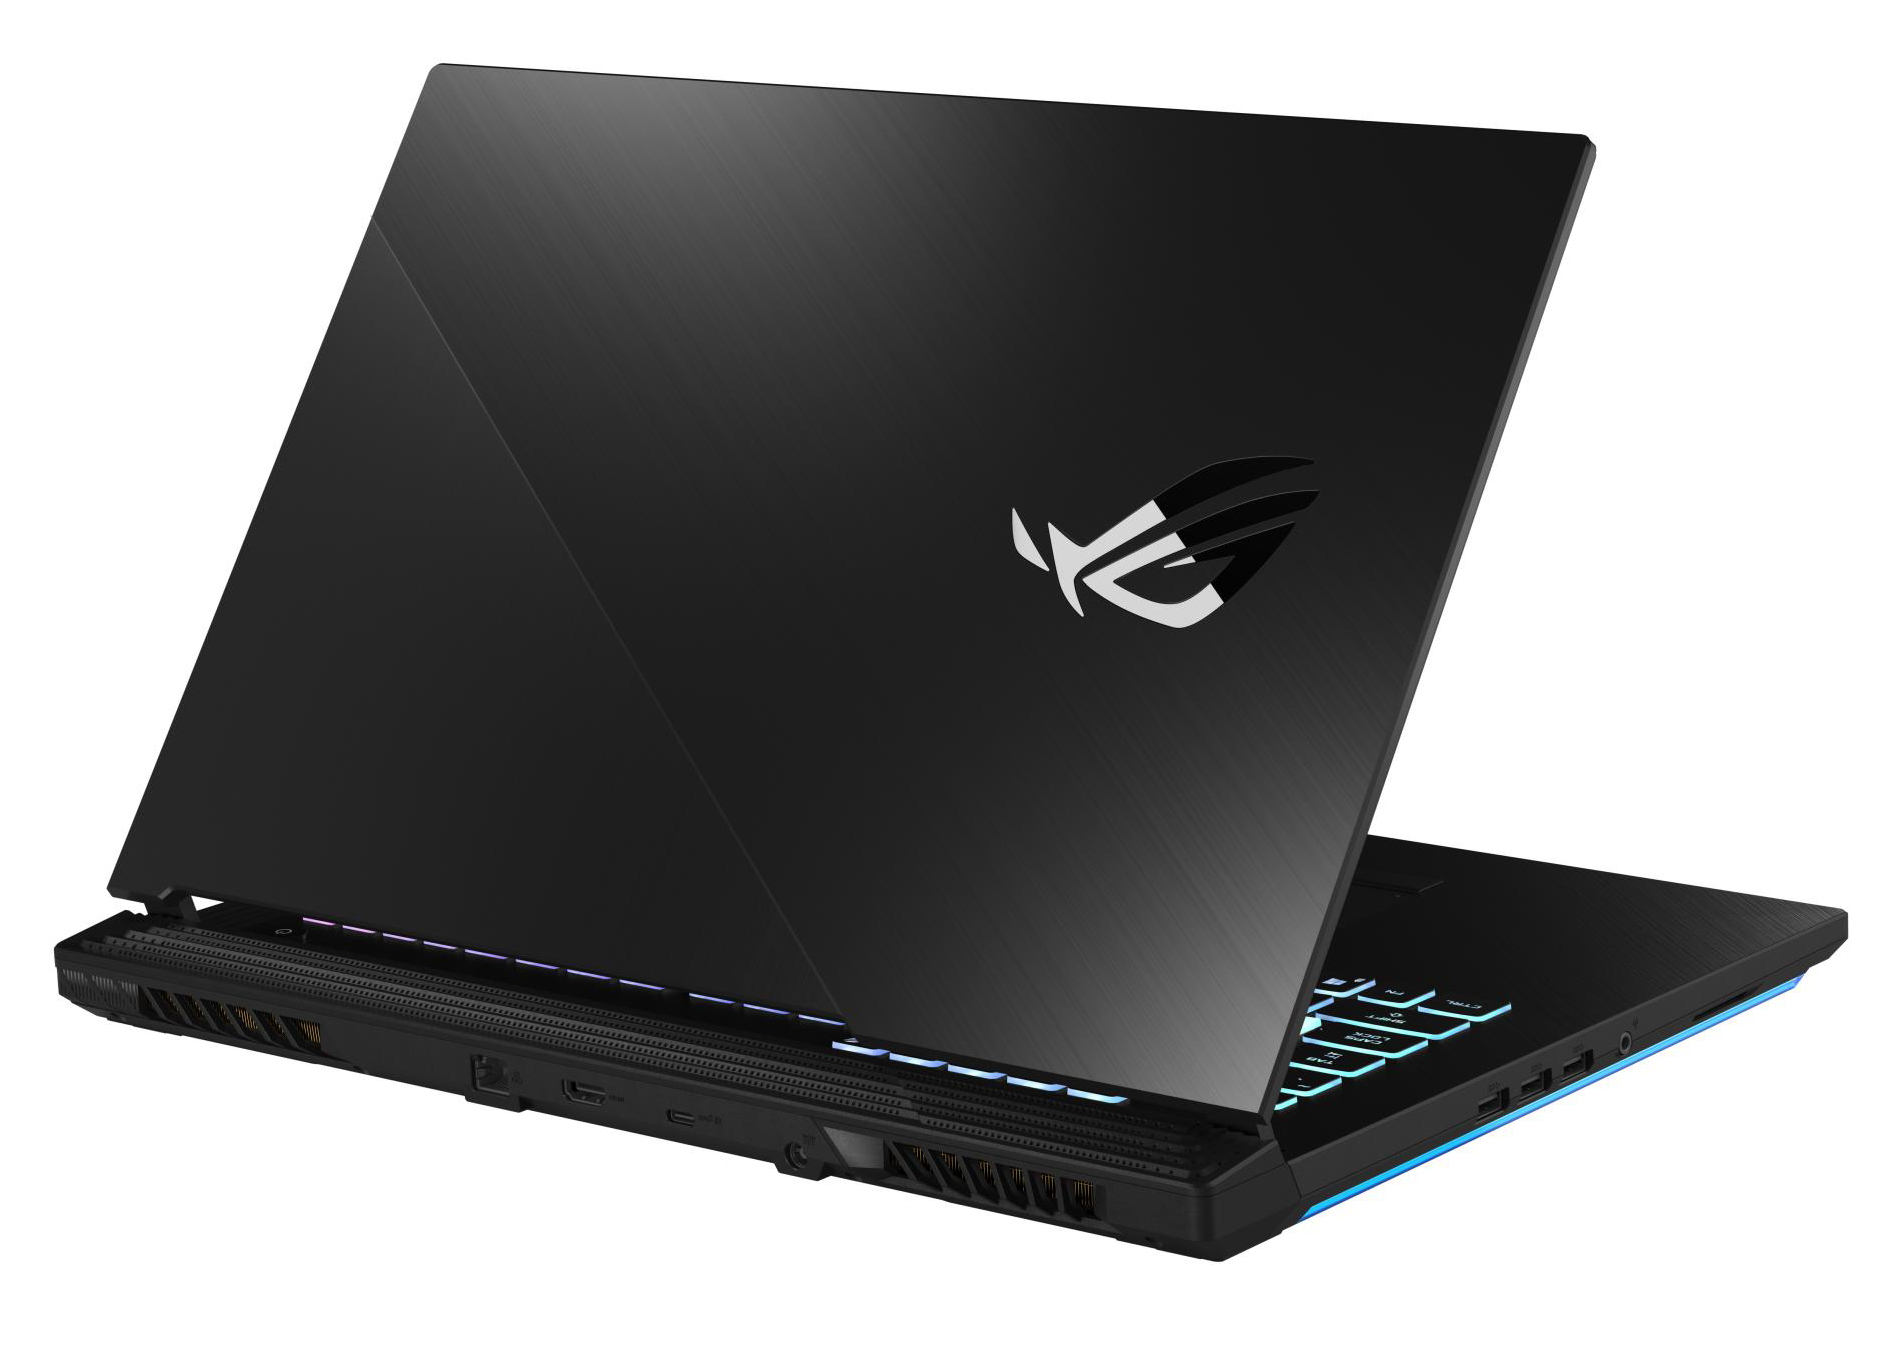
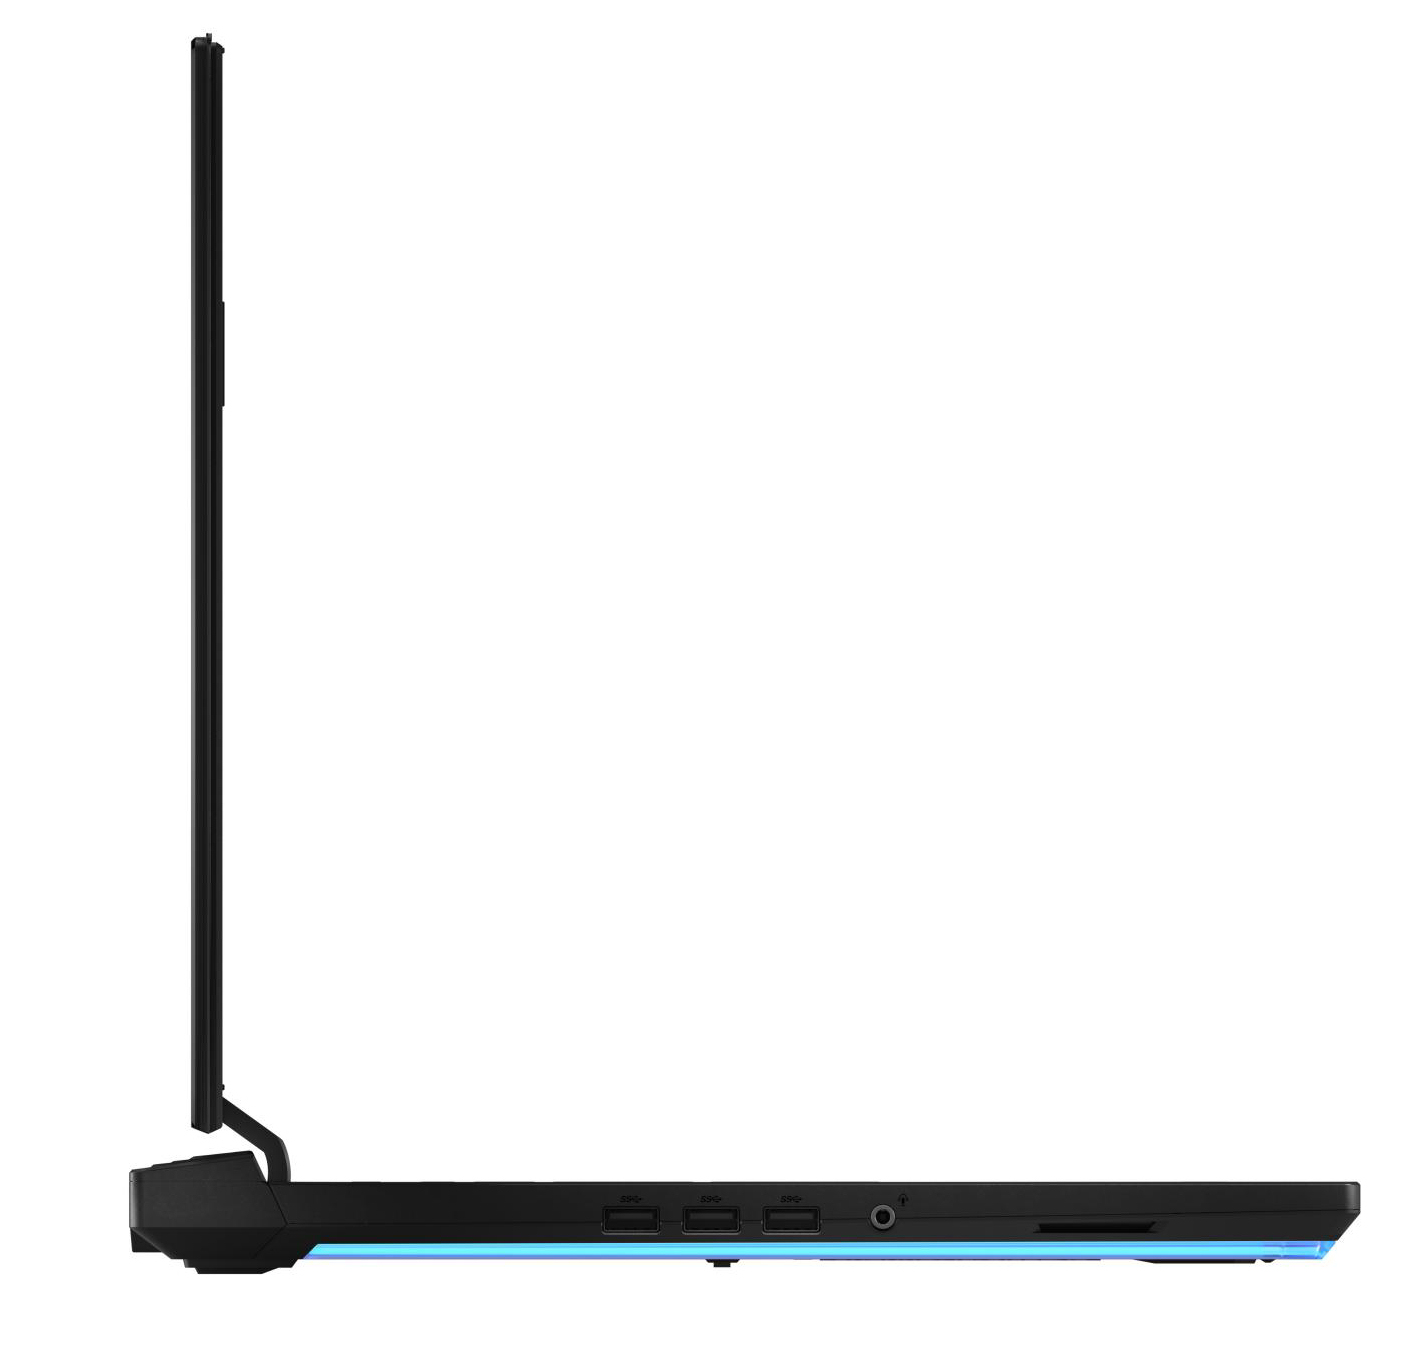
A seleção de portas bem completa inclui três portas USB Type-A 3.2 Gen 1, todas localizadas no lado esquerdo do gabinete. A Asus deveria ter instalado pelo menos uma porta no lado direito. Uma porta Thunderbolt 3 não está entre as conexões. Há apenas uma porta USB Type-C 3.2 Gen 2 que suporta DisplayPort via USB-C.
Asus Strix G17 G712LWS
- 10/11/2020 v7 (old)
Sascha Mölck
Price comparison
