Breve Análise do Portátil Asus ROG Zephyrus G GA502DU (Ryzen 7 3750H, GTX 1660 Ti Max-Q)
| |||||||||||||||||||||||||
iluminação: 85 %
iluminação com acumulador: 240.1 cd/m²
Contraste: 706:1 (Preto: 0.34 cd/m²)
ΔE ColorChecker Calman: 4.2 | ∀{0.5-29.43 Ø4.72}
calibrated: 4.09
ΔE Greyscale Calman: 2.8 | ∀{0.09-98 Ø4.97}
60.4% sRGB (Argyll 1.6.3 3D)
38.4% AdobeRGB 1998 (Argyll 1.6.3 3D)
41.69% AdobeRGB 1998 (Argyll 3D)
60.6% sRGB (Argyll 3D)
40.33% Display P3 (Argyll 3D)
Gamma: 2.2
CCT: 6925 K
| Asus ROG Zephyrus G15 GA502DU Panda LM156LF-CL03, IPS, 15.6", 1920x1080 | Razer Blade 15 RTX 2070 Max-Q LG Philips LGD05C0, IPS, 15.6", 1920x1080 | Asus Zephyrus S GX531GX AU Optronics B156HAN08.2, IPS, 15.6", 1920x1080 | Asus ROG GU501GM-BI7N8 AU Optronics AUO45ED, IPS, 15.6", 1920x1080 | Lenovo Legion Y740-15ICHg LP156WFG-SPB2, IPS, 15.6", 1920x1080 | Gigabyte Aero 15 Classic-XA Sharp LQ156M1JW03 (SHP14C5), IGZO, 15.6", 1920x1080 | Asus Zephyrus S GX502GW AU Optronics B156HAN08.2 (AUO82ED), IPS, 15.6", 1920x1080 | |
|---|---|---|---|---|---|---|---|
| Display | 59% | 58% | 51% | 55% | 60% | 56% | |
| Display P3 Coverage (%) | 40.33 | 65.3 62% | 65.6 63% | 63.4 57% | 63.5 57% | 65.3 62% | 64.9 61% |
| sRGB Coverage (%) | 60.6 | 94.9 57% | 92.2 52% | 87.7 45% | 92.4 52% | 95.5 58% | 91 50% |
| AdobeRGB 1998 Coverage (%) | 41.69 | 66.3 59% | 66.9 60% | 64.7 55% | 66.5 60% | 65.9 58% | |
| Response Times | 55% | 73% | 5% | 49% | 58% | 74% | |
| Response Time Grey 50% / Grey 80% * (ms) | 34 ? | 16.8 ? 51% | 7 ? 79% | 30.8 ? 9% | 18.8 ? 45% | 15.2 ? 55% | 7.2 ? 79% |
| Response Time Black / White * (ms) | 28 ? | 11.6 ? 59% | 9.6 ? 66% | 27.6 ? 1% | 13.2 ? 53% | 11.2 ? 60% | 8.8 ? 69% |
| PWM Frequency (Hz) | 21280 ? | 23580 ? | |||||
| Screen | 31% | 34% | 20% | 23% | 30% | 31% | |
| Brightness middle (cd/m²) | 240.1 | 314.7 31% | 323.6 35% | 286.7 19% | 320.4 33% | 266 11% | 286 19% |
| Brightness (cd/m²) | 231 | 312 35% | 315 36% | 281 22% | 298 29% | 248 7% | 275 19% |
| Brightness Distribution (%) | 85 | 90 6% | 91 7% | 92 8% | 85 0% | 89 5% | 90 6% |
| Black Level * (cd/m²) | 0.34 | 0.38 -12% | 0.29 15% | 0.39 -15% | 0.42 -24% | 0.31 9% | 0.37 -9% |
| Contrast (:1) | 706 | 828 17% | 1116 58% | 735 4% | 763 8% | 858 22% | 773 9% |
| Colorchecker dE 2000 * | 4.2 | 2.56 39% | 3.31 21% | 4.17 1% | 3.21 24% | 2.78 34% | 2.19 48% |
| Colorchecker dE 2000 max. * | 17.8 | 4.89 73% | 5.74 68% | 7.22 59% | 5.54 69% | 5.96 67% | 4.4 75% |
| Colorchecker dE 2000 calibrated * | 4.09 | 1.71 58% | 2.73 33% | 2.36 42% | 0.91 78% | 2.27 44% | |
| Greyscale dE 2000 * | 2.8 | 3.4 -21% | 2.9 -4% | 2.5 11% | 3.6 -29% | 3.58 -28% | 2.2 21% |
| Gamma | 2.2 100% | 2.3 96% | 2.29 96% | 2.274 97% | 2.27 97% | 2.46 89% | 2.41 91% |
| CCT | 6925 94% | 6435 101% | 6765 96% | 6885 94% | 6503 100% | 7186 90% | 6405 101% |
| Color Space (Percent of AdobeRGB 1998) (%) | 38.4 | 60.7 58% | 59.7 55% | 57 48% | 59 54% | 62 61% | 59 54% |
| Color Space (Percent of sRGB) (%) | 60.4 | 94.6 57% | 91.8 52% | 87 44% | 92 52% | 96 59% | 91 51% |
| Média Total (Programa/Configurações) | 48% /
39% | 55% /
44% | 25% /
22% | 42% /
33% | 49% /
39% | 54% /
41% |
* ... menor é melhor
Exibir tempos de resposta
| ↔ Tempo de resposta preto para branco | ||
|---|---|---|
| 28 ms ... ascensão ↗ e queda ↘ combinadas | ↗ 17.2 ms ascensão | 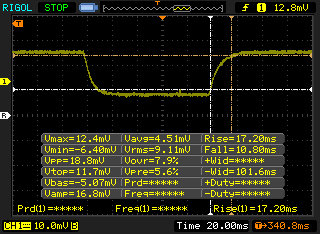 |
| ↘ 10.8 ms queda | ||
| A tela mostra taxas de resposta relativamente lentas em nossos testes e pode ser muito lenta para os jogadores. Em comparação, todos os dispositivos testados variam de 0.1 (mínimo) a 240 (máximo) ms. » 71 % de todos os dispositivos são melhores. Isso significa que o tempo de resposta medido é pior que a média de todos os dispositivos testados (19.9 ms). | ||
| ↔ Tempo de resposta 50% cinza a 80% cinza | ||
| 34 ms ... ascensão ↗ e queda ↘ combinadas | ↗ 17.2 ms ascensão | 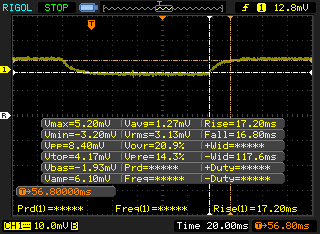 |
| ↘ 16.8 ms queda | ||
| A tela mostra taxas de resposta lentas em nossos testes e será insatisfatória para os jogadores. Em comparação, todos os dispositivos testados variam de 0.165 (mínimo) a 636 (máximo) ms. » 47 % de todos os dispositivos são melhores. Isso significa que o tempo de resposta medido é semelhante à média de todos os dispositivos testados (31.1 ms). | ||
Cintilação da tela / PWM (modulação por largura de pulso)
| Tela tremeluzindo/PWM detectado | 21280 Hz | ≤ 34 % configuração de brilho | 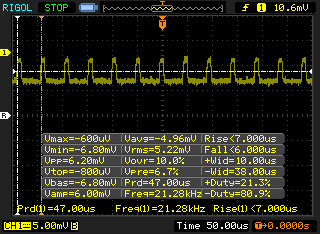 |
A luz de fundo da tela pisca em 21280 Hz (pior caso, por exemplo, utilizando PWM) Cintilação detectada em uma configuração de brilho de 34 % e abaixo. Não deve haver cintilação ou PWM acima desta configuração de brilho. A frequência de 21280 Hz é bastante alta, então a maioria dos usuários sensíveis ao PWM não deve notar nenhuma oscilação. [pwm_comparison] Em comparação: 52 % de todos os dispositivos testados não usam PWM para escurecer a tela. Se PWM foi detectado, uma média de 7784 (mínimo: 5 - máximo: 343500) Hz foi medida. | |||
| PCMark 8 | |
| Home Score Accelerated v2 | |
| Asus TUF FX505DY | |
| Asus ROG GU501GM-BI7N8 | |
| Asus Zephyrus S GX531GX | |
| MSI GL63 8RC-069US | |
| Asus ROG Zephyrus G15 GA502DU | |
| Work Score Accelerated v2 | |
| Asus Zephyrus S GX531GX | |
| MSI GL63 8RC-069US | |
| Asus TUF FX505DY | |
| Asus ROG GU501GM-BI7N8 | |
| Asus ROG Zephyrus G15 GA502DU | |
| PCMark 8 Home Score Accelerated v2 | 3642 pontos | |
| PCMark 8 Work Score Accelerated v2 | 4956 pontos | |
| PCMark 10 Score | 4322 pontos | |
Ajuda | ||
| Asus ROG Zephyrus G15 GA502DU Intel SSD 660p SSDPEKNW512G8 | Razer Blade 15 RTX 2070 Max-Q Samsung SSD PM981 MZVLB512HAJQ | Asus Zephyrus S GX531GX Intel SSD 660p SSDPEKNW512G8 | Asus ROG GU501GM-BI7N8 Kingston RBUSNS8154P3128GJ | Lenovo Legion Y740-15ICHg Samsung SSD PM981 MZVLB256HAHQ | Gigabyte Aero 15 Classic-XA Intel SSD 760p SSDPEKKW512G8 | |
|---|---|---|---|---|---|---|
| AS SSD | 92% | 7% | -59% | 59% | 60% | |
| Seq Read (MB/s) | 907 | 1840 103% | 1239 37% | 841 -7% | 1953 115% | 2517 178% |
| Seq Write (MB/s) | 926 | 1822 97% | 920 -1% | 404.7 -56% | 1629 76% | 924 0% |
| 4K Read (MB/s) | 47.26 | 52.3 11% | 45.74 -3% | 22.62 -52% | 33.2 -30% | 59.1 25% |
| 4K Write (MB/s) | 98.7 | 110.7 12% | 95.7 -3% | 67.1 -32% | 88.1 -11% | 126.5 28% |
| 4K-64 Read (MB/s) | 321.5 | 1126 250% | 322 0% | 270.3 -16% | 757 135% | 876 172% |
| 4K-64 Write (MB/s) | 736 | 1717 133% | 722 -2% | 237 -68% | 1501 104% | 922 25% |
| Access Time Read * (ms) | 0.064 | 0.047 27% | 0.073 -14% | 0.278 -334% | 0.077 -20% | 0.042 34% |
| Access Time Write * (ms) | 0.045 | 0.033 27% | 0.047 -4% | 0.058 -29% | 0.043 4% | 0.065 -44% |
| Score Read (Points) | 459 | 1362 197% | 492 7% | 377 -18% | 985 115% | 1186 158% |
| Score Write (Points) | 927 | 2010 117% | 910 -2% | 345 -63% | 1752 89% | 1141 23% |
| Score Total (Points) | 1641 | 4079 149% | 1654 1% | 900 -45% | 3230 97% | 2870 75% |
| Copy ISO MB/s (MB/s) | 905 | 1975 118% | 1236 37% | 773 -15% | 1872 107% | 2086 130% |
| Copy Program MB/s (MB/s) | 496.9 | 526 6% | 703 41% | 269.2 -46% | 478.2 -4% | 454.2 -9% |
| Copy Game MB/s (MB/s) | 819 | 1200 47% | 812 -1% | 419.3 -49% | 1165 42% | 1141 39% |
* ... menor é melhor

| 3DMark | |
| 1920x1080 Fire Strike Graphics | |
| MSI GE75 9SG | |
| Asus Zephyrus S GX502GW | |
| Razer Blade 15 RTX 2070 Max-Q | |
| Alienware 17 R5 | |
| Schenker Compact 15 | |
| Asus ROG Zephyrus G15 GA502DU | |
| Asus Zephyrus S GX531GM | |
| Acer Nitro 5 | |
| Asus TUF FX705GE-EW096T | |
| Asus TUF FX705DY-AU072 | |
| Acer Swift 3 SF314-55G-768V | |
| 2560x1440 Time Spy Graphics | |
| MSI GE75 9SG | |
| Asus Zephyrus S GX502GW | |
| Razer Blade 15 RTX 2070 Max-Q | |
| Alienware 17 R5 | |
| Schenker Compact 15 | |
| Asus ROG Zephyrus G15 GA502DU | |
| Asus Zephyrus S GX531GM | |
| Acer Nitro 5 | |
| Asus TUF FX705GE-EW096T | |
| Asus TUF FX705DY-AU072 | |
| 3840x2160 Fire Strike Ultra Graphics | |
| MSI GE75 9SG | |
| Razer Blade 15 RTX 2070 Max-Q | |
| Asus ROG Zephyrus G15 GA502DU | |
| Asus Zephyrus S GX531GM | |
| Asus TUF FX705GE-EW096T | |
| Asus TUF FX705DY-AU072 | |
| 1920x1080 Fire Strike Score | |
| MSI GE75 9SG | |
| Asus Zephyrus S GX502GW | |
| Alienware 17 R5 | |
| Razer Blade 15 RTX 2070 Max-Q | |
| Schenker Compact 15 | |
| Asus ROG Zephyrus G15 GA502DU | |
| Asus Zephyrus S GX531GM | |
| Acer Nitro 5 | |
| Asus TUF FX705GE-EW096T | |
| Asus TUF FX705DY-AU072 | |
| Acer Swift 3 SF314-55G-768V | |
| 3DMark 11 | |
| 1280x720 Performance GPU | |
| MSI GE75 9SG | |
| Asus Zephyrus S GX502GW | |
| Alienware 17 R5 | |
| Razer Blade 15 RTX 2070 Max-Q | |
| Schenker Compact 15 | |
| Asus ROG Zephyrus G15 GA502DU | |
| Acer Nitro 5 | |
| Asus Zephyrus S GX531GM | |
| Asus TUF FX705GE-EW096T | |
| Asus TUF FX705DY-AU072 | |
| Acer Swift 3 SF314-55G-768V | |
| 1280x720 Performance Combined | |
| MSI GE75 9SG | |
| Schenker Compact 15 | |
| Alienware 17 R5 | |
| Asus Zephyrus S GX502GW | |
| Razer Blade 15 RTX 2070 Max-Q | |
| Acer Nitro 5 | |
| Asus TUF FX705GE-EW096T | |
| Asus Zephyrus S GX531GM | |
| Asus ROG Zephyrus G15 GA502DU | |
| Asus TUF FX705DY-AU072 | |
| Acer Swift 3 SF314-55G-768V | |
| 3DMark 06 Standard Score | 24029 pontos | |
| 3DMark Vantage P Result | 31845 pontos | |
| 3DMark 11 Performance | 12279 pontos | |
| 3DMark Ice Storm Standard Score | 56479 pontos | |
| 3DMark Cloud Gate Standard Score | 17712 pontos | |
| 3DMark Fire Strike Score | 10792 pontos | |
| 3DMark Time Spy Score | 4547 pontos | |
Ajuda | ||
| Shadow of the Tomb Raider - 1920x1080 Highest Preset AA:T | |
| Nvidia GeForce GTX 1080 Founders Edition | |
| Alienware m15 P79F | |
| Zotac GeForce GTX 1660 Ti 6 GB | |
| MSI GL73 8SE-010US | |
| Schenker Compact 15 | |
| HP Omen 15-dc0015ng | |
| Asus ROG Zephyrus G15 GA502DU | |
| Acer Nitro 5 | |
| Asus Zephyrus S GX531GM | |
| Asus TUF FX705GE-EW096T | |
| Lenovo ThinkPad X1 Extreme-20MF000XGE | |
| Acer Aspire 5 A515-52G-723L | |
| baixo | média | alto | ultra | |
|---|---|---|---|---|
| BioShock Infinite (2013) | 183.4 | 102.3 | ||
| The Witcher 3 (2015) | 138.4 | 83.9 | 48.8 | |
| Batman: Arkham Knight (2015) | 89 | 69 | 51 | |
| Metal Gear Solid V (2015) | 60 | 60 | 60 | |
| Rise of the Tomb Raider (2016) | 93.7 | 72.7 | 64.5 | |
| Ashes of the Singularity (2016) | 42.4 | 40.7 | ||
| Overwatch (2016) | 193.7 | 140.7 | 116 | |
| Rocket League (2017) | 206.7 | 160.8 | 141.7 | |
| Middle-earth: Shadow of War (2017) | 91 | 82 | 72 | 61 |
| Fortnite (2018) | 138 | 92.2 | 89.5 | 78.6 |
| Final Fantasy XV Benchmark (2018) | 78.4 | 60.3 | 44.9 | |
| Monster Hunter World (2018) | 66.9 | 59.3 | 59.5 | 50.8 |
| Shadow of the Tomb Raider (2018) | 62 | 57 | 53 | 49 |
| Assassin´s Creed Odyssey (2018) | 48 | 43 | 39 | 33 |
| Apex Legends (2019) | 144 | 105.3 | 90.1 | 89 |
| Metro Exodus (2019) | 96.6 | 53.9 | 46.6 | 35.1 |
| Asus ROG Zephyrus G15 GA502DU GeForce GTX 1660 Ti Max-Q, R7 3750H, Intel SSD 660p SSDPEKNW512G8 | Razer Blade 15 RTX 2070 Max-Q GeForce RTX 2070 Max-Q, i7-8750H, Samsung SSD PM981 MZVLB512HAJQ | Asus Zephyrus S GX531GX GeForce RTX 2080 Max-Q, i7-8750H, Intel SSD 660p SSDPEKNW512G8 | Asus ROG GU501GM-BI7N8 GeForce GTX 1060 Mobile, i7-8750H, Kingston RBUSNS8154P3128GJ | Asus Zephyrus S GX502GW GeForce RTX 2070 Mobile, i7-9750H, 2x Intel SSD 660p SSDPEKNW512G8 (RAID 0) | Acer Aspire Nitro 5 AN515-54-53Z2 GeForce GTX 1650 Mobile, i5-9300H, WDC PC SN520 SDAPNUW-512G | |
|---|---|---|---|---|---|---|
| Noise | 10% | -3% | -0% | -7% | 1% | |
| desligado / ambiente * (dB) | 28 | 28.8 -3% | 28.7 -2% | 28.6 -2% | 30 -7% | 30 -7% |
| Idle Minimum * (dB) | 29.4 | 28.8 2% | 29.8 -1% | 31.4 -7% | 31 -5% | 30 -2% |
| Idle Average * (dB) | 31.9 | 28.8 10% | 32.4 -2% | 31.4 2% | 33 -3% | 31 3% |
| Idle Maximum * (dB) | 33 | 29.4 11% | 38 -15% | 34.2 -4% | 38 -15% | 33 -0% |
| Load Average * (dB) | 41.2 | 35.7 13% | 38.2 7% | 42.8 -4% | 50 -21% | 46 -12% |
| Witcher 3 ultra * (dB) | 53.8 | 42.5 21% | 56.6 -5% | 50.9 5% | 53 1% | 46 14% |
| Load Maximum * (dB) | 55.7 | 45 19% | 56.6 -2% | 50.9 9% | 56 -1% | 49 12% |
* ... menor é melhor
Barulho
| Ocioso |
| 29.4 / 31.9 / 33 dB |
| Carga |
| 41.2 / 55.7 dB |
 | ||
30 dB silencioso 40 dB(A) audível 50 dB(A) ruidosamente alto |
||
min: | ||
(-) A temperatura máxima no lado superior é 55.8 °C / 132 F, em comparação com a média de 40.4 °C / 105 F , variando de 21.2 a 68.8 °C para a classe Gaming.
(-) A parte inferior aquece até um máximo de 58.2 °C / 137 F, em comparação com a média de 43.2 °C / 110 F
(+) Em uso inativo, a temperatura média para o lado superior é 27 °C / 81 F, em comparação com a média do dispositivo de 33.9 °C / ### class_avg_f### F.
(±) Jogando The Witcher 3, a temperatura média para o lado superior é 35.7 °C / 96 F, em comparação com a média do dispositivo de 33.9 °C / ## #class_avg_f### F.
(+) Os apoios para as mãos e o touchpad são mais frios que a temperatura da pele, com um máximo de 27.6 °C / 81.7 F e, portanto, são frios ao toque.
(±) A temperatura média da área do apoio para as mãos de dispositivos semelhantes foi 28.8 °C / 83.8 F (+1.2 °C / 2.1 F).
Asus ROG Zephyrus G15 GA502DU análise de áudio
(+) | os alto-falantes podem tocar relativamente alto (###valor### dB)
Graves 100 - 315Hz
(±) | graves reduzidos - em média 12.5% menor que a mediana
(±) | a linearidade dos graves é média (12.5% delta para a frequência anterior)
Médios 400 - 2.000 Hz
(±) | médios mais altos - em média 6.2% maior que a mediana
(±) | a linearidade dos médios é média (7.7% delta para frequência anterior)
Altos 2 - 16 kHz
(+) | agudos equilibrados - apenas 3.5% longe da mediana
(±) | a linearidade dos máximos é média (9.2% delta para frequência anterior)
Geral 100 - 16.000 Hz
(±) | a linearidade do som geral é média (17.2% diferença em relação à mediana)
Comparado com a mesma classe
» 46% de todos os dispositivos testados nesta classe foram melhores, 11% semelhantes, 42% piores
» O melhor teve um delta de 6%, a média foi 18%, o pior foi 132%
Comparado com todos os dispositivos testados
» 32% de todos os dispositivos testados foram melhores, 8% semelhantes, 60% piores
» O melhor teve um delta de 4%, a média foi 24%, o pior foi 134%
Apple MacBook 12 (Early 2016) 1.1 GHz análise de áudio
(+) | os alto-falantes podem tocar relativamente alto (###valor### dB)
Graves 100 - 315Hz
(±) | graves reduzidos - em média 11.3% menor que a mediana
(±) | a linearidade dos graves é média (14.2% delta para a frequência anterior)
Médios 400 - 2.000 Hz
(+) | médios equilibrados - apenas 2.4% longe da mediana
(+) | médios são lineares (5.5% delta para frequência anterior)
Altos 2 - 16 kHz
(+) | agudos equilibrados - apenas 2% longe da mediana
(+) | os máximos são lineares (4.5% delta da frequência anterior)
Geral 100 - 16.000 Hz
(+) | o som geral é linear (10.2% diferença em relação à mediana)
Comparado com a mesma classe
» 7% de todos os dispositivos testados nesta classe foram melhores, 2% semelhantes, 91% piores
» O melhor teve um delta de 5%, a média foi 18%, o pior foi 53%
Comparado com todos os dispositivos testados
» 5% de todos os dispositivos testados foram melhores, 1% semelhantes, 94% piores
» O melhor teve um delta de 4%, a média foi 24%, o pior foi 134%
| desligado | |
| Ocioso | |
| Carga |
|
Key:
min: | |
| Asus ROG Zephyrus G15 GA502DU R7 3750H, GeForce GTX 1660 Ti Max-Q, Intel SSD 660p SSDPEKNW512G8, IPS, 1920x1080, 15.6" | Razer Blade 15 RTX 2070 Max-Q i7-8750H, GeForce RTX 2070 Max-Q, Samsung SSD PM981 MZVLB512HAJQ, IPS, 1920x1080, 15.6" | Asus Zephyrus S GX531GX i7-8750H, GeForce RTX 2080 Max-Q, Intel SSD 660p SSDPEKNW512G8, IPS, 1920x1080, 15.6" | Asus ROG GU501GM-BI7N8 i7-8750H, GeForce GTX 1060 Mobile, Kingston RBUSNS8154P3128GJ, IPS, 1920x1080, 15.6" | Acer Aspire Nitro 5 AN515-54-53Z2 i5-9300H, GeForce GTX 1650 Mobile, WDC PC SN520 SDAPNUW-512G, IPS, 1920x1080, 15.6" | Lenovo Legion Y730-15ICH i5-8300H i5-8300H, GeForce GTX 1050 Ti Mobile, Intel Optane 16 GB MEMPEK1J016GAL + HGST ST1000LM049 1 TB HDD, IPS, 1920x1080, 15.6" | |
|---|---|---|---|---|---|---|
| Power Consumption | -27% | -64% | -39% | 19% | -2% | |
| Idle Minimum * (Watt) | 7.4 | 10.4 -41% | 16.1 -118% | 12.35 -67% | 5 32% | 8 -8% |
| Idle Average * (Watt) | 8.6 | 14.6 -70% | 20.9 -143% | 19.98 -132% | 7 19% | 11.8 -37% |
| Idle Maximum * (Watt) | 39.1 | 16.3 58% | 27 31% | 25.44 35% | 11 72% | 13.1 66% |
| Load Average * (Watt) | 65.9 | 88.5 -34% | 93.4 -42% | 94.28 -43% | 89 -35% | 90.2 -37% |
| Witcher 3 ultra * (Watt) | 106.9 | 155.4 -45% | 168.2 -57% | 132.9 -24% | 90 16% | 107.8 -1% |
| Load Maximum * (Watt) | 141.3 | 182.4 -29% | 215.3 -52% | 140.63 -0% | 132 7% | 136.2 4% |
* ... menor é melhor
| Asus ROG Zephyrus G15 GA502DU R7 3750H, GeForce GTX 1660 Ti Max-Q, 76 Wh | Razer Blade 15 RTX 2070 Max-Q i7-8750H, GeForce RTX 2070 Max-Q, 80 Wh | Asus Zephyrus S GX531GX i7-8750H, GeForce RTX 2080 Max-Q, 50 Wh | Asus ROG GU501GM-BI7N8 i7-8750H, GeForce GTX 1060 Mobile, 55 Wh | Lenovo Legion Y740-15ICHg i7-8750H, GeForce RTX 2070 Max-Q, 57 Wh | Acer Aspire Nitro 5 AN515-54-53Z2 i5-9300H, GeForce GTX 1650 Mobile, 57 Wh | |
|---|---|---|---|---|---|---|
| Duração da bateria | -24% | -62% | -61% | -67% | -5% | |
| Reader / Idle (h) | 15.3 | 11.4 -25% | 4.5 -71% | 3.9 -75% | 17.4 14% | |
| WiFi v1.3 (h) | 8 | 6.5 -19% | 3 -62% | 4 -50% | 2.8 -65% | 8.1 1% |
| Load (h) | 2.1 | 1.5 -29% | 0.8 -62% | 0.8 -62% | 1.5 -29% |
Pro
Contra
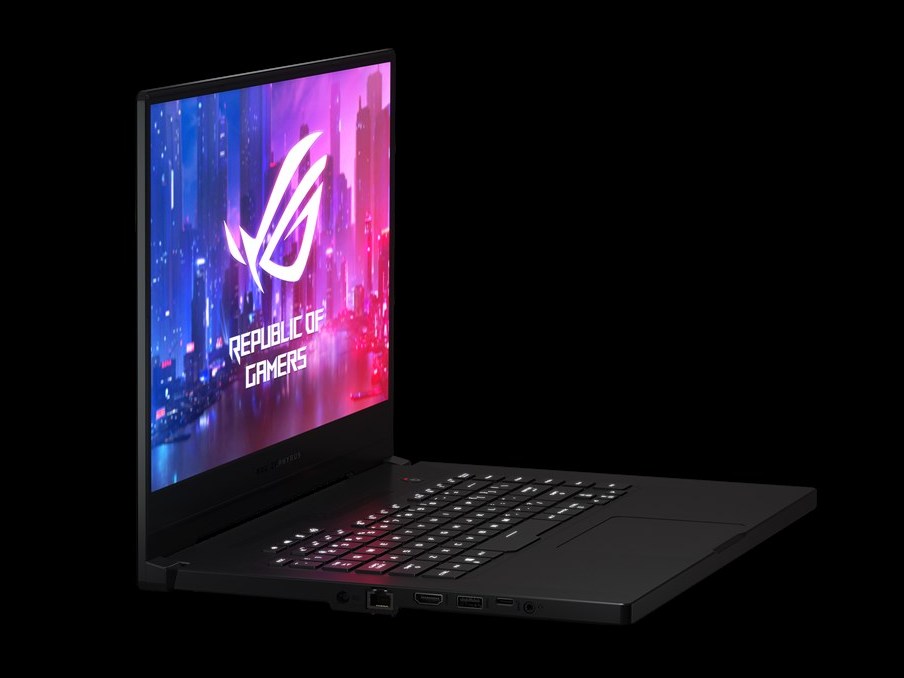
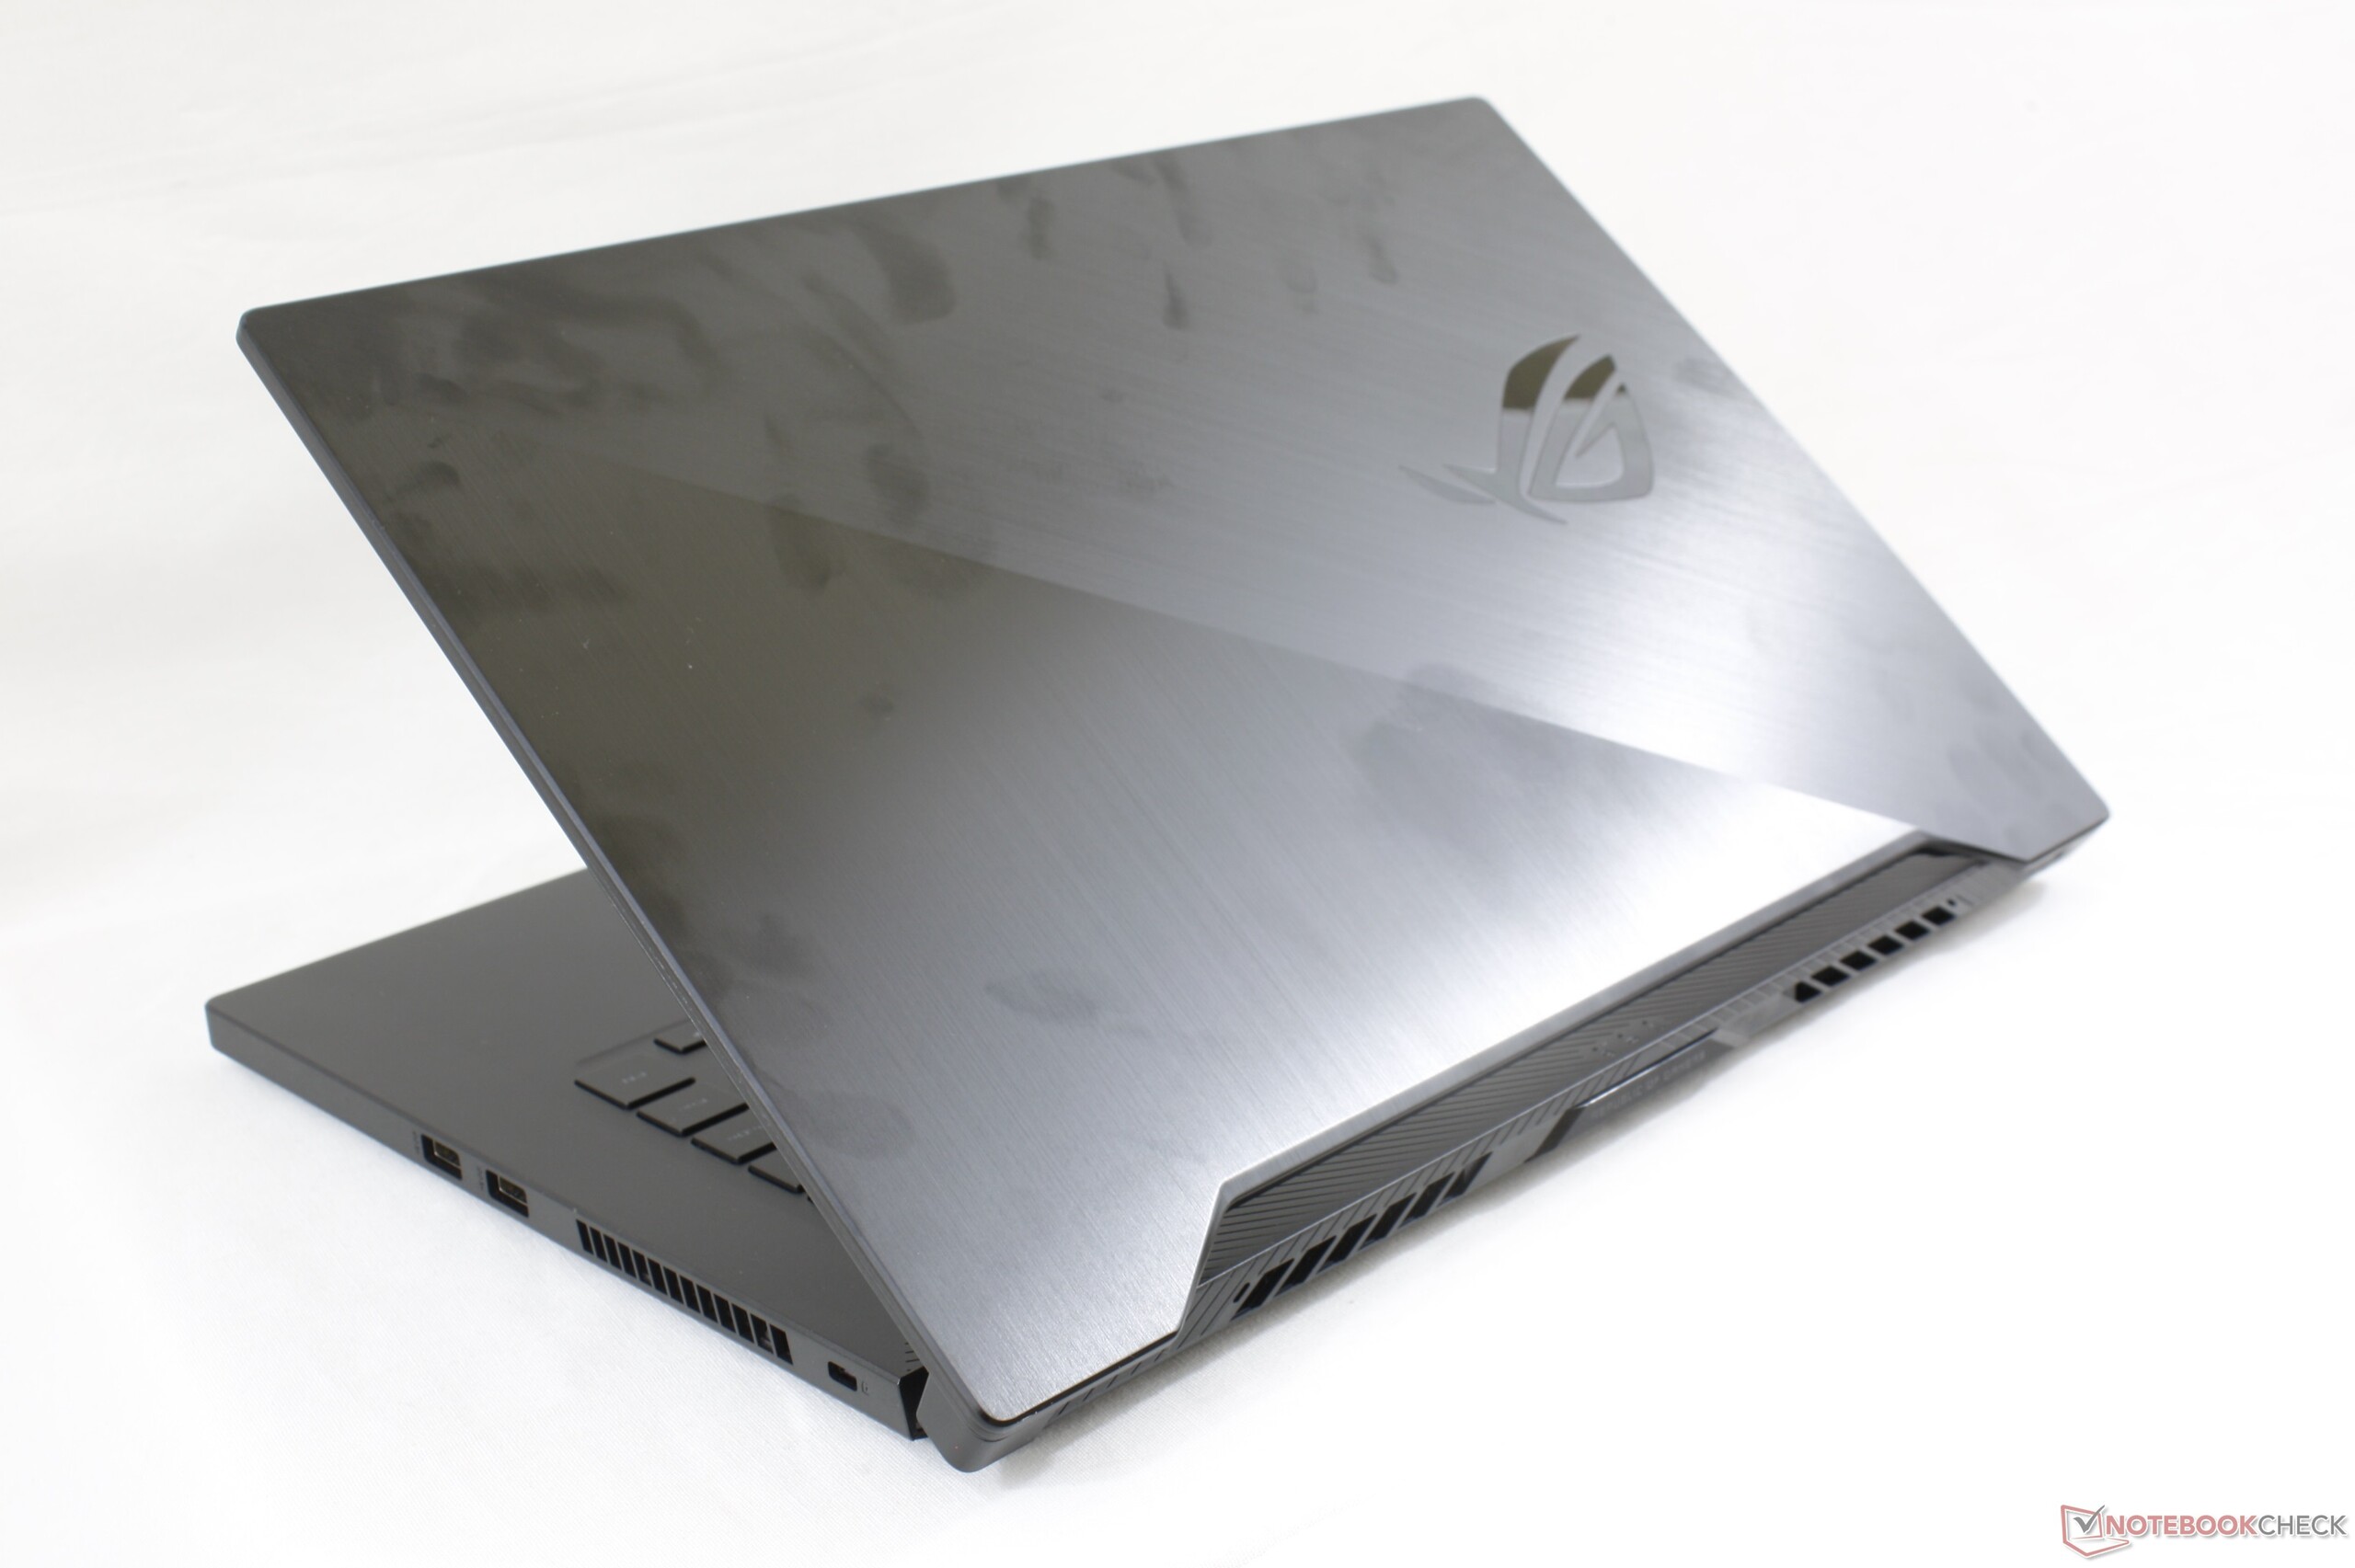
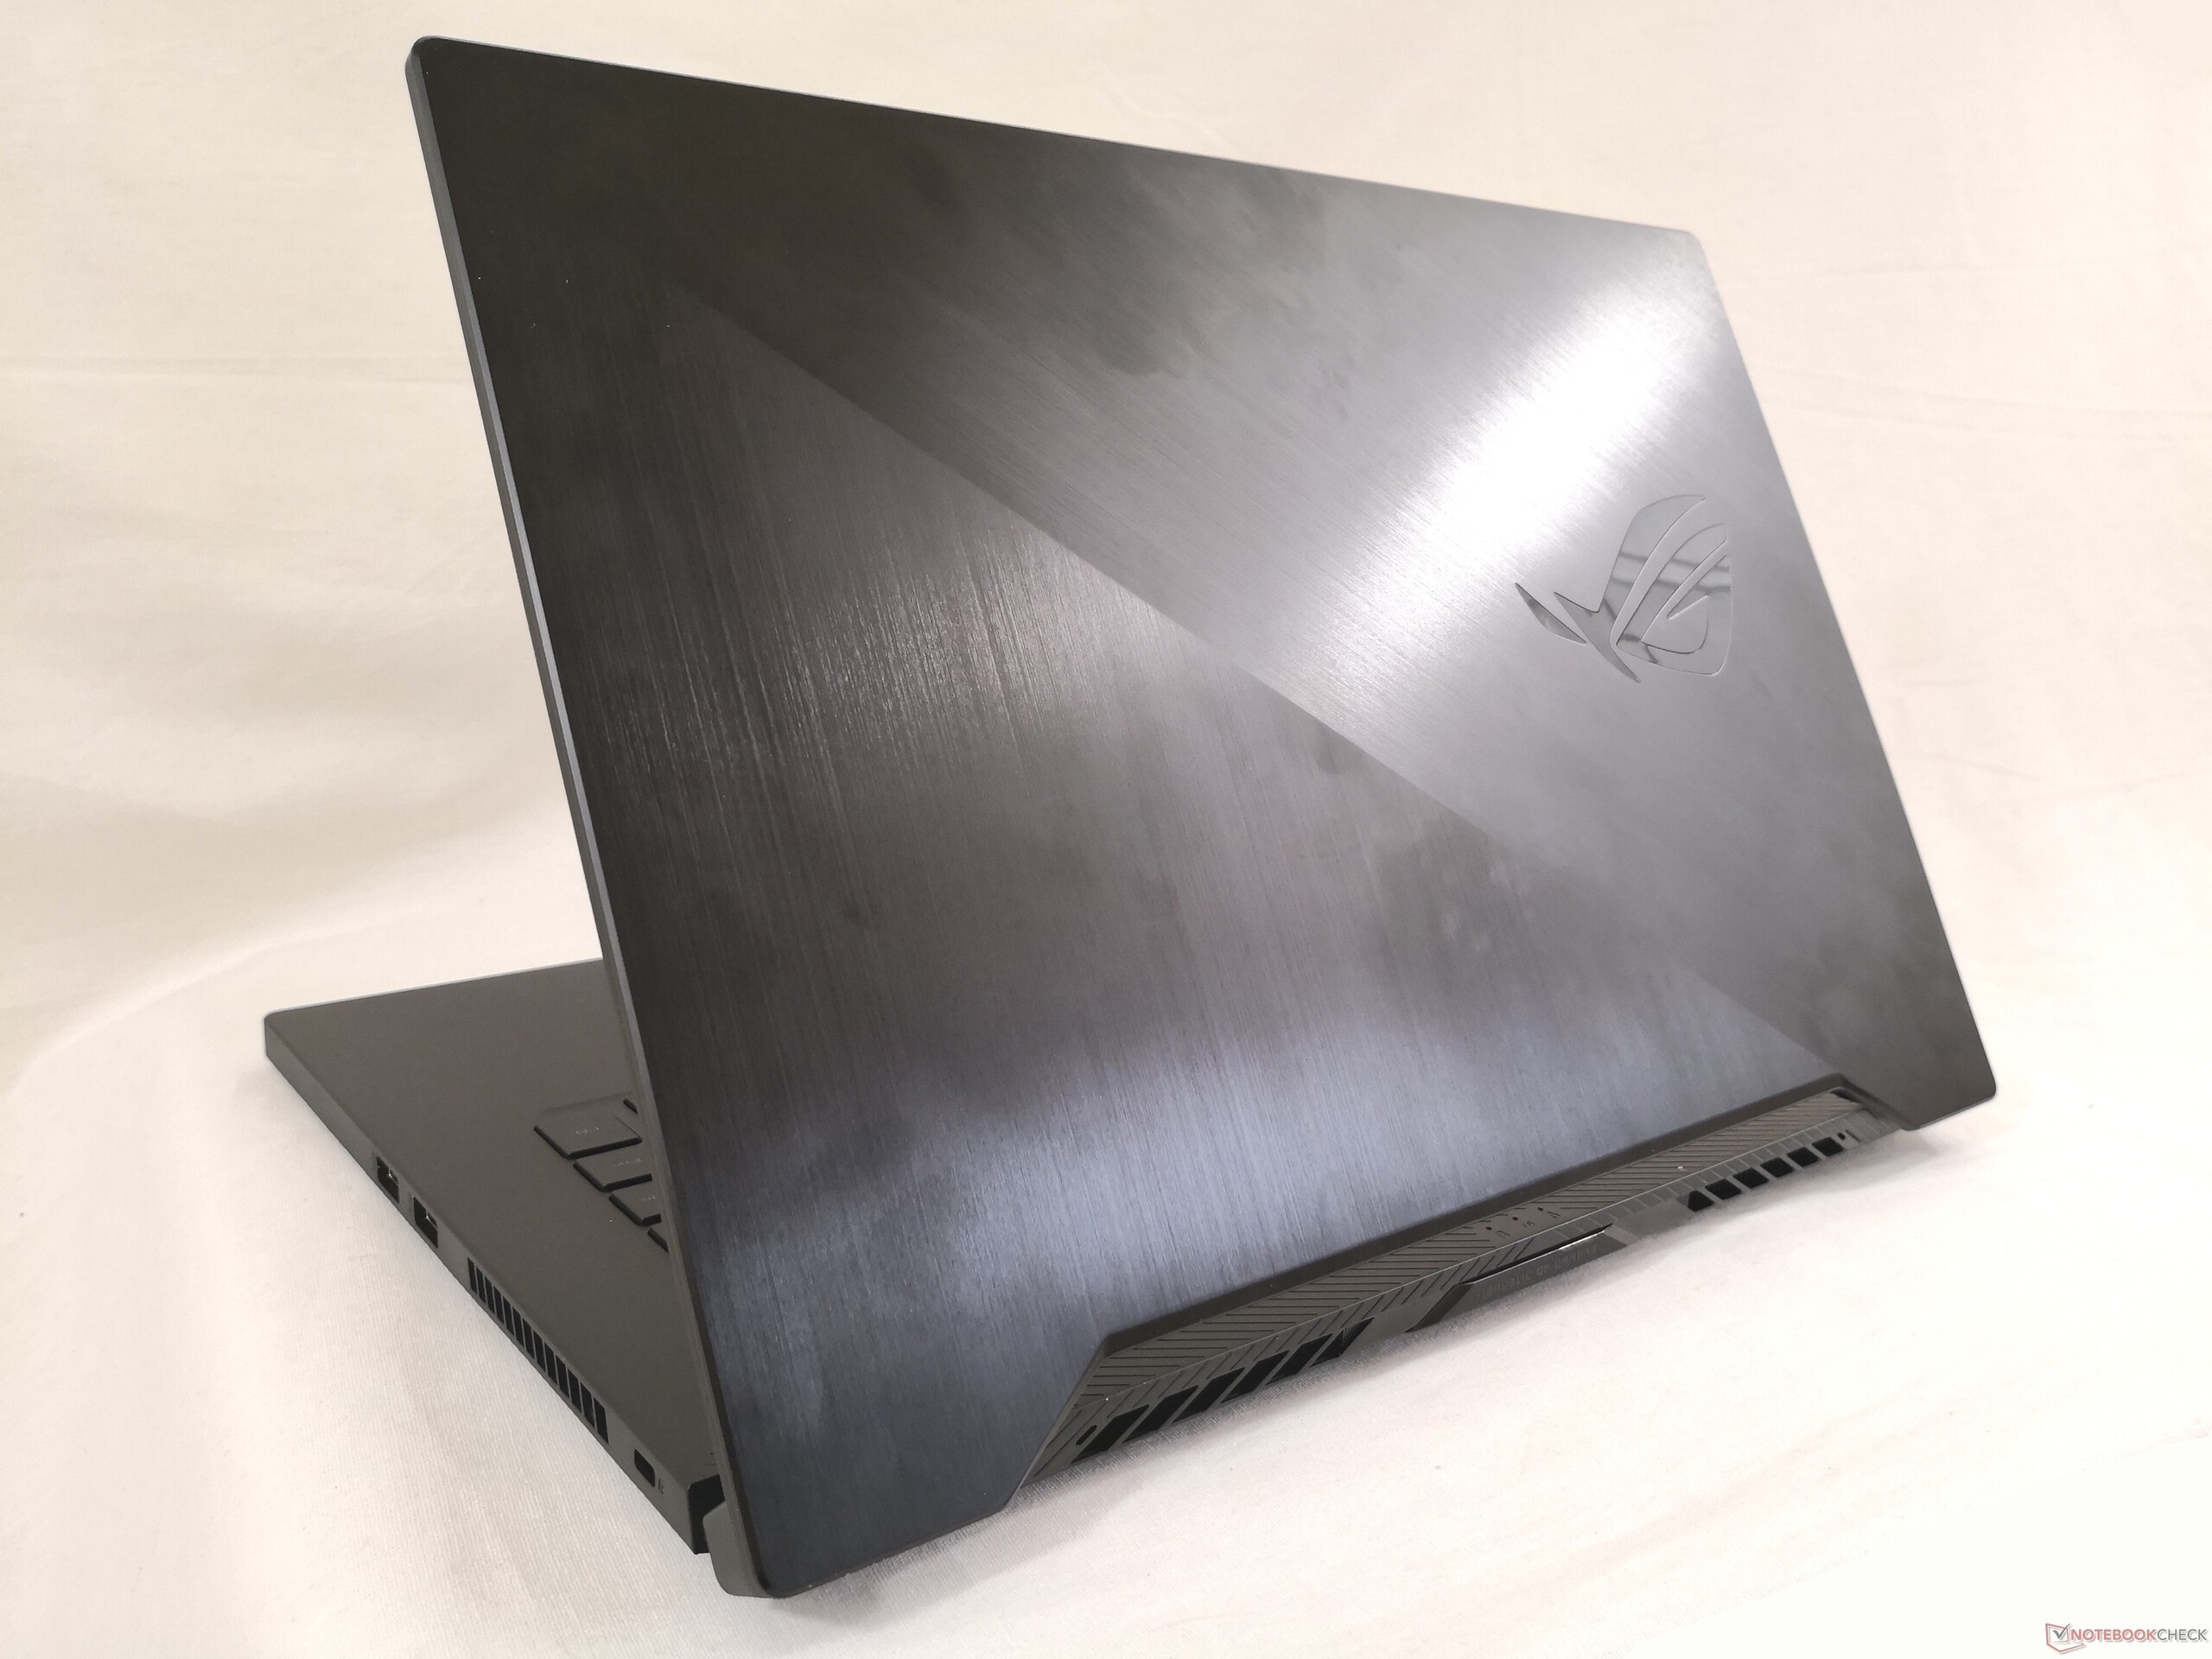
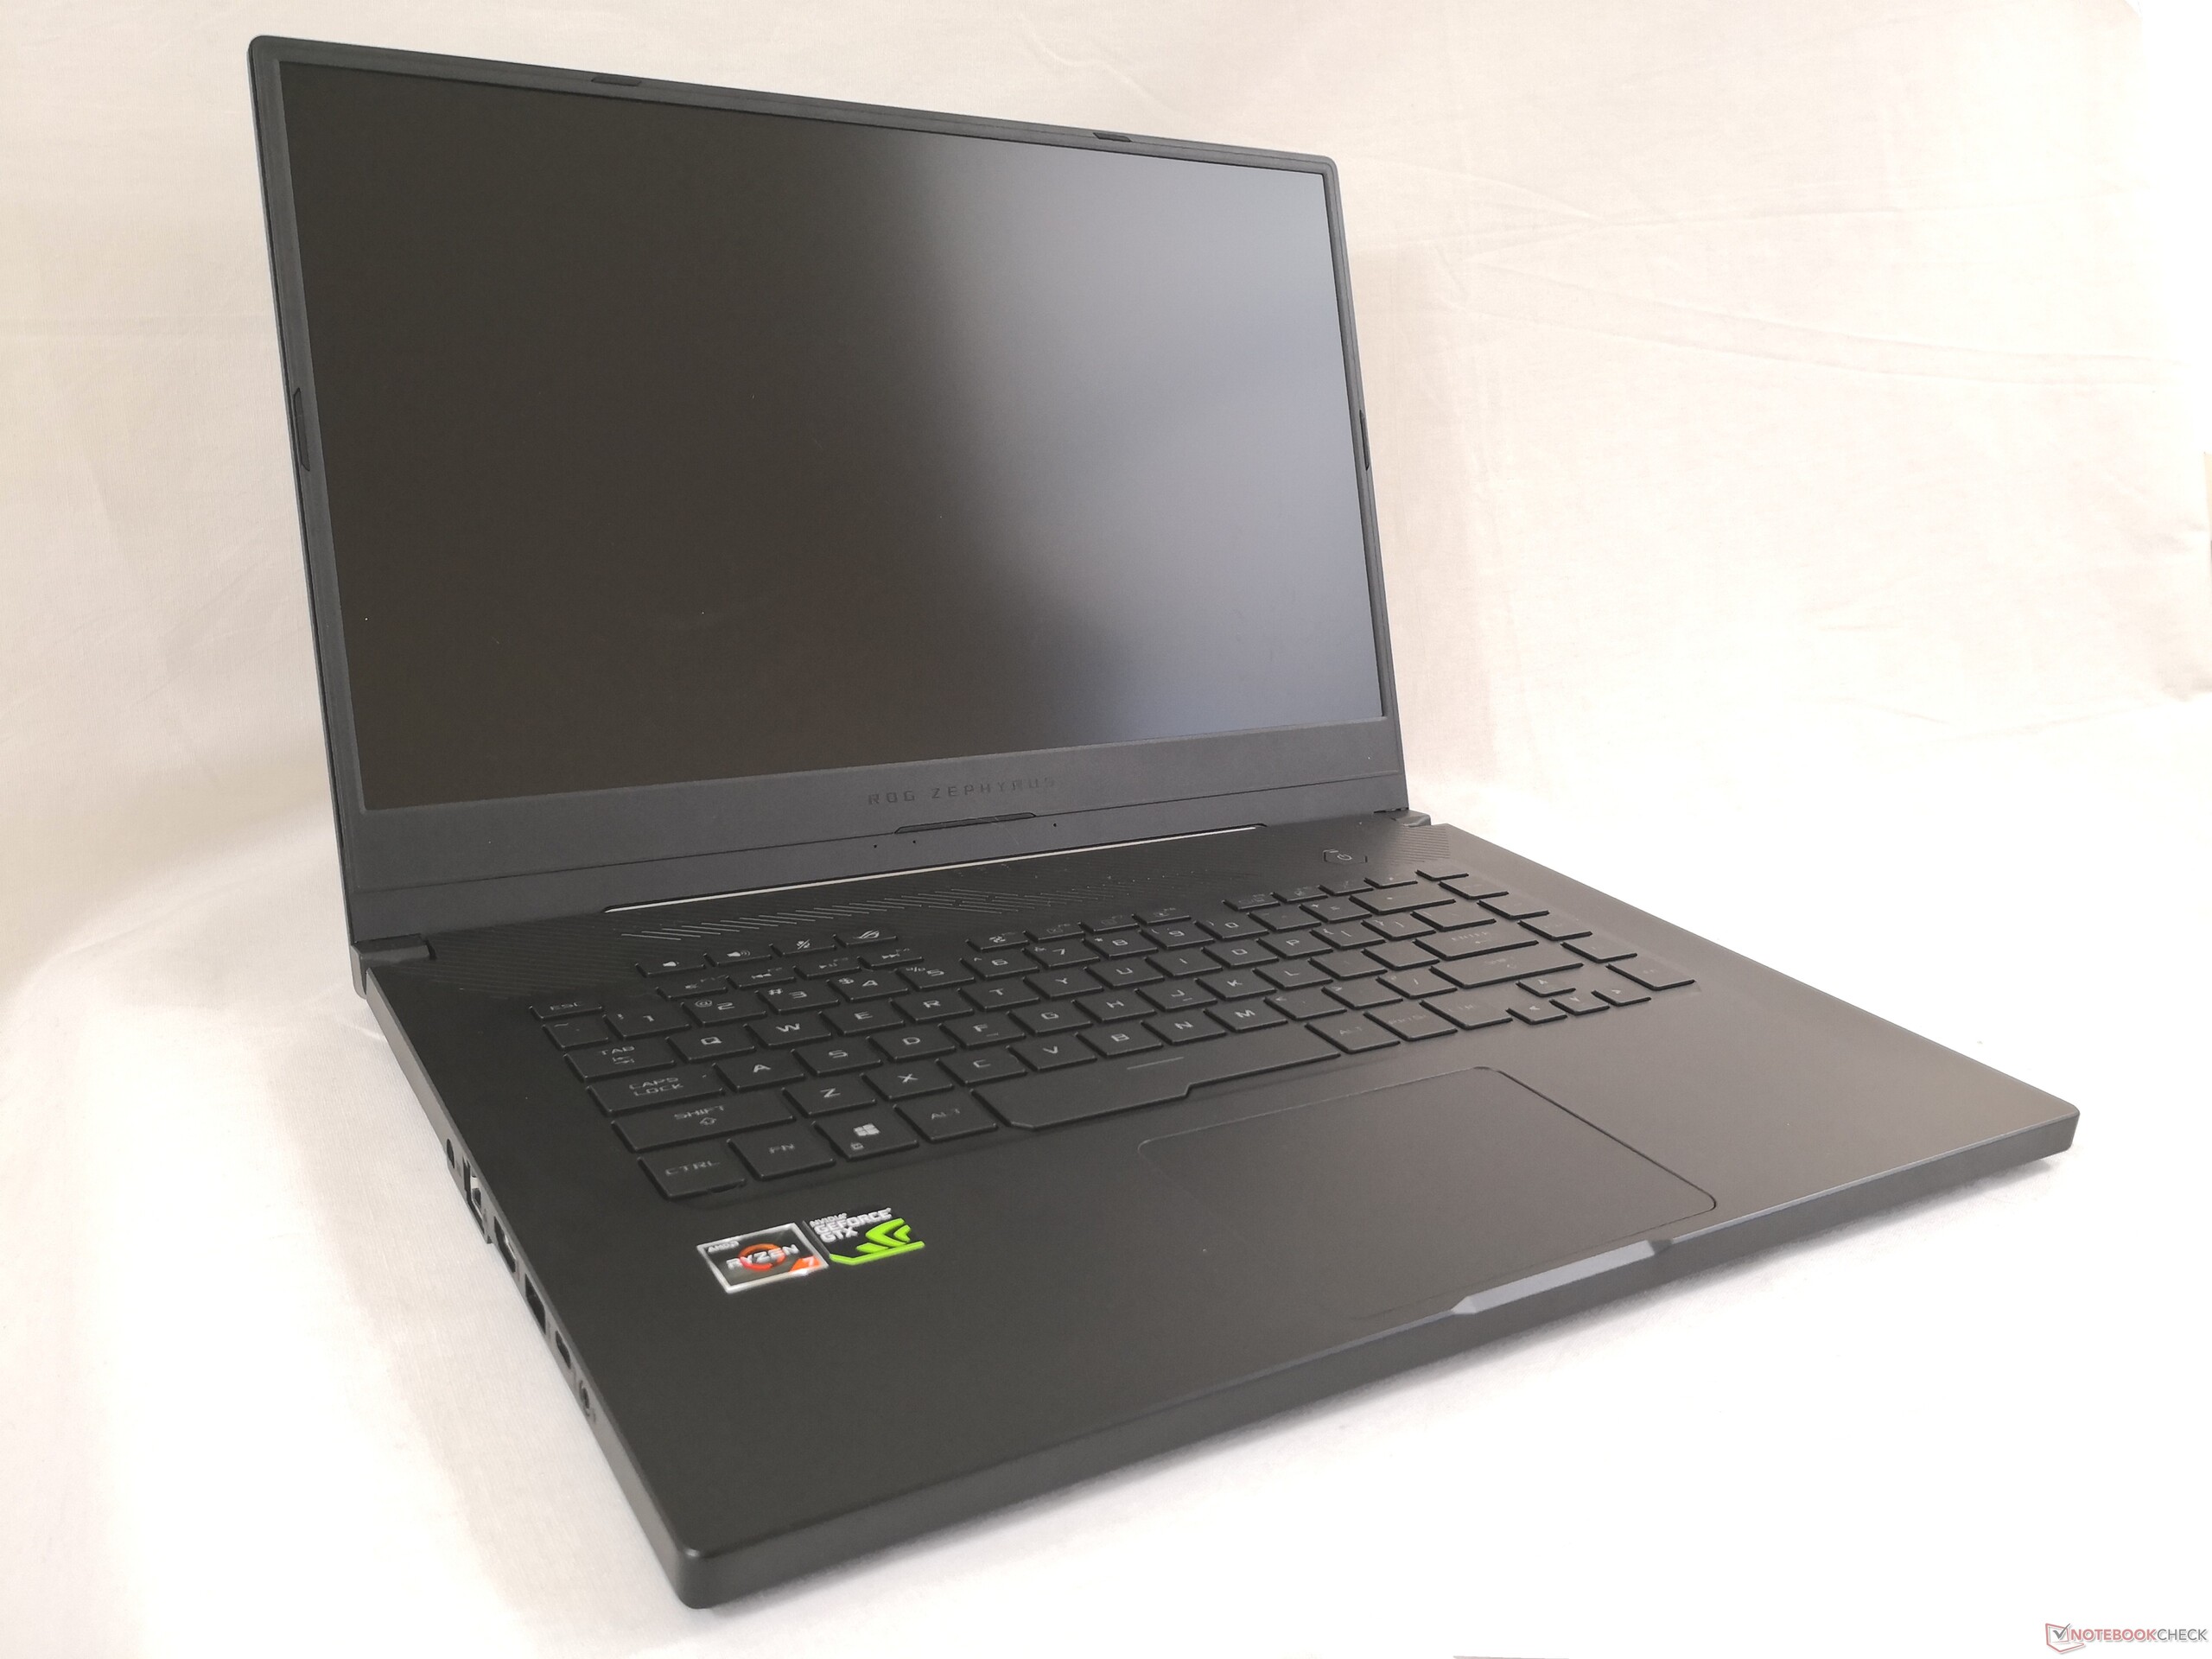
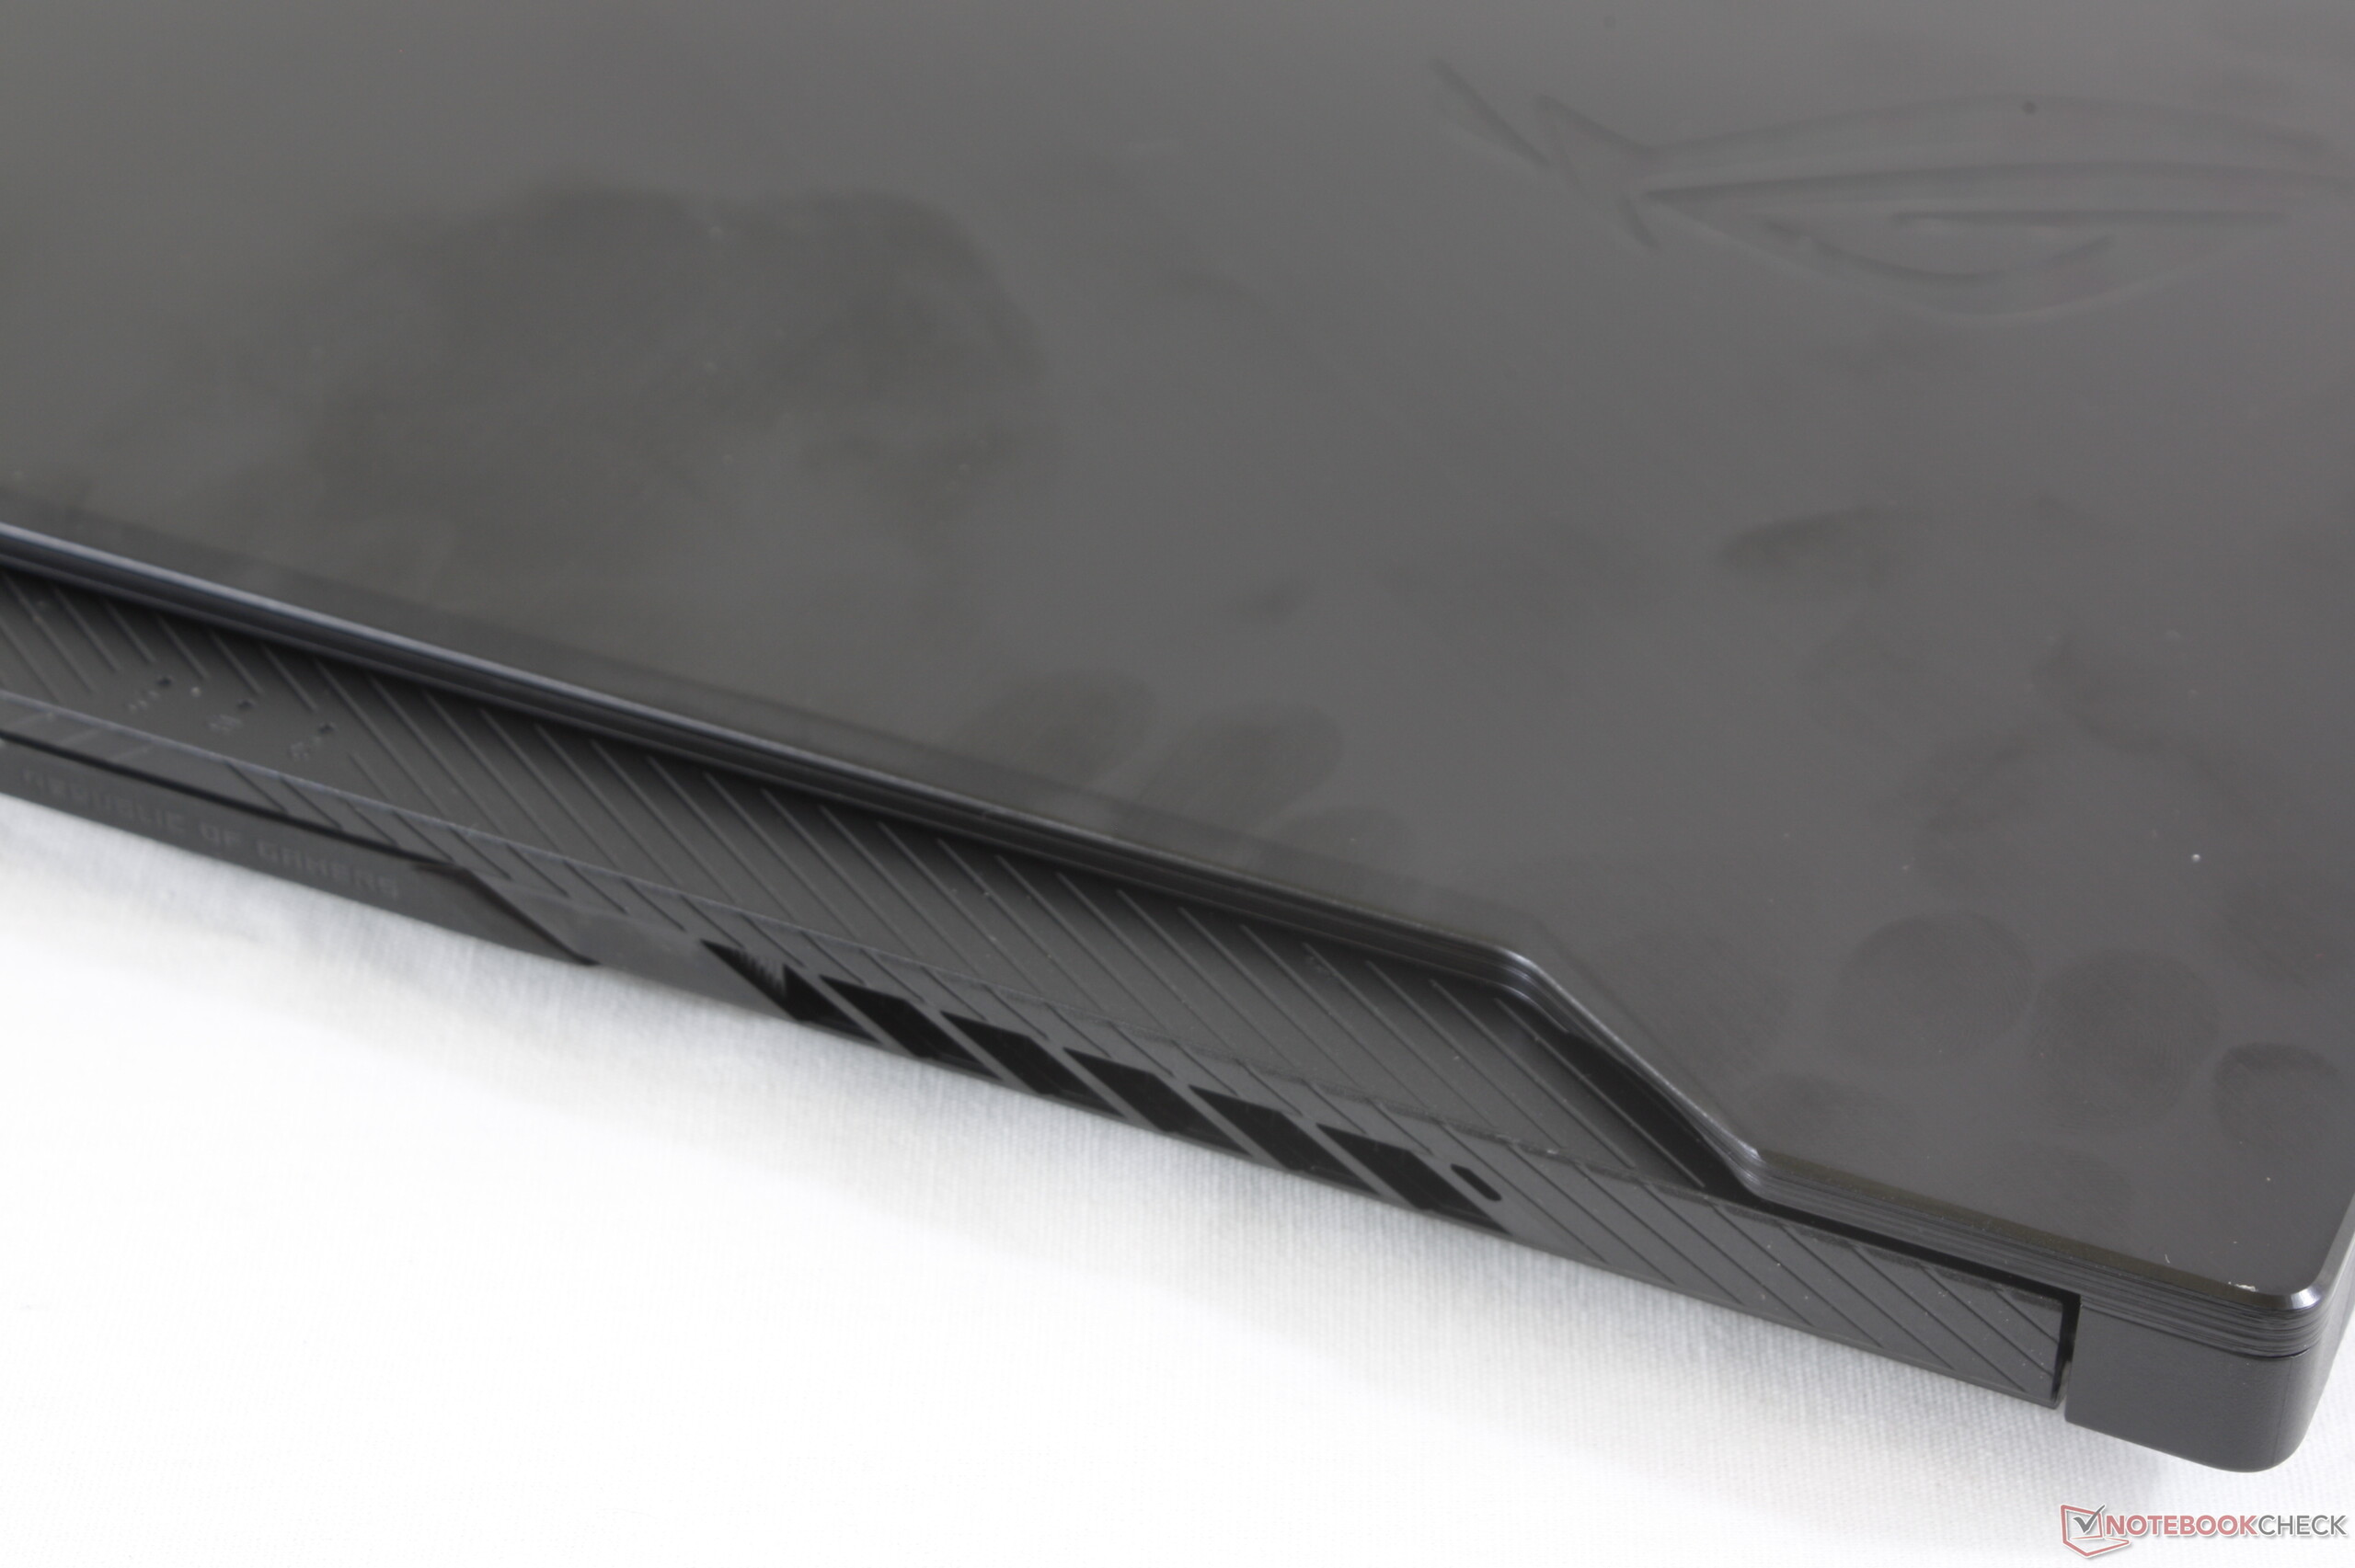
Portáteis de jogos econômicos são notórios por sua aparência sombria, plásticos baratos e perfis mais grossos. Geralmente é o preço a pagar por ter opções mais rápidas de CPU e GPU quando comparado com Ultrabooks. O design chato pode não ser importante para os gamers de baixo orçamento, desde que o desempenho seja confiável o suficiente para rodar os títulos mais recentes. E se, no entanto, dissermos a você que existe um portátil barato com a aparência de um sistema superfino e o desempenho da GTX 1060 ou melhor?
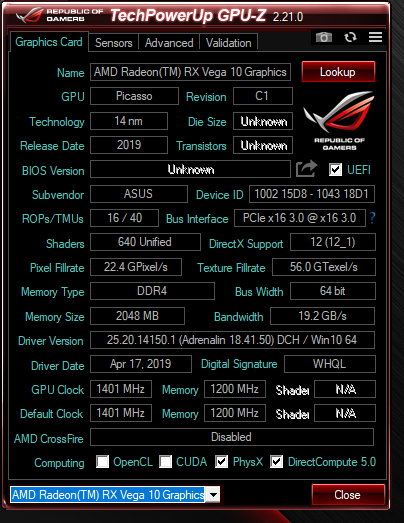
O Asus Zephyrus G GA502GU foi finamente ajustado para equilibrar o desempenho dos jogos com a aparência talvez melhor do que qualquer outro portátil para jogos desta faixa de preço. A faixa dos $1000 está cheia de sistemas para jogos de nível de entrada, como o Acer Nitro 5, MSI GF/GP series, Dell G5, Walmart Overpowered 15, e o HP Pavilion Gaming equipado com gráficos GTX 1050 Ti, GTX 1060, ou GTX 1650. O GA502GU pode superar essas alternativas com sua GPU GTX 1660 Ti Max-Q mais capaz, enquanto ostenta um design mais fino, mais eficiente no consumo de energia e mais luxuoso por quase o mesmo preço.
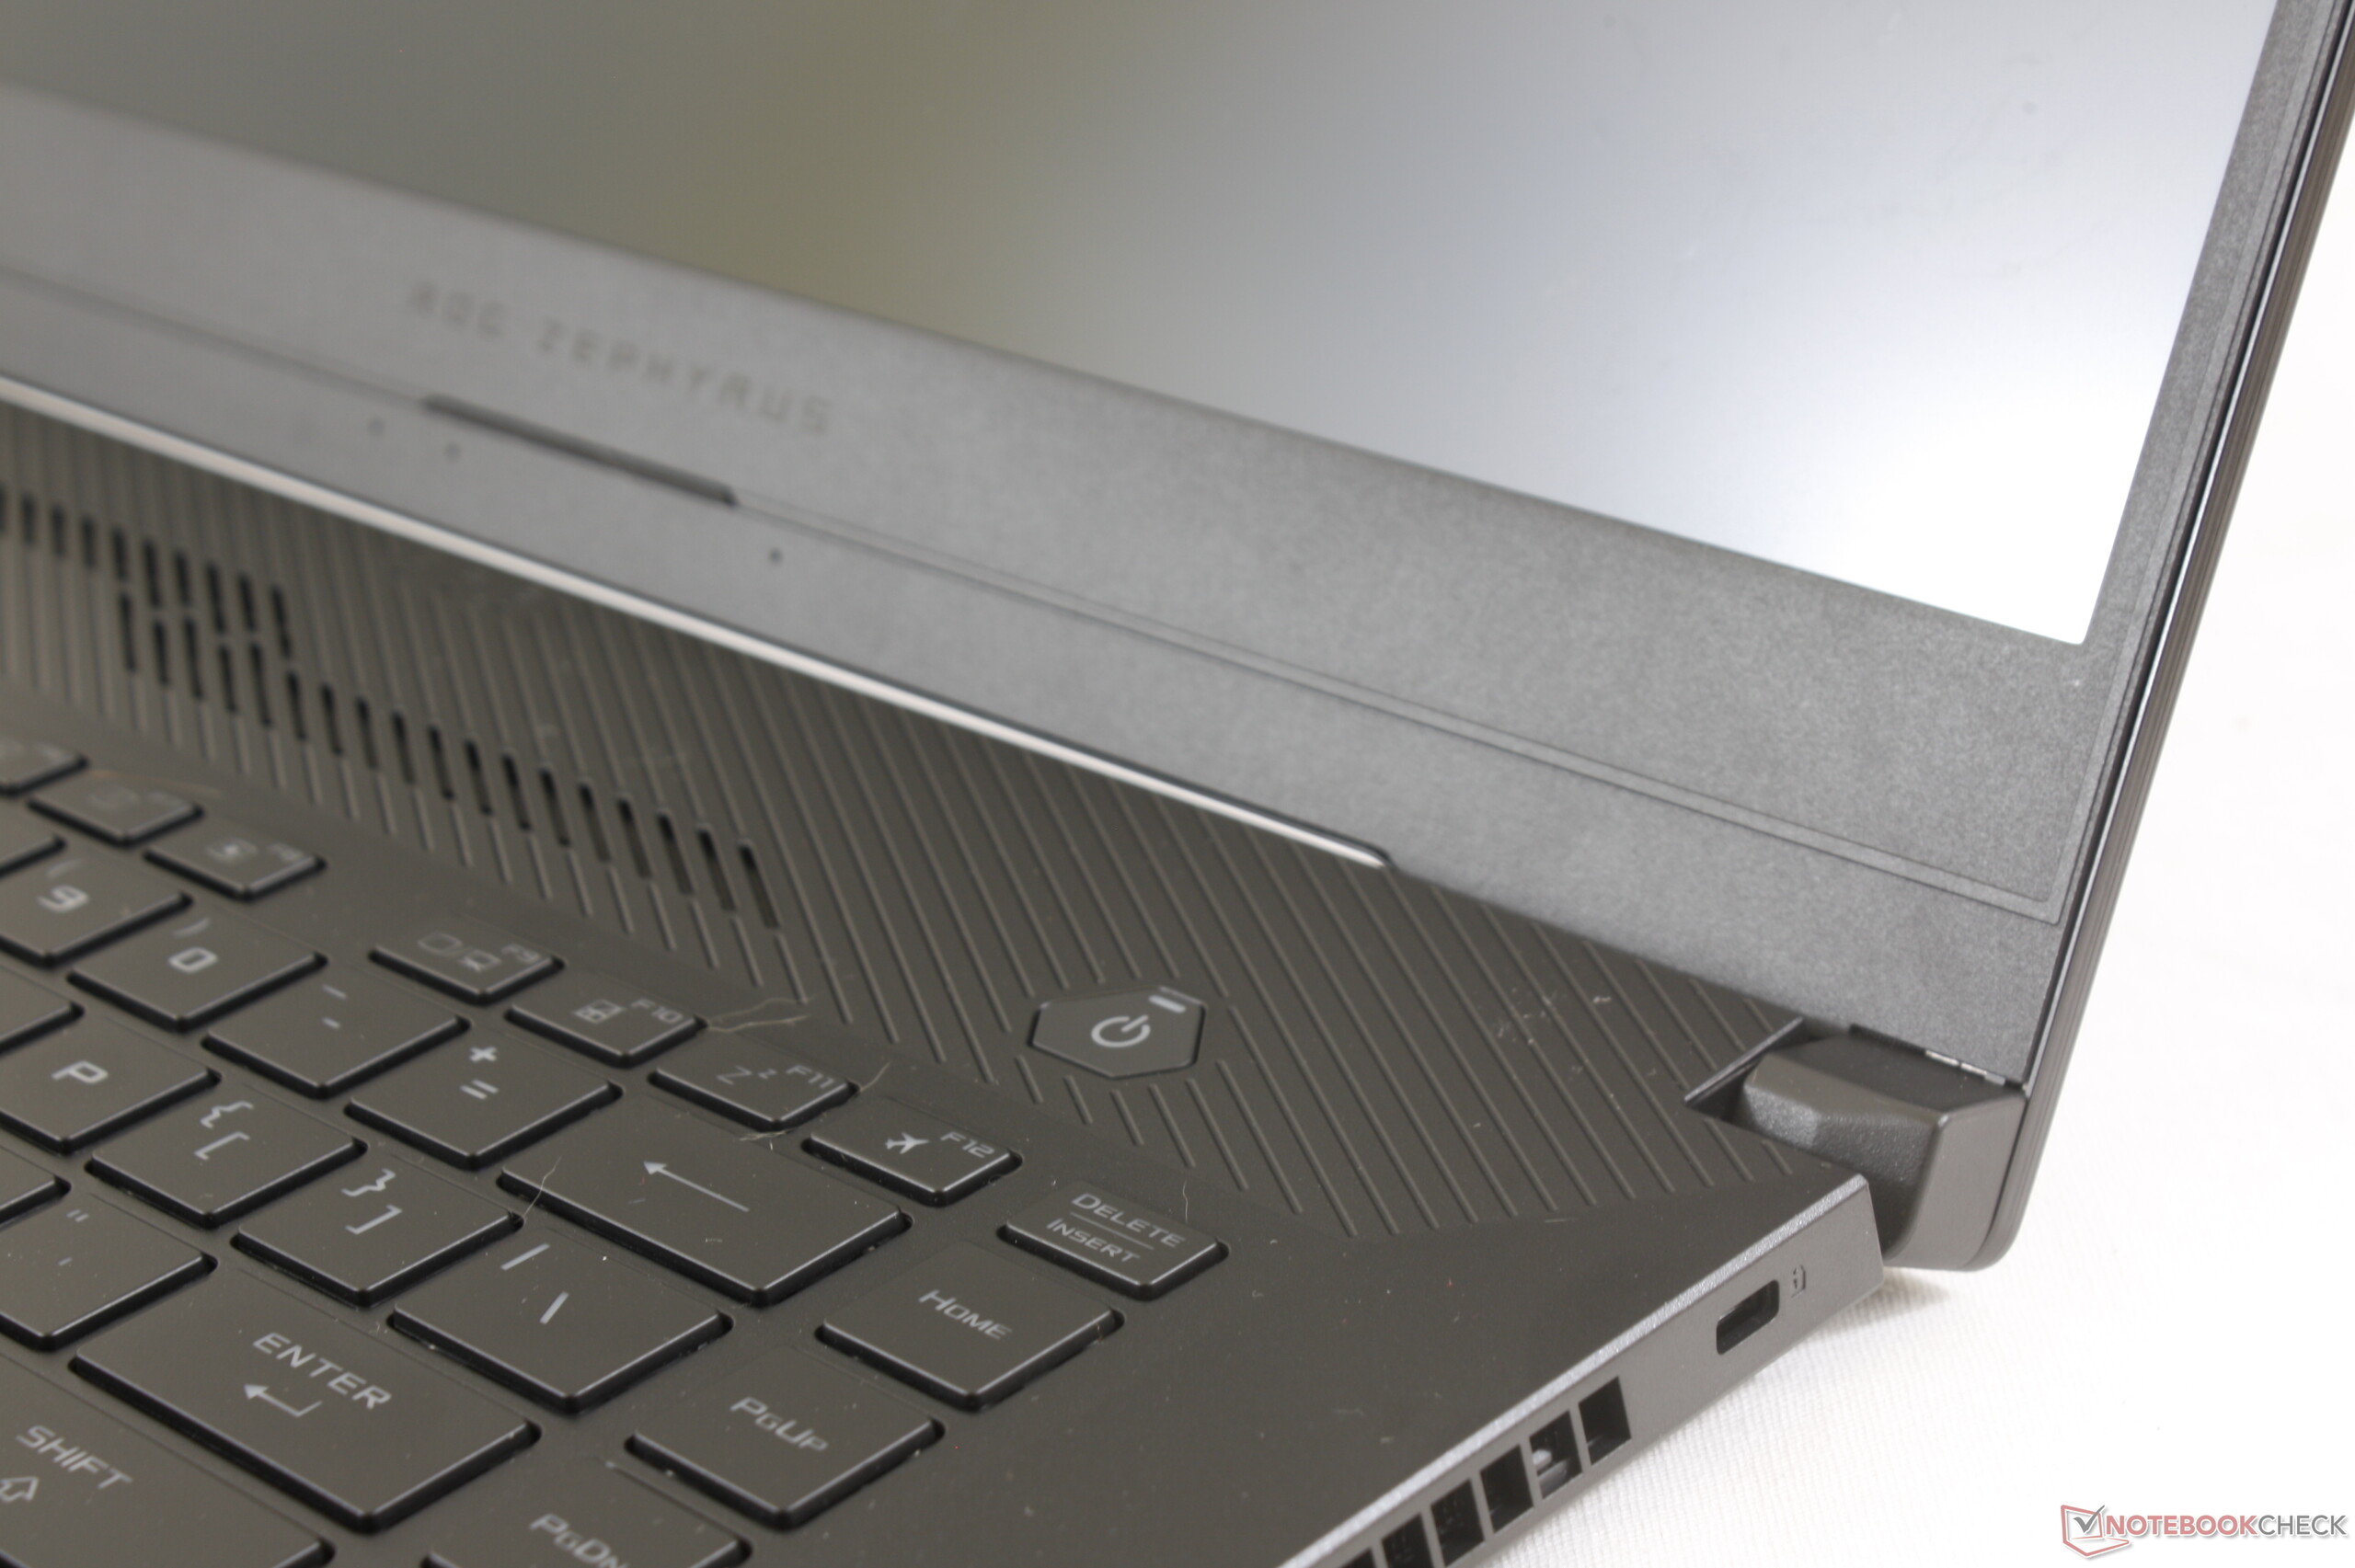
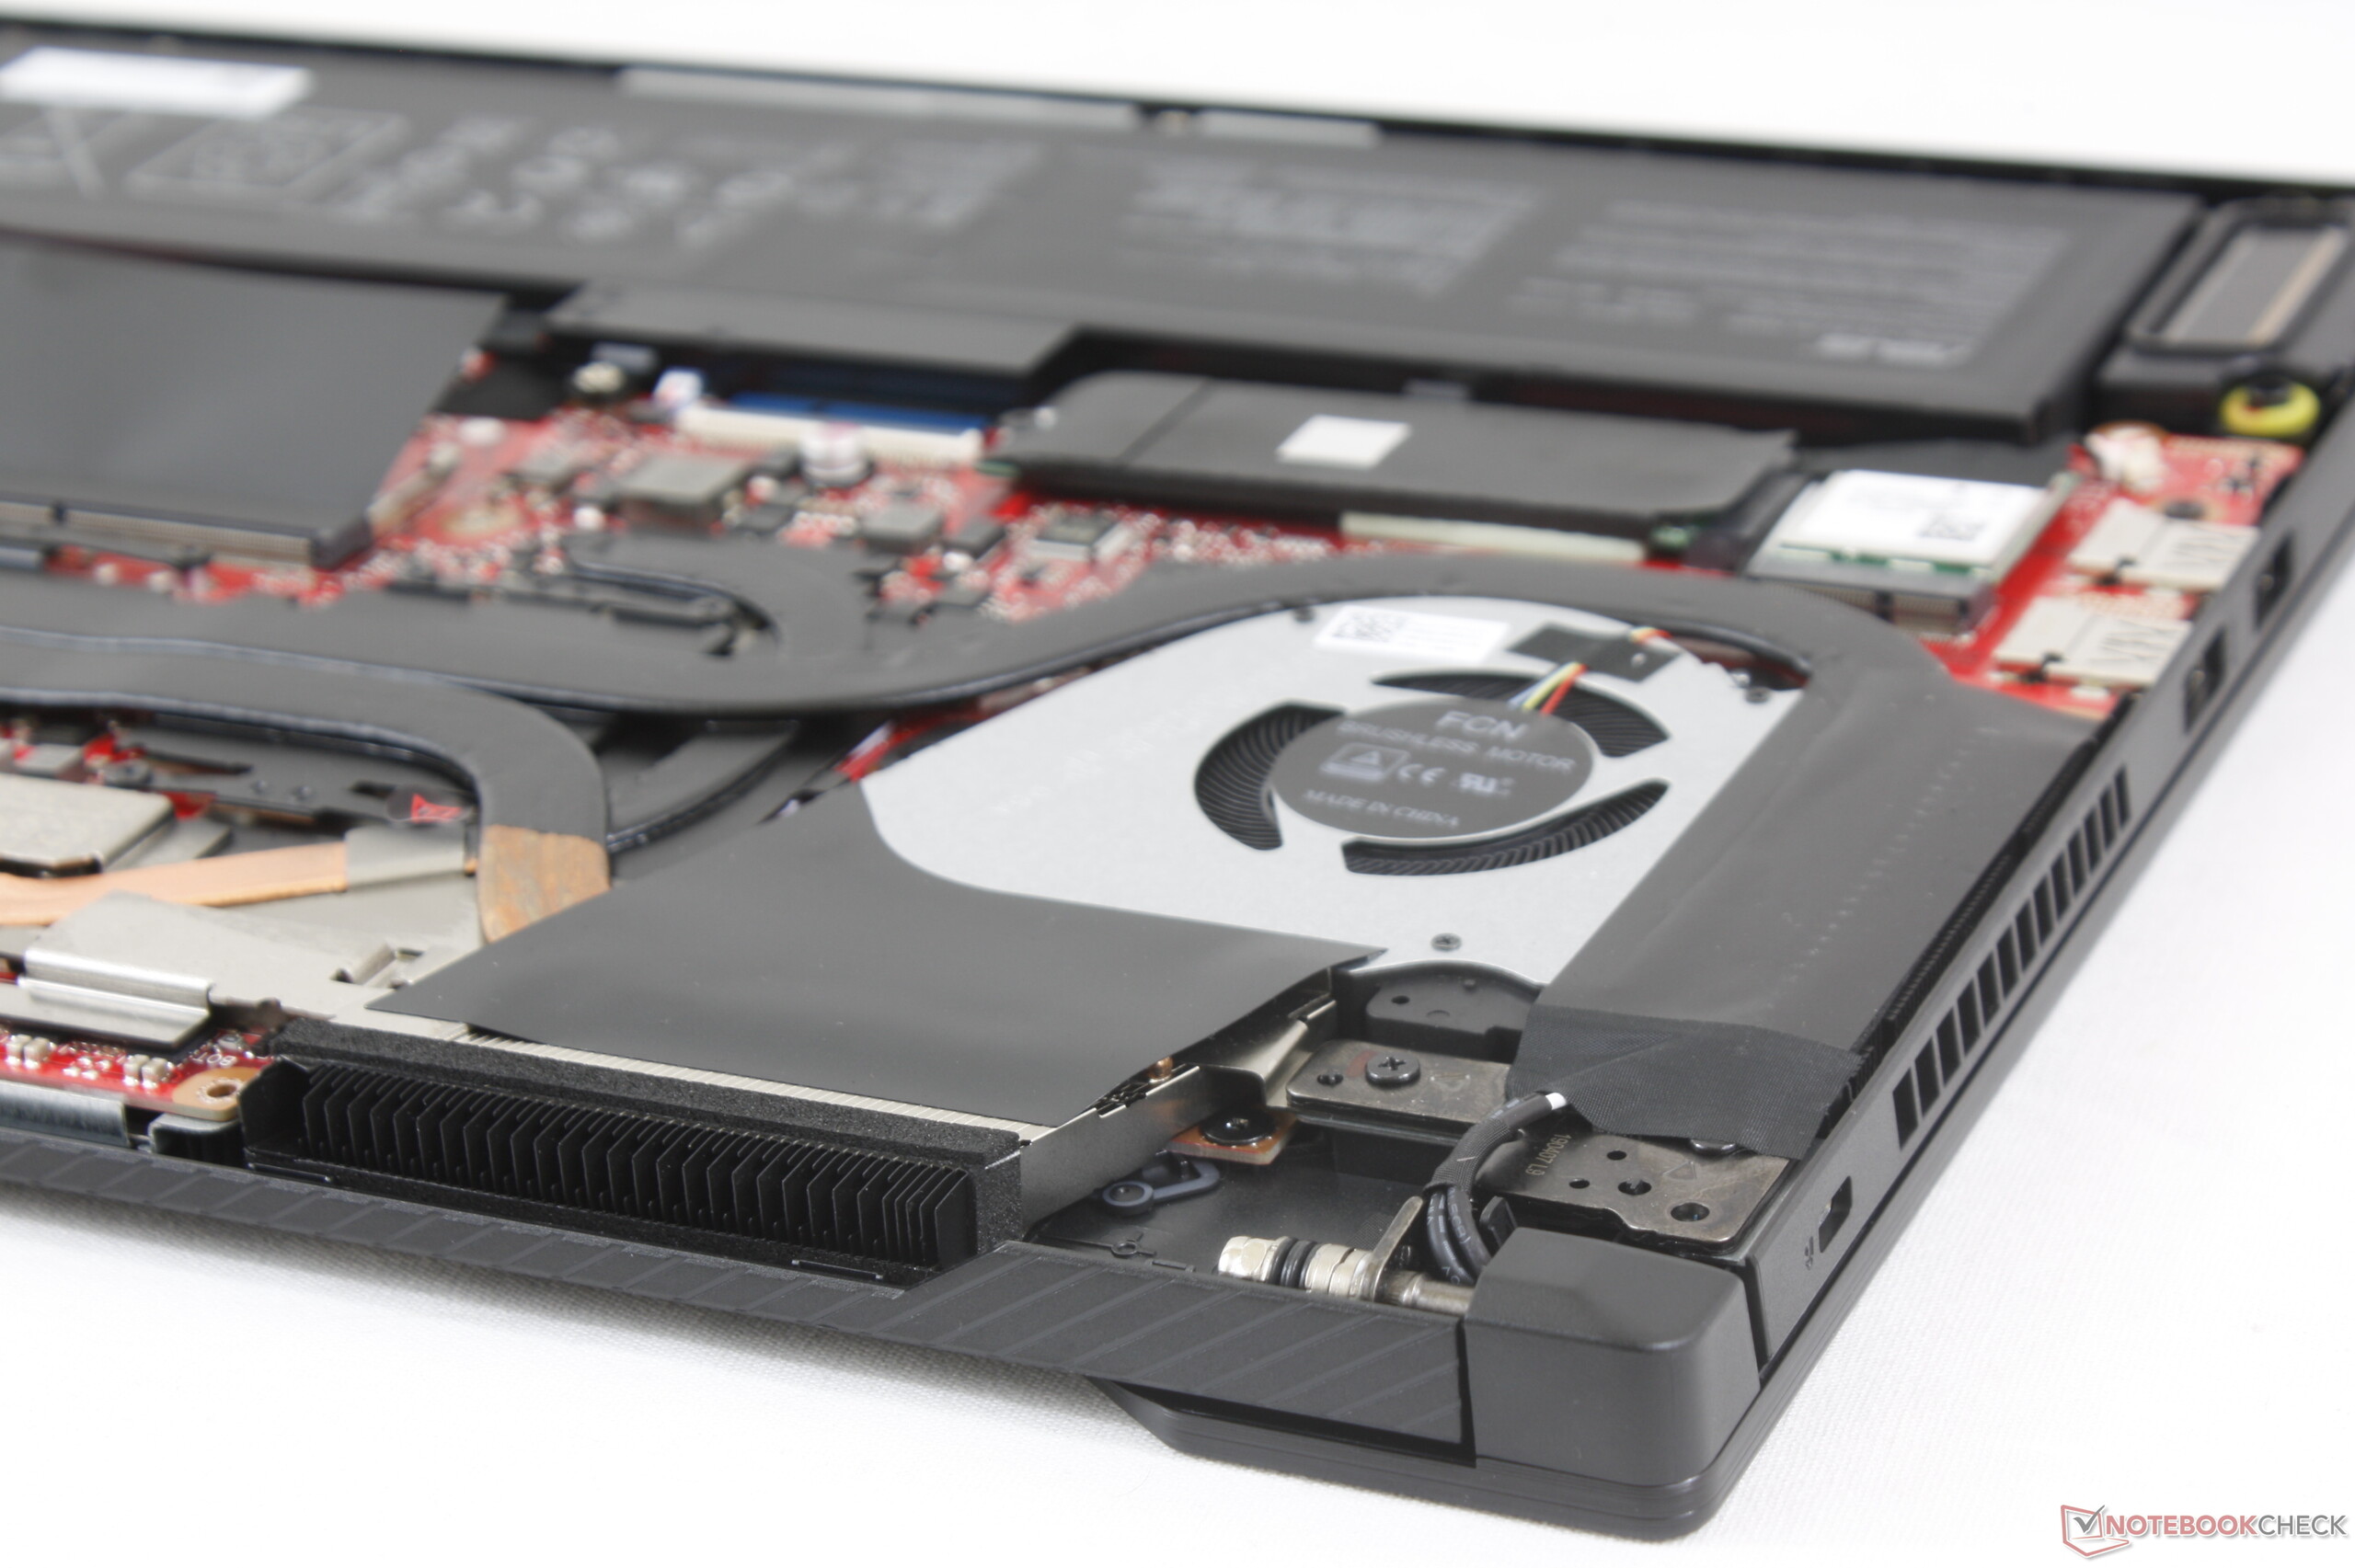
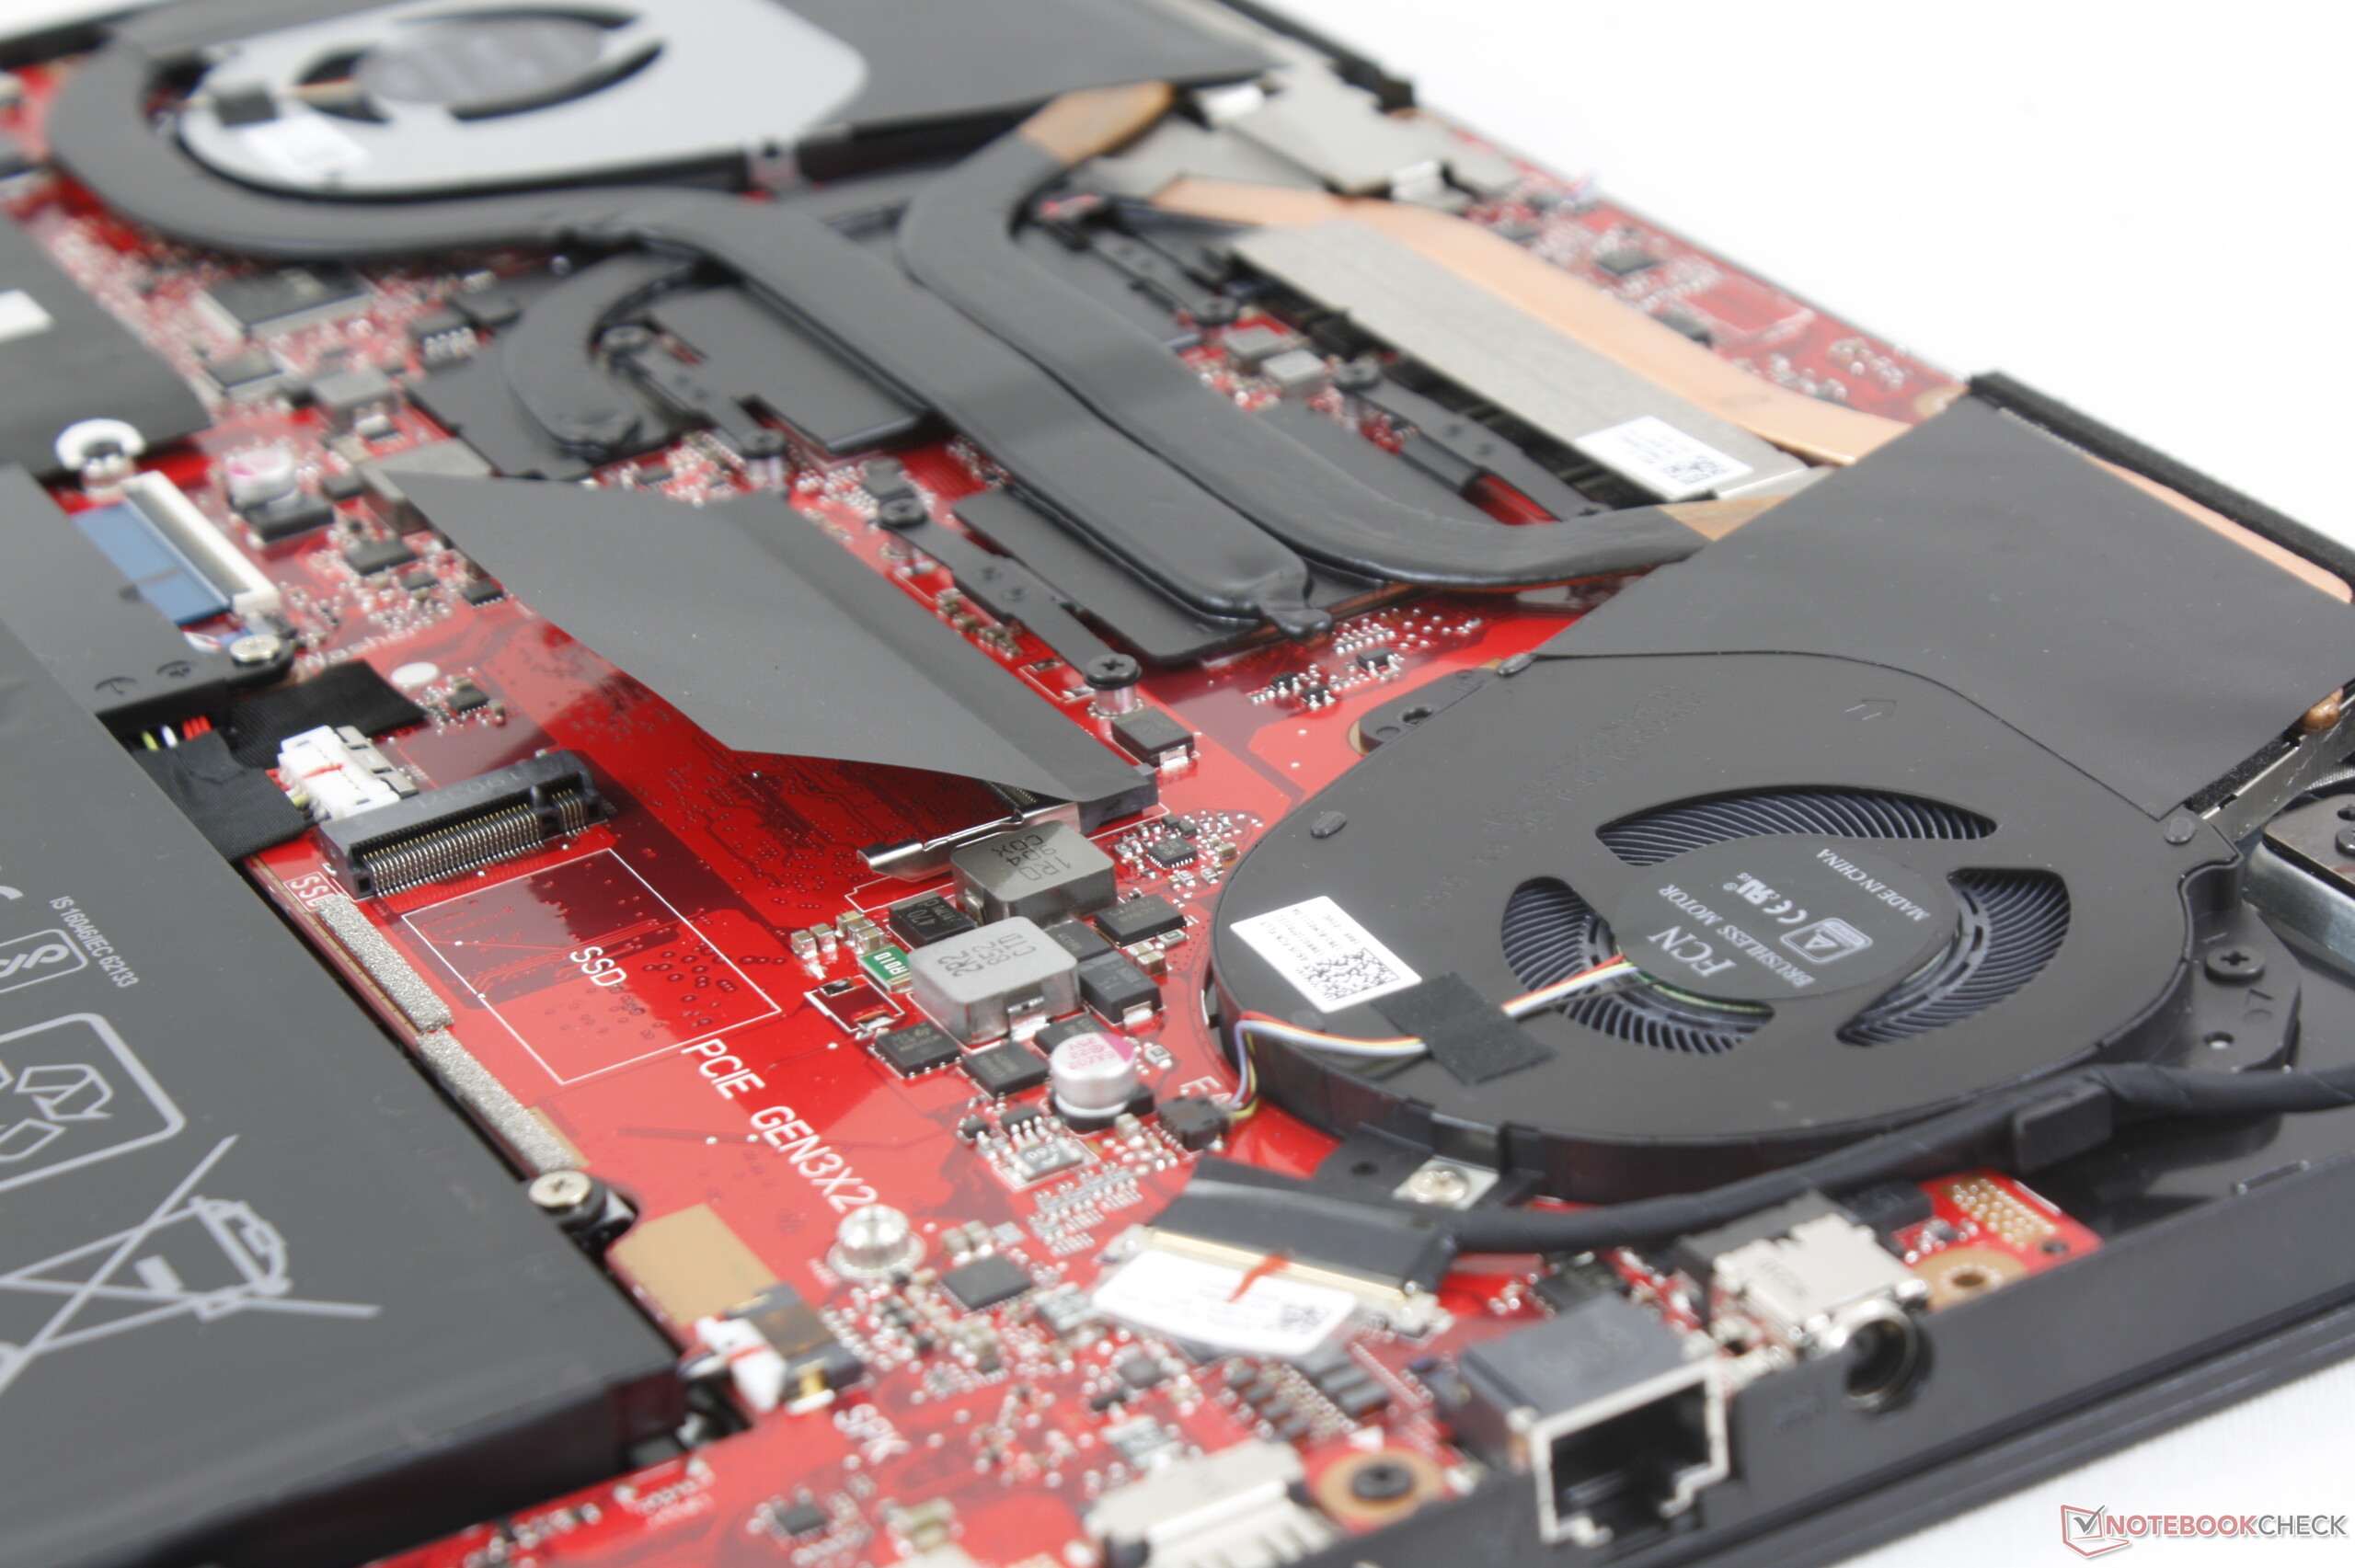
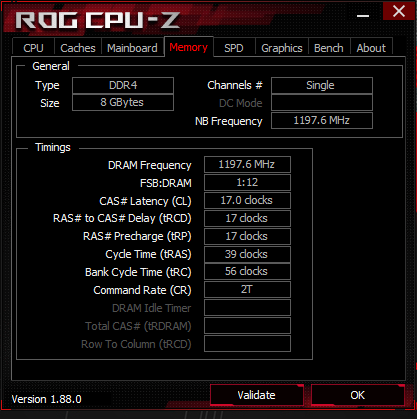
Alguns cantos tiveram que ser cortados para oferecer uma aparência de alto nível e desempenho a um nível acessível: A tela é mais escura do que a maioria, o espaço de cor é estreito, o ghosting é mais perceptível, os dois slots M.2 2280 NVMe são de meia velocidade, não há webcam integrada ou G-Sync, e o SKU base inclui apenas 8 GB de RAM single-channel apenas. Na pior das hipóteses, essas limitações diminuem muito pouco a experiência de jogos em 1080p e a RAM é felizmente fácil de expandir, se desejado. Espero que as futuras revisões abordem o ruído do ventilador para ficar mais silencioso quando estiver jogando.
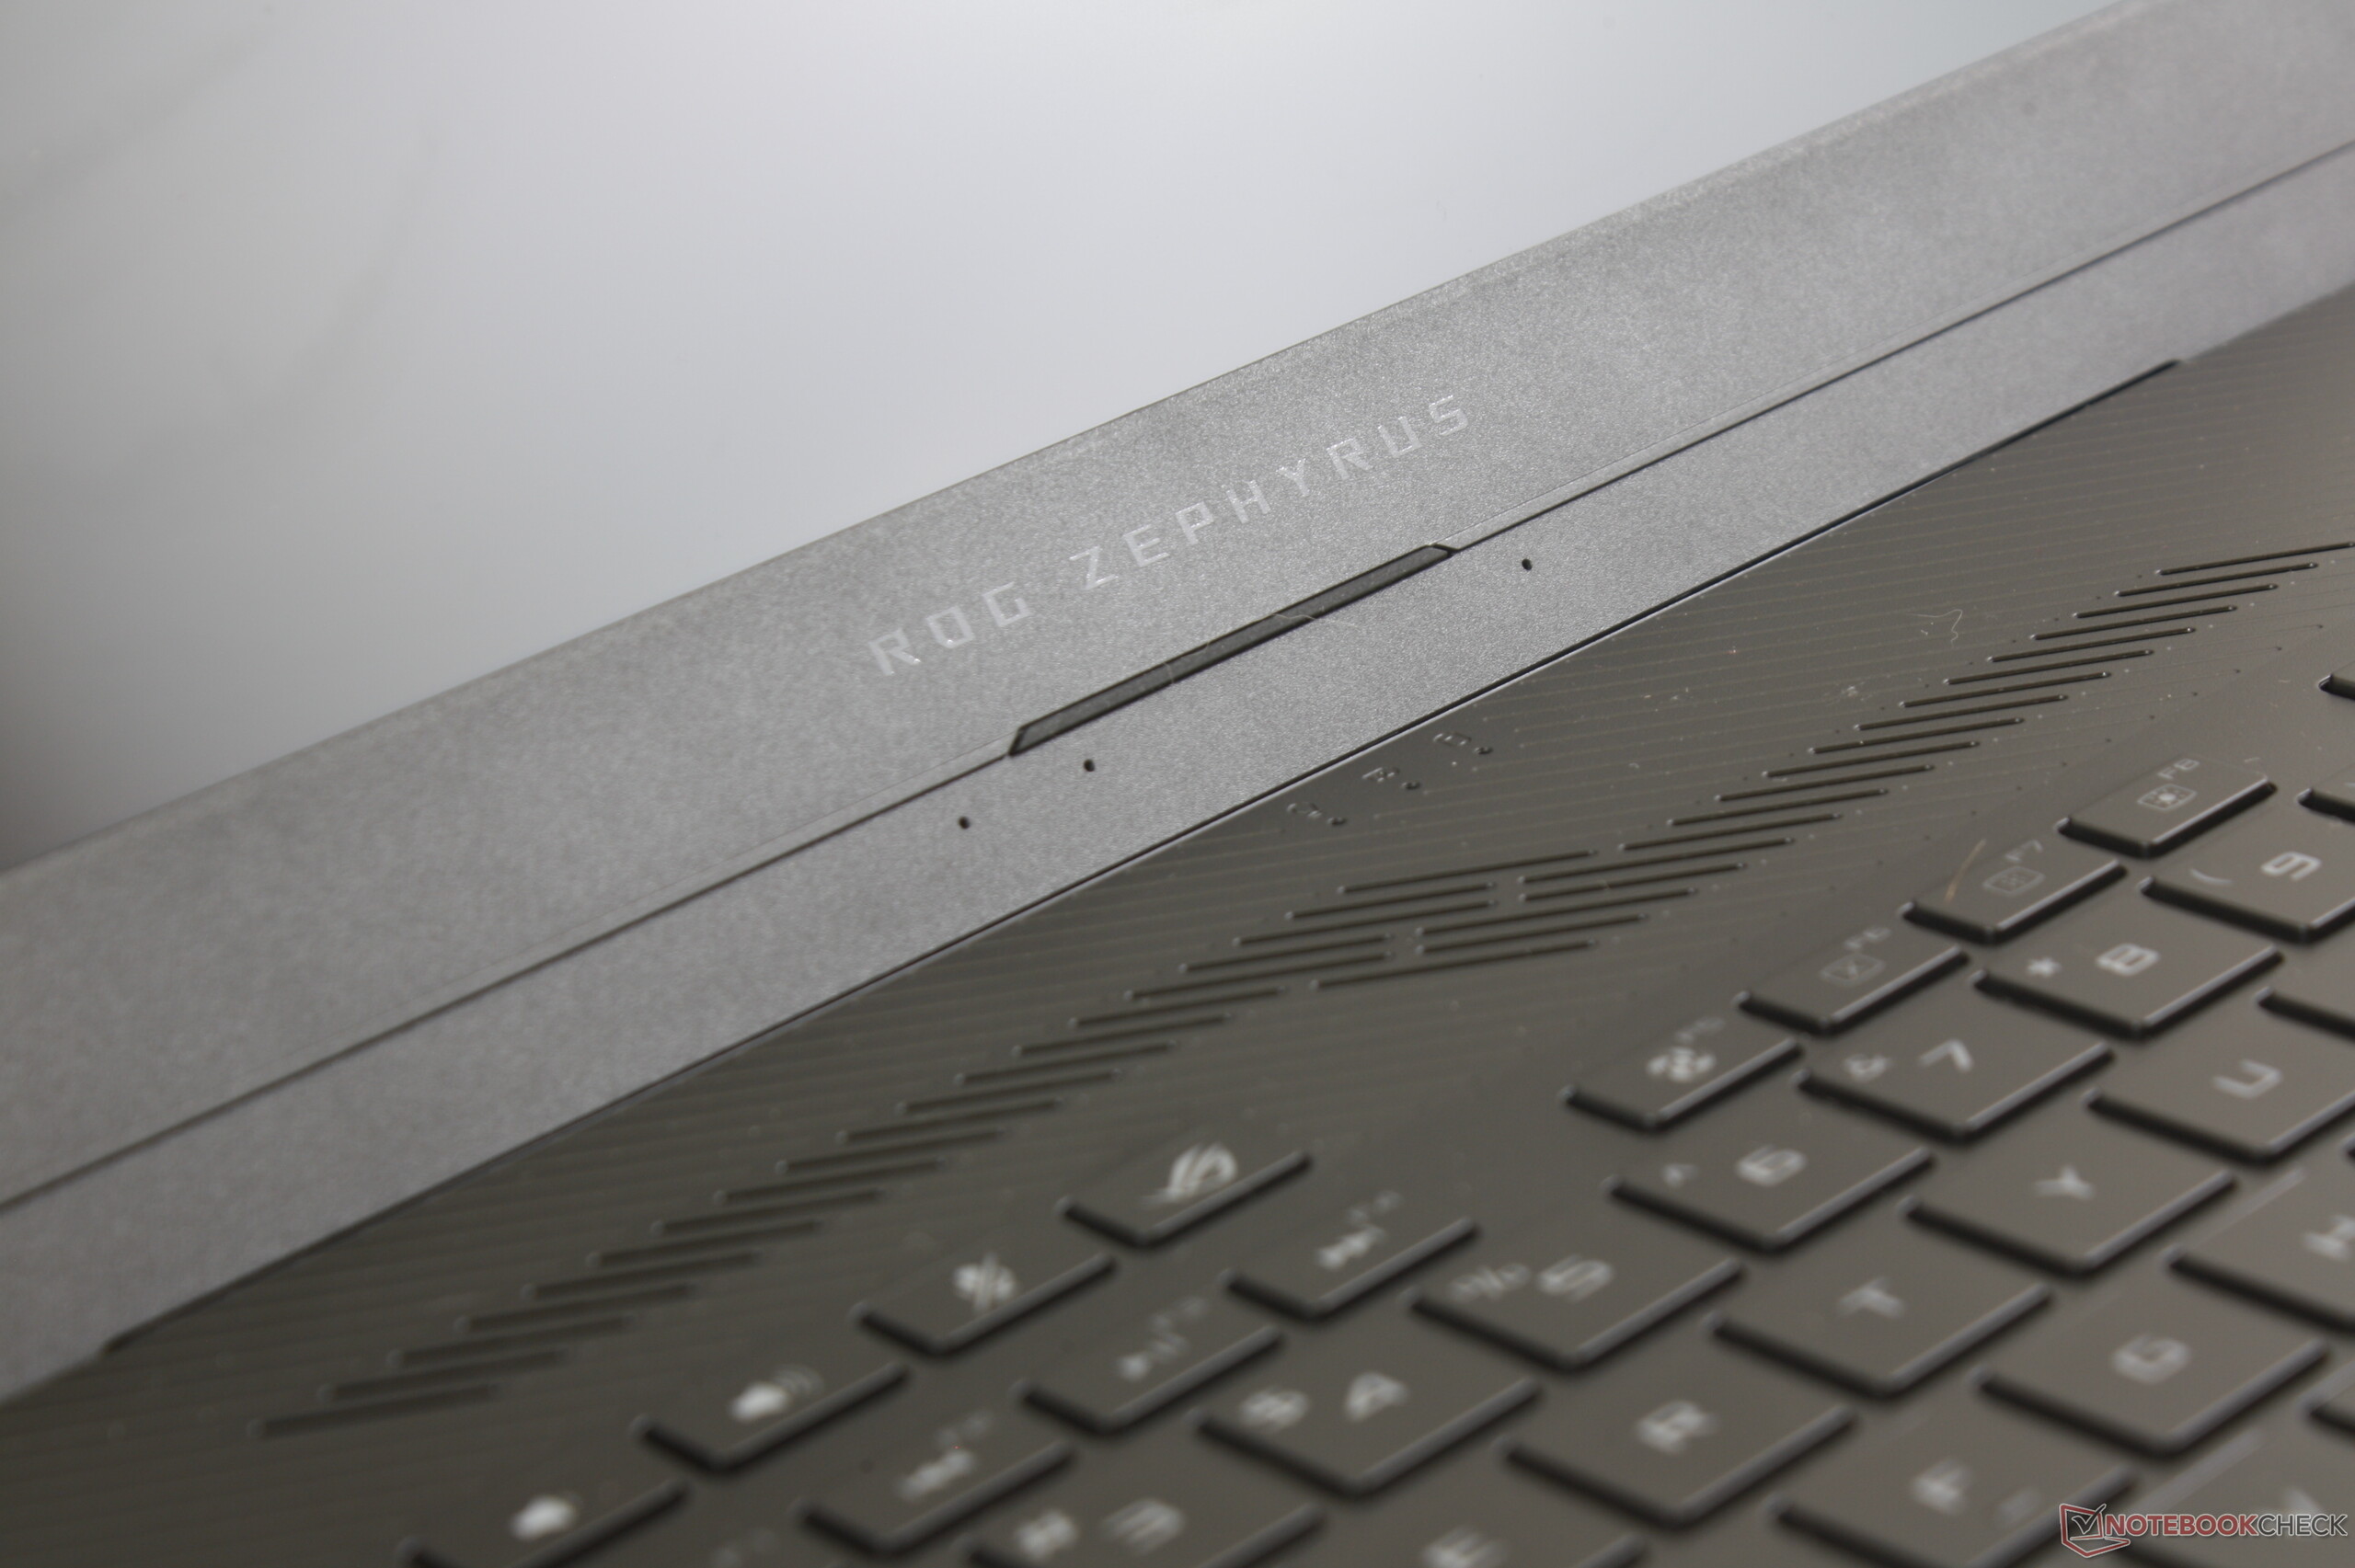
Aparência de carro-chefe com desempenho de jogos de gama média a um preço baixo. Com a ajuda de Ryzen, a Asus aumentou a aposta em como um portátil de jogos de baixo custo deve ser, se sentir e funcionar quando comparado ao mercado de portáteis de jogos Intel Core i5 baratos do mercado.
Asus ROG Zephyrus G15 GA502DU
- 05/30/2019 v6 (old)
Allen Ngo
Price comparison
