Breve Análise do Conversível Dell Latitude 7390 2-em-1 (i7-8650U, FHD)
| SD Card Reader | |
| average JPG Copy Test (av. of 3 runs) | |
| Lenovo ThinkPad X1 Carbon 2018-20KGS03900 (Toshiba Exceria Pro M501) | |
| Dell Latitude 7390 2-in-1 (Toshiba Exceria Pro M501 UHS-II) | |
| Dell Latitude 13 7380 (Toshiba Exceria Pro SDXC 64 GB UHS-II) | |
| Toshiba Portege A30-D-139 (Toshiba Exceria Pro SDXC 64 GB UHS-II) | |
| Asus ZenBook 13 UX331UN (Toshiba Exceria Pro M501 microSDXC 64GB) | |
| Média da turma Office (19.8 - 198.5, n=22, últimos 2 anos) | |
| maximum AS SSD Seq Read Test (1GB) | |
| Dell Latitude 7390 2-in-1 (Toshiba Exceria Pro M501 UHS-II) | |
| Lenovo ThinkPad X1 Carbon 2018-20KGS03900 (Toshiba Exceria Pro M501) | |
| Dell Latitude 13 7380 (Toshiba Exceria Pro SDXC 64 GB UHS-II) | |
| Toshiba Portege A30-D-139 (Toshiba Exceria Pro SDXC 64 GB UHS-II) | |
| Asus ZenBook 13 UX331UN (Toshiba Exceria Pro M501 microSDXC 64GB) | |
| Média da turma Office (27.4 - 249, n=21, últimos 2 anos) | |
| |||||||||||||||||||||||||
iluminação: 83 %
iluminação com acumulador: 318.2 cd/m²
Contraste: 1061:1 (Preto: 0.3 cd/m²)
ΔE ColorChecker Calman: 4.25 | ∀{0.5-29.43 Ø4.71}
calibrated: 4.38
ΔE Greyscale Calman: 2.1 | ∀{0.09-98 Ø4.96}
85% sRGB (Argyll 1.6.3 3D)
56% AdobeRGB 1998 (Argyll 1.6.3 3D)
62.9% AdobeRGB 1998 (Argyll 3D)
86.1% sRGB (Argyll 3D)
62.5% Display P3 (Argyll 3D)
Gamma: 2.311
CCT: 6588 K
| Dell Latitude 7390 2-in-1 AUO462D, IPS, 13.3", 1920x1080 | Dell Latitude 13 7380 LGD0589, IPS, 13.3", 1920x1080 | Lenovo ThinkPad X1 Carbon 2018-20KGS03900 B140QAN02.0, IPS, 14", 2560x1440 | HP Elitebook 1040 G4-2XU40UT Chi Mei CMN14D7, IPS, 14", 1920x1080 | Asus ZenBook 13 UX331UN AU Optronics B133HAN04.9, IPS, 13.3", 1920x1080 | Toshiba Portege A30-D-139 Toshiba TOS508F, IPS, 13.3", 1920x1080 | |
|---|---|---|---|---|---|---|
| Display | 6% | 38% | 10% | 1% | 11% | |
| Display P3 Coverage (%) | 62.5 | 65.5 5% | 87.7 40% | 66.8 7% | 63.3 1% | 68 9% |
| sRGB Coverage (%) | 86.1 | 91.8 7% | 100 16% | 97.1 13% | 86.7 1% | 98.1 14% |
| AdobeRGB 1998 Coverage (%) | 62.9 | 65.8 5% | 99.9 59% | 69 10% | 63.4 1% | 70 11% |
| Response Times | 17% | -17% | 16% | 16% | 10% | |
| Response Time Grey 50% / Grey 80% * (ms) | 48.8 ? | 34 ? 30% | 59.2 ? -21% | 34.4 ? 30% | 44 ? 10% | 40 ? 18% |
| Response Time Black / White * (ms) | 30.4 ? | 29.6 ? 3% | 34.4 ? -13% | 30 ? 1% | 24 ? 21% | 30 ? 1% |
| PWM Frequency (Hz) | 26040 ? | 208 ? | ||||
| Screen | -31% | 36% | -3% | 1% | -10% | |
| Brightness middle (cd/m²) | 318.2 | 317 0% | 578 82% | 295.9 -7% | 329 3% | 319 0% |
| Brightness (cd/m²) | 312 | 295 -5% | 533 71% | 287 -8% | 306 -2% | 296 -5% |
| Brightness Distribution (%) | 83 | 87 5% | 84 1% | 87 5% | 86 4% | 88 6% |
| Black Level * (cd/m²) | 0.3 | 0.3 -0% | 0.38 -27% | 0.23 23% | 0.3 -0% | 0.28 7% |
| Contrast (:1) | 1061 | 1057 0% | 1521 43% | 1287 21% | 1097 3% | 1139 7% |
| Colorchecker dE 2000 * | 4.25 | 6.3 -48% | 1.9 55% | 2.83 33% | 4.07 4% | 4.04 5% |
| Colorchecker dE 2000 max. * | 9.49 | 10.4 -10% | 3.8 60% | 7.34 23% | 7.05 26% | 8.09 15% |
| Colorchecker dE 2000 calibrated * | 4.38 | 0.8 82% | ||||
| Greyscale dE 2000 * | 2.1 | 7.8 -271% | 3 -43% | 5.2 -148% | 2.76 -31% | 5.5 -162% |
| Gamma | 2.311 95% | 1.81 122% | 2.14 103% | 2.28 96% | 2.56 86% | 2.4 92% |
| CCT | 6588 99% | 7120 91% | 6377 102% | 7056 92% | 6915 94% | 7198 90% |
| Color Space (Percent of AdobeRGB 1998) (%) | 56 | 61 9% | 88.8 59% | 63 13% | 56 0% | 64 14% |
| Color Space (Percent of sRGB) (%) | 85 | 92 8% | 100 18% | 97 14% | 86 1% | 98 15% |
| Média Total (Programa/Configurações) | -3% /
-17% | 19% /
30% | 8% /
2% | 6% /
3% | 4% /
-3% |
* ... menor é melhor
Exibir tempos de resposta
| ↔ Tempo de resposta preto para branco | ||
|---|---|---|
| 30.4 ms ... ascensão ↗ e queda ↘ combinadas | ↗ 16.4 ms ascensão | 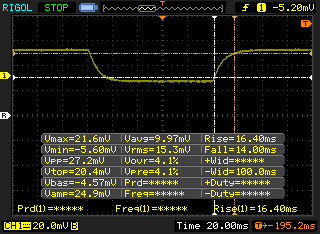 |
| ↘ 14 ms queda | ||
| A tela mostra taxas de resposta lentas em nossos testes e será insatisfatória para os jogadores. Em comparação, todos os dispositivos testados variam de 0.1 (mínimo) a 240 (máximo) ms. » 82 % de todos os dispositivos são melhores. Isso significa que o tempo de resposta medido é pior que a média de todos os dispositivos testados (19.8 ms). | ||
| ↔ Tempo de resposta 50% cinza a 80% cinza | ||
| 48.8 ms ... ascensão ↗ e queda ↘ combinadas | ↗ 23.6 ms ascensão | 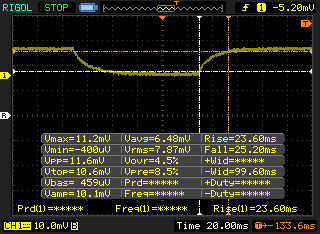 |
| ↘ 25.2 ms queda | ||
| A tela mostra taxas de resposta lentas em nossos testes e será insatisfatória para os jogadores. Em comparação, todos os dispositivos testados variam de 0.165 (mínimo) a 636 (máximo) ms. » 84 % de todos os dispositivos são melhores. Isso significa que o tempo de resposta medido é pior que a média de todos os dispositivos testados (31 ms). | ||
Cintilação da tela / PWM (modulação por largura de pulso)
| Tela tremeluzindo / PWM não detectado | 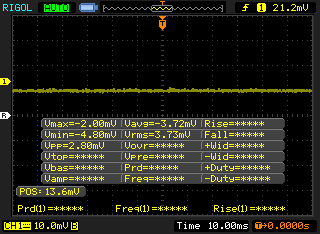 | ||
[pwm_comparison] Em comparação: 52 % de todos os dispositivos testados não usam PWM para escurecer a tela. Se PWM foi detectado, uma média de 7754 (mínimo: 5 - máximo: 343500) Hz foi medida. | |||
| wPrime 2.10 - 1024m | |
| Dell Latitude 13 7380 | |
| Média da turma Office (208 - 675, n=8, últimos 2 anos) | |
| HP Elitebook 1040 G4-2XU40UT | |
| Dell Latitude 7390 2-in-1 | |
| Média Intel Core i7-8650U (268 - 335, n=3) | |
* ... menor é melhor
| PCMark 8 Home Score Accelerated v2 | 3760 pontos | |
| PCMark 8 Creative Score Accelerated v2 | 4869 pontos | |
| PCMark 8 Work Score Accelerated v2 | 4978 pontos | |
| PCMark 10 Score | 3520 pontos | |
Ajuda | ||
| Dell Latitude 7390 2-in-1 SK hynix PC401 NVMe 500 GB | Lenovo ThinkPad X1 Carbon 2018-20KGS03900 Samsung SSD PM981 MZVLB512HAJQ | HP Elitebook 1040 G4-2XU40UT Toshiba XG4 NVMe (THNSN5512GPUK) | Asus ZenBook 13 UX331UN SK Hynix HFS256G39TND-N210A | Toshiba Portege A30-D-139 Toshiba SG5 THNSNK128GVN8 | |
|---|---|---|---|---|---|
| AS SSD | 65% | -12% | -80% | -91% | |
| Copy Game MB/s (MB/s) | 473.6 | 1107 134% | 394.2 -17% | 154.1 -67% | |
| Copy Program MB/s (MB/s) | 223.5 | 460.2 106% | 133.7 -40% | 129.7 -42% | |
| Copy ISO MB/s (MB/s) | 1377 | 1247 -9% | 534 -61% | 192.4 -86% | |
| Score Total (Points) | 2057 | 3529 72% | 2299 12% | 991 -52% | 650 -68% |
| Score Write (Points) | 781 | 1801 131% | 848 9% | 323 -59% | 163 -79% |
| Score Read (Points) | 877 | 1168 33% | 979 12% | 445 -49% | 330 -62% |
| Access Time Write * (ms) | 0.052 | 0.027 48% | 0.038 27% | 0.23 -342% | 0.085 -63% |
| Access Time Read * (ms) | 0.045 | 0.029 36% | 0.105 -133% | 0.09 -100% | 0.2 -344% |
| 4K-64 Write (MB/s) | 606 | 1529 152% | 662 9% | 233.1 -62% | 83.7 -86% |
| 4K-64 Read (MB/s) | 643 | 876 36% | 782 22% | 368.4 -43% | 257.8 -60% |
| 4K Write (MB/s) | 103.4 | 134.3 30% | 100.1 -3% | 68.9 -33% | 66.8 -35% |
| 4K Read (MB/s) | 42.12 | 52.4 24% | 38.49 -9% | 27.98 -34% | 21.64 -49% |
| Seq Write (MB/s) | 711 | 1376 94% | 863 21% | 213.7 -70% | 128.6 -82% |
| Seq Read (MB/s) | 1911 | 2396 25% | 1585 -17% | 483.7 -75% | 502 -74% |
* ... menor é melhor

| 3DMark 06 Standard Score | 9648 pontos | |
| 3DMark 11 Performance | 1808 pontos | |
| 3DMark Ice Storm Standard Score | 64396 pontos | |
| 3DMark Cloud Gate Standard Score | 8115 pontos | |
| 3DMark Fire Strike Score | 950 pontos | |
| 3DMark Fire Strike Extreme Score | 395 pontos | |
Ajuda | ||
| baixo | média | alto | ultra | |
|---|---|---|---|---|
| BioShock Infinite (2013) | 56 | 33 | 27 | 10 |
Barulho
| Ocioso |
| 28.2 / 28.2 / 28.2 dB |
| Carga |
| 32 / 41.6 dB |
 | ||
30 dB silencioso 40 dB(A) audível 50 dB(A) ruidosamente alto |
||
min: | ||
| Dell Latitude 7390 2-in-1 UHD Graphics 620, i7-8650U, SK hynix PC401 NVMe 500 GB | Dell Latitude 13 7380 HD Graphics 620, i7-7600U, Samsung PM961 MZVLW256HEHP | Lenovo ThinkPad X1 Carbon 2018-20KGS03900 UHD Graphics 620, i5-8550U, Samsung SSD PM981 MZVLB512HAJQ | HP Elitebook 1040 G4-2XU40UT HD Graphics 630, i7-7820HQ, Toshiba XG4 NVMe (THNSN5512GPUK) | Asus ZenBook 13 UX331UN GeForce MX150, i5-8550U, SK Hynix HFS256G39TND-N210A | Toshiba Portege A30-D-139 HD Graphics 620, i3-7100U, Toshiba SG5 THNSNK128GVN8 | |
|---|---|---|---|---|---|---|
| Noise | 3% | -3% | 2% | -8% | -7% | |
| desligado / ambiente * (dB) | 28.2 | 28 1% | 28.9 -2% | 28.2 -0% | 30.13 -7% | 30 -6% |
| Idle Minimum * (dB) | 28.2 | 28 1% | 28.9 -2% | 28.2 -0% | 30.13 -7% | 30 -6% |
| Idle Average * (dB) | 28.2 | 28 1% | 28.9 -2% | 28.2 -0% | 30.3 -7% | 30 -6% |
| Idle Maximum * (dB) | 28.2 | 29.6 -5% | 32.5 -15% | 28.2 -0% | 30.3 -7% | 30 -6% |
| Load Average * (dB) | 32 | 30.6 4% | 35.1 -10% | 33.3 -4% | 39.2 -23% | 39.3 -23% |
| Load Maximum * (dB) | 41.6 | 35.4 15% | 35.1 16% | 35.3 15% | 41 1% | 38.3 8% |
* ... menor é melhor
(±) A temperatura máxima no lado superior é 44 °C / 111 F, em comparação com a média de 34.3 °C / 94 F , variando de 21.2 a 62.5 °C para a classe Office.
(-) A parte inferior aquece até um máximo de 50.6 °C / 123 F, em comparação com a média de 36.8 °C / 98 F
(+) Em uso inativo, a temperatura média para o lado superior é 25.2 °C / 77 F, em comparação com a média do dispositivo de 29.5 °C / ### class_avg_f### F.
(+) Os apoios para as mãos e o touchpad são mais frios que a temperatura da pele, com um máximo de 27.4 °C / 81.3 F e, portanto, são frios ao toque.
(±) A temperatura média da área do apoio para as mãos de dispositivos semelhantes foi 27.5 °C / 81.5 F (+0.1 °C / 0.2 F).
Dell Latitude 7390 2-in-1 análise de áudio
(+) | os alto-falantes podem tocar relativamente alto (###valor### dB)
Graves 100 - 315Hz
(-) | quase nenhum baixo - em média 17.1% menor que a mediana
(±) | a linearidade dos graves é média (9% delta para a frequência anterior)
Médios 400 - 2.000 Hz
(±) | médios mais altos - em média 6.4% maior que a mediana
(±) | a linearidade dos médios é média (11.1% delta para frequência anterior)
Altos 2 - 16 kHz
(±) | máximos mais altos - em média 6% maior que a mediana
(±) | a linearidade dos máximos é média (11% delta para frequência anterior)
Geral 100 - 16.000 Hz
(±) | a linearidade do som geral é média (22.8% diferença em relação à mediana)
Comparado com a mesma classe
» 63% de todos os dispositivos testados nesta classe foram melhores, 8% semelhantes, 29% piores
» O melhor teve um delta de 7%, a média foi 21%, o pior foi 53%
Comparado com todos os dispositivos testados
» 68% de todos os dispositivos testados foram melhores, 5% semelhantes, 27% piores
» O melhor teve um delta de 4%, a média foi 23%, o pior foi 134%
Lenovo ThinkPad X1 Carbon 2018-20KGS03900 análise de áudio
(+) | os alto-falantes podem tocar relativamente alto (###valor### dB)
Graves 100 - 315Hz
(-) | quase nenhum baixo - em média 25.9% menor que a mediana
(±) | a linearidade dos graves é média (9.8% delta para a frequência anterior)
Médios 400 - 2.000 Hz
(+) | médios equilibrados - apenas 3.8% longe da mediana
(±) | a linearidade dos médios é média (9% delta para frequência anterior)
Altos 2 - 16 kHz
(+) | agudos equilibrados - apenas 2.1% longe da mediana
(+) | os máximos são lineares (4% delta da frequência anterior)
Geral 100 - 16.000 Hz
(±) | a linearidade do som geral é média (18.7% diferença em relação à mediana)
Comparado com a mesma classe
» 35% de todos os dispositivos testados nesta classe foram melhores, 6% semelhantes, 59% piores
» O melhor teve um delta de 7%, a média foi 21%, o pior foi 53%
Comparado com todos os dispositivos testados
» 43% de todos os dispositivos testados foram melhores, 8% semelhantes, 49% piores
» O melhor teve um delta de 4%, a média foi 23%, o pior foi 134%
| desligado | |
| Ocioso | |
| Carga |
|
Key:
min: | |
| Dell Latitude 7390 2-in-1 i7-8650U, UHD Graphics 620, SK hynix PC401 NVMe 500 GB, IPS, 1920x1080, 13.3" | Dell Latitude 13 7380 i7-7600U, HD Graphics 620, Samsung PM961 MZVLW256HEHP, IPS, 1920x1080, 13.3" | Lenovo ThinkPad X1 Carbon 2018-20KGS03900 i5-8550U, UHD Graphics 620, Samsung SSD PM981 MZVLB512HAJQ, IPS, 2560x1440, 14" | HP Elitebook 1040 G4-2XU40UT i7-7820HQ, HD Graphics 630, Toshiba XG4 NVMe (THNSN5512GPUK), IPS, 1920x1080, 14" | Asus ZenBook 13 UX331UN i5-8550U, GeForce MX150, SK Hynix HFS256G39TND-N210A, IPS, 1920x1080, 13.3" | Toshiba Portege A30-D-139 i3-7100U, HD Graphics 620, Toshiba SG5 THNSNK128GVN8, IPS, 1920x1080, 13.3" | |
|---|---|---|---|---|---|---|
| Power Consumption | -1% | -60% | -60% | -9% | -10% | |
| Idle Minimum * (Watt) | 2.6 | 3.2 -23% | 3.8 -46% | 5.1 -96% | 2.2 15% | 3.2 -23% |
| Idle Average * (Watt) | 5.7 | 5.5 4% | 8.9 -56% | 7 -23% | 5 12% | 6.8 -19% |
| Idle Maximum * (Watt) | 6 | 6.1 -2% | 11.9 -98% | 11.7 -95% | 8 -33% | 8 -33% |
| Load Average * (Watt) | 29.2 | 29.5 -1% | 47.5 -63% | 41.2 -41% | 33 -13% | 30.4 -4% |
| Load Maximum * (Watt) | 38.8 | 32 18% | 52.5 -35% | 56.9 -47% | 49.4 -27% | 28 28% |
* ... menor é melhor
| Dell Latitude 7390 2-in-1 i7-8650U, UHD Graphics 620, 60 Wh | Dell Latitude 13 7380 i7-7600U, HD Graphics 620, 60 Wh | Lenovo ThinkPad X1 Carbon 2018-20KGS03900 i5-8550U, UHD Graphics 620, 57 Wh | HP Elitebook 1040 G4-2XU40UT i7-7820HQ, HD Graphics 630, 67 Wh | Asus ZenBook 13 UX331UN i5-8550U, GeForce MX150, 50 Wh | Toshiba Portege A30-D-139 i3-7100U, HD Graphics 620, 45 Wh | |
|---|---|---|---|---|---|---|
| Duração da bateria | 9% | -14% | -5% | -12% | 11% | |
| WiFi v1.3 (h) | 9.2 | 10.5 14% | 8.7 -5% | 11.1 21% | 9 -2% | 9.1 -1% |
| Load (h) | 2.3 | 2.4 4% | 1.8 -22% | 1.6 -30% | 1.8 -22% | 2.8 22% |
Pro
Contra
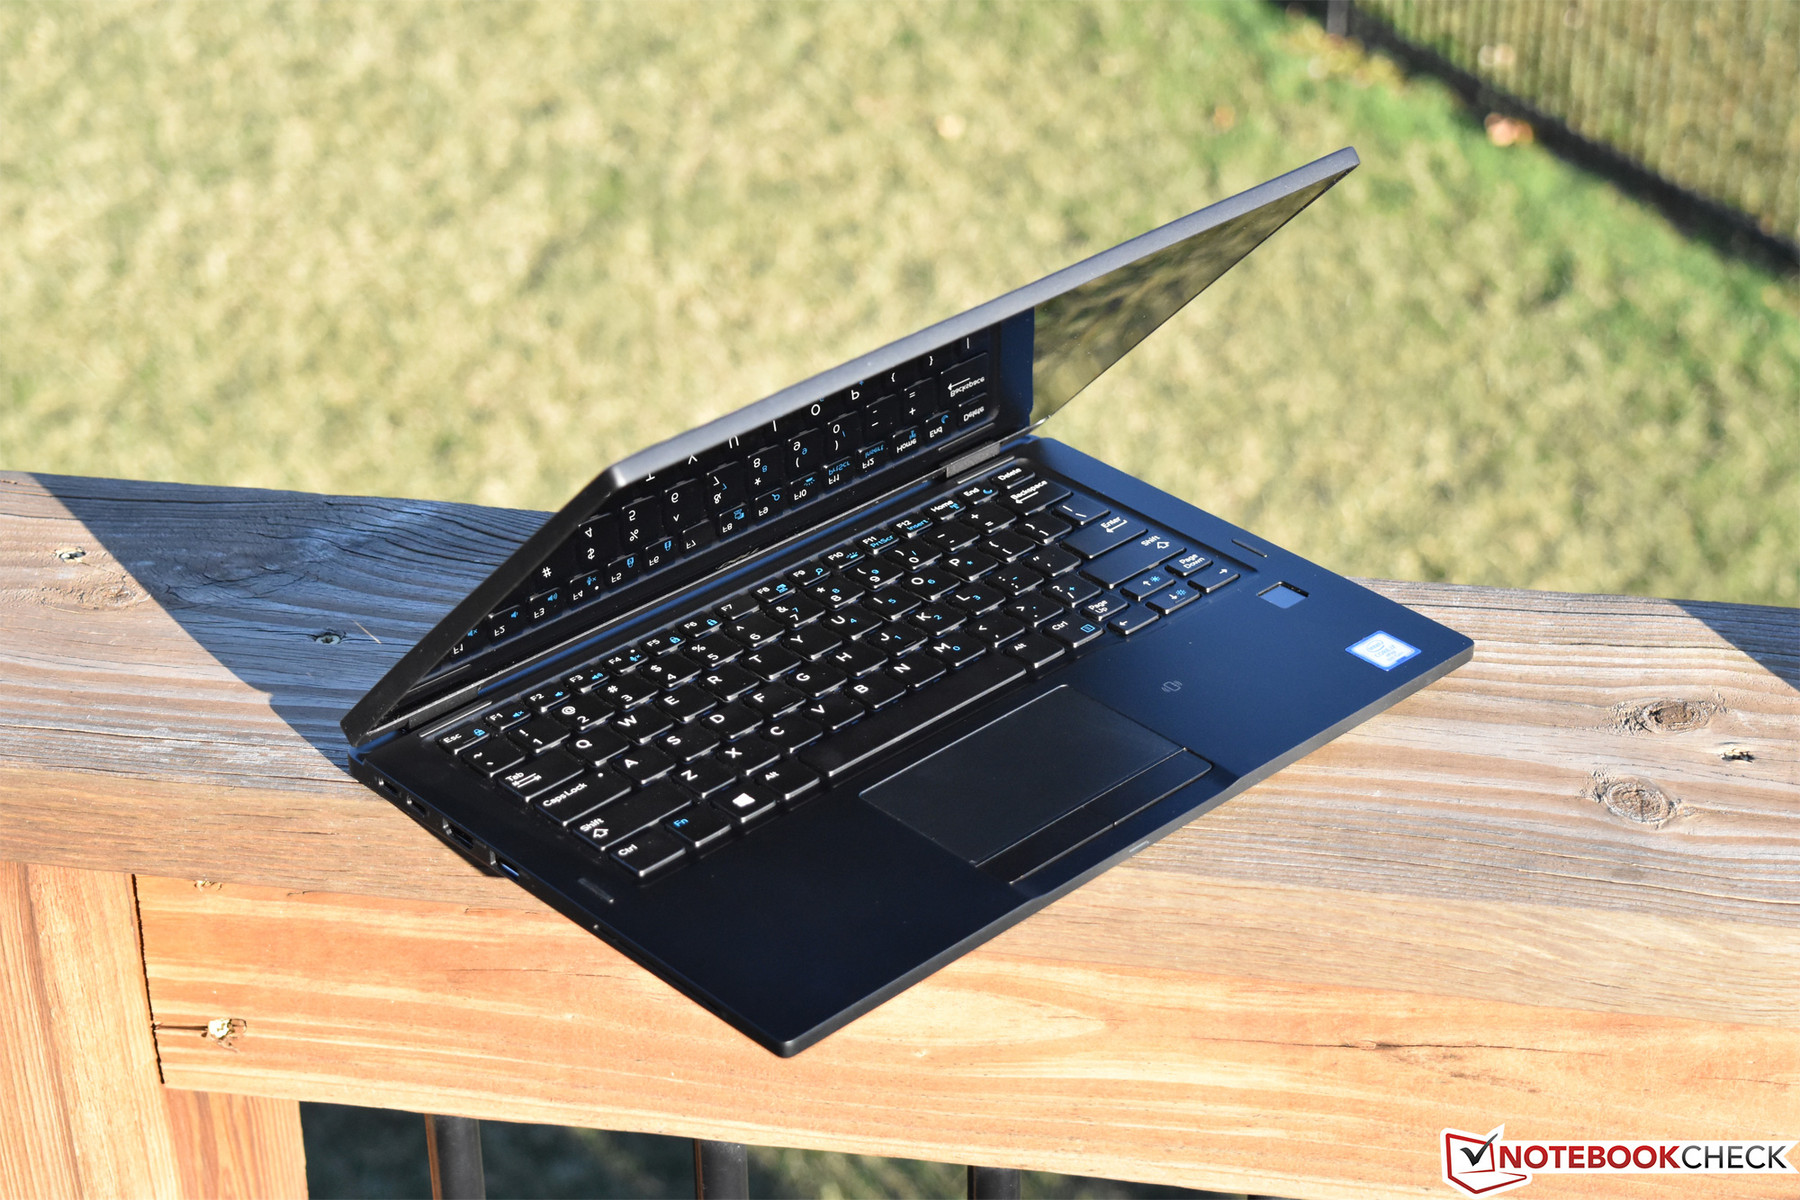
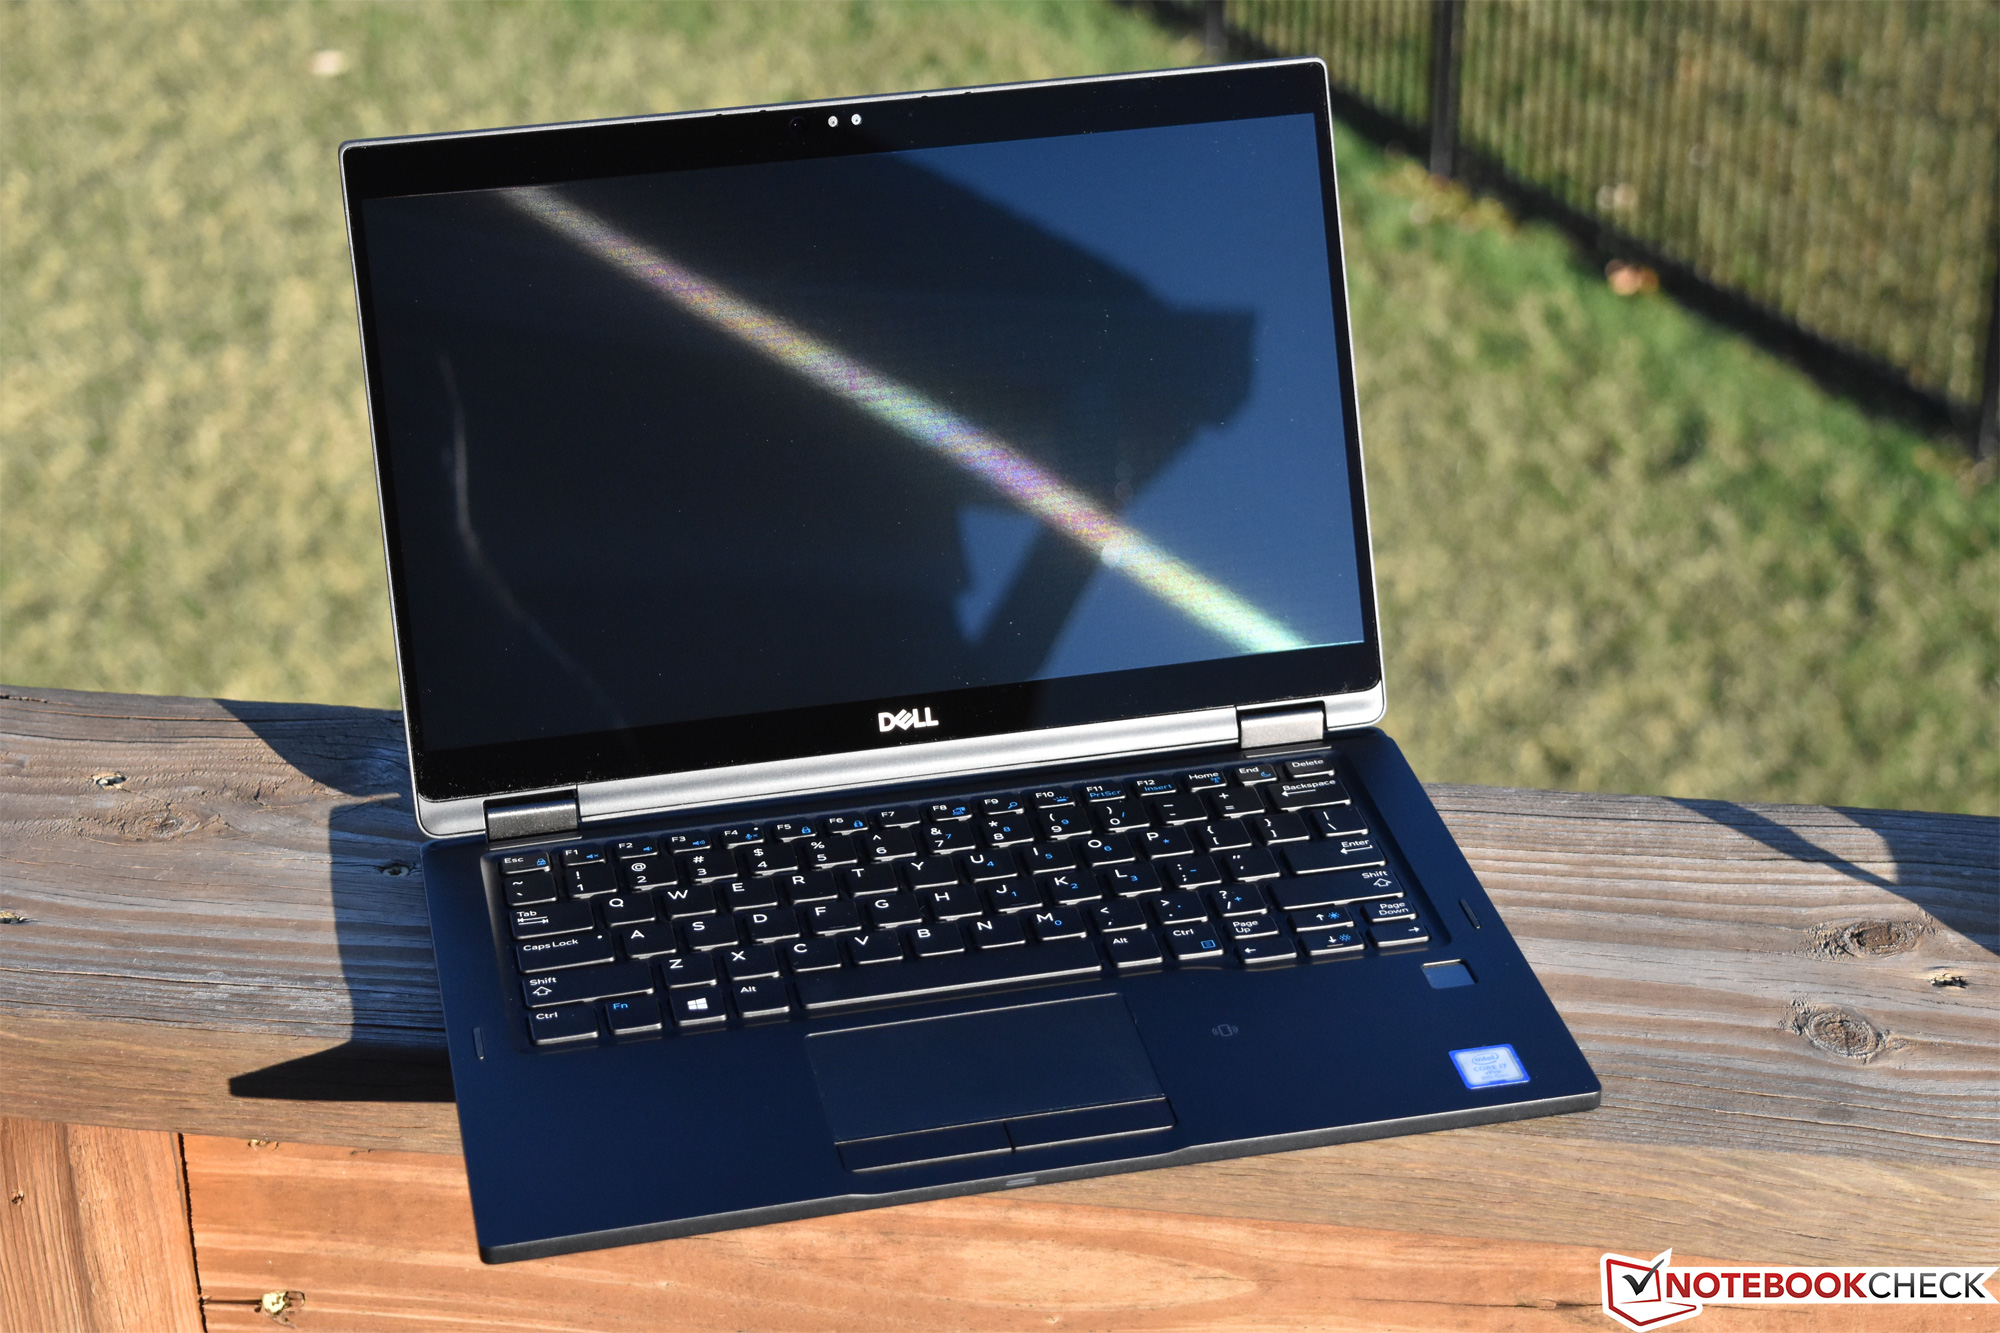
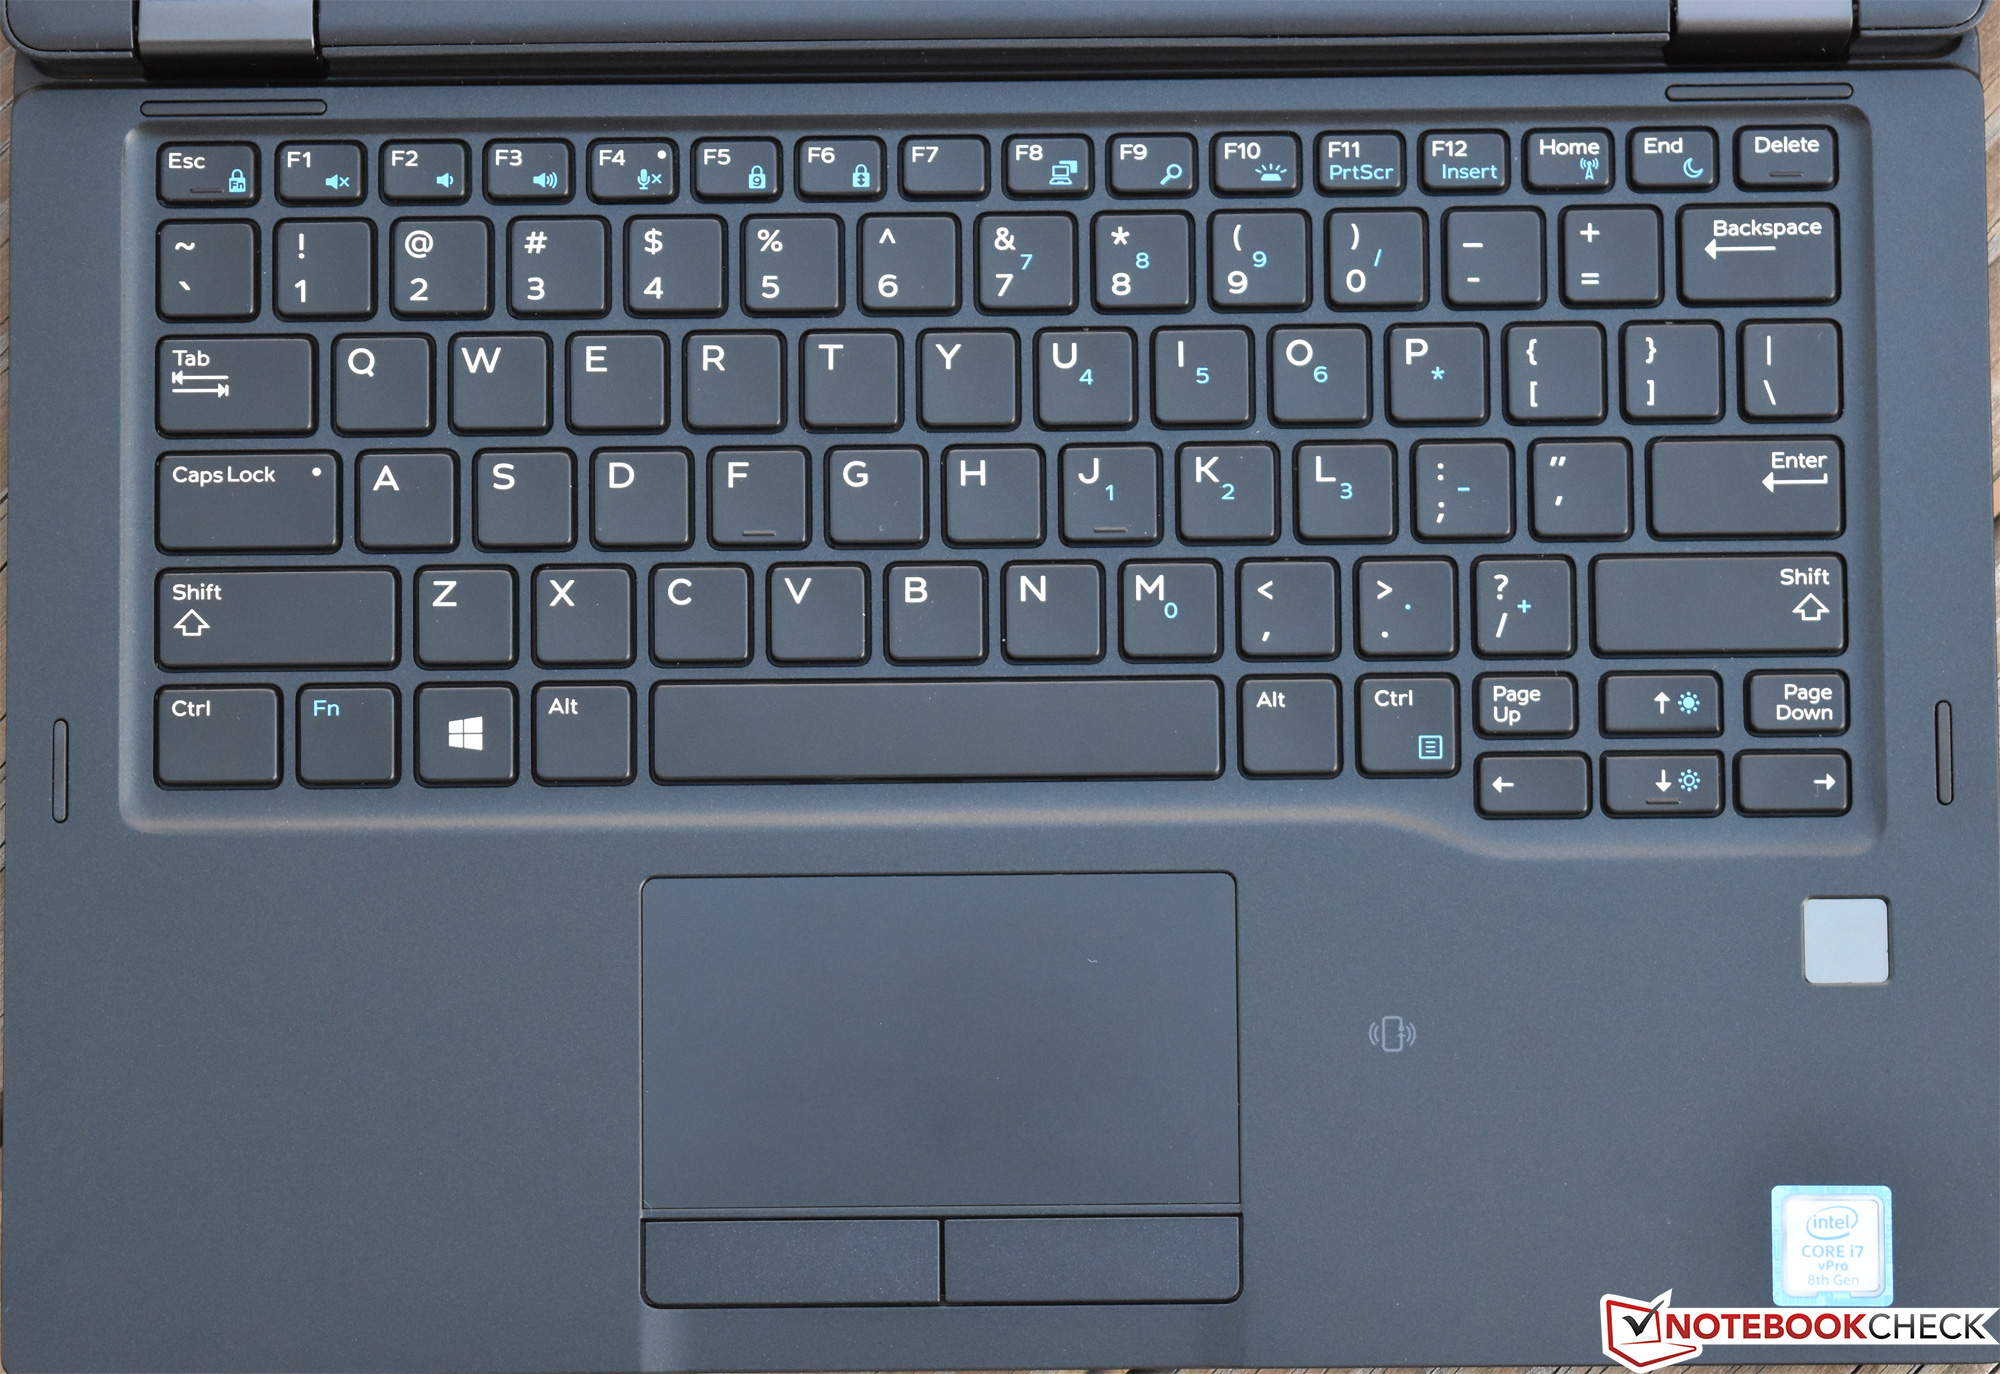
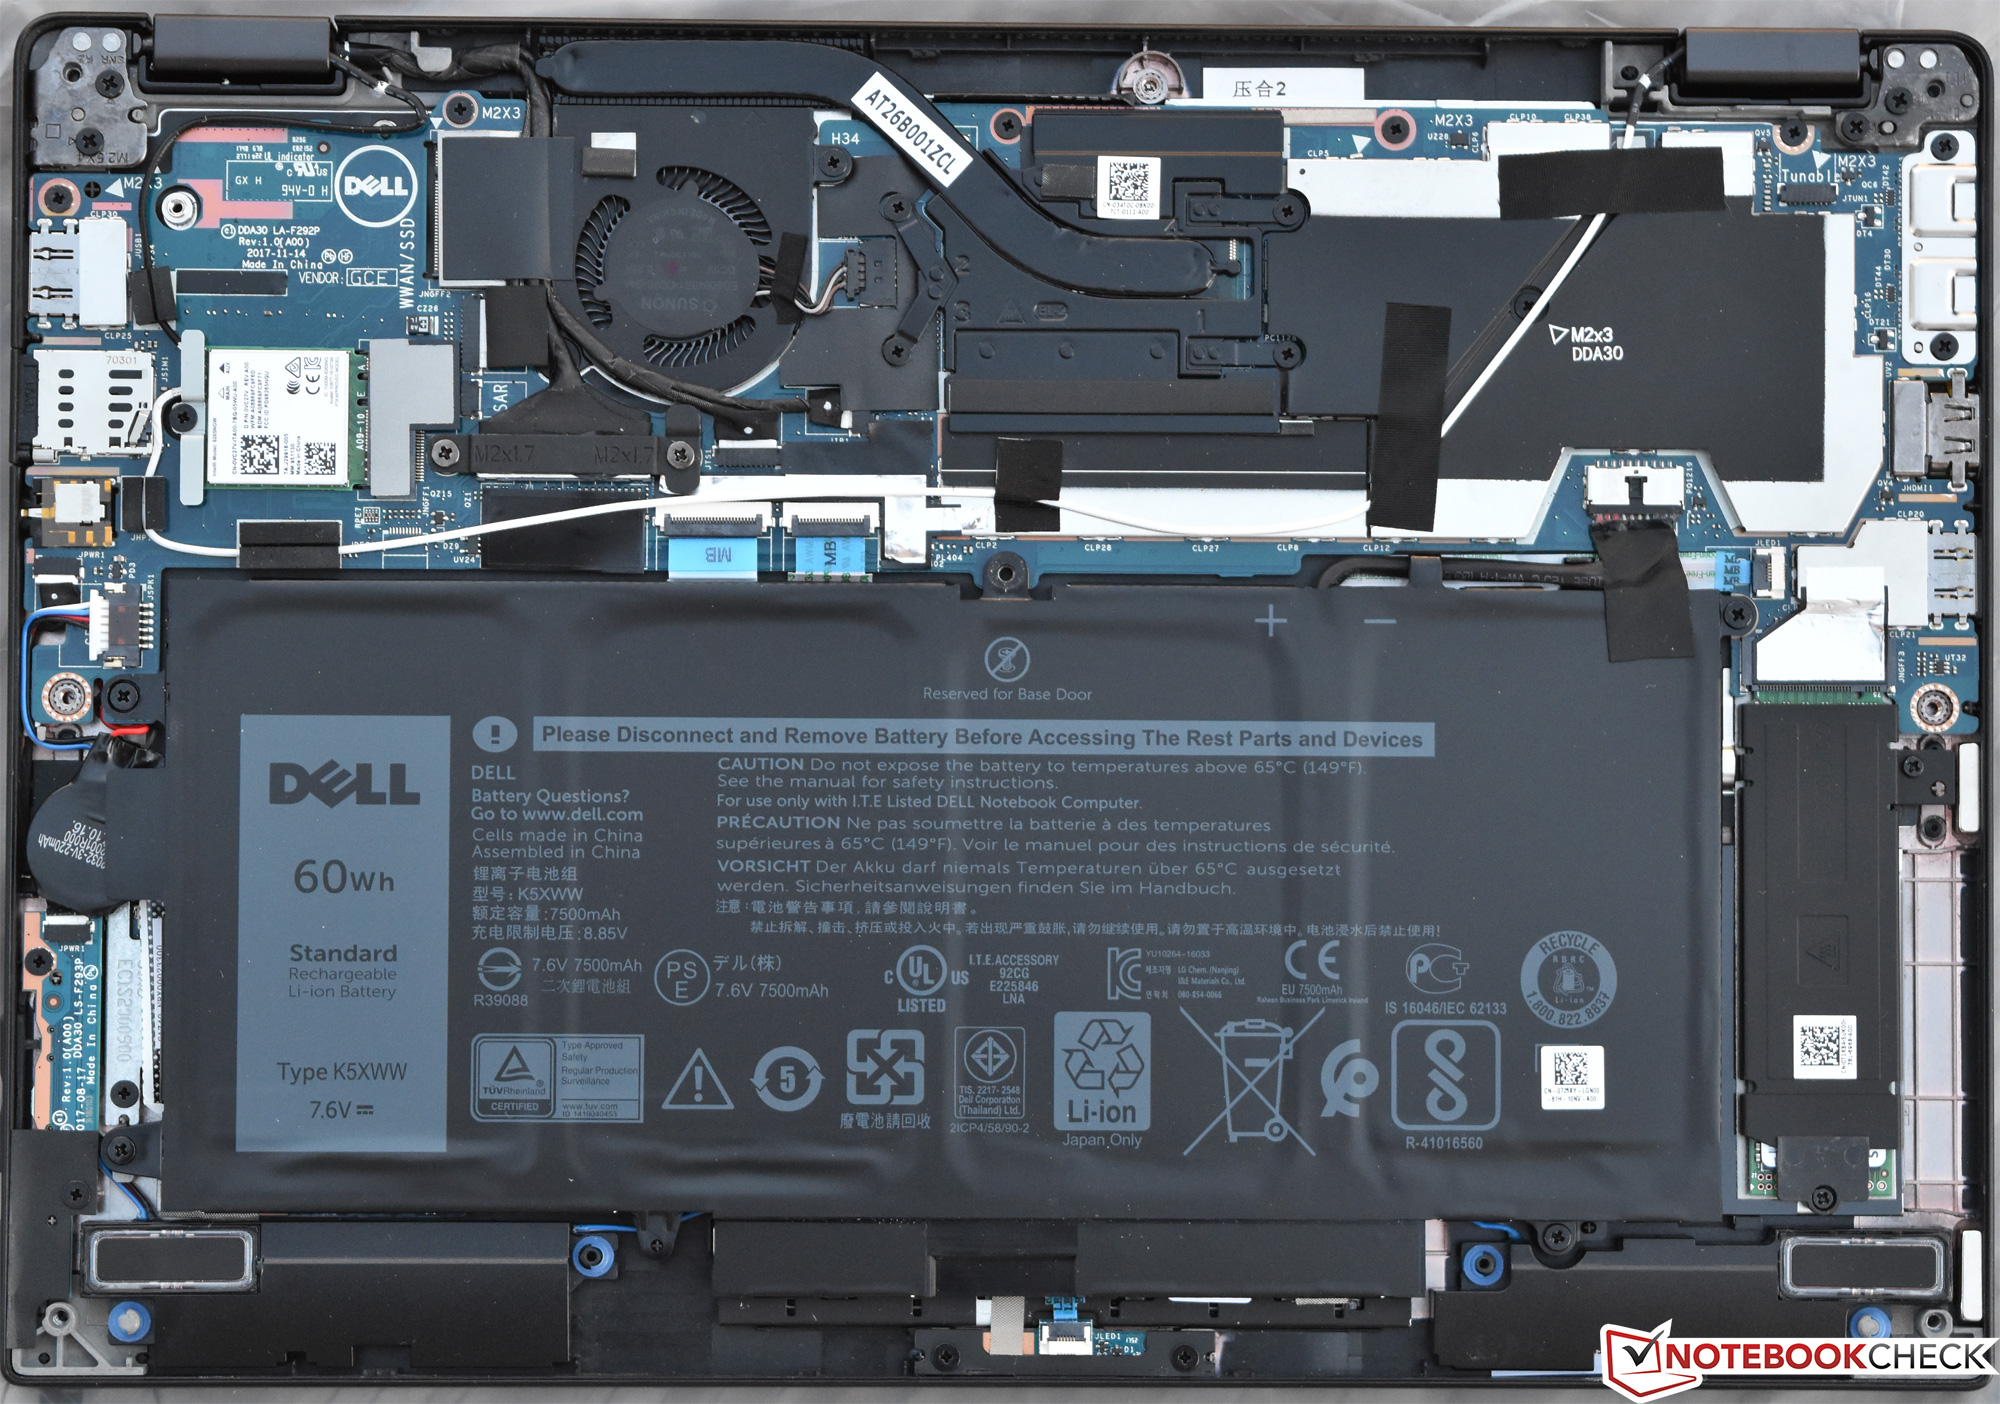
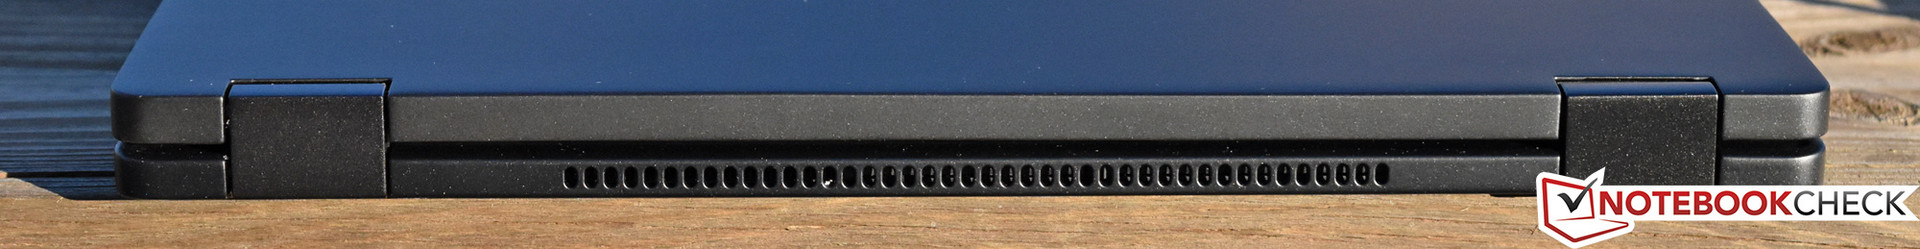
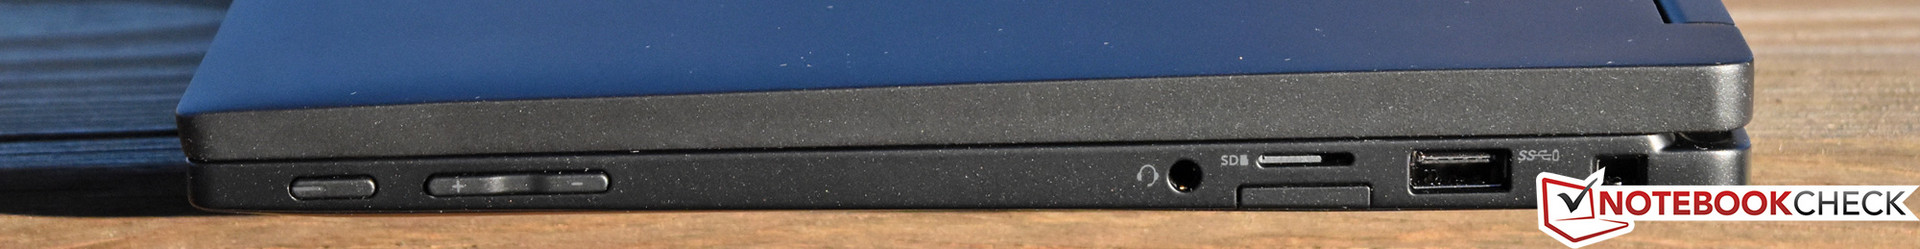
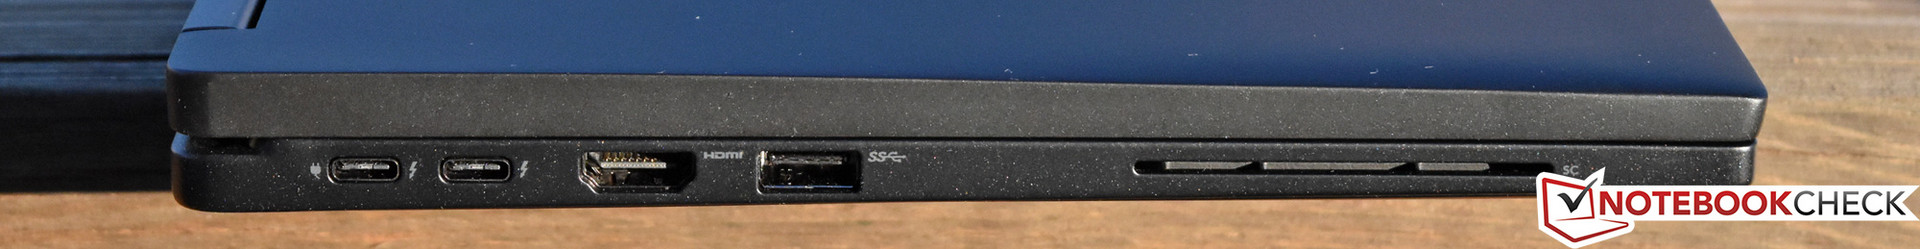
O Latitude 7390 2-em-1 é uma máquina robusta, atraente e bem construída, com dispositivos de entrada muito bons e desempenho geral rápido do sistema. Ele também possui ótimas opções de conectividade, fácil manutenção e um formato menor do que a média para sua classe. Particularmente impressionante é a opção de armazenamento duplo, possibilitada pelo slot WWAN vazio, que também pode acomodar um SSD M.2/NVMe 2230. No entanto, embora o desempenho da CPU ainda seja um pouco mais rápido do que as máquinas comparáveis da geração anterior, vemos pouca justificativa para a configuração do Core i7 que recebemos como uma unidade de teste. Em vez disso, a menos que os aplicativos single-threaded sejam os únicos itens da pauta, sugerimos que você use uma configuração mais econômica do Core i5.
O Latitude 7390 2-em-1 é uma máquina robusta, atraente e bem construída, com dispositivos de entrada muito bons e desempenho geral rápido do sistema. No entanto, ele tem sua parte de desvantagens e, certamente, não é um investimento pequeno. Por isso, antes de mergulhar, recomendamos que você pesquise a paisagem.
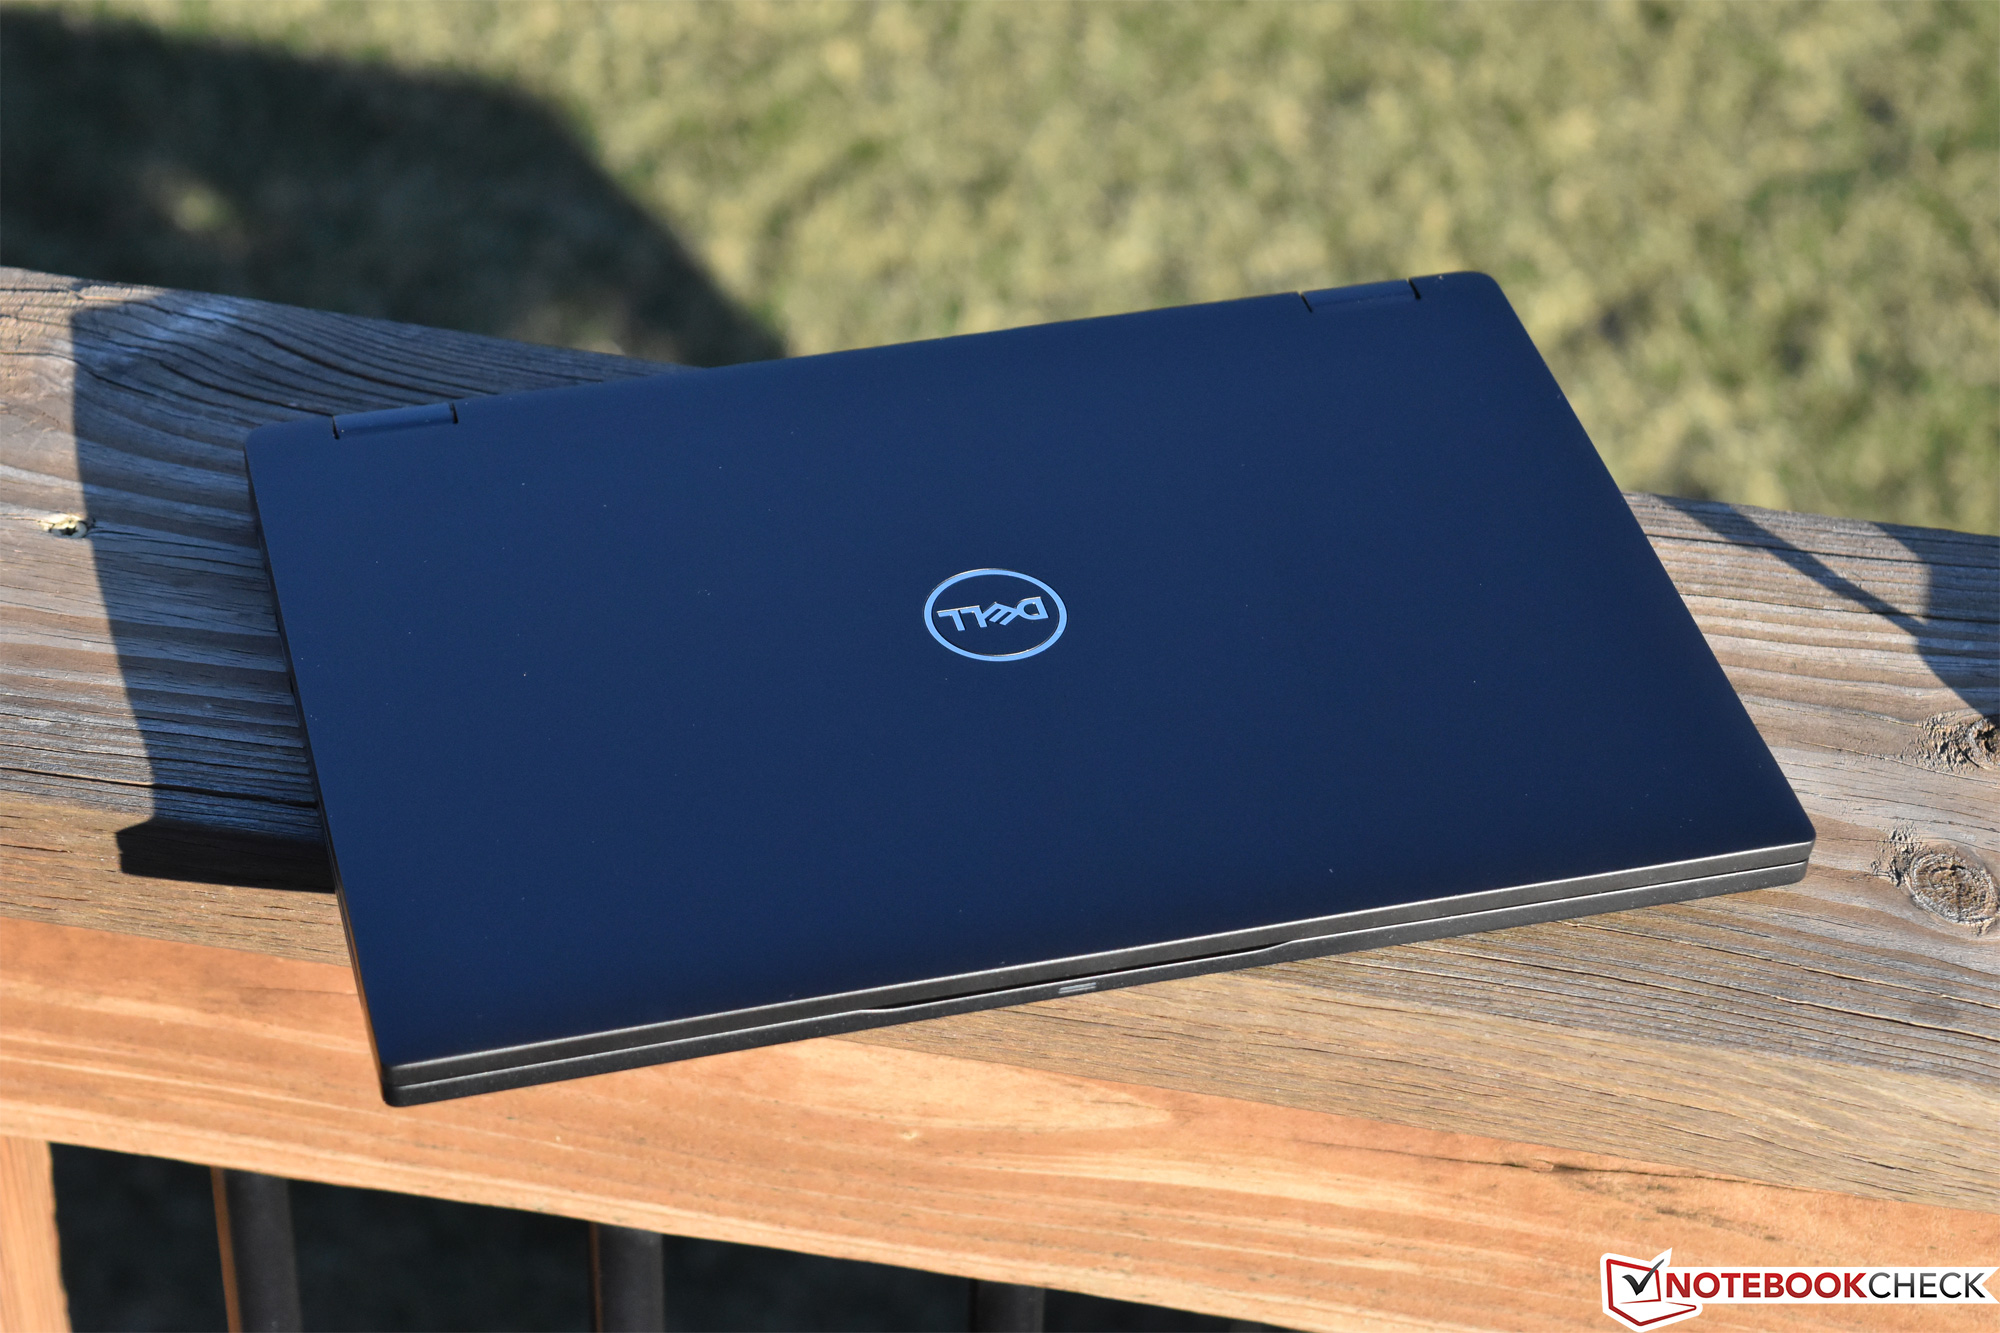
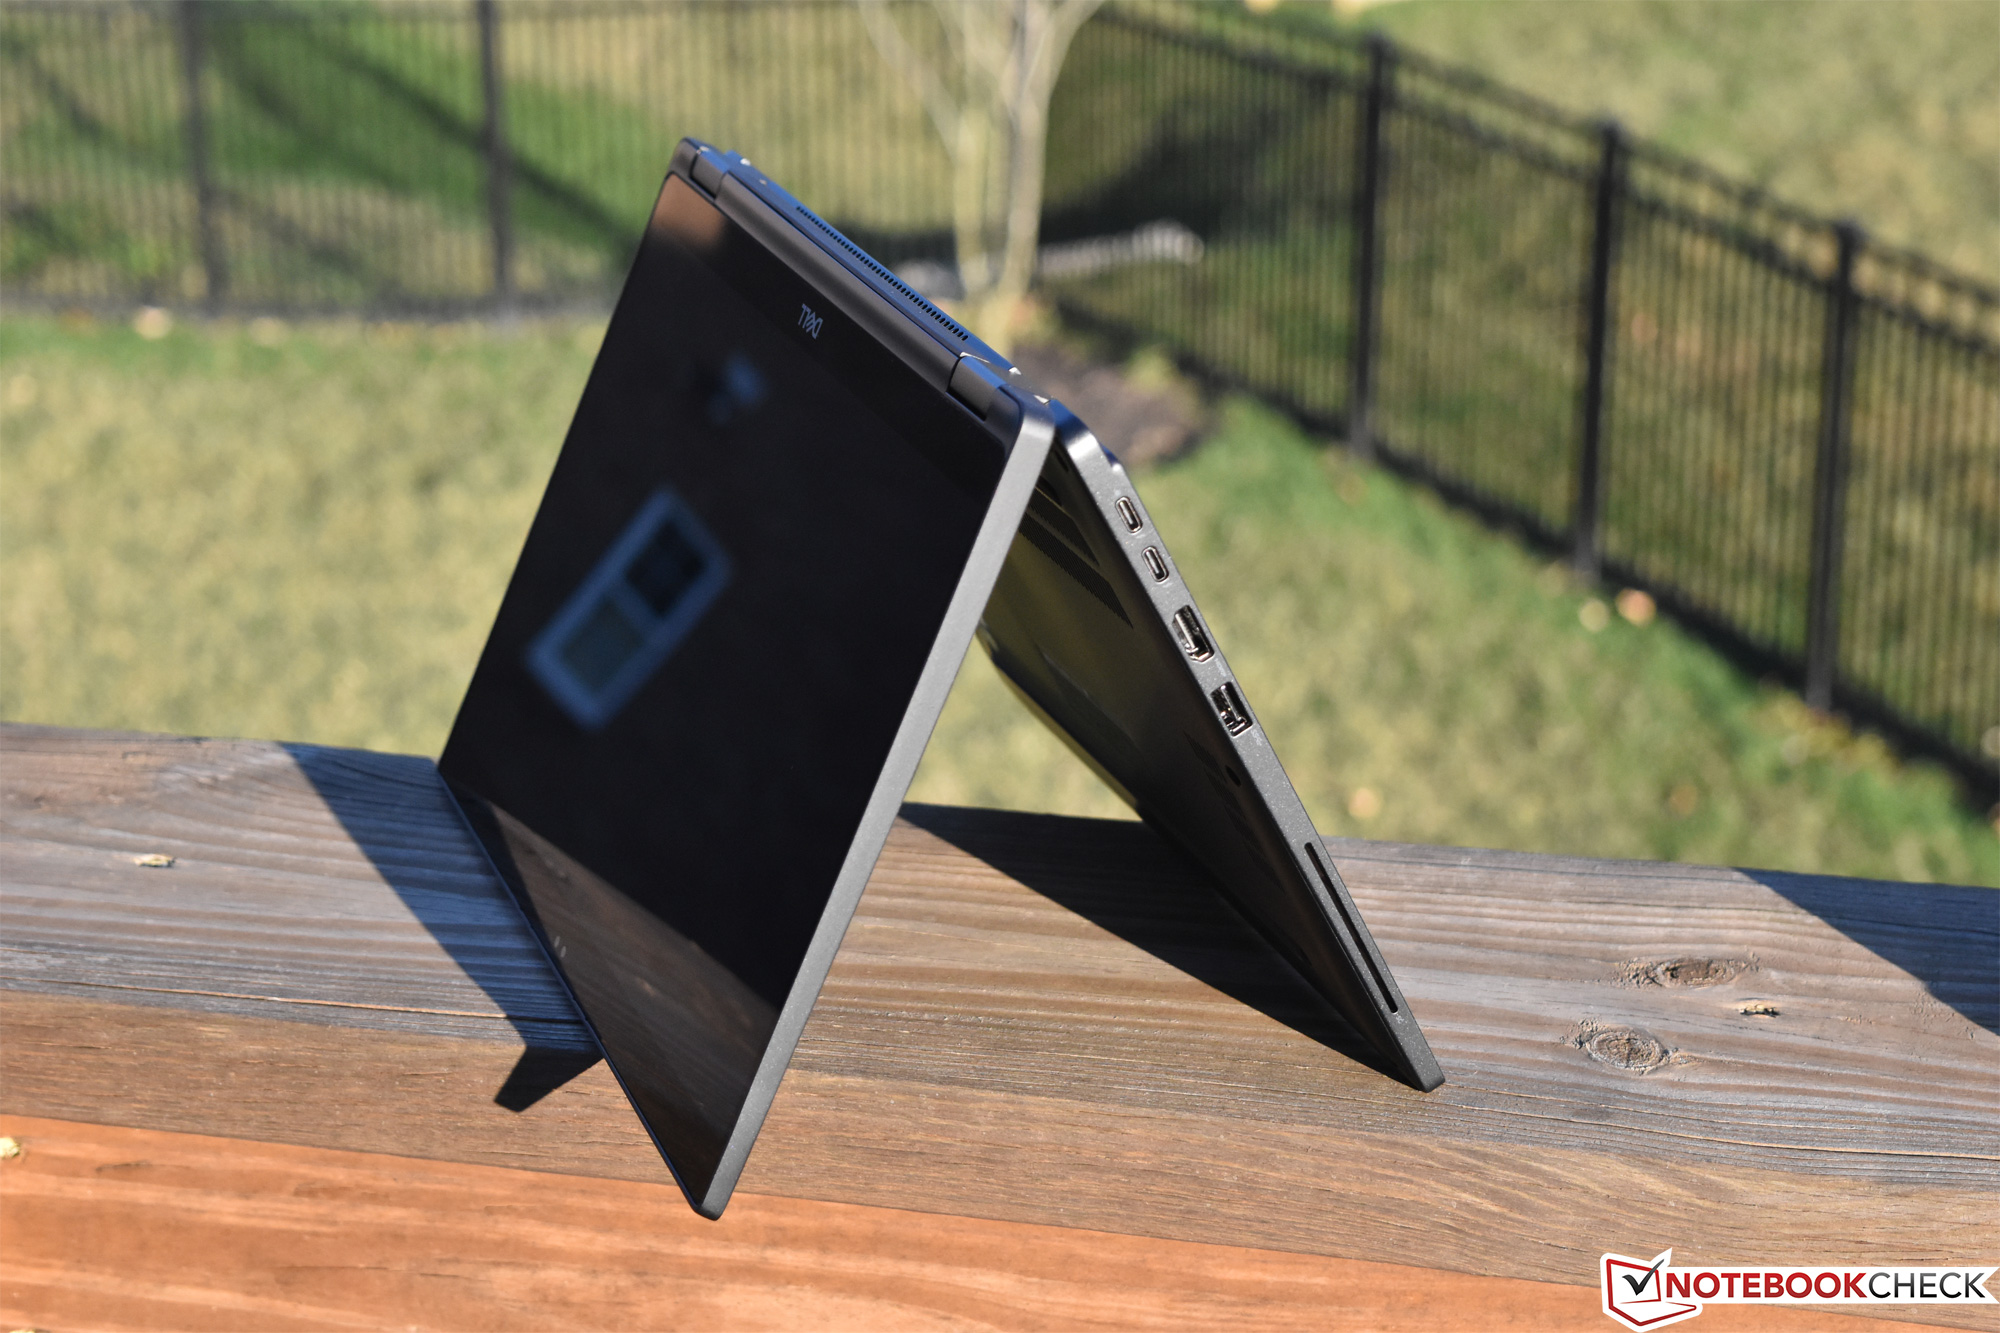
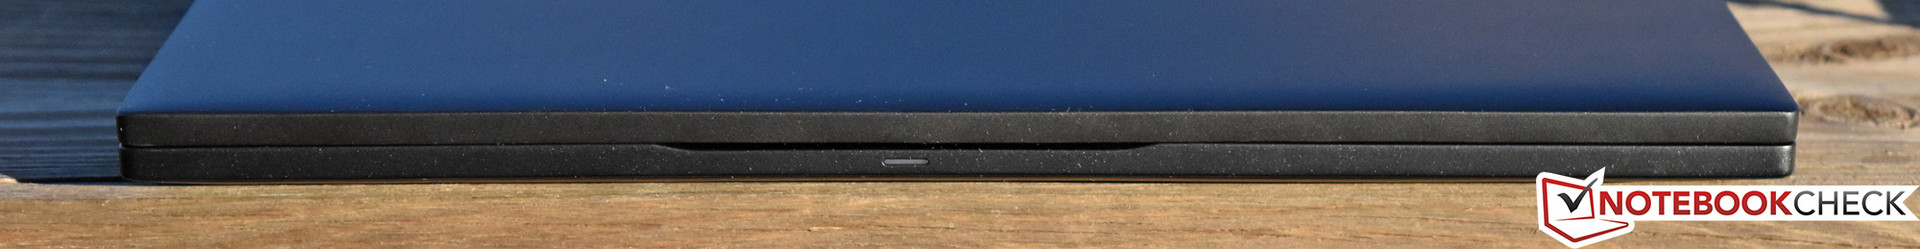
Em outros lugares, o 7390 2-em-1 também é atrapalhado por alguns outros pontos de interrogação. Apenas telas tácteis refletivas estão disponíveis para configuração e nenhuma delas é particularmente impressionante no âmbito da cobertura de cores - pelo menos, não em comparação com os líderes de categoria, como o ThinkPad X1 Carbon. O SSD NVMe que recebemos em nossa unidade dificilmente poderia acompanhar as unidades de primeira linha, como os da Samsung. A máquina é bastante pesada para seu tamanho e, graças à sua tampa de tela mais grossa e comparativamente mais pesada, ela não parece ser tão estável no colo como gostaríamos. E, por fim, há sempre a questão de saber se a maioria das pessoas na empresa realmente precisa da funcionalidade conversível fornecida por estes derivados do estilo Yoga. A Dell já tem uma oferta perfeitamente capaz e extremamente equilibrada no fantástico Latitude 7380 (e, embora ainda tenhamos que analisá-lo, presumimos que também o 7390) - e pode ser equipado com uma tela anti-refletiva, é mais leve e parece mais estável em qualquer superfície.
Outras máquinas que vale a pena considerar (além do convencional Latitude 7380/7390) são o excelente ThinkPad X1 Carbon 2018 e Asus Zenbook 13 UX331UA. Com um preço de $2.109 (conforme configurado) o 2-em-1 Latitude 7390, certamente, não é um investimento pequeno. Por isso, antes de mergulhar, recomendamos que você pesquise a paisagem.
Dell Latitude 7390 2-in-1
- 03/20/2018 v6 (old)
Steve Schardein
Price comparison
