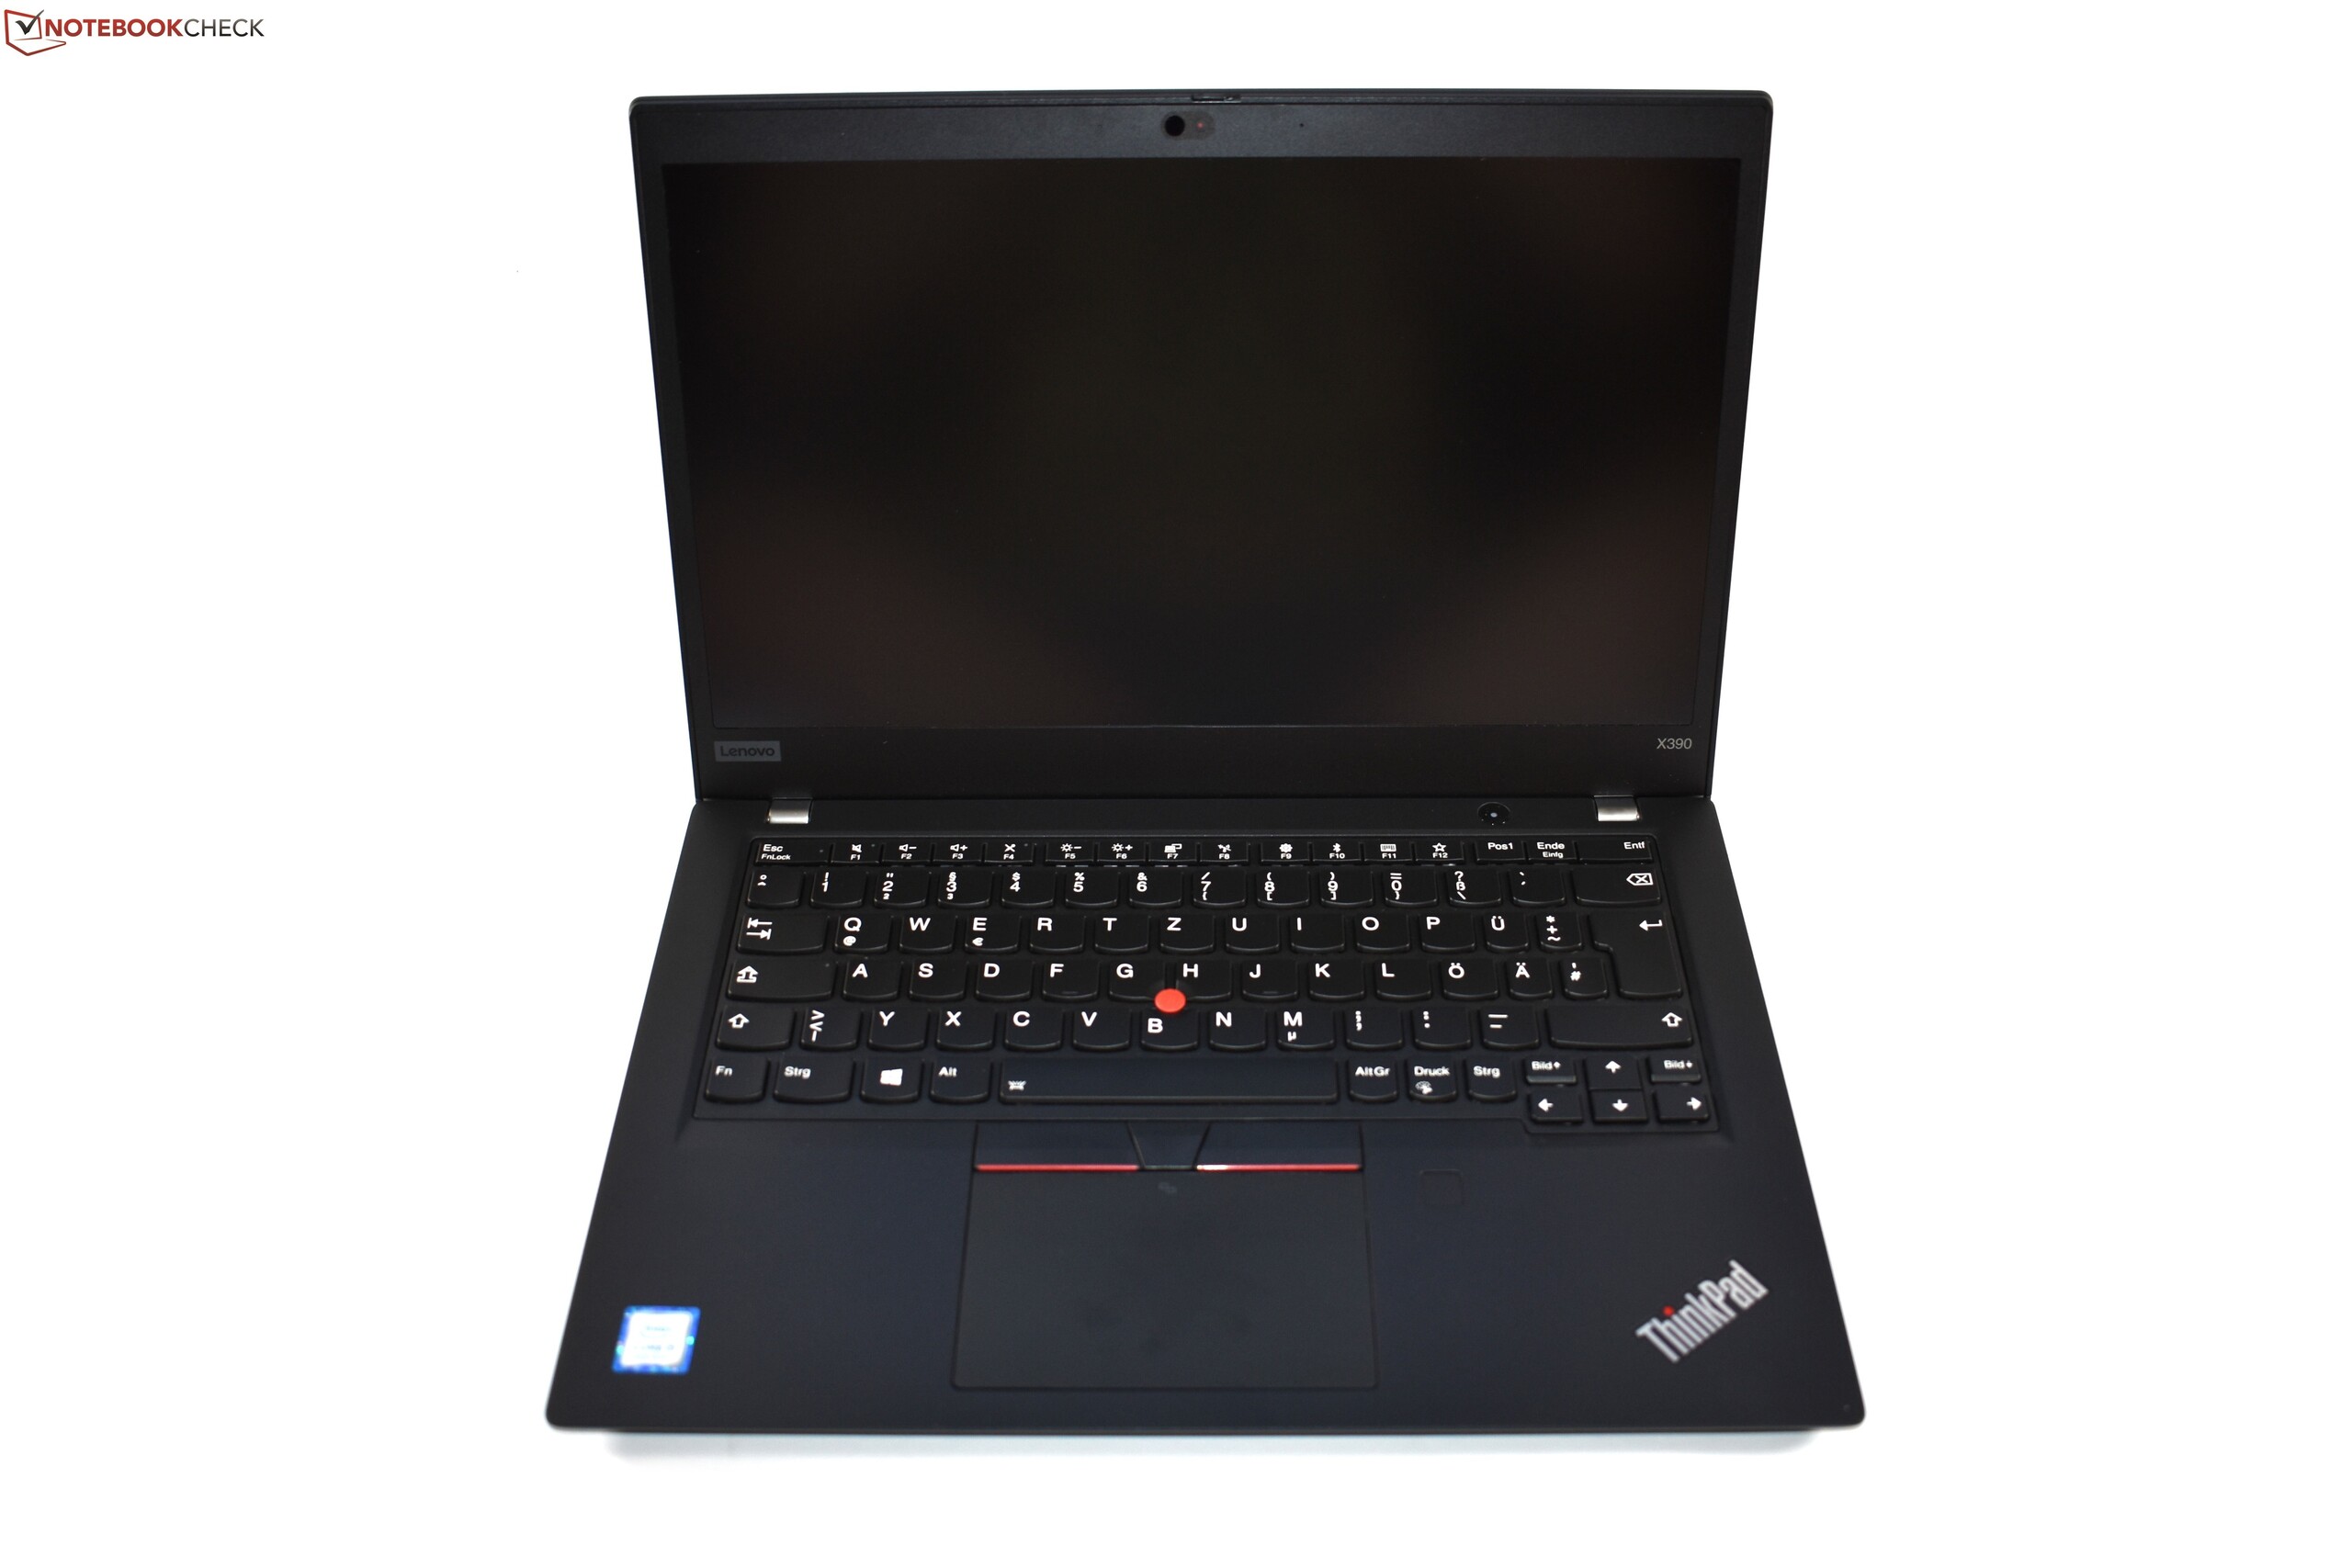
Breve Análise do Portátil Lenovo ThinkPad X13: pequeno, leve, e compatível com 4G
Avaliação | Data | Modelo | Peso | Altura | Size | Resolução | Preço |
|---|---|---|---|---|---|---|---|
| 88 % v7 (old) | 08/2020 | Lenovo ThinkPad X13-20T20033GE i5-10210U, UHD Graphics 620 | 1.3 kg | 16.9 mm | 13.30" | 1920x1080 | |
| 90.3 % v6 (old) | 05/2019 | Lenovo ThinkPad X390-20Q1S02M00 i5-8265U, UHD Graphics 620 | 1.3 kg | 16.9 mm | 13.30" | 1920x1080 | |
| 88.8 % v7 (old) | 03/2020 | Dell XPS 13 9300 i5 FHD i5-1035G1, UHD Graphics G1 (Ice Lake 32 EU) | 1.2 kg | 14.8 mm | 13.40" | 1920x1200 | |
| 85.1 % v7 (old) | Dynabook Portege X30L-G1331 i5-10210U, UHD Graphics 620 | 859 g | 17.9 mm | 13.30" | 1920x1080 | ||
| 87.4 % v7 (old) | 06/2020 | Huawei MateBook X Pro 2020 i7 i7-10510U, GeForce MX250 | 1.3 kg | 14.6 mm | 13.90" | 3000x2000 |
| SD Card Reader | |
| average JPG Copy Test (av. of 3 runs) | |
| Dell XPS 13 9300 i5 FHD (Toshiba Exceria Pro M501 64 GB UHS-II) | |
| Lenovo ThinkPad X390-20Q1S02M00 (Toshiba Exceria Pro M501) | |
| Dynabook Portege X30L-G1331 (Toshiba Exceria Pro M501 64 GB UHS-II) | |
| Média da turma Office (19.8 - 198.5, n=22, últimos 2 anos) | |
| Lenovo ThinkPad X13-20T20033GE (Toshiba Exceria Pro M501 64 GB UHS-II) | |
| maximum AS SSD Seq Read Test (1GB) | |
| Dell XPS 13 9300 i5 FHD (Toshiba Exceria Pro M501 64 GB UHS-II) | |
| Lenovo ThinkPad X390-20Q1S02M00 (Toshiba Exceria Pro M501) | |
| Dynabook Portege X30L-G1331 (Toshiba Exceria Pro M501 64 GB UHS-II) | |
| Média da turma Office (27.4 - 249, n=21, últimos 2 anos) | |
| Lenovo ThinkPad X13-20T20033GE (Toshiba Exceria Pro M501 64 GB UHS-II) | |
| Networking | |
| iperf3 transmit AX12 | |
| Dynabook Portege X30L-G1331 | |
| Huawei MateBook X Pro 2020 i7 | |
| Média Intel Wi-Fi 6 AX201 (49.8 - 1775, n=324) | |
| Dell XPS 13 9300 i5 FHD | |
| Lenovo ThinkPad X13-20T20033GE | |
| Lenovo ThinkPad X390-20Q1S02M00 | |
| iperf3 receive AX12 | |
| Lenovo ThinkPad X13-20T20033GE | |
| Dell XPS 13 9300 i5 FHD | |
| Huawei MateBook X Pro 2020 i7 | |
| Média Intel Wi-Fi 6 AX201 (136 - 1743, n=324) | |
| Dynabook Portege X30L-G1331 | |
| Lenovo ThinkPad X390-20Q1S02M00 | |


| |||||||||||||||||||||||||
iluminação: 90 %
iluminação com acumulador: 360 cd/m²
Contraste: 1710:1 (Preto: 0.21 cd/m²)
ΔE ColorChecker Calman: 6.7 | ∀{0.5-29.43 Ø4.72}
calibrated: 1.3
ΔE Greyscale Calman: 7.4 | ∀{0.09-98 Ø4.97}
95.9% sRGB (Argyll 1.6.3 3D)
61.7% AdobeRGB 1998 (Argyll 1.6.3 3D)
67.2% AdobeRGB 1998 (Argyll 3D)
96.2% sRGB (Argyll 3D)
66% Display P3 (Argyll 3D)
Gamma: 2.85
CCT: 6309 K
| Lenovo ThinkPad X13-20T20033GE Lenovo B133HAK01.1, IPS, 1920x1080, 13.3" | Lenovo ThinkPad X390-20Q1S02M00 LP133WF7-SPB1, IPS LED, 1920x1080, 13.3" | Dell XPS 13 9300 i5 FHD SHP14CB, IPS, 1920x1200, 13.4" | Dynabook Portege X30L-G1331 Toshiba TOS508F, IPS, 1920x1080, 13.3" | Huawei MateBook X Pro 2020 i7 JDI LPM139M422A, LTPS, 3000x2000, 13.9" | |
|---|---|---|---|---|---|
| Display | -1% | 7% | 1% | 2% | |
| Display P3 Coverage (%) | 66 | 65.3 -1% | 71.5 8% | 66.9 1% | 66.6 1% |
| sRGB Coverage (%) | 96.2 | 95.9 0% | 99.4 3% | 97.6 1% | 99.4 3% |
| AdobeRGB 1998 Coverage (%) | 67.2 | 66.6 -1% | 73.5 9% | 67.8 1% | 68.6 2% |
| Response Times | -13% | -14% | -13% | 1% | |
| Response Time Grey 50% / Grey 80% * (ms) | 52.8 ? | 57.6 ? -9% | 60 ? -14% | 54.8 ? -4% | 49.6 ? 6% |
| Response Time Black / White * (ms) | 29.2 ? | 34 ? -16% | 33.2 ? -14% | 35.6 ? -22% | 30.8 ? -5% |
| PWM Frequency (Hz) | 2500 ? | 23810 ? | 29070 ? | ||
| Screen | 18% | 21% | 16% | 30% | |
| Brightness middle (cd/m²) | 359 | 356 -1% | 619 72% | 482 34% | 557 55% |
| Brightness (cd/m²) | 342 | 336 -2% | 591 73% | 452 32% | 532 56% |
| Brightness Distribution (%) | 90 | 88 -2% | 91 1% | 91 1% | 87 -3% |
| Black Level * (cd/m²) | 0.21 | 0.16 24% | 0.35 -67% | 0.4 -90% | 0.33 -57% |
| Contrast (:1) | 1710 | 2225 30% | 1769 3% | 1205 -30% | 1688 -1% |
| Colorchecker dE 2000 * | 6.7 | 3.6 46% | 3 55% | 1.85 72% | 1.4 79% |
| Colorchecker dE 2000 max. * | 10.9 | 5.5 50% | 8.2 25% | 3.08 72% | 2.5 77% |
| Colorchecker dE 2000 calibrated * | 1.3 | 1.1 15% | 1 23% | 1.2 8% | 0.7 46% |
| Greyscale dE 2000 * | 7.4 | 4.7 36% | 5.2 30% | 2 73% | 2 73% |
| Gamma | 2.85 77% | 2.48 89% | 2.14 103% | 2.1 105% | 2.14 103% |
| CCT | 6309 103% | 6374 102% | 6340 103% | 6822 95% | 6689 97% |
| Color Space (Percent of AdobeRGB 1998) (%) | 61.7 | 61.3 -1% | 66.9 8% | 62.5 1% | 62.5 1% |
| Color Space (Percent of sRGB) (%) | 95.9 | 95.7 0% | 99.3 4% | 97.7 2% | 99.5 4% |
| Média Total (Programa/Configurações) | 1% /
11% | 5% /
14% | 1% /
10% | 11% /
21% |
* ... menor é melhor
Exibir tempos de resposta
| ↔ Tempo de resposta preto para branco | ||
|---|---|---|
| 29.2 ms ... ascensão ↗ e queda ↘ combinadas | ↗ 16.8 ms ascensão | 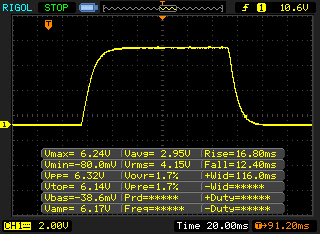 |
| ↘ 12.4 ms queda | ||
| A tela mostra taxas de resposta relativamente lentas em nossos testes e pode ser muito lenta para os jogadores. Em comparação, todos os dispositivos testados variam de 0.1 (mínimo) a 240 (máximo) ms. » 78 % de todos os dispositivos são melhores. Isso significa que o tempo de resposta medido é pior que a média de todos os dispositivos testados (19.8 ms). | ||
| ↔ Tempo de resposta 50% cinza a 80% cinza | ||
| 52.8 ms ... ascensão ↗ e queda ↘ combinadas | ↗ 26 ms ascensão | 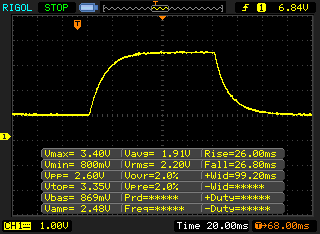 |
| ↘ 26.8 ms queda | ||
| A tela mostra taxas de resposta lentas em nossos testes e será insatisfatória para os jogadores. Em comparação, todos os dispositivos testados variam de 0.165 (mínimo) a 636 (máximo) ms. » 89 % de todos os dispositivos são melhores. Isso significa que o tempo de resposta medido é pior que a média de todos os dispositivos testados (31 ms). | ||
Cintilação da tela / PWM (modulação por largura de pulso)
| Tela tremeluzindo / PWM não detectado | 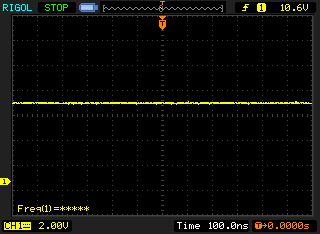 | ||
[pwm_comparison] Em comparação: 52 % de todos os dispositivos testados não usam PWM para escurecer a tela. Se PWM foi detectado, uma média de 7778 (mínimo: 5 - máximo: 343500) Hz foi medida. | |||
Cinebench R15: CPU Single 64Bit | CPU Multi 64Bit
Blender: v2.79 BMW27 CPU
7-Zip 18.03: 7z b 4 -mmt1 | 7z b 4
Geekbench 5.5: Single-Core | Multi-Core
HWBOT x265 Benchmark v2.2: 4k Preset
LibreOffice : 20 Documents To PDF
R Benchmark 2.5: Overall mean
| Cinebench R20 / CPU (Single Core) | |
| Média da turma Office (345 - 816, n=73, últimos 2 anos) | |
| Dell XPS 13 9300 i5 FHD | |
| Dynabook Portege X30L-G1331 | |
| Média Intel Core i5-10210U (322 - 428, n=30) | |
| Huawei MateBook X Pro 2020 i7 | |
| Lenovo ThinkPad X13-20T20033GE | |
| Cinebench R20 / CPU (Multi Core) | |
| Média da turma Office (648 - 8840, n=73, últimos 2 anos) | |
| Dell XPS 13 9300 i5 FHD | |
| Lenovo ThinkPad X13-20T20033GE | |
| Média Intel Core i5-10210U (722 - 1820, n=30) | |
| Dynabook Portege X30L-G1331 | |
| Huawei MateBook X Pro 2020 i7 | |
| Cinebench R15 / CPU Single 64Bit | |
| Média da turma Office (99.5 - 312, n=75, últimos 2 anos) | |
| Huawei MateBook X Pro 2020 i7 | |
| Lenovo ThinkPad X13-20T20033GE | |
| Dell XPS 13 9300 i5 FHD | |
| Dynabook Portege X30L-G1331 | |
| Média Intel Core i5-10210U (134 - 174, n=35) | |
| Lenovo ThinkPad X390-20Q1S02M00 | |
| Cinebench R15 / CPU Multi 64Bit | |
| Média da turma Office (250 - 3380, n=75, últimos 2 anos) | |
| Lenovo ThinkPad X13-20T20033GE | |
| Lenovo ThinkPad X390-20Q1S02M00 | |
| Dell XPS 13 9300 i5 FHD | |
| Dell XPS 13 9300 i5 FHD | |
| Média Intel Core i5-10210U (320 - 790, n=35) | |
| Huawei MateBook X Pro 2020 i7 | |
| Dynabook Portege X30L-G1331 | |
| Blender / v2.79 BMW27 CPU | |
| Huawei MateBook X Pro 2020 i7 | |
| Dynabook Portege X30L-G1331 | |
| Média Intel Core i5-10210U (585 - 1339, n=24) | |
| Dell XPS 13 9300 i5 FHD | |
| Lenovo ThinkPad X13-20T20033GE | |
| Média da turma Office (158 - 1940, n=74, últimos 2 anos) | |
| 7-Zip 18.03 / 7z b 4 -mmt1 | |
| Média da turma Office (3387 - 6469, n=75, últimos 2 anos) | |
| Huawei MateBook X Pro 2020 i7 | |
| Dynabook Portege X30L-G1331 | |
| Lenovo ThinkPad X13-20T20033GE | |
| Média Intel Core i5-10210U (3504 - 4467, n=24) | |
| Dell XPS 13 9300 i5 FHD | |
| 7-Zip 18.03 / 7z b 4 | |
| Média da turma Office (7098 - 76886, n=75, últimos 2 anos) | |
| Dell XPS 13 9300 i5 FHD | |
| Lenovo ThinkPad X13-20T20033GE | |
| Média Intel Core i5-10210U (10920 - 21679, n=24) | |
| Huawei MateBook X Pro 2020 i7 | |
| Dynabook Portege X30L-G1331 | |
| Geekbench 5.5 / Single-Core | |
| Média da turma Office (811 - 2128, n=71, últimos 2 anos) | |
| Dell XPS 13 9300 i5 FHD | |
| Dynabook Portege X30L-G1331 | |
| Lenovo ThinkPad X13-20T20033GE | |
| Média Intel Core i5-10210U (949 - 1133, n=27) | |
| Huawei MateBook X Pro 2020 i7 | |
| Geekbench 5.5 / Multi-Core | |
| Média da turma Office (1483 - 16999, n=71, últimos 2 anos) | |
| Dell XPS 13 9300 i5 FHD | |
| Lenovo ThinkPad X13-20T20033GE | |
| Dynabook Portege X30L-G1331 | |
| Média Intel Core i5-10210U (2079 - 4256, n=27) | |
| Huawei MateBook X Pro 2020 i7 | |
| HWBOT x265 Benchmark v2.2 / 4k Preset | |
| Média da turma Office (2.21 - 26, n=74, últimos 2 anos) | |
| Lenovo ThinkPad X13-20T20033GE | |
| Média Intel Core i5-10210U (2.36 - 6.28, n=24) | |
| Dell XPS 13 9300 i5 FHD | |
| Dynabook Portege X30L-G1331 | |
| Huawei MateBook X Pro 2020 i7 | |
| LibreOffice / 20 Documents To PDF | |
| Média Intel Core i5-10210U (49.6 - 80.3, n=18) | |
| Dynabook Portege X30L-G1331 | |
| Média da turma Office (39.9 - 102.3, n=74, últimos 2 anos) | |
| Huawei MateBook X Pro 2020 i7 | |
| Lenovo ThinkPad X13-20T20033GE | |
| R Benchmark 2.5 / Overall mean | |
| Média Intel Core i5-10210U (0.658 - 0.901, n=24) | |
| Dell XPS 13 9300 i5 FHD | |
| Lenovo ThinkPad X13-20T20033GE | |
| Dynabook Portege X30L-G1331 | |
| Huawei MateBook X Pro 2020 i7 | |
| Média da turma Office (0.4098 - 0.888, n=74, últimos 2 anos) | |
* ... menor é melhor
| PCMark 8 | |
| Home Score Accelerated v2 | |
| Média da turma Office (n=1últimos 2 anos) | |
| Dell XPS 13 9300 i5 FHD | |
| Huawei MateBook X Pro 2020 i7 | |
| Lenovo ThinkPad X13-20T20033GE | |
| Dynabook Portege X30L-G1331 | |
| Lenovo ThinkPad X390-20Q1S02M00 | |
| Média Intel Core i5-10210U, Intel UHD Graphics 620 (3182 - 4284, n=21) | |
| Work Score Accelerated v2 | |
| Média da turma Office (n=1últimos 2 anos) | |
| Lenovo ThinkPad X13-20T20033GE | |
| Dynabook Portege X30L-G1331 | |
| Lenovo ThinkPad X390-20Q1S02M00 | |
| Média Intel Core i5-10210U, Intel UHD Graphics 620 (4286 - 5114, n=21) | |
| Dell XPS 13 9300 i5 FHD | |
| Huawei MateBook X Pro 2020 i7 | |
| PCMark 8 Home Score Accelerated v2 | 3789 pontos | |
| PCMark 8 Work Score Accelerated v2 | 5114 pontos | |
| PCMark 10 Score | 4184 pontos | |
Ajuda | ||
| DPC Latencies / LatencyMon - interrupt to process latency (max), Web, Youtube, Prime95 | |
| Dynabook Portege X30L-G1331 | |
| Dell XPS 13 9300 i5 FHD | |
| Lenovo ThinkPad X13-20T20033GE | |
* ... menor é melhor
| Lenovo ThinkPad X13-20T20033GE Samsung SSD PM981a MZVLB512HBJQ | Lenovo ThinkPad X390-20Q1S02M00 Intel SSD Pro 7600p SSDPEKKF512G8L | Dell XPS 13 9300 i5 FHD Toshiba XG6 KXG60ZNV512G | Dynabook Portege X30L-G1331 Samsung SSD PM981a MZVLB512HBJQ | Huawei MateBook X Pro 2020 i7 Samsung PM981a MZVLB1T0HBLR | Média Samsung SSD PM981a MZVLB512HBJQ | |
|---|---|---|---|---|---|---|
| CrystalDiskMark 5.2 / 6 | -12% | -8% | 3% | 7% | 5% | |
| Write 4K (MB/s) | 131.1 | 120.7 -8% | 121.9 -7% | 164.1 25% | 165.6 26% | 140.8 ? 7% |
| Read 4K (MB/s) | 45.48 | 58.5 29% | 50 10% | 49.34 8% | 50.2 10% | 48.6 ? 7% |
| Write Seq (MB/s) | 2042 | 1491 -27% | 1497 -27% | 1777 -13% | 1905 -7% | 2106 ? 3% |
| Read Seq (MB/s) | 2259 | 2760 22% | 2111 -7% | 1752 -22% | 1669 -26% | 2099 ? -7% |
| Write 4K Q32T1 (MB/s) | 429.1 | 237.5 -45% | 365.9 -15% | 401.1 -7% | 474.6 11% | 451 ? 5% |
| Read 4K Q32T1 (MB/s) | 370.7 | 336.1 -9% | 384.6 4% | 498.7 35% | 508 37% | 482 ? 30% |
| Write Seq Q32T1 (MB/s) | 2963 | 1512 -49% | 2748 -7% | 2988 1% | 3007 1% | 2903 ? -2% |
| Read Seq Q32T1 (MB/s) | 3564 | 3154 -12% | 3119 -12% | 3544 -1% | 3556 0% | 3511 ? -1% |
| Write 4K Q8T8 (MB/s) | 1065 | 914 ? | ||||
| Read 4K Q8T8 (MB/s) | 891 | 1017 ? | ||||
| AS SSD | -2% | -20% | 1% | 26% | 2% | |
| Seq Read (MB/s) | 2714 | 2689 -1% | 2328 -14% | 2067 -24% | 2737 1% | 2412 ? -11% |
| Seq Write (MB/s) | 1374 | 1462 6% | 1137 -17% | 2444 78% | 2530 84% | 1983 ? 44% |
| 4K Read (MB/s) | 51.2 | 63.8 25% | 48.07 -6% | 55.8 9% | 54 5% | 53.1 ? 4% |
| 4K Write (MB/s) | 135.7 | 139.8 3% | 120.6 -11% | 124.6 -8% | 152.5 12% | 131.1 ? -3% |
| 4K-64 Read (MB/s) | 962 | 865 -10% | 899 -7% | 1601 66% | 2011 109% | 1201 ? 25% |
| 4K-64 Write (MB/s) | 1420 | 1041 -27% | 1220 -14% | 1696 19% | 1260 -11% | 1726 ? 22% |
| Access Time Read * (ms) | 0.043 | 0.037 14% | 0.085 -98% | 0.048 -12% | 0.066 -53% | 0.05525 ? -28% |
| Access Time Write * (ms) | 0.028 | 0.024 14% | 0.033 -18% | 0.091 -225% | 0.024 14% | 0.05394 ? -93% |
| Score Read (Points) | 1284 | 1198 -7% | 1180 -8% | 1864 45% | 2339 82% | 1495 ? 16% |
| Score Write (Points) | 1693 | 1328 -22% | 1455 -14% | 2065 22% | 1666 -2% | 2055 ? 21% |
| Score Total (Points) | 3579 | 3095 -14% | 3189 -11% | 4908 37% | 5191 45% | 4303 ? 20% |
| Média Total (Programa/Configurações) | -7% /
-6% | -14% /
-15% | 2% /
2% | 17% /
18% | 4% /
3% |
* ... menor é melhor

Continuous reading performance: DiskSpd Read Loop, Queue Depth 8
| 3DMark 11 - 1280x720 Performance GPU | |
| Média da turma Office (2551 - 18313, n=69, últimos 2 anos) | |
| Huawei MateBook X Pro 2020 i7 | |
| Dell XPS 13 9300 i5 FHD | |
| Lenovo ThinkPad X13-20T20033GE | |
| Lenovo ThinkPad X390-20Q1S02M00 | |
| Dynabook Portege X30L-G1331 | |
| Média Intel UHD Graphics 620 (1144 - 3432, n=244) | |
| 3DMark | |
| 1920x1080 Fire Strike Graphics | |
| Média da turma Office (736 - 21871, n=73, últimos 2 anos) | |
| Huawei MateBook X Pro 2020 i7 | |
| Dell XPS 13 9300 i5 FHD | |
| Lenovo ThinkPad X13-20T20033GE | |
| Dynabook Portege X30L-G1331 | |
| Lenovo ThinkPad X390-20Q1S02M00 | |
| Média Intel UHD Graphics 620 (557 - 2608, n=213) | |
| 2560x1440 Time Spy Graphics | |
| Média da turma Office (493 - 6679, n=68, últimos 2 anos) | |
| Huawei MateBook X Pro 2020 i7 | |
| Dell XPS 13 9300 i5 FHD | |
| Lenovo ThinkPad X13-20T20033GE | |
| Dynabook Portege X30L-G1331 | |
| Média Intel UHD Graphics 620 (299 - 797, n=88) | |
| 3DMark 11 Performance | 2117 pontos | |
| 3DMark Fire Strike Score | 1210 pontos | |
| 3DMark Time Spy Score | 483 pontos | |
Ajuda | ||
| baixo | média | alto | ultra | |
|---|---|---|---|---|
| The Witcher 3 (2015) | 17.9 | |||
| Dota 2 Reborn (2015) | 83.7 | 51.4 | 22.6 | 19.9 |
| Final Fantasy XV Benchmark (2018) | 11.49 | |||
| X-Plane 11.11 (2018) | 13.2 | 15.9 | 14.4 | |
| Far Cry 5 (2018) | 16 |
Barulho
| Ocioso |
| 29.3 / 29.3 / 29.3 dB |
| Carga |
| 30.7 / 34 dB |
 | ||
30 dB silencioso 40 dB(A) audível 50 dB(A) ruidosamente alto |
||
min: | ||
(-) A temperatura máxima no lado superior é 48.4 °C / 119 F, em comparação com a média de 34.3 °C / 94 F , variando de 21.2 a 62.5 °C para a classe Office.
(±) A parte inferior aquece até um máximo de 43.8 °C / 111 F, em comparação com a média de 36.8 °C / 98 F
(+) Em uso inativo, a temperatura média para o lado superior é 24.4 °C / 76 F, em comparação com a média do dispositivo de 29.5 °C / ### class_avg_f### F.
(+) Os apoios para as mãos e o touchpad estão atingindo a temperatura máxima da pele (35.9 °C / 96.6 F) e, portanto, não estão quentes.
(-) A temperatura média da área do apoio para as mãos de dispositivos semelhantes foi 27.5 °C / 81.5 F (-8.4 °C / -15.1 F).
Lenovo ThinkPad X13-20T20033GE análise de áudio
(±) | o volume do alto-falante é médio, mas bom (###valor### dB)
Graves 100 - 315Hz
(-) | quase nenhum baixo - em média 17.9% menor que a mediana
(±) | a linearidade dos graves é média (13.2% delta para a frequência anterior)
Médios 400 - 2.000 Hz
(+) | médios equilibrados - apenas 4.6% longe da mediana
(+) | médios são lineares (4.4% delta para frequência anterior)
Altos 2 - 16 kHz
(+) | agudos equilibrados - apenas 2.6% longe da mediana
(±) | a linearidade dos máximos é média (7% delta para frequência anterior)
Geral 100 - 16.000 Hz
(±) | a linearidade do som geral é média (23.8% diferença em relação à mediana)
Comparado com a mesma classe
» 68% de todos os dispositivos testados nesta classe foram melhores, 8% semelhantes, 24% piores
» O melhor teve um delta de 7%, a média foi 21%, o pior foi 53%
Comparado com todos os dispositivos testados
» 71% de todos os dispositivos testados foram melhores, 6% semelhantes, 22% piores
» O melhor teve um delta de 4%, a média foi 24%, o pior foi 134%
| desligado | |
| Ocioso | |
| Carga |
|
Key:
min: | |
| Lenovo ThinkPad X13-20T20033GE i5-10210U, UHD Graphics 620, Samsung SSD PM981a MZVLB512HBJQ, IPS, 1920x1080, 13.3" | Lenovo ThinkPad X390-20Q1S02M00 i5-8265U, UHD Graphics 620, Intel SSD Pro 7600p SSDPEKKF512G8L, IPS LED, 1920x1080, 13.3" | Dell XPS 13 9300 i5 FHD i5-1035G1, UHD Graphics G1 (Ice Lake 32 EU), Toshiba XG6 KXG60ZNV512G, IPS, 1920x1200, 13.4" | Dynabook Portege X30L-G1331 i5-10210U, UHD Graphics 620, Samsung SSD PM981a MZVLB512HBJQ, IPS, 1920x1080, 13.3" | Huawei MateBook X Pro 2020 i7 i7-10510U, GeForce MX250, Samsung PM981a MZVLB1T0HBLR, LTPS, 3000x2000, 13.9" | Média Intel UHD Graphics 620 | Média da turma Office | |
|---|---|---|---|---|---|---|---|
| Power Consumption | -13% | -8% | 6% | -43% | -9% | -26% | |
| Idle Minimum * (Watt) | 2.9 | 3.4 -17% | 3.4 -17% | 2.8 3% | 4.3 -48% | 3.81 ? -31% | 4.41 ? -52% |
| Idle Average * (Watt) | 5.6 | 5.6 -0% | 6 -7% | 4.9 12% | 8.5 -52% | 6.94 ? -24% | 7.37 ? -32% |
| Idle Maximum * (Watt) | 8.9 | 8.7 2% | 10.2 -15% | 9 -1% | 12 -35% | 8.75 ? 2% | 8.58 ? 4% |
| Load Average * (Watt) | 30.1 | 43.6 -45% | 36.6 -22% | 31.2 -4% | 54.8 -82% | 35 ? -16% | 43 ? -43% |
| Load Maximum * (Watt) | 61.3 | 65 -6% | 49.3 20% | 49.4 19% | 61.5 -0% | 47.5 ? 23% | 64.6 ? -5% |
| Witcher 3 ultra * (Watt) | 47.1 |
* ... menor é melhor
| Lenovo ThinkPad X13-20T20033GE i5-10210U, UHD Graphics 620, 48 Wh | Lenovo ThinkPad X390-20Q1S02M00 i5-8265U, UHD Graphics 620, 48 Wh | Dell XPS 13 9300 i5 FHD i5-1035G1, UHD Graphics G1 (Ice Lake 32 EU), 52 Wh | Dynabook Portege X30L-G1331 i5-10210U, UHD Graphics 620, 42 Wh | Huawei MateBook X Pro 2020 i7 i7-10510U, GeForce MX250, 57.4 Wh | Média da turma Office | |
|---|---|---|---|---|---|---|
| Duração da bateria | -14% | 25% | -11% | 1% | 11% | |
| H.264 (h) | 11.7 | 12.7 9% | 14.4 23% | 11.9 2% | 15 ? 28% | |
| WiFi v1.3 (h) | 9.3 | 8.3 -11% | 11.7 26% | 8.3 -11% | 10.4 12% | 12.9 ? 39% |
| Load (h) | 2.7 | 1.6 -41% | 3.4 26% | 2.4 -11% | 1.794 ? -34% |
Pro
Contra
Veredicto - Pontos fortes conhecidos em um design conhecido

O Lenovo ThinkPad X13 mostrou seus pontos fortes em nosso teste: uma carcaça de alta qualidade combinada com bons dispositivos de entrada e uma bateria decente. Com sua tela de 13,3 polegadas, o pequeno portátil é adequado para usuários ativos. No entanto, o ThinkPad X390, o predecessor do X13, já nos mostrou esses pontos fortes - portanto, essas não são vantagens do novo portátil. Elas estão em outro lugar.
O Lenovo ThinkPad X13 com um processador Intel Core i5 é mais eficiente em termos de energia do que seu predecessor, mas oferece apenas um pouco mais de desempenho.
O X13 tem melhor duração da bateria graças à sua CPU mais eficiente em termos de energia. A nova CPU oferece bom desempenho durante o uso diário, mas cai rapidamente para o nível do Intel Core i5-8265U no ThinkPad X390 quando está sob uso intenso constante. O desempenho do sistema do novo portátil é um pouco maior em geral, mas os usuários não devem esperar um aumento de desempenho de mais de 10%. Como resultado, não recomendamos proprietários do ThinkPad X390 mudem para o X13, e se você não precisa maximizar a vida da bateria e o desempenho do sistema, você pode economizar algum dinheiro comprando apenas o modelo anterior.
Lenovo ThinkPad X13-20T20033GE
- 08/13/2020 v7 (old)
Mike Wobker