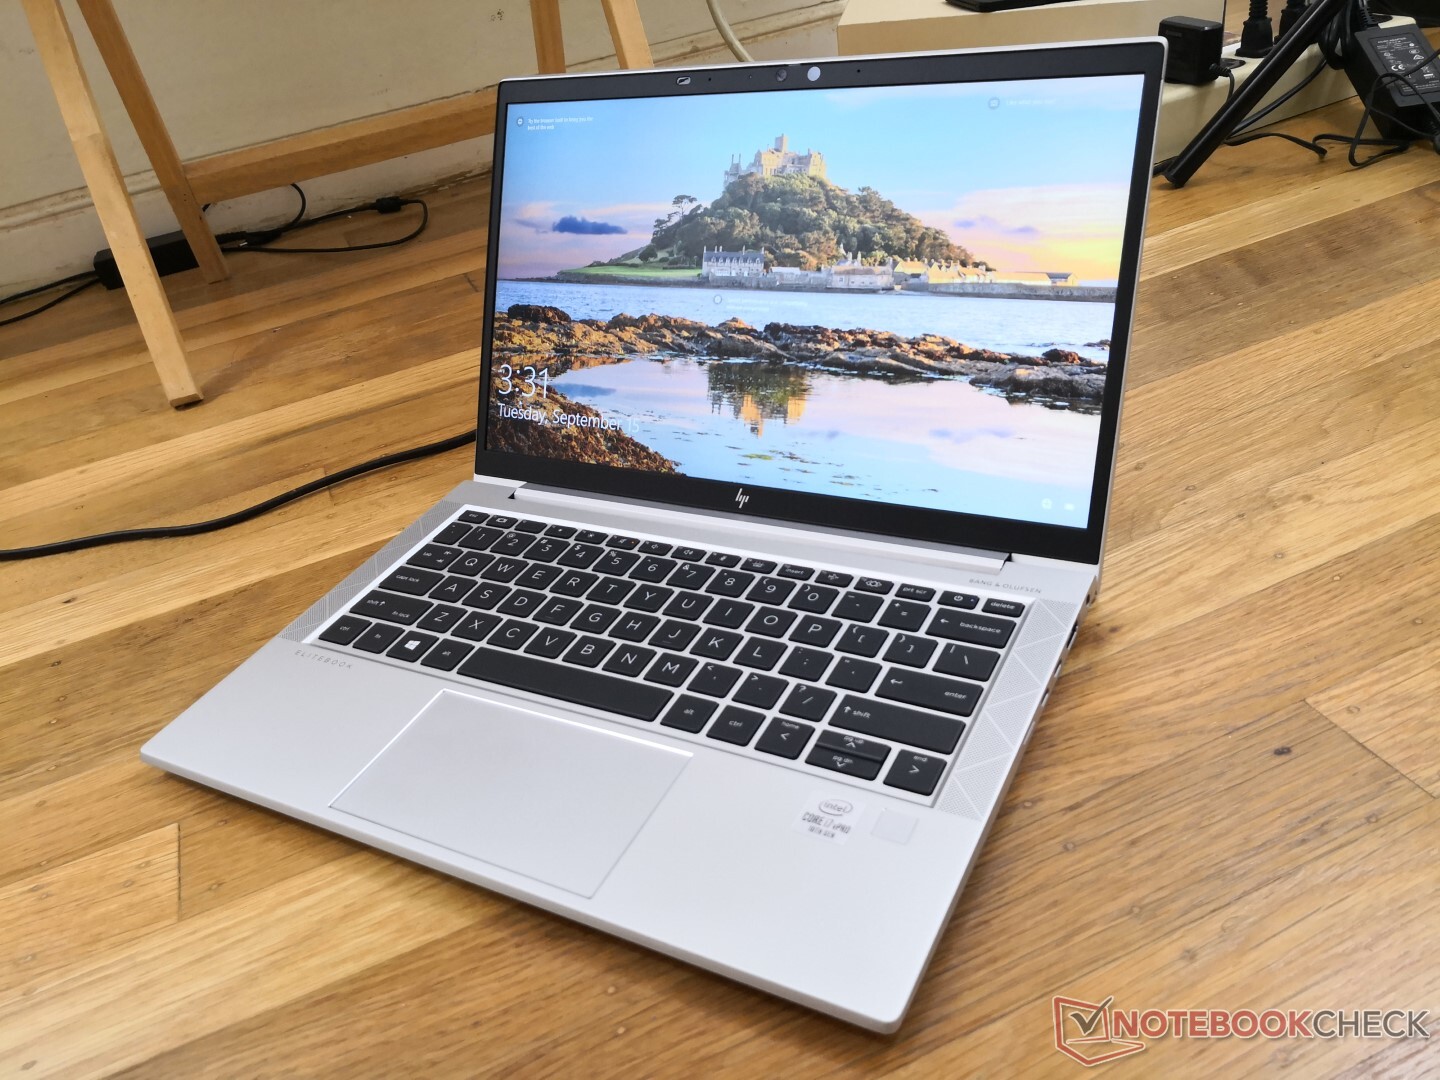
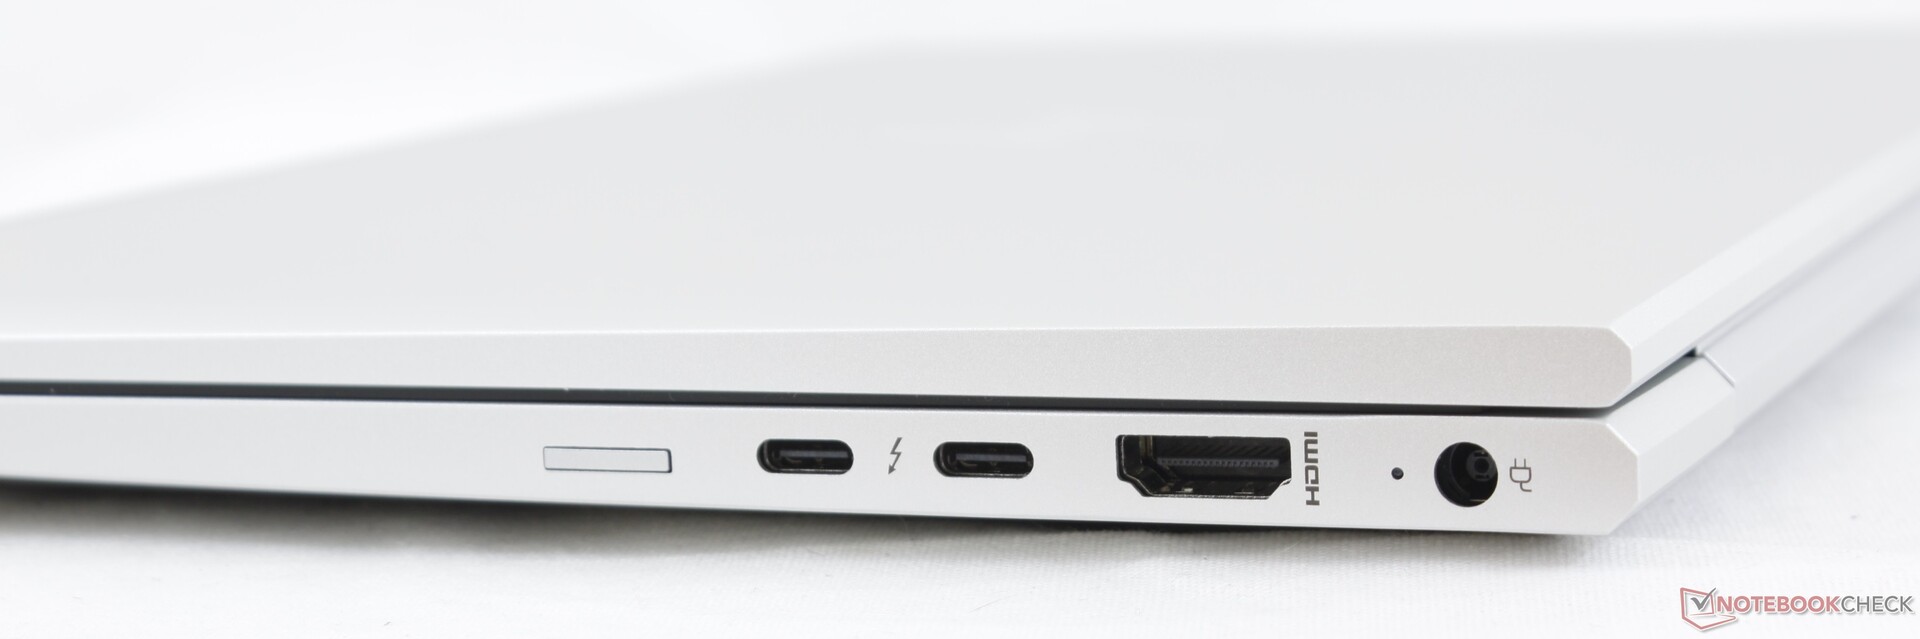
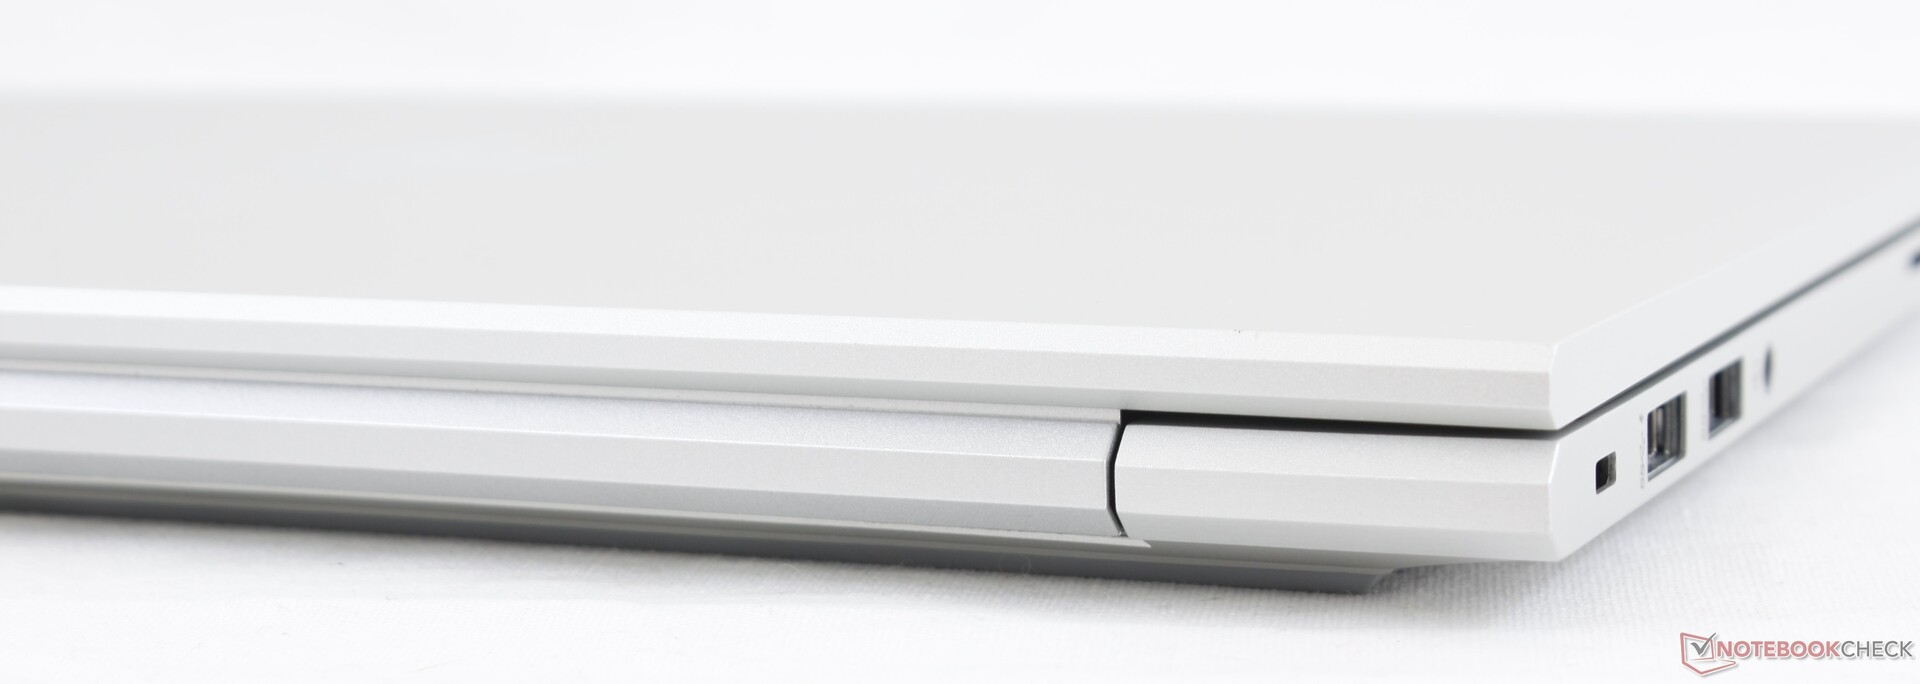
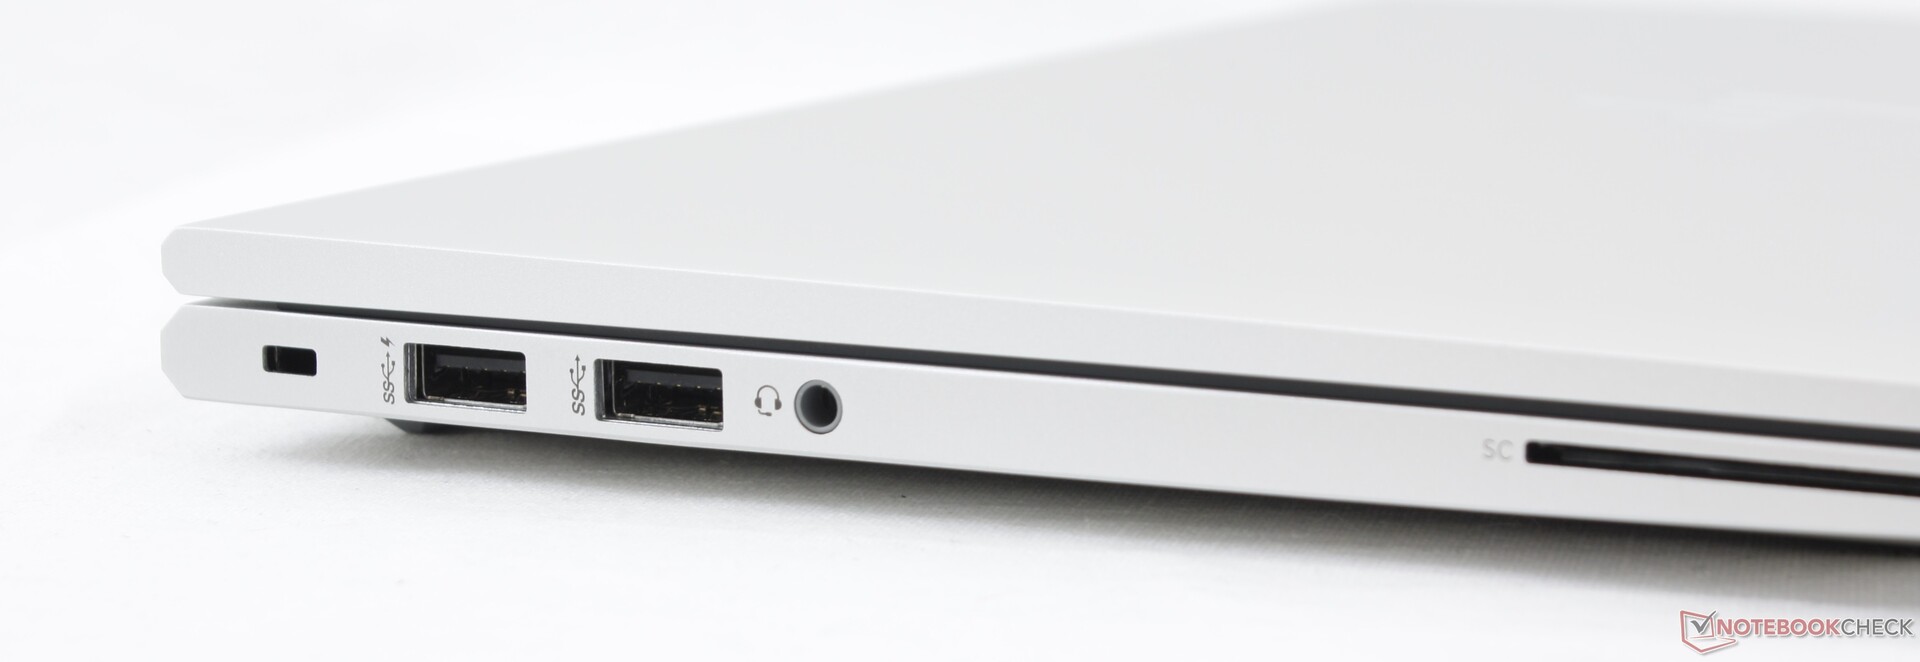
Breve Análise do Portátil HP EliteBook 830 G7: Premium para o mainstream
Avaliação | Data | Modelo | Peso | Altura | Size | Resolução | Preço |
|---|---|---|---|---|---|---|---|
| 88.7 % v7 (old) | 09/2020 | HP EliteBook 830 G7 i7-10810U, UHD Graphics 620 | 1.3 kg | 18.1 mm | 13.30" | 1920x1080 | |
| 87.9 % v7 (old) | 10/2019 | HP EliteBook x360 830 G6 i7-8565U, UHD Graphics 620 | 1.5 kg | 16.9 mm | 13.30" | 1920x1080 | |
| 88 % v7 (old) | 08/2020 | Lenovo ThinkPad X13-20T20033GE i5-10210U, UHD Graphics 620 | 1.3 kg | 16.9 mm | 13.30" | 1920x1080 | |
| 89.4 % v7 (old) | 07/2020 | Dell Latitude 7310 i7-10610U, UHD Graphics 620 | 1.2 kg | 18.3 mm | 13.30" | 1920x1080 | |
| 85.1 % v7 (old) | Dynabook Portege X30L-G1331 i5-10210U, UHD Graphics 620 | 859 g | 17.9 mm | 13.30" | 1920x1080 | ||
| 84 % v7 (old) | 03/2020 | Microsoft Surface Laptop 3 13 Core i5-1035G7 i5-1035G7, Iris Plus Graphics G7 (Ice Lake 64 EU) | 1.3 kg | 14.5 mm | 13.50" | 2256x1504 |
| Networking | |
| iperf3 transmit AX12 | |
| Microsoft Surface Laptop 3 13 Core i5-1035G7 | |
| Dynabook Portege X30L-G1331 | |
| Dell Latitude 7310 | |
| HP EliteBook 830 G7 | |
| Lenovo ThinkPad X13-20T20033GE | |
| iperf3 receive AX12 | |
| Lenovo ThinkPad X13-20T20033GE | |
| HP EliteBook 830 G7 | |
| Dynabook Portege X30L-G1331 | |
| Microsoft Surface Laptop 3 13 Core i5-1035G7 | |
| Dell Latitude 7310 | |


| |||||||||||||||||||||||||
iluminação: 91 %
iluminação com acumulador: 454.5 cd/m²
Contraste: 1683:1 (Preto: 0.27 cd/m²)
ΔE ColorChecker Calman: 3.12 | ∀{0.5-29.43 Ø4.71}
calibrated: 1.97
ΔE Greyscale Calman: 3.1 | ∀{0.09-98 Ø4.96}
97% sRGB (Argyll 1.6.3 3D)
61.5% AdobeRGB 1998 (Argyll 1.6.3 3D)
67.4% AdobeRGB 1998 (Argyll 3D)
97.4% sRGB (Argyll 3D)
65.7% Display P3 (Argyll 3D)
Gamma: 2.01
CCT: 6902 K
| HP EliteBook 830 G7 Chi Mei CMN13A9, IPS, 13.3", 1920x1080 | HP EliteBook x360 830 G6 M133NVFC R5, IPS LED, 13.3", 1920x1080 | Lenovo ThinkPad X13-20T20033GE Lenovo B133HAK01.1, IPS, 13.3", 1920x1080 | Dell Latitude 7310 AU Optronics B133HAN, IPS, 13.3", 1920x1080 | Dynabook Portege X30L-G1331 Toshiba TOS508F, IPS, 13.3", 1920x1080 | Microsoft Surface Laptop 3 13 Core i5-1035G7 Sharp LQ135P1JX51, IPS, 13.5", 2256x1504 | |
|---|---|---|---|---|---|---|
| Display | -0% | -0% | 6% | 1% | 1% | |
| Display P3 Coverage (%) | 65.7 | 66.1 1% | 66 0% | 71.8 9% | 66.9 2% | 65.7 0% |
| sRGB Coverage (%) | 97.4 | 95.3 -2% | 96.2 -1% | 99.3 2% | 97.6 0% | 98.6 1% |
| AdobeRGB 1998 Coverage (%) | 67.4 | 67.5 0% | 67.2 0% | 72.4 7% | 67.8 1% | 67.8 1% |
| Response Times | 6% | -2% | 12% | -14% | -28% | |
| Response Time Grey 50% / Grey 80% * (ms) | 46.8 ? | 44 ? 6% | 52.8 ? -13% | 40.8 ? 13% | 54.8 ? -17% | 59.2 ? -26% |
| Response Time Black / White * (ms) | 32 ? | 30 ? 6% | 29.2 ? 9% | 28.8 ? 10% | 35.6 ? -11% | 41.6 ? -30% |
| PWM Frequency (Hz) | 26600 ? | 952 ? | 23810 ? | 21740 ? | ||
| Screen | 10% | -33% | 5% | 8% | 14% | |
| Brightness middle (cd/m²) | 454.5 | 603 33% | 359 -21% | 332.7 -27% | 482 6% | 403.4 -11% |
| Brightness (cd/m²) | 435 | 692 59% | 342 -21% | 329 -24% | 452 4% | 397 -9% |
| Brightness Distribution (%) | 91 | 69 -24% | 90 -1% | 89 -2% | 91 0% | 89 -2% |
| Black Level * (cd/m²) | 0.27 | 0.26 4% | 0.21 22% | 0.25 7% | 0.4 -48% | 0.34 -26% |
| Contrast (:1) | 1683 | 2319 38% | 1710 2% | 1331 -21% | 1205 -28% | 1186 -30% |
| Colorchecker dE 2000 * | 3.12 | 2.2 29% | 6.7 -115% | 2.15 31% | 1.85 41% | 0.94 70% |
| Colorchecker dE 2000 max. * | 4.85 | 7.7 -59% | 10.9 -125% | 3.89 20% | 3.08 36% | 2.92 40% |
| Colorchecker dE 2000 calibrated * | 1.97 | 1.5 24% | 1.3 34% | 1.09 45% | 1.2 39% | 0.99 50% |
| Greyscale dE 2000 * | 3.1 | 2.6 16% | 7.4 -139% | 2.5 19% | 2 35% | 0.9 71% |
| Gamma | 2.01 109% | 2.17 101% | 2.85 77% | 2.3 96% | 2.1 105% | 2.13 103% |
| CCT | 6902 94% | 6412 101% | 6309 103% | 6347 102% | 6822 95% | 6620 98% |
| Color Space (Percent of AdobeRGB 1998) (%) | 61.5 | 60.2 -2% | 61.7 0% | 64.1 4% | 62.5 2% | 62.3 1% |
| Color Space (Percent of sRGB) (%) | 97 | 93.6 -4% | 95.9 -1% | 99.4 2% | 97.7 1% | 98.7 2% |
| Média Total (Programa/Configurações) | 5% /
8% | -12% /
-23% | 8% /
6% | -2% /
4% | -4% /
6% |
* ... menor é melhor
Exibir tempos de resposta
| ↔ Tempo de resposta preto para branco | ||
|---|---|---|
| 32 ms ... ascensão ↗ e queda ↘ combinadas | ↗ 15.6 ms ascensão | 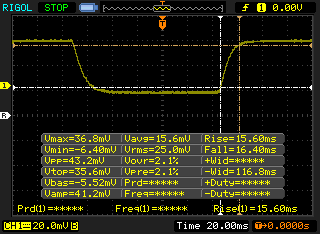 |
| ↘ 16.4 ms queda | ||
| A tela mostra taxas de resposta lentas em nossos testes e será insatisfatória para os jogadores. Em comparação, todos os dispositivos testados variam de 0.1 (mínimo) a 240 (máximo) ms. » 86 % de todos os dispositivos são melhores. Isso significa que o tempo de resposta medido é pior que a média de todos os dispositivos testados (19.8 ms). | ||
| ↔ Tempo de resposta 50% cinza a 80% cinza | ||
| 46.8 ms ... ascensão ↗ e queda ↘ combinadas | ↗ 24 ms ascensão | 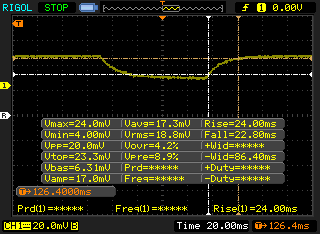 |
| ↘ 22.8 ms queda | ||
| A tela mostra taxas de resposta lentas em nossos testes e será insatisfatória para os jogadores. Em comparação, todos os dispositivos testados variam de 0.165 (mínimo) a 636 (máximo) ms. » 81 % de todos os dispositivos são melhores. Isso significa que o tempo de resposta medido é pior que a média de todos os dispositivos testados (31 ms). | ||
Cintilação da tela / PWM (modulação por largura de pulso)
| Tela tremeluzindo/PWM detectado | 26600 Hz | ≤ 62 % configuração de brilho | 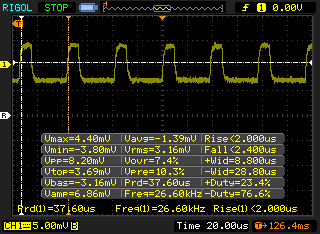 |
A luz de fundo da tela pisca em 26600 Hz (pior caso, por exemplo, utilizando PWM) Cintilação detectada em uma configuração de brilho de 62 % e abaixo. Não deve haver cintilação ou PWM acima desta configuração de brilho. A frequência de 26600 Hz é bastante alta, então a maioria dos usuários sensíveis ao PWM não deve notar nenhuma oscilação. [pwm_comparison] Em comparação: 52 % de todos os dispositivos testados não usam PWM para escurecer a tela. Se PWM foi detectado, uma média de 7757 (mínimo: 5 - máximo: 343500) Hz foi medida. | |||
Cinebench R15: CPU Multi 64Bit | CPU Single 64Bit
Blender: v2.79 BMW27 CPU
7-Zip 18.03: 7z b 4 -mmt1 | 7z b 4
Geekbench 5.5: Single-Core | Multi-Core
HWBOT x265 Benchmark v2.2: 4k Preset
LibreOffice : 20 Documents To PDF
R Benchmark 2.5: Overall mean
| LibreOffice / 20 Documents To PDF | |
| HP EliteBook 830 G7 | |
| Média Intel Core i7-10810U (60.6 - 68.2, n=5) | |
| Lenovo ThinkPad E14 Gen2-20T7S00W00 | |
| Microsoft Surface Book 3 15 | |
| Dell XPS 15 9500 Core i5 | |
| Lenovo ThinkPad X13-20UGS00800 | |
| Asus VivoBook Flip 14 TM420IA | |
| Acer TravelMate P6 P614-51T-G2-72ZU | |
| Lenovo ThinkPad X13-20T20033GE | |
* ... menor é melhor
| PCMark 8 | |
| Home Score Accelerated v2 | |
| Lenovo ThinkPad X13-20T20033GE | |
| Dell Latitude 7310 | |
| Média Intel Core i7-10810U, Intel UHD Graphics 620 (3569 - 3969, n=3) | |
| Microsoft Surface Laptop 3 13 Core i5-1035G7 | |
| Dynabook Portege X30L-G1331 | |
| HP EliteBook 830 G7 | |
| HP EliteBook x360 830 G6 | |
| Work Score Accelerated v2 | |
| Dell Latitude 7310 | |
| Lenovo ThinkPad X13-20T20033GE | |
| Dynabook Portege X30L-G1331 | |
| Média Intel Core i7-10810U, Intel UHD Graphics 620 (4763 - 5149, n=3) | |
| HP EliteBook 830 G7 | |
| Microsoft Surface Laptop 3 13 Core i5-1035G7 | |
| HP EliteBook x360 830 G6 | |
| PCMark 8 Home Score Accelerated v2 | 3569 pontos | |
| PCMark 8 Work Score Accelerated v2 | 4763 pontos | |
| PCMark 10 Score | 4185 pontos | |
Ajuda | ||
| DPC Latencies / LatencyMon - interrupt to process latency (max), Web, Youtube, Prime95 | |
| Dell Latitude 9510 2-in-1 | |
| Acer TravelMate P6 P614-51T-G2-72ZU | |
| Dynabook Portege X30L-G1331 | |
| Lenovo ThinkPad X13-20UGS00800 | |
| Dell XPS 13 9300 i5 FHD | |
| Lenovo ThinkPad X13-20T20033GE | |
| Dell Latitude 7310 | |
| HP EliteBook 830 G7 | |
| Lenovo ThinkPad E14 Gen2-20T7S00W00 | |
| Asus VivoBook Flip 14 TM420IA | |
* ... menor é melhor
| HP EliteBook 830 G7 Samsung SSD PM981a MZVLB512HBJQ | HP EliteBook x360 830 G6 WDC PC SN720 SDAPNTW-1T00 | Lenovo ThinkPad X13-20T20033GE Samsung SSD PM981a MZVLB512HBJQ | Dell Latitude 7310 Samsung SSD PM981a MZVLB512HBJQ | Microsoft Surface Laptop 3 13 Core i5-1035G7 SK hynix BC501 HFM256GDGTNG | |
|---|---|---|---|---|---|
| AS SSD | 9% | 20% | 62% | -14% | |
| Seq Read (MB/s) | 2081 | 2446 18% | 2714 30% | 2054 -1% | 1387 -33% |
| Seq Write (MB/s) | 1433 | 1319 -8% | 1374 -4% | 1575 10% | 504 -65% |
| 4K Read (MB/s) | 49.92 | 44.69 -10% | 51.2 3% | 52.1 4% | 42.35 -15% |
| 4K Write (MB/s) | 119.1 | 151.5 27% | 135.7 14% | 137.3 15% | 120 1% |
| 4K-64 Read (MB/s) | 585 | 603 3% | 962 64% | 618 6% | 497.4 -15% |
| 4K-64 Write (MB/s) | 1630 | 1410 -13% | 1420 -13% | 1317 -19% | 354.9 -78% |
| Access Time Read * (ms) | 0.043 | 0.052 -21% | 0.043 -0% | 0.044 -2% | 0.055 -28% |
| Access Time Write * (ms) | 0.097 | 0.026 73% | 0.028 71% | 0.083 14% | 0.093 4% |
| Score Read (Points) | 843 | 892 6% | 1284 52% | 876 4% | 678 -20% |
| Score Write (Points) | 1892 | 1693 -11% | 1693 -11% | 1611 -15% | 525 -72% |
| Score Total (Points) | 3149 | 2997 -5% | 3579 14% | 2927 -7% | 1520 -52% |
| Copy ISO MB/s (MB/s) | 2452 | 2990 22% | 2297 -6% | 764 -69% | |
| Copy Program MB/s (MB/s) | 72.2 | 106.5 48% | 540 648% | 256.1 255% | |
| Copy Game MB/s (MB/s) | 404 | 385.4 -5% | 1288 219% | 368.4 -9% | |
| CrystalDiskMark 5.2 / 6 | -13% | 3% | 6% | -32% | |
| Write 4K (MB/s) | 118.3 | 122.8 4% | 131.1 11% | 135.2 14% | 112.3 -5% |
| Read 4K (MB/s) | 60.4 | 46.89 -22% | 45.48 -25% | 50.7 -16% | 42.13 -30% |
| Write Seq (MB/s) | 2067 | 1801 -13% | 2042 -1% | 2155 4% | 630 -70% |
| Read Seq (MB/s) | 2394 | 1014 -58% | 2259 -6% | 2504 5% | 1023 -57% |
| Write 4K Q32T1 (MB/s) | 325.5 | 333.7 3% | 429.1 32% | 395.6 22% | 336.6 3% |
| Read 4K Q32T1 (MB/s) | 332.2 | 314.4 -5% | 370.7 12% | 394.5 19% | 399.6 20% |
| Write Seq Q32T1 (MB/s) | 2978 | 2784 -7% | 2963 -1% | 2987 0% | 821 -72% |
| Read Seq Q32T1 (MB/s) | 3552 | 3261 -8% | 3564 0% | 3564 0% | 2030 -43% |
| Write 4K Q8T8 (MB/s) | 300.6 | ||||
| Read 4K Q8T8 (MB/s) | 751 | ||||
| Média Total (Programa/Configurações) | -2% /
1% | 12% /
13% | 34% /
42% | -23% /
-20% |
* ... menor é melhor

Disk Throttling: DiskSpd Read Loop, Queue Depth 8
| 3DMark 11 Performance | 2176 pontos | |
| 3DMark Cloud Gate Standard Score | 9927 pontos | |
| 3DMark Fire Strike Score | 1248 pontos | |
| 3DMark Time Spy Score | 497 pontos | |
Ajuda | ||
| baixo | média | alto | ultra | |
|---|---|---|---|---|
| Dota 2 Reborn (2015) | 75.8 | 49.1 | 22.4 | 19.7 |
| X-Plane 11.11 (2018) | 11.9 | 10.6 | 10.1 |
| HP EliteBook 830 G7 UHD Graphics 620, i7-10810U, Samsung SSD PM981a MZVLB512HBJQ | HP EliteBook x360 830 G6 UHD Graphics 620, i7-8565U, WDC PC SN720 SDAPNTW-1T00 | Lenovo ThinkPad X13-20T20033GE UHD Graphics 620, i5-10210U, Samsung SSD PM981a MZVLB512HBJQ | Dell Latitude 7310 UHD Graphics 620, i7-10610U, Samsung SSD PM981a MZVLB512HBJQ | Dynabook Portege X30L-G1331 UHD Graphics 620, i5-10210U, Samsung SSD PM981a MZVLB512HBJQ | Microsoft Surface Laptop 3 13 Core i5-1035G7 Iris Plus Graphics G7 (Ice Lake 64 EU), i5-1035G7, SK hynix BC501 HFM256GDGTNG | |
|---|---|---|---|---|---|---|
| Noise | -5% | -3% | -5% | -3% | -3% | |
| desligado / ambiente * (dB) | 26.8 | 28.8 -7% | 29.3 -9% | 29 -8% | 28.5 -6% | 28.5 -6% |
| Idle Minimum * (dB) | 27.1 | 28.8 -6% | 29.3 -8% | 29 -7% | 28.5 -5% | 28.5 -5% |
| Idle Average * (dB) | 27.1 | 28.8 -6% | 29.3 -8% | 29 -7% | 28.5 -5% | 28.5 -5% |
| Idle Maximum * (dB) | 27.1 | 32.2 -19% | 29.3 -8% | 29 -7% | 28.5 -5% | 28.5 -5% |
| Load Average * (dB) | 31.4 | 32.2 -3% | 30.7 2% | 30.1 4% | 32 -2% | 28.5 9% |
| Load Maximum * (dB) | 39 | 34.4 12% | 34 13% | 41.3 -6% | 38 3% | 40.4 -4% |
| Witcher 3 ultra * (dB) | 40.4 |
* ... menor é melhor
Barulho
| Ocioso |
| 27.1 / 27.1 / 27.1 dB |
| Carga |
| 31.4 / 39 dB |
 | ||
30 dB silencioso 40 dB(A) audível 50 dB(A) ruidosamente alto |
||
min: | ||
(±) A temperatura máxima no lado superior é 41 °C / 106 F, em comparação com a média de 35.9 °C / 97 F , variando de 21.4 a 59 °C para a classe Subnotebook.
(-) A parte inferior aquece até um máximo de 47.2 °C / 117 F, em comparação com a média de 39.2 °C / 103 F
(+) Em uso inativo, a temperatura média para o lado superior é 27.4 °C / 81 F, em comparação com a média do dispositivo de 30.8 °C / ### class_avg_f### F.
(+) Os apoios para as mãos e o touchpad são mais frios que a temperatura da pele, com um máximo de 31.6 °C / 88.9 F e, portanto, são frios ao toque.
(-) A temperatura média da área do apoio para as mãos de dispositivos semelhantes foi 28.2 °C / 82.8 F (-3.4 °C / -6.1 F).
HP EliteBook 830 G7 análise de áudio
(±) | o volume do alto-falante é médio, mas bom (###valor### dB)
Graves 100 - 315Hz
(±) | graves reduzidos - em média 14.5% menor que a mediana
(±) | a linearidade dos graves é média (12.9% delta para a frequência anterior)
Médios 400 - 2.000 Hz
(+) | médios equilibrados - apenas 1.6% longe da mediana
(+) | médios são lineares (2.5% delta para frequência anterior)
Altos 2 - 16 kHz
(+) | agudos equilibrados - apenas 4.2% longe da mediana
(+) | os máximos são lineares (4.2% delta da frequência anterior)
Geral 100 - 16.000 Hz
(+) | o som geral é linear (14% diferença em relação à mediana)
Comparado com a mesma classe
» 26% de todos os dispositivos testados nesta classe foram melhores, 6% semelhantes, 68% piores
» O melhor teve um delta de 5%, a média foi 18%, o pior foi 53%
Comparado com todos os dispositivos testados
» 16% de todos os dispositivos testados foram melhores, 4% semelhantes, 80% piores
» O melhor teve um delta de 4%, a média foi 23%, o pior foi 134%
Apple MacBook 12 (Early 2016) 1.1 GHz análise de áudio
(+) | os alto-falantes podem tocar relativamente alto (###valor### dB)
Graves 100 - 315Hz
(±) | graves reduzidos - em média 11.3% menor que a mediana
(±) | a linearidade dos graves é média (14.2% delta para a frequência anterior)
Médios 400 - 2.000 Hz
(+) | médios equilibrados - apenas 2.4% longe da mediana
(+) | médios são lineares (5.5% delta para frequência anterior)
Altos 2 - 16 kHz
(+) | agudos equilibrados - apenas 2% longe da mediana
(+) | os máximos são lineares (4.5% delta da frequência anterior)
Geral 100 - 16.000 Hz
(+) | o som geral é linear (10.2% diferença em relação à mediana)
Comparado com a mesma classe
» 7% de todos os dispositivos testados nesta classe foram melhores, 2% semelhantes, 90% piores
» O melhor teve um delta de 5%, a média foi 18%, o pior foi 53%
Comparado com todos os dispositivos testados
» 5% de todos os dispositivos testados foram melhores, 1% semelhantes, 94% piores
» O melhor teve um delta de 4%, a média foi 23%, o pior foi 134%
| desligado | |
| Ocioso | |
| Carga |
|
Key:
min: | |
| HP EliteBook 830 G7 i7-10810U, UHD Graphics 620, Samsung SSD PM981a MZVLB512HBJQ, IPS, 1920x1080, 13.3" | HP EliteBook x360 830 G6 i7-8565U, UHD Graphics 620, WDC PC SN720 SDAPNTW-1T00, IPS LED, 1920x1080, 13.3" | Lenovo ThinkPad X13-20T20033GE i5-10210U, UHD Graphics 620, Samsung SSD PM981a MZVLB512HBJQ, IPS, 1920x1080, 13.3" | Dell Latitude 7310 i7-10610U, UHD Graphics 620, Samsung SSD PM981a MZVLB512HBJQ, IPS, 1920x1080, 13.3" | Dynabook Portege X30L-G1331 i5-10210U, UHD Graphics 620, Samsung SSD PM981a MZVLB512HBJQ, IPS, 1920x1080, 13.3" | Microsoft Surface Laptop 3 13 Core i5-1035G7 i5-1035G7, Iris Plus Graphics G7 (Ice Lake 64 EU), SK hynix BC501 HFM256GDGTNG, IPS, 2256x1504, 13.5" | |
|---|---|---|---|---|---|---|
| Power Consumption | -40% | -11% | 7% | -5% | -30% | |
| Idle Minimum * (Watt) | 3.6 | 4.4 -22% | 2.9 19% | 2.7 25% | 2.8 22% | 4.4 -22% |
| Idle Average * (Watt) | 4.7 | 8 -70% | 5.6 -19% | 4.4 6% | 4.9 -4% | 7.5 -60% |
| Idle Maximum * (Watt) | 5.1 | 10.6 -108% | 8.9 -75% | 4.8 6% | 9 -76% | 7.8 -53% |
| Load Average * (Watt) | 33.3 | 34.6 -4% | 30.1 10% | 33.4 -0% | 31.2 6% | 41.9 -26% |
| Load Maximum * (Watt) | 70 | 68.2 3% | 61.3 12% | 69.7 -0% | 49.4 29% | 63.9 9% |
| Witcher 3 ultra * (Watt) | 40.8 |
* ... menor é melhor
| HP EliteBook 830 G7 i7-10810U, UHD Graphics 620, 53 Wh | HP EliteBook x360 830 G6 i7-8565U, UHD Graphics 620, 53 Wh | Lenovo ThinkPad X13-20T20033GE i5-10210U, UHD Graphics 620, 48 Wh | Dell Latitude 7310 i7-10610U, UHD Graphics 620, 52 Wh | Dynabook Portege X30L-G1331 i5-10210U, UHD Graphics 620, 42 Wh | Microsoft Surface Laptop 3 13 Core i5-1035G7 i5-1035G7, Iris Plus Graphics G7 (Ice Lake 64 EU), 45 Wh | |
|---|---|---|---|---|---|---|
| Duração da bateria | -25% | -23% | -11% | -28% | -26% | |
| Reader / Idle (h) | 34.6 | 37.4 8% | 34.4 -1% | |||
| WiFi v1.3 (h) | 11.5 | 9.8 -15% | 9.3 -19% | 12.6 10% | 8.3 -28% | 8.3 -28% |
| Load (h) | 3.7 | 2.4 -35% | 2.7 -27% | 1.8 -51% | 1.9 -49% |
Pro
Contra

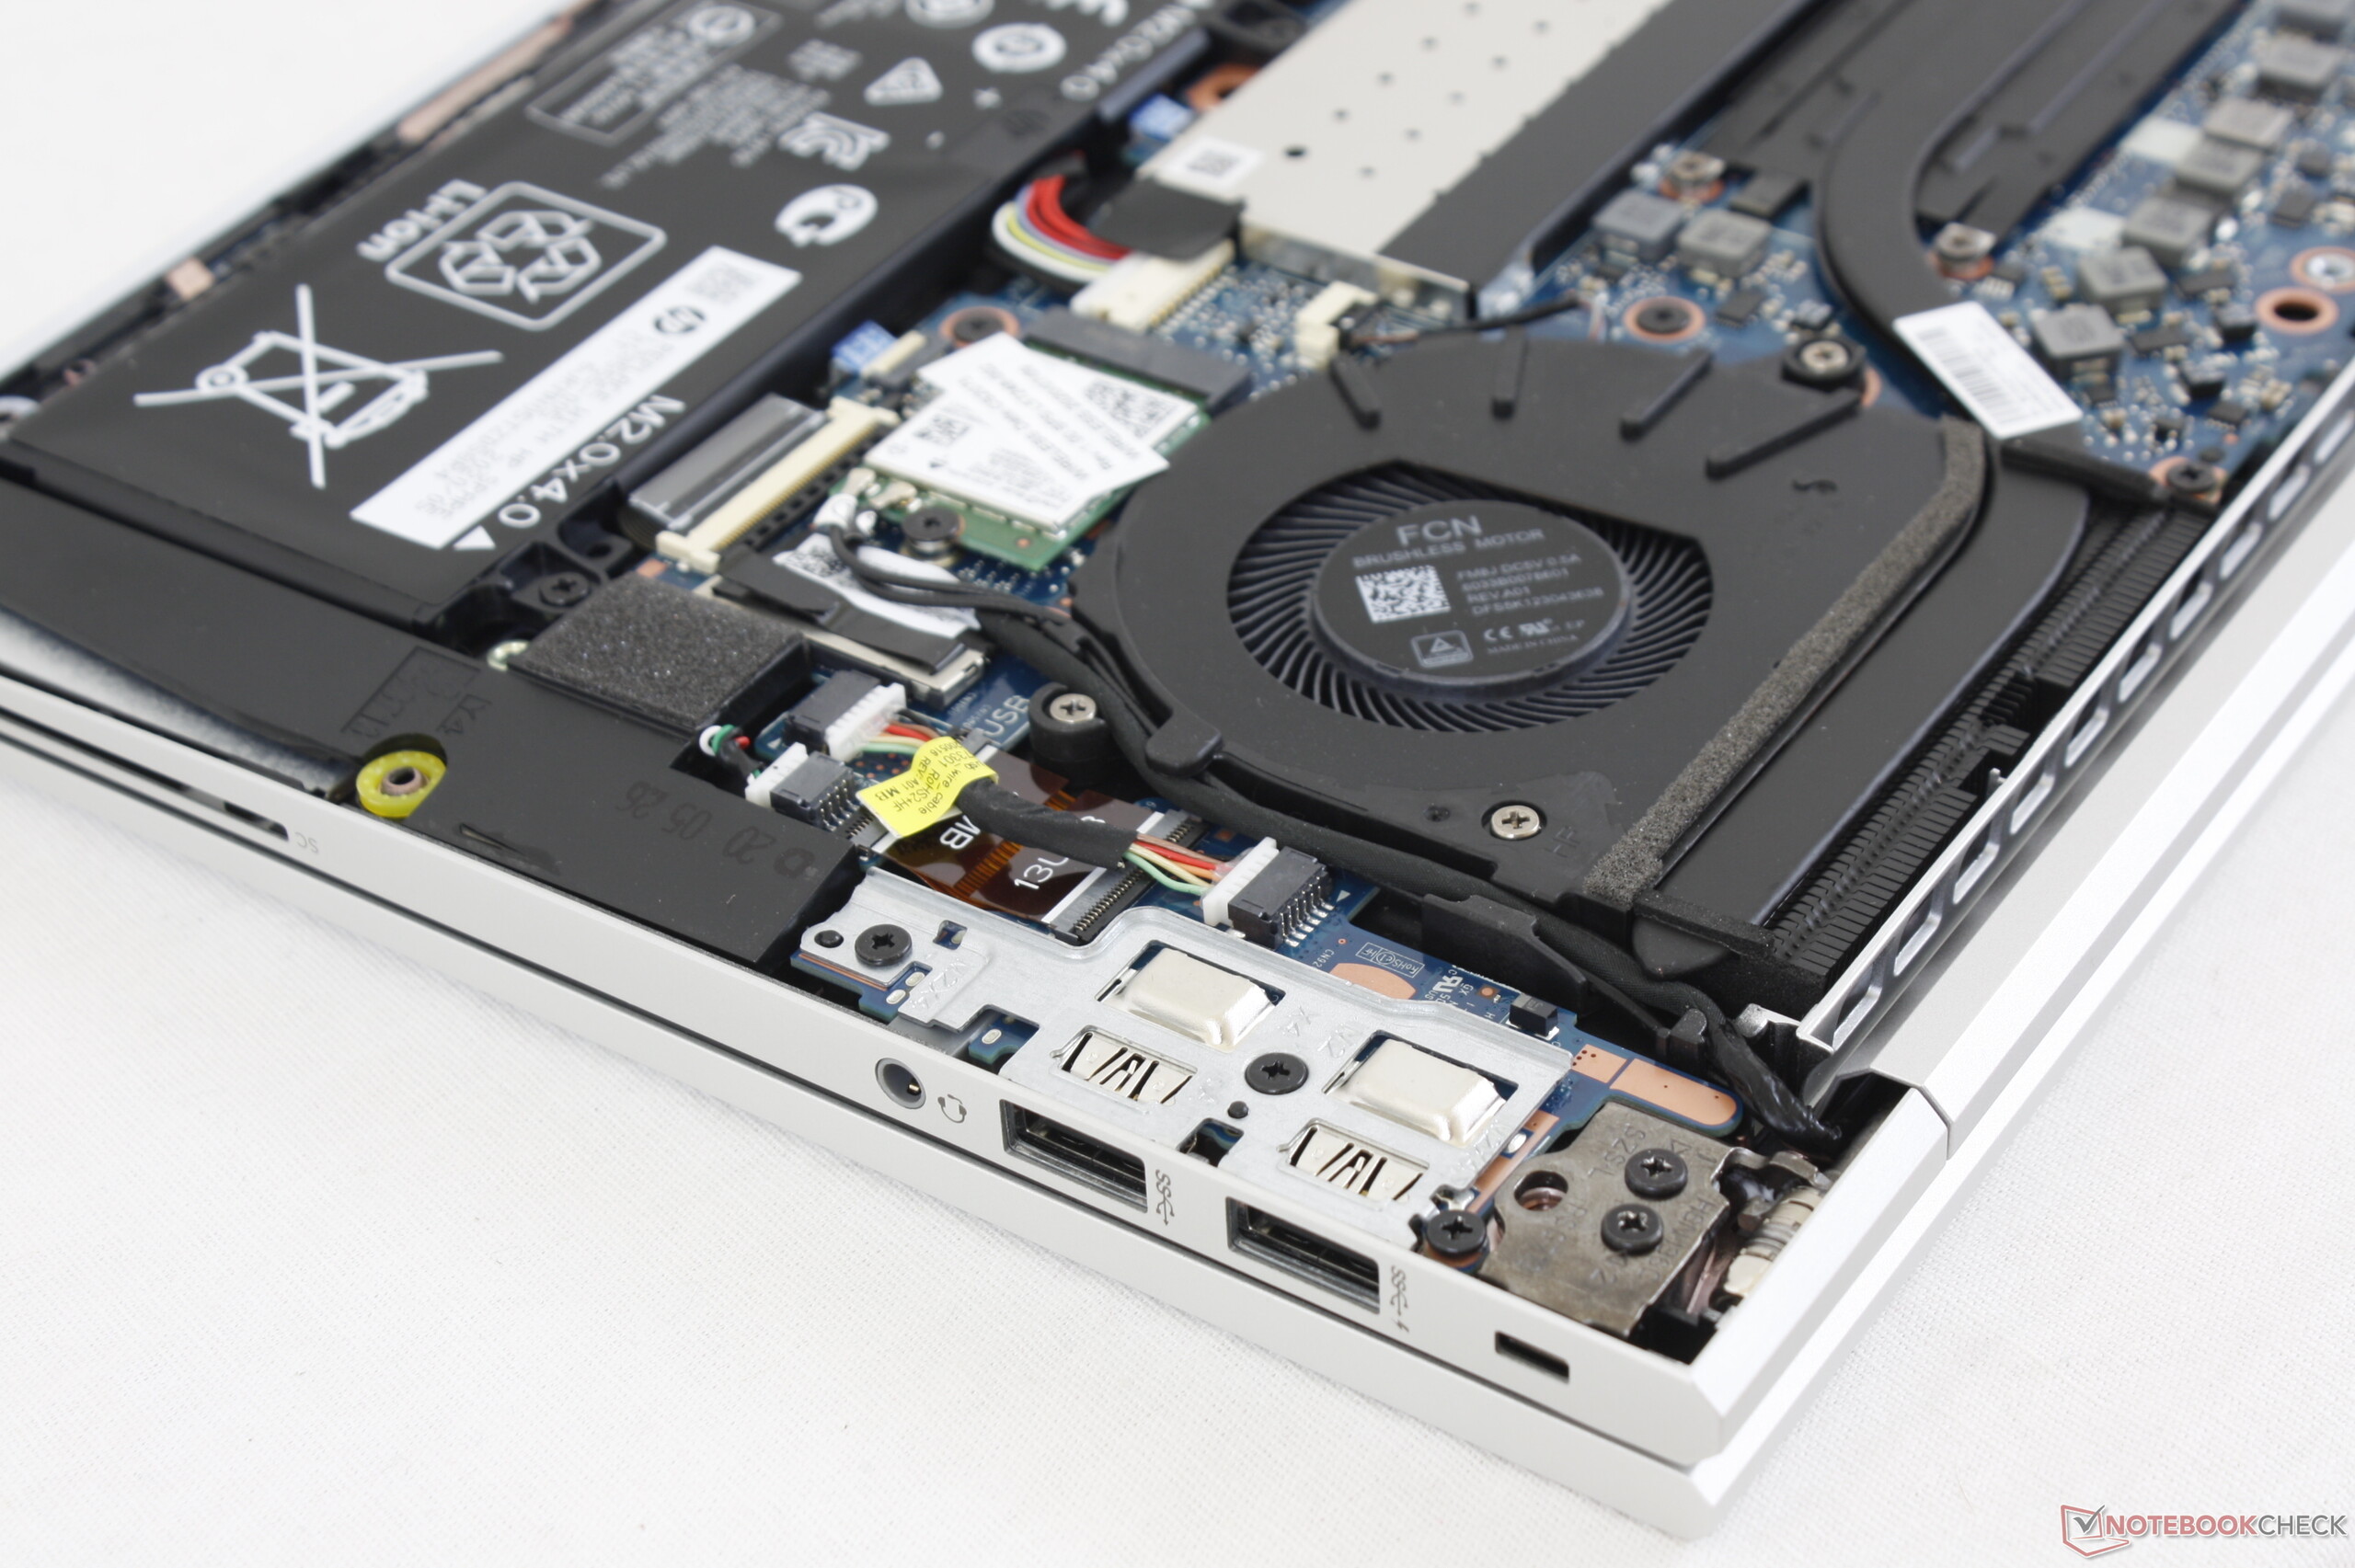
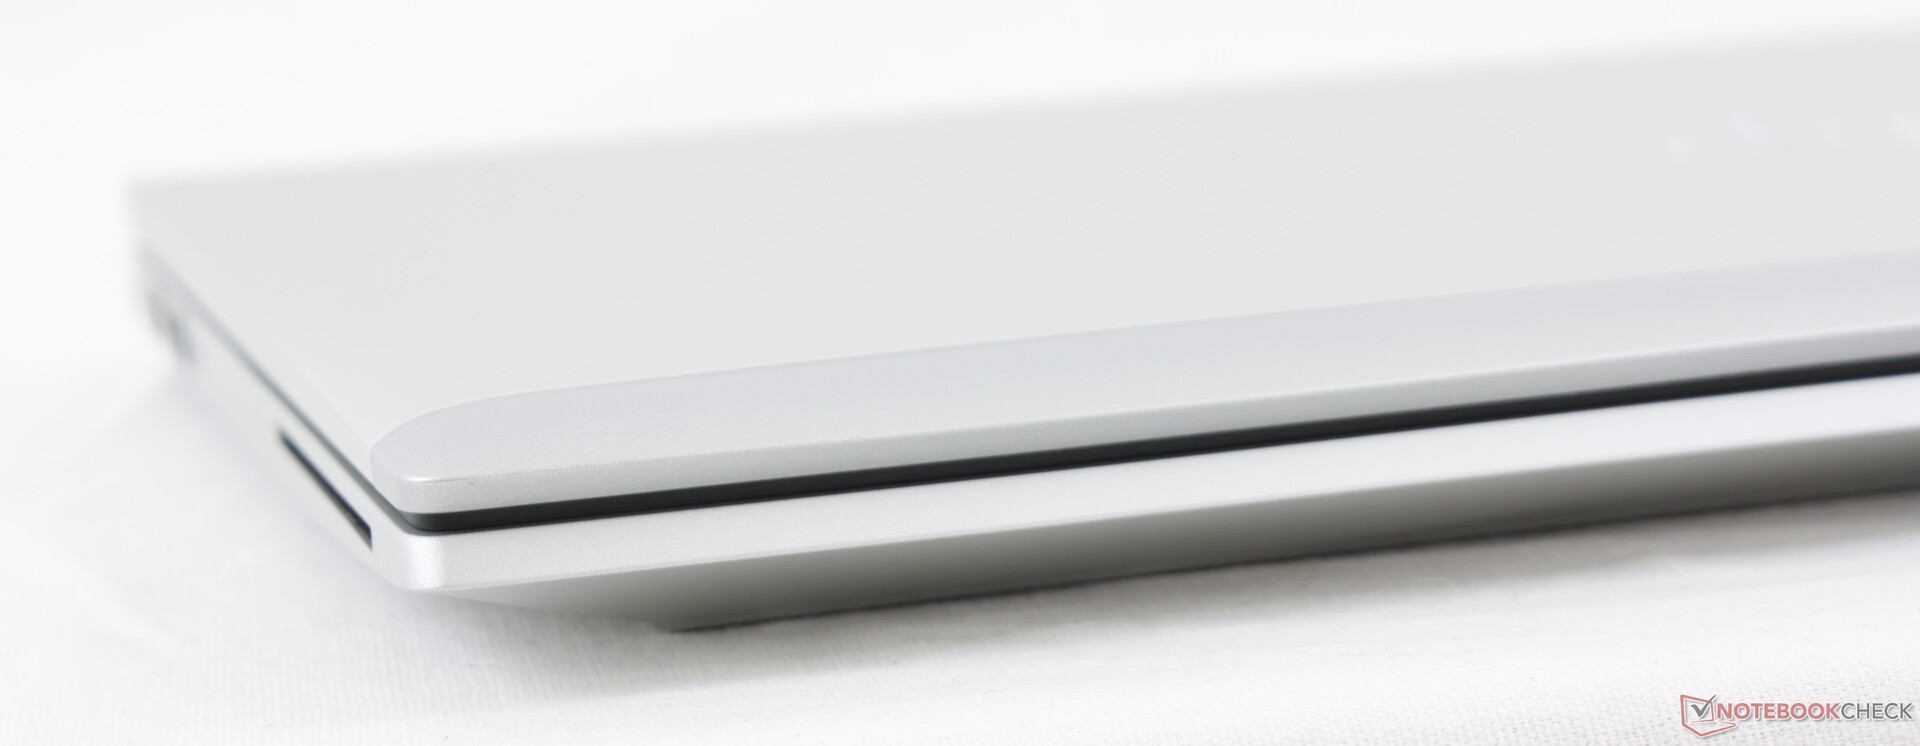
Não havia motivos convincentes suficientes para atualizar do EliteBook 830 G5 para o 830 G6, mas o mais recente 830 G7 representa um salto significativo no design do chassi e portabilidade para ser uma recomendação muito mais fácil sobre qualquer um de seus predecessores. Seu teclado confortável, opções de tela super brilhante e RAM/WLAN/SSD atualizáveis pelo usuário geralmente não estão disponíveis em sistemas concorrentes desta categoria de tamanho, incluindo o ThinkPad X13 ou Dell Latitude 7310.
Embora amemos o que está aqui, também estamos desapontados ao ver alguns recursos omitidos. O TrackPoint, os botões do mouse, o leitor de cartão SD, gráficos Iris/GeForce MX, o botão híbrido de digitais/energia e sensor de proximidade não estão disponíveis, independentemente da configuração que você escolher. O desempenho da CPU continua abaixo da média o que, embora compreensível para um subportátil, não será ideal para usuários que podem querer explorar todo o potencial do processador.
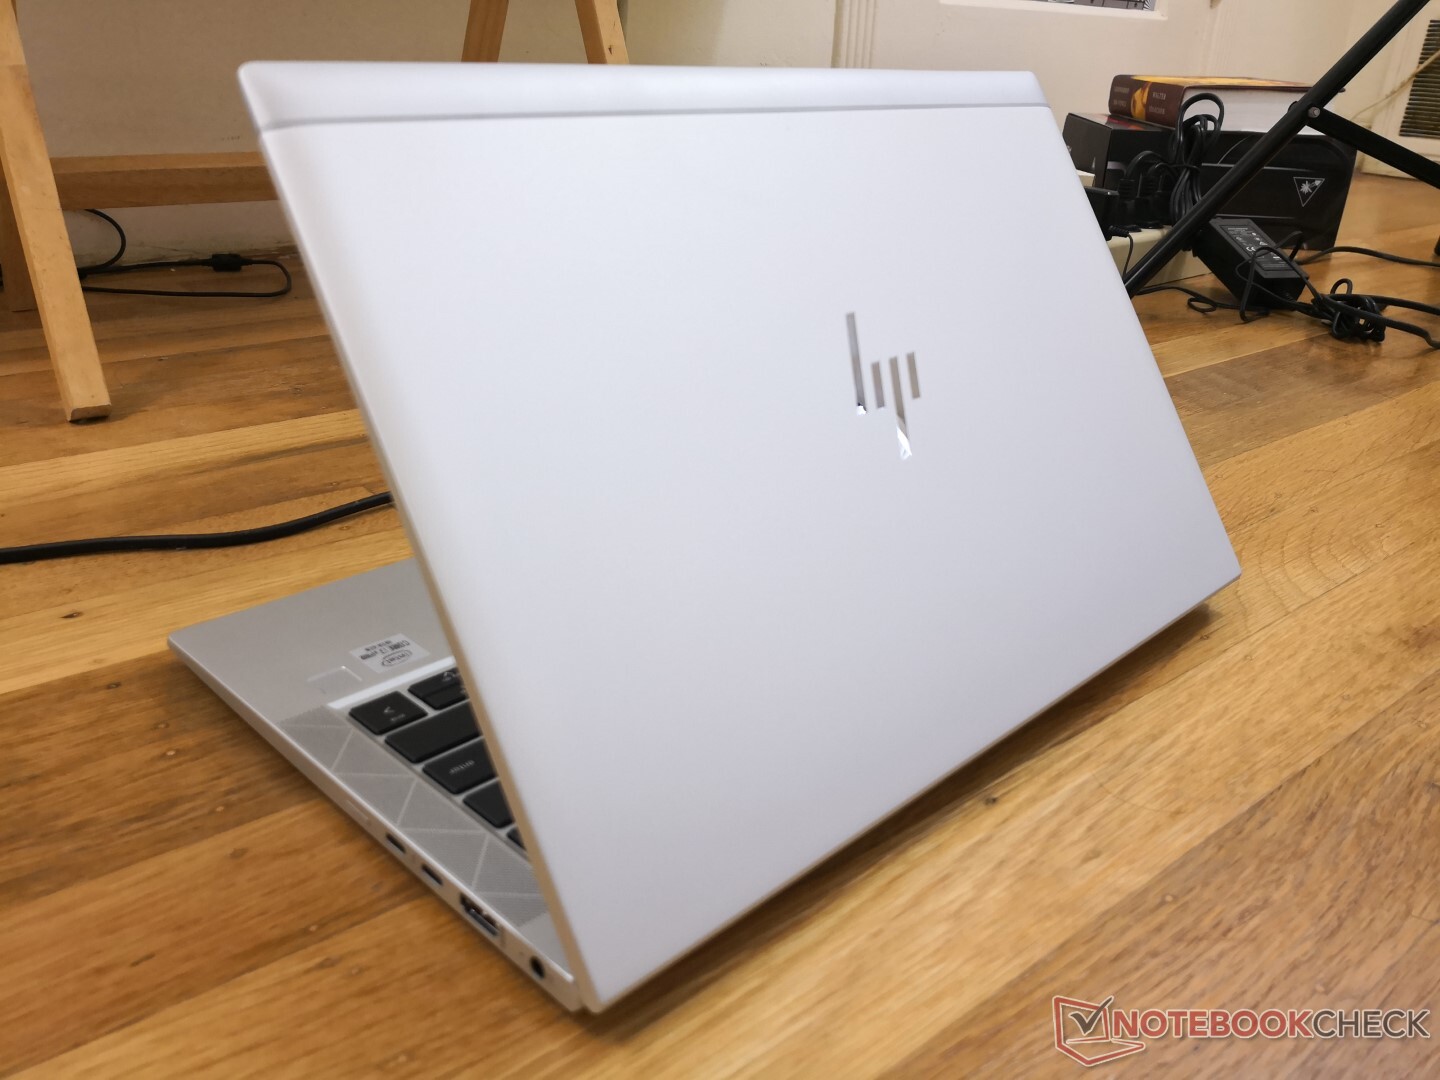
O HP EliteBook 830 G7 é um subportátil empresarial de gama média que se sente como um produto de gama alta. Estão faltando alguns recursos básicos comuns em portáteis empresariais tradicionais, mas compensa as omissões com sua construção rígida, facilidade de manutenção, tela brilhante e excelente experiência de digitação.
HP EliteBook 830 G7
- 09/19/2020 v7 (old)
Allen Ngo
Price comparison
