Breve Análise do Dell Precision 5540: Workstation que funciona como aquecedor de mão
Avaliação | Data | Modelo | Peso | Altura | Size | Resolução | Preço |
|---|---|---|---|---|---|---|---|
| 86.9 % v7 (old) | 11/2019 | Dell Precision 5540 i9-9980HK, Quadro T2000 Max-Q | 2 kg | 17 mm | 15.60" | 3840x2160 | |
| 86.3 % v7 (old) | 09/2019 | Dell XPS 15 7590 i5 iGPU FHD i5-9300H, UHD Graphics 630 | 1.9 kg | 17 mm | 15.60" | 1920x1080 | |
| 85 % v7 (old) | 06/2019 | MSI P65 Creator 9SF-657 i9-9880H, GeForce RTX 2070 Max-Q | 1.9 kg | 18 mm | 15.60" | 3840x2160 | |
| 87.8 % v7 (old) | 08/2019 | Lenovo ThinkPad P1 2019-20QT000RGE i7-9850H, Quadro T1000 (Laptop) | 1.7 kg | 18.4 mm | 15.60" | 1920x1080 | |
| 84.4 % v7 (old) | 11/2018 | HP ZBook Studio G5-4QH10EA i7-8750H, Quadro P1000 | 2.1 kg | 18.9 mm | 15.60" | 3840x2160 |
| SD Card Reader | |
| average JPG Copy Test (av. of 3 runs) | |
| Lenovo ThinkPad P1 2019-20QT000RGE (Toshiba Exceria Pro SDXC 64 GB UHS-II) | |
| Dell XPS 15 7590 i5 iGPU FHD (Toshiba Exceria Pro SDXC 64 GB UHS-II) | |
| HP ZBook Studio G5-4QH10EA (Toshiba Exceria Pro SDXC 64 GB UHS-II) | |
| Dell Precision 5540 (Toshiba Exceria Pro SDXC 64 GB UHS-II) | |
| Média da turma Workstation (49.6 - 681, n=14, últimos 2 anos) | |
| maximum AS SSD Seq Read Test (1GB) | |
| Média da turma Workstation (87.6 - 1455, n=14, últimos 2 anos) | |
| HP ZBook Studio G5-4QH10EA (Toshiba Exceria Pro SDXC 64 GB UHS-II) | |
| Lenovo ThinkPad P1 2019-20QT000RGE (Toshiba Exceria Pro SDXC 64 GB UHS-II) | |
| Dell Precision 5540 (Toshiba Exceria Pro SDXC 64 GB UHS-II) | |
| Dell XPS 15 7590 i5 iGPU FHD (Toshiba Exceria Pro SDXC 64 GB UHS-II) | |
| |||||||||||||||||||||||||
iluminação: 89 %
iluminação com acumulador: 427 cd/m²
Contraste: ∞:1 (Preto: 0 cd/m²)
ΔE ColorChecker Calman: 3.2 | ∀{0.5-29.43 Ø4.72}
calibrated: 2.8
ΔE Greyscale Calman: 1.8 | ∀{0.09-98 Ø4.97}
100% sRGB (Argyll 1.6.3 3D)
86.8% AdobeRGB 1998 (Argyll 1.6.3 3D)
97.3% AdobeRGB 1998 (Argyll 3D)
100% sRGB (Argyll 3D)
99.9% Display P3 (Argyll 3D)
Gamma: 2.15
CCT: 6176 K
| Dell Precision 5540 SDCA029, OLED, 3840x2160, 15.6" | Dell XPS 15 7590 i5 iGPU FHD LQ156M1, IPS, 1920x1080, 15.6" | MSI P65 Creator 9SF-657 AU Optronics AUO41EB, IPS, 3840x2160, 15.6" | Lenovo ThinkPad P1 2019-20QT000RGE N156HCE-GN1, IPS LED, 1920x1080, 15.6" | HP ZBook Studio G5-4QH10EA AUO30EB, IPS LED, 3840x2160, 15.6" | |
|---|---|---|---|---|---|
| Display | -22% | -5% | -27% | -22% | |
| Display P3 Coverage (%) | 99.9 | 66.5 -33% | 84.4 -16% | 62.4 -38% | 68.2 -32% |
| sRGB Coverage (%) | 100 | 98 -2% | 100 0% | 91.5 -8% | 96.2 -4% |
| AdobeRGB 1998 Coverage (%) | 97.3 | 68.4 -30% | 98.5 1% | 63.4 -35% | 68.8 -29% |
| Response Times | -1343% | -1295% | -734% | -1498% | |
| Response Time Grey 50% / Grey 80% * (ms) | 2.8 ? | 52.8 ? -1786% | 51 ? -1721% | 34.4 ? -1129% | 60.8 ? -2071% |
| Response Time Black / White * (ms) | 3.2 ? | 32 ? -900% | 31 ? -869% | 14 ? -338% | 32.8 ? -925% |
| PWM Frequency (Hz) | 240.9 ? | 1020 ? | 26040 ? | ||
| Screen | 2% | -23% | -12% | -22% | |
| Brightness middle (cd/m²) | 427 | 588 38% | 445 4% | 542 27% | 417 -2% |
| Brightness (cd/m²) | 411 | 555 35% | 462 12% | 528 28% | 412 0% |
| Brightness Distribution (%) | 89 | 89 0% | 83 -7% | 84 -6% | 85 -4% |
| Black Level * (cd/m²) | 0.4 | 0.5 | 0.41 | 0.29 | |
| Colorchecker dE 2000 * | 3.2 | 2.5 22% | 4.75 -48% | 3.5 -9% | 4.4 -38% |
| Colorchecker dE 2000 max. * | 8.4 | 6.3 25% | 7.79 7% | 7.8 7% | 6.7 20% |
| Colorchecker dE 2000 calibrated * | 2.8 | 0.6 79% | 1.3 54% | 1.9 32% | |
| Greyscale dE 2000 * | 1.8 | 4.5 -150% | 4.49 -149% | 4.8 -167% | 5 -178% |
| Gamma | 2.15 102% | 2.2 100% | 2.49 88% | 2.33 94% | 2.28 96% |
| CCT | 6176 105% | 6836 95% | 7374 88% | 7690 85% | 7575 86% |
| Color Space (Percent of AdobeRGB 1998) (%) | 86.8 | 63.2 -27% | 87 0% | 58.8 -32% | 62.3 -28% |
| Color Space (Percent of sRGB) (%) | 100 | 98 -2% | 100 0% | 91.1 -9% | 96 -4% |
| Contrast (:1) | 1470 | 890 | 1322 | 1438 | |
| Média Total (Programa/Configurações) | -454% /
-195% | -441% /
-214% | -258% /
-118% | -514% /
-233% |
* ... menor é melhor
Exibir tempos de resposta
| ↔ Tempo de resposta preto para branco | ||
|---|---|---|
| 3.2 ms ... ascensão ↗ e queda ↘ combinadas | ↗ 1.2 ms ascensão | 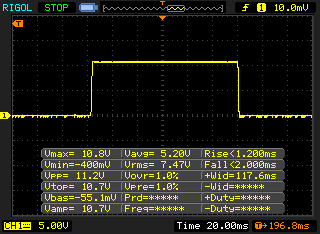 |
| ↘ 2 ms queda | ||
| A tela mostra taxas de resposta muito rápidas em nossos testes e deve ser muito adequada para jogos em ritmo acelerado. Em comparação, todos os dispositivos testados variam de 0.1 (mínimo) a 240 (máximo) ms. » 15 % de todos os dispositivos são melhores. Isso significa que o tempo de resposta medido é melhor que a média de todos os dispositivos testados (19.8 ms). | ||
| ↔ Tempo de resposta 50% cinza a 80% cinza | ||
| 2.8 ms ... ascensão ↗ e queda ↘ combinadas | ↗ 1.2 ms ascensão | 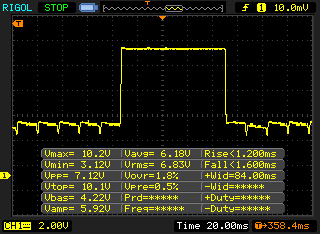 |
| ↘ 1.6 ms queda | ||
| A tela mostra taxas de resposta muito rápidas em nossos testes e deve ser muito adequada para jogos em ritmo acelerado. Em comparação, todos os dispositivos testados variam de 0.165 (mínimo) a 636 (máximo) ms. » 12 % de todos os dispositivos são melhores. Isso significa que o tempo de resposta medido é melhor que a média de todos os dispositivos testados (31 ms). | ||
Cintilação da tela / PWM (modulação por largura de pulso)
| Tela tremeluzindo/PWM detectado | 240.9 Hz | ≤ 50 % configuração de brilho | 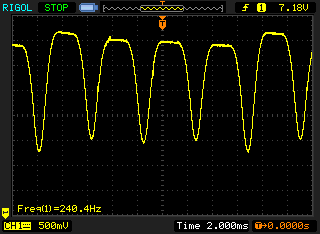 |
A luz de fundo da tela pisca em 240.9 Hz (pior caso, por exemplo, utilizando PWM) Cintilação detectada em uma configuração de brilho de 50 % e abaixo. Não deve haver cintilação ou PWM acima desta configuração de brilho. A frequência de 240.9 Hz é relativamente baixa, portanto, usuários sensíveis provavelmente notarão cintilação e sentirão fadiga ocular na configuração de brilho indicada e abaixo. [pwm_comparison] Em comparação: 52 % de todos os dispositivos testados não usam PWM para escurecer a tela. Se PWM foi detectado, uma média de 7781 (mínimo: 5 - máximo: 343500) Hz foi medida. | |||
| PCMark 8 Home Score Accelerated v2 | 3684 pontos | |
| PCMark 8 Work Score Accelerated v2 | 4558 pontos | |
| PCMark 10 Score | 5296 pontos | |
Ajuda | ||
| Dell Precision 5540 SK hynix PC400 512 GB | Dell XPS 15 7590 i5 iGPU FHD Toshiba XG6 KXG60ZNV512G | MSI P65 Creator 9SF-657 2x Samsung SSD PM981 MZVLB512HAJQ (RAID 0) | Lenovo ThinkPad P1 2019-20QT000RGE WDC PC SN720 SDAQNTW-512G | HP ZBook Studio G5-4QH10EA Samsung SSD PM981 MZVLB512HAJQ | Média SK hynix PC400 512 GB | |
|---|---|---|---|---|---|---|
| CrystalDiskMark 5.2 / 6 | 23% | 65% | 43% | 5% | 5% | |
| Write 4K (MB/s) | 98 | 93.6 -4% | 105.6 8% | 162.2 66% | 102.7 5% | 103.1 ? 5% |
| Read 4K (MB/s) | 41.25 | 41.87 2% | 46.32 12% | 43.71 6% | 38.32 -7% | 41.2 ? 0% |
| Write Seq (MB/s) | 1295 | 1698 31% | 2910 125% | 2441 88% | 1417 9% | 1341 ? 4% |
| Read Seq (MB/s) | 1441 | 1978 37% | 2820 96% | 1753 22% | 1289 -11% | 1668 ? 16% |
| Write 4K Q32T1 (MB/s) | 429.2 | 383.1 -11% | 545 27% | 397.6 -7% | 278.9 -35% | 411 ? -4% |
| Read 4K Q32T1 (MB/s) | 400.1 | 326.9 -18% | 632 58% | 520 30% | 348.8 -13% | 377 ? -6% |
| Write Seq Q32T1 (MB/s) | 1366 | 2778 103% | 3349 145% | 2519 84% | 1895 39% | 1387 ? 2% |
| Read Seq Q32T1 (MB/s) | 2201 | 3119 42% | 3333 51% | 3448 57% | 3352 52% | 2748 ? 25% |
| Write 4K Q8T8 (MB/s) | 1381 | 1575 | ||||
| Read 4K Q8T8 (MB/s) | 1371 | 1607 | ||||
| AS SSD | 28% | 56% | 58% | 48% | 4% | |
| Seq Read (MB/s) | 1743 | 2357 35% | 2860 64% | 2980 71% | 2379 36% | 2198 ? 26% |
| Seq Write (MB/s) | 930 | 1235 33% | 2604 180% | 2094 125% | 1780 91% | 1075 ? 16% |
| 4K Read (MB/s) | 39.1 | 43.29 11% | 45.15 15% | 45.05 15% | 51 30% | 34.5 ? -12% |
| 4K Write (MB/s) | 92.1 | 99.7 8% | 100.2 9% | 155.4 69% | 109.5 19% | 95.9 ? 4% |
| 4K-64 Read (MB/s) | 956 | 1020 7% | 1428 49% | 1291 35% | 1184 24% | 973 ? 2% |
| 4K-64 Write (MB/s) | 863 | 1502 74% | 1401 62% | 1506 75% | 1725 100% | 899 ? 4% |
| Access Time Read * (ms) | 0.074 | 0.07 5% | 0.049 34% | 0.064 14% | 0.057 23% | 0.082 ? -11% |
| Access Time Write * (ms) | 0.053 | 0.039 26% | 0.037 30% | 0.024 55% | 0.034 36% | 0.053 ? -0% |
| Score Read (Points) | 1170 | 1299 11% | 1759 50% | 1634 40% | 1472 26% | 1228 ? 5% |
| Score Write (Points) | 1048 | 1726 65% | 1762 68% | 1871 79% | 2013 92% | 1102 ? 5% |
| Score Total (Points) | 2781 | 3640 31% | 4411 59% | 4300 55% | 4217 52% | 2905 ? 4% |
| Copy ISO MB/s (MB/s) | 2145 | 2015 | 1989 | 1701 ? | ||
| Copy Program MB/s (MB/s) | 565 | 597 | 457 | 346 ? | ||
| Copy Game MB/s (MB/s) | 1320 | 1449 | 1121 | 1050 ? | ||
| Média Total (Programa/Configurações) | 26% /
26% | 61% /
60% | 51% /
52% | 27% /
30% | 5% /
4% |
* ... menor é melhor

| 3DMark 06 Standard Score | 36376 pontos | |
| 3DMark Vantage P Result | 39269 pontos | |
| 3DMark 11 Performance | 11695 pontos | |
| 3DMark Cloud Gate Standard Score | 28401 pontos | |
| 3DMark Fire Strike Score | 7320 pontos | |
| 3DMark Time Spy Score | 3356 pontos | |
Ajuda | ||
| The Witcher 3 - 1920x1080 Ultra Graphics & Postprocessing (HBAO+) | |
| MSI P65 Creator 9SF-657 | |
| Média da turma Workstation (26.3 - 91.7, n=3, últimos 2 anos) | |
| Dell XPS 15 7590 9980HK GTX 1650 | |
| Média NVIDIA Quadro T2000 Max-Q (32.4 - 33.4, n=2) | |
| Dell Precision 5540 | |
| Lenovo ThinkPad P1 2019-20QT000RGE | |
| HP ZBook Studio G5-4QH10EA | |
| BioShock Infinite - 1920x1080 Ultra Preset, DX11 (DDOF) | |
| MSI P65 Creator 9SF-657 | |
| Dell Precision 5540 | |
| Média NVIDIA Quadro T2000 Max-Q (n=1) | |
| Lenovo ThinkPad P1 2019-20QT000RGE | |
| Dell XPS 15 7590 9980HK GTX 1650 | |
| HP ZBook Studio G5-4QH10EA | |
| Dell XPS 15 7590 i5 iGPU FHD | |
| Anno 1800 | |
| 1920x1080 High Graphics Quality (DX11) | |
| Lenovo ThinkPad P1 2019-20QT000RGE | |
| Dell Precision 5540 | |
| Média NVIDIA Quadro T2000 Max-Q (n=1) | |
| 1920x1080 Medium Graphics Quality (DX11) | |
| Lenovo ThinkPad P1 2019-20QT000RGE | |
| Dell Precision 5540 | |
| Média NVIDIA Quadro T2000 Max-Q (n=1) | |
| 1280x720 Low Graphics Quality (DX11) | |
| Lenovo ThinkPad P1 2019-20QT000RGE | |
| Média NVIDIA Quadro T2000 Max-Q (n=1) | |
| Dell Precision 5540 | |
| baixo | média | alto | ultra | 4K | |
|---|---|---|---|---|---|
| BioShock Infinite (2013) | 79.5 | ||||
| The Witcher 3 (2015) | 32.4 | ||||
| Dota 2 Reborn (2015) | 145 | 132 | 118 | 108 | 43.4 |
| Final Fantasy XV Benchmark (2018) | 41.7 | 28.8 | 12.3 | ||
| X-Plane 11.11 (2018) | 101 | 87 | 73 | ||
| Anno 1800 (2019) | 27.86 | 12.9 | 9.8 |
Barulho
| Ocioso |
| 28.6 / 28.6 / 28.6 dB |
| Carga |
| 33.3 / 38 dB |
 | ||
30 dB silencioso 40 dB(A) audível 50 dB(A) ruidosamente alto |
||
min: | ||
(-) A temperatura máxima no lado superior é 46.2 °C / 115 F, em comparação com a média de 38.2 °C / 101 F , variando de 22.2 a 69.8 °C para a classe Workstation.
(-) A parte inferior aquece até um máximo de 45.7 °C / 114 F, em comparação com a média de 41.1 °C / 106 F
(+) Em uso inativo, a temperatura média para o lado superior é 26.5 °C / 80 F, em comparação com a média do dispositivo de 32 °C / ### class_avg_f### F.
(-) Jogando The Witcher 3, a temperatura média para o lado superior é 38.2 °C / 101 F, em comparação com a média do dispositivo de 32 °C / ## #class_avg_f### F.
(+) Os apoios para as mãos e o touchpad são mais frios que a temperatura da pele, com um máximo de 31.6 °C / 88.9 F e, portanto, são frios ao toque.
(-) A temperatura média da área do apoio para as mãos de dispositivos semelhantes foi 27.8 °C / 82 F (-3.8 °C / -6.9 F).
Dell Precision 5540 análise de áudio
(±) | o volume do alto-falante é médio, mas bom (###valor### dB)
Graves 100 - 315Hz
(-) | quase nenhum baixo - em média 16.6% menor que a mediana
(±) | a linearidade dos graves é média (7.2% delta para a frequência anterior)
Médios 400 - 2.000 Hz
(+) | médios equilibrados - apenas 3.8% longe da mediana
(+) | médios são lineares (6.6% delta para frequência anterior)
Altos 2 - 16 kHz
(+) | agudos equilibrados - apenas 3.3% longe da mediana
(+) | os máximos são lineares (6.6% delta da frequência anterior)
Geral 100 - 16.000 Hz
(±) | a linearidade do som geral é média (16% diferença em relação à mediana)
Comparado com a mesma classe
» 40% de todos os dispositivos testados nesta classe foram melhores, 9% semelhantes, 51% piores
» O melhor teve um delta de 7%, a média foi 17%, o pior foi 35%
Comparado com todos os dispositivos testados
» 25% de todos os dispositivos testados foram melhores, 5% semelhantes, 70% piores
» O melhor teve um delta de 4%, a média foi 24%, o pior foi 134%
Apple MacBook 12 (Early 2016) 1.1 GHz análise de áudio
(+) | os alto-falantes podem tocar relativamente alto (###valor### dB)
Graves 100 - 315Hz
(±) | graves reduzidos - em média 11.3% menor que a mediana
(±) | a linearidade dos graves é média (14.2% delta para a frequência anterior)
Médios 400 - 2.000 Hz
(+) | médios equilibrados - apenas 2.4% longe da mediana
(+) | médios são lineares (5.5% delta para frequência anterior)
Altos 2 - 16 kHz
(+) | agudos equilibrados - apenas 2% longe da mediana
(+) | os máximos são lineares (4.5% delta da frequência anterior)
Geral 100 - 16.000 Hz
(+) | o som geral é linear (10.2% diferença em relação à mediana)
Comparado com a mesma classe
» 7% de todos os dispositivos testados nesta classe foram melhores, 2% semelhantes, 91% piores
» O melhor teve um delta de 5%, a média foi 18%, o pior foi 53%
Comparado com todos os dispositivos testados
» 5% de todos os dispositivos testados foram melhores, 1% semelhantes, 94% piores
» O melhor teve um delta de 4%, a média foi 24%, o pior foi 134%
| desligado | |
| Ocioso | |
| Carga |
|
Key:
min: | |
| Dell Precision 5540 i9-9980HK, Quadro T2000 Max-Q, SK hynix PC400 512 GB, OLED, 3840x2160, 15.6" | Dell XPS 15 7590 i5 iGPU FHD i5-9300H, UHD Graphics 630, Toshiba XG6 KXG60ZNV512G, IPS, 1920x1080, 15.6" | MSI P65 Creator 9SF-657 i9-9880H, GeForce RTX 2070 Max-Q, 2x Samsung SSD PM981 MZVLB512HAJQ (RAID 0), IPS, 3840x2160, 15.6" | Lenovo ThinkPad P1 2019-20QT000RGE i7-9850H, Quadro T1000 (Laptop), WDC PC SN720 SDAQNTW-512G, IPS LED, 1920x1080, 15.6" | HP ZBook Studio G5-4QH10EA i7-8750H, Quadro P1000, Samsung SSD PM981 MZVLB512HAJQ, IPS LED, 3840x2160, 15.6" | Dell XPS 15 7590 9980HK GTX 1650 i9-9980HK, GeForce GTX 1650 Mobile, Toshiba XG6 KXG60ZNV1T02, OLED, 3840x2160, 15.6" | Média NVIDIA Quadro T2000 Max-Q | Média da turma Workstation | |
|---|---|---|---|---|---|---|---|---|
| Power Consumption | 35% | -38% | -33% | 10% | -6% | -3% | -20% | |
| Idle Minimum * (Watt) | 7.4 | 3.79 49% | 9.4 -27% | 13.7 -85% | 6.8 8% | 6.2 16% | 6.5 ? 12% | 8.94 ? -21% |
| Idle Average * (Watt) | 12.1 | 6.9 43% | 17.4 -44% | 17.5 -45% | 11.3 7% | 9.6 21% | 11.6 ? 4% | 13.8 ? -14% |
| Idle Maximum * (Watt) | 12.7 | 9.2 28% | 19.6 -54% | 20.9 -65% | 14.3 -13% | 21.2 -67% | 15.5 ? -22% | 17.5 ? -38% |
| Load Average * (Watt) | 98 | 62 37% | 103 -5% | 77.2 21% | 78 20% | 104.3 -6% | 106 ? -8% | 95 ? 3% |
| Witcher 3 ultra * (Watt) | 89.9 | 64 29% | 91.7 -2% | |||||
| Load Maximum * (Watt) | 135.1 | 108 20% | 216 -60% | 123.7 8% | 126 7% | 135.3 -0% | 134.6 ? -0% | 175.2 ? -30% |
* ... menor é melhor
| Dell Precision 5540 i9-9980HK, Quadro T2000 Max-Q, 97 Wh | Dell XPS 15 7590 i5 iGPU FHD i5-9300H, UHD Graphics 630, 97 Wh | MSI P65 Creator 9SF-657 i9-9880H, GeForce RTX 2070 Max-Q, 82 Wh | Lenovo ThinkPad P1 2019-20QT000RGE i7-9850H, Quadro T1000 (Laptop), 80 Wh | HP ZBook Studio G5-4QH10EA i7-8750H, Quadro P1000, 97 Wh | Dell XPS 15 7590 9980HK GTX 1650 i9-9980HK, GeForce GTX 1650 Mobile, 97 Wh | Média da turma Workstation | |
|---|---|---|---|---|---|---|---|
| Duração da bateria | 50% | -31% | -7% | 14% | 32% | 15% | |
| Reader / Idle (h) | 15 | 9.6 -36% | 17.3 15% | 15.2 1% | 26.1 ? 74% | ||
| H.264 (h) | 10.6 | 17.6 66% | 9.3 -12% | 9.1 -14% | 9.51 ? -10% | ||
| WiFi v1.3 (h) | 7.7 | 14.1 83% | 6 -22% | 8.9 16% | 9.7 26% | 7.8 1% | 8.53 ? 11% |
| Load (h) | 1.7 | 1.7 0% | 1.1 -35% | 1.3 -24% | 2.2 29% | 3.3 94% | 1.429 ? -16% |
Pro
Contra
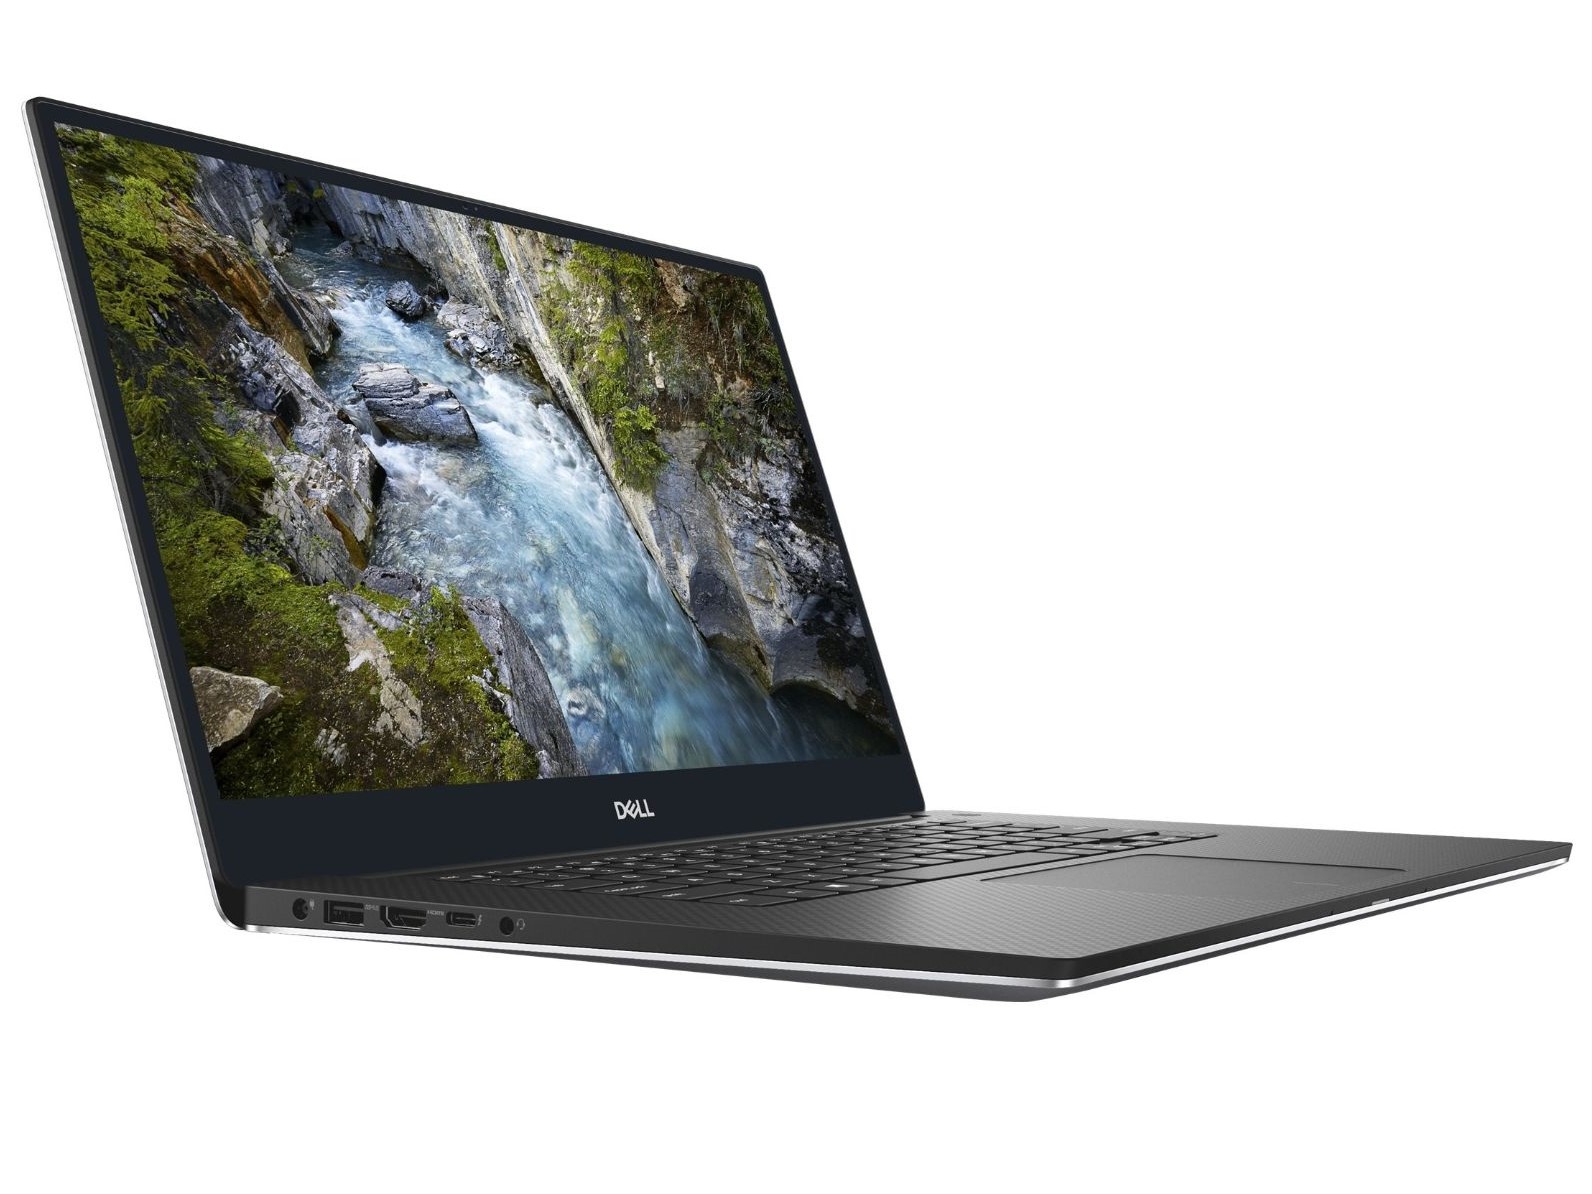
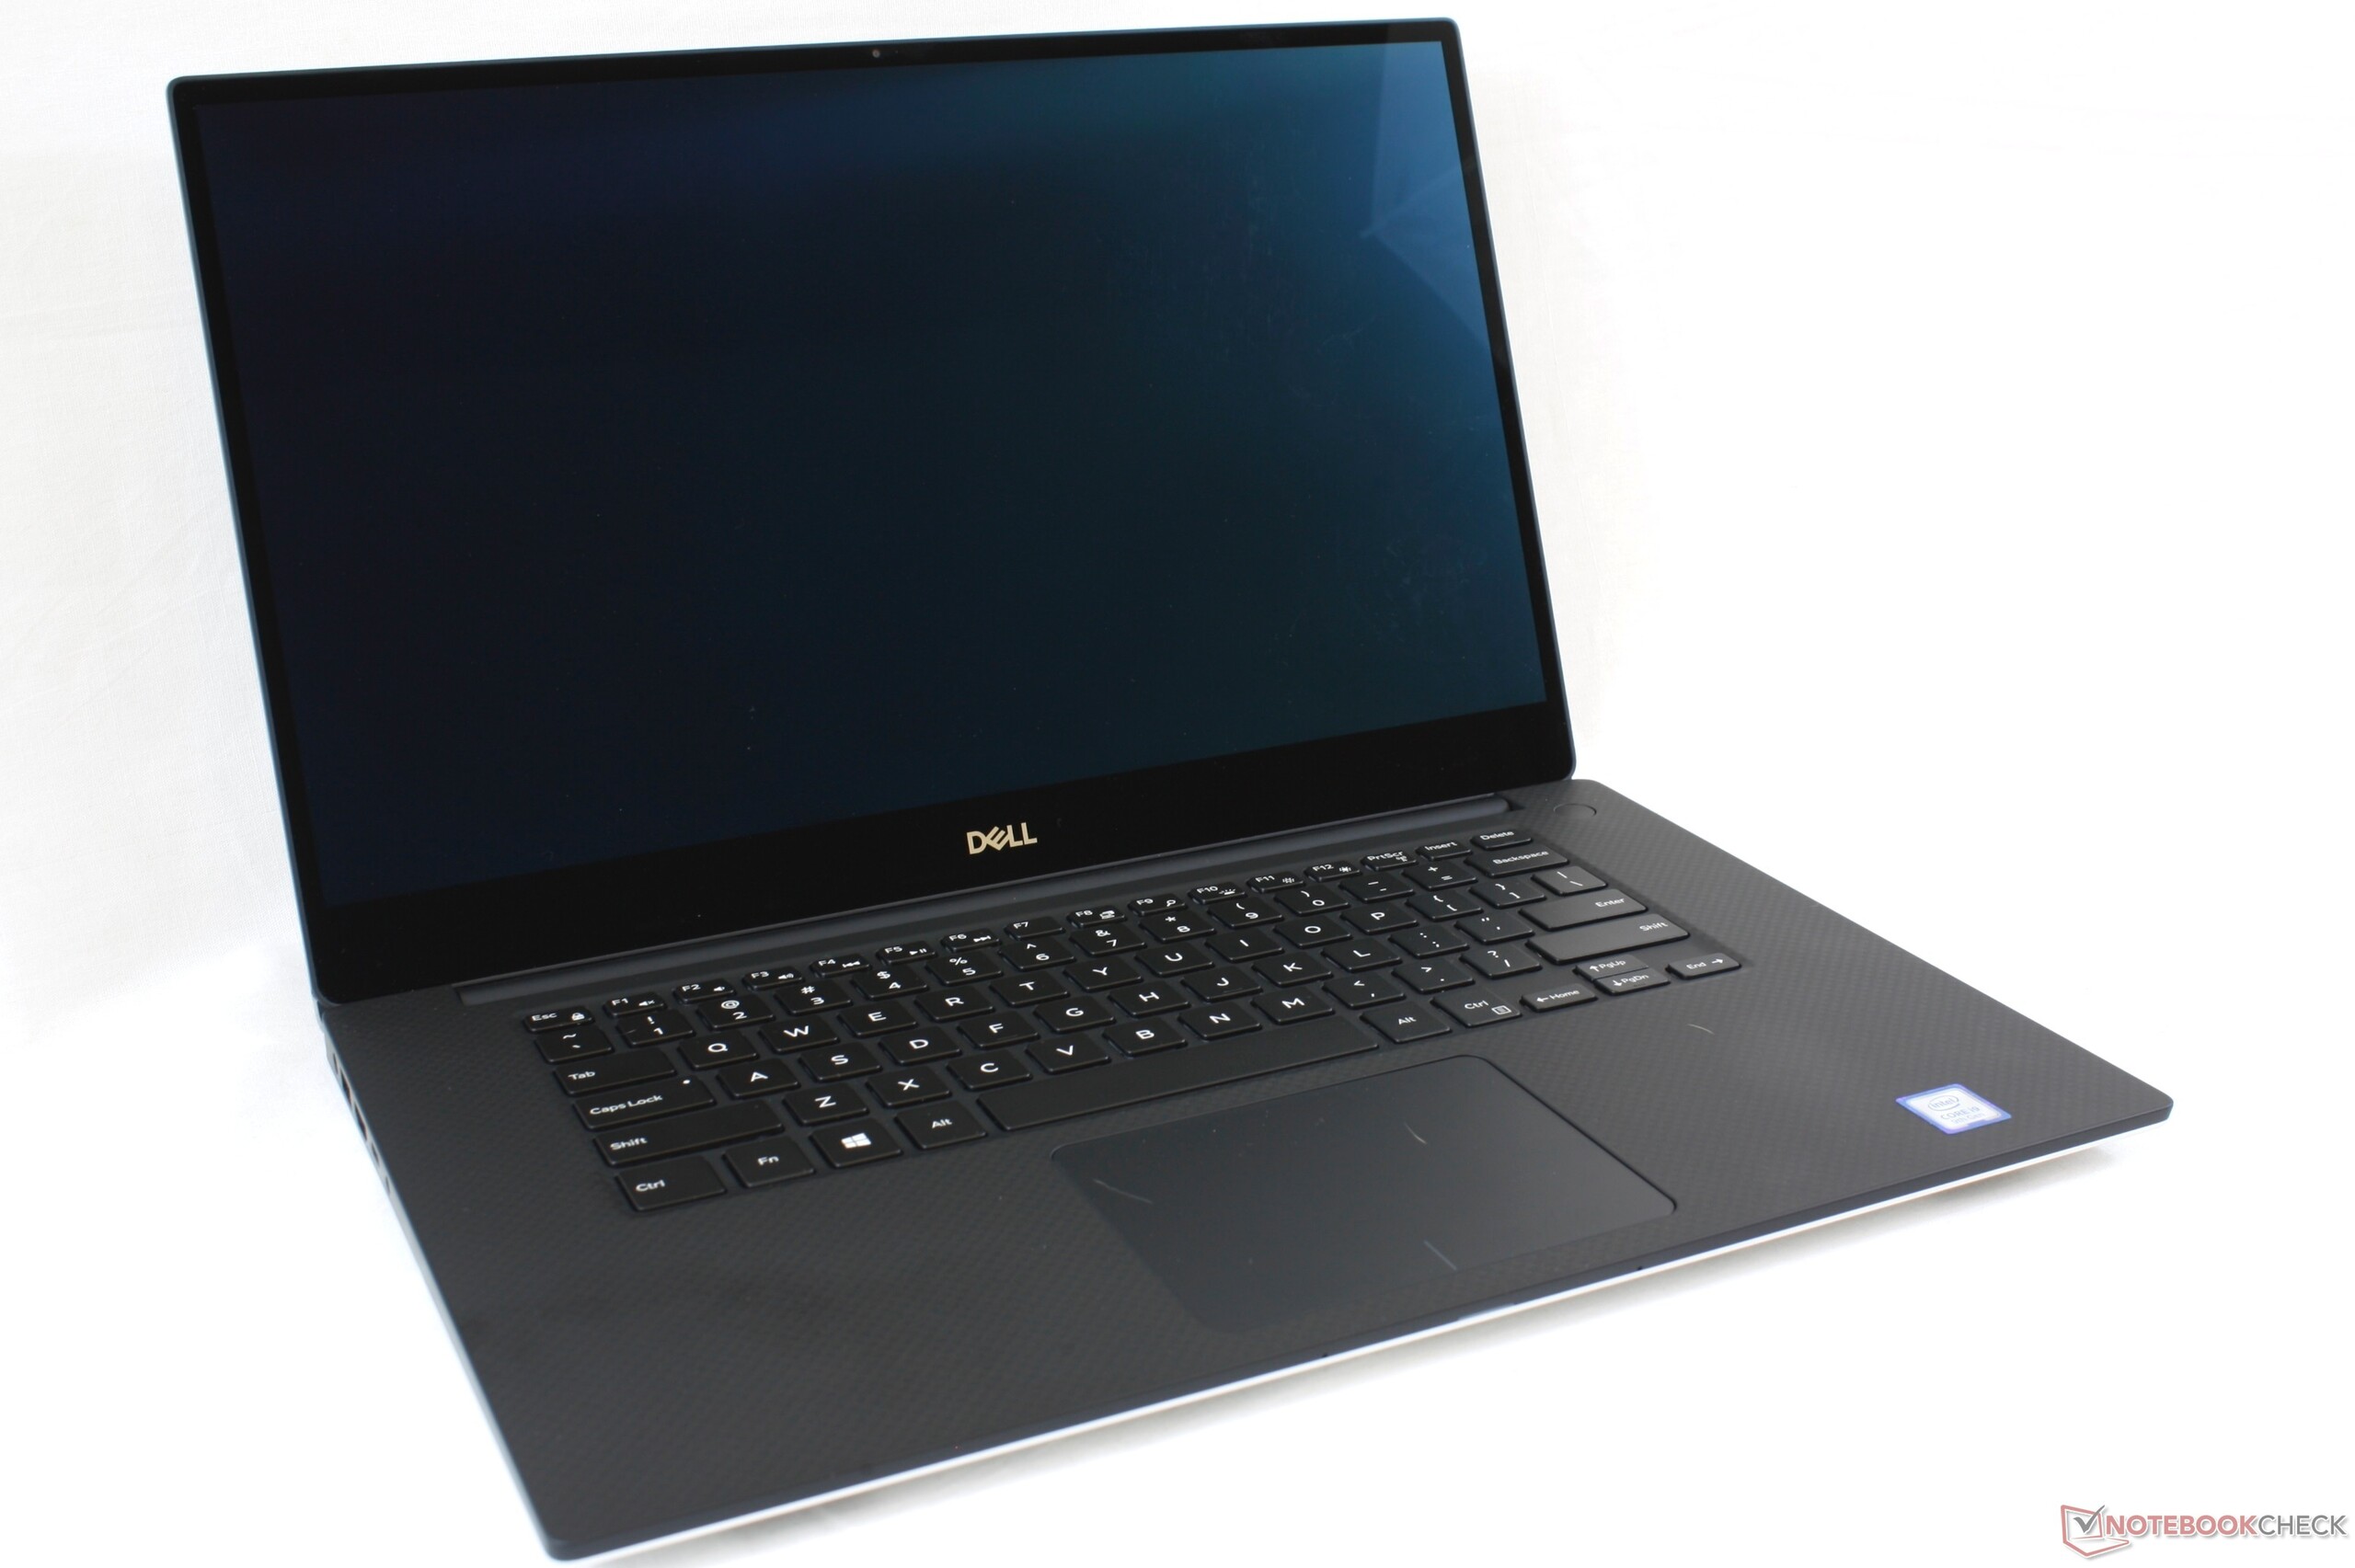
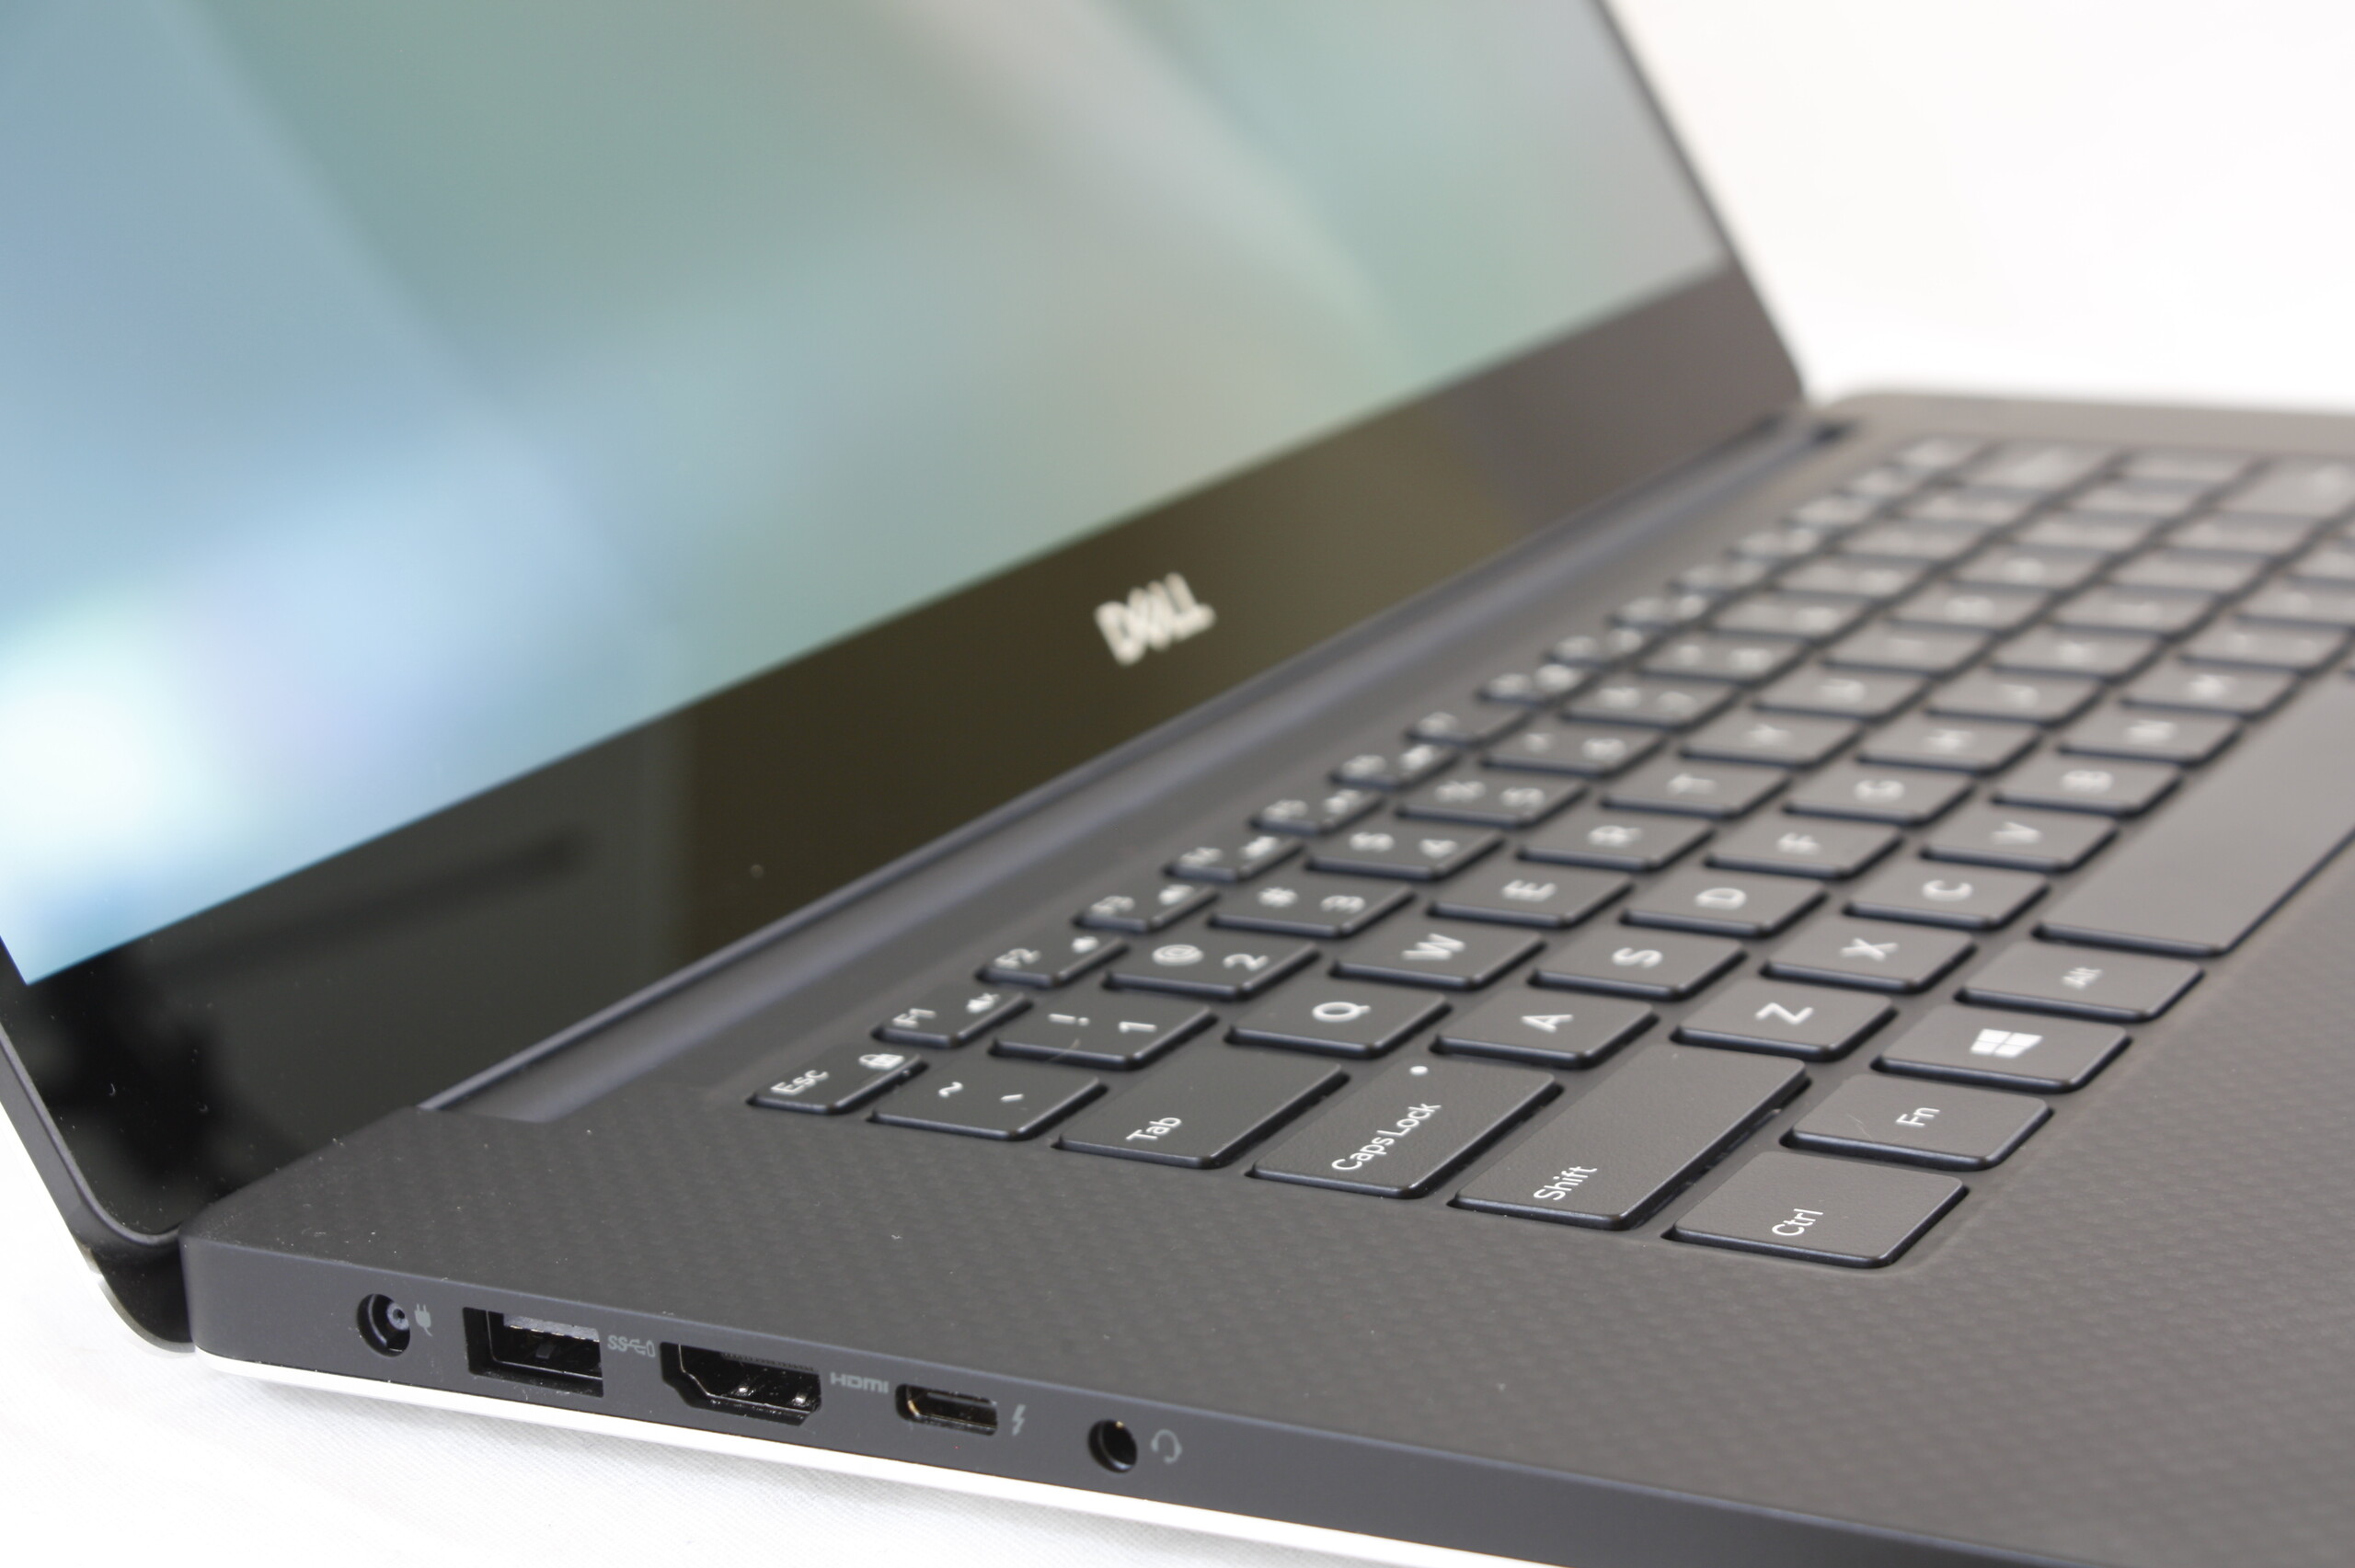
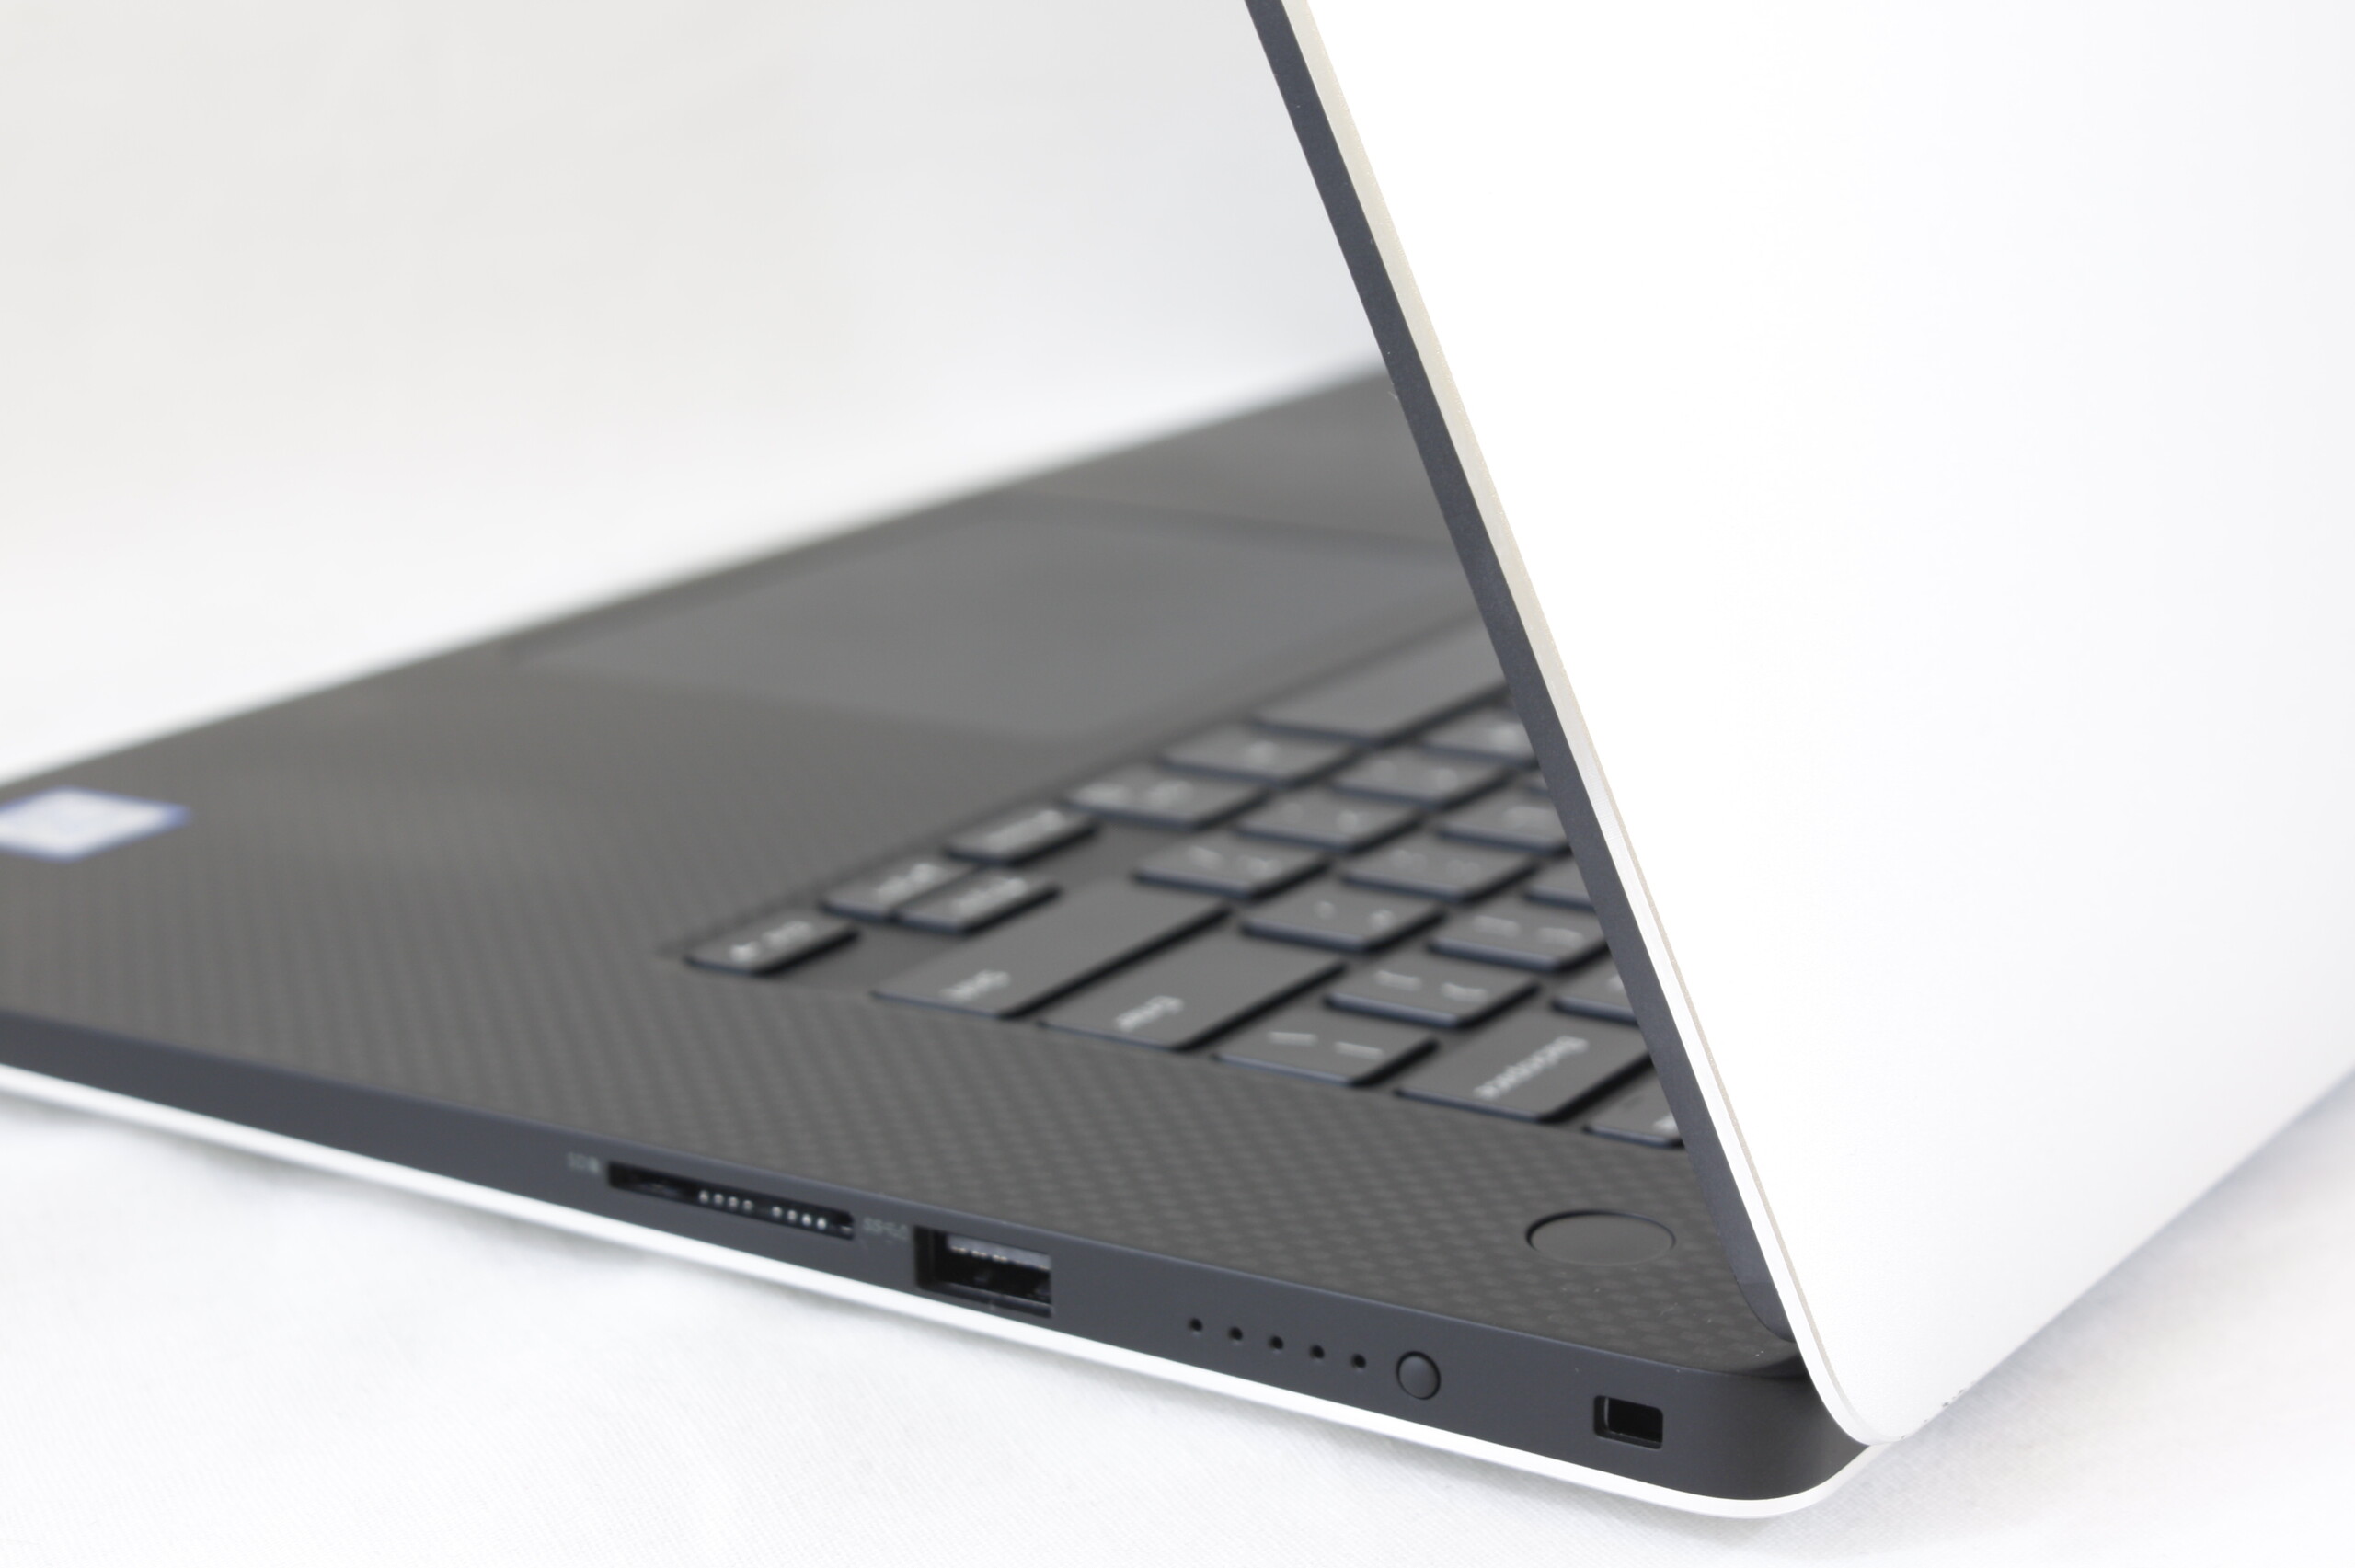
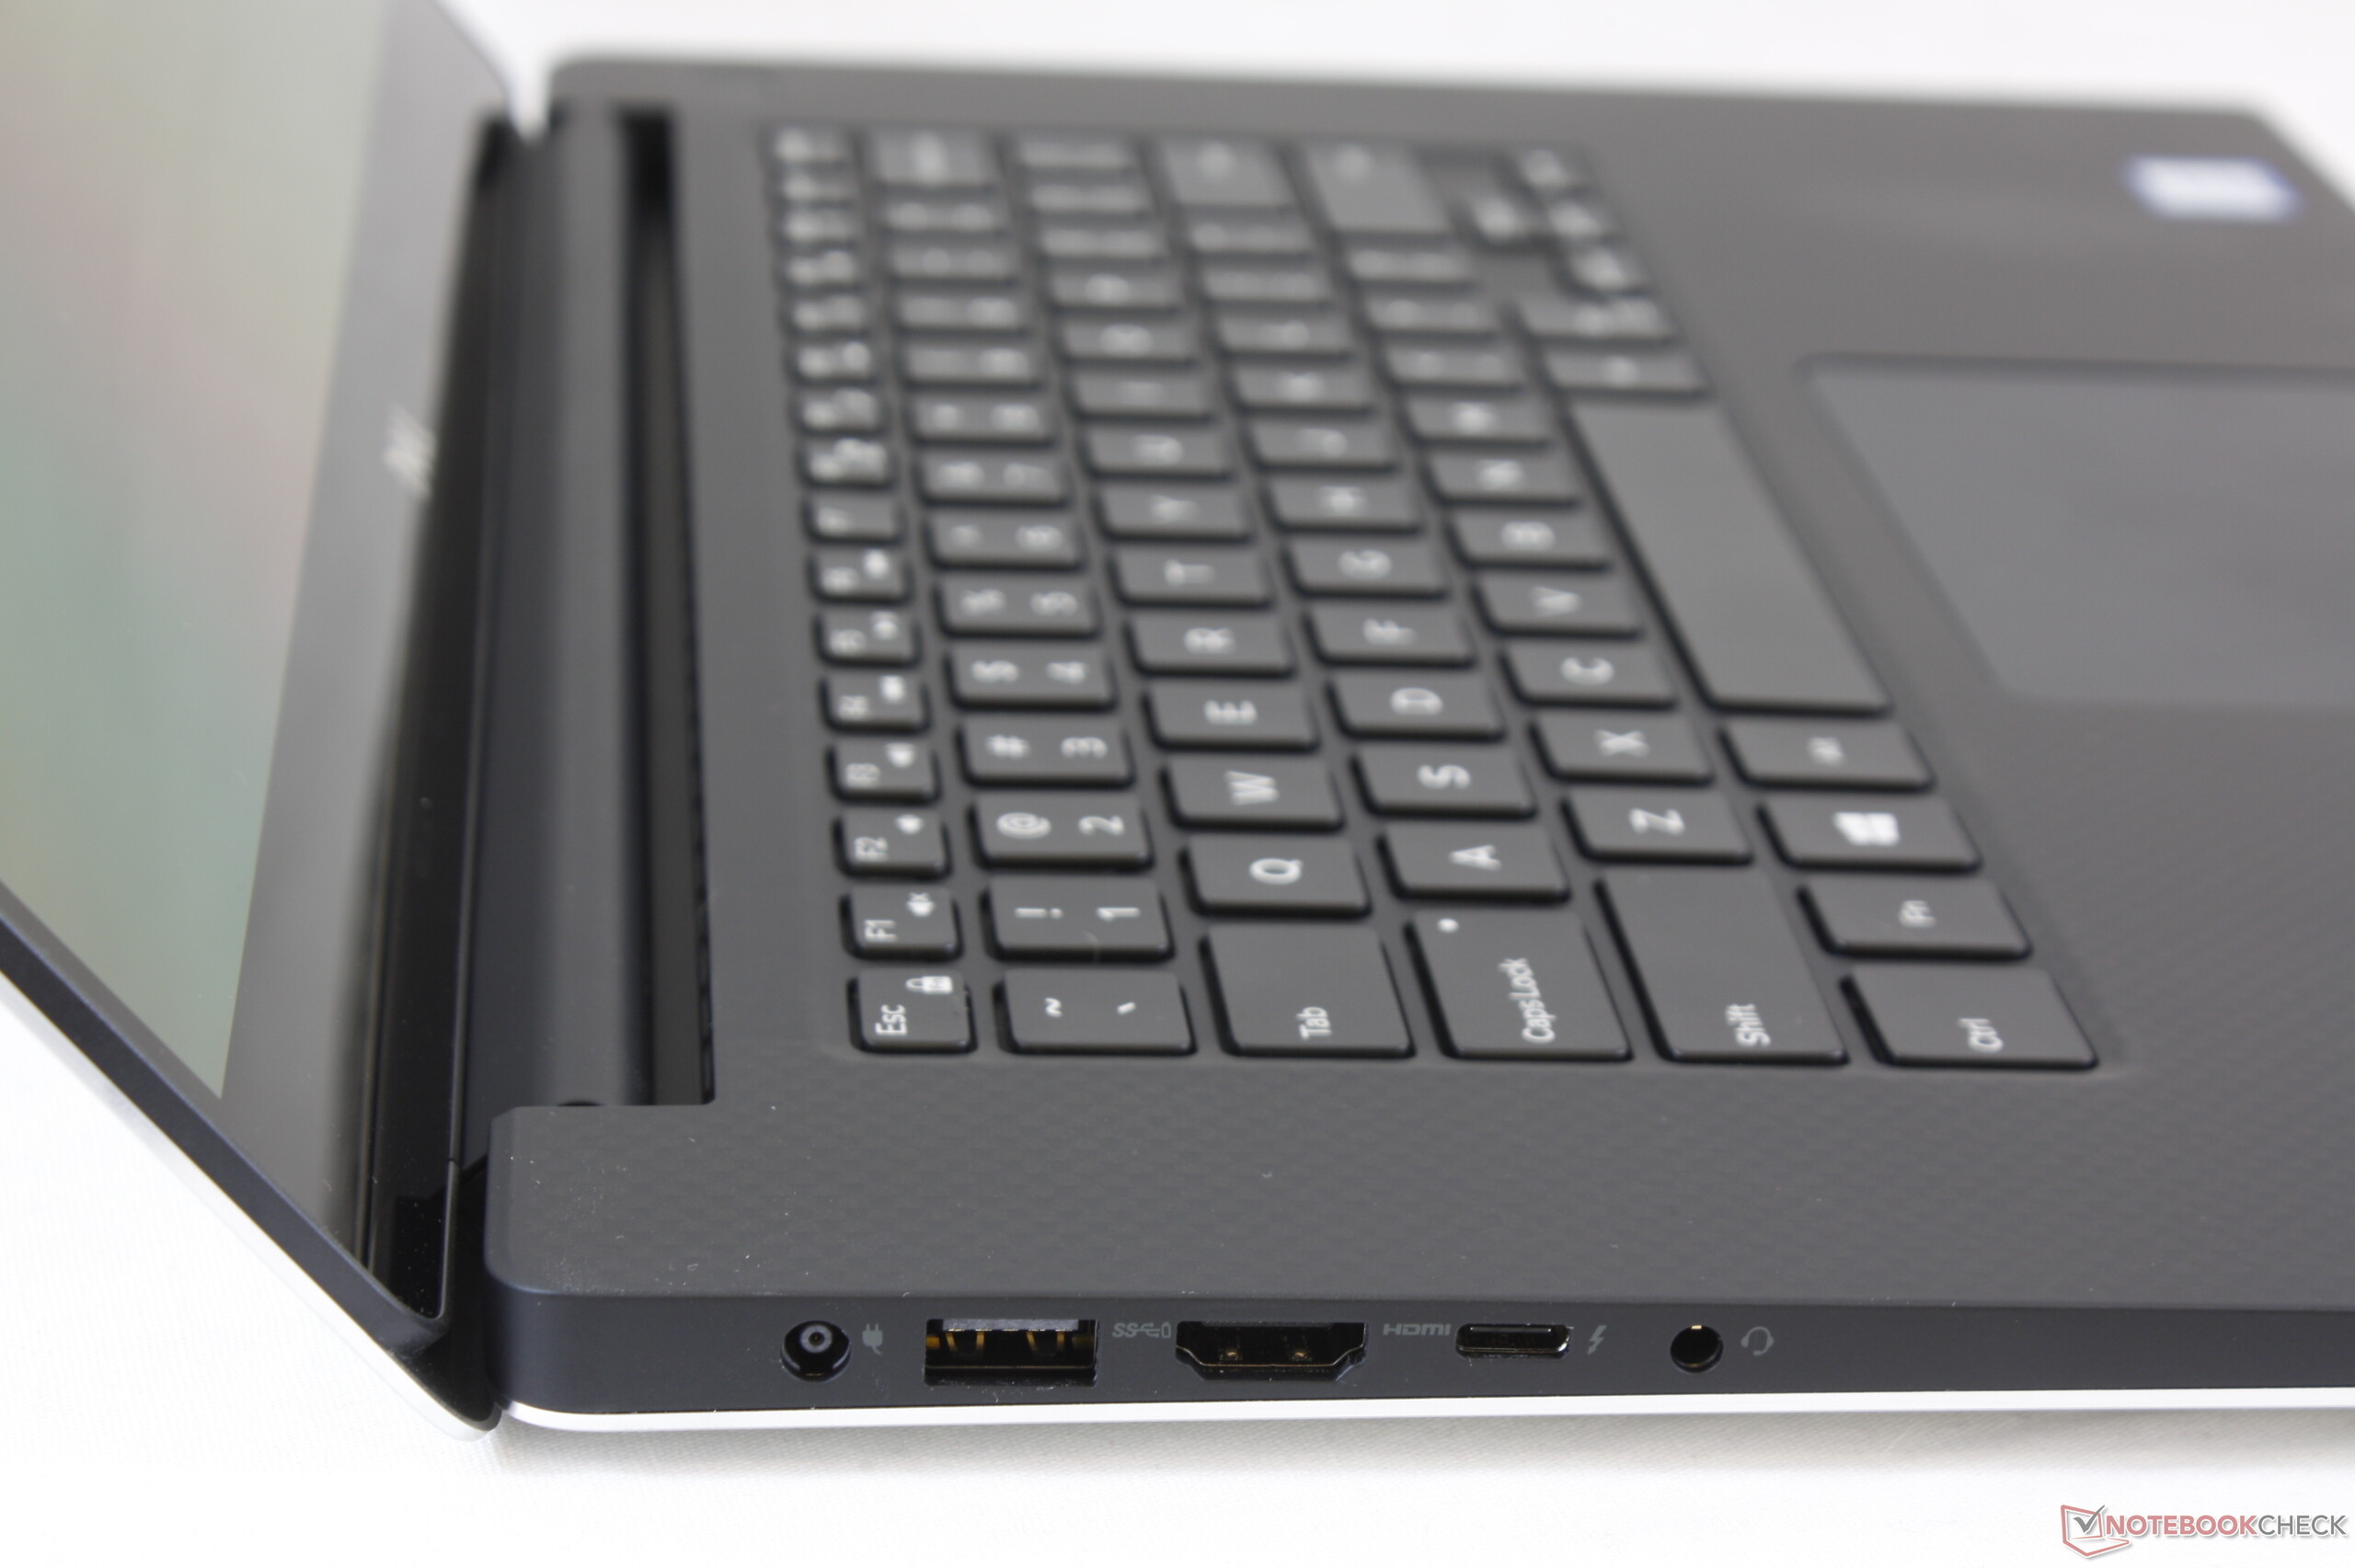
Em nossa análise, o Dell Precision 5540 provou ser um workstation capaz. Embora o chassi se baseia no mesmo design e, portanto, com a mesma alta qualidade do XPS 15, também é o motivo da seleção de portas insuficiente. Dito isto, a porta Thunderbolt 3 oferece muita flexibilidade e é capaz de compensar as portas ausentes com um adaptador adequado.
O Dell Precision 5540 é uma boa opção para usuários que estão no mercado por um dispositivo com desempenho intermediário e uma tela de alta resolução. Como de costume, o chassi é sólido e a duração da bateria é boa.
Infelizmente, a CPU não funciona tão bem quanto o esperado. Embora a Nvidia Quadro T2000 atinja o nível de desempenho esperado, o processador não consegue acompanhar. O desempenho tende a cair constantemente para ser 15% mais lento no final, do que o desempenho máximo inicial em nosso circuito de testes. Embora a tela OLED 4K pareça fantástica, ela cem com um custo de uma duração da bateria significativamente mais curta.
Dell Precision 5540
- 08/31/2022 v7 (old)
Mike Wobker
Price comparison
