Breve Análise do Lenovo IdeaPad Gaming 3i 15IMH05: Core i5 com afogamento forte
Avaliação | Data | Modelo | Peso | Altura | Size | Resolução | Preço |
|---|---|---|---|---|---|---|---|
| 78.4 % v7 (old) | 07/2020 | Lenovo IdeaPad Gaming 3i 15IMH05 i5-10300H, GeForce GTX 1650 Mobile | 2.2 kg | 24.9 mm | 15.60" | 1920x1080 | |
| 80.4 % v6 (old) | 07/2019 | Asus TUF FX505DT-EB73 R7 3750H, GeForce GTX 1650 Mobile | 2.2 kg | 26.8 mm | 15.60" | 1920x1080 | |
| 79.3 % v7 (old) | 10/2019 | Dell G3 3590 i5-9300H, GeForce GTX 1650 Mobile | 2.5 kg | 21.6 mm | 15.60" | 1920x1080 | |
| 77.6 % v7 (old) | 01/2020 | MSI GF63 Thin 9SC i5-9300H, GeForce GTX 1650 Max-Q | 1.8 kg | 22 mm | 15.60" | 1920x1080 | |
| 75.4 % v7 (old) | HP Pavilion Gaming 15-ec0002ng R5 3550H, GeForce GTX 1050 Mobile | 2.3 kg | 23.5 mm | 15.60" | 1920x1080 | ||
| 78.8 % v7 (old) | 02/2020 | MSI Alpha 15 A3DDK-034 R7 3750H, Radeon RX 5500M | 2.3 kg | 27.5 mm | 15.60" | 1920x1080 | |
| 79.8 % v7 (old) | 07/2020 | Acer Nitro 5 AN515-44-R5FT R5 4600H, GeForce GTX 1650 Ti Mobile | 2.2 kg | 24 mm | 15.60" | 1920x1080 |

| Networking | |
| iperf3 transmit AX12 | |
| Acer Nitro 5 AN515-44-R5FT | |
| MSI GF63 Thin 9SC | |
| Média Intel Wireless-AC 9560 (309 - 1350, n=182) | |
| HP Pavilion Gaming 15-ec0002ng | |
| MSI Alpha 15 A3DDK-034 | |
| Lenovo IdeaPad Gaming 3i 15IMH05 | |
| Asus TUF FX505DT-EB73 | |
| Lenovo IdeaPad L340-15IRH 81LK00BMGE | |
| Dell G3 3590 | |
| iperf3 receive AX12 | |
| Acer Nitro 5 AN515-44-R5FT | |
| MSI GF63 Thin 9SC | |
| Média Intel Wireless-AC 9560 (288 - 1390, n=183) | |
| MSI Alpha 15 A3DDK-034 | |
| Lenovo IdeaPad Gaming 3i 15IMH05 | |
| HP Pavilion Gaming 15-ec0002ng | |
| Asus TUF FX505DT-EB73 | |
| Dell G3 3590 | |
| Lenovo IdeaPad L340-15IRH 81LK00BMGE | |


| |||||||||||||||||||||||||
iluminação: 70 %
iluminação com acumulador: 300 cd/m²
Contraste: 753:1 (Preto: 0.405 cd/m²)
ΔE ColorChecker Calman: 6.01 | ∀{0.5-29.43 Ø4.73}
calibrated: 5.12
ΔE Greyscale Calman: 3.23 | ∀{0.09-98 Ø4.97}
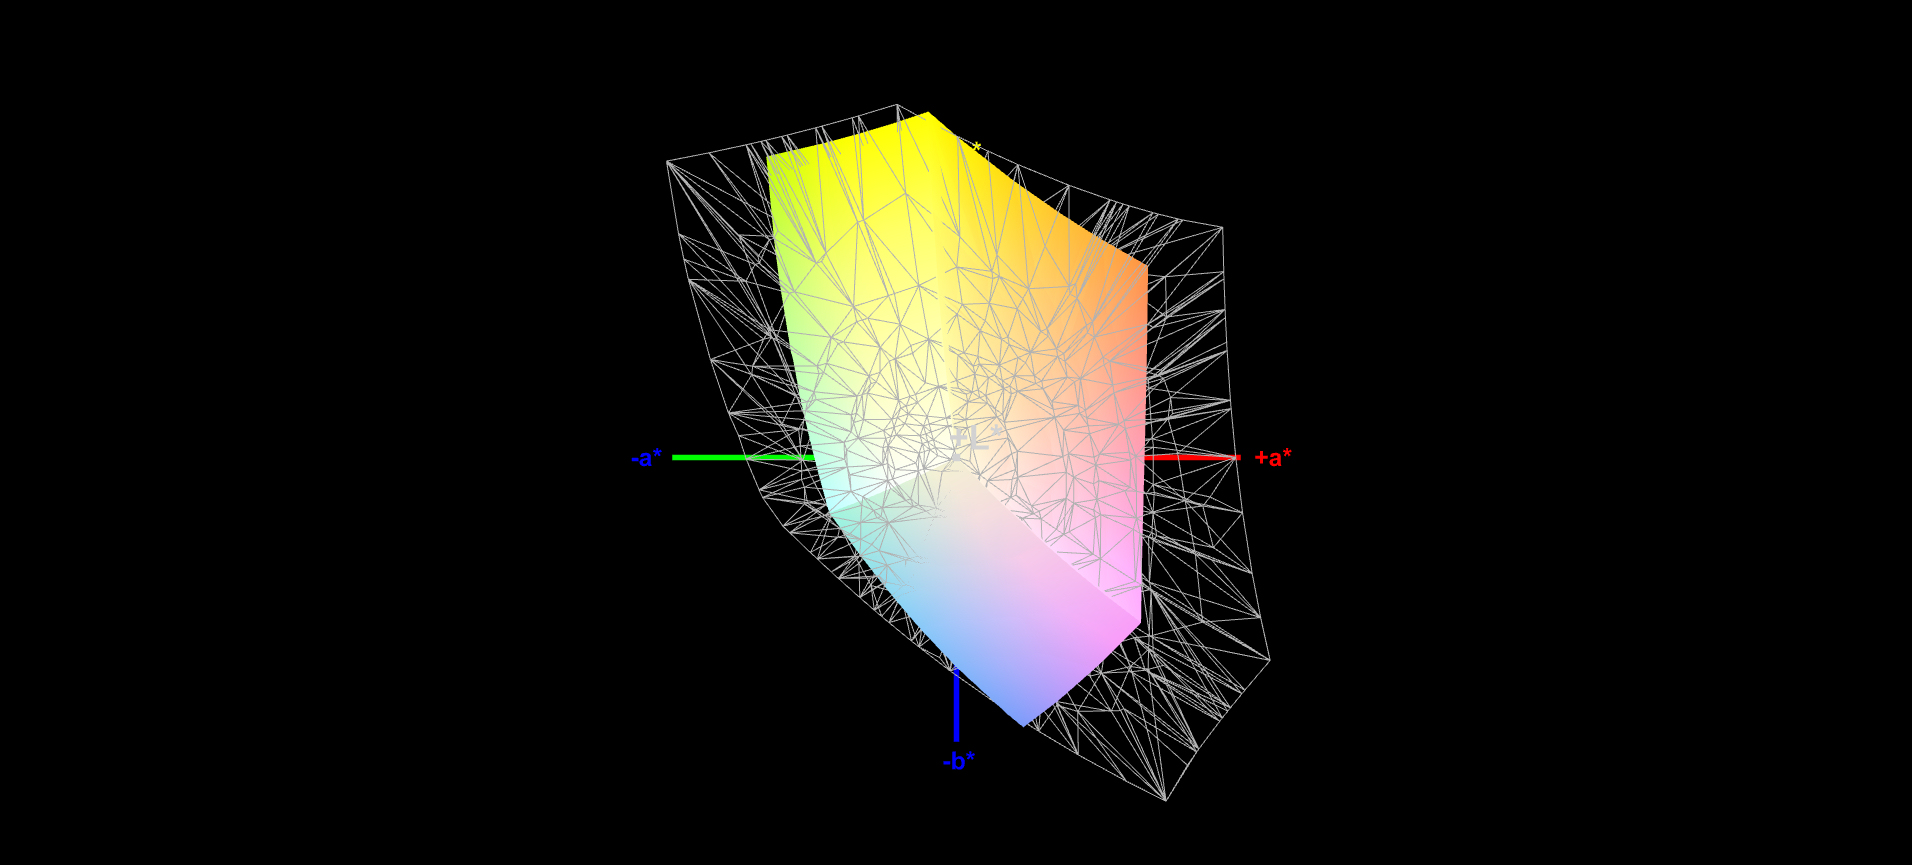
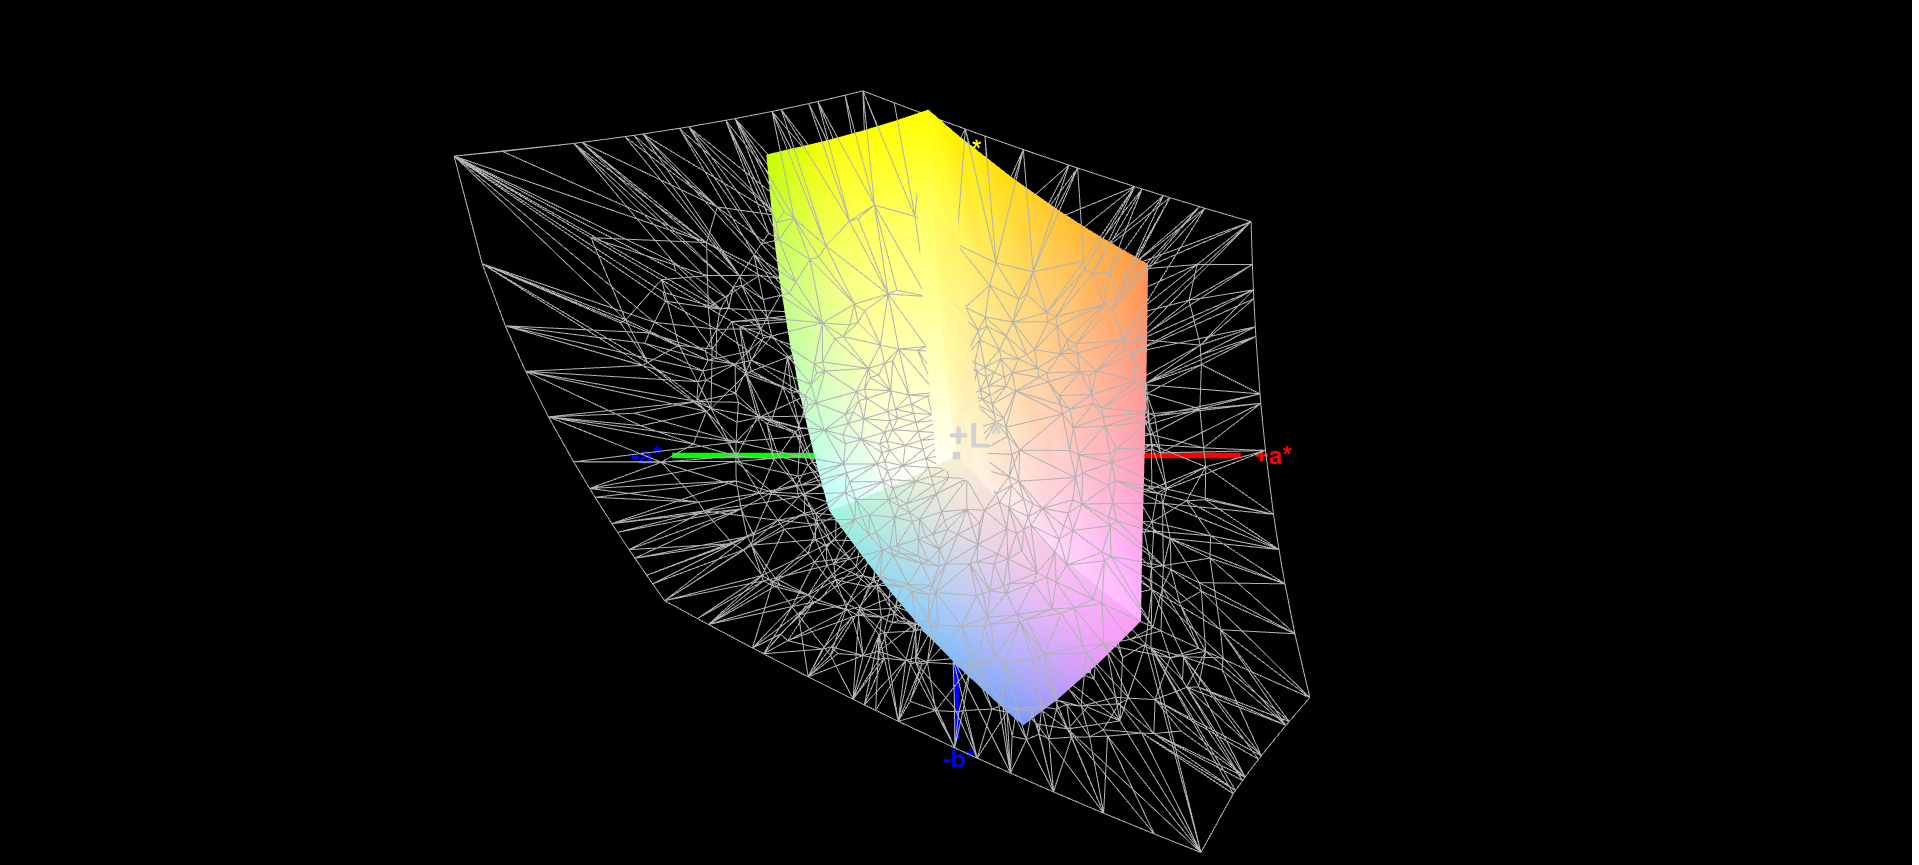
56% sRGB (Argyll 1.6.3 3D)
36% AdobeRGB 1998 (Argyll 1.6.3 3D)
39.3% AdobeRGB 1998 (Argyll 3D)
56.6% sRGB (Argyll 3D)
38.04% Display P3 (Argyll 3D)
Gamma: 2.43
CCT: 6818 K
| Lenovo IdeaPad Gaming 3i 15IMH05 IPS, 1920x1080, 15.6" | Asus TUF FX505DT-EB73 IPS, 1920x1080, 15.6" | Dell G3 3590 IPS, 1920x1080, 15.6" | MSI GF63 Thin 9SC IPS, 1920x1080, 15.6" | HP Pavilion Gaming 15-ec0002ng TN LED, 1920x1080, 15.6" | MSI Alpha 15 A3DDK-034 IPS, 1920x1080, 15.6" | Acer Nitro 5 AN515-44-R5FT IPS, 1920x1080, 15.6" | Lenovo IdeaPad L340-15IRH 81LK00BMGE IPS, 1920x1080, 15.6" | |
|---|---|---|---|---|---|---|---|---|
| Display | 4% | 6% | -1% | 8% | 68% | 8% | 13% | |
| Display P3 Coverage (%) | 38.04 | 39.56 4% | 40.13 5% | 37.76 -1% | 41.22 8% | 66.4 75% | 41.16 8% | 42.81 13% |
| sRGB Coverage (%) | 56.6 | 59.5 5% | 59.8 6% | 56.5 0% | 61.8 9% | 91 61% | 61.8 9% | 63.8 13% |
| AdobeRGB 1998 Coverage (%) | 39.3 | 40.91 4% | 41.47 6% | 39.01 -1% | 42.62 8% | 66.6 69% | 42.56 8% | 44.31 13% |
| Response Times | -42% | -88% | -83% | -32% | 56% | -70% | -82% | |
| Response Time Grey 50% / Grey 80% * (ms) | 25 ? | 30.4 ? -22% | 46 ? -84% | 44.8 ? -79% | 44 ? -76% | 7 ? 72% | 40.8 ? -63% | 45.6 ? -82% |
| Response Time Black / White * (ms) | 17 ? | 27.6 ? -62% | 32.4 ? -91% | 31.6 ? -86% | 15 ? 12% | 10.4 ? 39% | 30 ? -76% | 30.8 ? -81% |
| PWM Frequency (Hz) | 200 ? | 250 ? | 25910 ? | |||||
| Screen | 2% | 11% | 21% | -28% | 29% | 20% | 18% | |
| Brightness middle (cd/m²) | 305 | 286.2 -6% | 276.2 -9% | 260 -15% | 233 -24% | 310 2% | 287 -6% | 275 -10% |
| Brightness (cd/m²) | 294 | 267 -9% | 261 -11% | 249 -15% | 211 -28% | 310 5% | 271 -8% | 253 -14% |
| Brightness Distribution (%) | 70 | 84 20% | 86 23% | 92 31% | 82 17% | 86 23% | 88 26% | 83 19% |
| Black Level * (cd/m²) | 0.405 | 0.33 19% | 0.24 41% | 0.23 43% | 0.405 -0% | 0.29 28% | 0.25 38% | 0.18 56% |
| Contrast (:1) | 753 | 867 15% | 1151 53% | 1130 50% | 575 -24% | 1069 42% | 1148 52% | 1528 103% |
| Colorchecker dE 2000 * | 6.01 | 5.45 9% | 5.56 7% | 4.1 32% | 8.22 -37% | 4.78 20% | 4.77 21% | 5.4 10% |
| Colorchecker dE 2000 max. * | 21.9 | 18.08 17% | 23.45 -7% | 7.93 64% | 18.6 15% | 8.1 63% | 17.15 22% | 21.3 3% |
| Colorchecker dE 2000 calibrated * | 5.12 | 4.47 13% | 5.23 -2% | 3.56 30% | 2.36 54% | 3.73 27% | 4.4 14% | |
| Greyscale dE 2000 * | 3.23 | 5.3 -64% | 2.8 13% | 2.83 12% | 10.13 -214% | 4.78 -48% | 2.7 16% | 3.7 -15% |
| Gamma | 2.43 91% | 2.1 105% | 2.37 93% | 2.53 87% | 2.27 97% | 2.43 91% | 2.115 104% | 2.12 104% |
| CCT | 6818 95% | 7679 85% | 6710 97% | 6158 106% | 11323 57% | 7739 84% | 7187 90% | 6376 102% |
| Color Space (Percent of AdobeRGB 1998) (%) | 36 | 37.6 4% | 37.8 5% | 36 0% | 39 8% | 59 64% | 43 19% | 40.8 13% |
| Color Space (Percent of sRGB) (%) | 56 | 59.1 6% | 59 5% | 56 0% | 62 11% | 91 63% | 61 9% | 63.6 14% |
| Média Total (Programa/Configurações) | -12% /
-3% | -24% /
-3% | -21% /
4% | -17% /
-21% | 51% /
40% | -14% /
6% | -17% /
4% |
* ... menor é melhor
Exibir tempos de resposta
| ↔ Tempo de resposta preto para branco | ||
|---|---|---|
| 17 ms ... ascensão ↗ e queda ↘ combinadas | ↗ 9 ms ascensão | 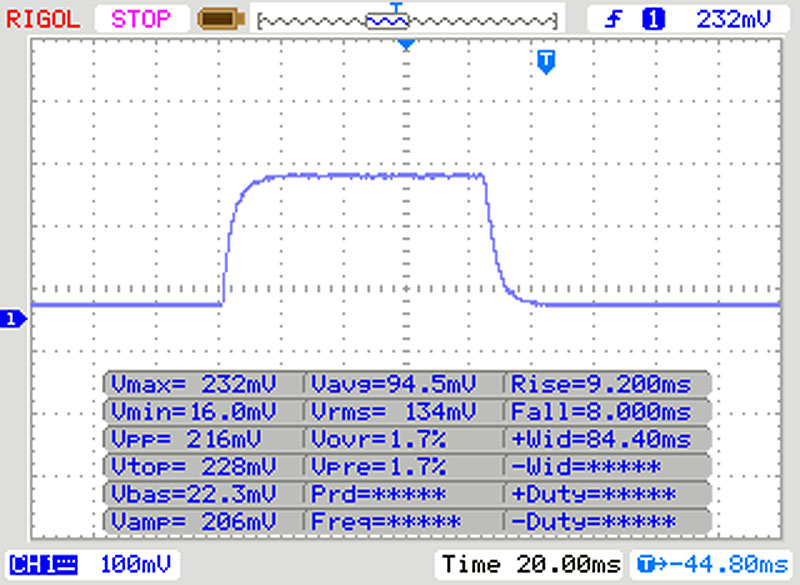 |
| ↘ 8 ms queda | ||
| A tela mostra boas taxas de resposta em nossos testes, mas pode ser muito lenta para jogadores competitivos. Em comparação, todos os dispositivos testados variam de 0.1 (mínimo) a 240 (máximo) ms. » 39 % de todos os dispositivos são melhores. Isso significa que o tempo de resposta medido é melhor que a média de todos os dispositivos testados (19.9 ms). | ||
| ↔ Tempo de resposta 50% cinza a 80% cinza | ||
| 25 ms ... ascensão ↗ e queda ↘ combinadas | ↗ 13 ms ascensão | 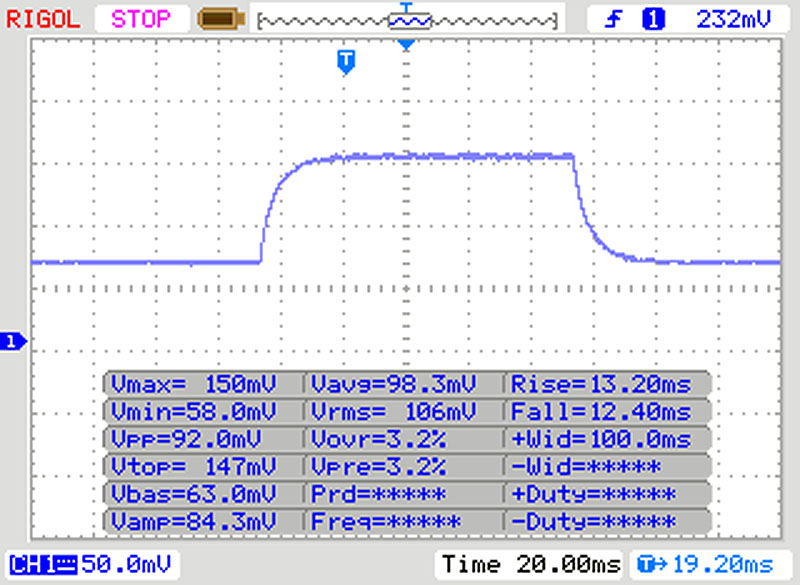 |
| ↘ 12 ms queda | ||
| A tela mostra taxas de resposta relativamente lentas em nossos testes e pode ser muito lenta para os jogadores. Em comparação, todos os dispositivos testados variam de 0.165 (mínimo) a 636 (máximo) ms. » 35 % de todos os dispositivos são melhores. Isso significa que o tempo de resposta medido é melhor que a média de todos os dispositivos testados (31.1 ms). | ||
Cintilação da tela / PWM (modulação por largura de pulso)
| Tela tremeluzindo / PWM não detectado | 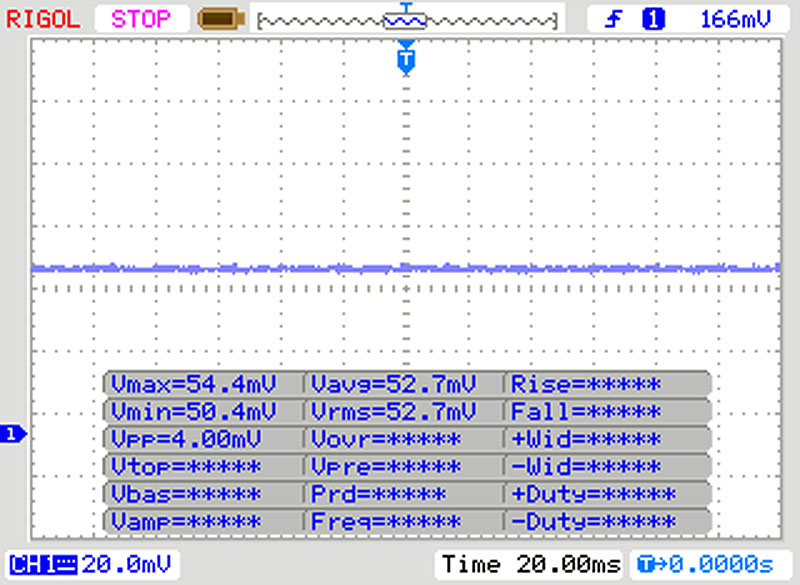 | ||
[pwm_comparison] Em comparação: 52 % de todos os dispositivos testados não usam PWM para escurecer a tela. Se PWM foi detectado, uma média de 7798 (mínimo: 5 - máximo: 343500) Hz foi medida. | |||
| Geekbench 5.5 | |
| Single-Core | |
| Média da turma Gaming (986 - 2474, n=111, últimos 2 anos) | |
| Lenovo IdeaPad Gaming 3i 15IMH05 | |
| Média Intel Core i5-10300H (703 - 1241, n=16) | |
| Acer Nitro 5 AN515-44-R5FT | |
| HP Pavilion Gaming 15-ec0002ng | |
| MSI Alpha 15 A3DDK-034 | |
| Multi-Core | |
| Média da turma Gaming (6460 - 27010, n=111, últimos 2 anos) | |
| Acer Nitro 5 AN515-44-R5FT | |
| Lenovo IdeaPad Gaming 3i 15IMH05 | |
| Média Intel Core i5-10300H (2783 - 4728, n=16) | |
| MSI Alpha 15 A3DDK-034 | |
| HP Pavilion Gaming 15-ec0002ng | |
| LibreOffice - 20 Documents To PDF | |
| Acer Nitro 5 AN515-44-R5FT | |
| Média Intel Core i5-10300H (23.9 - 94, n=14) | |
| Lenovo IdeaPad Gaming 3i 15IMH05 | |
| Média da turma Gaming (19 - 88.8, n=111, últimos 2 anos) | |
| R Benchmark 2.5 - Overall mean | |
| Média Intel Core i5-10300H (0.625 - 1.088, n=14) | |
| Lenovo IdeaPad Gaming 3i 15IMH05 | |
| Acer Nitro 5 AN515-44-R5FT | |
| Média da turma Gaming (0.3439 - 0.759, n=112, últimos 2 anos) | |
* ... menor é melhor
| PCMark 8 Home Score Accelerated v2 | 3841 pontos | |
| PCMark 8 Creative Score Accelerated v2 | 3644 pontos | |
| PCMark 8 Work Score Accelerated v2 | 5210 pontos | |
| PCMark 10 Score | 4612 pontos | |
Ajuda | ||
| PCMark 8 | |
| Home Score Accelerated v2 | |
| Média da turma Gaming (n=1últimos 2 anos) | |
| MSI Alpha 15 A3DDK-034 | |
| Asus TUF FX505DT-EB73 | |
| Lenovo IdeaPad Gaming 3i 15IMH05 | |
| Dell G3 3590 | |
| Média Intel Core i5-10300H, NVIDIA GeForce GTX 1650 Mobile (3181 - 3971, n=5) | |
| Lenovo IdeaPad L340-15IRH 81LK00BMGE | |
| HP Pavilion Gaming 15-ec0002ng | |
| Work Score Accelerated v2 | |
| Lenovo IdeaPad Gaming 3i 15IMH05 | |
| Dell G3 3590 | |
| MSI Alpha 15 A3DDK-034 | |
| Média Intel Core i5-10300H, NVIDIA GeForce GTX 1650 Mobile (4265 - 5276, n=5) | |
| HP Pavilion Gaming 15-ec0002ng | |
| Asus TUF FX505DT-EB73 | |
| Lenovo IdeaPad L340-15IRH 81LK00BMGE | |
| Média da turma Gaming (n=1últimos 2 anos) | |
| DPC Latencies / LatencyMon - interrupt to process latency (max), Web, Youtube, Prime95 | |
| Acer Nitro 5 AN515-44-R5FT | |
| Lenovo IdeaPad Gaming 3i 15IMH05 | |
* ... menor é melhor

| Lenovo IdeaPad Gaming 3i 15IMH05 SK hynix BC511 HFM512GDHTNI-87A0B | Asus TUF FX505DT-EB73 Intel SSD 660p SSDPEKNW512G8 | MSI GF63 Thin 9SC Toshiba KBG30ZMV512G | HP Pavilion Gaming 15-ec0002ng Intel SSD 660p SSDPEKNW512G8 | MSI Alpha 15 A3DDK-034 Kingston RBUSNS8154P3512GJ | Acer Nitro 5 AN515-44-R5FT SK Hynix BC511 HFM512GDJTNI | Lenovo IdeaPad L340-15IRH 81LK00BMGE WDC PC SN520 SDAPMUW-512 | Média SK hynix BC511 HFM512GDHTNI-87A0B | |
|---|---|---|---|---|---|---|---|---|
| CrystalDiskMark 5.2 / 6 | -1% | -25% | 0% | -12% | 1% | -6% | 5% | |
| Write 4K (MB/s) | 130 | 137.5 6% | 80.6 -38% | 136.9 5% | 105.4 -19% | 94.7 -27% | 103.6 -20% | 135.9 ? 5% |
| Read 4K (MB/s) | 44.44 | 57 28% | 41.82 -6% | 57 28% | 33.24 -25% | 38.91 -12% | 39.91 -10% | 45.3 ? 2% |
| Write Seq (MB/s) | 1059 | 984 -7% | 597 -44% | 968 -9% | 1029 -3% | 1056 0% | 1160 10% | 1057 ? 0% |
| Read Seq (MB/s) | 1105 | 1564 42% | 963 -13% | 1631 48% | 1098 -1% | 1183 7% | 990 -10% | 1144 ? 4% |
| Write 4K Q32T1 (MB/s) | 490.3 | 237.4 -52% | 188.8 -61% | 237 -52% | 322.1 -34% | 445.3 -9% | 283.4 -42% | 458 ? -7% |
| Read 4K Q32T1 (MB/s) | 309.2 | 340.7 10% | 403.7 31% | 337.1 9% | 352 14% | 477.7 54% | 344.5 11% | 425 ? 37% |
| Write Seq Q32T1 (MB/s) | 1053 | 959 -9% | 689 -35% | 963 -9% | 1036 -2% | 1063 1% | 1455 38% | 1040 ? -1% |
| Read Seq Q32T1 (MB/s) | 2261 | 1732 -23% | 1583 -30% | 1863 -18% | 1606 -29% | 2154 -5% | 1690 -25% | 2274 ? 1% |
Continuous load read: DiskSpd Read Loop, Queue Depth 8
| 3DMark 11 Performance | 11788 pontos | |
| 3DMark Ice Storm Standard Score | 118141 pontos | |
| 3DMark Cloud Gate Standard Score | 27773 pontos | |
| 3DMark Fire Strike Score | 8526 pontos | |
| 3DMark Time Spy Score | 3621 pontos | |
Ajuda | ||
| 3DMark 11 - 1280x720 Performance GPU | |
| Média da turma Gaming (21841 - 80022, n=109, últimos 2 anos) | |
| MSI Alpha 15 A3DDK-034 | |
| Acer Nitro 5 AN515-44-R5FT | |
| Asus TUF FX505DT-EB73 | |
| Lenovo IdeaPad L340-15IRH 81LK00BMGE | |
| Dell G3 3590 | |
| Média NVIDIA GeForce GTX 1650 Mobile (10885 - 13575, n=30) | |
| Lenovo IdeaPad Gaming 3i 15IMH05 | |
| MSI GF63 Thin 9SC | |
| HP Pavilion Gaming 15-ec0002ng | |
| BioShock Infinite - 1920x1080 Ultra Preset, DX11 (DDOF) | |
| Lenovo IdeaPad Gaming 3i 15IMH05 | |
| MSI Alpha 15 A3DDK-034 | |
| Média NVIDIA GeForce GTX 1650 Mobile (68.5 - 99.4, n=18) | |
| Dell G3 3590 | |
| Lenovo IdeaPad L340-15IRH 81LK00BMGE | |
| Asus TUF FX505DT-EB73 | |
| HP Pavilion Gaming 15-ec0002ng | |
| The Witcher 3 - 1920x1080 Ultra Graphics & Postprocessing (HBAO+) | |
| Média da turma Gaming (95 - 240, n=8, últimos 2 anos) | |
| MSI Alpha 15 A3DDK-034 | |
| Acer Nitro 5 AN515-44-R5FT | |
| Lenovo IdeaPad Gaming 3i 15IMH05 | |
| Asus TUF FX505DT-EB73 | |
| Dell G3 3590 | |
| Média NVIDIA GeForce GTX 1650 Mobile (29.9 - 40.3, n=31) | |
| Lenovo IdeaPad L340-15IRH 81LK00BMGE | |
| MSI GF63 Thin 9SC | |
| HP Pavilion Gaming 15-ec0002ng | |
| Escape from Tarkov - 1920x1080 Ultra Preset | |
| Lenovo IdeaPad Gaming 3i 15IMH05 | |
| Média NVIDIA GeForce GTX 1650 Mobile (45.8 - 62.2, n=2) | |
| Shadow of the Tomb Raider - 1920x1080 Highest Preset AA:T | |
| Média da turma Gaming (96 - 116, n=2, últimos 2 anos) | |
| Acer Nitro 5 AN515-44-R5FT | |
| Lenovo IdeaPad Gaming 3i 15IMH05 | |
| Média NVIDIA GeForce GTX 1650 Mobile (34 - 47, n=15) | |
| Asus TUF FX505DT-EB73 | |
| HP Pavilion Gaming 15-ec0002ng | |
| Doom Eternal - 1920x1080 High Preset | |
| Lenovo IdeaPad Gaming 3i 15IMH05 | |
| Média NVIDIA GeForce GTX 1650 Mobile (62.6 - 69.2, n=4) | |
| Gears Tactics - 1920x1080 Ultra Preset | |
| Acer Nitro 5 AN515-44-R5FT | |
| Lenovo IdeaPad Gaming 3i 15IMH05 | |
| Média NVIDIA GeForce GTX 1650 Mobile (41.9 - 48.3, n=5) | |
| Call of Duty Modern Warfare 2019 - 1920x1080 Maximum Settings AA:T2X Filmic SM | |
| Acer Nitro 5 AN515-44-R5FT | |
| Média NVIDIA GeForce GTX 1650 Mobile (43.3 - 53.5, n=4) | |
| Lenovo IdeaPad Gaming 3i 15IMH05 | |
| MSI GF63 Thin 9SC | |
| HP Pavilion Gaming 15-ec0002ng | |
| Far Cry 5 - 1920x1080 Ultra Preset AA:T | |
| Média da turma Gaming (70 - 151, n=10, últimos 2 anos) | |
| Lenovo IdeaPad Gaming 3i 15IMH05 | |
| Média NVIDIA GeForce GTX 1650 Mobile (44 - 57, n=9) | |
| HP Pavilion Gaming 15-ec0002ng | |
| baixo | média | alto | ultra | |
|---|---|---|---|---|
| BioShock Infinite (2013) | 288.3 | 242.3 | 224.2 | 96.5 |
| The Witcher 3 (2015) | 184.5 | 119.2 | 66 | 37.4 |
| Dota 2 Reborn (2015) | 133.9 | 121.5 | 113.2 | 107.5 |
| X-Plane 11.11 (2018) | 82.8 | 74.1 | 64.8 | |
| Far Cry 5 (2018) | 97 | 66 | 61 | 57 |
| Shadow of the Tomb Raider (2018) | 101 | 63 | 53 | 47 |
| Metro Exodus (2019) | 98.9 | 46.1 | 34.2 | 26.6 |
| Control (2019) | 138.5 | 46 | 33.5 | |
| Borderlands 3 (2019) | 115.7 | 60.1 | 39.2 | 34.6 |
| Call of Duty Modern Warfare 2019 (2019) | 99.6 | 64.3 | 53.3 | 45.4 |
| Need for Speed Heat (2019) | 75.6 | 57.8 | 51 | 48.7 |
| Star Wars Jedi Fallen Order (2019) | 69.6 | 59.8 | 52.1 | |
| Red Dead Redemption 2 (2019) | 93.6 | 50.8 | 33.1 | 21.2 |
| Escape from Tarkov (2020) | 121.2 | 78.6 | 67.9 | 62.2 |
| Hunt Showdown (2020) | 144.4 | 56.8 | 46.4 | |
| Doom Eternal (2020) | 151.5 | 84.6 | 68.1 | |
| Gears Tactics (2020) | 191.1 | 94 | 65.2 | 48.3 |
Barulho
| Ocioso |
| 30.7 / 30.7 / 30.7 dB |
| HDD |
| 30.7 dB |
| Carga |
| 49.7 / 50.3 dB |
 | ||
30 dB silencioso 40 dB(A) audível 50 dB(A) ruidosamente alto |
||
min: | ||
| Lenovo IdeaPad Gaming 3i 15IMH05 i5-10300H, GeForce GTX 1650 Mobile | Lenovo IdeaPad L340-15IRH 81LK00BMGE i5-9300H, GeForce GTX 1650 Mobile | Asus TUF FX505DT-EB73 R7 3750H, GeForce GTX 1650 Mobile | Dell G3 3590 i5-9300H, GeForce GTX 1650 Mobile | MSI GF63 Thin 9SC i5-9300H, GeForce GTX 1650 Max-Q | HP Pavilion Gaming 15-ec0002ng R5 3550H, GeForce GTX 1050 Mobile | Acer Nitro 5 AN515-44-R5FT R5 4600H, GeForce GTX 1650 Ti Mobile | MSI Alpha 15 A3DDK-034 R7 3750H, Radeon RX 5500M | Média NVIDIA GeForce GTX 1650 Mobile | Média da turma Gaming | |
|---|---|---|---|---|---|---|---|---|---|---|
| Noise | 14% | 6% | 5% | -2% | 7% | -0% | -15% | 8% | 9% | |
| desligado / ambiente * (dB) | 30.7 | 28.4 7% | 28.2 8% | 28.4 7% | 30 2% | 30.3 1% | 30 2% | 29 6% | 27.6 ? 10% | 24.1 ? 21% |
| Idle Minimum * (dB) | 30.7 | 28.4 7% | 28.2 8% | 29.2 5% | 35 -14% | 30.3 1% | 30 2% | 36 -17% | 28.1 ? 8% | 25.8 ? 16% |
| Idle Average * (dB) | 30.7 | 28.4 7% | 28.2 8% | 29.4 4% | 36 -17% | 30.3 1% | 32 -4% | 37 -21% | 28.8 ? 6% | 27.5 ? 10% |
| Idle Maximum * (dB) | 30.7 | 28.4 7% | 31.4 -2% | 29.4 4% | 37 -21% | 31 -1% | 34 -11% | 46 -50% | 31 ? -1% | 30 ? 2% |
| Load Average * (dB) | 49.7 | 30.1 39% | 39.8 20% | 39 22% | 44 11% | 39.3 21% | 46 7% | 50 -1% | 41.7 ? 16% | 43.1 ? 13% |
| Witcher 3 ultra * (dB) | 47 | 40.2 14% | 47 -0% | 49.5 -5% | 41 13% | 42.9 9% | 47 -0% | 51 -9% | ||
| Load Maximum * (dB) | 50.3 | 40.2 20% | 50.2 -0% | 49.7 1% | 43 15% | 43.3 14% | 49 3% | 57 -13% | 46.4 ? 8% | 54 ? -7% |
* ... menor é melhor
(±) A temperatura máxima no lado superior é 43 °C / 109 F, em comparação com a média de 40.4 °C / 105 F , variando de 21.2 a 68.8 °C para a classe Gaming.
(-) A parte inferior aquece até um máximo de 50.6 °C / 123 F, em comparação com a média de 43.2 °C / 110 F
(+) Em uso inativo, a temperatura média para o lado superior é 25.7 °C / 78 F, em comparação com a média do dispositivo de 33.9 °C / ### class_avg_f### F.
(±) Jogando The Witcher 3, a temperatura média para o lado superior é 34.2 °C / 94 F, em comparação com a média do dispositivo de 33.9 °C / ## #class_avg_f### F.
(+) Os apoios para as mãos e o touchpad estão atingindo a temperatura máxima da pele (32.4 °C / 90.3 F) e, portanto, não estão quentes.
(-) A temperatura média da área do apoio para as mãos de dispositivos semelhantes foi 28.8 °C / 83.8 F (-3.6 °C / -6.5 F).
| Lenovo IdeaPad Gaming 3i 15IMH05 i5-10300H, GeForce GTX 1650 Mobile | Lenovo IdeaPad L340-15IRH 81LK00BMGE i5-9300H, GeForce GTX 1650 Mobile | Asus TUF FX505DT-EB73 R7 3750H, GeForce GTX 1650 Mobile | Dell G3 3590 i5-9300H, GeForce GTX 1650 Mobile | MSI GF63 Thin 9SC i5-9300H, GeForce GTX 1650 Max-Q | HP Pavilion Gaming 15-ec0002ng R5 3550H, GeForce GTX 1050 Mobile | Acer Nitro 5 AN515-44-R5FT R5 4600H, GeForce GTX 1650 Ti Mobile | MSI Alpha 15 A3DDK-034 R7 3750H, Radeon RX 5500M | Média NVIDIA GeForce GTX 1650 Mobile | Média da turma Gaming | |
|---|---|---|---|---|---|---|---|---|---|---|
| Heat | -6% | -7% | -15% | 2% | 9% | -5% | 1% | -3% | -10% | |
| Maximum Upper Side * (°C) | 43 | 44.8 -4% | 41.2 4% | 49 -14% | 47 -9% | 41 5% | 49 -14% | 44 -2% | 46 ? -7% | 45.2 ? -5% |
| Maximum Bottom * (°C) | 50.6 | 58.1 -15% | 40 21% | 49.8 2% | 47 7% | 39.1 23% | 50 1% | 49 3% | 49.2 ? 3% | 48.2 ? 5% |
| Idle Upper Side * (°C) | 27.2 | 27.9 -3% | 34.6 -27% | 32.4 -19% | 26 4% | 26 4% | 28 -3% | 26 4% | 28.3 ? -4% | 31.1 ? -14% |
| Idle Bottom * (°C) | 27.5 | 27.9 -1% | 34.4 -25% | 35.6 -29% | 26 5% | 26.5 4% | 28 -2% | 28 -2% | 28.9 ? -5% | 34.3 ? -25% |
* ... menor é melhor
Lenovo IdeaPad Gaming 3i 15IMH05 análise de áudio
(-) | alto-falantes não muito altos (###valor### dB)
Graves 100 - 315Hz
(-) | quase nenhum baixo - em média 21.8% menor que a mediana
(±) | a linearidade dos graves é média (11.9% delta para a frequência anterior)
Médios 400 - 2.000 Hz
(±) | médios mais altos - em média 5.9% maior que a mediana
(±) | a linearidade dos médios é média (9.4% delta para frequência anterior)
Altos 2 - 16 kHz
(+) | agudos equilibrados - apenas 1.1% longe da mediana
(+) | os máximos são lineares (4.6% delta da frequência anterior)
Geral 100 - 16.000 Hz
(±) | a linearidade do som geral é média (22.8% diferença em relação à mediana)
Comparado com a mesma classe
» 82% de todos os dispositivos testados nesta classe foram melhores, 5% semelhantes, 13% piores
» O melhor teve um delta de 6%, a média foi 18%, o pior foi 132%
Comparado com todos os dispositivos testados
» 67% de todos os dispositivos testados foram melhores, 6% semelhantes, 27% piores
» O melhor teve um delta de 4%, a média foi 24%, o pior foi 134%
| desligado | |
| Ocioso | |
| Carga |
|
Key:
min: | |
| Lenovo IdeaPad Gaming 3i 15IMH05 i5-10300H, GeForce GTX 1650 Mobile | Lenovo IdeaPad L340-15IRH 81LK00BMGE i5-9300H, GeForce GTX 1650 Mobile | Asus TUF FX505DT-EB73 R7 3750H, GeForce GTX 1650 Mobile | Dell G3 3590 i5-9300H, GeForce GTX 1650 Mobile | MSI GF63 Thin 9SC i5-9300H, GeForce GTX 1650 Max-Q | HP Pavilion Gaming 15-ec0002ng R5 3550H, GeForce GTX 1050 Mobile | Acer Nitro 5 AN515-44-R5FT R5 4600H, GeForce GTX 1650 Ti Mobile | MSI Alpha 15 A3DDK-034 R7 3750H, Radeon RX 5500M | Média NVIDIA GeForce GTX 1650 Mobile | Média da turma Gaming | |
|---|---|---|---|---|---|---|---|---|---|---|
| Power Consumption | 24% | 0% | -22% | -1% | 29% | 12% | -82% | 1% | -95% | |
| Idle Minimum * (Watt) | 5.1 | 3.8 25% | 7 -37% | 6.2 -22% | 7 -37% | 1.9 63% | 5 2% | 14 -175% | 4.96 ? 3% | 13.3 ? -161% |
| Idle Average * (Watt) | 8.2 | 6.6 20% | 9.9 -21% | 8.4 -2% | 9 -10% | 7.2 12% | 8 2% | 18 -120% | 8.61 ? -5% | 19 ? -132% |
| Idle Maximum * (Watt) | 10.6 | 8.9 16% | 12 -13% | 27.7 -161% | 13 -23% | 9.6 9% | 13 -23% | 32 -202% | 14.8 ? -40% | 24.5 ? -131% |
| Load Average * (Watt) | 128 | 78.4 39% | 68.4 47% | 91 29% | 79 38% | 74 42% | 69 46% | 64 50% | 81.7 ? 36% | 108.1 ? 16% |
| Witcher 3 ultra * (Watt) | 109 | 82 25% | 94.9 13% | 94.4 13% | 73 33% | 75 31% | 78 28% | 123 -13% | ||
| Load Maximum * (Watt) | 150 | 124 17% | 130.9 13% | 131.5 12% | 164 -9% | 124 17% | 124 17% | 193 -29% | 131.9 ? 12% | 254 ? -69% |
* ... menor é melhor
| Lenovo IdeaPad Gaming 3i 15IMH05 i5-10300H, GeForce GTX 1650 Mobile, 45 Wh | Asus TUF FX505DT-EB73 R7 3750H, GeForce GTX 1650 Mobile, 48 Wh | Dell G3 3590 i5-9300H, GeForce GTX 1650 Mobile, 51 Wh | MSI GF63 Thin 9SC i5-9300H, GeForce GTX 1650 Max-Q, 51 Wh | HP Pavilion Gaming 15-ec0002ng R5 3550H, GeForce GTX 1050 Mobile, 52.5 Wh | MSI Alpha 15 A3DDK-034 R7 3750H, Radeon RX 5500M, 51 Wh | Acer Nitro 5 AN515-44-R5FT R5 4600H, GeForce GTX 1650 Ti Mobile, 57.48 Wh | Lenovo IdeaPad L340-15IRH 81LK00BMGE i5-9300H, GeForce GTX 1650 Mobile, 45 Wh | Média da turma Gaming | |
|---|---|---|---|---|---|---|---|---|---|
| Duração da bateria | -26% | -2% | -31% | 33% | -48% | 9% | -28% | -6% | |
| Reader / Idle (h) | 12.4 | 7.8 -37% | 13.5 9% | 8.5 -31% | 5.8 -53% | 13.8 11% | 7.8 -37% | 8.71 ? -30% | |
| H.264 (h) | 7.3 | 3.9 -47% | 8.26 ? 13% | ||||||
| WiFi v1.3 (h) | 6.3 | 4.8 -24% | 6.7 6% | 4.4 -30% | 8.4 33% | 4.1 -35% | 8.7 38% | 6.1 -3% | 7.01 ? 11% |
| Load (h) | 1.8 | 1.5 -17% | 1.4 -22% | 1.2 -33% | 0.8 -56% | 1.4 -22% | 1 -44% | 1.47 ? -18% |
Pro
Contra
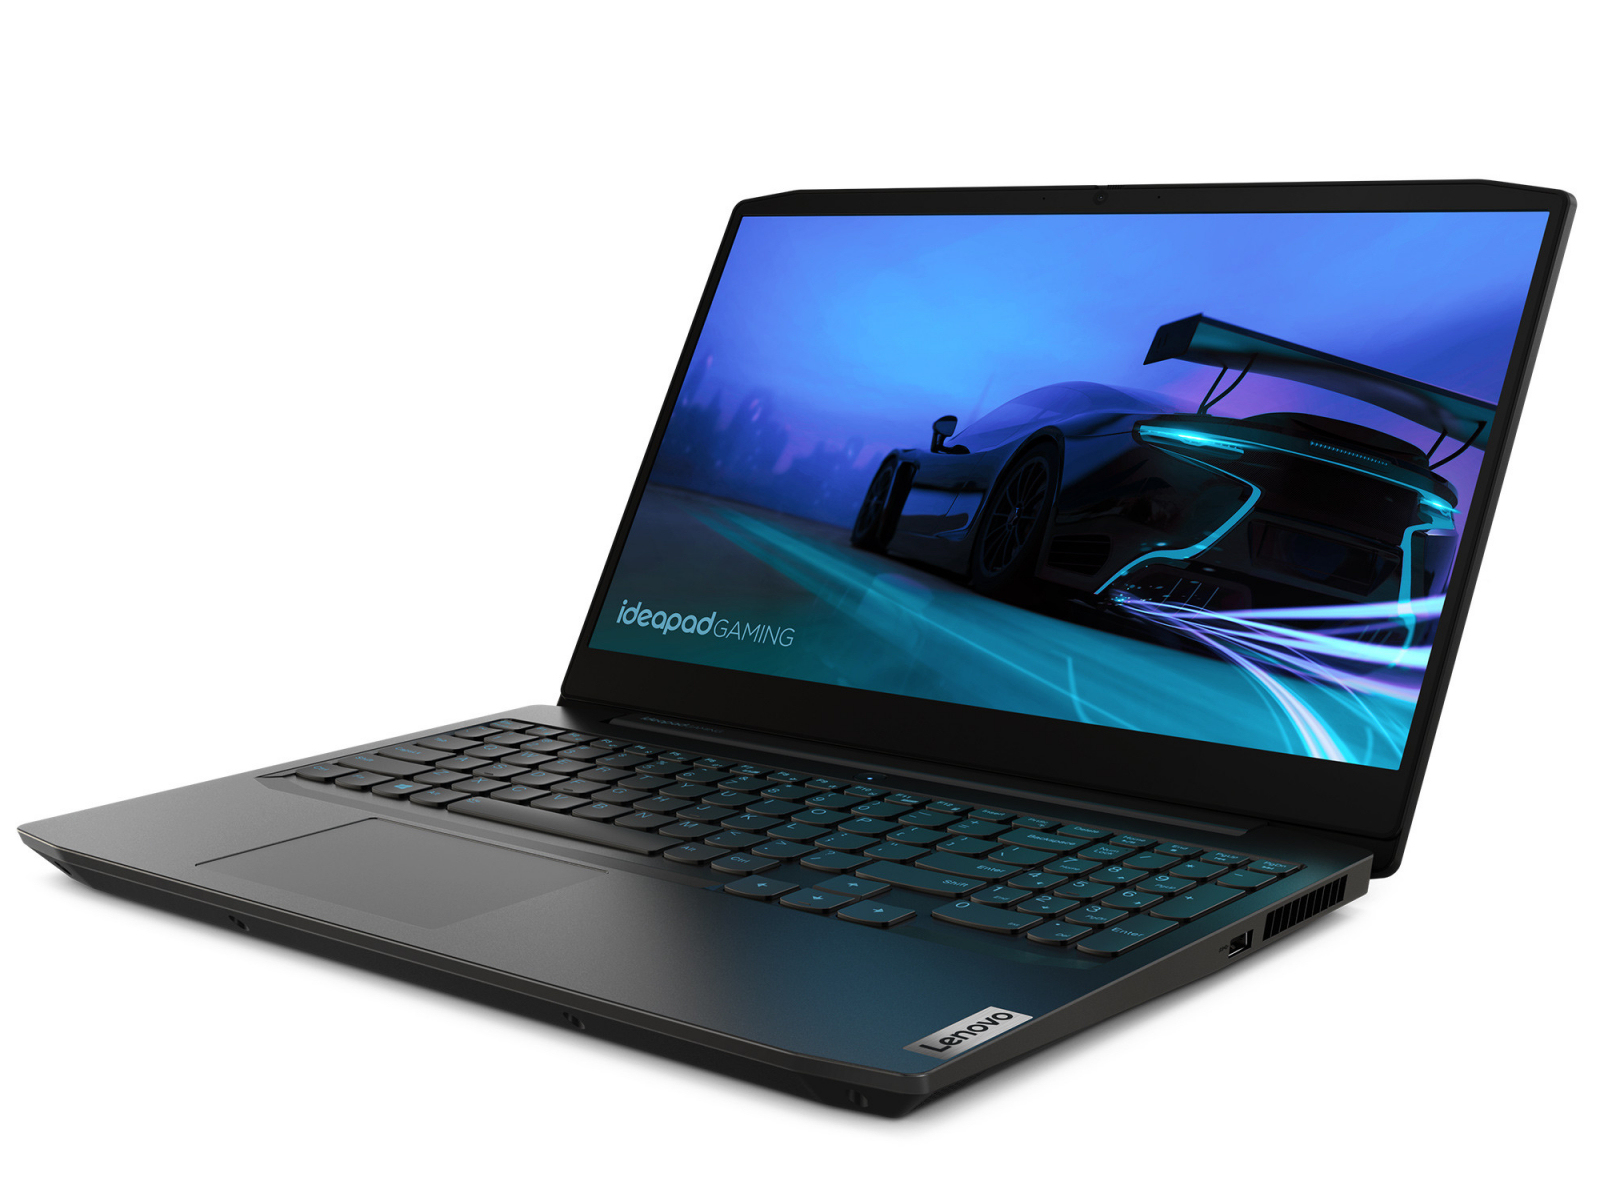
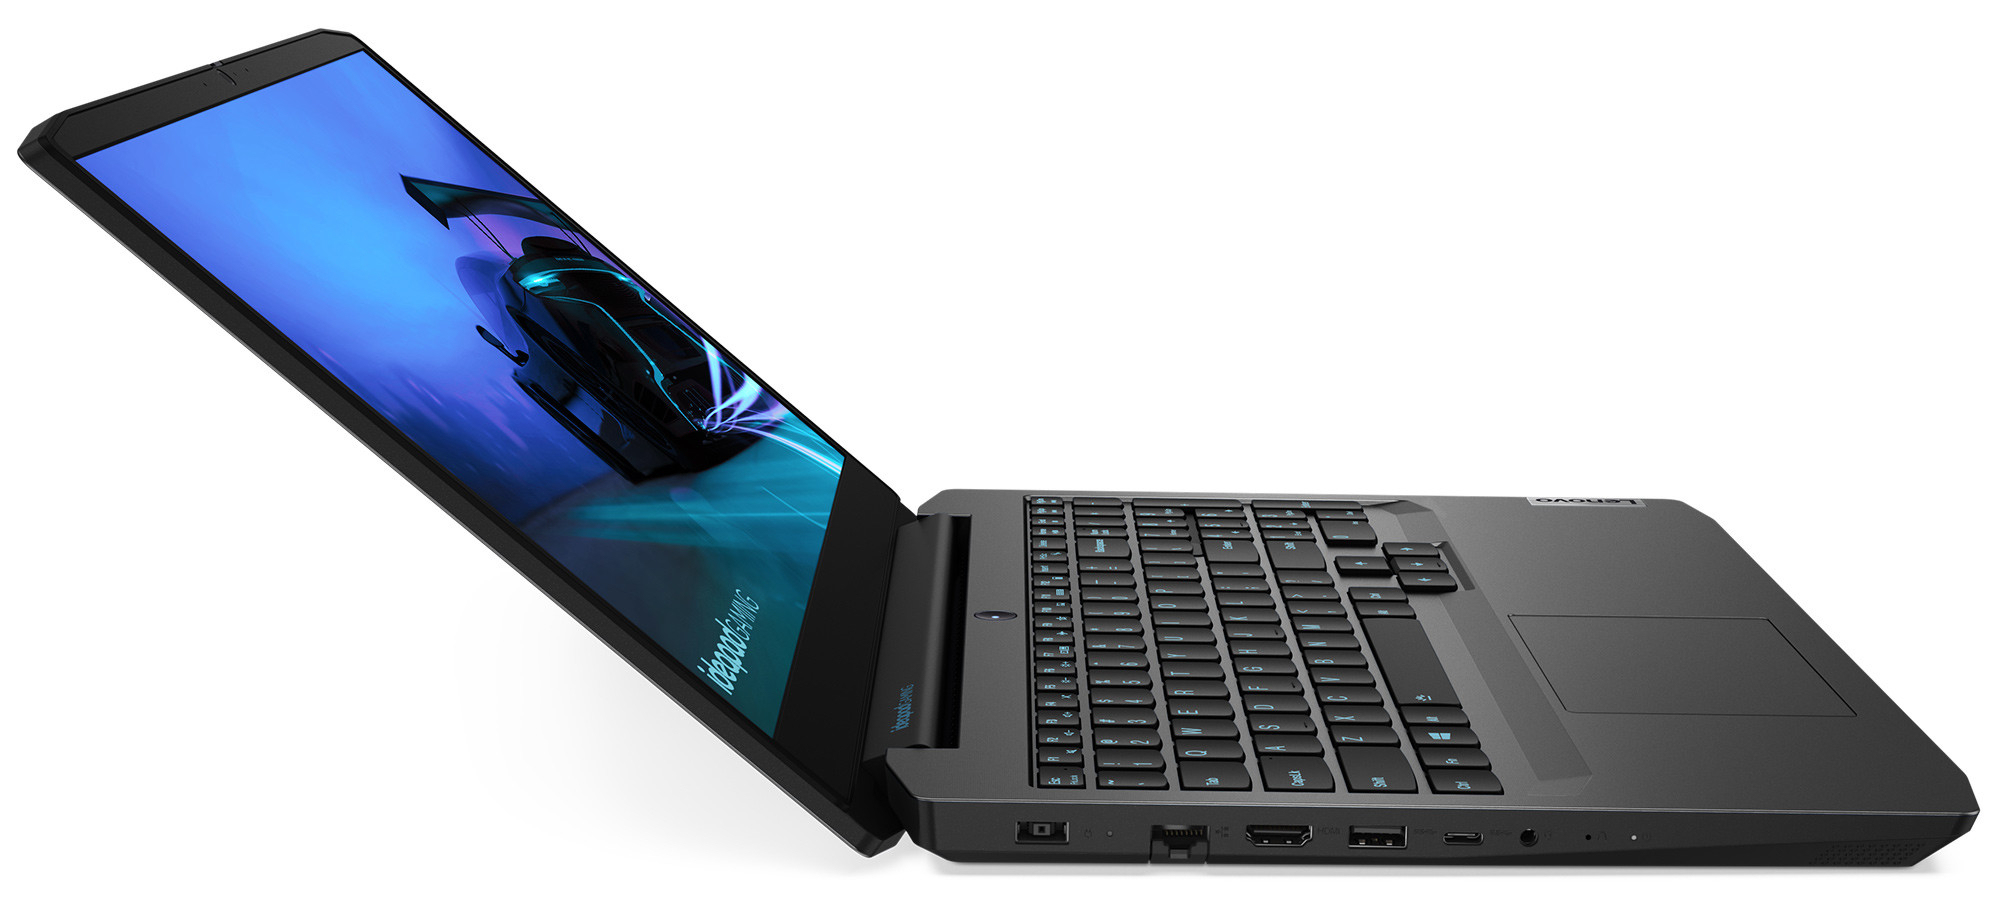
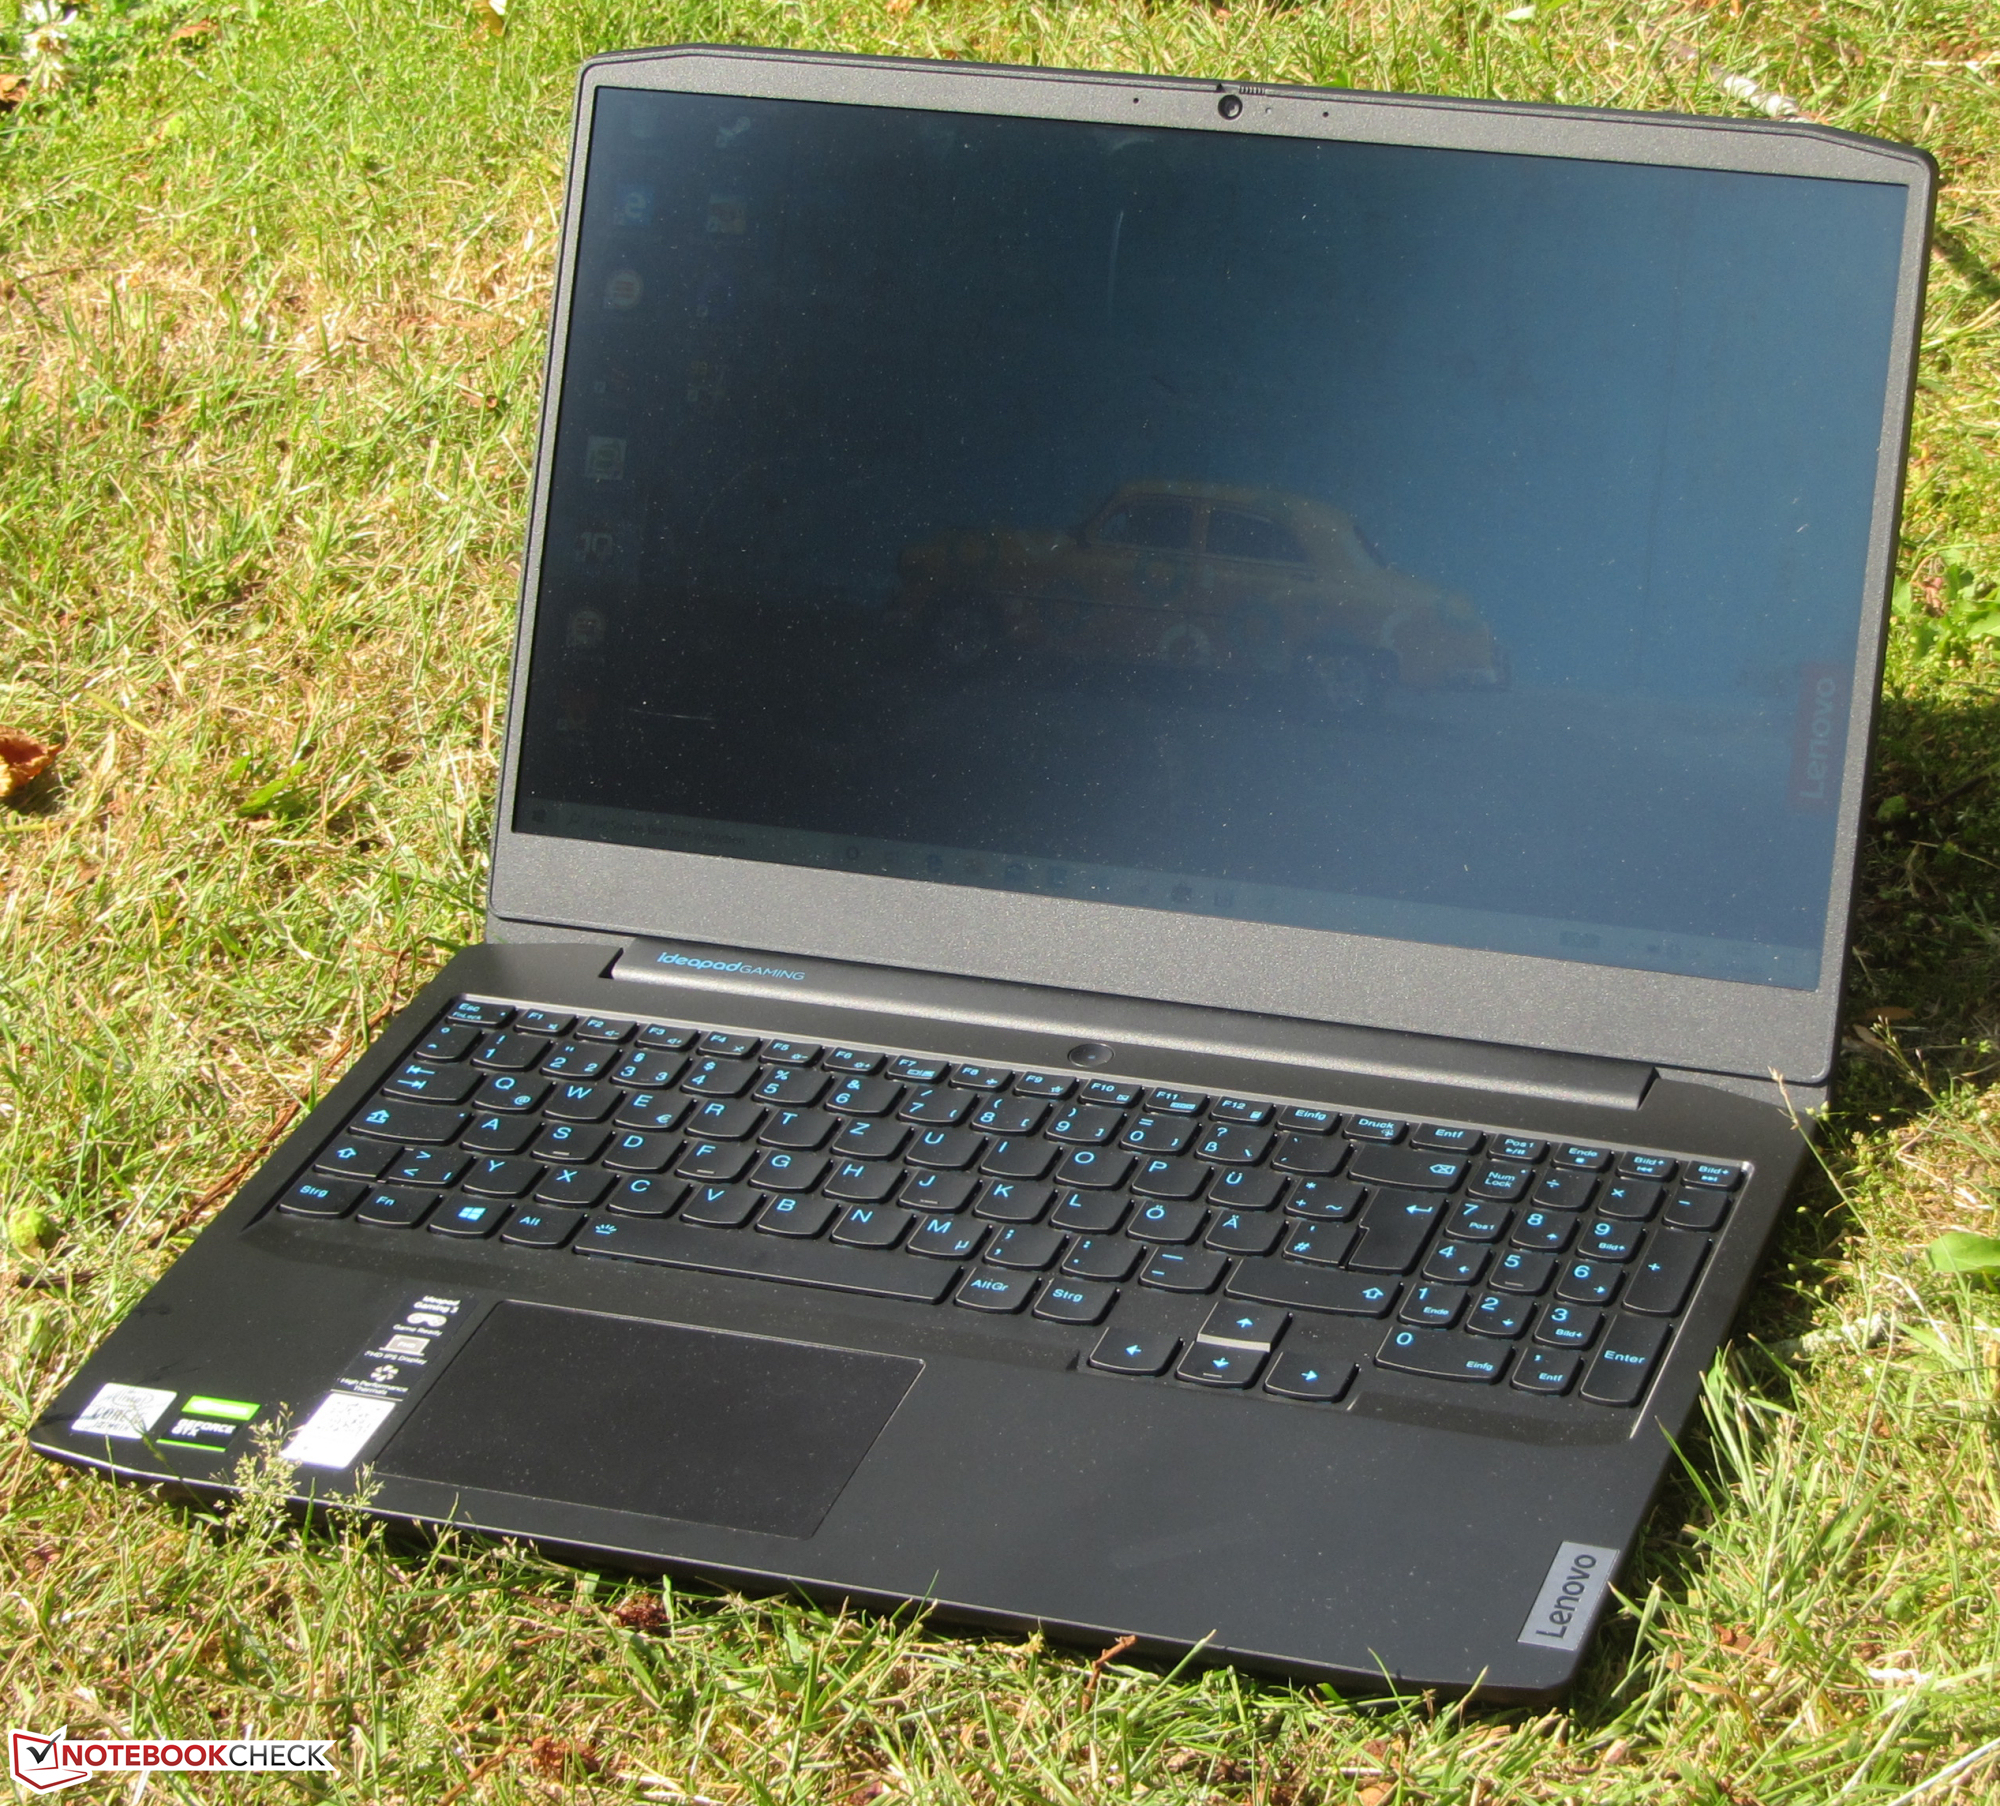
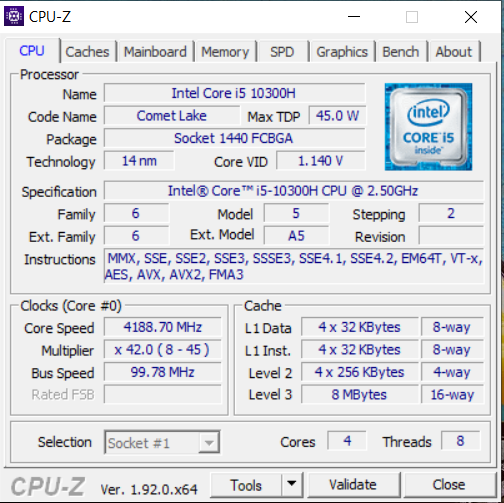
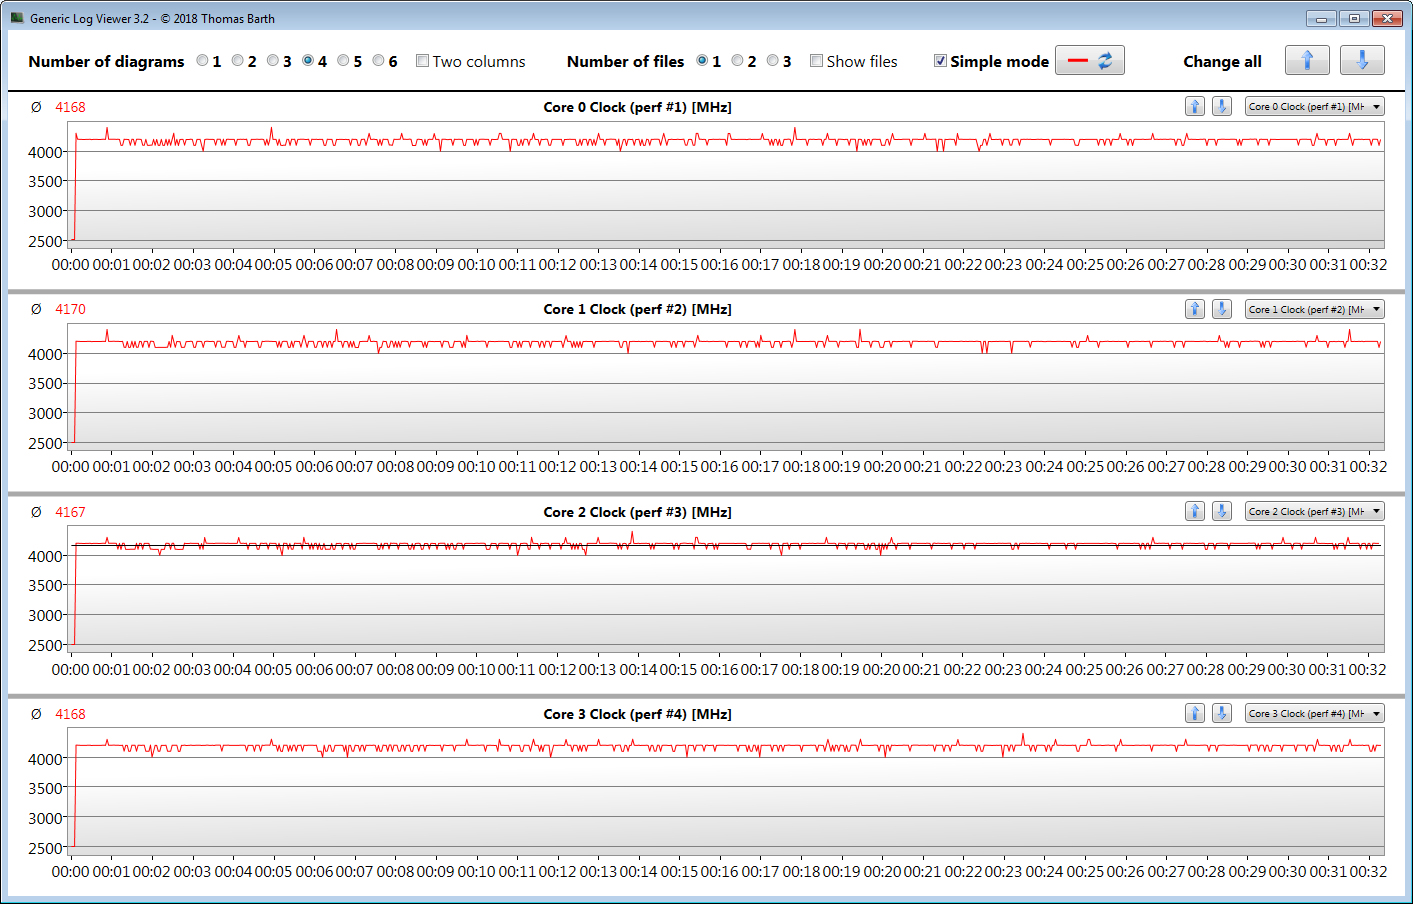
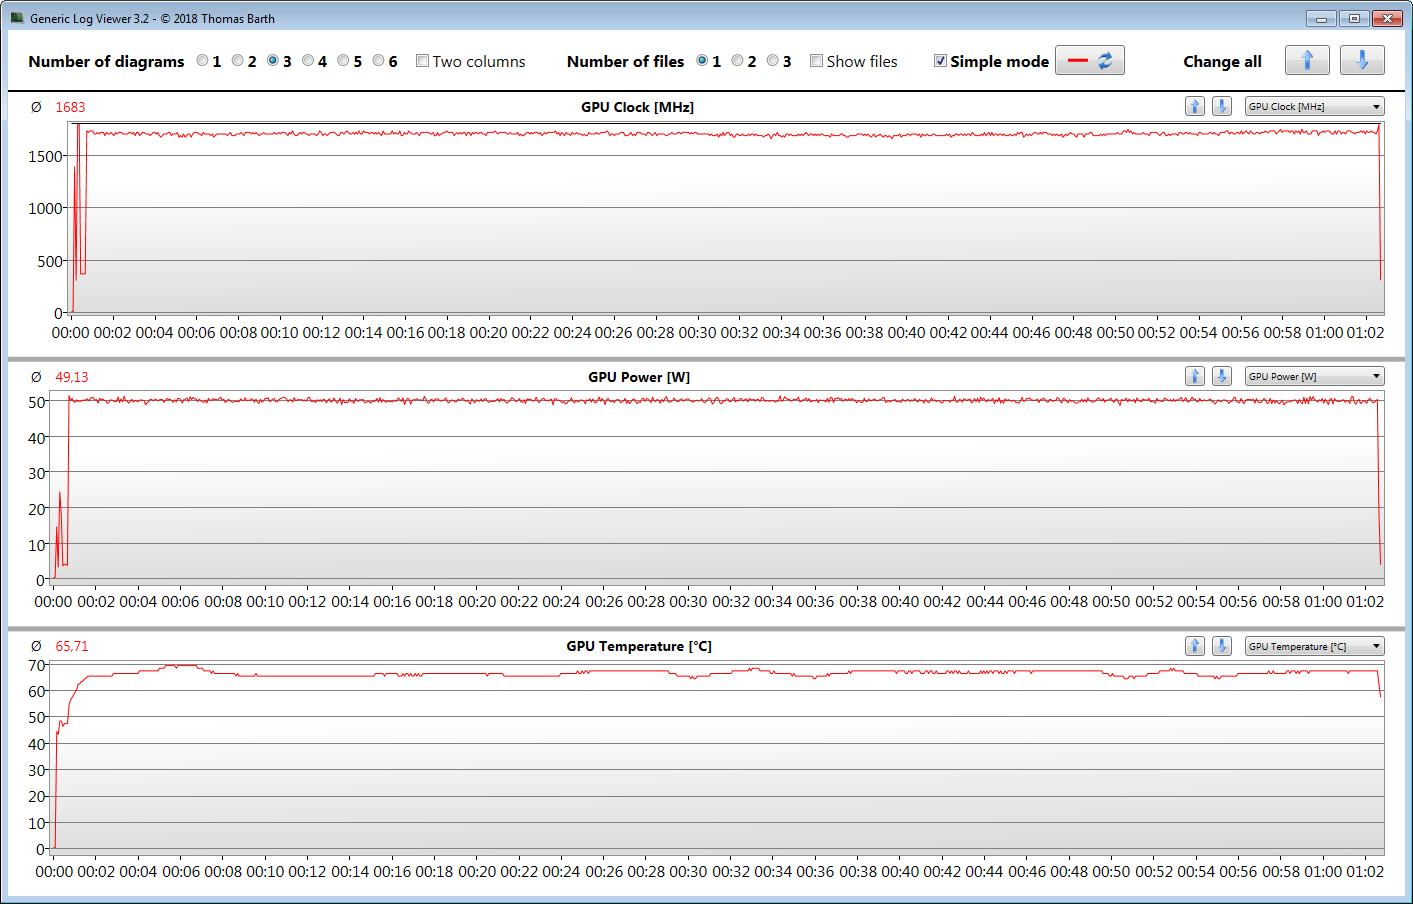
O portátil para jogos de 15,6 polegadas da Lenovo (cerca de 800 Euros (~US$ 903)) possui um processador Core i5-10300H (Comet Lake) a bordo que fornece potência de computação suficiente para todas as áreas de aplicação comuns. Em combinação com o núcleo gráfico GeForce GTX 1650 dedicado, a CPU traz para a tela todos os jogos de computador modernos sem problemas. Positivo: Tanto a CPU quanto a GPU podem funcionar em alta velocidade por períodos prolongados.
O IdeaPad Gaming 3i 15IMH05 representa um portátil de jogos completo no segmento básico, que oferece uma boa relação preço-desempenho.
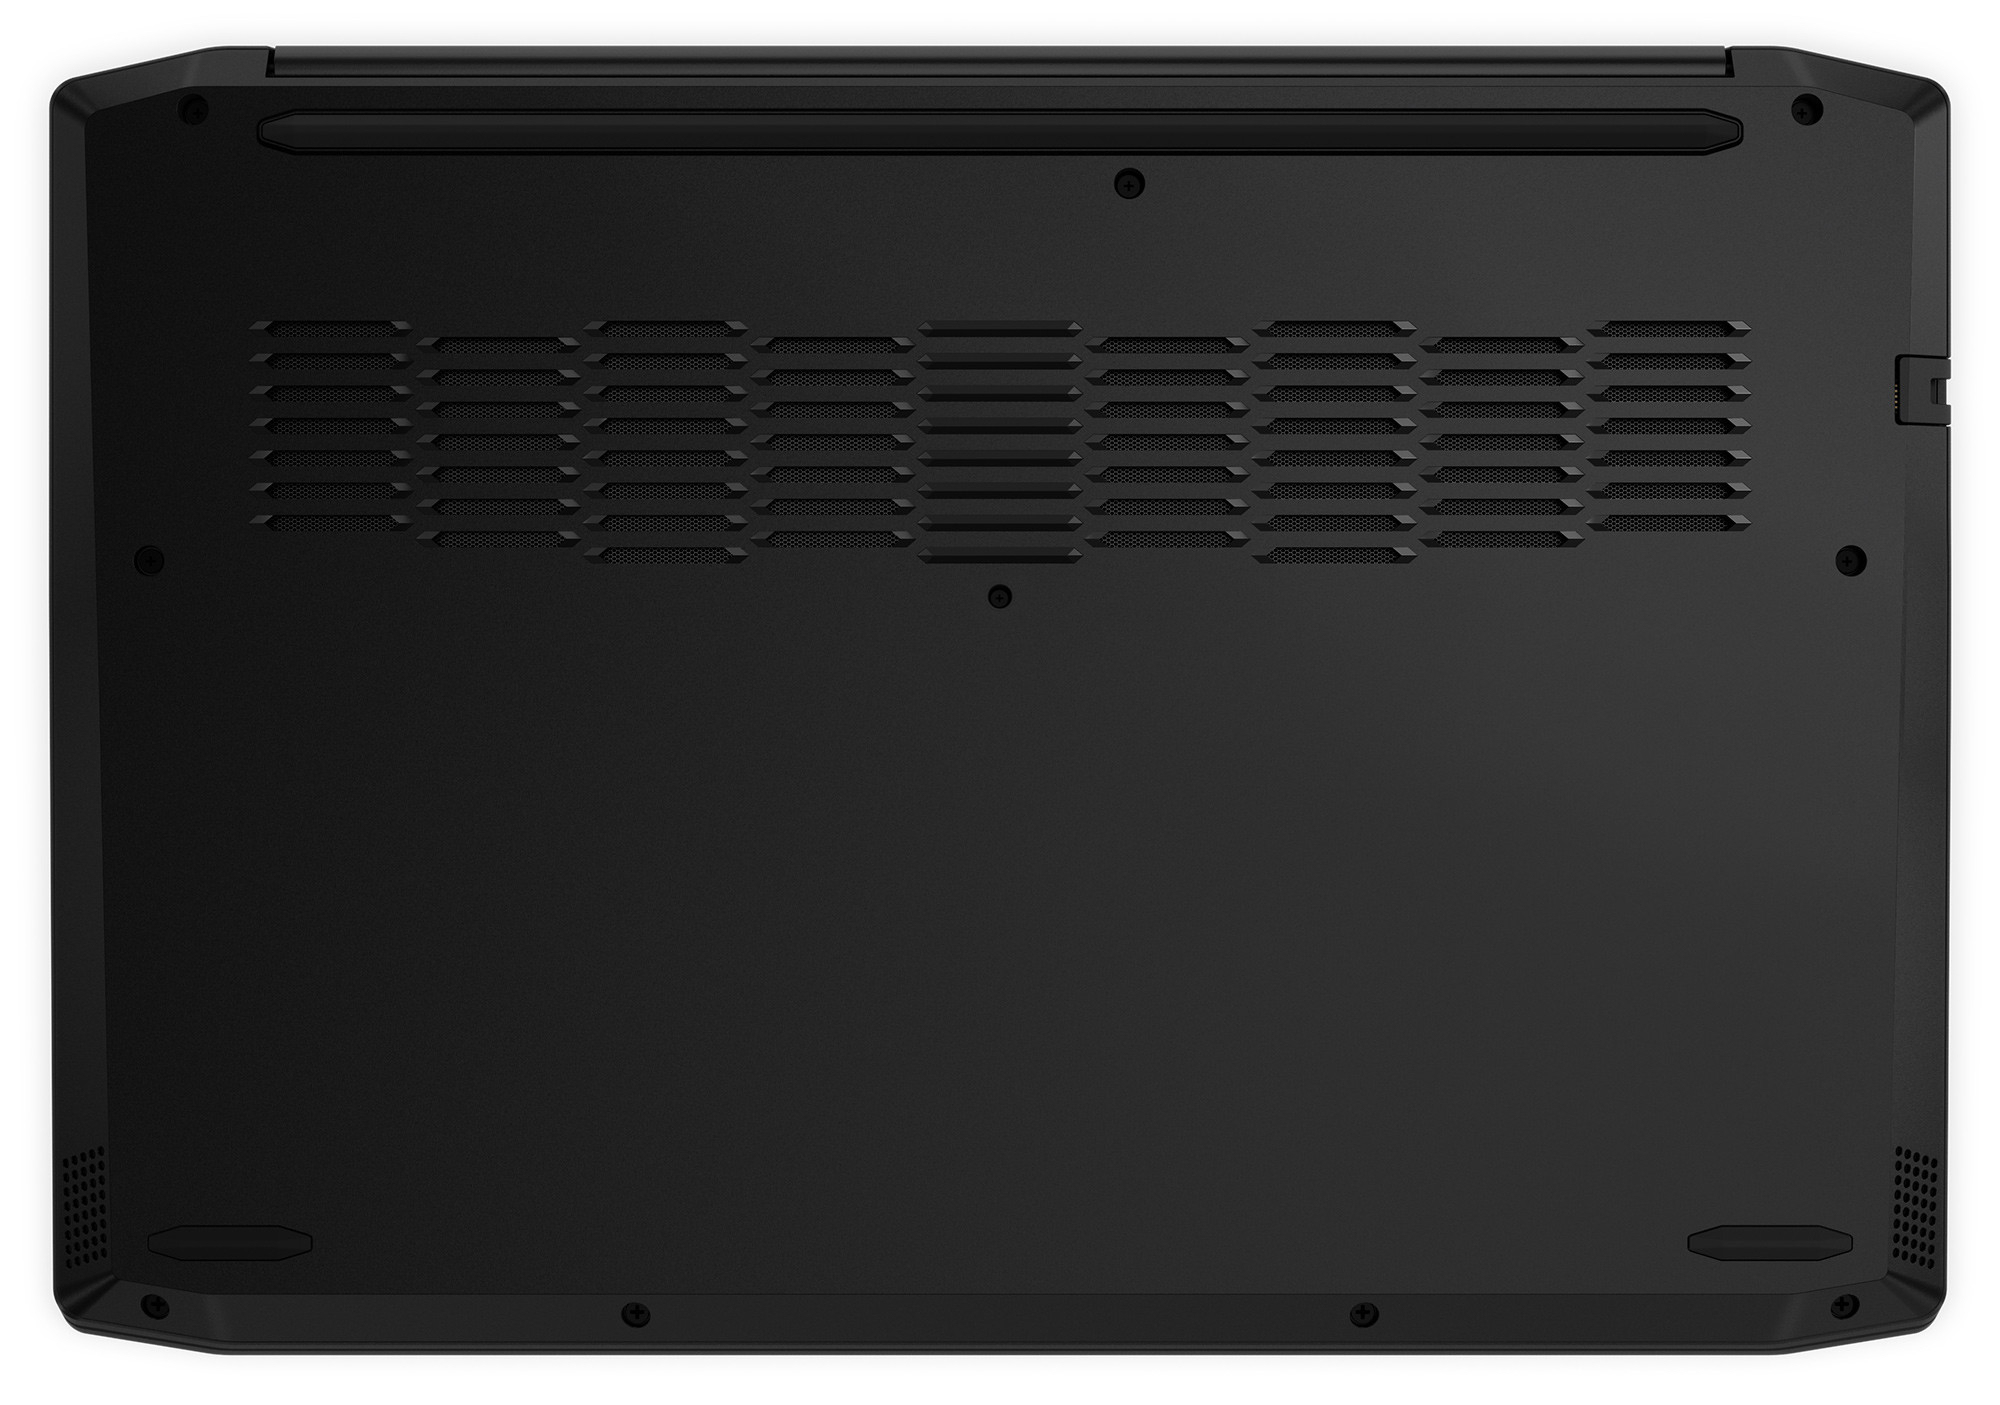
Um SSD NVMe de 512 GB (2242) garante um sistema rápido. Se o espaço de armazenamento acabar, poderá ser expandido sem problemas. O portátil vem com um segundo slot M.2, que pode acomodar um SSD NVMe SSD no formato 2280 ou 2230. Como o computador não possui uma escotilha de manutenção, a carcaça precisaria ser aberta para a instalação.
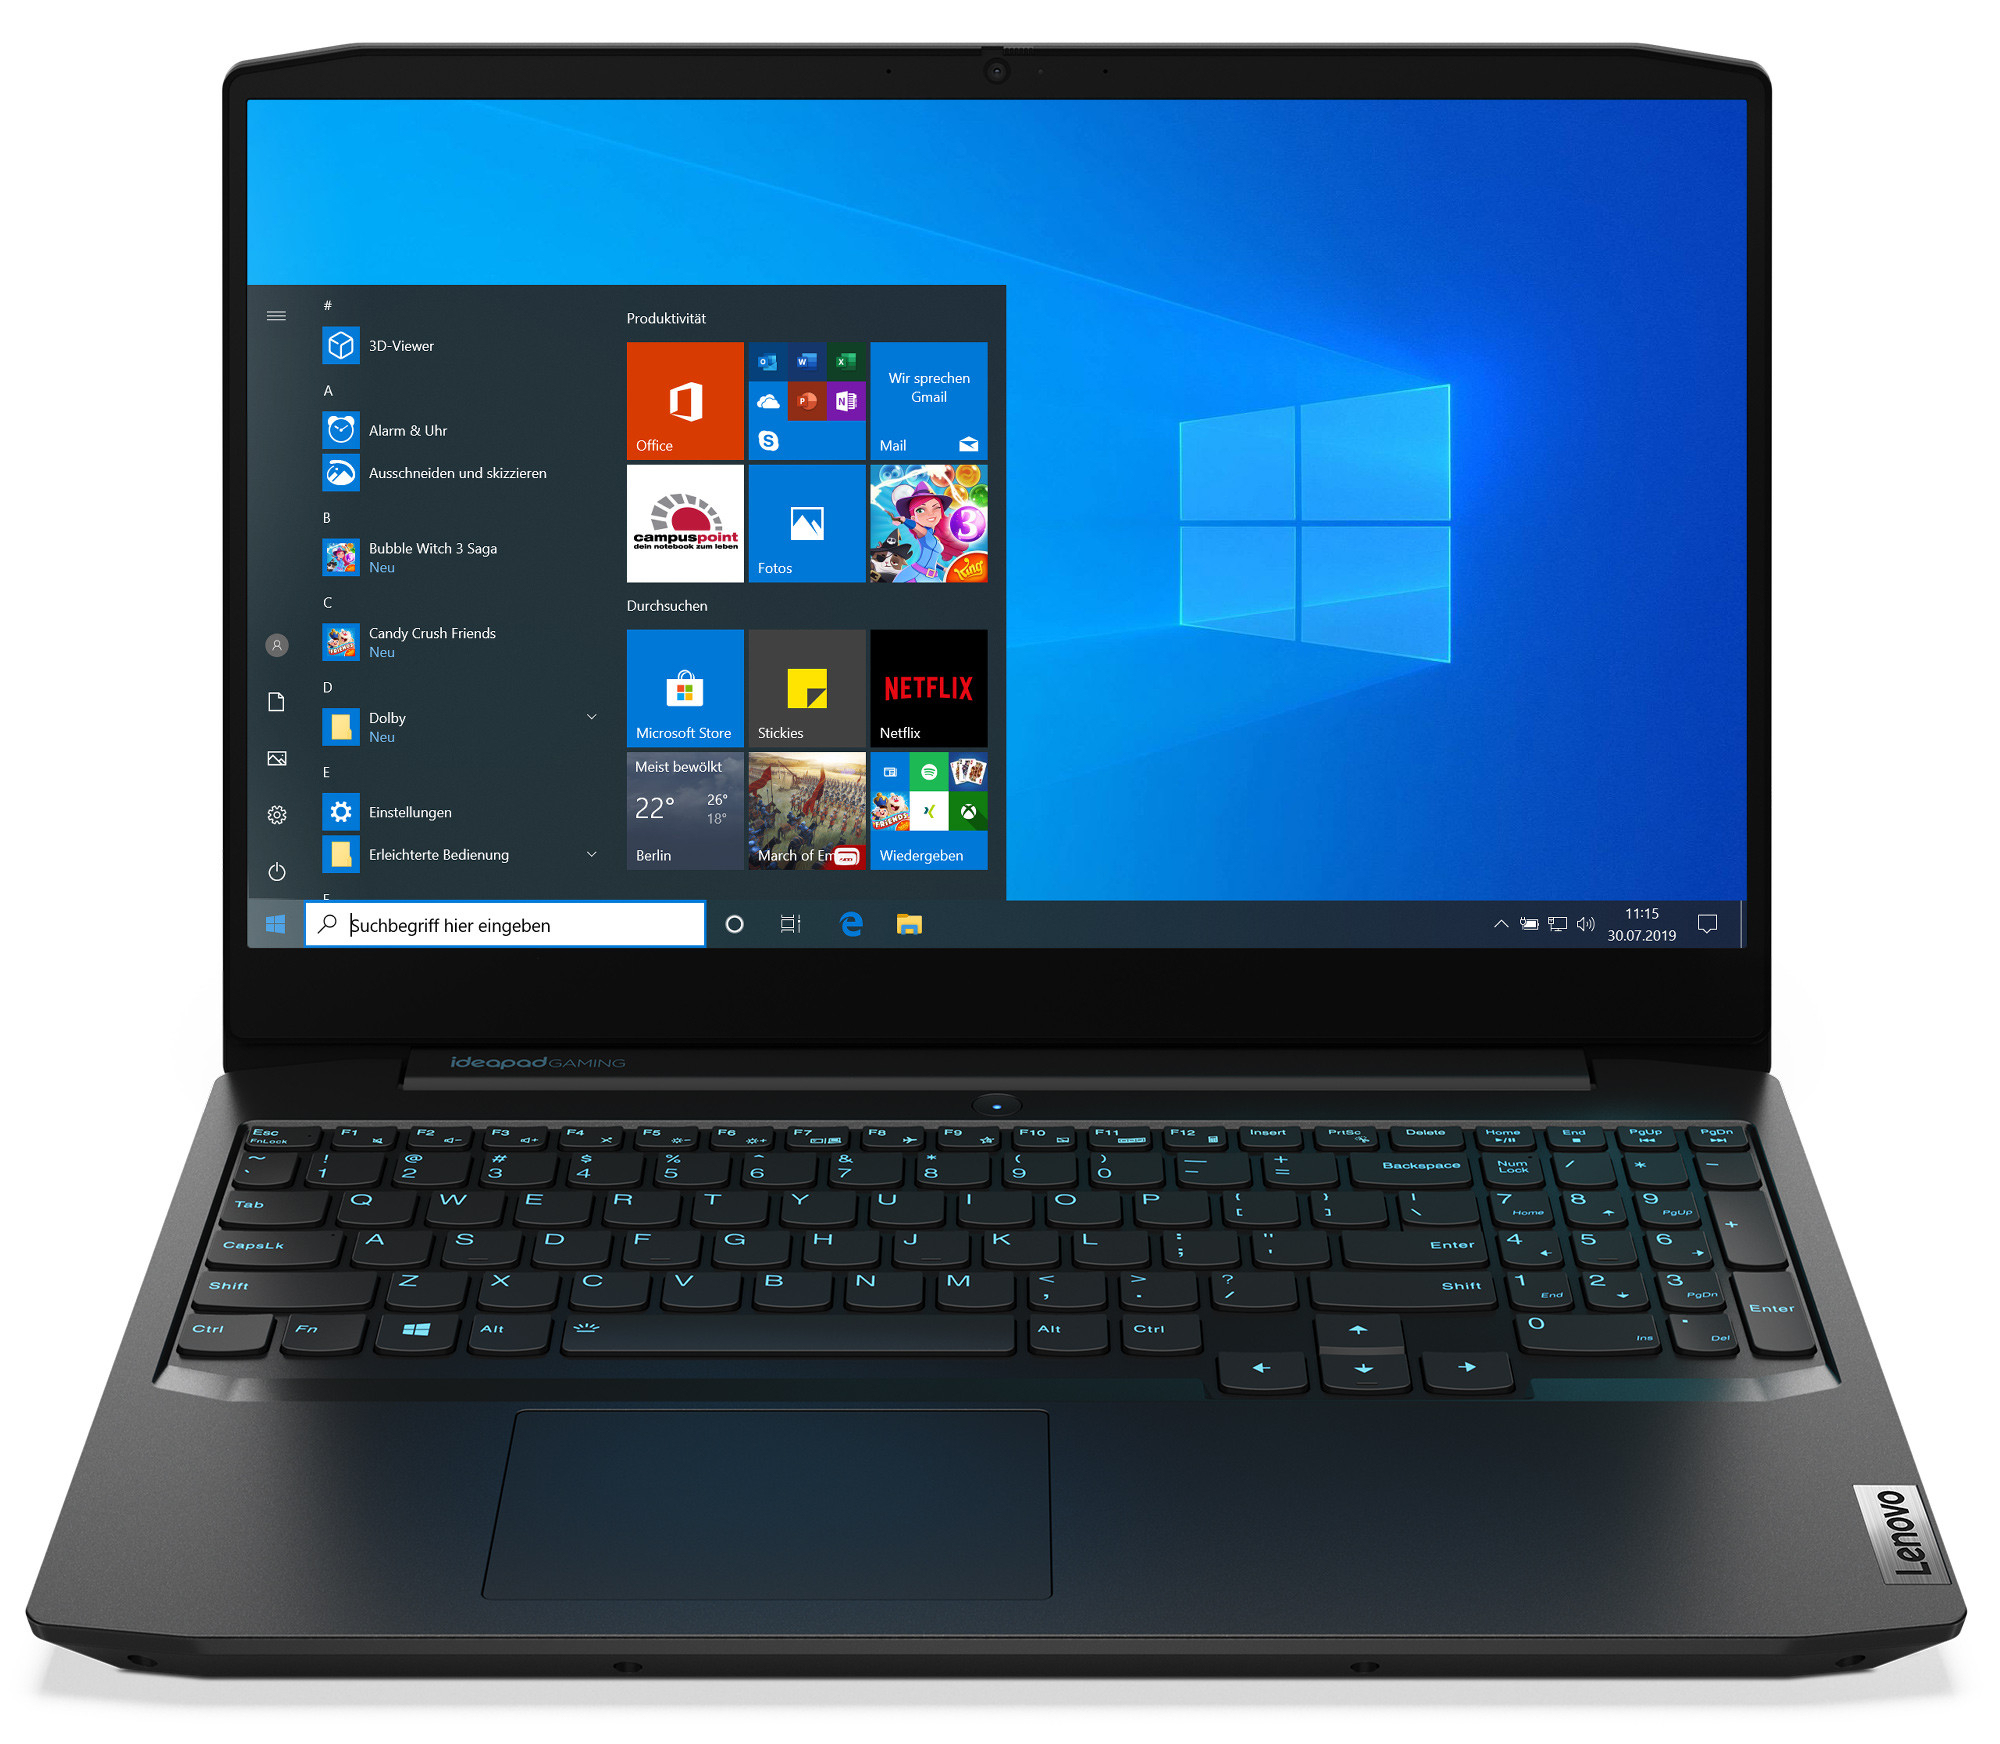
A tela IPS Full HD de 120 Hz oferece ângulos de visão estáveis, superfície mate, tempos de resposta aceitáveis e reprodução de cores decente. Embora o brilho máximo ainda possa ser descrito como suficiente, o contraste e a cobertura do espaço de cores são muito baixos. Até um portátil básico deve oferecer mais aqui.
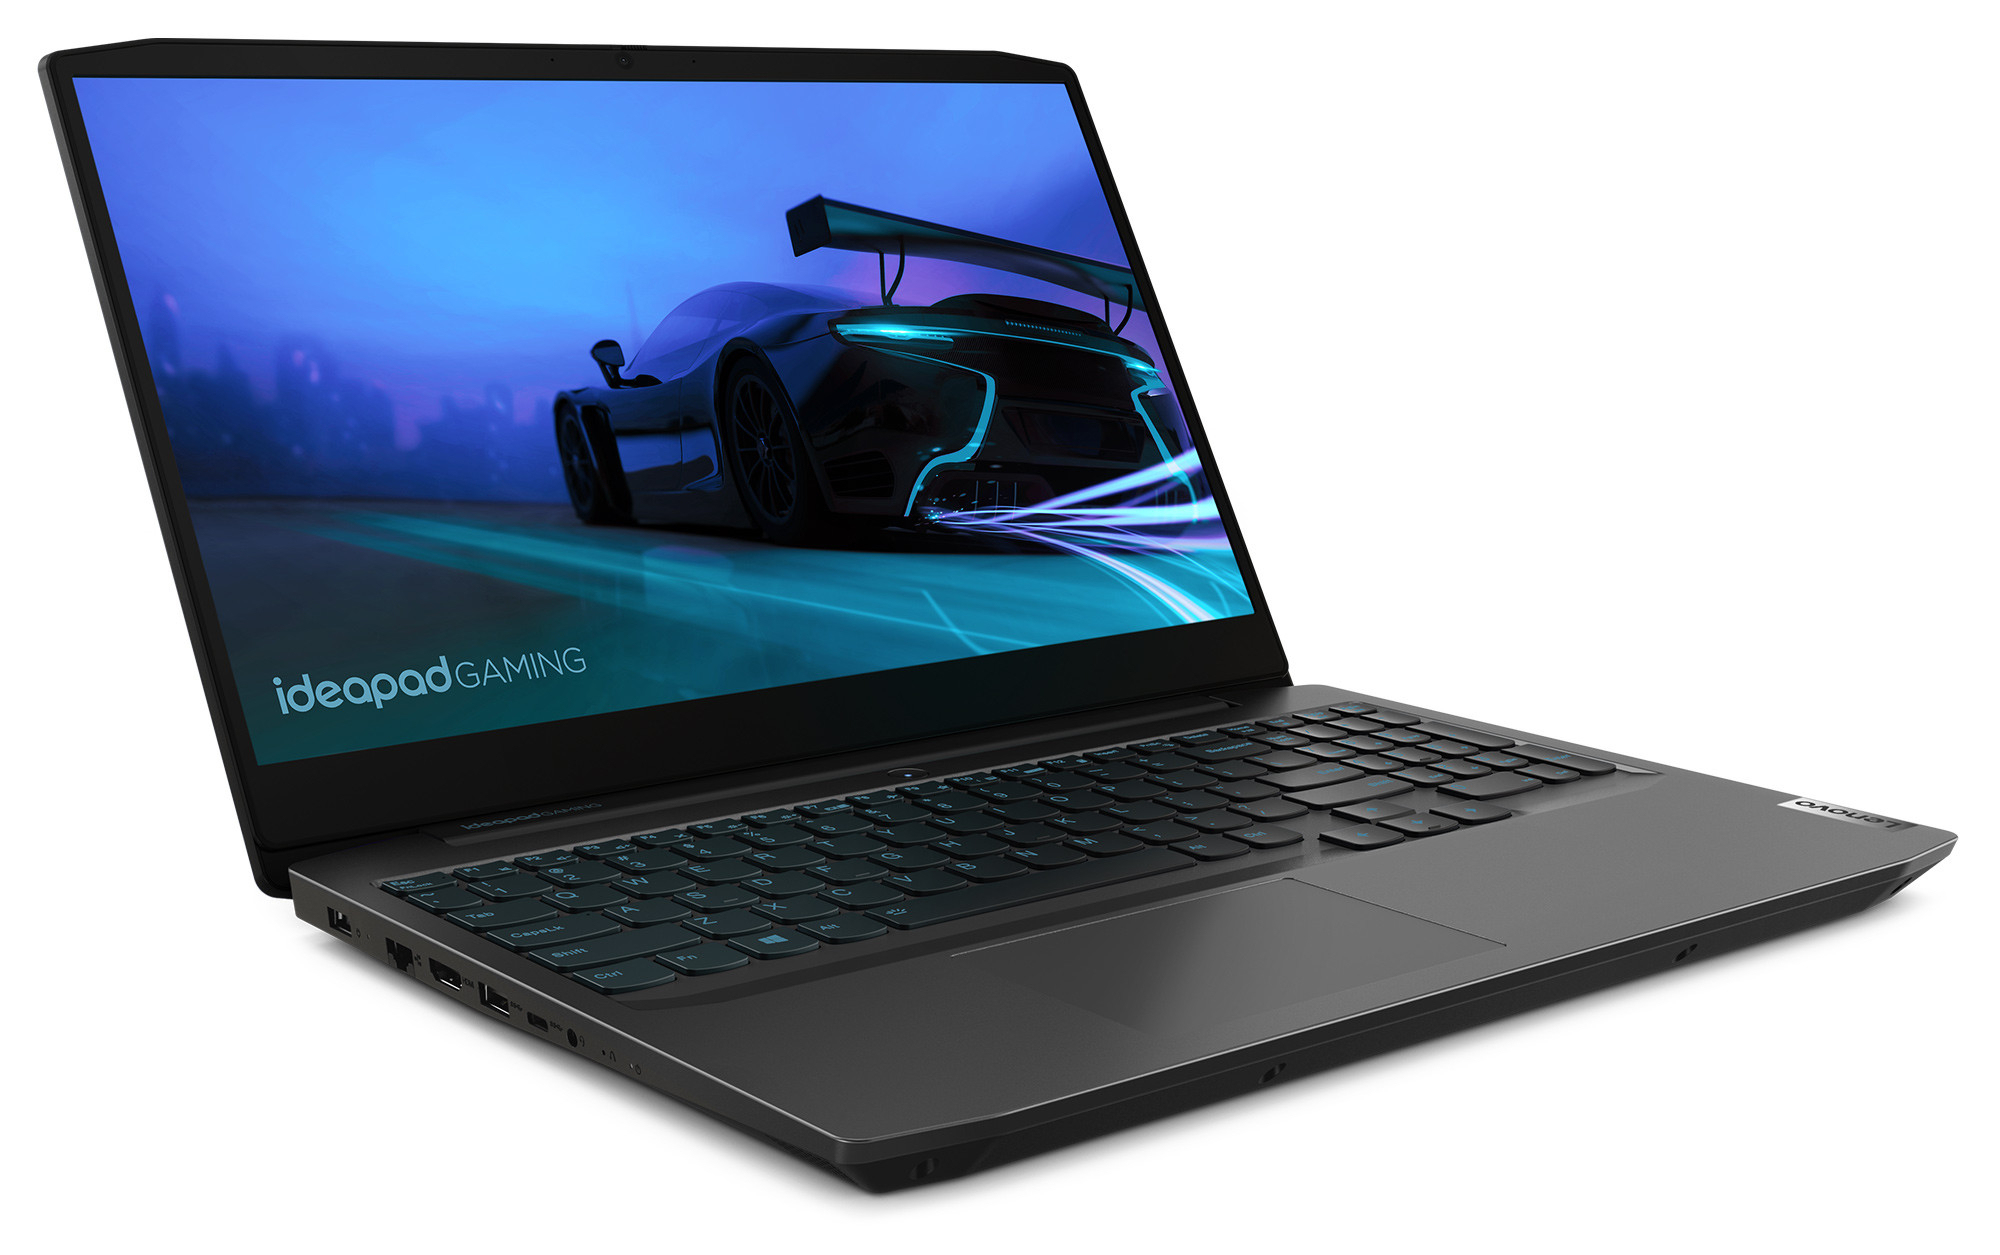
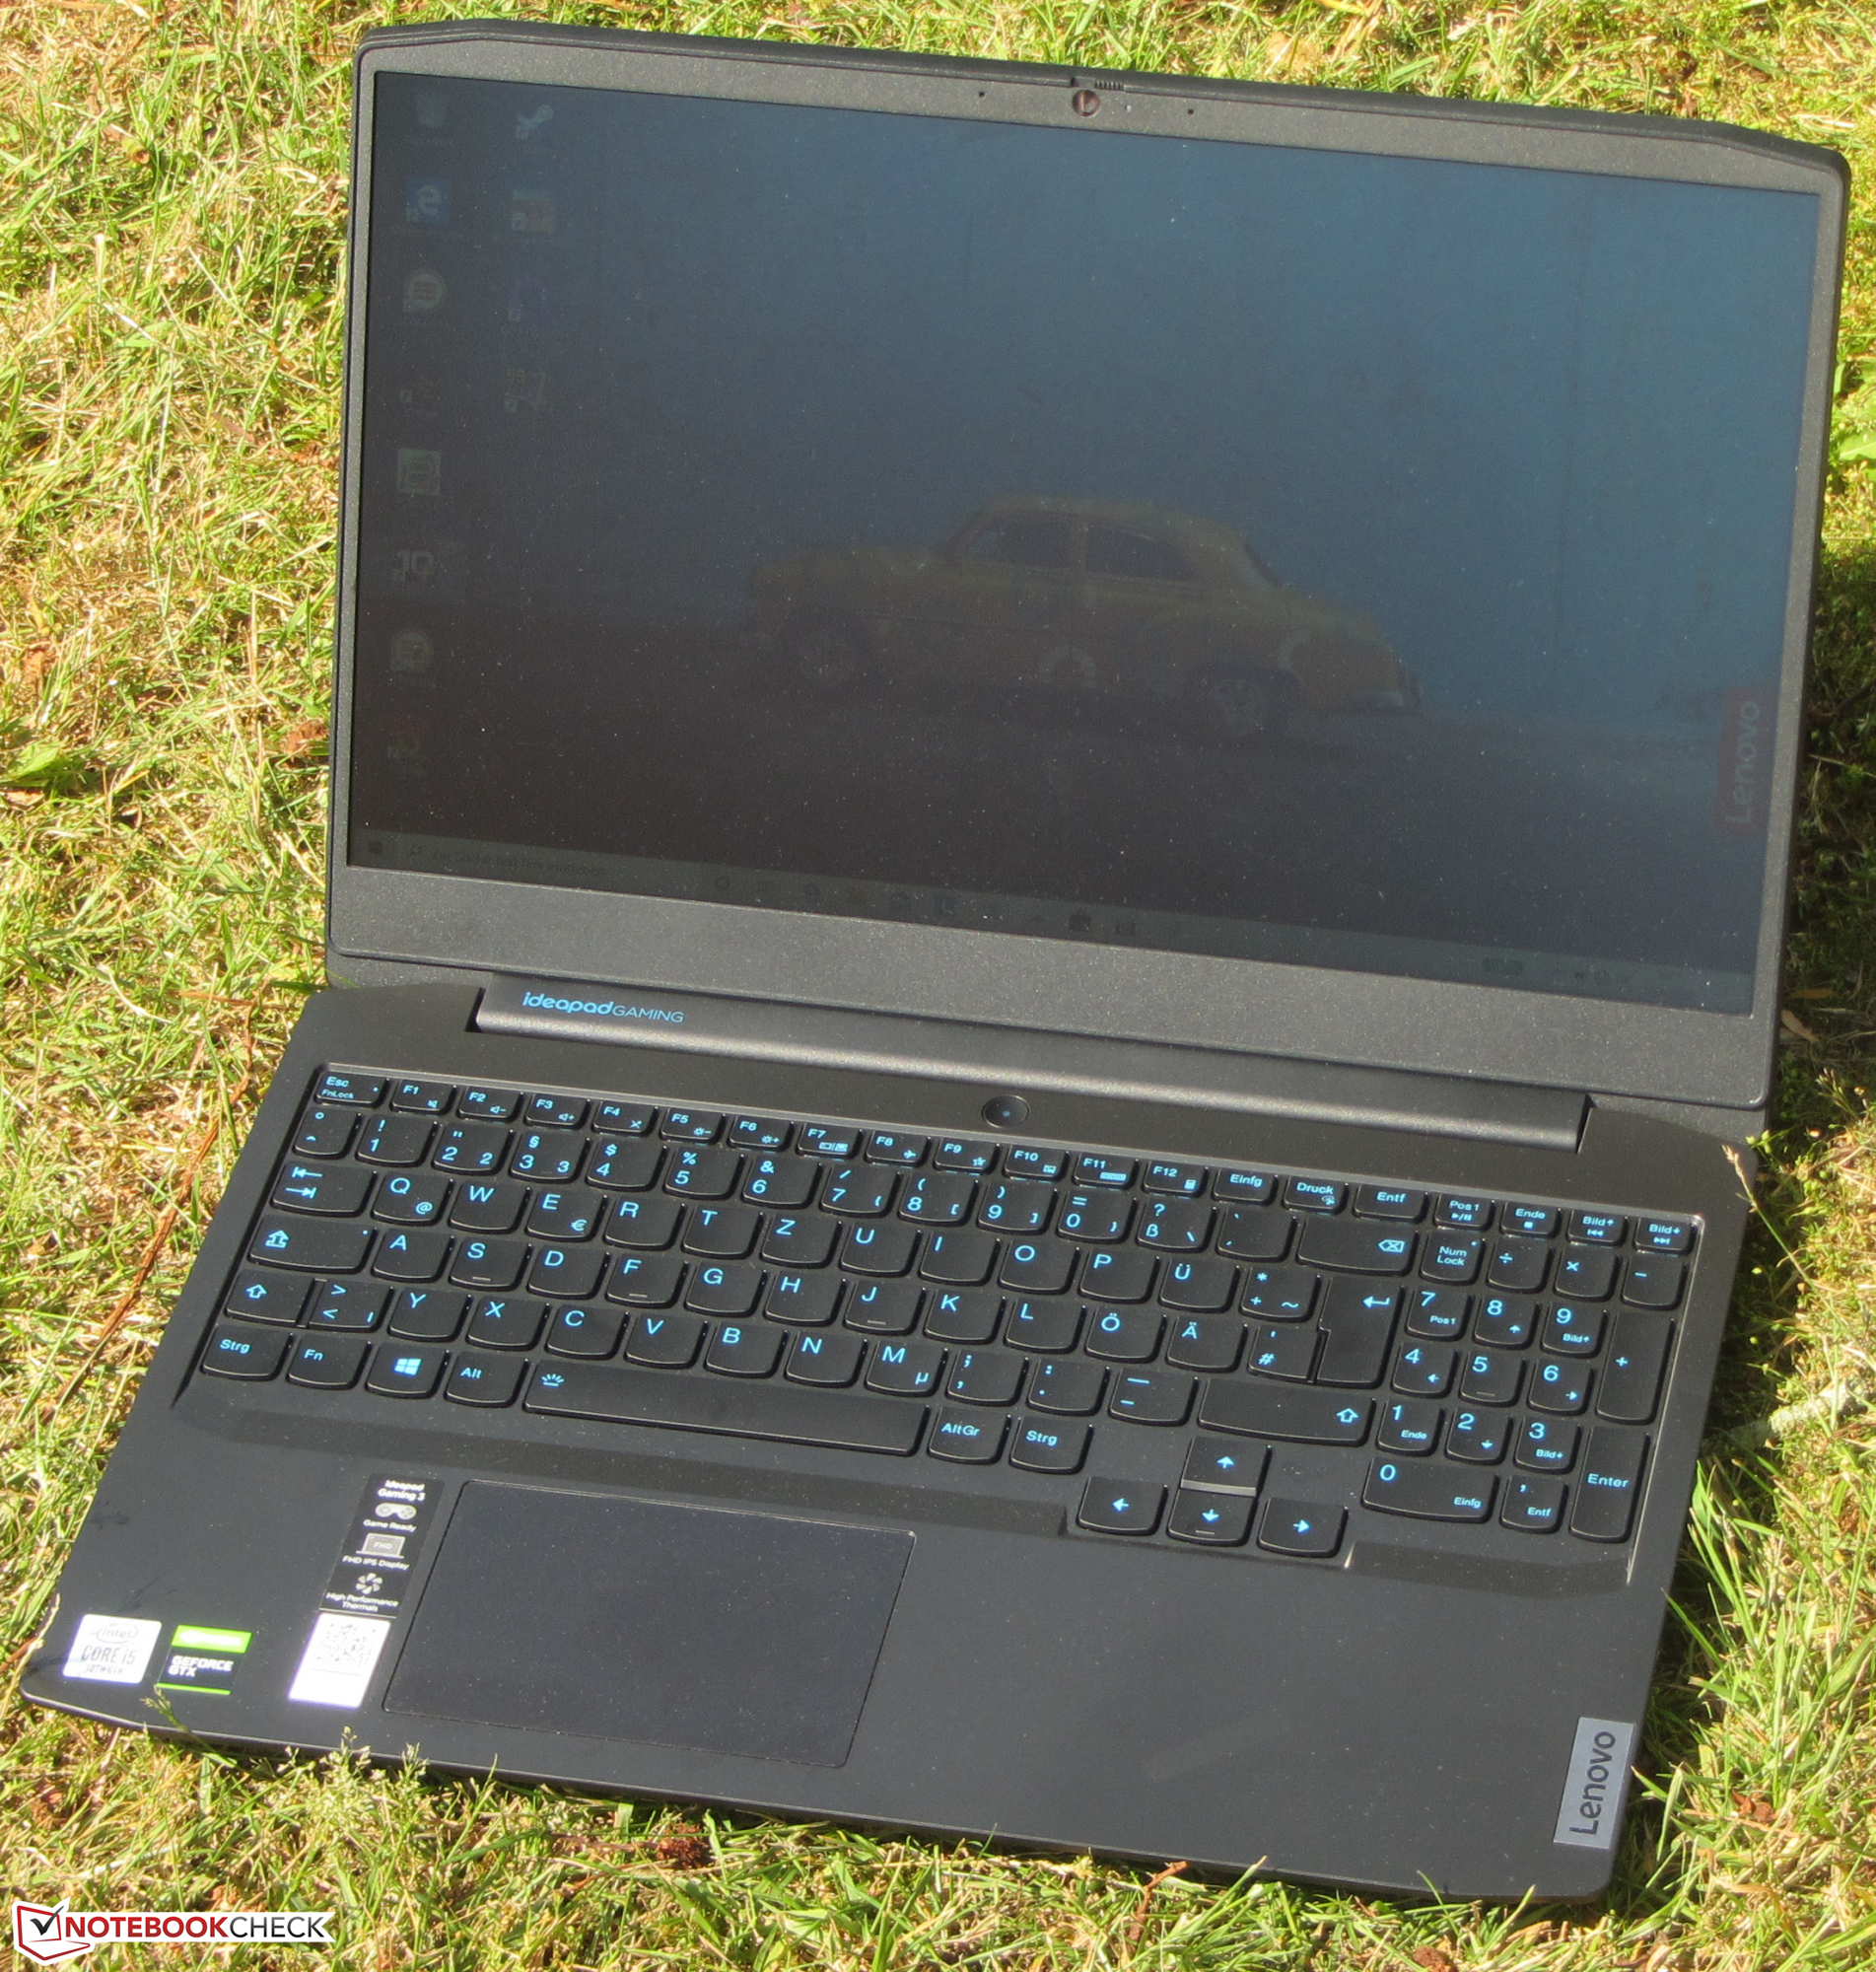
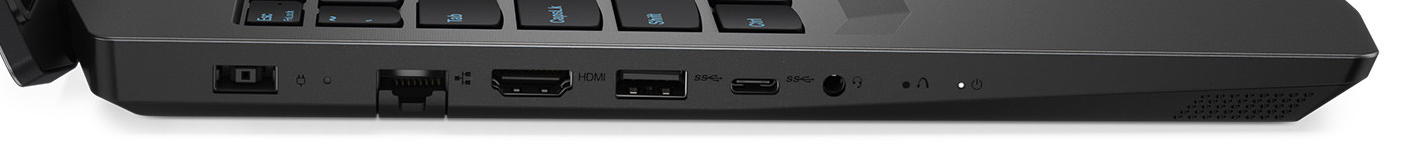
O computador não oferece uma infinidade de conexões. Como resultado, não há um leitor de cartões de memória nem uma porta Thunderbolt 3. A porta USB Type-C 3.2 Gen 1 disponível não suporta o DisplayPort via função USB-C. O teclado integrado (luz de fundo de dois estágios) provou ser adequado para o uso diário. Além disso, a duração da bateria é boa.
Lenovo IdeaPad Gaming 3i 15IMH05
- 07/02/2020 v7 (old)
Sascha Mölck
Price comparison
