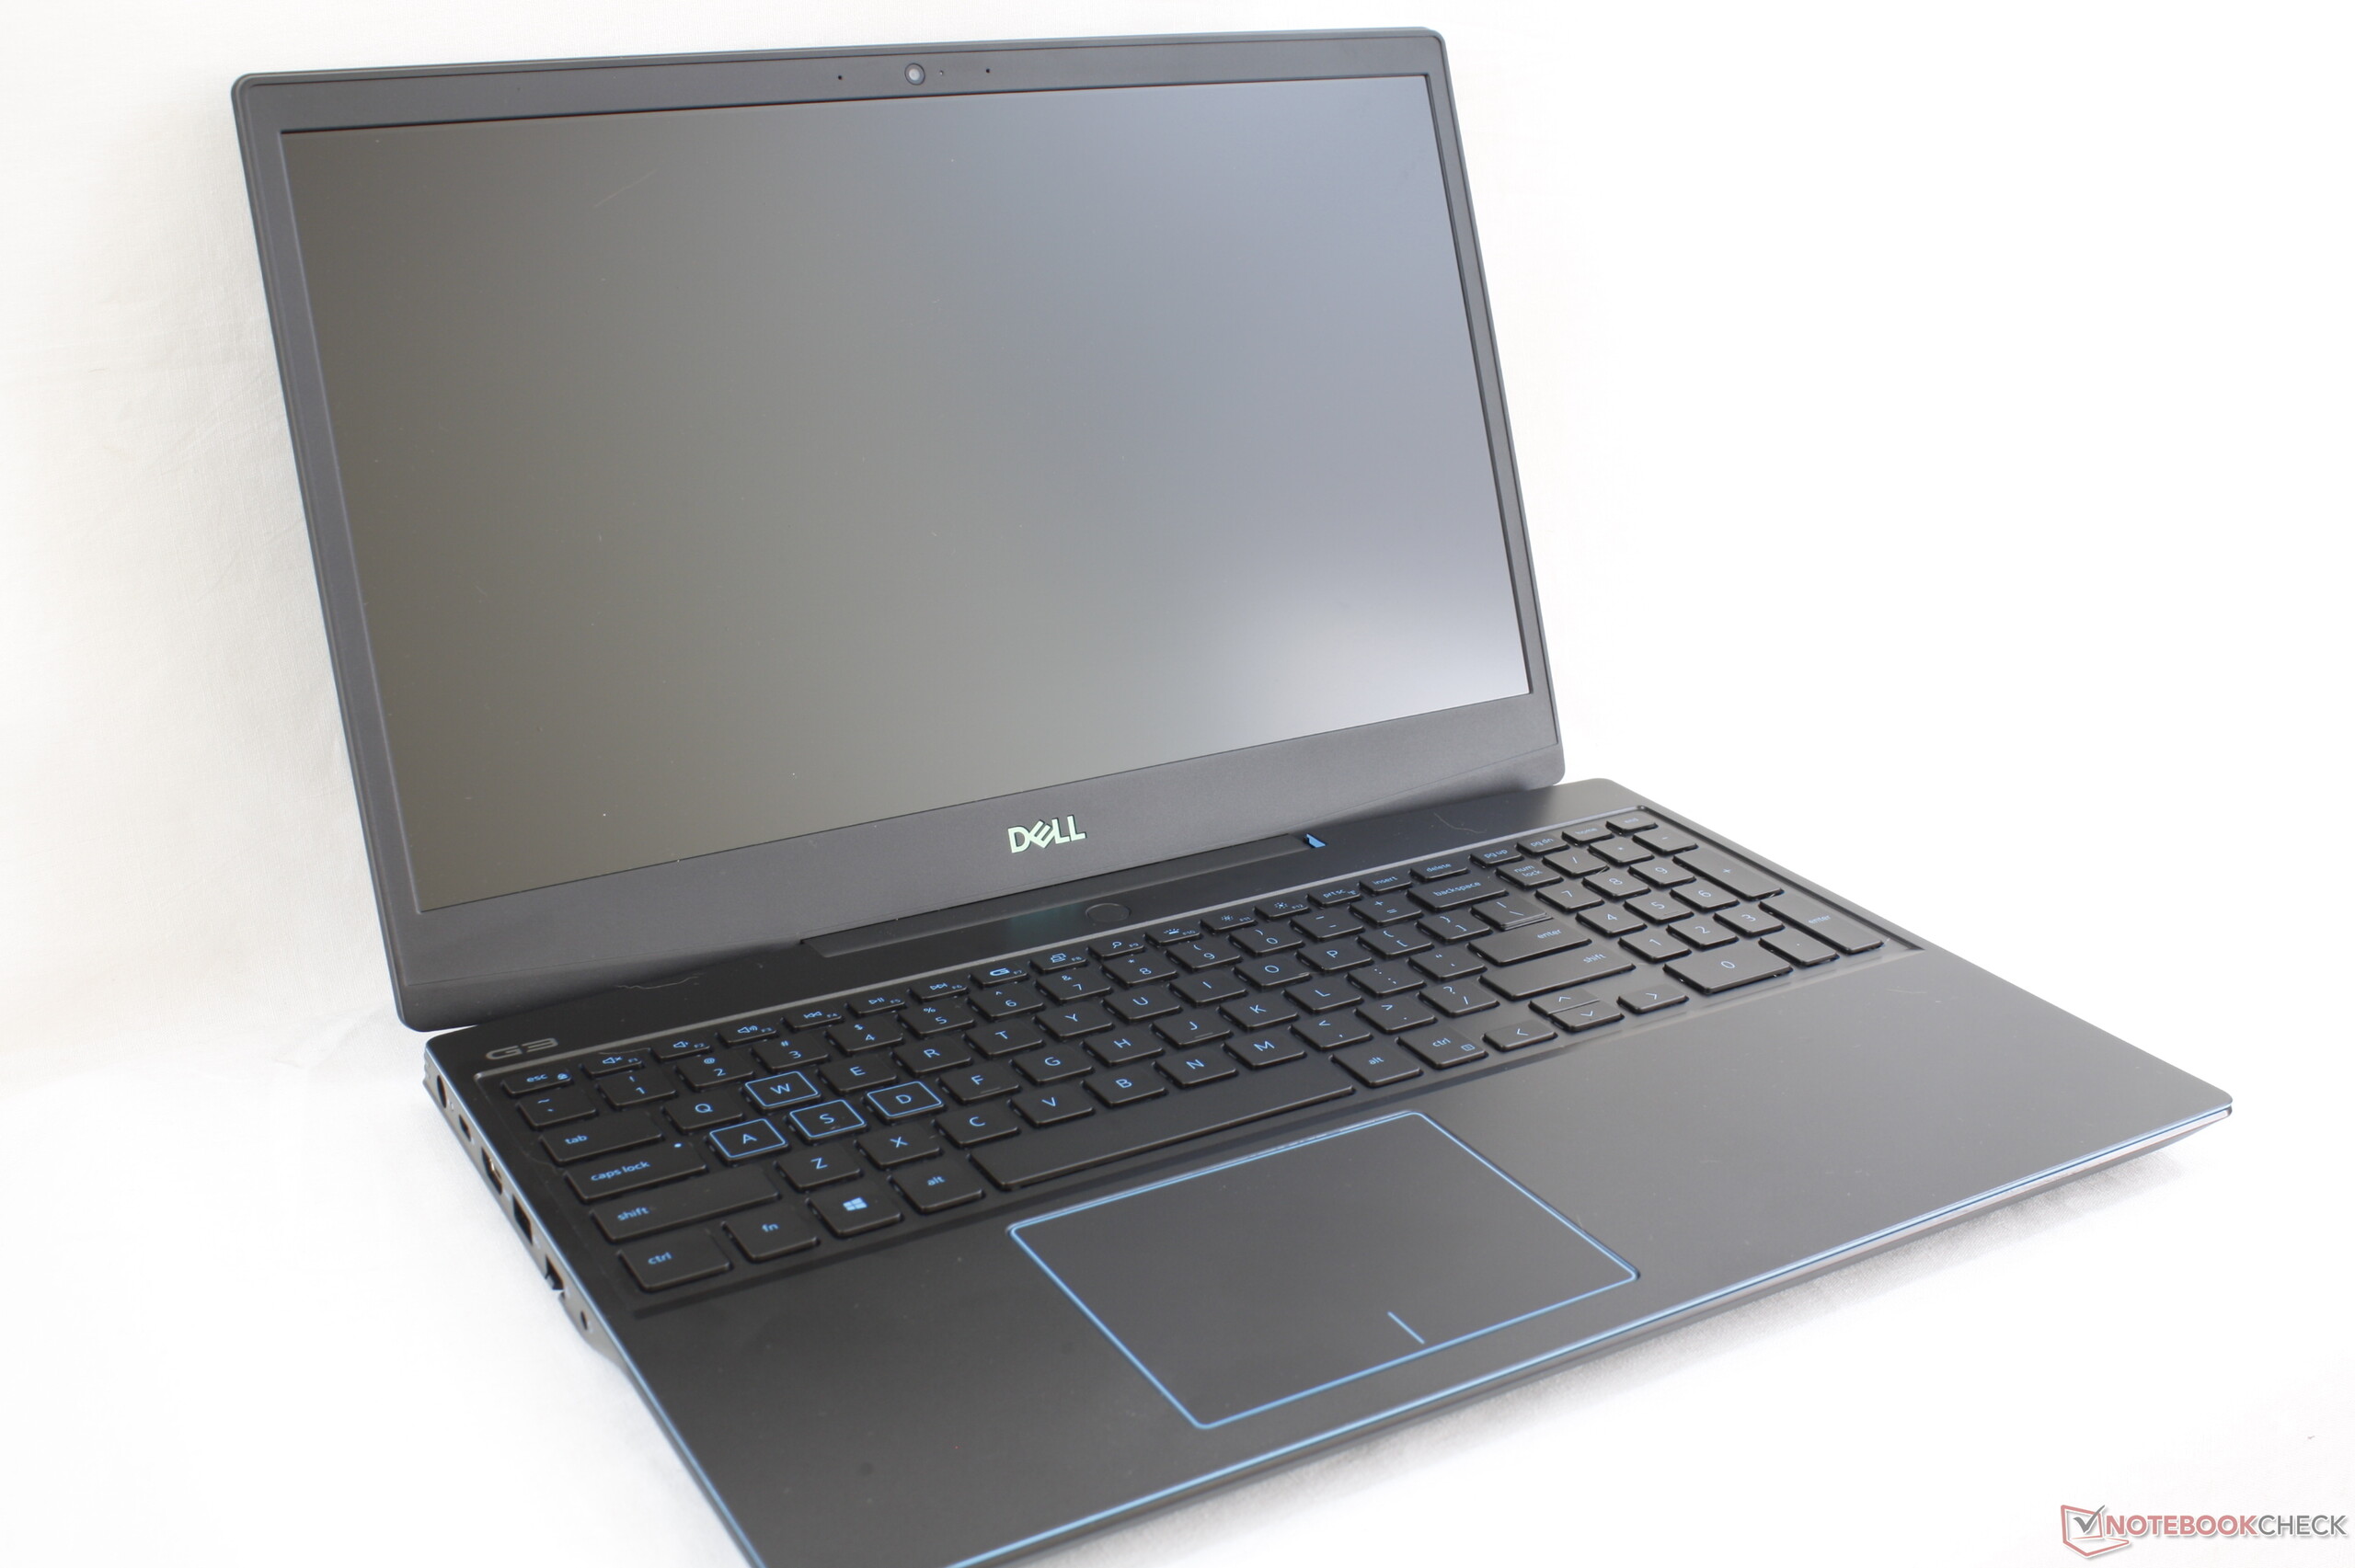
Breve Análise do Portátil Dell G3 15 3590: Barato com atualizações fáceis
Avaliação | Data | Modelo | Peso | Altura | Size | Resolução | Preço |
|---|---|---|---|---|---|---|---|
| 79.3 % v7 (old) | 10/2019 | Dell G3 3590 i5-9300H, GeForce GTX 1650 Mobile | 2.5 kg | 21.6 mm | 15.60" | 1920x1080 | |
| 85.5 % v6 (old) | 06/2019 | Aorus 15-SA i7-9750H, GeForce GTX 1660 Ti Mobile | 2.1 kg | 24.4 mm | 15.60" | 1920x1080 | |
| 83.9 % v7 (old) | 08/2019 | HP Gaming Pavilion 15-dk0009ng i7-9750H, GeForce GTX 1660 Ti Max-Q | 2.4 kg | 23.4 mm | 15.60" | 1920x1080 | |
| 83.3 % v6 (old) | 05/2019 | Asus ROG Zephyrus G15 GA502DU R7 3750H, GeForce GTX 1660 Ti Max-Q | 2.1 kg | 20.4 mm | 15.60" | 1920x1080 |
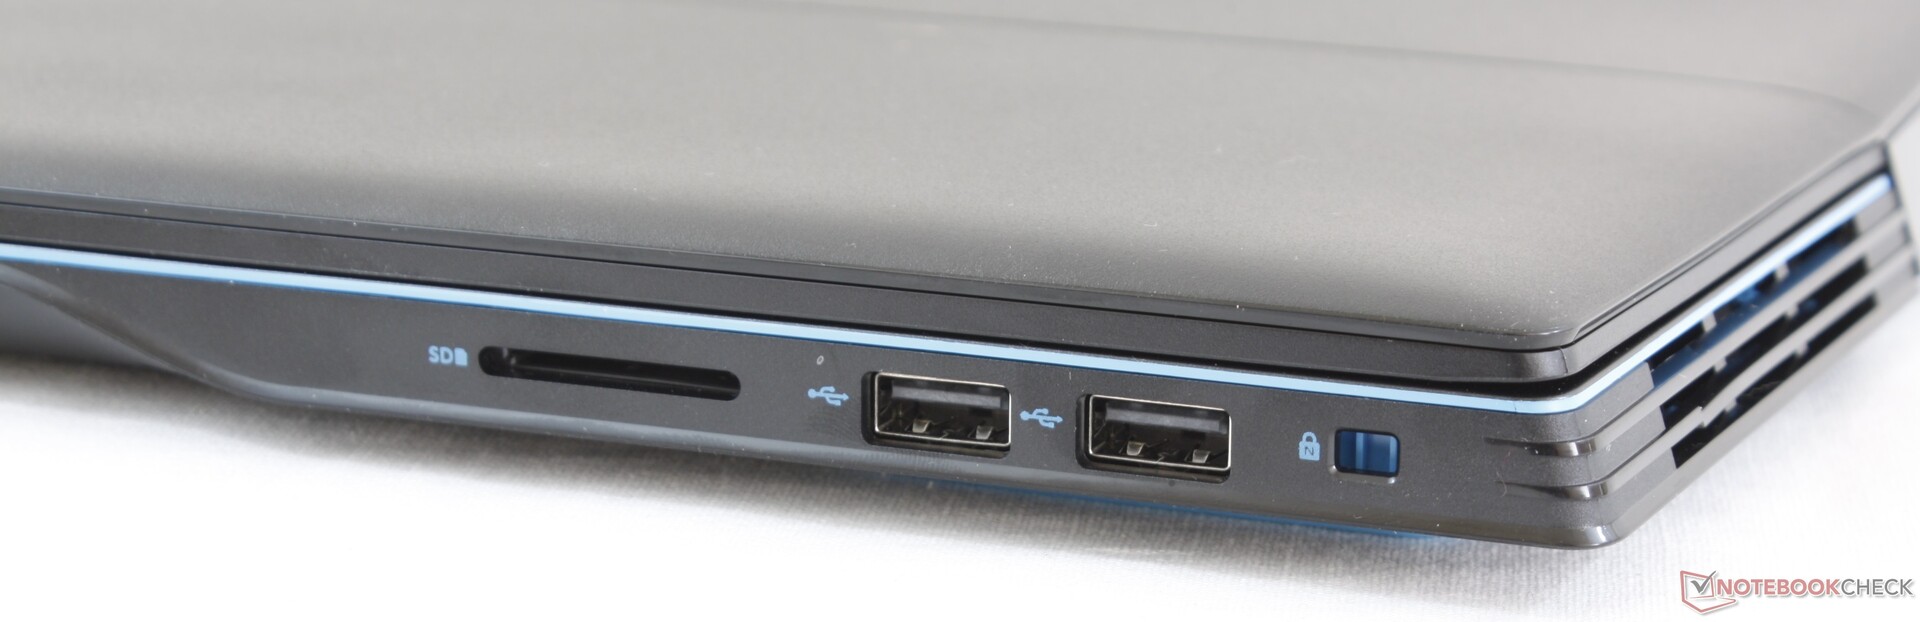
| SD Card Reader | |
| average JPG Copy Test (av. of 3 runs) | |
| HP Gaming Pavilion 15-dk0009ng (Toshiba Exceria Pro SDXC 64 GB UHS-II) | |
| Dell G3 15 3579 (Toshiba Exceria Pro SDXC 64 GB UHS-II) | |
| Dell G3 3590 (Toshiba Exceria Pro SDXC 64 GB UHS-II) | |
| maximum AS SSD Seq Read Test (1GB) | |
| HP Gaming Pavilion 15-dk0009ng (Toshiba Exceria Pro SDXC 64 GB UHS-II) | |
| Dell G3 3590 (Toshiba Exceria Pro SDXC 64 GB UHS-II) | |
| Dell G3 15 3579 (Toshiba Exceria Pro SDXC 64 GB UHS-II) | |
| Networking | |
| iperf3 transmit AX12 | |
| Aorus 15-SA | |
| Lenovo Legion Y540-15IRH-81SX00B2GE | |
| Alienware m15 R2 P87F | |
| Dell G3 15 3579 | |
| Dell G3 3590 | |
| iperf3 receive AX12 | |
| Aorus 15-SA | |
| Alienware m15 R2 P87F | |
| Lenovo Legion Y540-15IRH-81SX00B2GE | |
| Dell G3 3590 | |
| Dell G3 15 3579 | |
| |||||||||||||||||||||||||
iluminação: 86 %
iluminação com acumulador: 172 cd/m²
Contraste: 1151:1 (Preto: 0.24 cd/m²)
ΔE ColorChecker Calman: 5.56 | ∀{0.5-29.43 Ø4.72}
calibrated: 5.23
ΔE Greyscale Calman: 2.8 | ∀{0.09-98 Ø4.97}
59% sRGB (Argyll 1.6.3 3D)
37.8% AdobeRGB 1998 (Argyll 1.6.3 3D)
41.47% AdobeRGB 1998 (Argyll 3D)
59.8% sRGB (Argyll 3D)
40.13% Display P3 (Argyll 3D)
Gamma: 2.37
CCT: 6710 K
| Dell G3 3590 BOE NV15N3D, IPS, 15.6", 1920x1080 | Dell G3 15 3579 LG Philips LP156WF6, IPS, 15.6", 1920x1080 | Lenovo Legion Y540-15IRH-81SX00B2GE BOE 084D, IPS, 15.6", 1920x1080 | Aorus 15-SA LG Philips LP156WFG-SPB2 (LGD05E8), IPS, 15.6", 1920x1080 | Alienware m15 R2 P87F Sharp LQ156M1, IPS, 15.6", 1920x1080 | HP Gaming Pavilion 15-dk0009ng LG Philips LGD05FE, IPS, 15.6", 1920x1080 | |
|---|---|---|---|---|---|---|
| Display | -4% | 56% | 58% | 60% | 59% | |
| Display P3 Coverage (%) | 40.13 | 38.48 -4% | 63.6 58% | 64.3 60% | 65.3 63% | 64.2 60% |
| sRGB Coverage (%) | 59.8 | 57.9 -3% | 91.7 53% | 93.6 57% | 95.1 59% | 95.1 59% |
| AdobeRGB 1998 Coverage (%) | 41.47 | 39.75 -4% | 65.2 57% | 65.6 58% | 65.9 59% | 65.8 59% |
| Response Times | 29% | 72% | 63% | 69% | 66% | |
| Response Time Grey 50% / Grey 80% * (ms) | 46 ? | 32.4 ? 30% | 8.8 ? 81% | 15.6 ? 66% | 16.4 ? 64% | 16.4 ? 64% |
| Response Time Black / White * (ms) | 32.4 ? | 23.2 ? 28% | 12 ? 63% | 12.8 ? 60% | 8.8 ? 73% | 10.4 ? 68% |
| PWM Frequency (Hz) | 200 ? | 23810 ? | ||||
| Screen | -11% | 20% | 21% | 2% | 33% | |
| Brightness middle (cd/m²) | 276.2 | 208.2 -25% | 299 8% | 266 -4% | 324.2 17% | 345 25% |
| Brightness (cd/m²) | 261 | 203 -22% | 290 11% | 254 -3% | 304 16% | 324 24% |
| Brightness Distribution (%) | 86 | 81 -6% | 89 3% | 90 5% | 90 5% | 86 0% |
| Black Level * (cd/m²) | 0.24 | 0.34 -42% | 0.29 -21% | 0.28 -17% | 0.38 -58% | 0.42 -75% |
| Contrast (:1) | 1151 | 612 -47% | 1031 -10% | 950 -17% | 853 -26% | 821 -29% |
| Colorchecker dE 2000 * | 5.56 | 4.65 16% | 3.7 33% | 3.11 44% | 5.01 10% | 1.3 77% |
| Colorchecker dE 2000 max. * | 23.45 | 15.99 32% | 7 70% | 5.84 75% | 12.7 46% | 2.8 88% |
| Colorchecker dE 2000 calibrated * | 5.23 | 3.84 27% | 2 62% | 1.37 74% | 1.64 69% | 1.1 79% |
| Greyscale dE 2000 * | 2.8 | 4.1 -46% | 4.1 -46% | 3.94 -41% | 7.9 -182% | 1.2 57% |
| Gamma | 2.37 93% | 2.3 96% | 2.19 100% | 2.53 87% | 2.35 94% | 2.31 95% |
| CCT | 6710 97% | 7352 88% | 7166 91% | 6210 105% | 8455 77% | 6476 100% |
| Color Space (Percent of AdobeRGB 1998) (%) | 37.8 | 36.7 -3% | 59.3 57% | 60 59% | 60.8 61% | 60.5 60% |
| Color Space (Percent of sRGB) (%) | 59 | 57.9 -2% | 91.5 55% | 93 58% | 95.5 62% | 94.9 61% |
| Média Total (Programa/Configurações) | 5% /
-4% | 49% /
33% | 47% /
33% | 44% /
21% | 53% /
42% |
* ... menor é melhor
Exibir tempos de resposta
| ↔ Tempo de resposta preto para branco | ||
|---|---|---|
| 32.4 ms ... ascensão ↗ e queda ↘ combinadas | ↗ 18.4 ms ascensão | 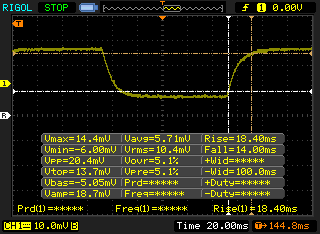 |
| ↘ 14 ms queda | ||
| A tela mostra taxas de resposta lentas em nossos testes e será insatisfatória para os jogadores. Em comparação, todos os dispositivos testados variam de 0.1 (mínimo) a 240 (máximo) ms. » 88 % de todos os dispositivos são melhores. Isso significa que o tempo de resposta medido é pior que a média de todos os dispositivos testados (19.8 ms). | ||
| ↔ Tempo de resposta 50% cinza a 80% cinza | ||
| 46 ms ... ascensão ↗ e queda ↘ combinadas | ↗ 22 ms ascensão | 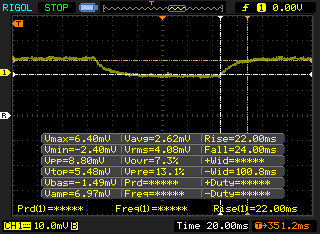 |
| ↘ 24 ms queda | ||
| A tela mostra taxas de resposta lentas em nossos testes e será insatisfatória para os jogadores. Em comparação, todos os dispositivos testados variam de 0.165 (mínimo) a 636 (máximo) ms. » 79 % de todos os dispositivos são melhores. Isso significa que o tempo de resposta medido é pior que a média de todos os dispositivos testados (31 ms). | ||
Cintilação da tela / PWM (modulação por largura de pulso)
| Tela tremeluzindo/PWM detectado | 200 Hz | ≤ 98 % configuração de brilho | 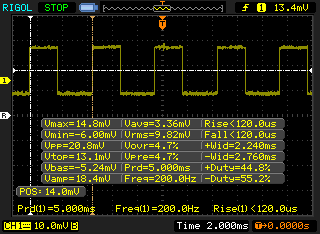 |
A luz de fundo da tela pisca em 200 Hz (pior caso, por exemplo, utilizando PWM) Cintilação detectada em uma configuração de brilho de 98 % e abaixo. Não deve haver cintilação ou PWM acima desta configuração de brilho. A frequência de 200 Hz é relativamente baixa, portanto, usuários sensíveis provavelmente notarão cintilação e sentirão fadiga ocular na configuração de brilho indicada e abaixo. [pwm_comparison] Em comparação: 52 % de todos os dispositivos testados não usam PWM para escurecer a tela. Se PWM foi detectado, uma média de 7763 (mínimo: 5 - máximo: 343500) Hz foi medida. | |||
| Cinebench R15 | |
| CPU Single 64Bit | |
| Alienware Area-51m i9-9900K RTX 2080 | |
| Alienware m17 P37E | |
| Alienware m15 R2 P87F | |
| Média Intel Core i5-9300H (169 - 176, n=11) | |
| Dell G3 3590 | |
| Dell G3 15 3579 | |
| Dell G7 17 7790 | |
| Dell Inspiron 15 7000 7577 4K | |
| Asus ROG Zephyrus G15 GA502DU | |
| Alienware 13 R3 (i5-7300HQ, GTX 1050 Ti) | |
| CPU Multi 64Bit | |
| Alienware Area-51m i9-9900K RTX 2080 | |
| Alienware m17 P37E | |
| Dell G7 17 7790 | |
| Alienware m15 R2 P87F | |
| Dell G3 15 3579 | |
| Asus ROG Zephyrus G15 GA502DU | |
| Dell G3 3590 | |
| Média Intel Core i5-9300H (717 - 850, n=11) | |
| Dell Inspiron 15 7000 7577 4K | |
| Alienware 13 R3 (i5-7300HQ, GTX 1050 Ti) | |
| Cinebench R11.5 | |
| CPU Single 64Bit | |
| Dell Inspiron 15 7000 7577 4K | |
| Asus ROG Zephyrus G15 GA502DU | |
| CPU Multi 64Bit | |
| Asus ROG Zephyrus G15 GA502DU | |
| Dell Inspiron 15 7000 7577 4K | |
| Cinebench R10 | |
| Rendering Multiple CPUs 32Bit | |
| Média Intel Core i5-9300H (21798 - 25656, n=5) | |
| Dell Inspiron 15 7000 7577 4K | |
| Asus ROG Zephyrus G15 GA502DU | |
| Rendering Single 32Bit | |
| Média Intel Core i5-9300H (6421 - 6677, n=5) | |
| Dell Inspiron 15 7000 7577 4K | |
| Asus ROG Zephyrus G15 GA502DU | |
| wPrime 2.10 - 1024m | |
| Dell Inspiron 15 7000 7577 4K | |
| Asus ROG Zephyrus G15 GA502DU | |
* ... menor é melhor
| PCMark 8 Home Score Accelerated v2 | 3792 pontos | |
| PCMark 8 Work Score Accelerated v2 | 5088 pontos | |
| PCMark 10 Score | 4798 pontos | |
Ajuda | ||
| Dell G3 3590 Toshiba BG4 KBG40ZNS128G | Dell G7 17 7790 Toshiba BG3 KBG30ZMS256G | Aorus 15-SA Intel SSD 760p SSDPEKKW512G8 | Razer Blade 15 GTX 1660 Ti Samsung SSD PM981 MZVLB256HAHQ | Dell XPS 15 7590 i5 iGPU FHD Toshiba XG6 KXG60ZNV512G | Asus ROG Zephyrus G15 GA502DU Intel SSD 660p SSDPEKNW512G8 | |
|---|---|---|---|---|---|---|
| AS SSD | 26% | 361% | 387% | 466% | 226% | |
| Seq Read (MB/s) | 1174 | 1033 -12% | 2601 122% | 1829 56% | 2357 101% | 907 -23% |
| Seq Write (MB/s) | 186 | 218.3 17% | 1507 710% | 1315 607% | 1235 564% | 926 398% |
| 4K Read (MB/s) | 34.01 | 24.12 -29% | 56.3 66% | 51.3 51% | 43.29 27% | 47.26 39% |
| 4K Write (MB/s) | 69.4 | 55 -21% | 110.3 59% | 106 53% | 99.7 44% | 98.7 42% |
| 4K-64 Read (MB/s) | 424 | 330.3 -22% | 877 107% | 917 116% | 1020 141% | 321.5 -24% |
| 4K-64 Write (MB/s) | 68.8 | 155.8 126% | 914 1228% | 1212 1662% | 1502 2083% | 736 970% |
| Access Time Read * (ms) | 0.168 | 0.18 -7% | 0.05 70% | 0.063 62% | 0.07 58% | 0.064 62% |
| Access Time Write * (ms) | 0.94 | 0.314 67% | 0.034 96% | 0.104 89% | 0.039 96% | 0.045 95% |
| Score Read (Points) | 575 | 458 -20% | 1193 107% | 1152 100% | 1299 126% | 459 -20% |
| Score Write (Points) | 157 | 233 48% | 1175 648% | 1450 824% | 1726 999% | 927 490% |
| Score Total (Points) | 987 | 891 -10% | 2938 198% | 3177 222% | 3640 269% | 1641 66% |
| Copy ISO MB/s (MB/s) | 215.7 | 382.9 78% | 2104 875% | 1539 613% | 2145 894% | 905 320% |
| Copy Program MB/s (MB/s) | 108.2 | 234.9 117% | 387.7 258% | 513 374% | 565 422% | 496.9 359% |
| Copy Game MB/s (MB/s) | 165.9 | 218.7 32% | 1021 515% | 1150 593% | 1320 696% | 819 394% |
* ... menor é melhor

| 3DMark 11 Performance | 11845 pontos | |
| 3DMark Cloud Gate Standard Score | 24291 pontos | |
| 3DMark Fire Strike Score | 8081 pontos | |
| 3DMark Time Spy Score | 3608 pontos | |
Ajuda | ||
| Shadow of the Tomb Raider - 1920x1080 High Preset AA:SM | |
| Alienware Area-51m i9-9900K RTX 2080 | |
| Alienware m15 R2 P87F | |
| Alienware m15 P79F | |
| Razer Blade 15 GTX 1660 Ti | |
| HP Pavilion Gaming 17-cd0085cl | |
| Asus TUF FX705GM | |
| Asus ROG Zephyrus G15 GA502DU | |
| MSI GF75 Thin 9SC | |
| Dell G3 3590 | |
| Gainward GeForce GTX 1650 4 GB | |
| Média NVIDIA GeForce GTX 1650 Mobile (38 - 53, n=15) | |
| Asus TUF FX705GE-EW096T | |
| Asus GL753VD | |
| baixo | média | alto | ultra | |
|---|---|---|---|---|
| BioShock Infinite (2013) | 259.9 | 221.8 | 193.6 | 85.6 |
| The Witcher 3 (2015) | 175.1 | 115.8 | 65.9 | 36.2 |
| Rocket League (2017) | 247 | 188.7 | 137.2 | |
| Shadow of the Tomb Raider (2018) | 102 | 61 | 51 |
| Dell G3 3590 GeForce GTX 1650 Mobile, i5-9300H, Toshiba BG4 KBG40ZNS128G | Dell G3 15 3579 GeForce GTX 1050 Mobile, i5-8300H, Seagate Mobile HDD 1TB ST1000LX015-1U7172 | Lenovo Legion Y540-15IRH-81SX00B2GE GeForce GTX 1660 Ti Mobile, i7-9750H, WDC PC SN720 SDAPNTW-512G | Aorus 15-SA GeForce GTX 1660 Ti Mobile, i7-9750H, Intel SSD 760p SSDPEKKW512G8 | Alienware m15 R2 P87F GeForce RTX 2080 Max-Q, i7-9750H, 2x Toshiba XG6 KXG60ZNV512G (RAID 0) | HP Gaming Pavilion 15-dk0009ng GeForce GTX 1660 Ti Max-Q, i7-9750H, Samsung SSD PM981 MZVLB256HAHQ | |
|---|---|---|---|---|---|---|
| Noise | 0% | 3% | -18% | -14% | 9% | |
| desligado / ambiente * (dB) | 28.4 | 28 1% | 29.3 -3% | 29 -2% | 28.3 -0% | 28.2 1% |
| Idle Minimum * (dB) | 29.2 | 29.8 -2% | 29.3 -0% | 32 -10% | 28.5 2% | 29.3 -0% |
| Idle Average * (dB) | 29.4 | 29.8 -1% | 29.3 -0% | 35 -19% | 28.5 3% | 29.3 -0% |
| Idle Maximum * (dB) | 29.4 | 30 -2% | 29.3 -0% | 41 -39% | 49 -67% | 29.3 -0% |
| Load Average * (dB) | 39 | 38.6 1% | 35.7 8% | 54 -38% | 49 -26% | 32.3 17% |
| Witcher 3 ultra * (dB) | 49.5 | 46.9 5% | 44.2 11% | 52 -5% | 49 1% | 34 31% |
| Load Maximum * (dB) | 49.7 | 49.4 1% | 45.6 8% | 56 -13% | 55 -11% | 41.2 17% |
* ... menor é melhor
Barulho
| Ocioso |
| 29.2 / 29.4 / 29.4 dB |
| Carga |
| 39 / 49.7 dB |
 | ||
30 dB silencioso 40 dB(A) audível 50 dB(A) ruidosamente alto |
||
min: | ||
(-) A temperatura máxima no lado superior é 49 °C / 120 F, em comparação com a média de 40.4 °C / 105 F , variando de 21.2 a 68.8 °C para a classe Gaming.
(-) A parte inferior aquece até um máximo de 49.8 °C / 122 F, em comparação com a média de 43.2 °C / 110 F
(+) Em uso inativo, a temperatura média para o lado superior é 28.8 °C / 84 F, em comparação com a média do dispositivo de 33.9 °C / ### class_avg_f### F.
(±) Jogando The Witcher 3, a temperatura média para o lado superior é 37.3 °C / 99 F, em comparação com a média do dispositivo de 33.9 °C / ## #class_avg_f### F.
(+) Os apoios para as mãos e o touchpad são mais frios que a temperatura da pele, com um máximo de 31.2 °C / 88.2 F e, portanto, são frios ao toque.
(-) A temperatura média da área do apoio para as mãos de dispositivos semelhantes foi 28.8 °C / 83.8 F (-2.4 °C / -4.4 F).
Dell G3 3590 análise de áudio
(+) | os alto-falantes podem tocar relativamente alto (###valor### dB)
Graves 100 - 315Hz
(-) | quase nenhum baixo - em média 16.9% menor que a mediana
(±) | a linearidade dos graves é média (10.9% delta para a frequência anterior)
Médios 400 - 2.000 Hz
(±) | médios mais altos - em média 6.5% maior que a mediana
(+) | médios são lineares (5.9% delta para frequência anterior)
Altos 2 - 16 kHz
(+) | agudos equilibrados - apenas 3.5% longe da mediana
(±) | a linearidade dos máximos é média (9.4% delta para frequência anterior)
Geral 100 - 16.000 Hz
(±) | a linearidade do som geral é média (22.8% diferença em relação à mediana)
Comparado com a mesma classe
» 82% de todos os dispositivos testados nesta classe foram melhores, 5% semelhantes, 13% piores
» O melhor teve um delta de 6%, a média foi 18%, o pior foi 132%
Comparado com todos os dispositivos testados
» 67% de todos os dispositivos testados foram melhores, 6% semelhantes, 27% piores
» O melhor teve um delta de 4%, a média foi 24%, o pior foi 134%
Apple MacBook 12 (Early 2016) 1.1 GHz análise de áudio
(+) | os alto-falantes podem tocar relativamente alto (###valor### dB)
Graves 100 - 315Hz
(±) | graves reduzidos - em média 11.3% menor que a mediana
(±) | a linearidade dos graves é média (14.2% delta para a frequência anterior)
Médios 400 - 2.000 Hz
(+) | médios equilibrados - apenas 2.4% longe da mediana
(+) | médios são lineares (5.5% delta para frequência anterior)
Altos 2 - 16 kHz
(+) | agudos equilibrados - apenas 2% longe da mediana
(+) | os máximos são lineares (4.5% delta da frequência anterior)
Geral 100 - 16.000 Hz
(+) | o som geral é linear (10.2% diferença em relação à mediana)
Comparado com a mesma classe
» 7% de todos os dispositivos testados nesta classe foram melhores, 2% semelhantes, 91% piores
» O melhor teve um delta de 5%, a média foi 18%, o pior foi 53%
Comparado com todos os dispositivos testados
» 5% de todos os dispositivos testados foram melhores, 1% semelhantes, 94% piores
» O melhor teve um delta de 4%, a média foi 24%, o pior foi 134%
| desligado | |
| Ocioso | |
| Carga |
|
Key:
min: | |
| Dell G3 3590 i5-9300H, GeForce GTX 1650 Mobile, Toshiba BG4 KBG40ZNS128G, IPS, 1920x1080, 15.6" | Dell G3 15 3579 i5-8300H, GeForce GTX 1050 Mobile, Seagate Mobile HDD 1TB ST1000LX015-1U7172, IPS, 1920x1080, 15.6" | Aorus 15-SA i7-9750H, GeForce GTX 1660 Ti Mobile, Intel SSD 760p SSDPEKKW512G8, IPS, 1920x1080, 15.6" | Alienware m15 R2 P87F i7-9750H, GeForce RTX 2080 Max-Q, 2x Toshiba XG6 KXG60ZNV512G (RAID 0), IPS, 1920x1080, 15.6" | HP Gaming Pavilion 15-dk0009ng i7-9750H, GeForce GTX 1660 Ti Max-Q, Samsung SSD PM981 MZVLB256HAHQ, IPS, 1920x1080, 15.6" | MSI GS65 Stealth Thin 8RE-051US i7-8750H, GeForce GTX 1060 Mobile, Samsung SSD PM981 MZVLB256HAHQ, IPS, 1920x1080, 15.6" | |
|---|---|---|---|---|---|---|
| Power Consumption | 0% | -79% | -147% | -9% | -20% | |
| Idle Minimum * (Watt) | 6.2 | 7.9 -27% | 20 -223% | 19 -206% | 6.8 -10% | 8.7 -40% |
| Idle Average * (Watt) | 8.4 | 9.6 -14% | 23 -174% | 40.5 -382% | 10.7 -27% | 13 -55% |
| Idle Maximum * (Watt) | 27.7 | 13 53% | 29 -5% | 52 -88% | 12.5 55% | 14.3 48% |
| Load Average * (Watt) | 91 | 93 -2% | 87 4% | 132.3 -45% | 87.2 4% | 107.4 -18% |
| Witcher 3 ultra * (Watt) | 94.4 | 100.6 -7% | 136 -44% | 183.3 -94% | 121 -28% | 129 -37% |
| Load Maximum * (Watt) | 131.5 | 132.7 -1% | 173 -32% | 217.2 -65% | 191.4 -46% | 151.5 -15% |
* ... menor é melhor
| Dell G3 3590 i5-9300H, GeForce GTX 1650 Mobile, 51 Wh | Dell G3 15 3579 i5-8300H, GeForce GTX 1050 Mobile, 56 Wh | Lenovo Legion Y540-15IRH-81SX00B2GE i7-9750H, GeForce GTX 1660 Ti Mobile, 57 Wh | Aorus 15-SA i7-9750H, GeForce GTX 1660 Ti Mobile, 62 Wh | Alienware m15 R2 P87F i7-9750H, GeForce RTX 2080 Max-Q, 76 Wh | HP Gaming Pavilion 15-dk0009ng i7-9750H, GeForce GTX 1660 Ti Max-Q, 52.5 Wh | |
|---|---|---|---|---|---|---|
| Duração da bateria | 27% | -47% | -30% | -33% | -24% | |
| Reader / Idle (h) | 13.5 | 4 -70% | 3.5 -74% | 9.2 -32% | 8.7 -36% | |
| WiFi v1.3 (h) | 6.7 | 6.5 -3% | 2.4 -64% | 2.8 -58% | 5.5 -18% | 4.8 -28% |
| Load (h) | 1.4 | 2.2 57% | 1.3 -7% | 2 43% | 0.7 -50% | 1.3 -7% |
| Witcher 3 ultra (h) | 1 |
Pro
Contra
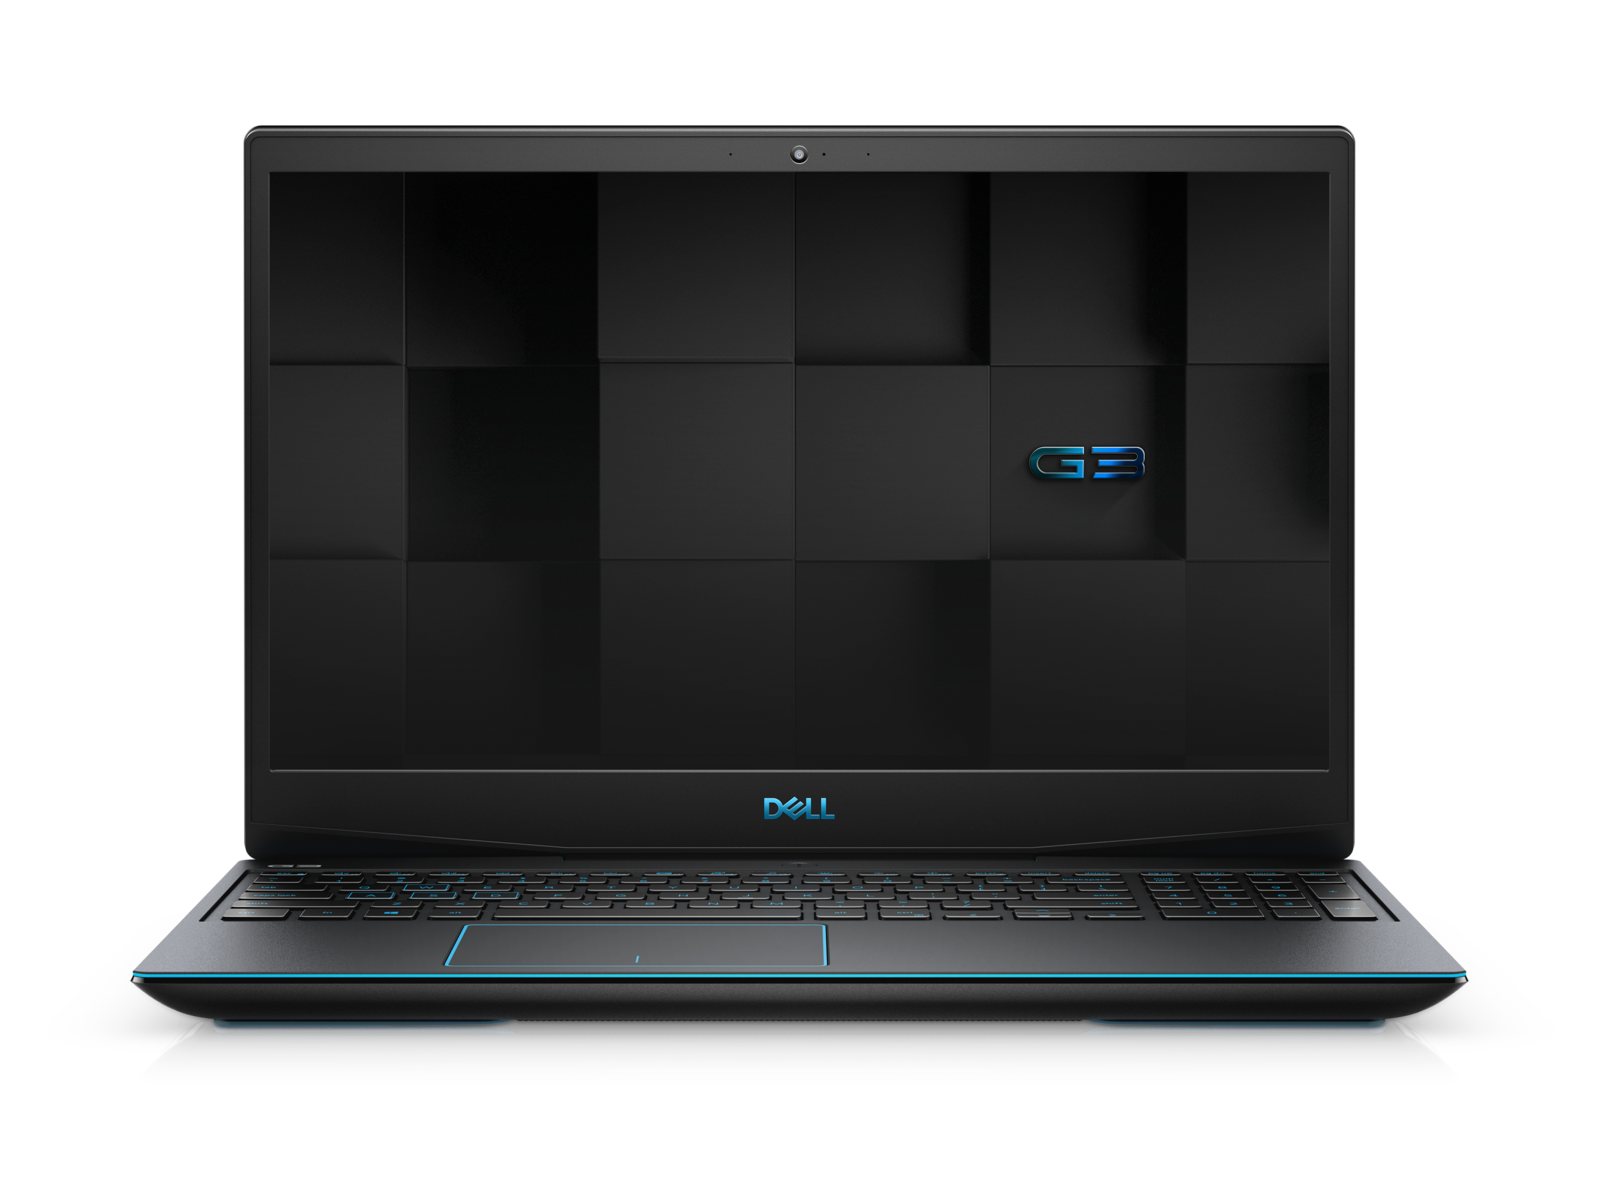
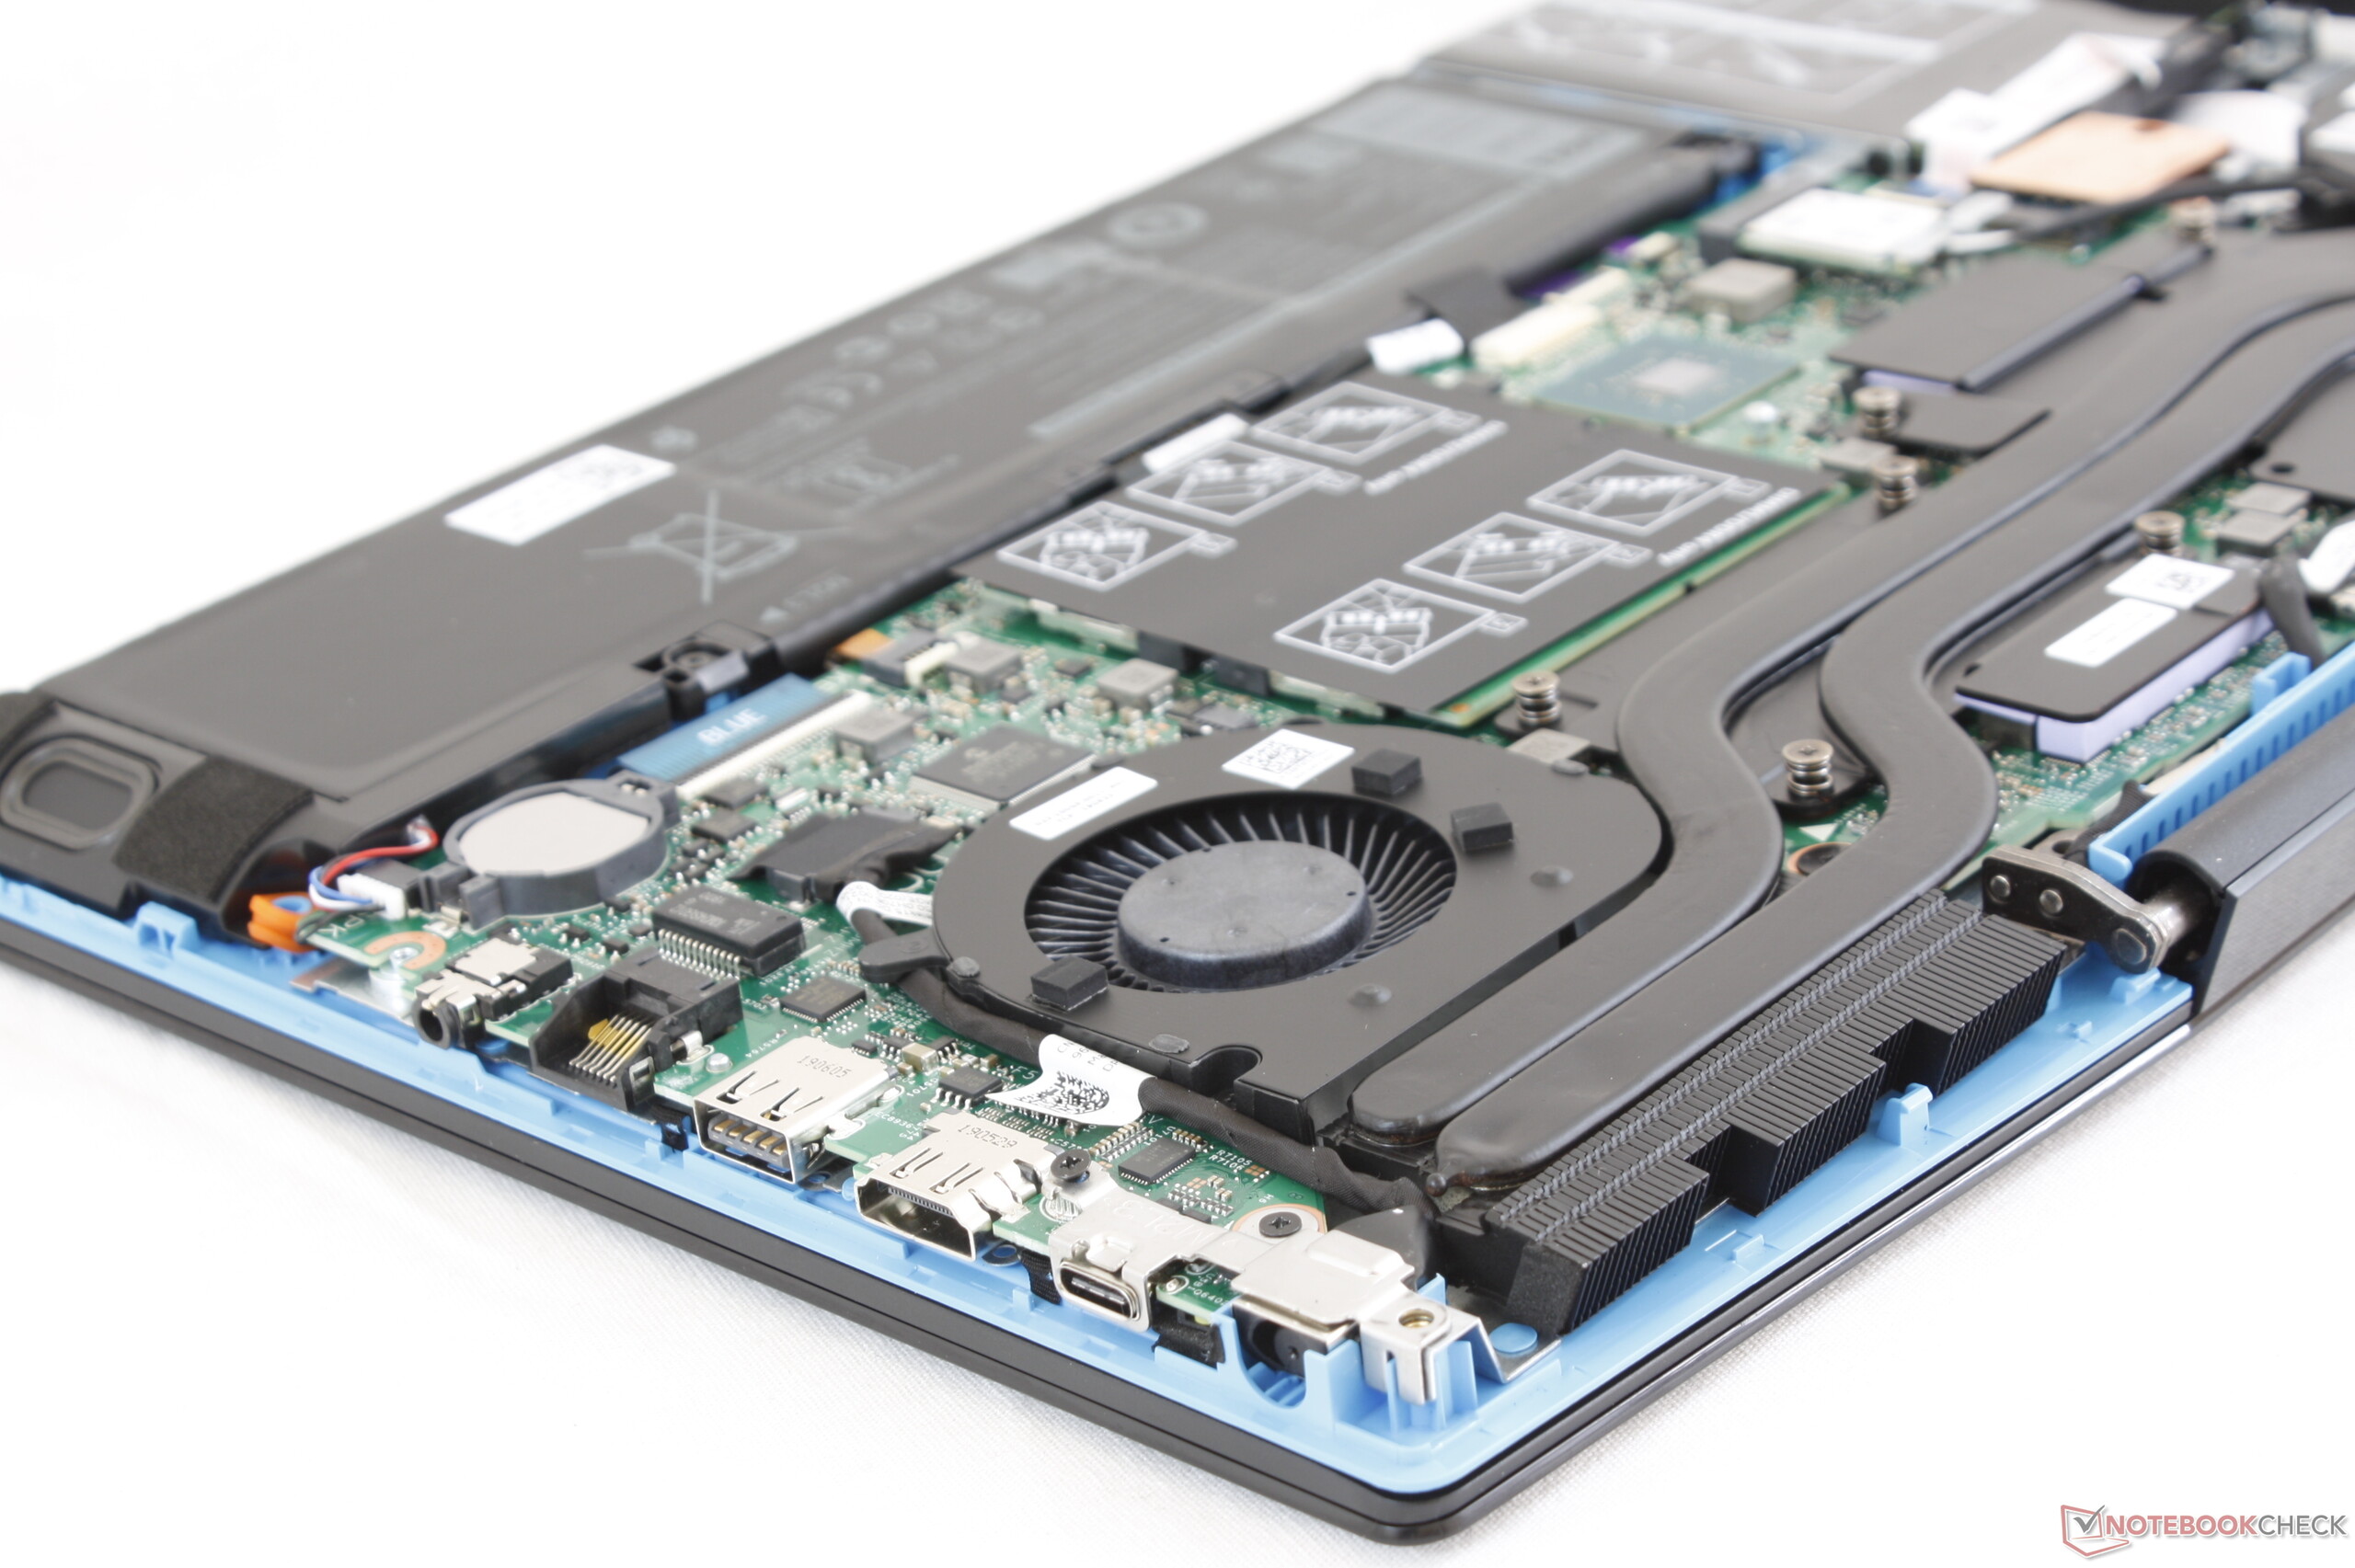
O aspecto mais forte do Dell G3 3590 é sua capacidade de manutenção. Ao contrário do HP Pavilion Gaming 15 ou do MSI GP65, o sistema da Dell é mais fácil de atualizar e não exige o rompimento de nenhum selo de garantia. O desempenho está onde esperamos, considerando que o hardware e o baixo preço de entrada torna o sistema atraente para os usuários que desejam uma máquina de jogos decentemente poderosa e sem frescuras.
A lista de fraquezas é maior do que gostaríamos. A tela, em particular, sofre de muito com recortes, incluindo cores fracas, bleeding irregular da luz de fundo moderadamente pesado, tempos de resposta mais lentos, sobreposição mate granulada e uma luz de fundo fraca. Embora seja perfeitamente aceitável para a maioria dos jogos, os concorrentes HP Gaming Pavilion 15 e o Lenovo Legion Y540 oferecem paineis muito melhores que são mais adequados para jogos de ritmo rápido. Você precisará atualizar para a série Dell G7 ou superior se desejar uma melhor experiência visual, pois o G3 3590 não oferece outras opções de painel.
O restante do sistema é típico de sua faixa de preço. O chassi de plástico, os alto-falantes agudos pesados, o leitor SD lento, a WLAN 1x1 e o SSD NVMe econômico são comuns em portáteis de jogos econômicos.
Se você tiver US$ 1.000 para gastar em um portátil para jogos, pode querer considerar o HP Pavilion Gaming 15, mais silencioso, ou o Asus Zephyrus G GA502 mais sofisticado, com tecnologia AMD. O Dell G3 3590 pode ser um pouco mais barato, mas é difícil recomendar seus ventiladores mais barulhentos e sua tela mais fraca.
Dell G3 3590
- 10/11/2019 v7 (old)
Allen Ngo
Price comparison
