Breve Análise do Workstation Dell Precision 7530 (i9-8950HK, Quadro P3200)
| SD Card Reader | |
| average JPG Copy Test (av. of 3 runs) | |
| Dell Precision 7530 (Toshiba Exceria Pro SDXC 64 GB UHS-II) | |
| Gigabyte Aero 15X v8 (Toshiba Exceria Pro SDXC 64 GB UHS-II) | |
| Dell Precision 3530 (Toshiba Exceria Pro SDXC 64 GB UHS-II) | |
| Lenovo ThinkPad P1-20MD002LUS (Toshiba Exceria Pro SDXC 64 GB UHS-II) | |
| Dell Precision 5530 2-in-1 (Toshiba Exceria Pro M501 UHS-II) | |
| maximum AS SSD Seq Read Test (1GB) | |
| Gigabyte Aero 15X v8 (Toshiba Exceria Pro SDXC 64 GB UHS-II) | |
| Lenovo ThinkPad P1-20MD002LUS (Toshiba Exceria Pro SDXC 64 GB UHS-II) | |
| Dell Precision 5530 2-in-1 (Toshiba Exceria Pro M501 UHS-II) | |
| Dell Precision 3530 (Toshiba Exceria Pro SDXC 64 GB UHS-II) | |
| Dell Precision 7530 (Toshiba Exceria Pro SDXC 64 GB UHS-II) | |
| |||||||||||||||||||||||||
iluminação: 85 %
iluminação com acumulador: 292.8 cd/m²
Contraste: 813:1 (Preto: 0.36 cd/m²)
ΔE ColorChecker Calman: 3.48 | ∀{0.5-29.43 Ø4.71}
calibrated: 3.13
ΔE Greyscale Calman: 4.1 | ∀{0.09-98 Ø4.96}
99.6% sRGB (Argyll 1.6.3 3D)
84.4% AdobeRGB 1998 (Argyll 1.6.3 3D)
96.2% AdobeRGB 1998 (Argyll 3D)
99.4% sRGB (Argyll 3D)
82.5% Display P3 (Argyll 3D)
Gamma: 2.2
CCT: 6740 K
| Dell Precision 7530 Sharp LQ156D1, IPS, 15.6", 3840x2160 | Lenovo ThinkPad P1-20MD002LUS B156ZAN03.2, IPS, 15.6", 3840x2160 | Dell Precision 5530 2-in-1 Sharp SHP148D, IPS, 15.6", 3840x2160 | Dell Precision 3530 BOE BOE06F1, IPS, 15.6", 1920x1080 | HP ZBook 15u G5 2ZC05EA CMN15E7, IPS LED, 15.6", 1920x1080 | Eurocom Tornado F5W AUO52ED B156HTN05.2, TN, 15.6", 1920x1080 | |
|---|---|---|---|---|---|---|
| Display | 3% | 5% | -15% | -46% | -22% | |
| Display P3 Coverage (%) | 82.5 | 86.4 5% | 91.2 11% | 72.8 -12% | 43.05 -48% | 66.1 -20% |
| sRGB Coverage (%) | 99.4 | 99.9 1% | 99.9 1% | 94.6 -5% | 64.7 -35% | 87.7 -12% |
| AdobeRGB 1998 Coverage (%) | 96.2 | 99.1 3% | 99.4 3% | 69.3 -28% | 44.5 -54% | 64.2 -33% |
| Response Times | -38% | -42% | -24% | -14% | 51% | |
| Response Time Grey 50% / Grey 80% * (ms) | 35.2 ? | 55.6 ? -58% | 49.6 ? -41% | 40.4 ? -15% | 41.6 ? -18% | 23.2 ? 34% |
| Response Time Black / White * (ms) | 26.4 ? | 30.8 ? -17% | 37.6 ? -42% | 34.8 ? -32% | 28.8 ? -9% | 8.5 ? 68% |
| PWM Frequency (Hz) | 198.4 ? | 990 ? | 1053 ? | 25770 ? | ||
| Screen | 5% | 14% | -16% | -22% | -53% | |
| Brightness middle (cd/m²) | 292.8 | 397.6 36% | 430.9 47% | 285.7 -2% | 229 -22% | 405.7 39% |
| Brightness (cd/m²) | 295 | 396 34% | 398 35% | 275 -7% | 212 -28% | 397 35% |
| Brightness Distribution (%) | 85 | 85 0% | 79 -7% | 85 0% | 88 4% | 92 8% |
| Black Level * (cd/m²) | 0.36 | 0.25 31% | 0.35 3% | 0.31 14% | 0.23 36% | 0.65 -81% |
| Contrast (:1) | 813 | 1590 96% | 1231 51% | 922 13% | 996 23% | 624 -23% |
| Colorchecker dE 2000 * | 3.48 | 4.95 -42% | 3.29 5% | 5.84 -68% | 4.2 -21% | 8.5 -144% |
| Colorchecker dE 2000 max. * | 6.81 | 10.23 -50% | 7.46 -10% | 8.76 -29% | 18 -164% | 16.2 -138% |
| Colorchecker dE 2000 calibrated * | 3.13 | 4.22 -35% | 3.58 -14% | 3.14 -0% | 4.2 -34% | |
| Greyscale dE 2000 * | 4.1 | 5.1 -24% | 2.6 37% | 6.5 -59% | 2 51% | 11.6 -183% |
| Gamma | 2.2 100% | 2.234 98% | 2.19 100% | 2.383 92% | 2.23 99% | 2.37 93% |
| CCT | 6740 96% | 7543 86% | 6870 95% | 7176 91% | 6292 103% | 10468 62% |
| Color Space (Percent of AdobeRGB 1998) (%) | 84.4 | 87.6 4% | 87.2 3% | 62 -27% | 41 -51% | 57 -32% |
| Color Space (Percent of sRGB) (%) | 99.6 | 100 0% | 100 0% | 94 -6% | 64.5 -35% | 87 -13% |
| Média Total (Programa/Configurações) | -10% /
-1% | -8% /
5% | -18% /
-16% | -27% /
-25% | -8% /
-33% |
* ... menor é melhor
Exibir tempos de resposta
| ↔ Tempo de resposta preto para branco | ||
|---|---|---|
| 26.4 ms ... ascensão ↗ e queda ↘ combinadas | ↗ 14 ms ascensão | 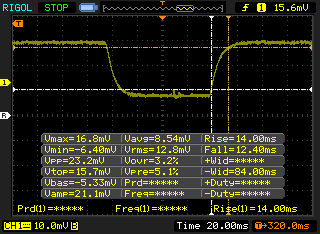 |
| ↘ 12.4 ms queda | ||
| A tela mostra taxas de resposta relativamente lentas em nossos testes e pode ser muito lenta para os jogadores. Em comparação, todos os dispositivos testados variam de 0.1 (mínimo) a 240 (máximo) ms. » 66 % de todos os dispositivos são melhores. Isso significa que o tempo de resposta medido é pior que a média de todos os dispositivos testados (19.8 ms). | ||
| ↔ Tempo de resposta 50% cinza a 80% cinza | ||
| 35.2 ms ... ascensão ↗ e queda ↘ combinadas | ↗ 17.2 ms ascensão | 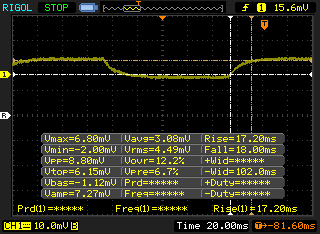 |
| ↘ 18 ms queda | ||
| A tela mostra taxas de resposta lentas em nossos testes e será insatisfatória para os jogadores. Em comparação, todos os dispositivos testados variam de 0.165 (mínimo) a 636 (máximo) ms. » 49 % de todos os dispositivos são melhores. Isso significa que o tempo de resposta medido é pior que a média de todos os dispositivos testados (31 ms). | ||
Cintilação da tela / PWM (modulação por largura de pulso)
| Tela tremeluzindo/PWM detectado | 198.4 Hz | ≤ 25 % configuração de brilho | 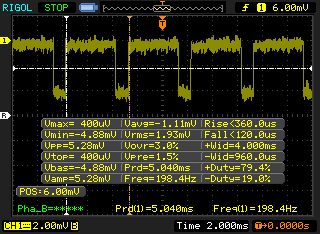 |
A luz de fundo da tela pisca em 198.4 Hz (pior caso, por exemplo, utilizando PWM) Cintilação detectada em uma configuração de brilho de 25 % e abaixo. Não deve haver cintilação ou PWM acima desta configuração de brilho. A frequência de 198.4 Hz é relativamente baixa, portanto, usuários sensíveis provavelmente notarão cintilação e sentirão fadiga ocular na configuração de brilho indicada e abaixo. [pwm_comparison] Em comparação: 52 % de todos os dispositivos testados não usam PWM para escurecer a tela. Se PWM foi detectado, uma média de 7754 (mínimo: 5 - máximo: 343500) Hz foi medida. | |||
| wPrime 2.10 - 1024m | |
| Asus ROG Strix GL702ZC-GC204T | |
| Dell Precision 7510 (4K IGZO) | |
| Eurocom Tornado F5W | |
| Média Intel Core i9-8950HK (n=1) | |
| Dell Precision 5530 2-in-1 | |
| Eurocom Sky X4C | |
* ... menor é melhor
| PCMark 8 | |
| Home Score Accelerated v2 | |
| Eurocom Tornado F5W | |
| Dell Precision 3530 | |
| Dell Precision 7530 | |
| Lenovo ThinkPad P1-20MD002LUS | |
| Dell Precision 5530 2-in-1 | |
| Work Score Accelerated v2 | |
| Dell Precision 7530 | |
| Eurocom Tornado F5W | |
| Dell Precision 3530 | |
| Lenovo ThinkPad P1-20MD002LUS | |
| Dell Precision 5530 2-in-1 | |
| Creative Score Accelerated v2 | |
| Eurocom Tornado F5W | |
| Dell Precision 3530 | |
| Lenovo ThinkPad P1-20MD002LUS | |
| PCMark 8 Home Score Accelerated v2 | 4200 pontos | |
| PCMark 8 Work Score Accelerated v2 | 5568 pontos | |
| PCMark 10 Score | 5738 pontos | |
Ajuda | ||
| Dell Precision 7530 Samsung PM961 NVMe MZVLW512HMJP | Lenovo ThinkPad P1-20MD002LUS Samsung SSD PM981 MZVLB2T0HMLB | Dell Precision 5530 2-in-1 SK Hynix PC401 512GB M.2 (HFS512GD9TNG) | Dell Precision 3530 SK hynix PC400 512 GB | Eurocom Tornado F5W Samsung SSD 960 Pro 512 GB m.2 | HP ZBook 15u G5 2ZC05EA Toshiba XG5 KXG50ZNV256G | |
|---|---|---|---|---|---|---|
| CrystalDiskMark 5.2 / 6 | 12% | 1% | 11% | 64% | -15% | |
| Write 4K (MB/s) | 105.9 | 108 2% | 128.9 22% | 113.6 7% | 211.4 100% | 98.8 -7% |
| Read 4K (MB/s) | 23.87 | 37.24 56% | 45.7 91% | 41.18 73% | 56.7 138% | 33.98 42% |
| Write Seq (MB/s) | 1542 | 1476 -4% | 635 -59% | 1417 -8% | 1983 29% | 395.7 -74% |
| Read Seq (MB/s) | 1916 | 1367 -29% | 2065 8% | 1896 -1% | 2841 48% | 2063 8% |
| Write 4K Q32T1 (MB/s) | 305.4 | 302.4 -1% | 336.6 10% | 355 16% | 571 87% | 352.3 15% |
| Read 4K Q32T1 (MB/s) | 358.4 | 375 5% | 393.6 10% | 404.3 13% | 606 69% | 281.8 -21% |
| Write Seq Q32T1 (MB/s) | 1572 | 2433 55% | 662 -58% | 1411 -10% | 1986 26% | 355 -77% |
| Read Seq Q32T1 (MB/s) | 3061 | 3493 14% | 2664 -13% | 3095 1% | 3467 13% | 2775 -9% |
| Write 4K Q8T8 (MB/s) | 361 | |||||
| Read 4K Q8T8 (MB/s) | 447.3 |

| 3DMark 06 Standard Score | 24576 pontos | |
| 3DMark Vantage P Result | 45851 pontos | |
| 3DMark 11 Performance | 14244 pontos | |
| 3DMark Ice Storm Standard Score | 49190 pontos | |
| 3DMark Cloud Gate Standard Score | 30100 pontos | |
| 3DMark Fire Strike Score | 10128 pontos | |
| 3DMark Time Spy Score | 3979 pontos | |
Ajuda | ||
| The Witcher 3 - 1920x1080 Ultra Graphics & Postprocessing (HBAO+) | |
| Eurocom Tornado F5W | |
| Média NVIDIA Quadro P3200 (41.6 - 46.4, n=4) | |
| Nvidia GeForce GTX 1060 Founders Edition 6 GB | |
| Dell Precision 7530 | |
| Dell Precision 5530 Xeon E-2176M | |
| Lenovo ThinkPad P1-20MD002LUS | |
| HP ZBook 15 G4-Y4E80AV | |
| Lenovo ThinkPad P52 20MAS03N00 | |
| Dell Precision 3530 | |
| baixo | média | alto | ultra | 4K | |
|---|---|---|---|---|---|
| The Witcher 3 (2015) | 208.9 | 141 | 80.6 | 41.6 | 28.2 |
| Batman: Arkham Knight (2015) | 140 | 127 | 89 | 59 | 29 |
| Rise of the Tomb Raider (2016) | 180.9 | 139.7 | 77.4 | 65.8 | 27.6 |
| Dell Precision 7530 i9-8950HK, Quadro P3200 | HP ZBook 15 G4-Y4E80AV E3-1535M v6, Quadro M2200 | Dell Precision 7510 (4K IGZO) E3-1535M v5, Quadro M2000M | Lenovo ThinkPad P52 20MAS03N00 i7-8750H, Quadro P1000 | Lenovo ThinkPad P1-20MD002LUS E-2176M, Quadro P2000 Max-Q | Eurocom Tornado F5W E3-1280 v5, Quadro P5000 | |
|---|---|---|---|---|---|---|
| Noise | 3% | -3% | 6% | 3% | 0% | |
| desligado / ambiente * (dB) | 28.3 | 29.5 -4% | 28.2 -0% | 29.5 -4% | 28.3 -0% | 29.6 -5% |
| Idle Minimum * (dB) | 28.3 | 29.5 -4% | 29.8 -5% | 29.5 -4% | 28.4 -0% | 31.2 -10% |
| Idle Average * (dB) | 28.3 | 29.5 -4% | 29.8 -5% | 29.5 -4% | 28.4 -0% | 31.2 -10% |
| Idle Maximum * (dB) | 30.5 | 30 2% | 31.2 -2% | 29.5 3% | 29.2 4% | 32.6 -7% |
| Load Average * (dB) | 34.5 | 39.5 -14% | 37.2 -8% | 34.7 -1% | 41.8 -21% | 32.6 6% |
| Witcher 3 ultra * (dB) | 49.5 | 39.5 20% | 33.1 33% | 39.1 21% | 43.1 13% | |
| Load Maximum * (dB) | 49.5 | 36 27% | 49.4 -0% | 39.4 20% | 41.8 16% | 43.3 13% |
* ... menor é melhor
Barulho
| Ocioso |
| 28.3 / 28.3 / 30.5 dB |
| Carga |
| 34.5 / 49.5 dB |
 | ||
30 dB silencioso 40 dB(A) audível 50 dB(A) ruidosamente alto |
||
min: | ||
(-) A temperatura máxima no lado superior é 54.4 °C / 130 F, em comparação com a média de 38.2 °C / 101 F , variando de 22.2 a 69.8 °C para a classe Workstation.
(-) A parte inferior aquece até um máximo de 49 °C / 120 F, em comparação com a média de 41.1 °C / 106 F
(±) Em uso inativo, a temperatura média para o lado superior é 33 °C / 91 F, em comparação com a média do dispositivo de 32 °C / ### class_avg_f### F.
(±) Jogando The Witcher 3, a temperatura média para o lado superior é 34.9 °C / 95 F, em comparação com a média do dispositivo de 32 °C / ## #class_avg_f### F.
(+) Os apoios para as mãos e o touchpad são mais frios que a temperatura da pele, com um máximo de 28.8 °C / 83.8 F e, portanto, são frios ao toque.
(±) A temperatura média da área do apoio para as mãos de dispositivos semelhantes foi 27.8 °C / 82 F (-1 °C / -1.8 F).
Dell Precision 7530 análise de áudio
(±) | o volume do alto-falante é médio, mas bom (###valor### dB)
Graves 100 - 315Hz
(±) | graves reduzidos - em média 8% menor que a mediana
(±) | a linearidade dos graves é média (12.3% delta para a frequência anterior)
Médios 400 - 2.000 Hz
(+) | médios equilibrados - apenas 3.3% longe da mediana
(±) | a linearidade dos médios é média (7.8% delta para frequência anterior)
Altos 2 - 16 kHz
(+) | agudos equilibrados - apenas 2.3% longe da mediana
(+) | os máximos são lineares (5% delta da frequência anterior)
Geral 100 - 16.000 Hz
(+) | o som geral é linear (11.4% diferença em relação à mediana)
Comparado com a mesma classe
» 13% de todos os dispositivos testados nesta classe foram melhores, 4% semelhantes, 83% piores
» O melhor teve um delta de 7%, a média foi 17%, o pior foi 35%
Comparado com todos os dispositivos testados
» 7% de todos os dispositivos testados foram melhores, 2% semelhantes, 90% piores
» O melhor teve um delta de 4%, a média foi 23%, o pior foi 134%
Apple MacBook 12 (Early 2016) 1.1 GHz análise de áudio
(+) | os alto-falantes podem tocar relativamente alto (###valor### dB)
Graves 100 - 315Hz
(±) | graves reduzidos - em média 11.3% menor que a mediana
(±) | a linearidade dos graves é média (14.2% delta para a frequência anterior)
Médios 400 - 2.000 Hz
(+) | médios equilibrados - apenas 2.4% longe da mediana
(+) | médios são lineares (5.5% delta para frequência anterior)
Altos 2 - 16 kHz
(+) | agudos equilibrados - apenas 2% longe da mediana
(+) | os máximos são lineares (4.5% delta da frequência anterior)
Geral 100 - 16.000 Hz
(+) | o som geral é linear (10.2% diferença em relação à mediana)
Comparado com a mesma classe
» 7% de todos os dispositivos testados nesta classe foram melhores, 2% semelhantes, 90% piores
» O melhor teve um delta de 5%, a média foi 18%, o pior foi 53%
Comparado com todos os dispositivos testados
» 5% de todos os dispositivos testados foram melhores, 1% semelhantes, 94% piores
» O melhor teve um delta de 4%, a média foi 23%, o pior foi 134%
| desligado | |
| Ocioso | |
| Carga |
|
Key:
min: | |
| Dell Precision 7530 i9-8950HK, Quadro P3200, Samsung PM961 NVMe MZVLW512HMJP, IPS, 3840x2160, 15.6" | Lenovo ThinkPad P1-20MD002LUS E-2176M, Quadro P2000 Max-Q, Samsung SSD PM981 MZVLB2T0HMLB, IPS, 3840x2160, 15.6" | Dell Precision 5530 2-in-1 i7-8706G, WX Vega M GL, SK Hynix PC401 512GB M.2 (HFS512GD9TNG), IPS, 3840x2160, 15.6" | Dell Precision 7510 (4K IGZO) E3-1535M v5, Quadro M2000M, Samsung SSD SM951a 512GB M.2 PCIe 3.0 x4 NVMe (MZVKV512), IGZO IPS, 3840x2160, 15.6" | HP ZBook 15u G5 2ZC05EA i5-8550U, Radeon Pro WX 3100, Toshiba XG5 KXG50ZNV256G, IPS LED, 1920x1080, 15.6" | Asus Strix GL504GM i7-8750H, GeForce GTX 1060 Mobile, Toshiba NVMe THNSN5256GPU7, IPS, 1920x1080, 15.6" | |
|---|---|---|---|---|---|---|
| Power Consumption | 40% | 43% | -16% | 64% | 14% | |
| Idle Minimum * (Watt) | 15.7 | 7.1 55% | 7.4 53% | 23.9 -52% | 3.2 80% | 10 36% |
| Idle Average * (Watt) | 20.3 | 14.4 29% | 12.4 39% | 28.9 -42% | 6.1 70% | 16.9 17% |
| Idle Maximum * (Watt) | 25.7 | 14.6 43% | 13.3 48% | 30 -17% | 9.7 62% | 21.1 18% |
| Load Average * (Watt) | 118.9 | 93.9 21% | 79.2 33% | 95.2 20% | 62 48% | 112.4 5% |
| Witcher 3 ultra * (Watt) | 131.2 | 77.9 41% | 82.2 37% | 48 63% | 135.5 -3% | |
| Load Maximum * (Watt) | 174 | 88.3 49% | 96.5 45% | 157.1 10% | 71 59% | 157.3 10% |
* ... menor é melhor
| Dell Precision 7530 i9-8950HK, Quadro P3200, 97 Wh | Lenovo ThinkPad P1-20MD002LUS E-2176M, Quadro P2000 Max-Q, 80 Wh | Dell Precision 7510 (4K IGZO) E3-1535M v5, Quadro M2000M, 91 Wh | Dell Precision 5530 2-in-1 i7-8706G, WX Vega M GL, 75 Wh | HP ZBook 15u G5 2ZC05EA i5-8550U, Radeon Pro WX 3100, 56 Wh | Eurocom Tornado F5W E3-1280 v5, Quadro P5000, 75.24 Wh | |
|---|---|---|---|---|---|---|
| Duração da bateria | 15% | -23% | 42% | 144% | -22% | |
| Reader / Idle (h) | 6.4 | 4.5 -30% | 12.3 92% | 21.7 239% | 4.7 -27% | |
| WiFi v1.3 (h) | 4.6 | 5.3 15% | 4 -13% | 7.3 59% | 8.6 87% | 4 -13% |
| Load (h) | 1.6 | 1.2 -25% | 1.2 -25% | 3.3 106% | 1.2 -25% |
Pro
Contra
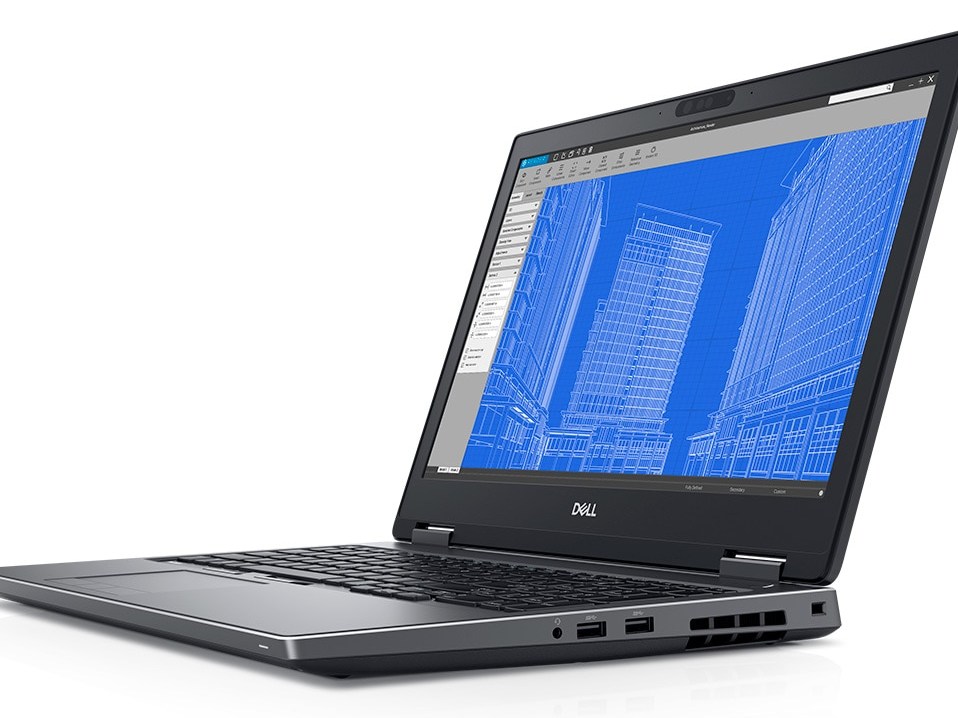
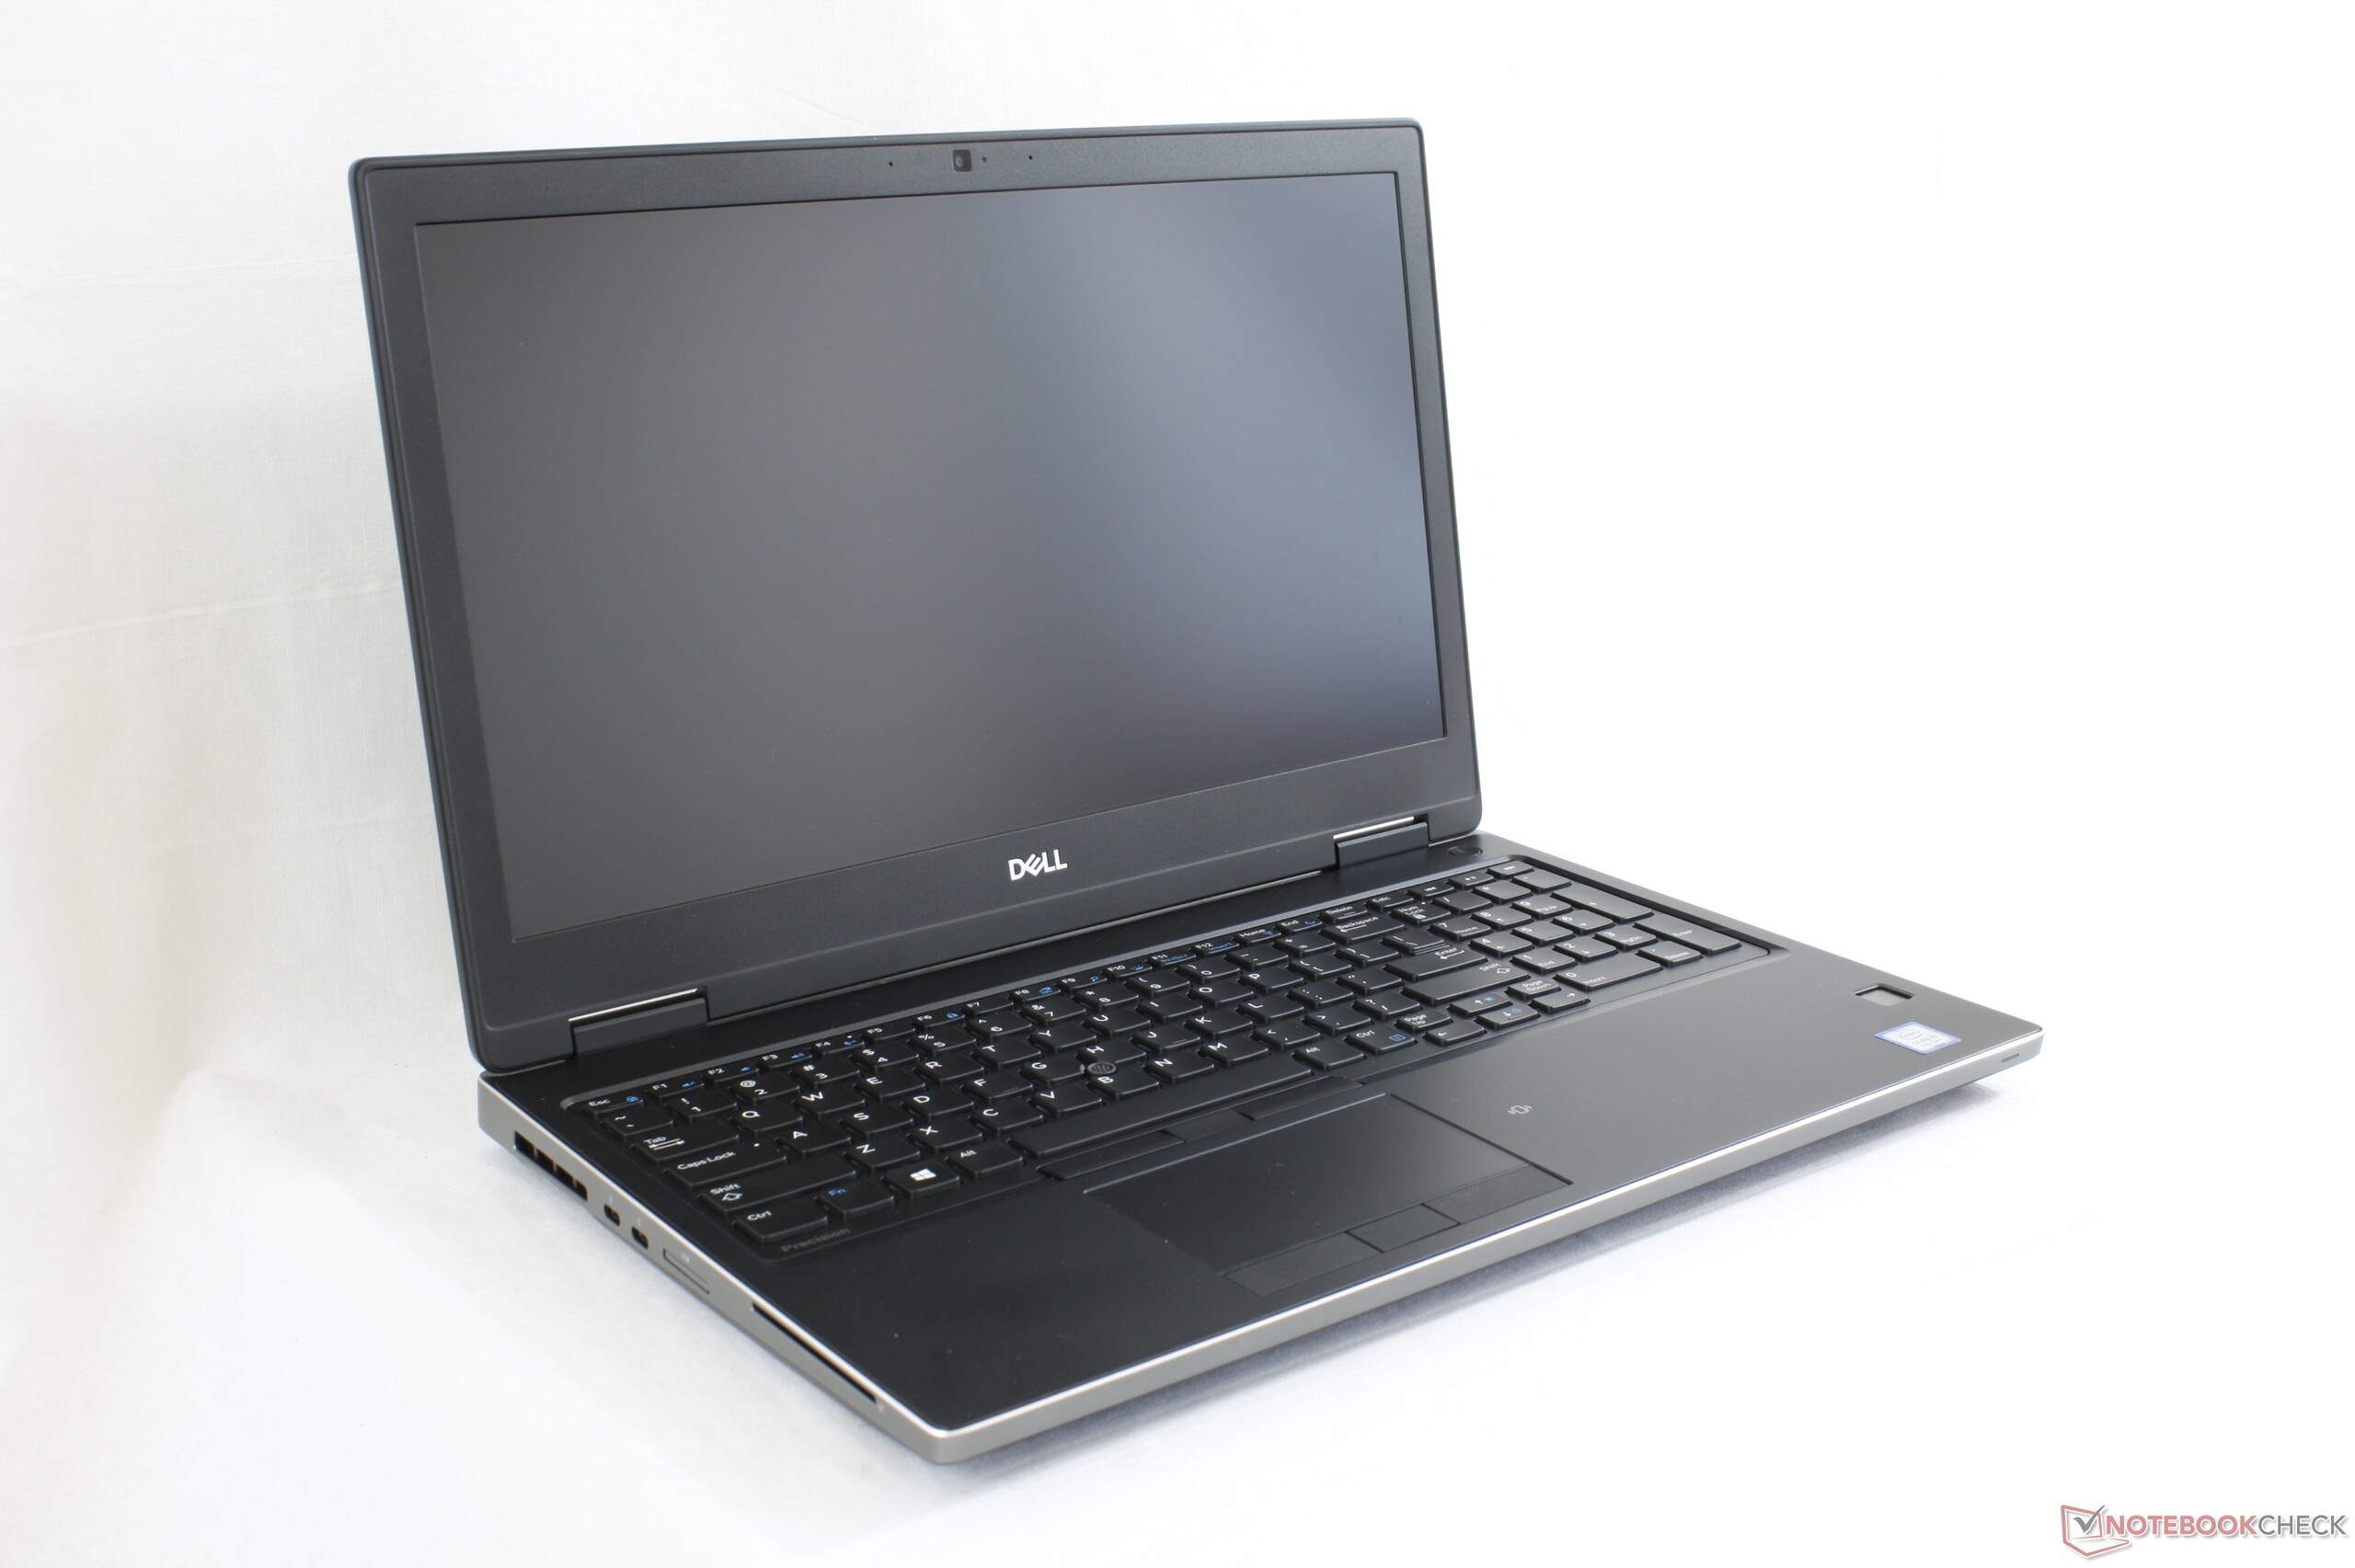
O Precision 7530 é um upgrade que vale a pena do 7510. É menor sem sacrificar a rigidez e carrega opções de CPU e GPU significativamente mais rápidas que os usuários de workstations de alto desempenho apreciarão. Seus recursos opcionais de WAN também oferecem uma vantagem sobre a concorrência.
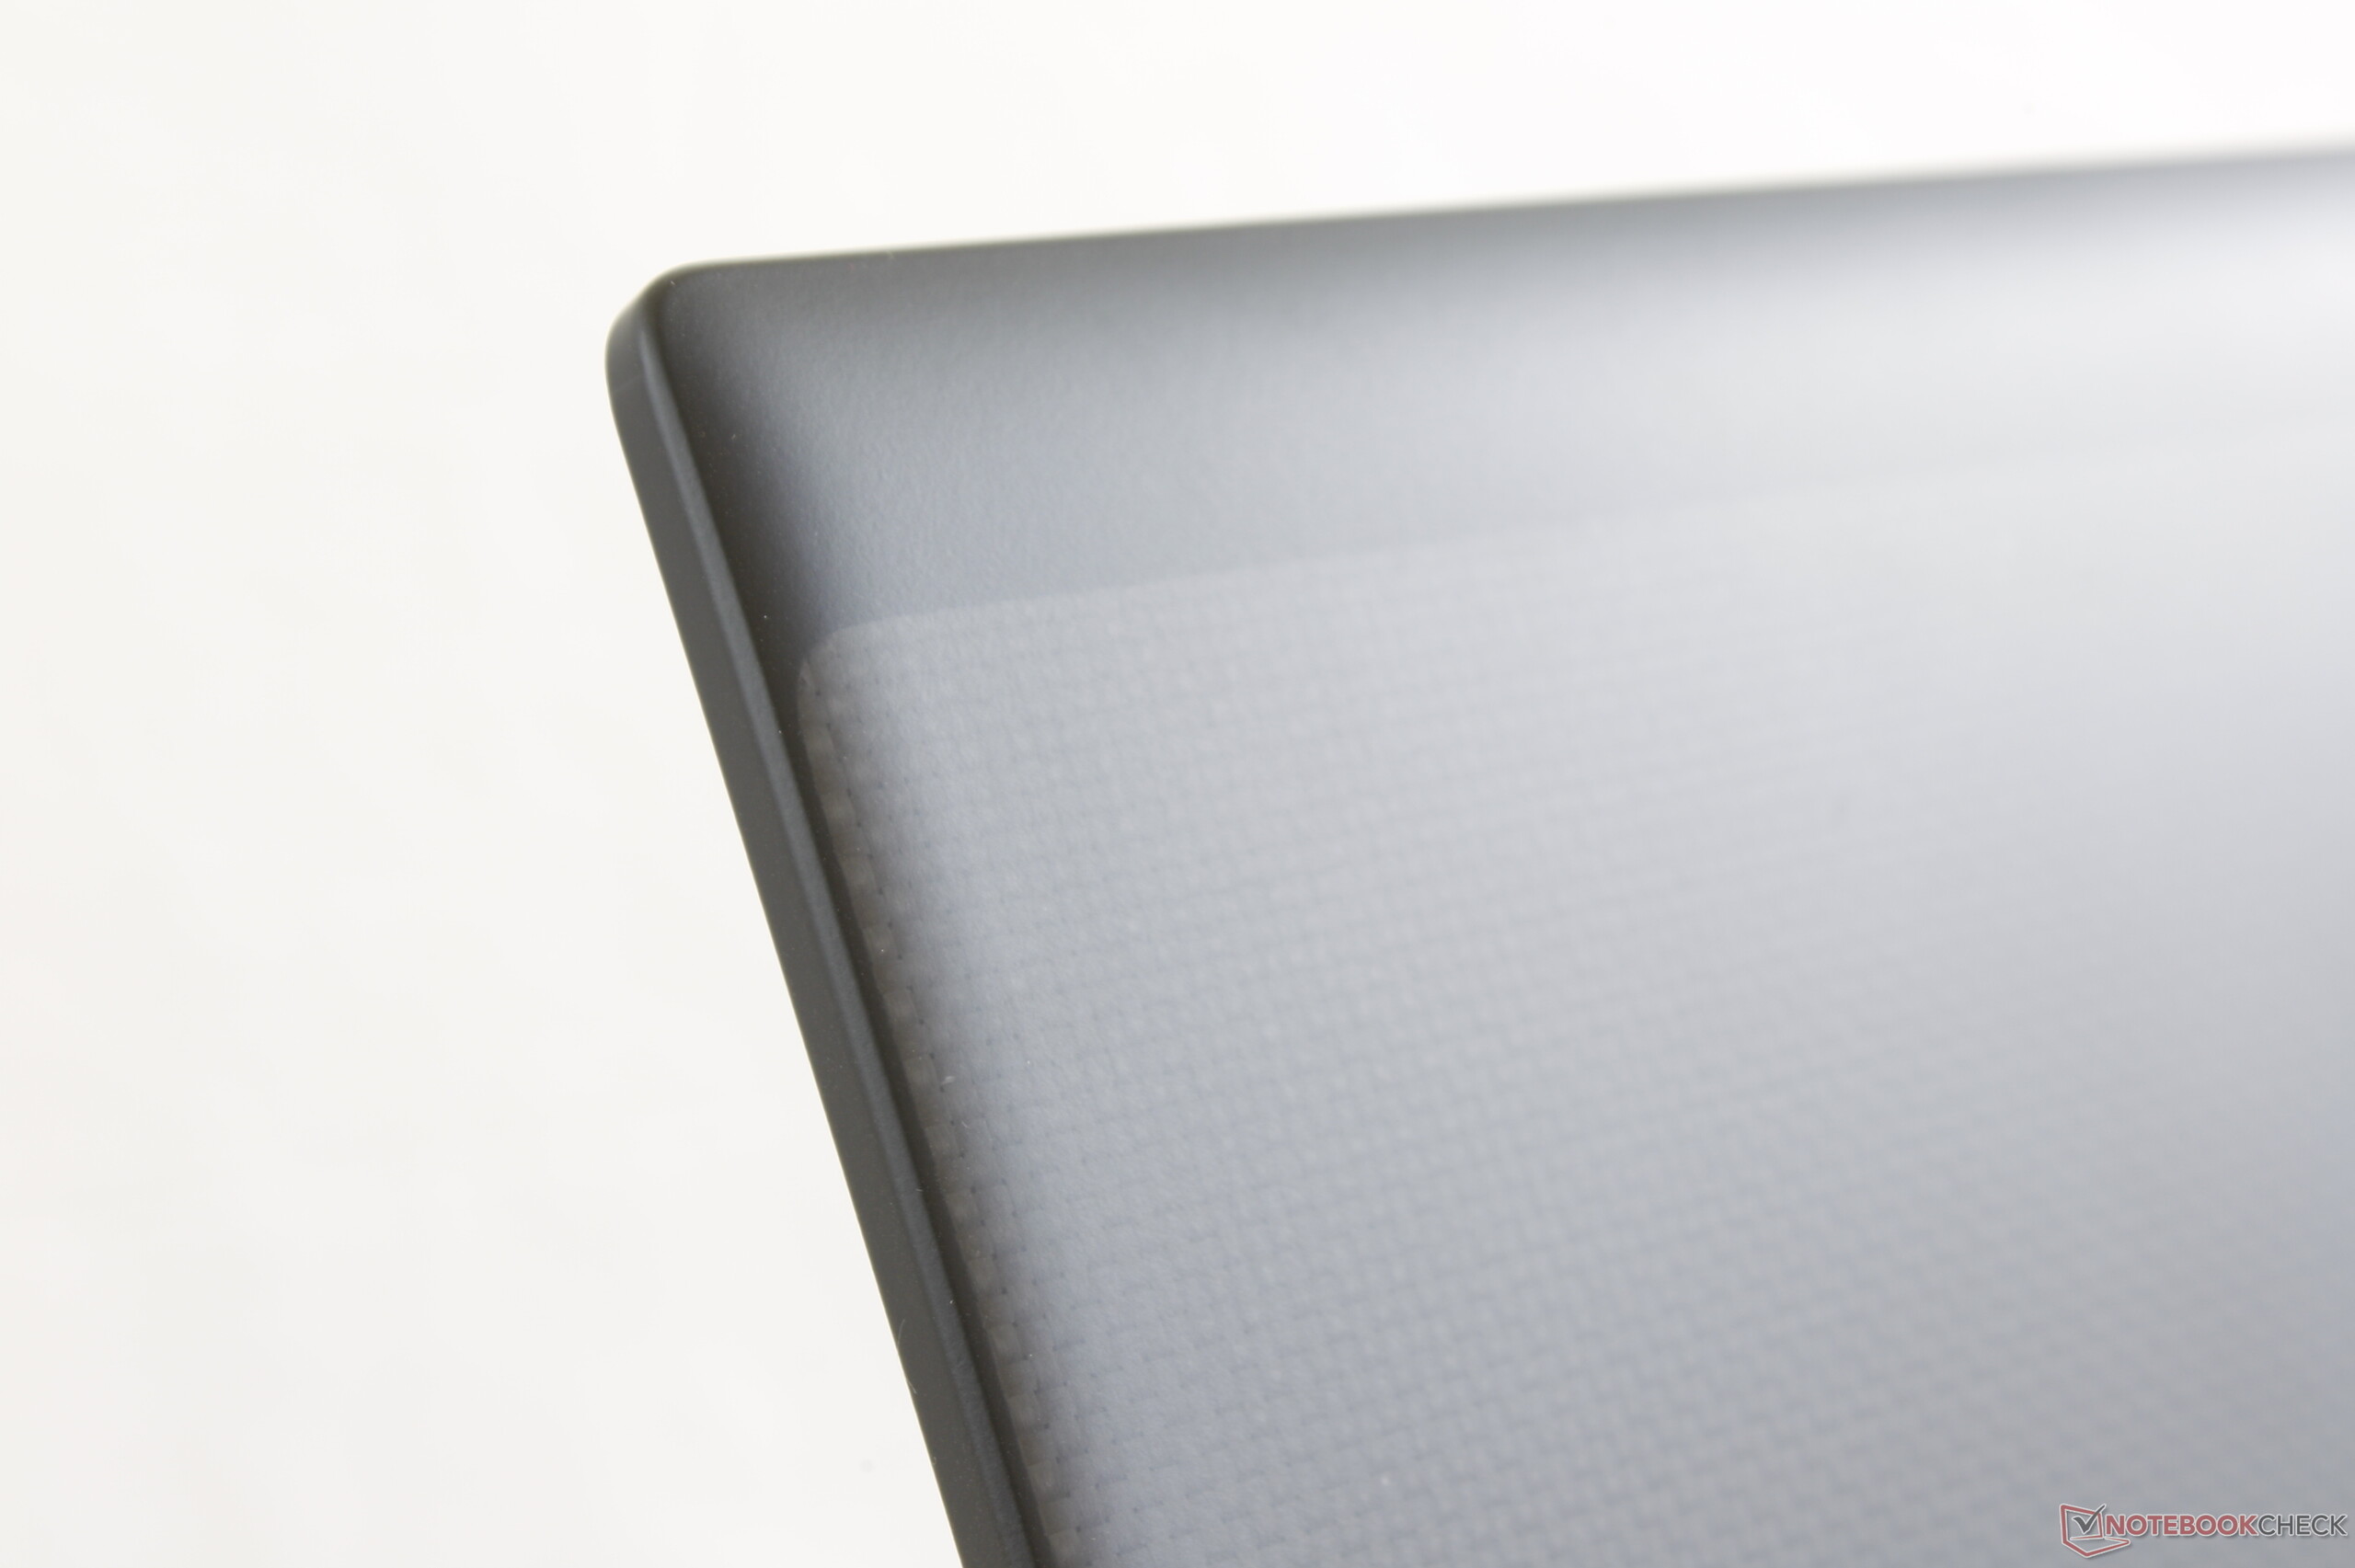
Há um número razoável de desvantagens relacionadas a seus processadores e opções de conectividade. Em primeiro lugar, a CPU Core i9 funciona muito quente no sistema para se beneficiar adequadamente das altas velocidades do Turbo Boost. Como resultado, o desempenho é apenas marginalmente melhor que o mais econômico Core i7-8750H no melhor dos casos e como resultado recomendamos o i7-8750H ou inferiores. Também ficamos desapontados ao ver um desempenho reduzido com a bateria e sem opções Quadro P4000 ou superiores, considerando que este é o workstation móvel de 15 polegadas mais potente “do mundo” e o primeiro preparado para RV. O painel 4K mate e granulado e os ventiladores barulhentos durante o uso intenso, abalam ainda mais um sistema sólido.
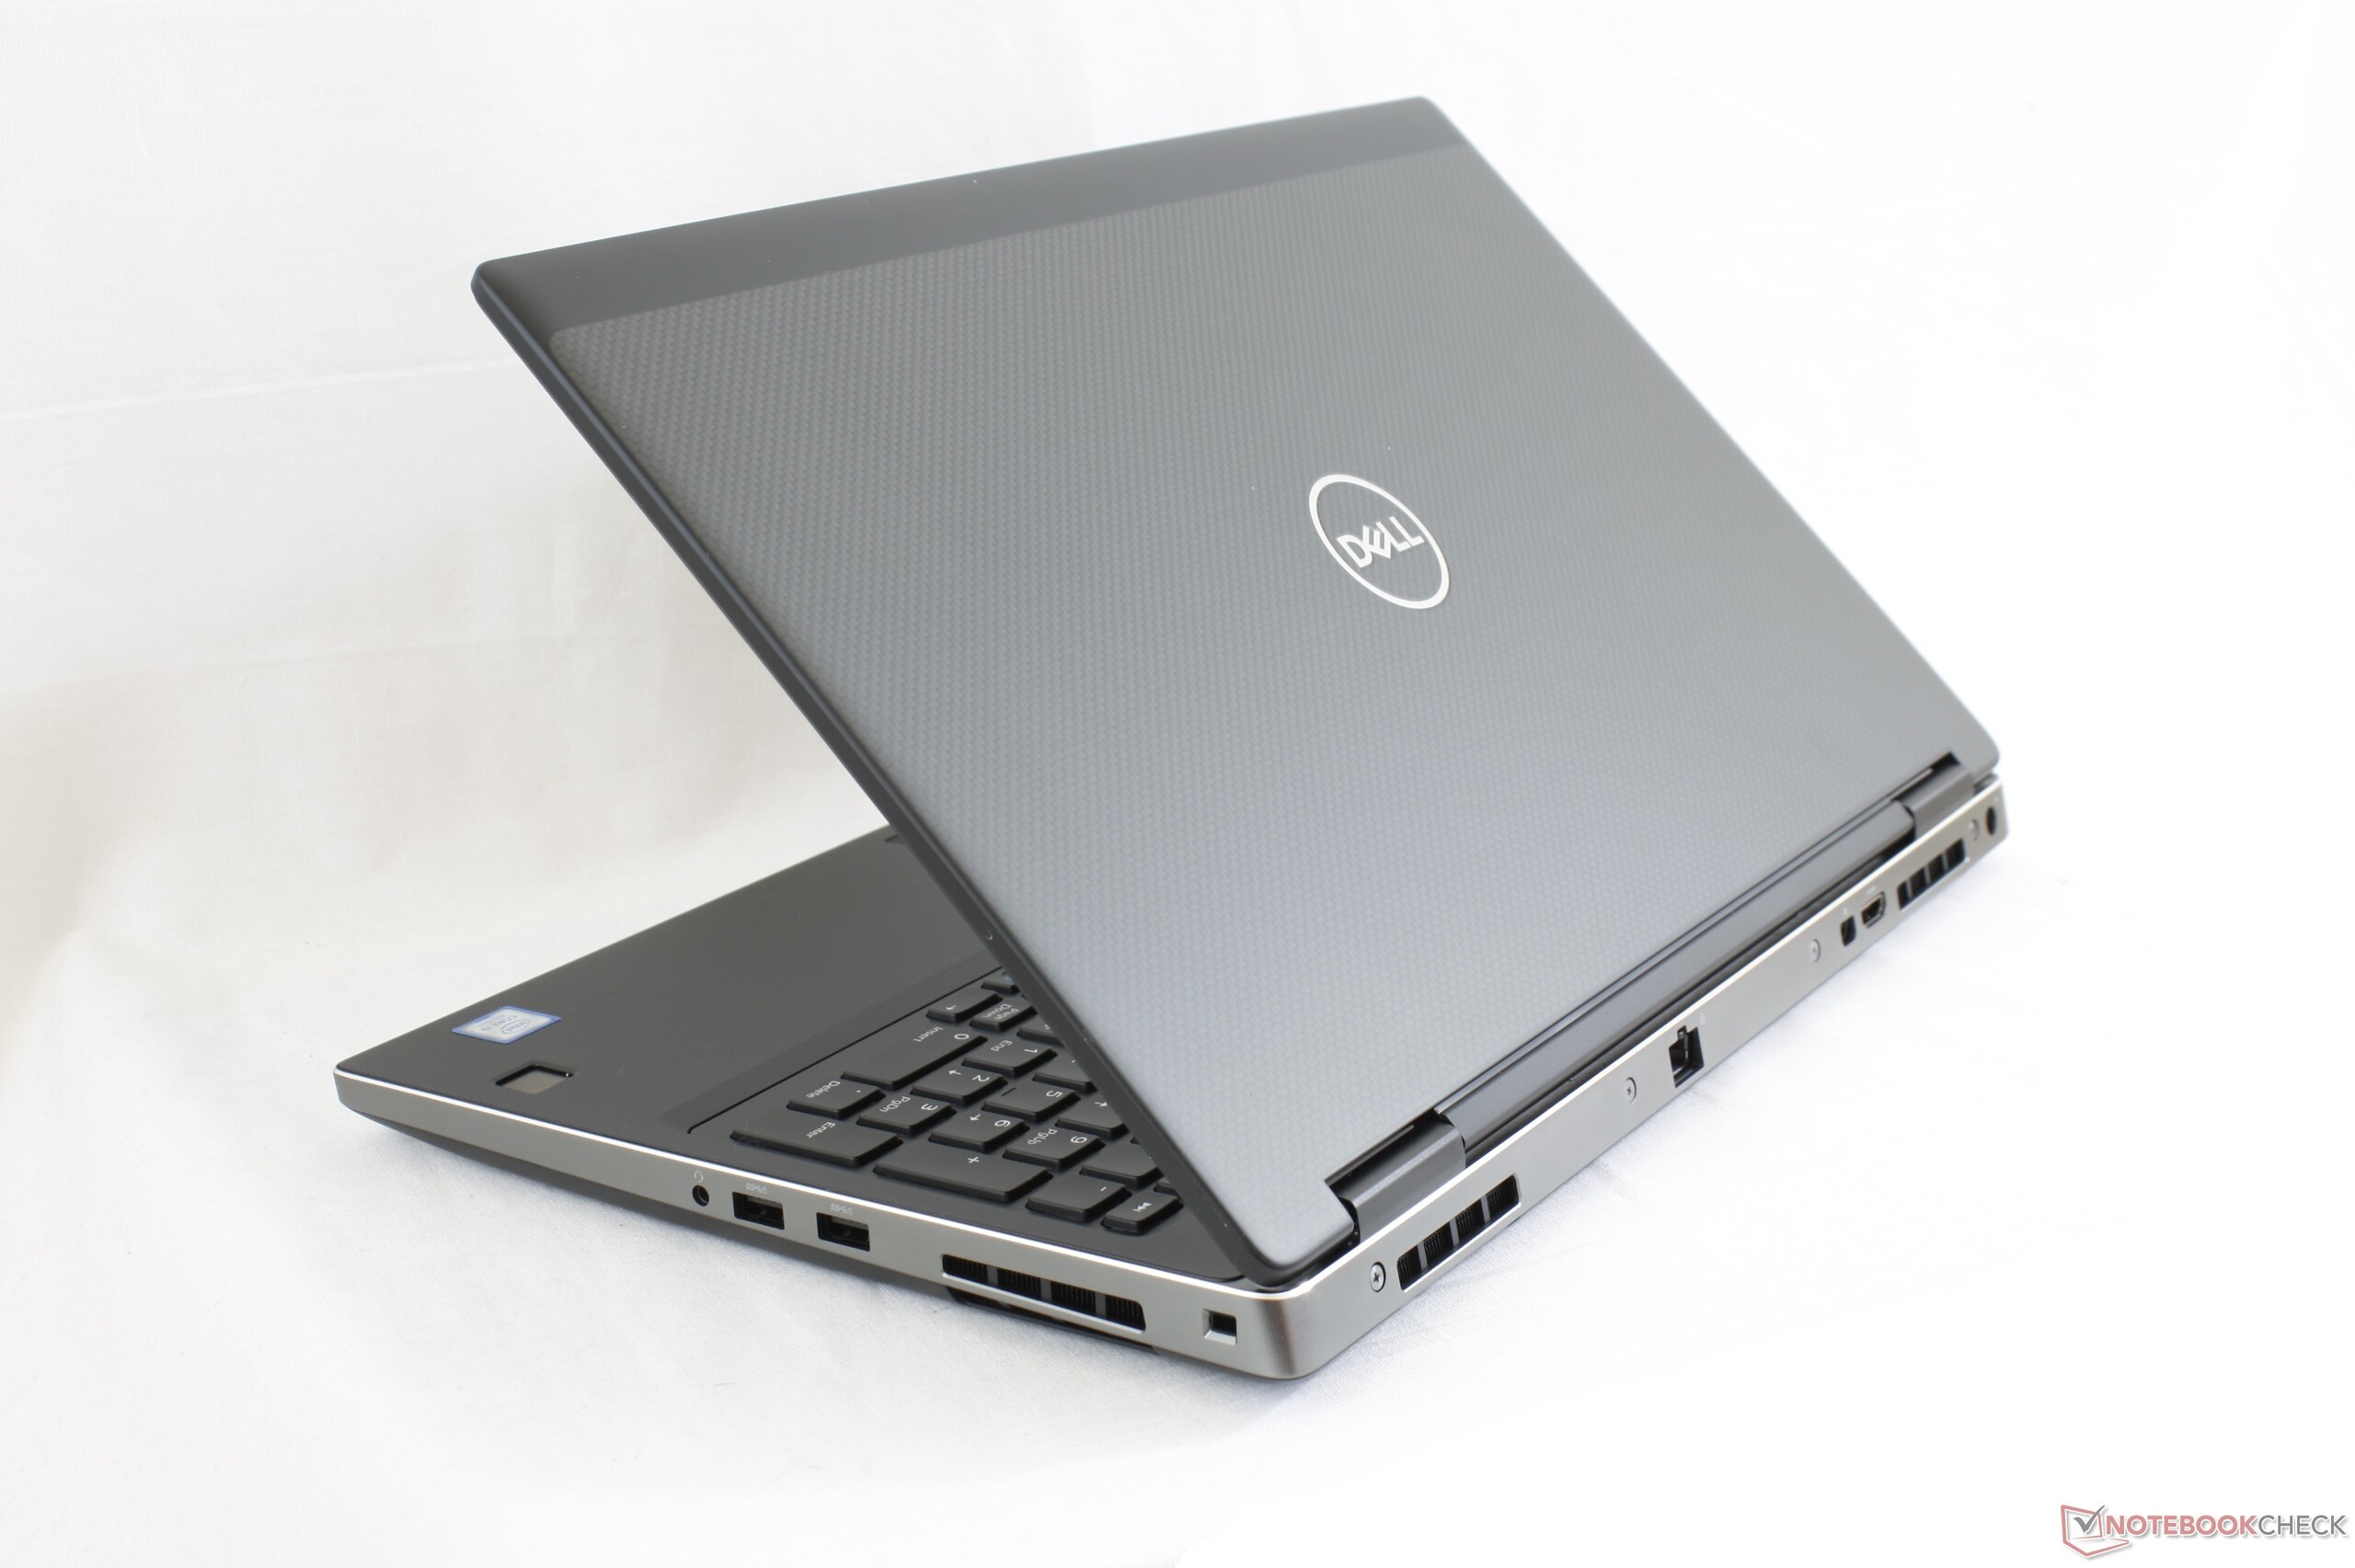
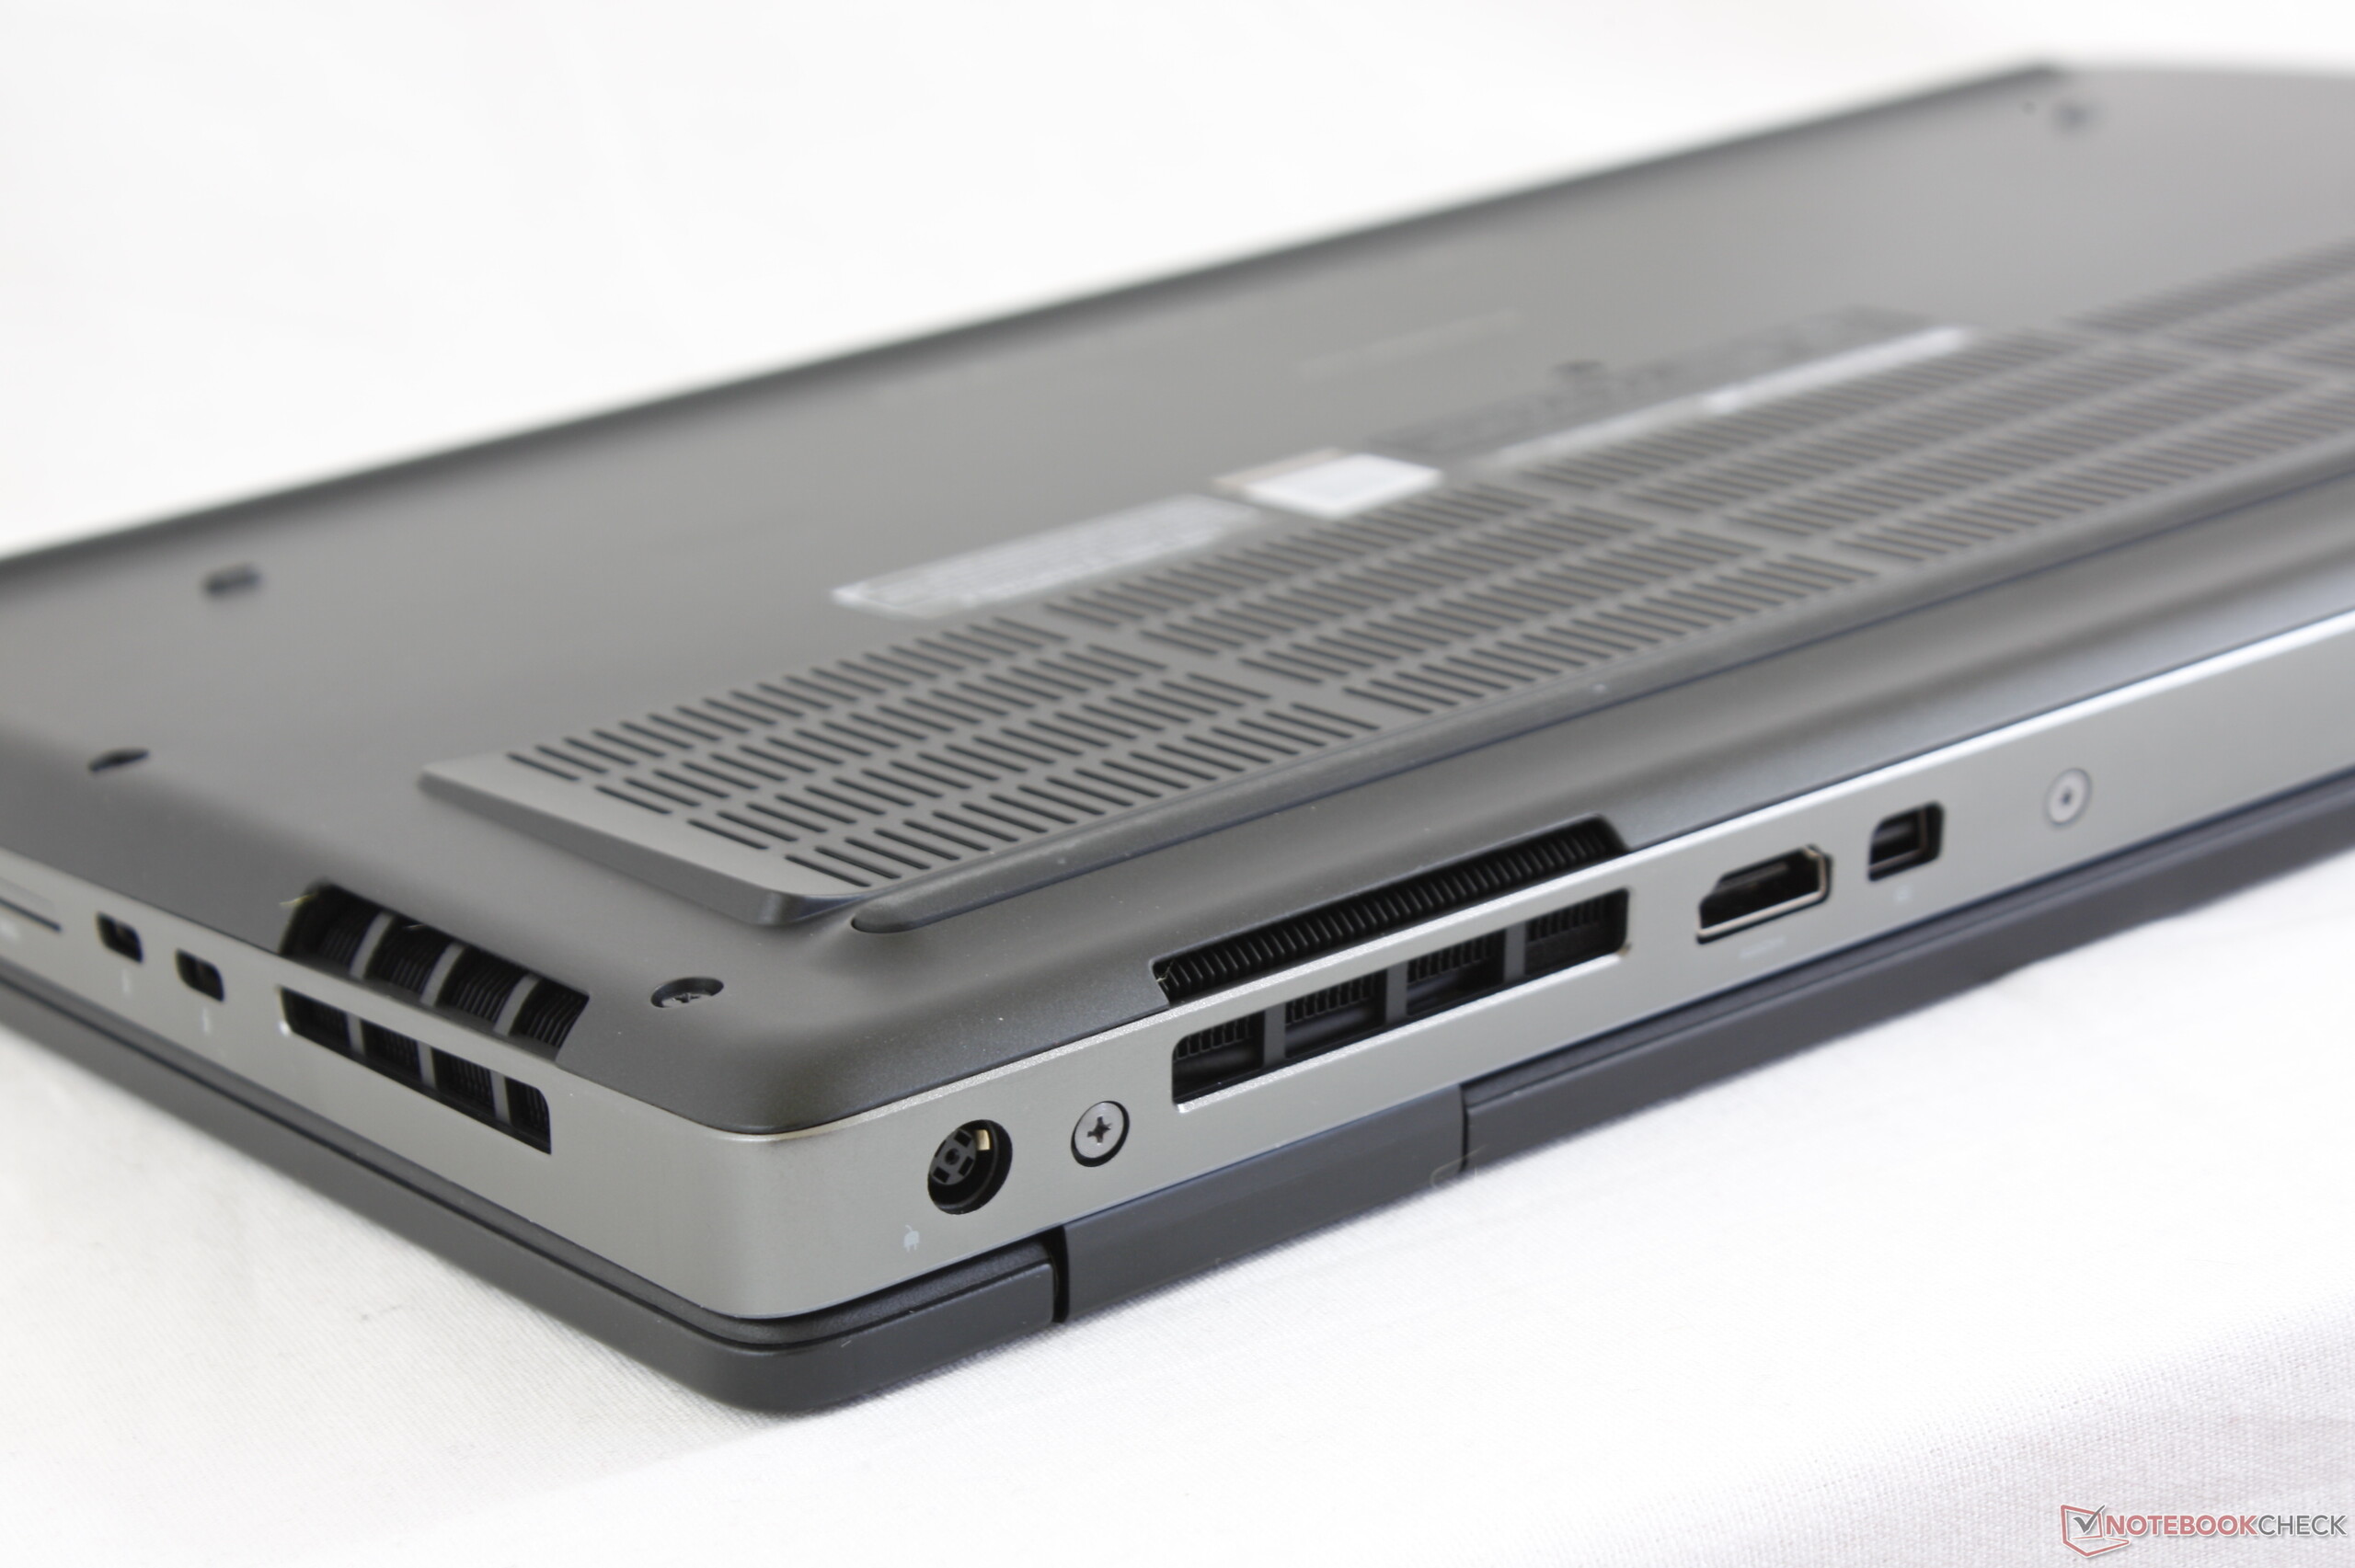
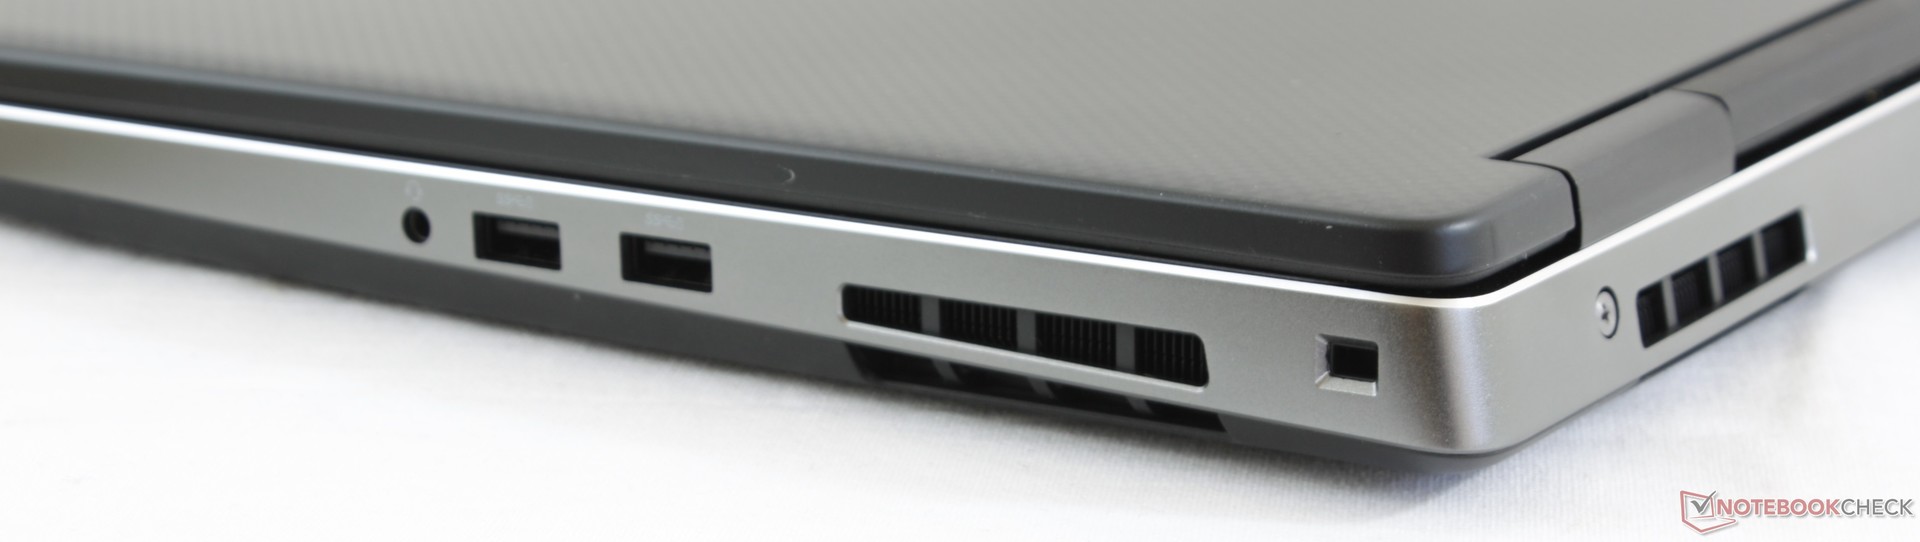
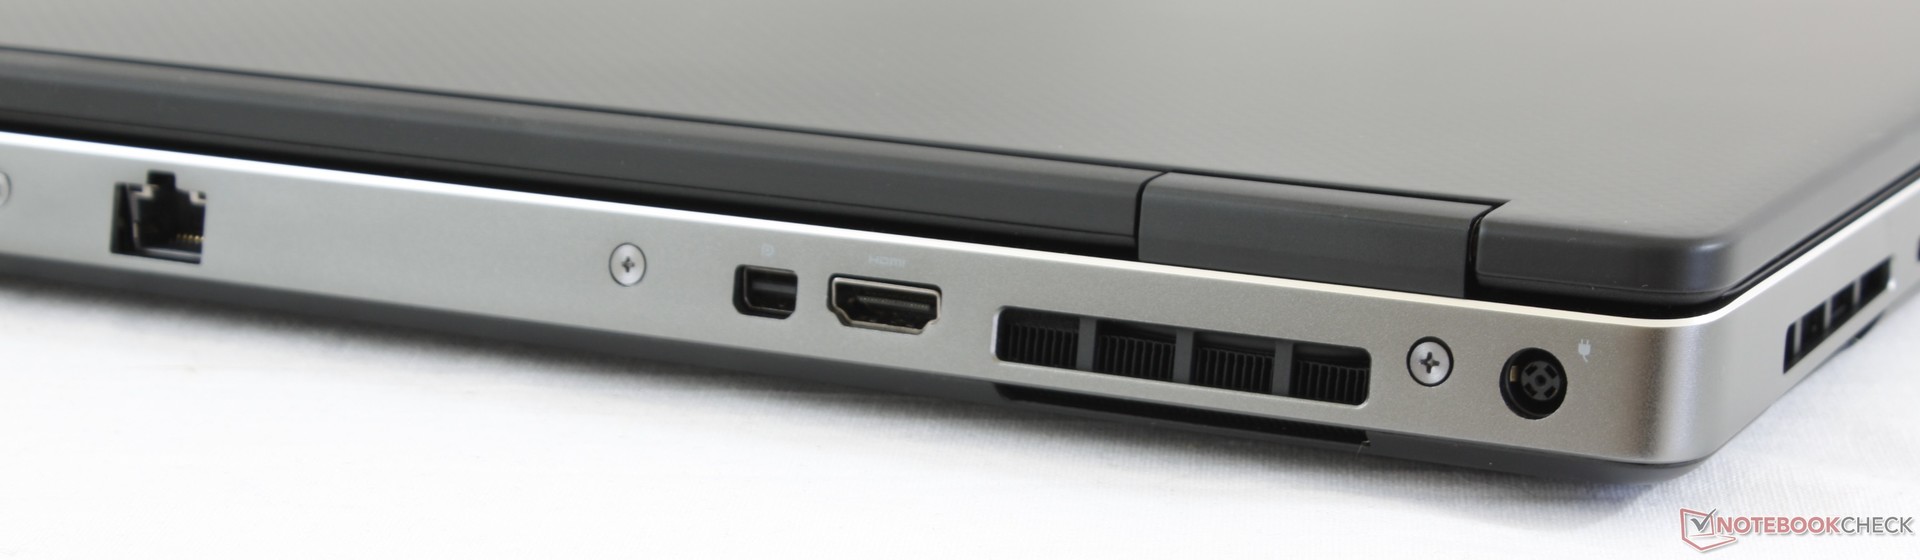
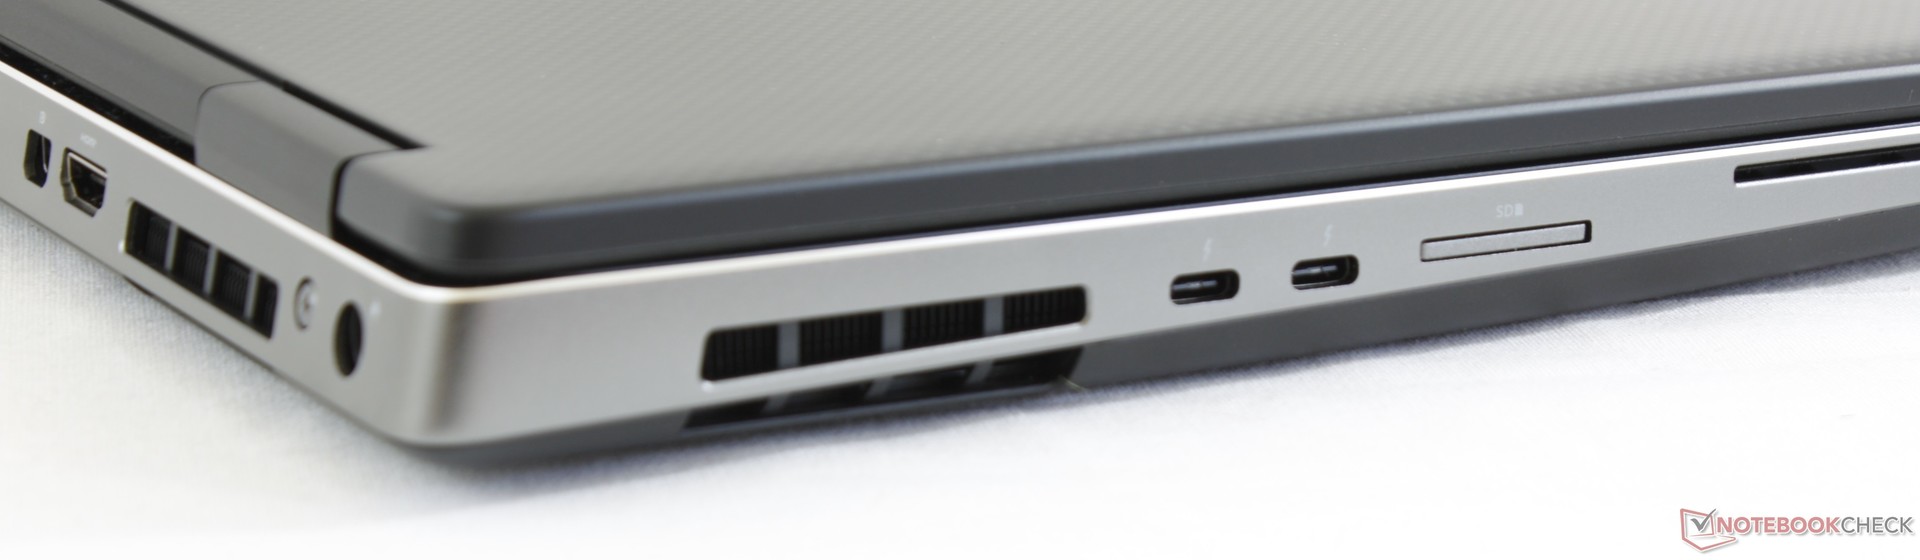
Quanto à conectividade, certamente achamos que poderia oferecer mais do que apenas duas portas USB tipo A, quando o Precision 7510 mais antigo tem o dobro desse número. Se deixar passar essas desvantagens o Precision 7530 ainda é um passo para cima em estética e desempenho em relação com seus antecessores.
O Core i9 é um pouco demais para o Precision 7530. Para uma máquina mais balanceada, os usuários estariam melhor configurando-o com o Core i7-8750H ou Xeon E-2176M. Esta é uma usina bem construída de um workstation com opções de 128 GB de RAM não encontradas na maioria dos outros workstations atualmente no mercado.
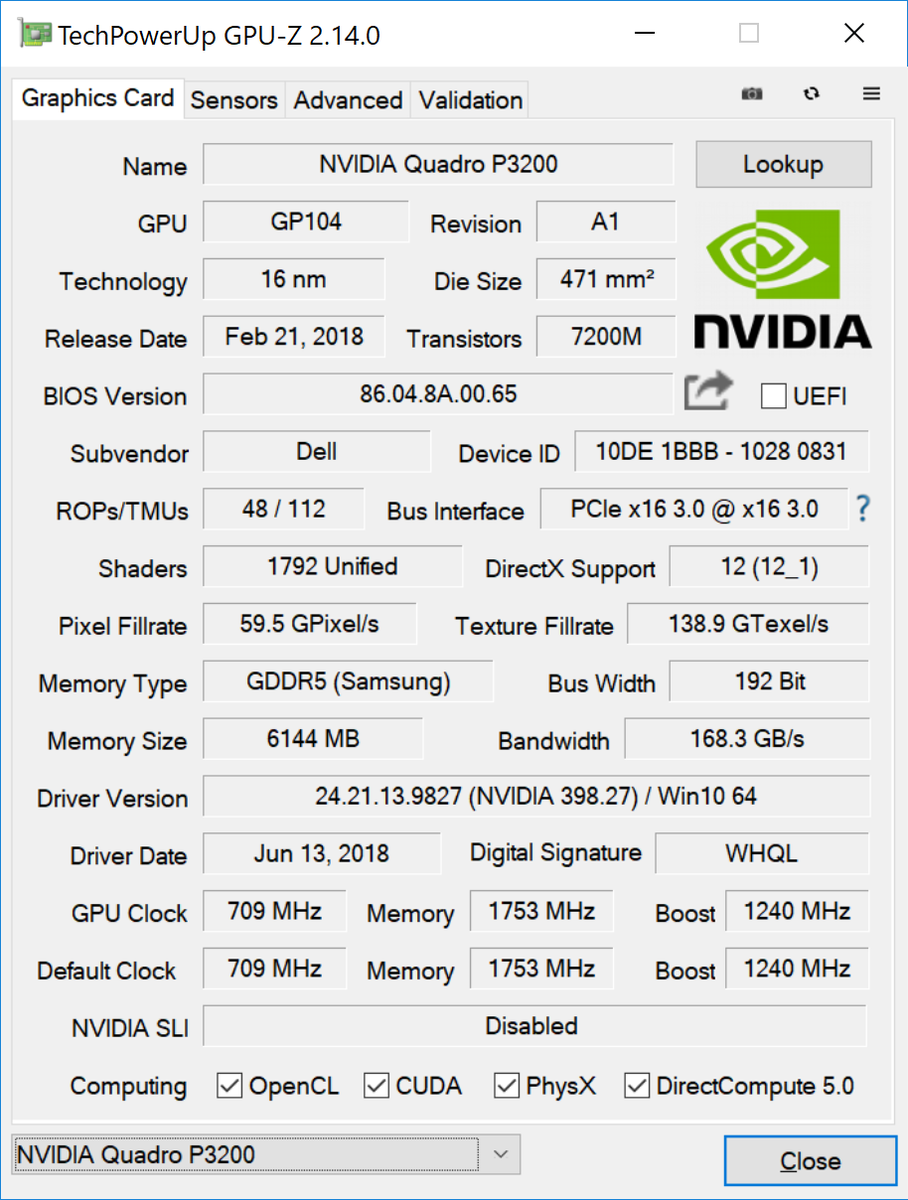
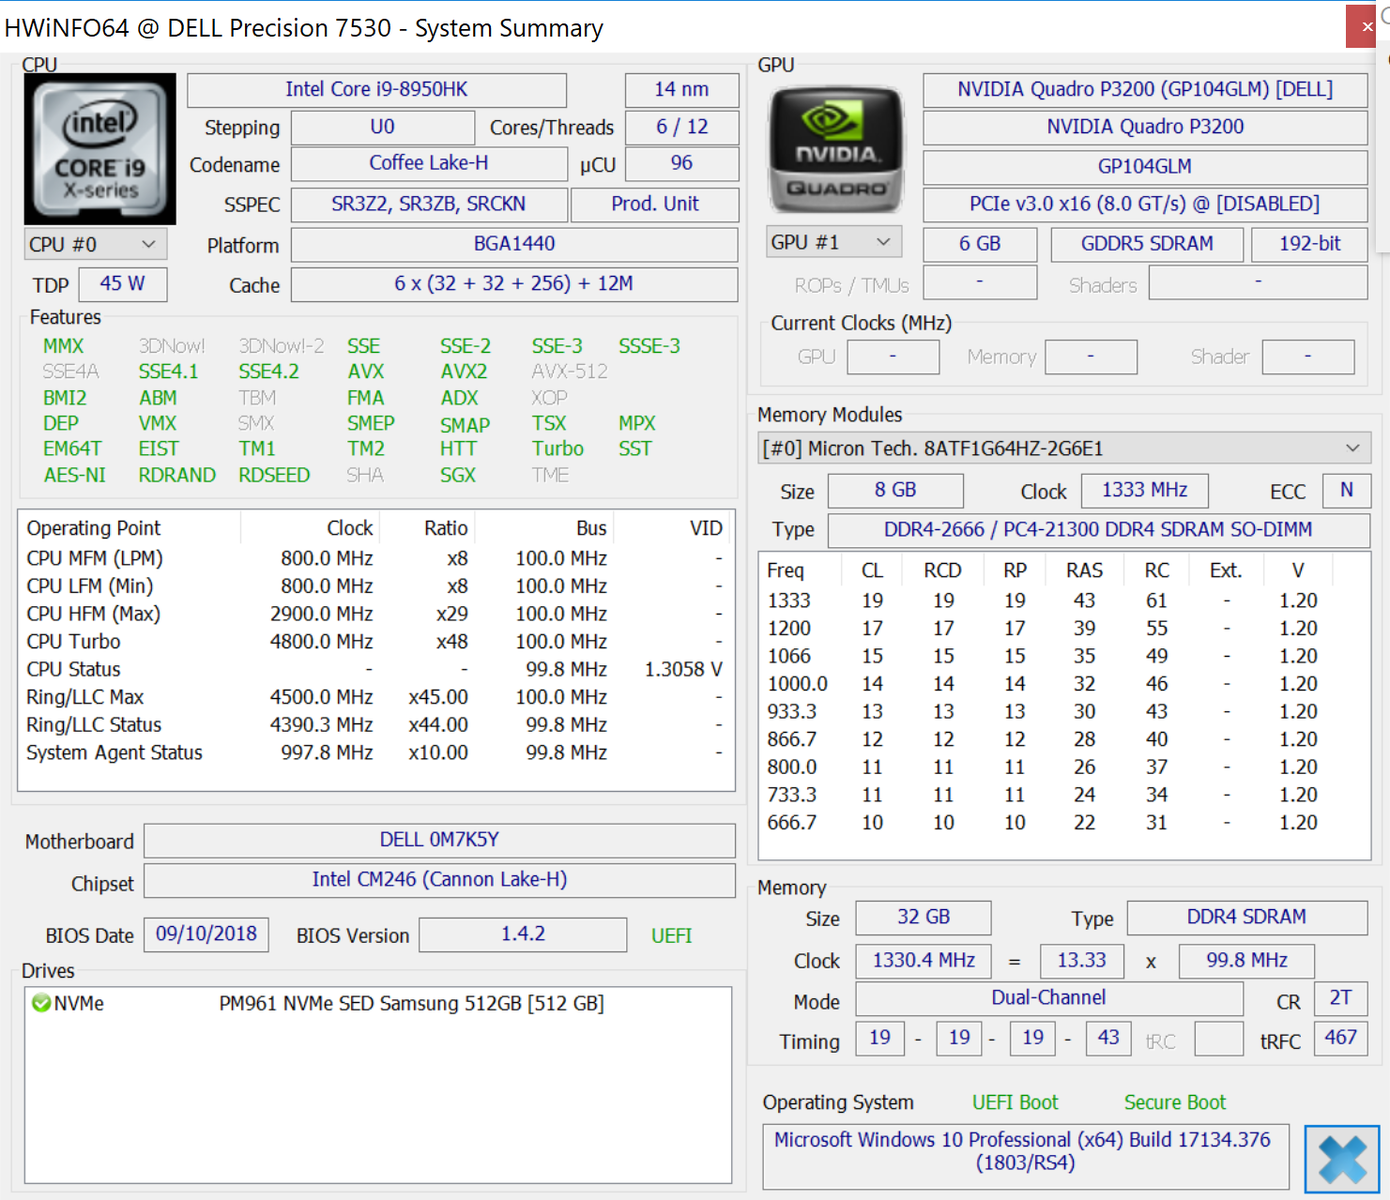
Dell Precision 7530
- 10/25/2019 v7 (old)
Allen Ngo
Price comparison
