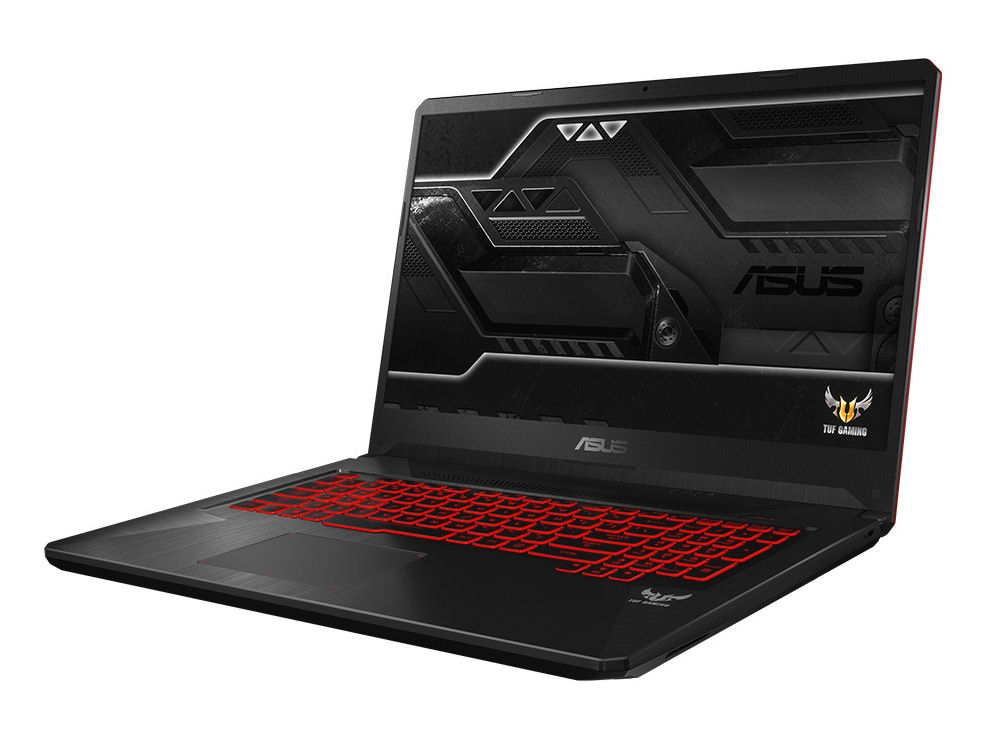
Breve Análise do Portátil ASUS TUF Gaming FX705DY (Ryzen 5 3550H, Radeon RX 560X, SSD, FHD)

| Networking | |
| iperf3 transmit AX12 | |
| Asus TUF FX705GM | |
| HP Envy 17-ae143ng | |
| Asus TUF FX705GE-EW096T | |
| Acer Predator Helios 300 PH317-52-51M6 | |
| Lenovo Legion Y730-17ICH, i7-8750H | |
| Asus TUF FX705DY-AU072 | |
| Dell G3 17 3779 | |
| Lenovo IdeaPad 330-17IKB 81DM | |
| HP 17-ca0013ng | |
| iperf3 receive AX12 | |
| Acer Predator Helios 300 PH317-52-51M6 | |
| Asus TUF FX705GM | |
| Asus TUF FX705GE-EW096T | |
| Lenovo Legion Y730-17ICH, i7-8750H | |
| HP Envy 17-ae143ng | |
| Lenovo IdeaPad 330-17IKB 81DM | |
| Dell G3 17 3779 | |
| Asus TUF FX705DY-AU072 | |
| HP 17-ca0013ng | |
| |||||||||||||||||||||||||
iluminação: 84 %
iluminação com acumulador: 322 cd/m²
Contraste: 1006:1 (Preto: 0.32 cd/m²)
ΔE ColorChecker Calman: 2.97 | ∀{0.5-29.43 Ø4.73}
calibrated: 2.29
ΔE Greyscale Calman: 2.26 | ∀{0.09-98 Ø4.97}
87% sRGB (Argyll 1.6.3 3D)
57% AdobeRGB 1998 (Argyll 1.6.3 3D)
Gamma: 2.45
CCT: 6892 K
| Asus TUF FX705DY-AU072 IPS, 1920x1080, 17.3" | Asus TUF FX705GE-EW096T IPS, 1920x1080, 17.3" | Dell G3 17 3779 IPS, 1920x1080, 17.3" | Lenovo Legion Y730-17ICH, i7-8750H IPS, 1920x1080, 17.3" | Acer Predator Helios 300 PH317-52-51M6 IPS, 1920x1080, 17.3" | Asus TUF FX705GM IPS, 1920x1080, 17.3" | |
|---|---|---|---|---|---|---|
| Display | ||||||
| Display P3 Coverage (%) | 63.1 | 63.9 | 66.4 | 67.1 | 62.4 | |
| sRGB Coverage (%) | 86.8 | 89.8 | 84.9 | 86.1 | 88.8 | |
| AdobeRGB 1998 Coverage (%) | 63.5 | 64.9 | 62.1 | 63 | 63.8 | |
| Response Times | -1% | 5% | 10% | 15% | 72% | |
| Response Time Grey 50% / Grey 80% * (ms) | 40 ? | 39 ? 2% | 38 ? 5% | 36.8 ? 8% | 36 ? 10% | 7.4 ? 81% |
| Response Time Black / White * (ms) | 27 ? | 28 ? -4% | 26 ? 4% | 24 ? 11% | 22 ? 19% | 10 ? 63% |
| PWM Frequency (Hz) | 122000 ? | |||||
| Screen | -1% | -26% | -37% | -44% | 8% | |
| Brightness middle (cd/m²) | 322 | 299 -7% | 323 0% | 328.7 2% | 365 13% | 234 -27% |
| Brightness (cd/m²) | 303 | 291 -4% | 306 1% | 318 5% | 341 13% | 228 -25% |
| Brightness Distribution (%) | 84 | 90 7% | 89 6% | 91 8% | 89 6% | 85 1% |
| Black Level * (cd/m²) | 0.32 | 0.28 12% | 0.31 3% | 0.51 -59% | 0.32 -0% | 0.2 37% |
| Contrast (:1) | 1006 | 1068 6% | 1042 4% | 645 -36% | 1141 13% | 1170 16% |
| Colorchecker dE 2000 * | 2.97 | 3.02 -2% | 4.96 -67% | 4.91 -65% | 6.51 -119% | 2.16 27% |
| Colorchecker dE 2000 max. * | 5.08 | 5.27 -4% | 8.25 -62% | 10.15 -100% | 12.32 -143% | 3.39 33% |
| Colorchecker dE 2000 calibrated * | 2.29 | 2.76 -21% | 4.27 -86% | 2.9 -27% | 2.02 12% | |
| Greyscale dE 2000 * | 2.26 | 2.18 4% | 5.65 -150% | 3.9 -73% | 7.65 -238% | 2 12% |
| Gamma | 2.45 90% | 2.48 89% | 2.24 98% | 2.13 103% | 2.64 83% | 2.46 89% |
| CCT | 6892 94% | 6392 102% | 7441 87% | 6911 94% | 8066 81% | 6394 102% |
| Color Space (Percent of AdobeRGB 1998) (%) | 57 | 57 0% | 58 2% | 55.6 -2% | 56 -2% | 58 2% |
| Color Space (Percent of sRGB) (%) | 87 | 87 0% | 90 3% | 84.7 -3% | 86 -1% | 89 2% |
| Média Total (Programa/Configurações) | -1% /
-1% | -11% /
-21% | -14% /
-30% | -15% /
-35% | 40% /
18% |
* ... menor é melhor
Exibir tempos de resposta
| ↔ Tempo de resposta preto para branco | ||
|---|---|---|
| 27 ms ... ascensão ↗ e queda ↘ combinadas | ↗ 16 ms ascensão | 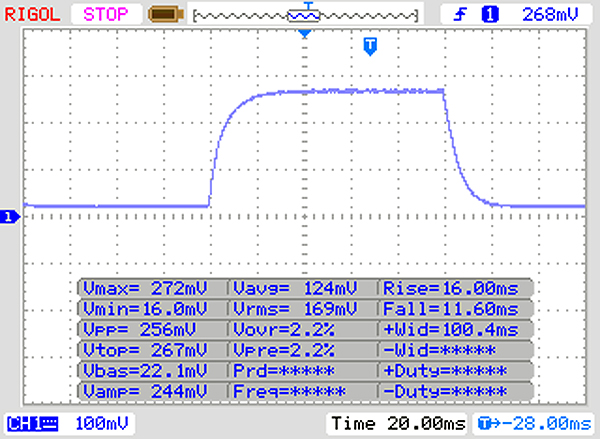 |
| ↘ 11 ms queda | ||
| A tela mostra taxas de resposta relativamente lentas em nossos testes e pode ser muito lenta para os jogadores. Em comparação, todos os dispositivos testados variam de 0.1 (mínimo) a 240 (máximo) ms. » 67 % de todos os dispositivos são melhores. Isso significa que o tempo de resposta medido é pior que a média de todos os dispositivos testados (19.9 ms). | ||
| ↔ Tempo de resposta 50% cinza a 80% cinza | ||
| 40 ms ... ascensão ↗ e queda ↘ combinadas | ↗ 20 ms ascensão | 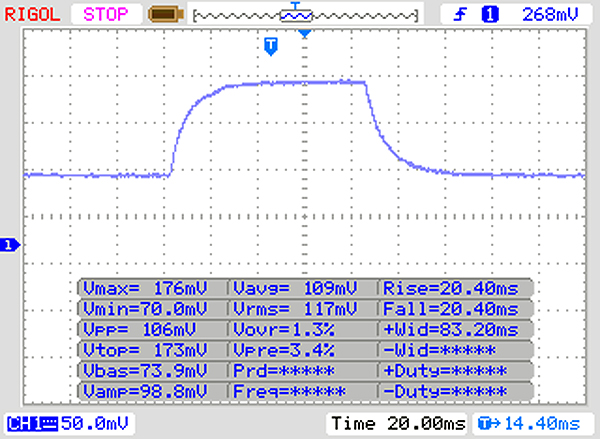 |
| ↘ 20 ms queda | ||
| A tela mostra taxas de resposta lentas em nossos testes e será insatisfatória para os jogadores. Em comparação, todos os dispositivos testados variam de 0.165 (mínimo) a 636 (máximo) ms. » 61 % de todos os dispositivos são melhores. Isso significa que o tempo de resposta medido é pior que a média de todos os dispositivos testados (31.1 ms). | ||
Cintilação da tela / PWM (modulação por largura de pulso)
| Tela tremeluzindo / PWM não detectado | 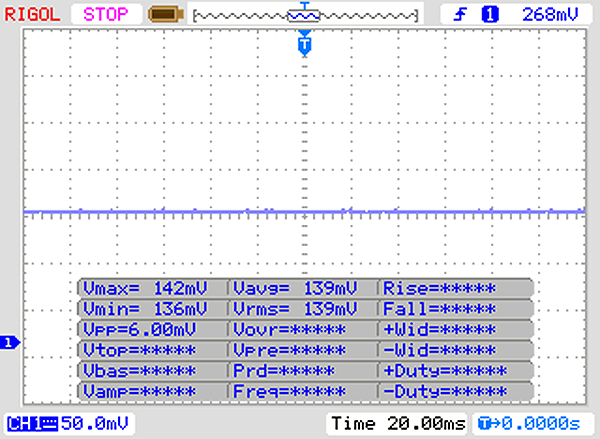 | ||
[pwm_comparison] Em comparação: 52 % de todos os dispositivos testados não usam PWM para escurecer a tela. Se PWM foi detectado, uma média de 7784 (mínimo: 5 - máximo: 343500) Hz foi medida. | |||

| Cinebench R15 | |
| CPU Single 64Bit | |
| Média da turma Gaming (188.8 - 343, n=109, últimos 2 anos) | |
| Asus TUF FX705GM | |
| Acer Predator Helios 300 PH317-52-51M6 | |
| Lenovo Legion Y730-17ICH, i7-8750H | |
| Asus TUF FX705GE-EW096T | |
| Dell G3 17 3779 | |
| Acer Nitro 5 AN515-52 | |
| Lenovo IdeaPad 330-17IKB 81DM | |
| HP Envy 17-ae143ng | |
| Asus TUF FX705DY-AU072 | |
| Asus TUF FX705DY-AU072 (Turbo-Modus) | |
| Média AMD Ryzen 5 3550H (77 - 146, n=11) | |
| HP 17-ca0013ng | |
| Asus TUF FX705DY-AU072 (Leise-Modus) | |
| CPU Multi 64Bit | |
| Média da turma Gaming (1578 - 6271, n=109, últimos 2 anos) | |
| Lenovo Legion Y730-17ICH, i7-8750H | |
| Asus TUF FX705GM | |
| Asus TUF FX705GE-EW096T | |
| Acer Predator Helios 300 PH317-52-51M6 | |
| Acer Nitro 5 AN515-52 | |
| Dell G3 17 3779 | |
| Asus TUF FX705DY-AU072 (Turbo-Modus) | |
| Asus TUF FX705DY-AU072 | |
| Média AMD Ryzen 5 3550H (635 - 769, n=11) | |
| Asus TUF FX705DY-AU072 (Leise-Modus) | |
| HP Envy 17-ae143ng | |
| HP 17-ca0013ng | |
| Lenovo IdeaPad 330-17IKB 81DM | |
| Cinebench R10 | |
| Rendering Single 32Bit | |
| Média da turma Gaming (7457 - 11779, n=8, últimos 2 anos) | |
| Asus TUF FX705DY-AU072 | |
| Dell G3 17 3779 | |
| Asus TUF FX705GE-EW096T | |
| HP Envy 17-ae143ng | |
| Média AMD Ryzen 5 3550H (4575 - 7893, n=4) | |
| Rendering Multiple CPUs 32Bit | |
| Média da turma Gaming (42932 - 81339, n=8, últimos 2 anos) | |
| Asus TUF FX705GE-EW096T | |
| Dell G3 17 3779 | |
| HP Envy 17-ae143ng | |
| Média AMD Ryzen 5 3550H (19002 - 20097, n=4) | |
| Asus TUF FX705DY-AU072 | |
| Cinebench R20 | |
| CPU (Single Core) | |
| Média da turma Gaming (442 - 895, n=109, últimos 2 anos) | |
| Asus TUF FX705DY-AU072 | |
| Média AMD Ryzen 5 3550H (331 - 370, n=8) | |
| CPU (Multi Core) | |
| Média da turma Gaming (4029 - 16108, n=109, últimos 2 anos) | |
| Asus TUF FX705DY-AU072 | |
| Média AMD Ryzen 5 3550H (1421 - 1728, n=8) | |
| Geekbench 3 | |
| 32 Bit Multi-Core Score | |
| Asus TUF FX705GE-EW096T | |
| Acer Nitro 5 AN515-52 | |
| Asus TUF FX705DY-AU072 | |
| Média AMD Ryzen 5 3550H (13474 - 15114, n=3) | |
| HP Envy 17-ae143ng | |
| 32 Bit Single-Core Score | |
| Acer Nitro 5 AN515-52 | |
| Asus TUF FX705GE-EW096T | |
| HP Envy 17-ae143ng | |
| Média AMD Ryzen 5 3550H (3348 - 3558, n=3) | |
| Asus TUF FX705DY-AU072 | |
| Geekbench 4.4 | |
| 64 Bit Multi-Core Score | |
| Média da turma Gaming (89200 - 97490, n=2, últimos 2 anos) | |
| Asus TUF FX705GE-EW096T | |
| Acer Nitro 5 AN515-52 | |
| HP Envy 17-ae143ng | |
| Média AMD Ryzen 5 3550H (11183 - 13441, n=7) | |
| Asus TUF FX705DY-AU072 | |
| 64 Bit Single-Core Score | |
| Média da turma Gaming (9335 - 9492, n=2, últimos 2 anos) | |
| Acer Nitro 5 AN515-52 | |
| Asus TUF FX705GE-EW096T | |
| HP Envy 17-ae143ng | |
| Média AMD Ryzen 5 3550H (3623 - 3938, n=7) | |
| Asus TUF FX705DY-AU072 | |
| Mozilla Kraken 1.1 - Total | |
| Asus TUF FX705DY-AU072 (Edge 44) | |
| Dell G3 17 3779 (Edge 42.17134.1.0) | |
| Média AMD Ryzen 5 3550H (1042 - 1229, n=8) | |
| Média da turma Gaming (391 - 590, n=104, últimos 2 anos) | |
| Octane V2 - Total Score | |
| Média da turma Gaming (89353 - 139447, n=29, últimos 2 anos) | |
| Dell G3 17 3779 (Edge 42.17134.1.0) | |
| Asus TUF FX705DY-AU072 (Edge 44) | |
| Média AMD Ryzen 5 3550H (28324 - 29361, n=4) | |
| WebXPRT 3 - Overall | |
| Média da turma Gaming (242 - 532, n=99, últimos 2 anos) | |
| Asus TUF FX705DY-AU072 (Edge 44) | |
| Média AMD Ryzen 5 3550H (151.3 - 174, n=5) | |
| Speedometer 2.0 - Result 2.0 | |
| Média da turma Gaming (29 - 686, n=28, últimos 2 anos) | |
| Asus TUF FX705DY-AU072 (Edge 44) | |
| Média AMD Ryzen 5 3550H (42.1 - 43.5, n=2) | |
* ... menor é melhor
| PCMark 7 Score | 7154 pontos | |
| PCMark 8 Home Score Accelerated v2 | 4041 pontos | |
| PCMark 8 Creative Score Accelerated v2 | 4142 pontos | |
| PCMark 8 Work Score Accelerated v2 | 4877 pontos | |
| PCMark 10 Score | 4237 pontos | |
Ajuda | ||

| Asus TUF FX705DY-AU072 Kingston RBUSNS8154P3512GJ | Asus TUF FX705GE-EW096T SK hynix BC501 HFM128GDJTNG-831 | Dell G3 17 3779 SK hynix SC311 SATA | Lenovo Legion Y730-17ICH, i7-8750H Toshiba KBG30ZMT128G | Acer Predator Helios 300 PH317-52-51M6 Hynix HFS128G39TND | Asus TUF FX705GM WDC PC SN520 SDAPNUW-256G | Média Kingston RBUSNS8154P3512GJ | |
|---|---|---|---|---|---|---|---|
| CrystalDiskMark 5.2 / 6 | -29% | -56% | -51% | -60% | 9% | -5% | |
| Write 4K (MB/s) | 107.7 | 90.3 -16% | 62.8 -42% | 71.4 -34% | 61.9 -43% | 104.2 -3% | 87.8 ? -18% |
| Read 4K (MB/s) | 36.5 | 37.03 1% | 24.63 -33% | 29.98 -18% | 22.78 -38% | 41.46 14% | 33.7 ? -8% |
| Write Seq (MB/s) | 988 | 320.3 -68% | 203.9 -79% | 129.6 -87% | 136.1 -86% | 1295 31% | 878 ? -11% |
| Read Seq (MB/s) | 1115 | 1012 -9% | 550 -51% | 843 -24% | 490.1 -56% | 1325 19% | 949 ? -15% |
| Write 4K Q32T1 (MB/s) | 334.9 | 196.8 -41% | 160.1 -52% | 88.9 -73% | 136.2 -59% | 282.8 -16% | 355 ? 6% |
| Read 4K Q32T1 (MB/s) | 360.8 | 271.5 -25% | 184.3 -49% | 196.4 -46% | 208.4 -42% | 321.3 -11% | 402 ? 11% |
| Write Seq Q32T1 (MB/s) | 1008 | 268.8 -73% | 235 -77% | 130.5 -87% | 136 -87% | 1301 29% | 977 ? -3% |
| Read Seq Q32T1 (MB/s) | 1609 | 1595 -1% | 554 -66% | 1037 -36% | 553 -66% | 1704 6% | 1597 ? -1% |
| 3DMark 06 Standard Score | 25527 pontos | |
| 3DMark 11 Performance | 7725 pontos | |
| 3DMark Ice Storm Standard Score | 60240 pontos | |
| 3DMark Cloud Gate Standard Score | 10106 pontos | |
| 3DMark Fire Strike Score | 5513 pontos | |
| 3DMark Time Spy Score | 1909 pontos | |
Ajuda | ||
| 3DMark 11 - 1280x720 Performance GPU | |
| Média da turma Gaming (21841 - 80022, n=106, últimos 2 anos) | |
| Asus TUF FX705GM | |
| Asus TUF FX705GE-EW096T | |
| Acer Predator Helios 300 PH317-52-51M6 | |
| Asus TUF FX705DY-AU072 | |
| Asus TUF FX505DY | |
| Média AMD Radeon RX 560X (Laptop) (6491 - 8451, n=6) | |
| Dell G3 17 3779 | |
| Lenovo IdeaPad 330-17IKB 81DM | |
| HP Envy 17-ae143ng | |
| HP 17-ca0013ng | |
| baixo | média | alto | ultra | |
|---|---|---|---|---|
| StarCraft 2 (2010) | 256.3 | 116.3 | 113.6 | 81.6 |
| Diablo III (2012) | 150.2 | 133.5 | 130.8 | 105.7 |
| Counter-Strike: GO (2012) | 209.3 | 188.2 | 162 | 121.7 |
| BioShock Infinite (2013) | 188 | 158.2 | 140.9 | 53 |
| Sims 4 (2014) | 145.4 | 114.8 | 73.2 | 64.8 |
| GTA V (2015) | 89.3 | 83 | 48.3 | 21.2 |
| The Witcher 3 (2015) | 105.5 | 67.6 | 35.9 | 21.7 |
| Batman: Arkham Knight (2015) | 90 | 84 | 47 | |
| Dota 2 Reborn (2015) | 80 | 73.1 | 65.6 | 60.7 |
| World of Warships (2015) | 125.7 | 105.9 | 83.6 | 71.4 |
| Ashes of the Singularity (2016) | 44.5 | 31.7 | 24.2 | |
| Mafia 3 (2016) | 44.9 | 34.4 | 22.7 | |
| Civilization 6 (2016) | 107.6 | 76.4 | 39.3 | 33.9 |
| Warhammer 40.000: Dawn of War III (2017) | 90.8 | 50 | 45 | 39.4 |
| Team Fortress 2 (2017) | 95.3 | 93.8 | 84.1 | 80.5 |
| Ark Survival Evolved (2017) | 64.3 | 18.9 | 14 | 9.7 |
| Destiny 2 (2017) | 77.8 | 50.8 | 46.7 | 37.3 |
| X-Plane 11.11 (2018) | 37 | 30 | 26.6 | |
| Far Cry 5 (2018) | 63 | 39 | 36 | 33 |
| Call of Duty Black Ops 4 (2018) | 89.3 | 48.4 | 45.2 | 37.3 |
| Battlefield V (2018) | 81.2 | 53.9 | 45.8 | 41.9 |
| Darksiders III (2018) | 96.8 | 40.3 | 31.8 | 27.6 |
| Just Cause 4 (2018) | 65.8 | 41.8 | 29.6 | 26.8 |
| Apex Legends (2019) | 106.8 | 45.4 | 37.5 | 34.9 |
| Far Cry New Dawn (2019) | 56 | 39 | 36 | 33 |
| Metro Exodus (2019) | 55.1 | 27.8 | 18.3 | 15.3 |
| Anthem (2019) | 47.2 | 36.6 | 33.1 | 30.2 |
| Dirt Rally 2.0 (2019) | 151.9 | 65.7 | 53.1 | 28.3 |
| The Division 2 (2019) | 69 | 42 | 31 | 23 |
| BioShock Infinite - 1920x1080 Ultra Preset, DX11 (DDOF) | |
| Lenovo Legion Y730-17ICH, i7-8750H | |
| Asus TUF FX705GE-EW096T | |
| Dell G3 17 3779 | |
| Asus TUF FX505DY | |
| Média AMD Radeon RX 560X (Laptop) (53 - 53.1, n=2) | |
| Asus TUF FX705DY-AU072 | |
| HP Envy 17-ae143ng | |
| HP 17-ca0013ng | |
| The Witcher 3 - 1366x768 Medium Graphics & Postprocessing | |
| Média da turma Gaming (295 - 517, n=3, últimos 2 anos) | |
| Lenovo Legion Y730-17ICH, i7-8750H | |
| Asus TUF FX705GE-EW096T | |
| Dell G3 17 3779 | |
| Asus TUF FX505DY | |
| Média AMD Radeon RX 560X (Laptop) (67.6 - 70.3, n=3) | |
| Asus TUF FX705DY-AU072 | |
| Lenovo IdeaPad 330-17IKB 81DM | |
| Far Cry 5 - 1920x1080 Medium Preset AA:T | |
| Média da turma Gaming (84 - 173, n=10, últimos 2 anos) | |
| Asus TUF FX705GE-EW096T | |
| Dell G3 17 3779 | |
| Asus TUF FX705DY-AU072 | |
| Média AMD Radeon RX 560X (Laptop) (38 - 39, n=2) | |
| Darksiders III - 1920x1080 Medium | |
| Asus TUF FX705GE-EW096T | |
| Asus TUF FX705DY-AU072 | |
| Média AMD Radeon RX 560X (Laptop) (n=1) | |
| Diablo III - 1920x1080 High AA:on | |
| Asus TUF FX705GE-EW096T | |
| Asus TUF FX705DY-AU072 | |
| Média AMD Radeon RX 560X (Laptop) (n=1) | |
| HP Envy 17-ae143ng | |
| StarCraft 2 - 1920x1080 ultra | |
| Asus TUF FX705GE-EW096T | |
| Asus TUF FX705DY-AU072 | |
| Média AMD Radeon RX 560X (Laptop) (n=1) | |
| HP Envy 17-ae143ng | |
Barulho
| Ocioso |
| 32.5 / 32.6 / 33.3 dB |
| Carga |
| 38.7 / 45 dB |
 | ||
30 dB silencioso 40 dB(A) audível 50 dB(A) ruidosamente alto |
||
min: | ||
| Asus TUF FX705DY-AU072 R5 3550H, Radeon RX 560X (Laptop) | Dell G3 17 3779 i5-8300H, GeForce GTX 1050 Mobile | Asus TUF FX705GE-EW096T i7-8750H, GeForce GTX 1050 Ti Mobile | Lenovo Legion Y730-17ICH, i7-8750H i7-8750H, GeForce GTX 1050 Ti Mobile | Acer Predator Helios 300 PH317-52-51M6 i5-8300H, GeForce GTX 1050 Ti Mobile | Asus TUF FX705GM i7-8750H, GeForce GTX 1060 Mobile | Média AMD Radeon RX 560X (Laptop) | Média da turma Gaming | |
|---|---|---|---|---|---|---|---|---|
| Noise | 3% | -2% | 9% | -1% | -9% | 3% | 6% | |
| desligado / ambiente * (dB) | 30.7 | 30.5 1% | 30.5 1% | 28 9% | 29 6% | 29 6% | 29.3 ? 5% | 24.1 ? 21% |
| Idle Minimum * (dB) | 32.5 | 30.5 6% | 31.2 4% | 28 14% | 29 11% | 32 2% | 29.9 ? 8% | 25.8 ? 21% |
| Idle Average * (dB) | 32.6 | 31.1 5% | 32.4 1% | 28 14% | 31 5% | 33 -1% | 30.6 ? 6% | 27.4 ? 16% |
| Idle Maximum * (dB) | 33.3 | 32.1 4% | 32.8 2% | 31.3 6% | 33 1% | 44 -32% | 31.2 ? 6% | 29.9 ? 10% |
| Load Average * (dB) | 38.7 | 43.4 -12% | 43 -11% | 33.4 14% | 45 -16% | 46 -19% | 39.5 ? -2% | 43 ? -11% |
| Load Maximum * (dB) | 45 | 39.2 13% | 48.1 -7% | 46.2 -3% | 51 -13% | 50 -11% | 47.2 ? -5% | 54 ? -20% |
| Witcher 3 ultra * (dB) | 42.8 | 45 | 48 |
* ... menor é melhor
(±) A temperatura máxima no lado superior é 41.5 °C / 107 F, em comparação com a média de 40.4 °C / 105 F , variando de 21.2 a 68.8 °C para a classe Gaming.
(+) A parte inferior aquece até um máximo de 39.6 °C / 103 F, em comparação com a média de 43.2 °C / 110 F
(+) Em uso inativo, a temperatura média para o lado superior é 23.7 °C / 75 F, em comparação com a média do dispositivo de 33.9 °C / ### class_avg_f### F.
(+) Os apoios para as mãos e o touchpad são mais frios que a temperatura da pele, com um máximo de 22.9 °C / 73.2 F e, portanto, são frios ao toque.
(+) A temperatura média da área do apoio para as mãos de dispositivos semelhantes foi 28.8 °C / 83.8 F (+5.9 °C / 10.6 F).
| Asus TUF FX705DY-AU072 R5 3550H, Radeon RX 560X (Laptop) | Dell G3 17 3779 i5-8300H, GeForce GTX 1050 Mobile | Asus TUF FX705GE-EW096T i7-8750H, GeForce GTX 1050 Ti Mobile | Lenovo Legion Y730-17ICH, i7-8750H i7-8750H, GeForce GTX 1050 Ti Mobile | Acer Predator Helios 300 PH317-52-51M6 i5-8300H, GeForce GTX 1050 Ti Mobile | Asus TUF FX705GM i7-8750H, GeForce GTX 1060 Mobile | Média AMD Radeon RX 560X (Laptop) | Média da turma Gaming | |
|---|---|---|---|---|---|---|---|---|
| Heat | -33% | -17% | -25% | -26% | -26% | -10% | -23% | |
| Maximum Upper Side * (°C) | 41.5 | 53 -28% | 53.3 -28% | 42 -1% | 50 -20% | 54 -30% | 44.2 ? -7% | 45.2 ? -9% |
| Maximum Bottom * (°C) | 39.6 | 60.5 -53% | 44.7 -13% | 51.2 -29% | 52 -31% | 53 -34% | 44.3 ? -12% | 47.9 ? -21% |
| Idle Upper Side * (°C) | 25.7 | 30.3 -18% | 29.5 -15% | 31.8 -24% | 33 -28% | 30 -17% | 27.2 ? -6% | 31.1 ? -21% |
| Idle Bottom * (°C) | 24.2 | 32 -32% | 27 -12% | 35.4 -46% | 30 -24% | 30 -24% | 27.7 ? -14% | 34.2 ? -41% |
* ... menor é melhor
Asus TUF FX705DY-AU072 análise de áudio
(-) | alto-falantes não muito altos (###valor### dB)
Graves 100 - 315Hz
(-) | quase nenhum baixo - em média 19.2% menor que a mediana
(±) | a linearidade dos graves é média (10.6% delta para a frequência anterior)
Médios 400 - 2.000 Hz
(+) | médios equilibrados - apenas 3.3% longe da mediana
(±) | a linearidade dos médios é média (9.5% delta para frequência anterior)
Altos 2 - 16 kHz
(±) | máximos mais altos - em média 8% maior que a mediana
(±) | a linearidade dos máximos é média (9.4% delta para frequência anterior)
Geral 100 - 16.000 Hz
(±) | a linearidade do som geral é média (29.1% diferença em relação à mediana)
Comparado com a mesma classe
» 94% de todos os dispositivos testados nesta classe foram melhores, 2% semelhantes, 4% piores
» O melhor teve um delta de 6%, a média foi 18%, o pior foi 132%
Comparado com todos os dispositivos testados
» 87% de todos os dispositivos testados foram melhores, 2% semelhantes, 11% piores
» O melhor teve um delta de 4%, a média foi 24%, o pior foi 134%
| desligado | |
| Ocioso | |
| Carga |
|
Key:
min: | |
| Asus TUF FX705DY-AU072 R5 3550H, Radeon RX 560X (Laptop) | Dell G3 17 3779 i5-8300H, GeForce GTX 1050 Mobile | Asus TUF FX705GE-EW096T i7-8750H, GeForce GTX 1050 Ti Mobile | Lenovo Legion Y730-17ICH, i7-8750H i7-8750H, GeForce GTX 1050 Ti Mobile | Acer Predator Helios 300 PH317-52-51M6 i5-8300H, GeForce GTX 1050 Ti Mobile | Asus TUF FX705GM i7-8750H, GeForce GTX 1060 Mobile | Média AMD Radeon RX 560X (Laptop) | Média da turma Gaming | |
|---|---|---|---|---|---|---|---|---|
| Power Consumption | -21% | 6% | -7% | -6% | -75% | -0% | -92% | |
| Idle Minimum * (Watt) | 5.5 | 7.7 -40% | 3.8 31% | 6.3 -15% | 6 -9% | 13 -136% | 5.9 ? -7% | 13.2 ? -140% |
| Idle Average * (Watt) | 10.9 | 14 -28% | 9 17% | 11 -1% | 9 17% | 17 -56% | 9.47 ? 13% | 18.9 ? -73% |
| Idle Maximum * (Watt) | 12.2 | 15.5 -27% | 11.2 8% | 11.5 6% | 13 -7% | 24 -97% | 13.2 ? -8% | 24.3 ? -99% |
| Load Average * (Watt) | 77 | 95 -23% | 101 -31% | 89.8 -17% | 95 -23% | 106 -38% | 76.3 ? 1% | 108.3 ? -41% |
| Load Maximum * (Watt) | 123 | 106 14% | 119.7 3% | 130.7 -6% | 134 -9% | 179 -46% | 123.9 ? -1% | 254 ? -107% |
| Witcher 3 ultra * (Watt) | 102 | 102 | 151 |
* ... menor é melhor
| Asus TUF FX705DY-AU072 R5 3550H, Radeon RX 560X (Laptop), 64 Wh | Dell G3 17 3779 i5-8300H, GeForce GTX 1050 Mobile, 56 Wh | Lenovo Legion Y730-17ICH, i7-8750H i7-8750H, GeForce GTX 1050 Ti Mobile, 76 Wh | Acer Predator Helios 300 PH317-52-51M6 i5-8300H, GeForce GTX 1050 Ti Mobile, 48 Wh | Asus TUF FX705GE-EW096T i7-8750H, GeForce GTX 1050 Ti Mobile, 64 Wh | Asus TUF FX705GM i7-8750H, GeForce GTX 1060 Mobile, 64 Wh | Média da turma Gaming | |
|---|---|---|---|---|---|---|---|
| Duração da bateria | -10% | -19% | -13% | 19% | -36% | -9% | |
| Reader / Idle (h) | 12.6 | 12.2 -3% | 13.2 5% | 11.8 -6% | 6.3 -50% | 8.71 ? -31% | |
| H.264 (h) | 6.7 | 5.3 -21% | 4.3 -36% | 8.26 ? 23% | |||
| WiFi v1.3 (h) | 7.2 | 5.8 -19% | 6.7 -7% | 5.9 -18% | 8.6 19% | 4.5 -37% | 7.04 ? -2% |
| Load (h) | 2 | 2.1 5% | 0.9 -55% | 1.7 -15% | 1.6 -20% | 1.47 ? -26% |
Pro
Contra
O ASUS TUF Gaming FX705DY é um dispositivo bem equipado, considerando seu preço. Sua APU e GPU da AMD combinam bem para oferecer um desempenho decente do sistema e são poderosos o suficiente para lidar com todos os jogos modernos com taxas de quadros e configurações gráficas agradáveis.
Além disso, a máquina nem sempre é barulhento, como acontece com muitos portáteis de jogos, mas você deve primeiro ativar o modo silencioso, o que compromete o desempenho do processador. No entanto, a máquina ainda é capaz de executar tarefas de escritório e baseadas na Internet nesse modo.
O ASUS TUF Gaming FX705DY tem uma excelente relação qualidade/preço e proporciona uma experiência de jogo decente com apenas alguns pequenos compromissos.
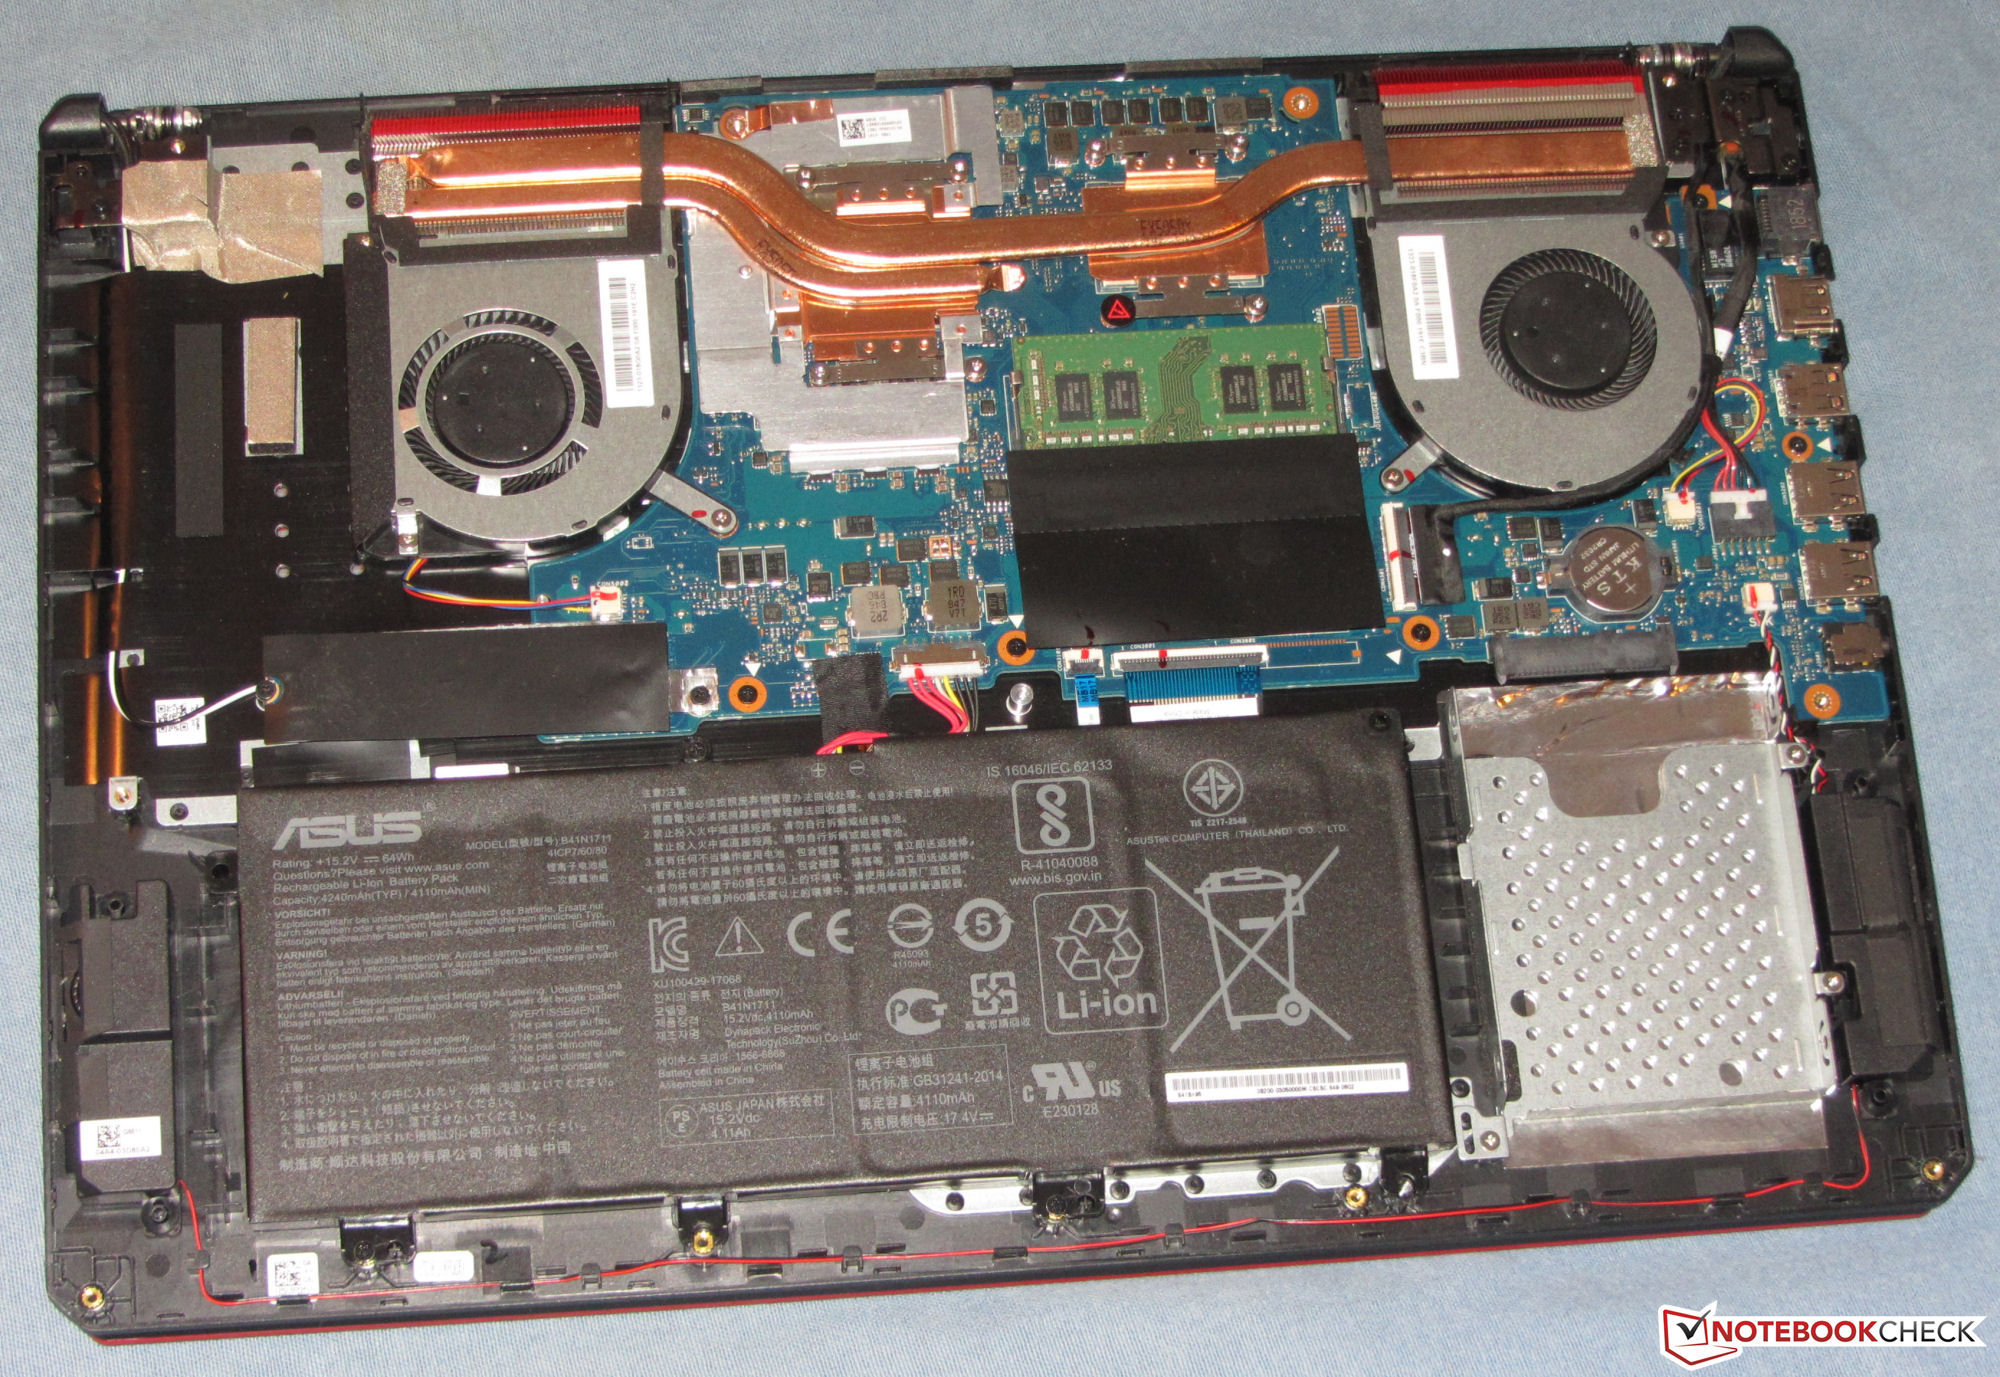
O SSD NVMe de 512 GB deve ser suficiente para a maioria das pessoas, mas você sempre pode adicionar um HD de 2,5 polegadas caso fique sem espaço. Infelizmente, você deve remover a carcaça inferior para acessar a baia da unidade, mas esse é geralmente o caso com os portáteis modernos.
Também gostamos da tela IPS mate. Ela é brilhante, tem bom contraste, tem ângulos de visão estáveis é reproduz cores com precisão. Da mesma forma, o dispositivo tem um teclado retro iluminado RGB decente, e a bateria deve durar até o final do dia, embora o FX705GE irá durar algumas horas a mais.
É uma pena que a ASUS tenha decidido não incluir uma porta USB Type-C ou um leitor de cartões de algum tipo. Além disso, a escolha de equipar o dispositivo com apenas uma saída de vídeo parece um passo em falso. Essas divergências à parte, o ASUS TUF Gaming FX705DY é uma barganha de 800 Euros (~$900) se você estiver procurando por um portátil de jogos de 17,3 polegadas. Ele deve marcar a maioria das caixas de verificação das pessoas, mesmo que fique aquém dos concorrentes em algumas áreas.
Asus TUF FX705DY-AU072
- 04/17/2019 v6 (old)
Sascha Mölck
Price comparison
