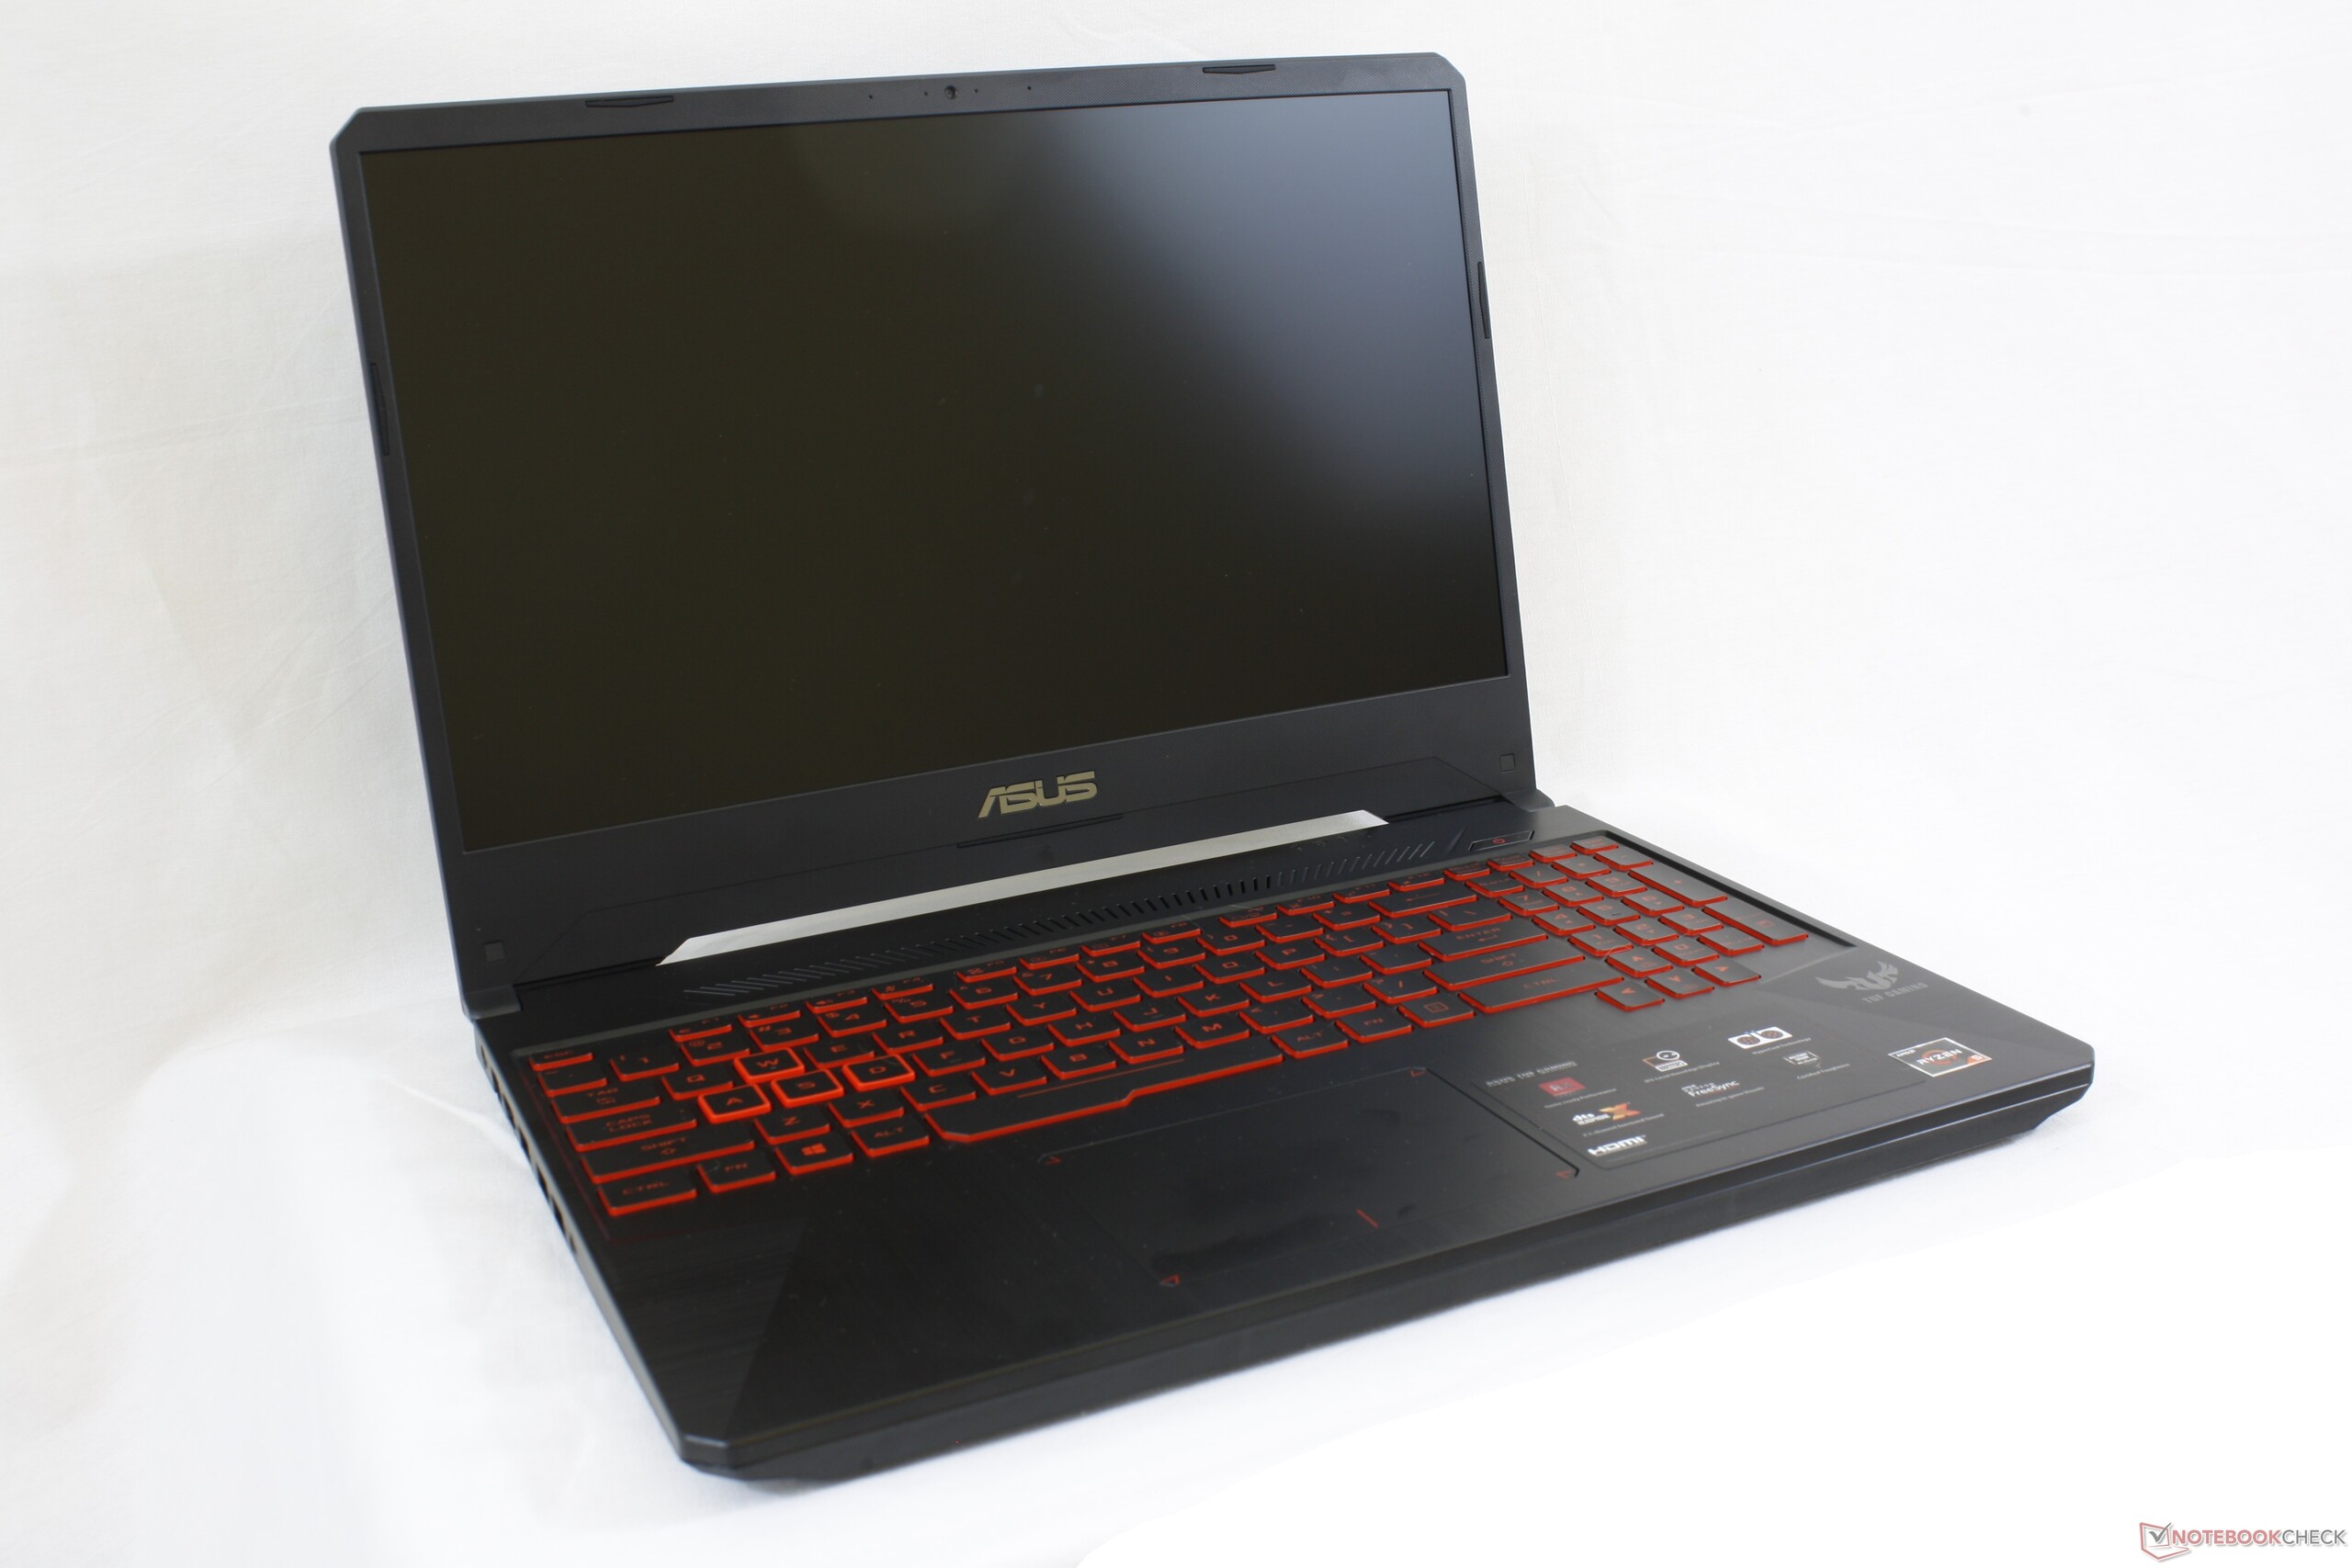
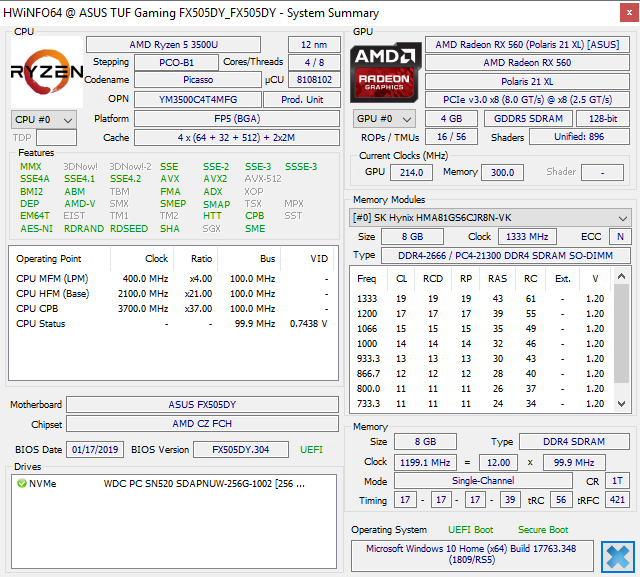
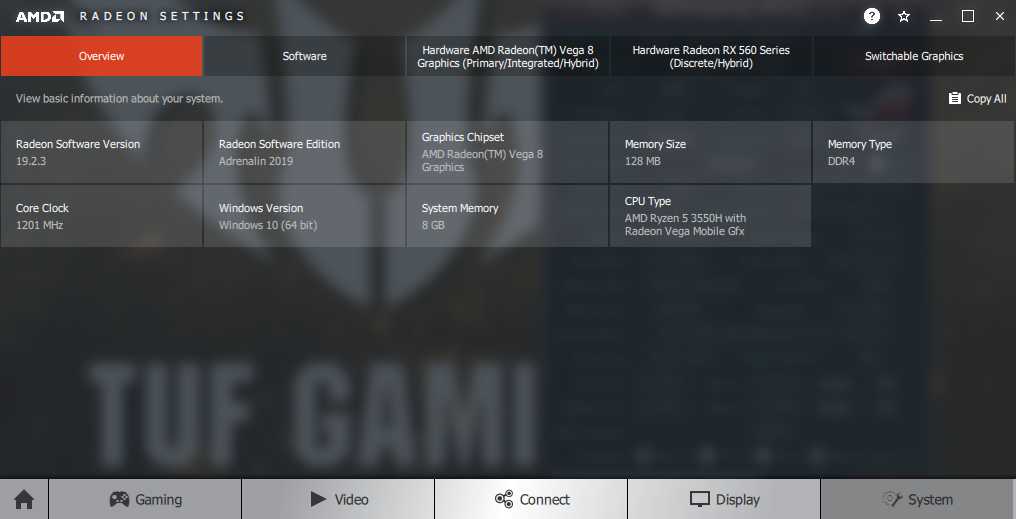
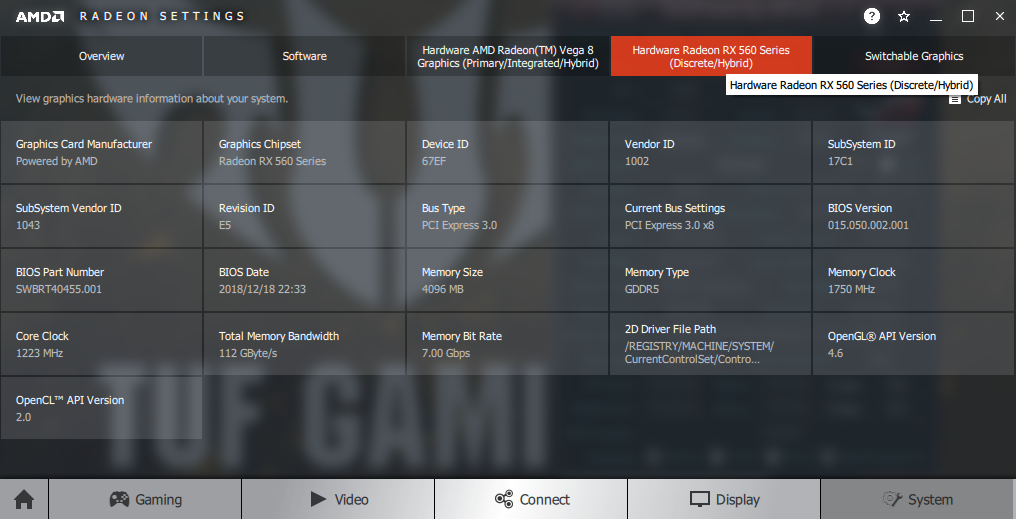
Breve Análise do Portátil Asus TUF FX505DY (Ryzen 5 3550H, Radeon RX 560X)
| Networking | |
| iperf3 transmit AX12 | |
| MSI GP63 Leopard 8RE-013US | |
| Asus FX504GD | |
| Asus TUF FX505DY | |
| Lenovo Legion Y530-15ICH | |
| iperf3 receive AX12 | |
| Asus FX504GD | |
| MSI GP63 Leopard 8RE-013US | |
| Asus TUF FX505DY | |
| Lenovo Legion Y530-15ICH | |
| |||||||||||||||||||||||||
iluminação: 82 %
iluminação com acumulador: 211.5 cd/m²
Contraste: 920:1 (Preto: 0.23 cd/m²)
ΔE ColorChecker Calman: 3.92 | ∀{0.5-29.43 Ø4.73}
calibrated: 4.16
ΔE Greyscale Calman: 3.1 | ∀{0.09-98 Ø4.97}
60% sRGB (Argyll 1.6.3 3D)
38.1% AdobeRGB 1998 (Argyll 1.6.3 3D)
41.4% AdobeRGB 1998 (Argyll 3D)
60.2% sRGB (Argyll 3D)
40.04% Display P3 (Argyll 3D)
Gamma: 2.23
CCT: 6578 K
| Asus TUF FX505DY Panda LM156LF-CL03, IPS, 15.6", 1920x1080 | MSI GP63 Leopard 8RE-013US Chi Mei CMN15F4 (N156HHE-GA1 CMN), TN LED, 120 Hz, 15.6", 1920x1080 | Asus FX504GD AU Optronics B156HTN03.8, TN LED, 15.6", 1920x1080 | Lenovo Legion Y530-15ICH LG Display LP156WFG-SPB2, IPS, 15.6", 1920x1080 | Acer Nitro 5 AN515-42-R6V0 AU Optronics B156HAN06.0 (AUO60ED), IPS, 15.6", 1920x1080 | Gigabyte Sabre 15G ID: LGD0533, Name: LG Display LP156WF6-SPK3, IPS, 15.6", 1920x1080 | |
|---|---|---|---|---|---|---|
| Display | 101% | -7% | 55% | 53% | -3% | |
| Display P3 Coverage (%) | 40.04 | 91.5 129% | 37.09 -7% | 62.5 56% | 63.4 58% | 38.97 -3% |
| sRGB Coverage (%) | 60.2 | 100 66% | 55.8 -7% | 93 54% | 87.4 45% | 58.2 -3% |
| AdobeRGB 1998 Coverage (%) | 41.4 | 85.9 107% | 38.34 -7% | 63.8 54% | 64 55% | 40.3 -3% |
| Response Times | 60% | 29% | 66% | -7% | 23% | |
| Response Time Grey 50% / Grey 80% * (ms) | 44.8 ? | 24 ? 46% | 41.6 ? 7% | 15 ? 67% | 48.4 ? -8% | 32 ? 29% |
| Response Time Black / White * (ms) | 30.8 ? | 8.4 ? 73% | 15.2 ? 51% | 11 ? 64% | 32.8 ? -6% | 25.6 ? 17% |
| PWM Frequency (Hz) | 20830 ? | 26040 ? | 20000 ? | |||
| Screen | -5% | -34% | 10% | 19% | -25% | |
| Brightness middle (cd/m²) | 211.5 | 368.5 74% | 260 23% | 305 44% | 299 41% | 248.4 17% |
| Brightness (cd/m²) | 200 | 341 71% | 241 21% | 284 42% | 284 42% | 241 21% |
| Brightness Distribution (%) | 82 | 87 6% | 85 4% | 83 1% | 88 7% | 84 2% |
| Black Level * (cd/m²) | 0.23 | 0.34 -48% | 0.55 -139% | 0.52 -126% | 0.24 -4% | 0.3 -30% |
| Contrast (:1) | 920 | 1084 18% | 473 -49% | 587 -36% | 1246 35% | 828 -10% |
| Colorchecker dE 2000 * | 3.92 | 8.91 -127% | 7 -79% | 3.63 7% | 4.98 -27% | 7.5 -91% |
| Colorchecker dE 2000 max. * | 17.63 | 14.39 18% | 22.52 -28% | 8.18 54% | 7.67 56% | 25.2 -43% |
| Colorchecker dE 2000 calibrated * | 4.16 | 2.87 31% | 5.27 -27% | 1.31 69% | 3.7 11% | |
| Greyscale dE 2000 * | 3.1 | 12 -287% | 6.1 -97% | 4.77 -54% | 4.58 -48% | 6.5 -110% |
| Gamma | 2.23 99% | 1.825 121% | 1.97 112% | 2.54 87% | 2.55 86% | 2.19 100% |
| CCT | 6578 99% | 11519 56% | 7894 82% | 7500 87% | 6397 102% | 7852 83% |
| Color Space (Percent of AdobeRGB 1998) (%) | 38.1 | 85.94 126% | 35.5 -7% | 59 55% | 57 50% | 37 -3% |
| Color Space (Percent of sRGB) (%) | 60 | 99.98 67% | 61 2% | 93 55% | 87 45% | 57.9 -3% |
| Média Total (Programa/Configurações) | 52% /
23% | -4% /
-21% | 44% /
25% | 22% /
22% | -2% /
-14% |
* ... menor é melhor
Exibir tempos de resposta
| ↔ Tempo de resposta preto para branco | ||
|---|---|---|
| 30.8 ms ... ascensão ↗ e queda ↘ combinadas | ↗ 17.6 ms ascensão | 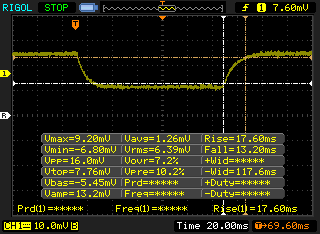 |
| ↘ 13.2 ms queda | ||
| A tela mostra taxas de resposta lentas em nossos testes e será insatisfatória para os jogadores. Em comparação, todos os dispositivos testados variam de 0.1 (mínimo) a 240 (máximo) ms. » 83 % de todos os dispositivos são melhores. Isso significa que o tempo de resposta medido é pior que a média de todos os dispositivos testados (19.9 ms). | ||
| ↔ Tempo de resposta 50% cinza a 80% cinza | ||
| 44.8 ms ... ascensão ↗ e queda ↘ combinadas | ↗ 18.8 ms ascensão | 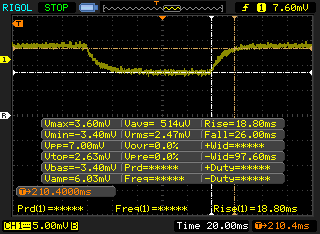 |
| ↘ 26 ms queda | ||
| A tela mostra taxas de resposta lentas em nossos testes e será insatisfatória para os jogadores. Em comparação, todos os dispositivos testados variam de 0.165 (mínimo) a 636 (máximo) ms. » 76 % de todos os dispositivos são melhores. Isso significa que o tempo de resposta medido é pior que a média de todos os dispositivos testados (31.1 ms). | ||
Cintilação da tela / PWM (modulação por largura de pulso)
| Tela tremeluzindo/PWM detectado | 20830 Hz | ≤ 30 % configuração de brilho | 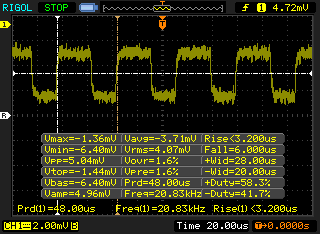 |
A luz de fundo da tela pisca em 20830 Hz (pior caso, por exemplo, utilizando PWM) Cintilação detectada em uma configuração de brilho de 30 % e abaixo. Não deve haver cintilação ou PWM acima desta configuração de brilho. A frequência de 20830 Hz é bastante alta, então a maioria dos usuários sensíveis ao PWM não deve notar nenhuma oscilação. [pwm_comparison] Em comparação: 52 % de todos os dispositivos testados não usam PWM para escurecer a tela. Se PWM foi detectado, uma média de 7794 (mínimo: 5 - máximo: 343500) Hz foi medida. | |||
| Cinebench R15 | |
| CPU Single 64Bit | |
| Asus ZenBook 15 UX533FD | |
| Dell Precision 7530 | |
| Asus FX504GD | |
| MSI GP63 Leopard 8RE-013US | |
| Gigabyte Sabre 15G | |
| Acer Nitro 5 AN515-42-R6V0 | |
| Lenovo Legion Y520-15IKBA-80WY001VGE | |
| Asus TUF FX505DY | |
| Asus GL702ZC-GC104T | |
| Honor Magicbook | |
| CPU Multi 64Bit | |
| Asus GL702ZC-GC104T | |
| Dell Precision 7530 | |
| MSI GP63 Leopard 8RE-013US | |
| Asus ZenBook 15 UX533FD | |
| Asus TUF FX505DY | |
| Gigabyte Sabre 15G | |
| Acer Nitro 5 AN515-42-R6V0 | |
| Asus FX504GD | |
| Honor Magicbook | |
| Lenovo Legion Y520-15IKBA-80WY001VGE | |
| PCMark 8 Home Score Accelerated v2 | 4560 pontos | |
| PCMark 8 Work Score Accelerated v2 | 5223 pontos | |
| PCMark 10 Score | 4405 pontos | |
Ajuda | ||
| Asus TUF FX505DY WDC PC SN520 SDAPNUW-256G | MSI GP63 Leopard 8RE-013US Samsung PM871b MZNLN128HAHQ | Lenovo Legion Y530-15ICH Samsung SSD PM981 MZVLB256HAHQ | Acer Nitro 5 AN515-42-R6V0 SK Hynix HFS128G39TND | Gigabyte Sabre 15G Liteonit CV3-8D128 | |
|---|---|---|---|---|---|
| AS SSD | -60% | -1% | -119% | -60% | |
| Seq Read (MB/s) | 1059 | 504 -52% | 1808 71% | 470.8 -56% | 516 -51% |
| Seq Write (MB/s) | 1180 | 462.9 -61% | 1429 21% | 126.8 -89% | 479.8 -59% |
| 4K Read (MB/s) | 37.55 | 21.88 -42% | 46.1 23% | 23.64 -37% | 28.3 -25% |
| 4K Write (MB/s) | 110.6 | 60.8 -45% | 97 -12% | 54.5 -51% | 53.8 -51% |
| 4K-64 Read (MB/s) | 619 | 253 -59% | 536 -13% | 203.1 -67% | 257 -58% |
| 4K-64 Write (MB/s) | 502 | 137.8 -73% | 273.6 -45% | 127.1 -75% | 132.2 -74% |
| Access Time Read * (ms) | 0.087 | 0.155 -78% | 0.085 2% | 0.121 -39% | 0.141 -62% |
| Access Time Write * (ms) | 0.034 | 0.072 -112% | 0.038 -12% | 0.269 -691% | 0.073 -115% |
| Score Read (Points) | 762 | 325 -57% | 763 0% | 274 -64% | 337 -56% |
| Score Write (Points) | 730 | 245 -66% | 514 -30% | 194 -73% | 234 -68% |
| Score Total (Points) | 1899 | 742 -61% | 1663 -12% | 600 -68% | 752 -60% |
| Copy ISO MB/s (MB/s) | 1166 | 690 -41% | 446.8 -62% | ||
| Copy Program MB/s (MB/s) | 507 | 328.1 -35% | 195.3 -61% | ||
| Copy Game MB/s (MB/s) | 480.3 | 220.7 -54% | 323.5 -33% |
* ... menor é melhor

| 3DMark | |
| 1920x1080 Fire Strike Graphics | |
| Asus Zephyrus S GX531GM | |
| Asus GL702ZC-GC104T | |
| Intel Hades Canyon NUC8i7HVK | |
| Lenovo Legion Y730-15ICH i5-8300H | |
| Schenker XMG P506 | |
| Dell XPS 15 9575 i5-8305G | |
| Asus FX504GD | |
| Asus TUF FX505DY | |
| Acer Nitro 5 AN515-42-R6V0 | |
| Lenovo Legion Y520-15IKBA-80WY001VGE | |
| Asus ZenBook 15 UX533FD | |
| Asus GL552VW-DK725T | |
| Honor Magicbook | |
| 2560x1440 Time Spy Graphics | |
| Asus Zephyrus S GX531GM | |
| Asus GL702ZC-GC104T | |
| Intel Hades Canyon NUC8i7HVK | |
| Asus TUF FX505DY | |
| Asus FX504GD | |
| 3DMark 11 | |
| 1280x720 Performance GPU | |
| Asus GL702ZC-GC104T | |
| Intel Hades Canyon NUC8i7HVK | |
| Asus Zephyrus S GX531GM | |
| Schenker XMG P506 | |
| Dell XPS 15 9575 i5-8305G | |
| Lenovo Legion Y730-15ICH i5-8300H | |
| Acer Nitro 5 AN515-42-R6V0 | |
| Lenovo Legion Y520-15IKBA-80WY001VGE | |
| Asus TUF FX505DY | |
| Asus FX504GD | |
| Asus ZenBook 15 UX533FD | |
| Asus GL552VW-DK725T | |
| Honor Magicbook | |
| 1280x720 Performance Combined | |
| Intel Hades Canyon NUC8i7HVK | |
| Asus GL702ZC-GC104T | |
| Schenker XMG P506 | |
| Lenovo Legion Y730-15ICH i5-8300H | |
| Dell XPS 15 9575 i5-8305G | |
| Asus FX504GD | |
| Asus Zephyrus S GX531GM | |
| Asus ZenBook 15 UX533FD | |
| Asus TUF FX505DY | |
| Lenovo Legion Y520-15IKBA-80WY001VGE | |
| Acer Nitro 5 AN515-42-R6V0 | |
| Asus GL552VW-DK725T | |
| Honor Magicbook | |
| 3DMark 06 Standard Score | 25730 pontos | |
| 3DMark 11 Performance | 7714 pontos | |
| 3DMark Ice Storm Standard Score | 57356 pontos | |
| 3DMark Cloud Gate Standard Score | 18476 pontos | |
| 3DMark Fire Strike Score | 5515 pontos | |
| 3DMark Time Spy Score | 1925 pontos | |
Ajuda | ||
| The Witcher 3 - 1920x1080 Ultra Graphics & Postprocessing (HBAO+) | |
| MSI GP63 Leopard 8RE-013US | |
| Asus GL702ZC-GC104T | |
| Intel Hades Canyon NUC8i7HVK | |
| Asus ZenBook 15 UX533FD | |
| Lenovo Legion Y730-15ICH i5-8300H | |
| Schenker XMG P506 | |
| Dell XPS 15 9575 i5-8305G | |
| Asus TUF FX505DY | |
| Asus FX504GD | |
| Lenovo Legion Y520-15IKBA-80WY001VGE | |
| Acer Nitro 5 AN515-42-R6V0 | |
| Asus GL552VW-DK725T | |
| baixo | média | alto | ultra | |
|---|---|---|---|---|
| BioShock Infinite (2013) | 134.3 | 118 | 114 | 53.1 |
| The Witcher 3 (2015) | 108.8 | 70.3 | 38.5 | 22.7 |
| Rise of the Tomb Raider (2016) | 108.6 | 65.7 | 35.3 | 26.6 |
| Asus TUF FX505DY Radeon RX 560X (Laptop), R5 3550H, WDC PC SN520 SDAPNUW-256G | MSI GP63 Leopard 8RE-013US GeForce GTX 1060 Mobile, i7-8750H, Samsung PM871b MZNLN128HAHQ | Asus FX504GD GeForce GTX 1050 Mobile, i5-8300H, Seagate Mobile HDD 1TB ST1000LX015-1U7172 | Lenovo Legion Y530-15ICH GeForce GTX 1060 Mobile, i7-8750H, Samsung SSD PM981 MZVLB256HAHQ | Acer Nitro 5 AN515-42-R6V0 Radeon RX 560X (Laptop), R7 2700U, SK Hynix HFS128G39TND | Gigabyte Sabre 15G GeForce GTX 1050 Mobile, i7-7700HQ, Liteonit CV3-8D128 | |
|---|---|---|---|---|---|---|
| Noise | -6% | 1% | -2% | 1% | -9% | |
| desligado / ambiente * (dB) | 28.2 | 28.4 -1% | 28.1 -0% | 30.2 -7% | 29 -3% | 28.2 -0% |
| Idle Minimum * (dB) | 28.2 | 32.8 -16% | 29 -3% | 30.9 -10% | 29 -3% | 33 -17% |
| Idle Average * (dB) | 28.2 | 32.8 -16% | 29.2 -4% | 30.9 -10% | 31 -10% | 33.3 -18% |
| Idle Maximum * (dB) | 28.2 | 33 -17% | 29.7 -5% | 31.6 -12% | 32 -13% | 34.7 -23% |
| Load Average * (dB) | 43.9 | 35.8 18% | 44.3 -1% | 42.3 4% | 36 18% | 44.5 -1% |
| Witcher 3 ultra * (dB) | 49 | 51 -4% | 40.7 17% | 44 10% | 49.2 -0% | |
| Load Maximum * (dB) | 50.6 | 52.3 -3% | 47.7 6% | 40 21% | 46 9% | 52.8 -4% |
* ... menor é melhor
Barulho
| Ocioso |
| 28.2 / 28.2 / 28.2 dB |
| Carga |
| 43.9 / 50.6 dB |
 | ||
30 dB silencioso 40 dB(A) audível 50 dB(A) ruidosamente alto |
||
min: | ||
(±) A temperatura máxima no lado superior é 44.2 °C / 112 F, em comparação com a média de 40.4 °C / 105 F , variando de 21.2 a 68.8 °C para a classe Gaming.
(-) A parte inferior aquece até um máximo de 49.4 °C / 121 F, em comparação com a média de 43.2 °C / 110 F
(+) Em uso inativo, a temperatura média para o lado superior é 24.2 °C / 76 F, em comparação com a média do dispositivo de 33.9 °C / ### class_avg_f### F.
(+) Jogando The Witcher 3, a temperatura média para o lado superior é 28.4 °C / 83 F, em comparação com a média do dispositivo de 33.9 °C / ## #class_avg_f### F.
(+) Os apoios para as mãos e o touchpad são mais frios que a temperatura da pele, com um máximo de 27.4 °C / 81.3 F e, portanto, são frios ao toque.
(±) A temperatura média da área do apoio para as mãos de dispositivos semelhantes foi 28.8 °C / 83.8 F (+1.4 °C / 2.5 F).
Asus TUF FX505DY análise de áudio
(±) | o volume do alto-falante é médio, mas bom (###valor### dB)
Graves 100 - 315Hz
(-) | quase nenhum baixo - em média 19.4% menor que a mediana
(±) | a linearidade dos graves é média (9.9% delta para a frequência anterior)
Médios 400 - 2.000 Hz
(±) | médios mais altos - em média 7% maior que a mediana
(±) | a linearidade dos médios é média (8.3% delta para frequência anterior)
Altos 2 - 16 kHz
(±) | máximos mais altos - em média 6.3% maior que a mediana
(±) | a linearidade dos máximos é média (7.6% delta para frequência anterior)
Geral 100 - 16.000 Hz
(-) | o som geral não é linear (31.6% diferença em relação à mediana)
Comparado com a mesma classe
» 97% de todos os dispositivos testados nesta classe foram melhores, 1% semelhantes, 2% piores
» O melhor teve um delta de 6%, a média foi 18%, o pior foi 132%
Comparado com todos os dispositivos testados
» 90% de todos os dispositivos testados foram melhores, 2% semelhantes, 8% piores
» O melhor teve um delta de 4%, a média foi 24%, o pior foi 134%
Apple MacBook 12 (Early 2016) 1.1 GHz análise de áudio
(+) | os alto-falantes podem tocar relativamente alto (###valor### dB)
Graves 100 - 315Hz
(±) | graves reduzidos - em média 11.3% menor que a mediana
(±) | a linearidade dos graves é média (14.2% delta para a frequência anterior)
Médios 400 - 2.000 Hz
(+) | médios equilibrados - apenas 2.4% longe da mediana
(+) | médios são lineares (5.5% delta para frequência anterior)
Altos 2 - 16 kHz
(+) | agudos equilibrados - apenas 2% longe da mediana
(+) | os máximos são lineares (4.5% delta da frequência anterior)
Geral 100 - 16.000 Hz
(+) | o som geral é linear (10.2% diferença em relação à mediana)
Comparado com a mesma classe
» 7% de todos os dispositivos testados nesta classe foram melhores, 2% semelhantes, 91% piores
» O melhor teve um delta de 5%, a média foi 18%, o pior foi 53%
Comparado com todos os dispositivos testados
» 5% de todos os dispositivos testados foram melhores, 1% semelhantes, 94% piores
» O melhor teve um delta de 4%, a média foi 24%, o pior foi 134%
| desligado | |
| Ocioso | |
| Carga |
|
Key:
min: | |
| Asus TUF FX505DY R5 3550H, Radeon RX 560X (Laptop), WDC PC SN520 SDAPNUW-256G, IPS, 1920x1080, 15.6" | MSI GP63 Leopard 8RE-013US i7-8750H, GeForce GTX 1060 Mobile, Samsung PM871b MZNLN128HAHQ, TN LED, 120 Hz, 1920x1080, 15.6" | Asus FX504GD i5-8300H, GeForce GTX 1050 Mobile, Seagate Mobile HDD 1TB ST1000LX015-1U7172, TN LED, 1920x1080, 15.6" | Lenovo Legion Y530-15ICH i7-8750H, GeForce GTX 1060 Mobile, Samsung SSD PM981 MZVLB256HAHQ, IPS, 1920x1080, 15.6" | Acer Nitro 5 AN515-42-R6V0 R7 2700U, Radeon RX 560X (Laptop), SK Hynix HFS128G39TND, IPS, 1920x1080, 15.6" | Gigabyte Sabre 15G i7-7700HQ, GeForce GTX 1050 Mobile, Liteonit CV3-8D128, IPS, 1920x1080, 15.6" | |
|---|---|---|---|---|---|---|
| Power Consumption | -52% | -18% | -42% | -30% | -19% | |
| Idle Minimum * (Watt) | 5.2 | 7.99 -54% | 7.2 -38% | 7.3 -40% | 7 -35% | 8 -54% |
| Idle Average * (Watt) | 7.5 | 12.15 -62% | 10.2 -36% | 11.1 -48% | 10 -33% | 10.9 -45% |
| Idle Maximum * (Watt) | 9.4 | 13.4 -43% | 10.9 -16% | 12.6 -34% | 18 -91% | 11 -17% |
| Load Average * (Watt) | 73 | 103.62 -42% | 93.3 -28% | 109 -49% | 79 -8% | 76.7 -5% |
| Witcher 3 ultra * (Watt) | 90 | 156.1 -73% | 95.8 -6% | 98 -9% | 94.9 -5% | |
| Load Maximum * (Watt) | 120.7 | 164.29 -36% | 102.5 15% | 168 -39% | 128 -6% | 106.4 12% |
* ... menor é melhor
| Asus TUF FX505DY R5 3550H, Radeon RX 560X (Laptop), 48 Wh | MSI GP63 Leopard 8RE-013US i7-8750H, GeForce GTX 1060 Mobile, 51 Wh | Asus FX504GD i5-8300H, GeForce GTX 1050 Mobile, 48 Wh | Lenovo Legion Y530-15ICH i7-8750H, GeForce GTX 1060 Mobile, 52 Wh | Acer Nitro 5 AN515-42-R6V0 R7 2700U, Radeon RX 560X (Laptop), 48 Wh | Gigabyte Sabre 15G i7-7700HQ, GeForce GTX 1050 Mobile, 47 Wh | |
|---|---|---|---|---|---|---|
| Duração da bateria | -24% | -30% | -37% | 4% | -15% | |
| Reader / Idle (h) | 8.7 | 7.5 -14% | 7.5 -14% | 8.3 -5% | 8.2 -6% | |
| WiFi v1.3 (h) | 5.5 | 4.8 -13% | 3.7 -33% | 3.8 -31% | 5.7 4% | 4.4 -20% |
| Load (h) | 1.6 | 0.9 -44% | 0.9 -44% | 0.4 -75% | 1.3 -19% |
Pro
Contra
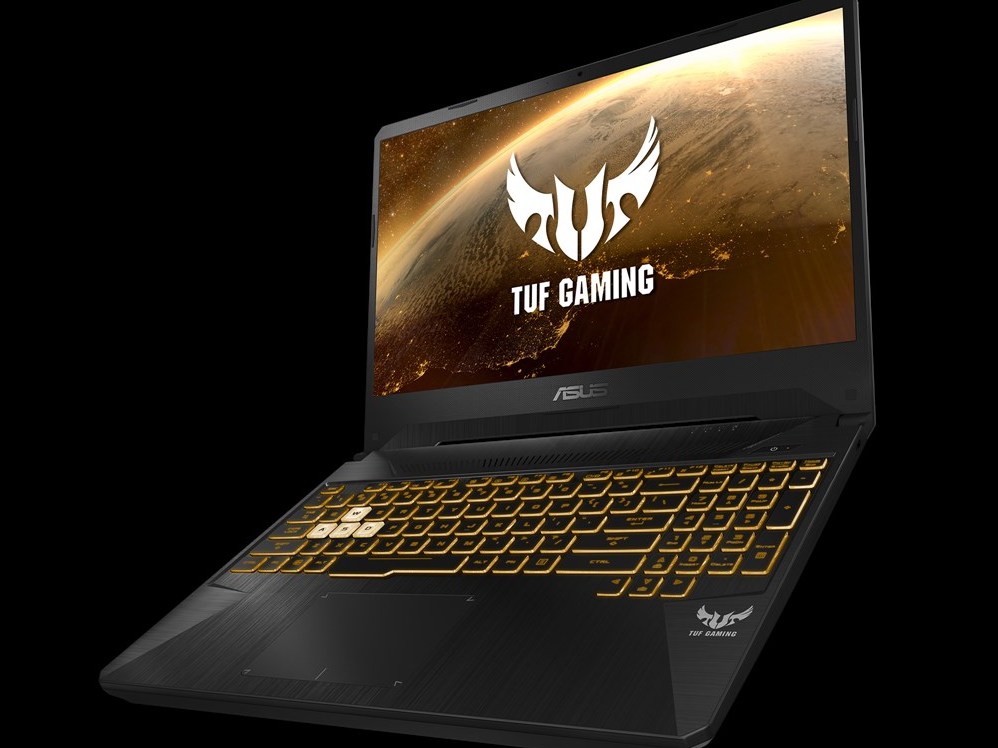
O TUF FX505DY é o portátil de jogos AMD mais balanceado que já testamos. Considerando a incompatibilidade do Strix GL702ZC junto com uma CPU de gama alta com uma GPU de gama média e o FX550IU junto com uma CPU de gama baixa com uma GPU de gama média, o FX505DY combina com sucesso um Ryzen 5 3550H de gama média com a Radeon RX 560X de gama média, para jogar em 1080p com um preço econômico. O desempenho geral é muitas vezes a par com o laptop de jogos orçamento comum alimentado por um Intel Core i5-8300H e GeForce GTX 1050 enquanto se vende a um preço recomendado pelo fabricante, mais baixo, o que é exatamente o que a AMD e a Asus tem como alvo para este novo sistema TUF.
O principal problema aqui é o tempo. Portáteis com uma GTX 1050 e inclusive GPUs 1050 Ti foram baixando em preço para dar espaço para os portáteis RTX. Não é difícil encontrar esses sistemas à venda hoje por $700 para anular a vantagem de desempenho por dólar que os sistemas da AMD normalmente têm. Se o FX505DY tivesse sido lançado um ano antes, quando a GTX 1050 era mais nova e mais cara, ele teria contribuído para uma alternativa mais atraente.
Devido ao mencionado anteriormente, o FX505DY não tem nenhuma grande vantagem sobre a concorrência, mas também não é uma escolha inferior. Ela está cara-a-cara com ofertas de orçamento da Intel-Nvidia, o que é dizer muito para um portátil todo AMD. Como o primeiro portátil para jogos Zen+ no mercado, ele se mostra muito promissor sobre o que os futuros portáteis para jogos Ryzen podem trazer para a mesa. Ainda estamos cruzando os dedos para os portáteis Ryzen-Nvidia realmente consigam afetar o domínio da Intel.
Estreia potente do Ryzen Zen+, mas um pouco atrasado para a festa. O Asus TUF FX505DY é uma boa alternativa à habitual alternativa Intel Core i5-8300H e GTX 1050. Espera-se que o sistema pavimente o caminho para os portáteis de jogos Ryzen-Turing em um futuro próximo, o que quase certamente enfraquecerá a Intel-Turing em termos de preço de varejo.
Asus TUF FX505DY
- 03/08/2019 v6 (old)
Allen Ngo
Price comparison
