Breve Análise do Portátil Lenovo Legion Y730-17ICH (i7-8750H, GTX 1050 Ti)
| |||||||||||||||||||||||||
iluminação: 91 %
iluminação com acumulador: 328.7 cd/m²
Contraste: 645:1 (Preto: 0.51 cd/m²)
ΔE ColorChecker Calman: 4.91 | ∀{0.5-29.43 Ø4.71}
calibrated: 4.27
ΔE Greyscale Calman: 3.9 | ∀{0.09-98 Ø4.96}
84.7% sRGB (Argyll 1.6.3 3D)
55.6% AdobeRGB 1998 (Argyll 1.6.3 3D)
62.1% AdobeRGB 1998 (Argyll 3D)
84.9% sRGB (Argyll 3D)
66.4% Display P3 (Argyll 3D)
Gamma: 2.13
CCT: 6911 K
| Lenovo Legion Y730-17ICH, i7-8750H LP173WF4-SPF6, IPS, 17.3", 1920x1080 | Alienware 17 R5 JYWWF_B173QTN (AUO1496), TN, 17.3", 2560x1440 | HP Omen 17t-3AW55AV_1 AU Optronics AUO309D, IPS, 17.3", 1920x1080 | Dell G3 17 3779 AUO, B173HAN01.3, IPS, 17.3", 1920x1080 | Asus Strix GL703GM-DS74 Chi Mei CMN1747 M173JJE-G32, TN LED, 17.3", 1920x1080 | MSI GE73 8RF-008 Raider RGB Chi Mei N173HHE-G32 (CMN1747), TN WLED, 17.3", 1920x1080 | |
|---|---|---|---|---|---|---|
| Display | -1% | 3% | 2% | 30% | 31% | |
| Display P3 Coverage (%) | 66.4 | 63.4 -5% | 65.4 -2% | 63.9 -4% | 90 36% | 90.8 37% |
| sRGB Coverage (%) | 84.9 | 86.1 1% | 90 6% | 89.8 6% | 100 18% | 99.9 18% |
| AdobeRGB 1998 Coverage (%) | 62.1 | 62.9 1% | 65.8 6% | 64.9 5% | 84.8 37% | 85.8 38% |
| Response Times | 59% | 55% | -6% | 73% | 34% | |
| Response Time Grey 50% / Grey 80% * (ms) | 36.8 ? | 20.8 ? 43% | 17.6 ? 52% | 38 ? -3% | 8.8 ? 76% | 28 ? 24% |
| Response Time Black / White * (ms) | 24 ? | 6 ? 75% | 10 ? 58% | 26 ? -8% | 7.4 ? 69% | 13.6 ? 43% |
| PWM Frequency (Hz) | 25510 ? | 25000 ? | ||||
| Screen | 4% | 18% | 8% | 16% | 25% | |
| Brightness middle (cd/m²) | 328.7 | 398 21% | 343.6 5% | 323 -2% | 297.8 -9% | 273 -17% |
| Brightness (cd/m²) | 318 | 367 15% | 320 1% | 306 -4% | 285 -10% | 273 -14% |
| Brightness Distribution (%) | 91 | 86 -5% | 87 -4% | 89 -2% | 84 -8% | 90 -1% |
| Black Level * (cd/m²) | 0.51 | 0.51 -0% | 0.34 33% | 0.31 39% | 0.33 35% | 0.26 49% |
| Contrast (:1) | 645 | 780 21% | 1011 57% | 1042 62% | 902 40% | 1050 63% |
| Colorchecker dE 2000 * | 4.91 | 5.45 -11% | 3.74 24% | 4.96 -1% | 3.68 25% | 3.52 28% |
| Colorchecker dE 2000 max. * | 10.15 | 10.36 -2% | 5.33 47% | 8.25 19% | 7.71 24% | 6.34 38% |
| Colorchecker dE 2000 calibrated * | 4.27 | 2.56 40% | 3.49 18% | 2.71 37% | 2.09 51% | |
| Greyscale dE 2000 * | 3.9 | 5.4 -38% | 3.7 5% | 5.65 -45% | 5 -28% | 3.11 20% |
| Gamma | 2.13 103% | 2.4 92% | 2.36 93% | 2.24 98% | 2.06 107% | 2.43 91% |
| CCT | 6911 94% | 7453 87% | 6388 102% | 7441 87% | 6728 97% | 6999 93% |
| Color Space (Percent of AdobeRGB 1998) (%) | 55.6 | 56 1% | 58 4% | 58 4% | 84.77 52% | 76 37% |
| Color Space (Percent of sRGB) (%) | 84.7 | 86 2% | 90 6% | 90 6% | 99.97 18% | 100 18% |
| Média Total (Programa/Configurações) | 21% /
10% | 25% /
20% | 1% /
5% | 40% /
26% | 30% /
27% |
* ... menor é melhor
Exibir tempos de resposta
| ↔ Tempo de resposta preto para branco | ||
|---|---|---|
| 24 ms ... ascensão ↗ e queda ↘ combinadas | ↗ 14 ms ascensão | 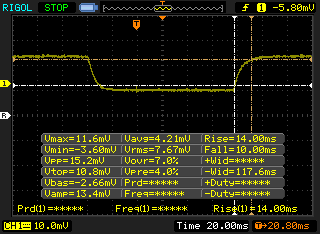 |
| ↘ 10 ms queda | ||
| A tela mostra boas taxas de resposta em nossos testes, mas pode ser muito lenta para jogadores competitivos. Em comparação, todos os dispositivos testados variam de 0.1 (mínimo) a 240 (máximo) ms. » 54 % de todos os dispositivos são melhores. Isso significa que o tempo de resposta medido é pior que a média de todos os dispositivos testados (19.8 ms). | ||
| ↔ Tempo de resposta 50% cinza a 80% cinza | ||
| 36.8 ms ... ascensão ↗ e queda ↘ combinadas | ↗ 18.8 ms ascensão | 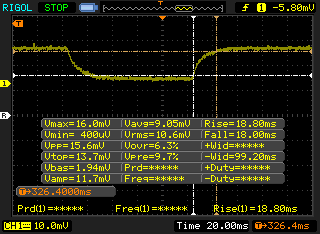 |
| ↘ 18 ms queda | ||
| A tela mostra taxas de resposta lentas em nossos testes e será insatisfatória para os jogadores. Em comparação, todos os dispositivos testados variam de 0.165 (mínimo) a 636 (máximo) ms. » 53 % de todos os dispositivos são melhores. Isso significa que o tempo de resposta medido é pior que a média de todos os dispositivos testados (30.9 ms). | ||
Cintilação da tela / PWM (modulação por largura de pulso)
| Tela tremeluzindo / PWM não detectado | 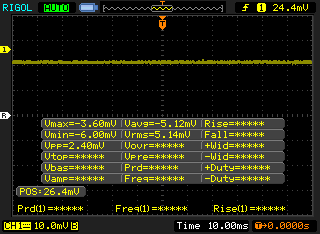 | ||
[pwm_comparison] Em comparação: 52 % de todos os dispositivos testados não usam PWM para escurecer a tela. Se PWM foi detectado, uma média de 7744 (mínimo: 5 - máximo: 343500) Hz foi medida. | |||
| PCMark 8 Home Score Accelerated v2 | 4148 pontos | |
| PCMark 8 Work Score Accelerated v2 | 5340 pontos | |
| PCMark 10 Score | 4982 pontos | |
Ajuda | ||
| Lenovo Legion Y730-17ICH, i7-8750H Toshiba KBG30ZMT128G | Alienware 17 R5 SK hynix PC401 HFS256GD9TNG | HP Omen 17t-3AW55AV_1 Samsung SSD PM981 MZVLB512HAJQ | Dell G3 17 3779 SK hynix SC311 SATA | Asus Strix GL703GM-DS74 Samsung PM961 MZVLW256HEHP | Média Toshiba KBG30ZMT128G | |
|---|---|---|---|---|---|---|
| AS SSD | 233% | 915% | 41% | 463% | 28% | |
| Copy Game MB/s (MB/s) | 134.6 | 875 550% | 124.2 -8% | 481 257% | 122.3 ? -9% | |
| Copy Program MB/s (MB/s) | 182.9 | 481.1 163% | 99.8 -45% | 780 326% | 122.6 ? -33% | |
| Copy ISO MB/s (MB/s) | 272.7 | 1080 296% | 154.9 -43% | 1043 282% | 174.8 ? -36% | |
| Score Total (Points) | 479 | 1424 197% | 4142 765% | 552 15% | 3075 542% | 656 ? 37% |
| Score Write (Points) | 86 | 428 398% | 2147 2397% | 199 131% | 825 859% | 149 ? 73% |
| Score Read (Points) | 286 | 706 147% | 1304 356% | 236 -17% | 1520 431% | 360 ? 26% |
| Access Time Write * (ms) | 0.324 | 0.065 80% | 0.047 85% | 0.069 79% | 0.042 87% | 0.27 ? 17% |
| Access Time Read * (ms) | 0.519 | 0.091 82% | 0.071 86% | 0.136 74% | 0.066 87% | 0.3803 ? 27% |
| 4K-64 Write (MB/s) | 31.38 | 279.1 789% | 1866 5846% | 114.8 266% | 633 1917% | 75.1 ? 139% |
| 4K-64 Read (MB/s) | 168.6 | 447.2 165% | 1125 567% | 160.7 -5% | 1285 662% | 222 ? 32% |
| 4K Write (MB/s) | 38.73 | 92.7 139% | 84.4 118% | 58.5 51% | 88.4 128% | 60.8 ? 57% |
| 4K Read (MB/s) | 19.73 | 38.74 96% | 31.66 60% | 24.22 23% | 35.76 81% | 30.3 ? 54% |
| Seq Write (MB/s) | 125.4 | 559 346% | 1962 1465% | 254.4 103% | 1031 722% | 122.4 ? -2% |
| Seq Read (MB/s) | 979 | 2203 125% | 1473 50% | 511 -48% | 1993 104% | 1074 ? 10% |
* ... menor é melhor

| 3DMark Cloud Gate Standard Score | 27317 pontos | |
| 3DMark Fire Strike Score | 7049 pontos | |
Ajuda | ||
| baixo | média | alto | ultra | |
|---|---|---|---|---|
| BioShock Infinite (2013) | 255.3 | 203.4 | 185.5 | 74.5 |
| The Witcher 3 (2015) | 144.5 | 87.3 | 51 | 26 |
| Rise of the Tomb Raider (2016) | 134.9 | 92.4 | 47.6 | 40.1 |
Barulho
| Ocioso |
| 28 / 28 / 31.3 dB |
| HDD |
| 31.2 dB |
| Carga |
| 33.4 / 46.2 dB |
 | ||
30 dB silencioso 40 dB(A) audível 50 dB(A) ruidosamente alto |
||
min: | ||
| Lenovo Legion Y730-17ICH, i7-8750H GeForce GTX 1050 Ti Mobile, i7-8750H, Toshiba KBG30ZMT128G | Dell G3 17 3779 GeForce GTX 1050 Mobile, i5-8300H, SK hynix SC311 SATA | Asus Strix GL703GM-DS74 GeForce GTX 1060 Mobile, i7-8750H, Samsung PM961 MZVLW256HEHP | HP Omen 17t-3AW55AV_1 GeForce GTX 1070 Mobile, i7-8750H, Samsung SSD PM981 MZVLB512HAJQ | Dell XPS 15 9575 i7-8705G Vega M GL / 870, i7-8705G, SK hynix PC401 NVMe 500 GB | |
|---|---|---|---|---|---|
| Noise | -8% | -8% | -9% | 2% | |
| desligado / ambiente * (dB) | 28 | 30.5 -9% | 28.6 -2% | 27.8 1% | 28.2 -1% |
| Idle Minimum * (dB) | 28 | 30.5 -9% | 29.4 -5% | 31.1 -11% | 28.2 -1% |
| Idle Average * (dB) | 28 | 31.1 -11% | 29.4 -5% | 31.1 -11% | 28.2 -1% |
| Idle Maximum * (dB) | 31.3 | 32.1 -3% | 33.7 -8% | 35 -12% | 28.2 10% |
| Load Average * (dB) | 33.4 | 43.4 -30% | 41.2 -23% | 42 -26% | 29 13% |
| Witcher 3 ultra * (dB) | 42.8 | 47.3 -11% | 44.5 -4% | 44.7 -4% | |
| Load Maximum * (dB) | 46.2 | 39.2 15% | 48.3 -5% | 46.5 -1% | 47.4 -3% |
* ... menor é melhor
(±) A temperatura máxima no lado superior é 42 °C / 108 F, em comparação com a média de 40.4 °C / 105 F , variando de 21.2 a 68.8 °C para a classe Gaming.
(-) A parte inferior aquece até um máximo de 51.2 °C / 124 F, em comparação com a média de 43.2 °C / 110 F
(+) Em uso inativo, a temperatura média para o lado superior é 29.2 °C / 85 F, em comparação com a média do dispositivo de 33.9 °C / ### class_avg_f### F.
(+) Jogando The Witcher 3, a temperatura média para o lado superior é 28.4 °C / 83 F, em comparação com a média do dispositivo de 33.9 °C / ## #class_avg_f### F.
(+) Os apoios para as mãos e o touchpad são mais frios que a temperatura da pele, com um máximo de 28.4 °C / 83.1 F e, portanto, são frios ao toque.
(±) A temperatura média da área do apoio para as mãos de dispositivos semelhantes foi 28.8 °C / 83.8 F (+0.4 °C / 0.7 F).
Lenovo Legion Y730-17ICH, i7-8750H análise de áudio
(-) | alto-falantes não muito altos (###valor### dB)
Graves 100 - 315Hz
(±) | graves reduzidos - em média 5.7% menor que a mediana
(±) | a linearidade dos graves é média (12.8% delta para a frequência anterior)
Médios 400 - 2.000 Hz
(+) | médios equilibrados - apenas 3.3% longe da mediana
(+) | médios são lineares (5.3% delta para frequência anterior)
Altos 2 - 16 kHz
(+) | agudos equilibrados - apenas 1.2% longe da mediana
(+) | os máximos são lineares (4.5% delta da frequência anterior)
Geral 100 - 16.000 Hz
(+) | o som geral é linear (13.8% diferença em relação à mediana)
Comparado com a mesma classe
» 21% de todos os dispositivos testados nesta classe foram melhores, 7% semelhantes, 71% piores
» O melhor teve um delta de 6%, a média foi 18%, o pior foi 132%
Comparado com todos os dispositivos testados
» 15% de todos os dispositivos testados foram melhores, 4% semelhantes, 81% piores
» O melhor teve um delta de 4%, a média foi 23%, o pior foi 134%
Apple MacBook 12 (Early 2016) 1.1 GHz análise de áudio
(+) | os alto-falantes podem tocar relativamente alto (###valor### dB)
Graves 100 - 315Hz
(±) | graves reduzidos - em média 11.3% menor que a mediana
(±) | a linearidade dos graves é média (14.2% delta para a frequência anterior)
Médios 400 - 2.000 Hz
(+) | médios equilibrados - apenas 2.4% longe da mediana
(+) | médios são lineares (5.5% delta para frequência anterior)
Altos 2 - 16 kHz
(+) | agudos equilibrados - apenas 2% longe da mediana
(+) | os máximos são lineares (4.5% delta da frequência anterior)
Geral 100 - 16.000 Hz
(+) | o som geral é linear (10.2% diferença em relação à mediana)
Comparado com a mesma classe
» 7% de todos os dispositivos testados nesta classe foram melhores, 2% semelhantes, 90% piores
» O melhor teve um delta de 5%, a média foi 18%, o pior foi 53%
Comparado com todos os dispositivos testados
» 5% de todos os dispositivos testados foram melhores, 1% semelhantes, 94% piores
» O melhor teve um delta de 4%, a média foi 23%, o pior foi 134%
| desligado | |
| Ocioso | |
| Carga |
|
Key:
min: | |
| Lenovo Legion Y730-17ICH, i7-8750H i7-8750H, GeForce GTX 1050 Ti Mobile, Toshiba KBG30ZMT128G, IPS, 1920x1080, 17.3" | HP Omen 17t-3AW55AV_1 i7-8750H, GeForce GTX 1070 Mobile, Samsung SSD PM981 MZVLB512HAJQ, IPS, 1920x1080, 17.3" | Dell G3 17 3779 i5-8300H, GeForce GTX 1050 Mobile, SK hynix SC311 SATA, IPS, 1920x1080, 17.3" | Asus Strix GL703GM-DS74 i7-8750H, GeForce GTX 1060 Mobile, Samsung PM961 MZVLW256HEHP, TN LED, 1920x1080, 17.3" | Dell XPS 15 9575 i7-8705G i7-8705G, Vega M GL / 870, SK hynix PC401 NVMe 500 GB, IPS, 3840x2160, 15.6" | Asus Strix GL502VT-DS74 6700HQ, GeForce GTX 970M, Lite-On CV1-8B128, IPS, 1920x1080, 15.6" | |
|---|---|---|---|---|---|---|
| Power Consumption | -98% | -14% | -97% | 4% | -39% | |
| Idle Minimum * (Watt) | 6.3 | 17.8 -183% | 7.7 -22% | 18.88 -200% | 6.2 2% | 11.1 -76% |
| Idle Average * (Watt) | 11 | 24.7 -125% | 14 -27% | 24.36 -121% | 12.9 -17% | 14.1 -28% |
| Idle Maximum * (Watt) | 11.5 | 29.6 -157% | 15.5 -35% | 32.27 -181% | 13.6 -18% | 18.4 -60% |
| Load Average * (Watt) | 89.8 | 110 -22% | 95 -6% | 107.74 -20% | 76.1 15% | 96.5 -7% |
| Witcher 3 ultra * (Watt) | 102 | 167.8 -65% | 142 -39% | 84.3 17% | ||
| Load Maximum * (Watt) | 130.7 | 178.6 -37% | 106 19% | 160.28 -23% | 99.4 24% | 159.5 -22% |
* ... menor é melhor
| Lenovo Legion Y730-17ICH, i7-8750H i7-8750H, GeForce GTX 1050 Ti Mobile, 76 Wh | Alienware 17 R5 i7-8750H, GeForce GTX 1070 Mobile, 99 Wh | Dell G3 17 3779 i5-8300H, GeForce GTX 1050 Mobile, 56 Wh | Asus Strix GL703GM-DS74 i7-8750H, GeForce GTX 1060 Mobile, 74 Wh | Aorus X7 DT v8 i7-8850H, GeForce GTX 1080 Mobile, 94.24 Wh | Lenovo Ideapad Y700 17ISK 80Q0 6700HQ, GeForce GTX 960M, 60 Wh | |
|---|---|---|---|---|---|---|
| Duração da bateria | -30% | 37% | -24% | -21% | 13% | |
| Reader / Idle (h) | 13.2 | 4.5 -66% | 12.2 -8% | 5.3 -60% | 4.9 -63% | 11.5 -13% |
| WiFi v1.3 (h) | 6.7 | 3.6 -46% | 5.8 -13% | 3.6 -46% | 3.8 -43% | 5.6 -16% |
| Load (h) | 0.9 | 1.1 22% | 2.1 133% | 1.2 33% | 1.3 44% | 1.5 67% |
Pro
Contra
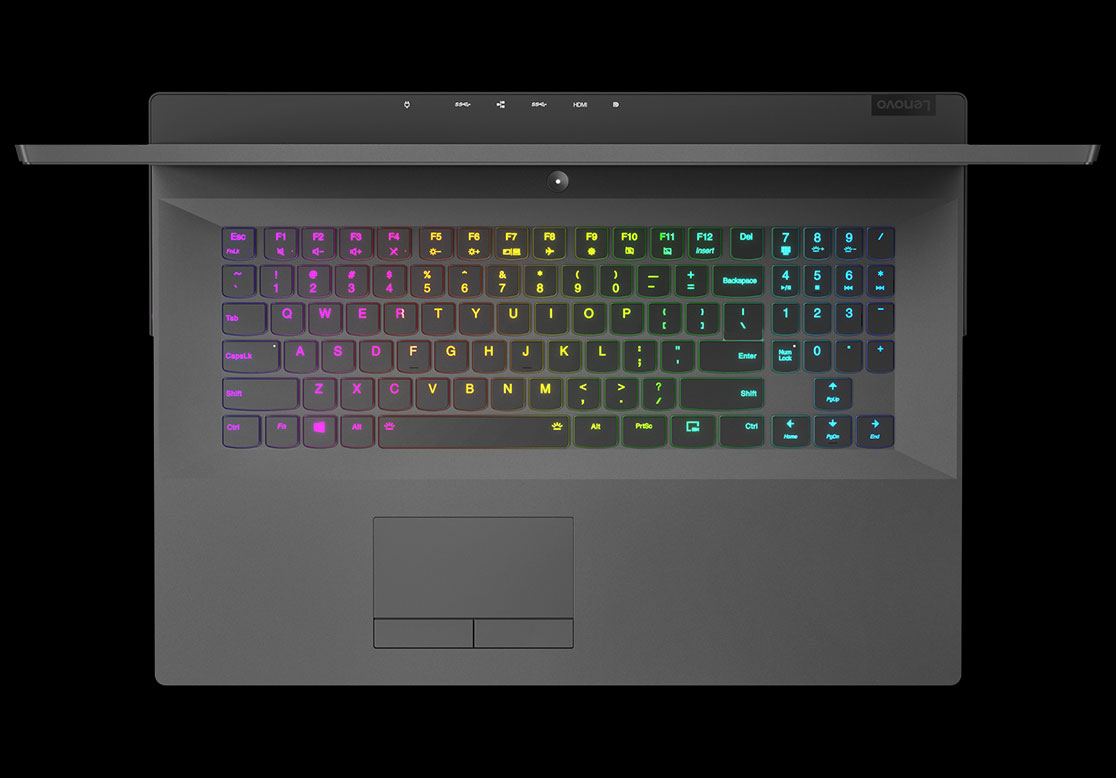
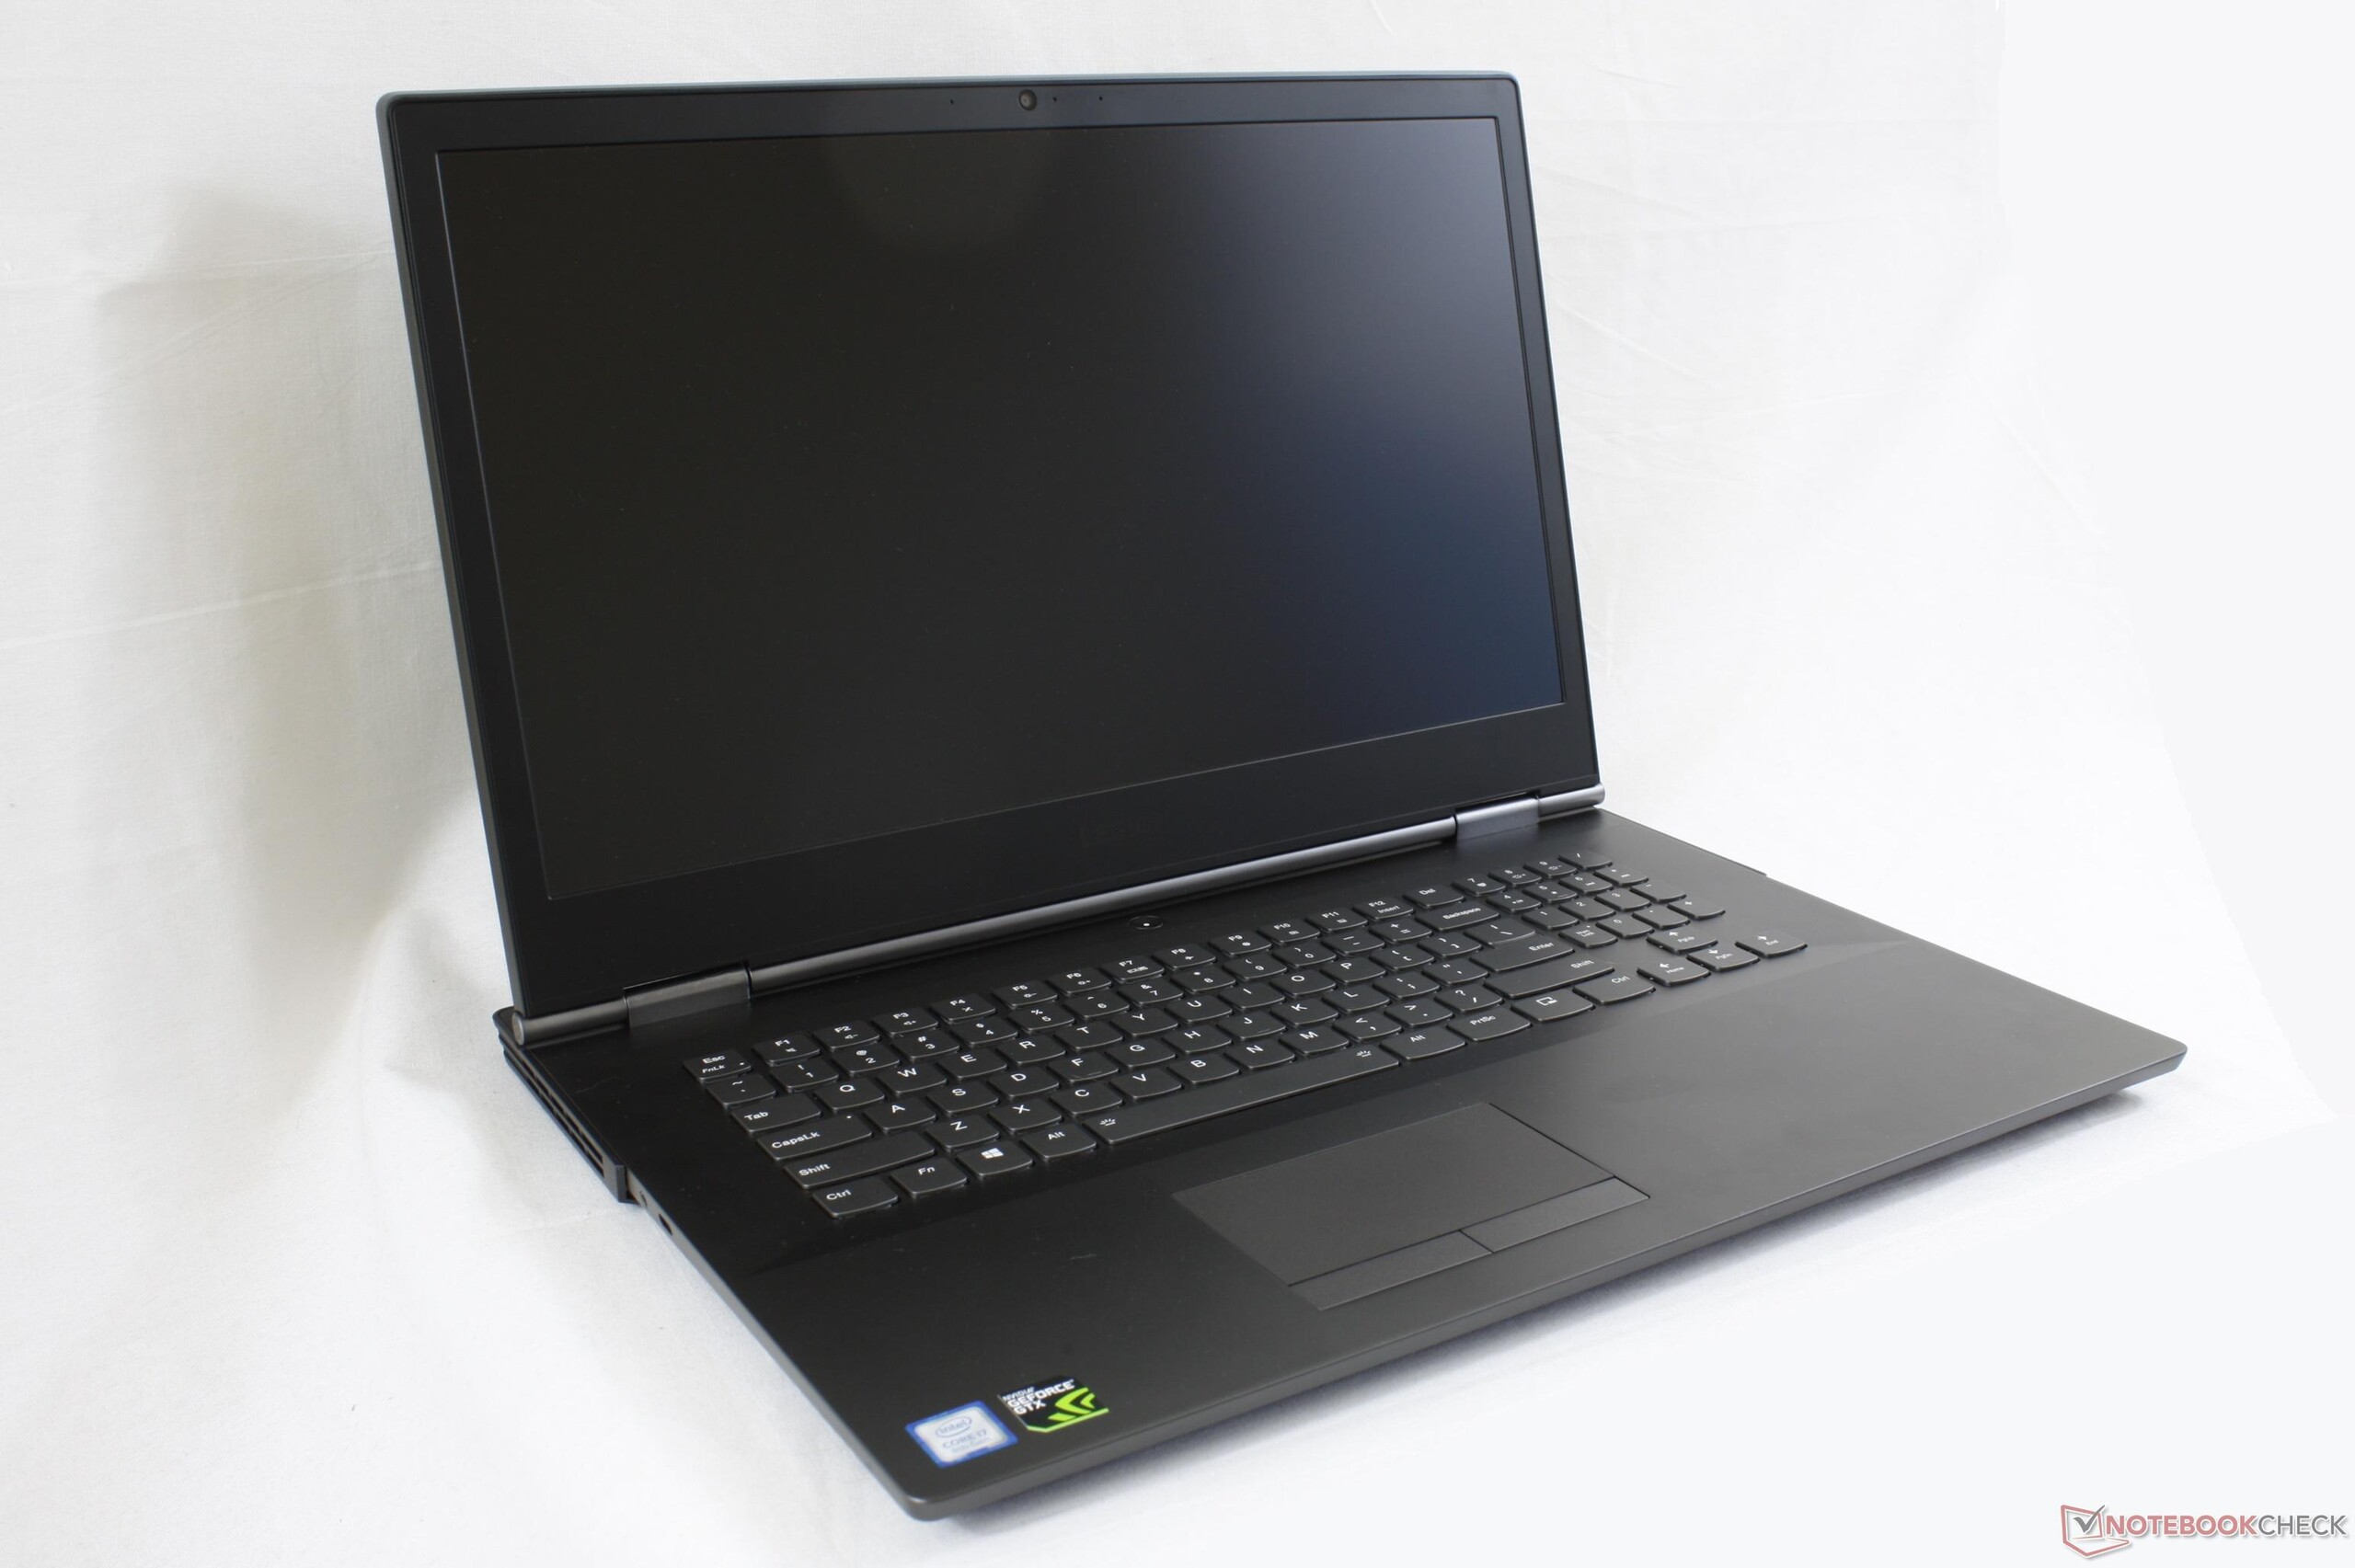
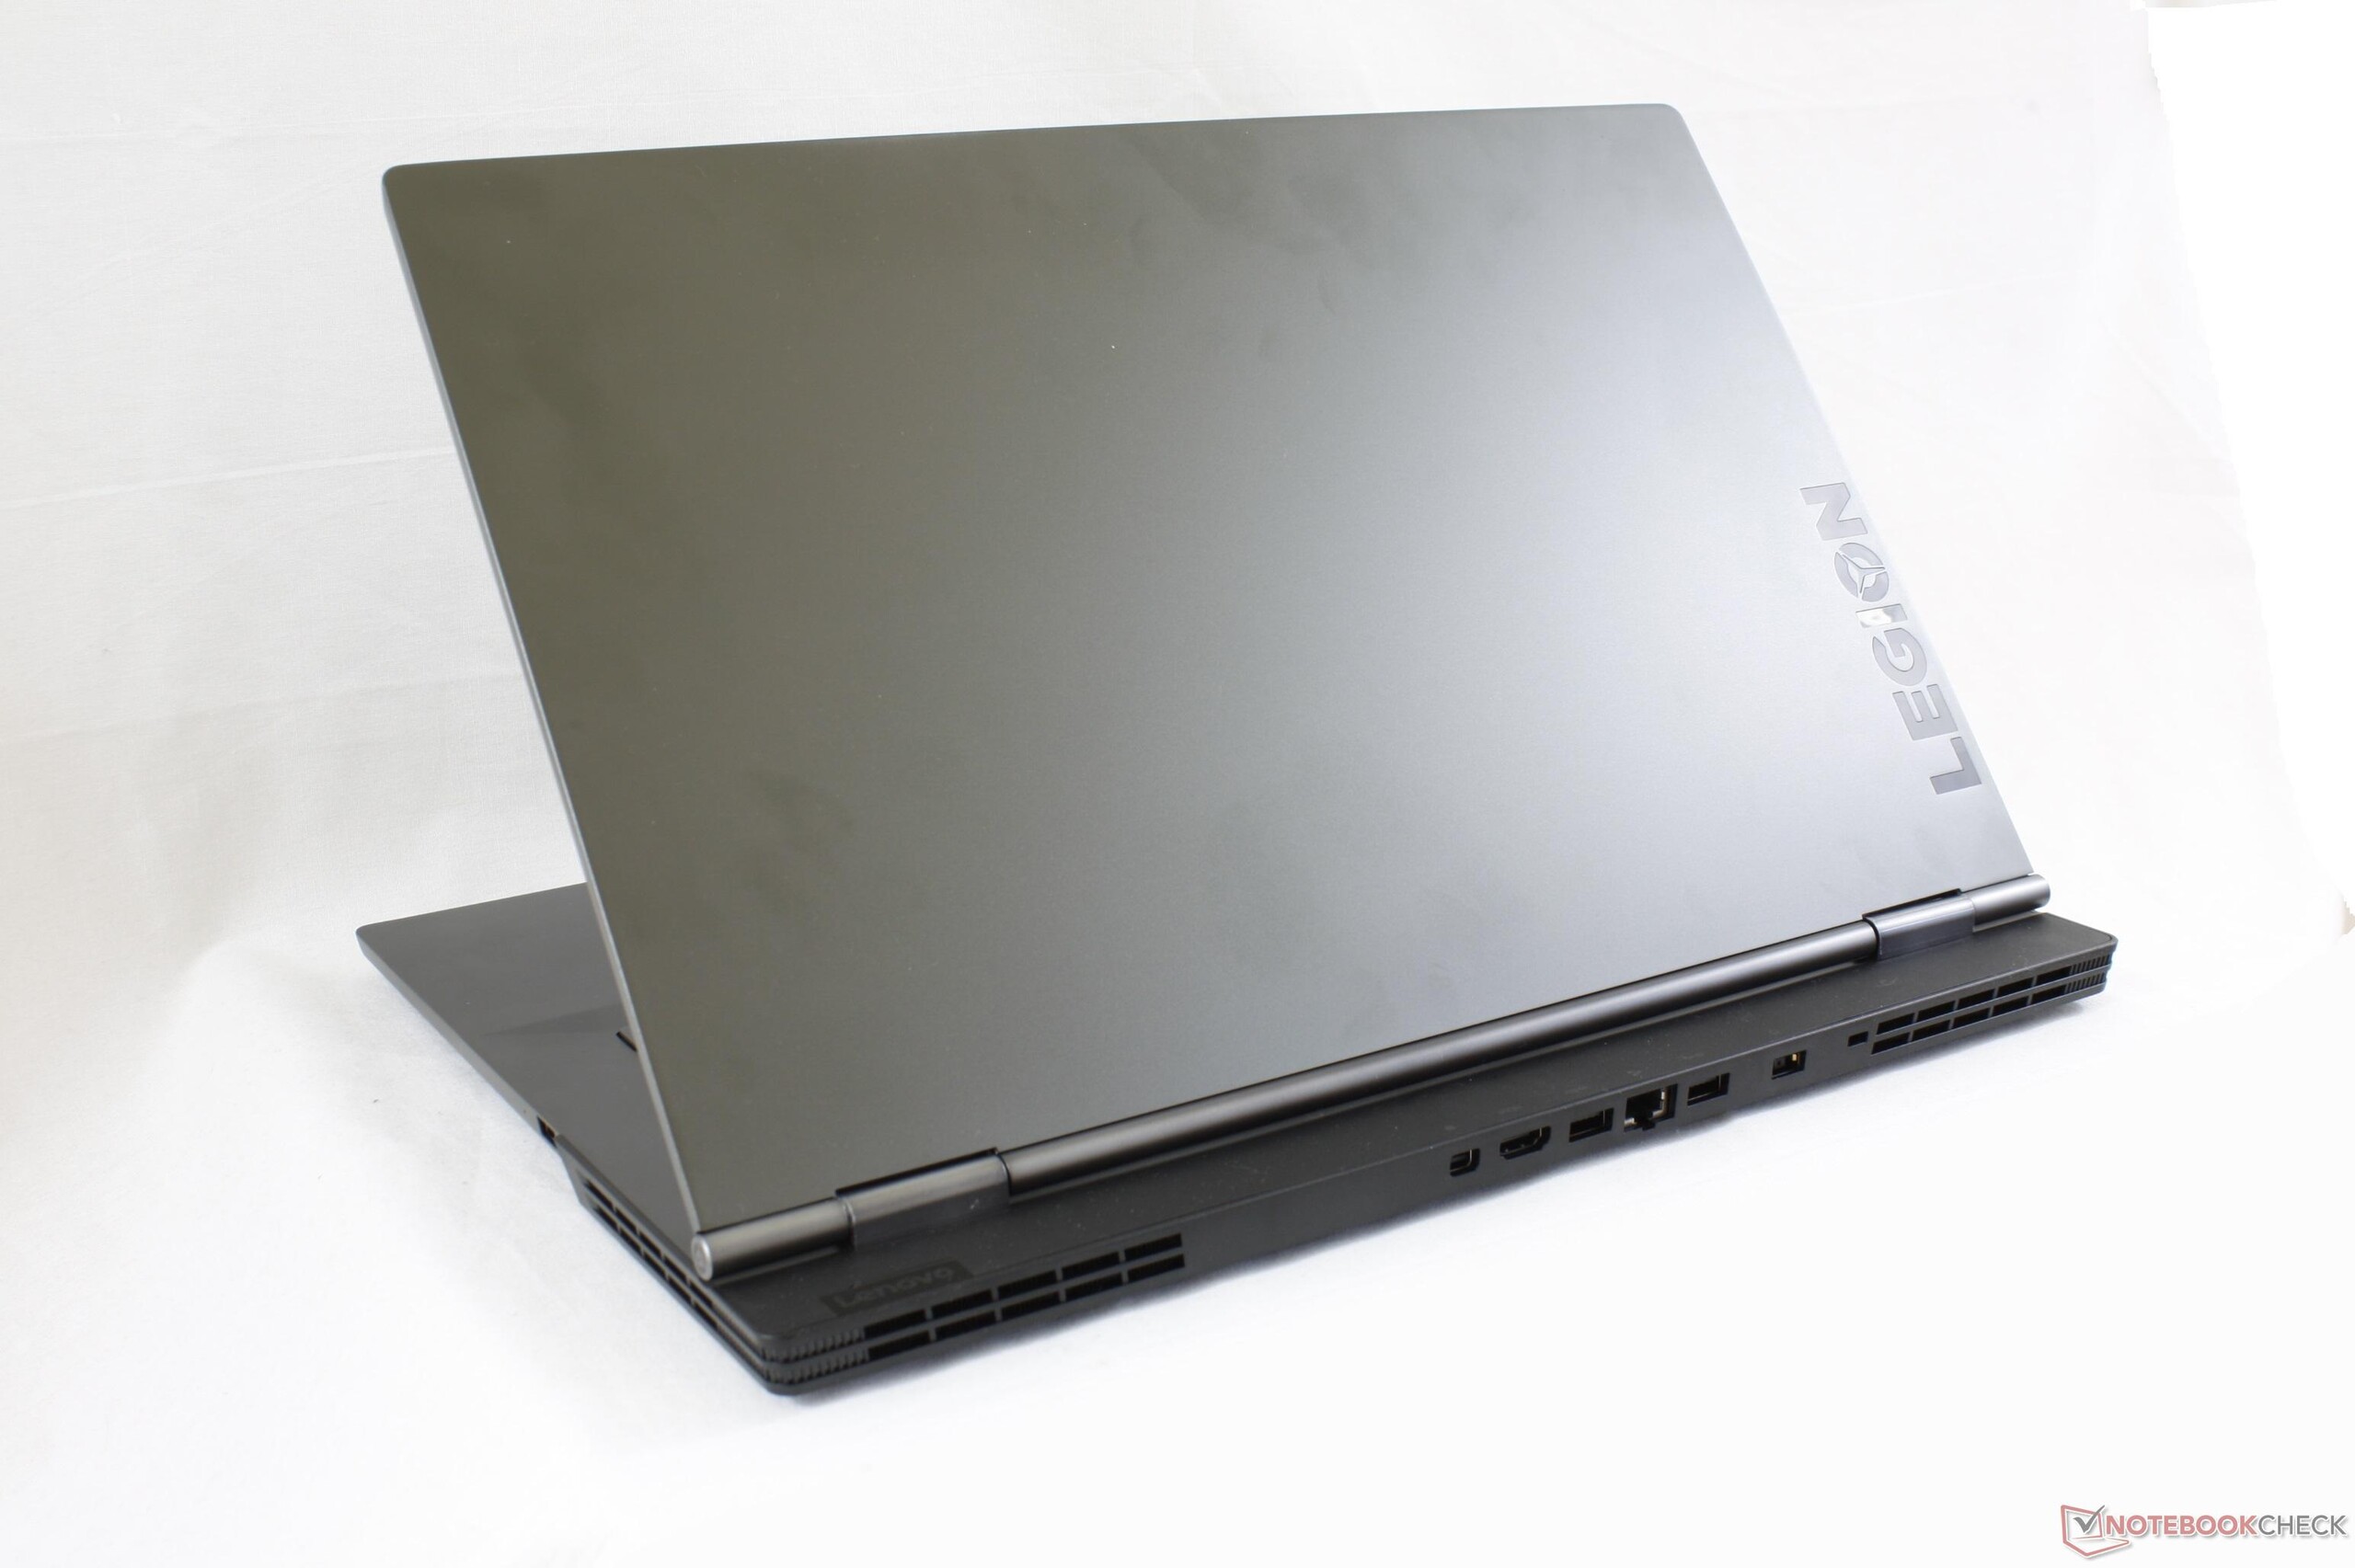
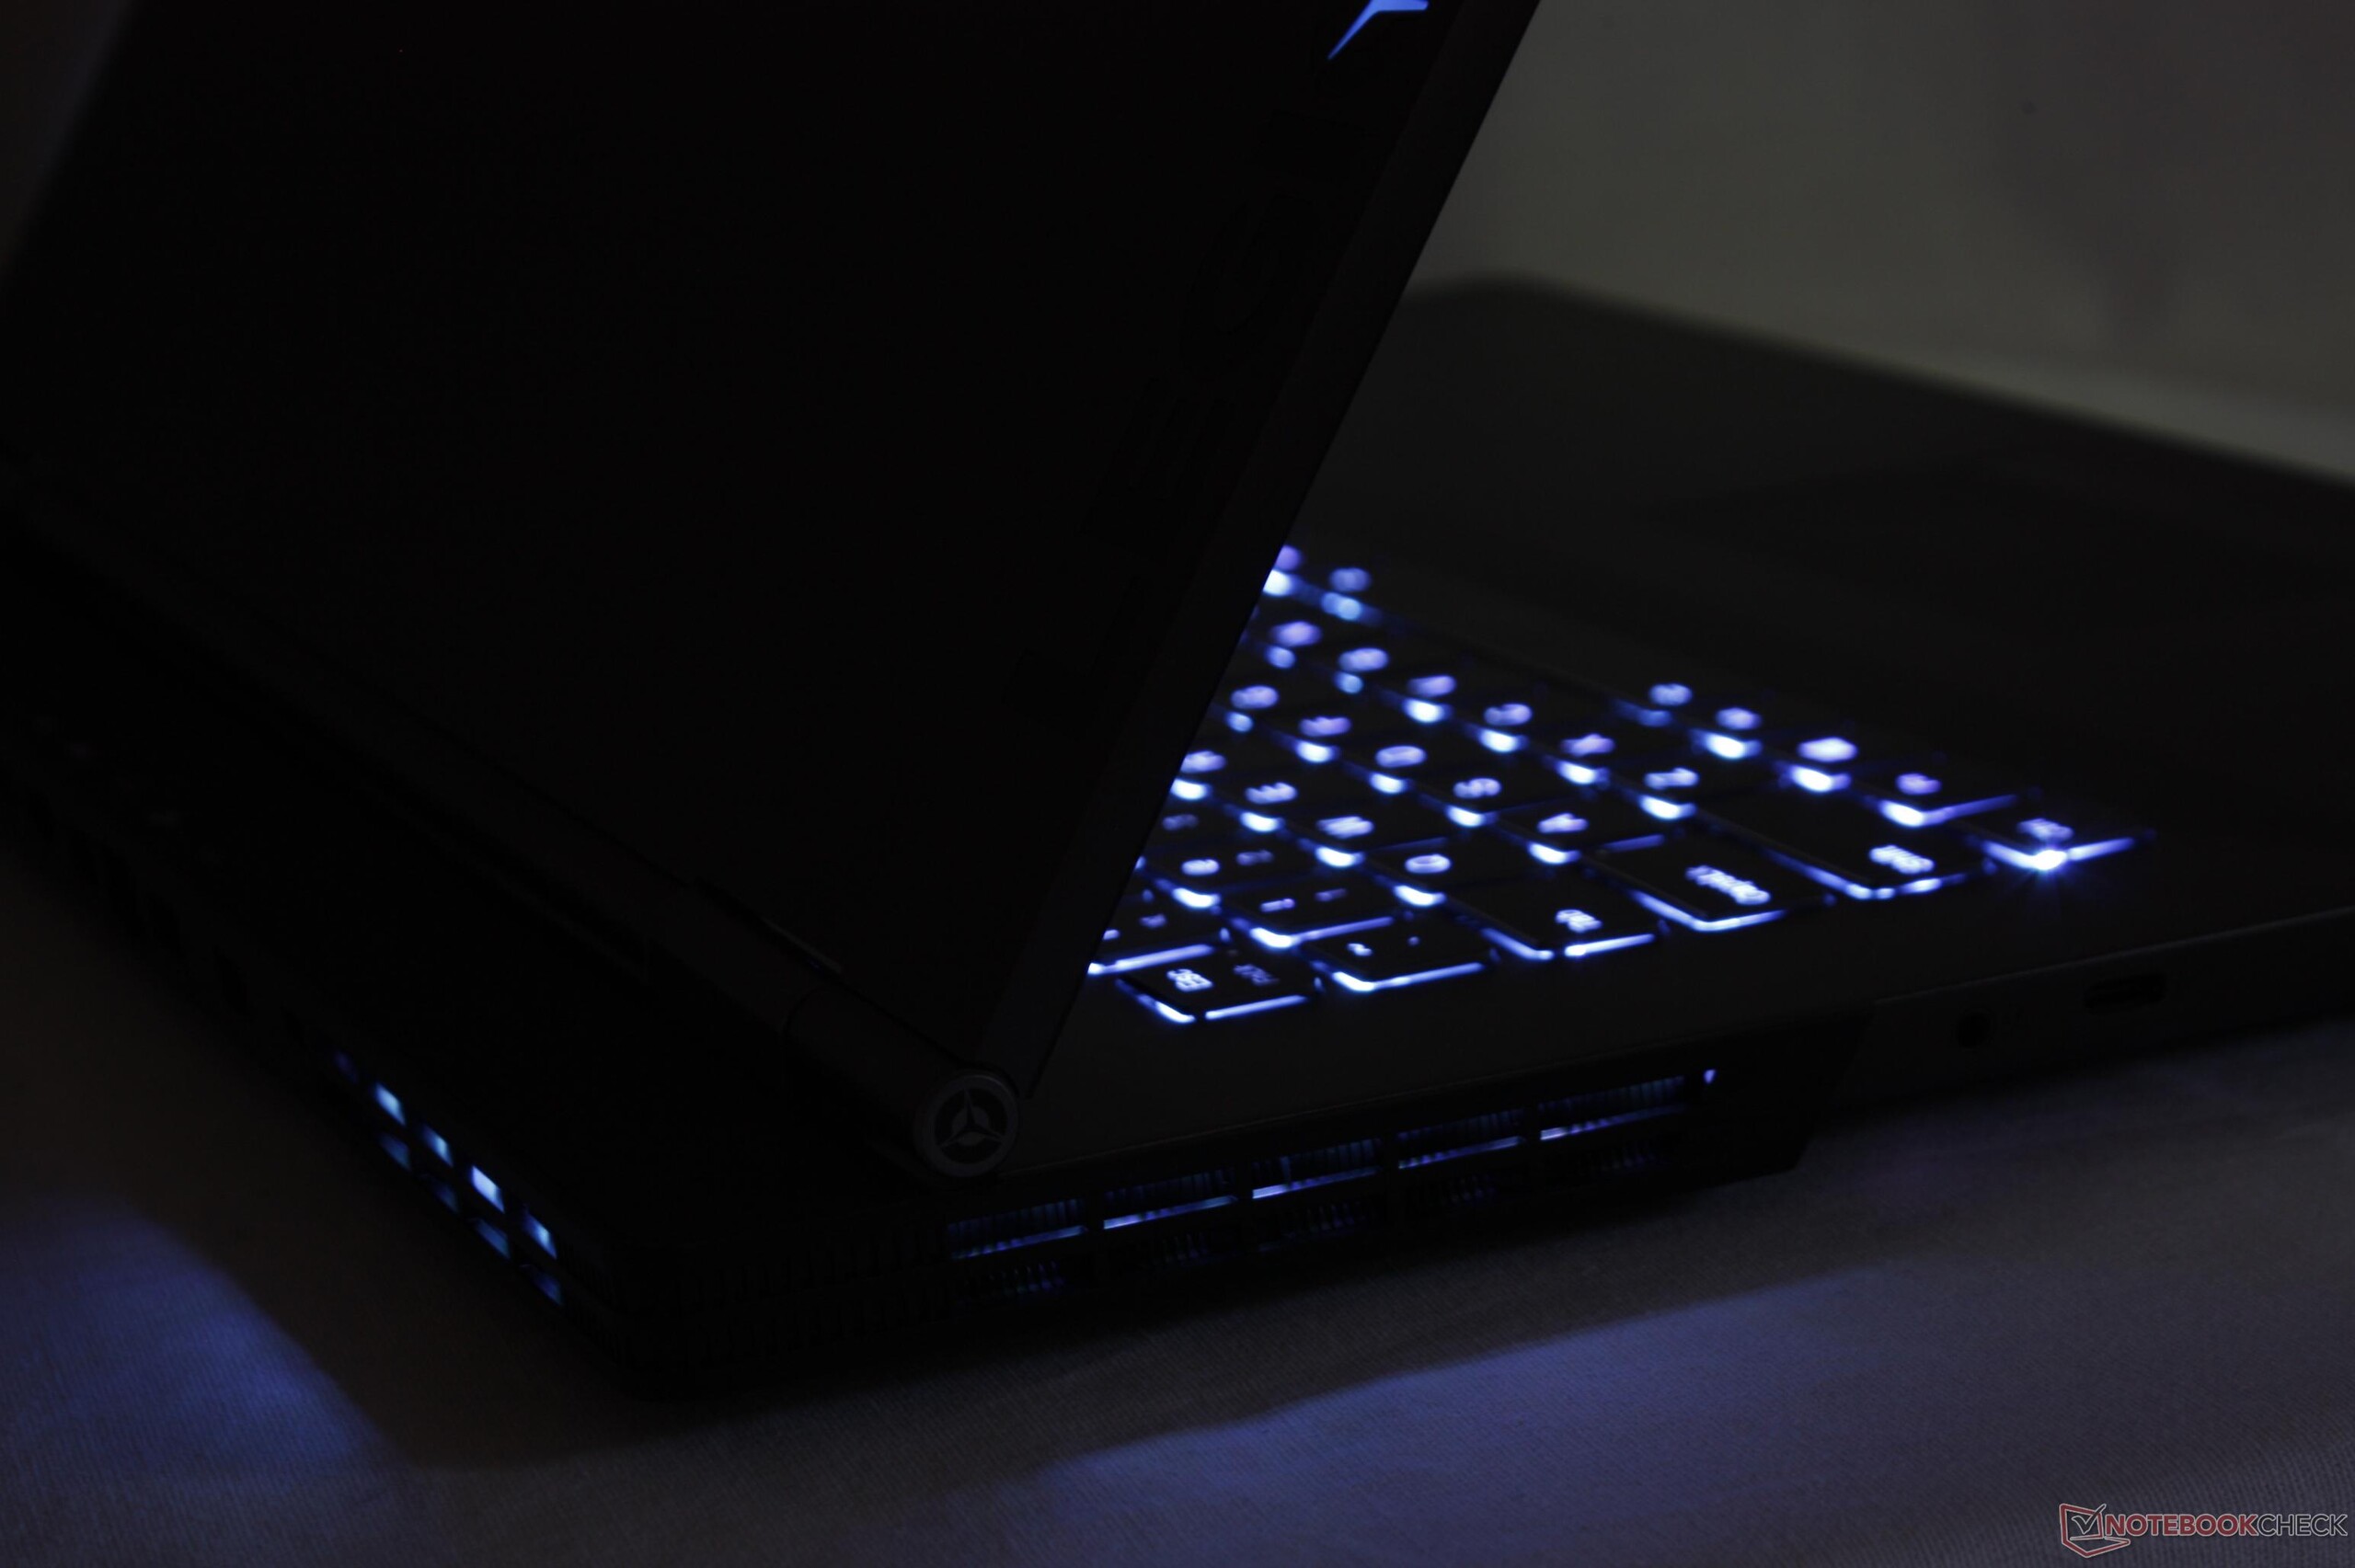
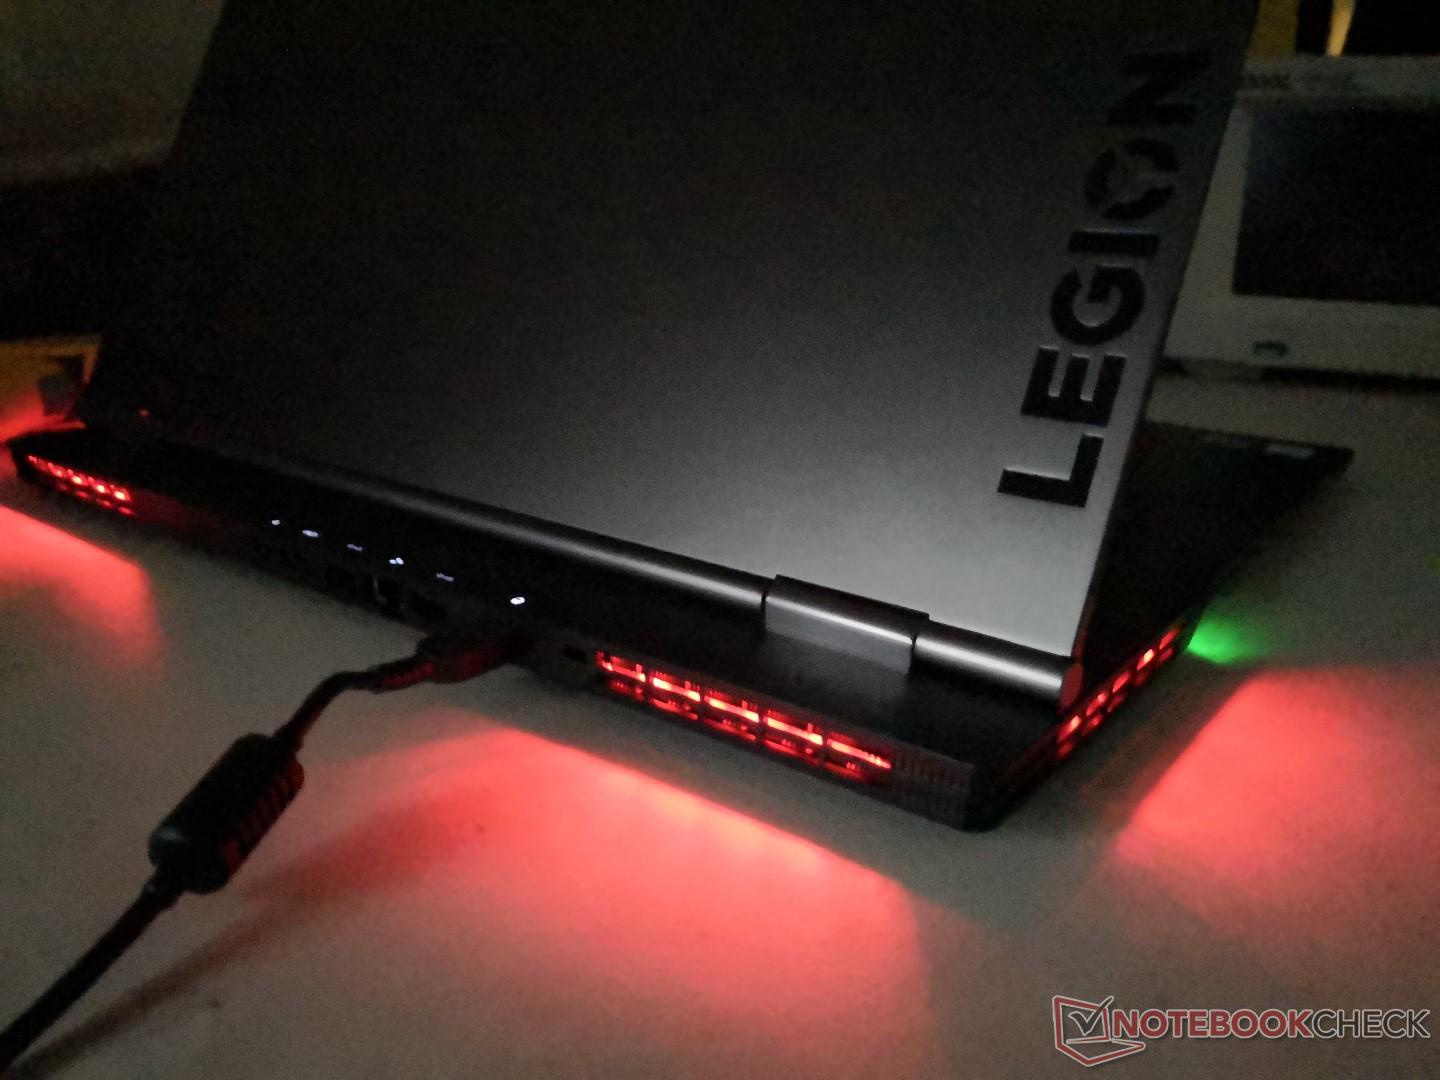
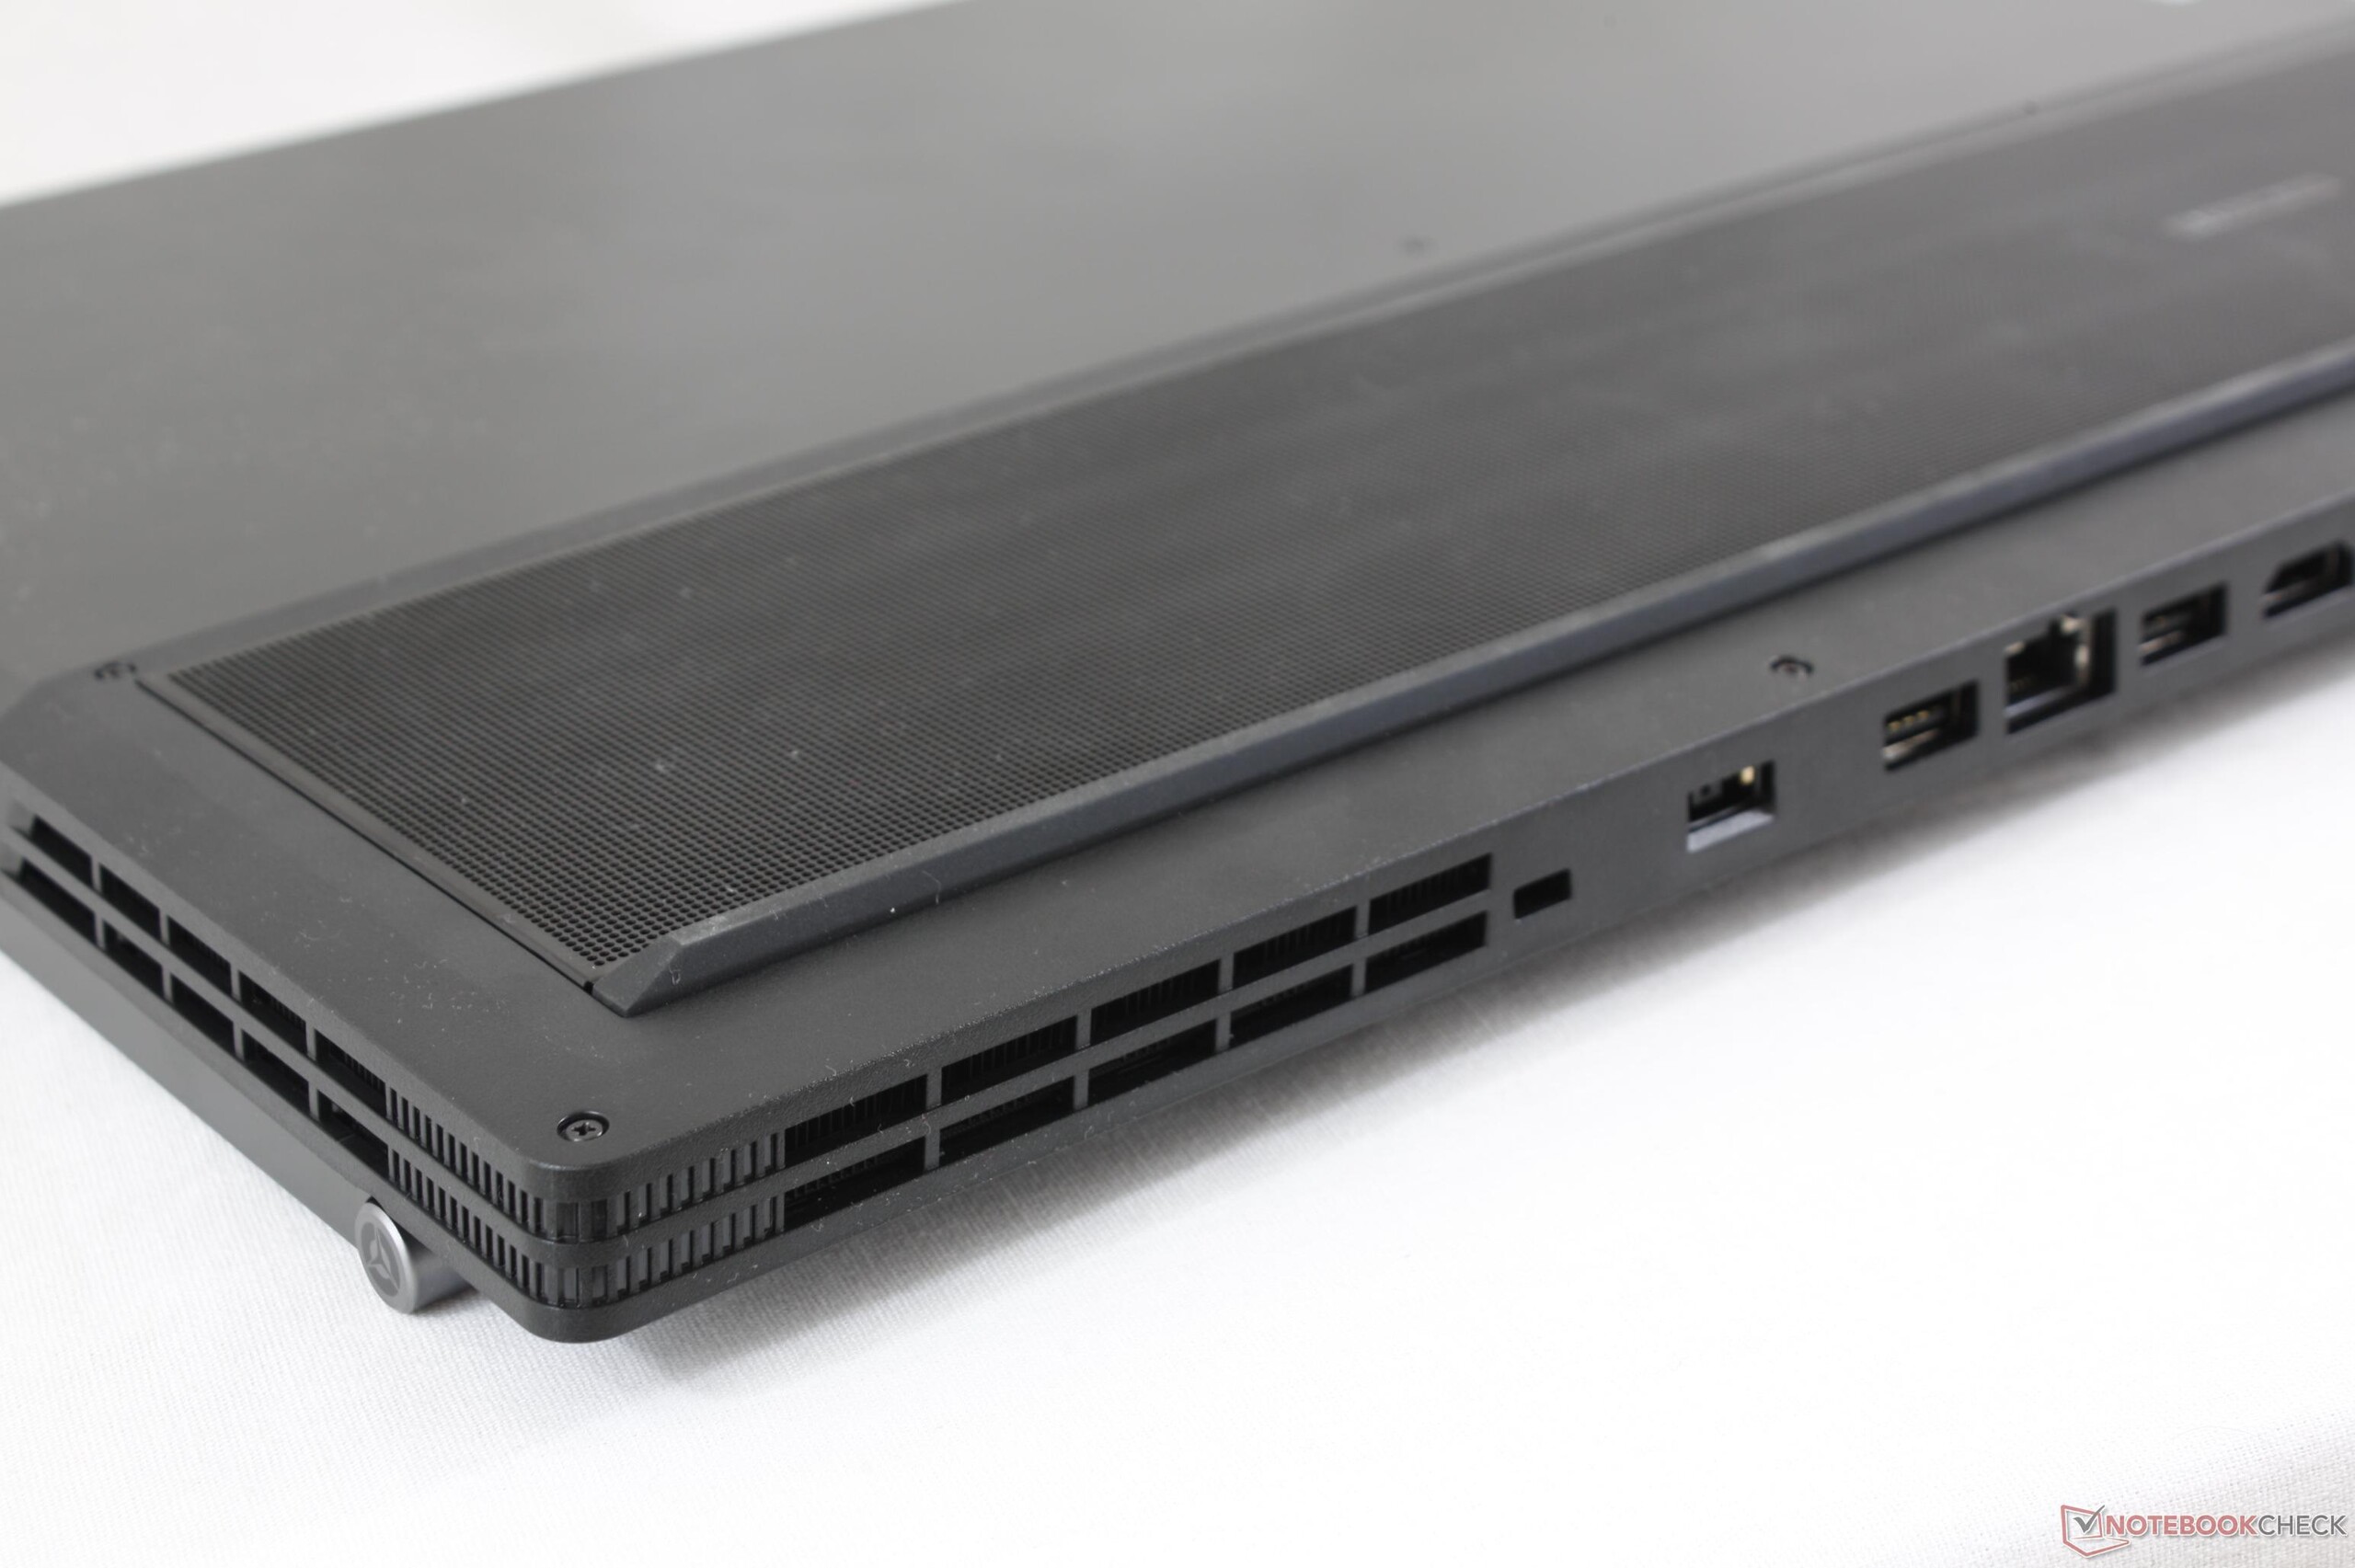
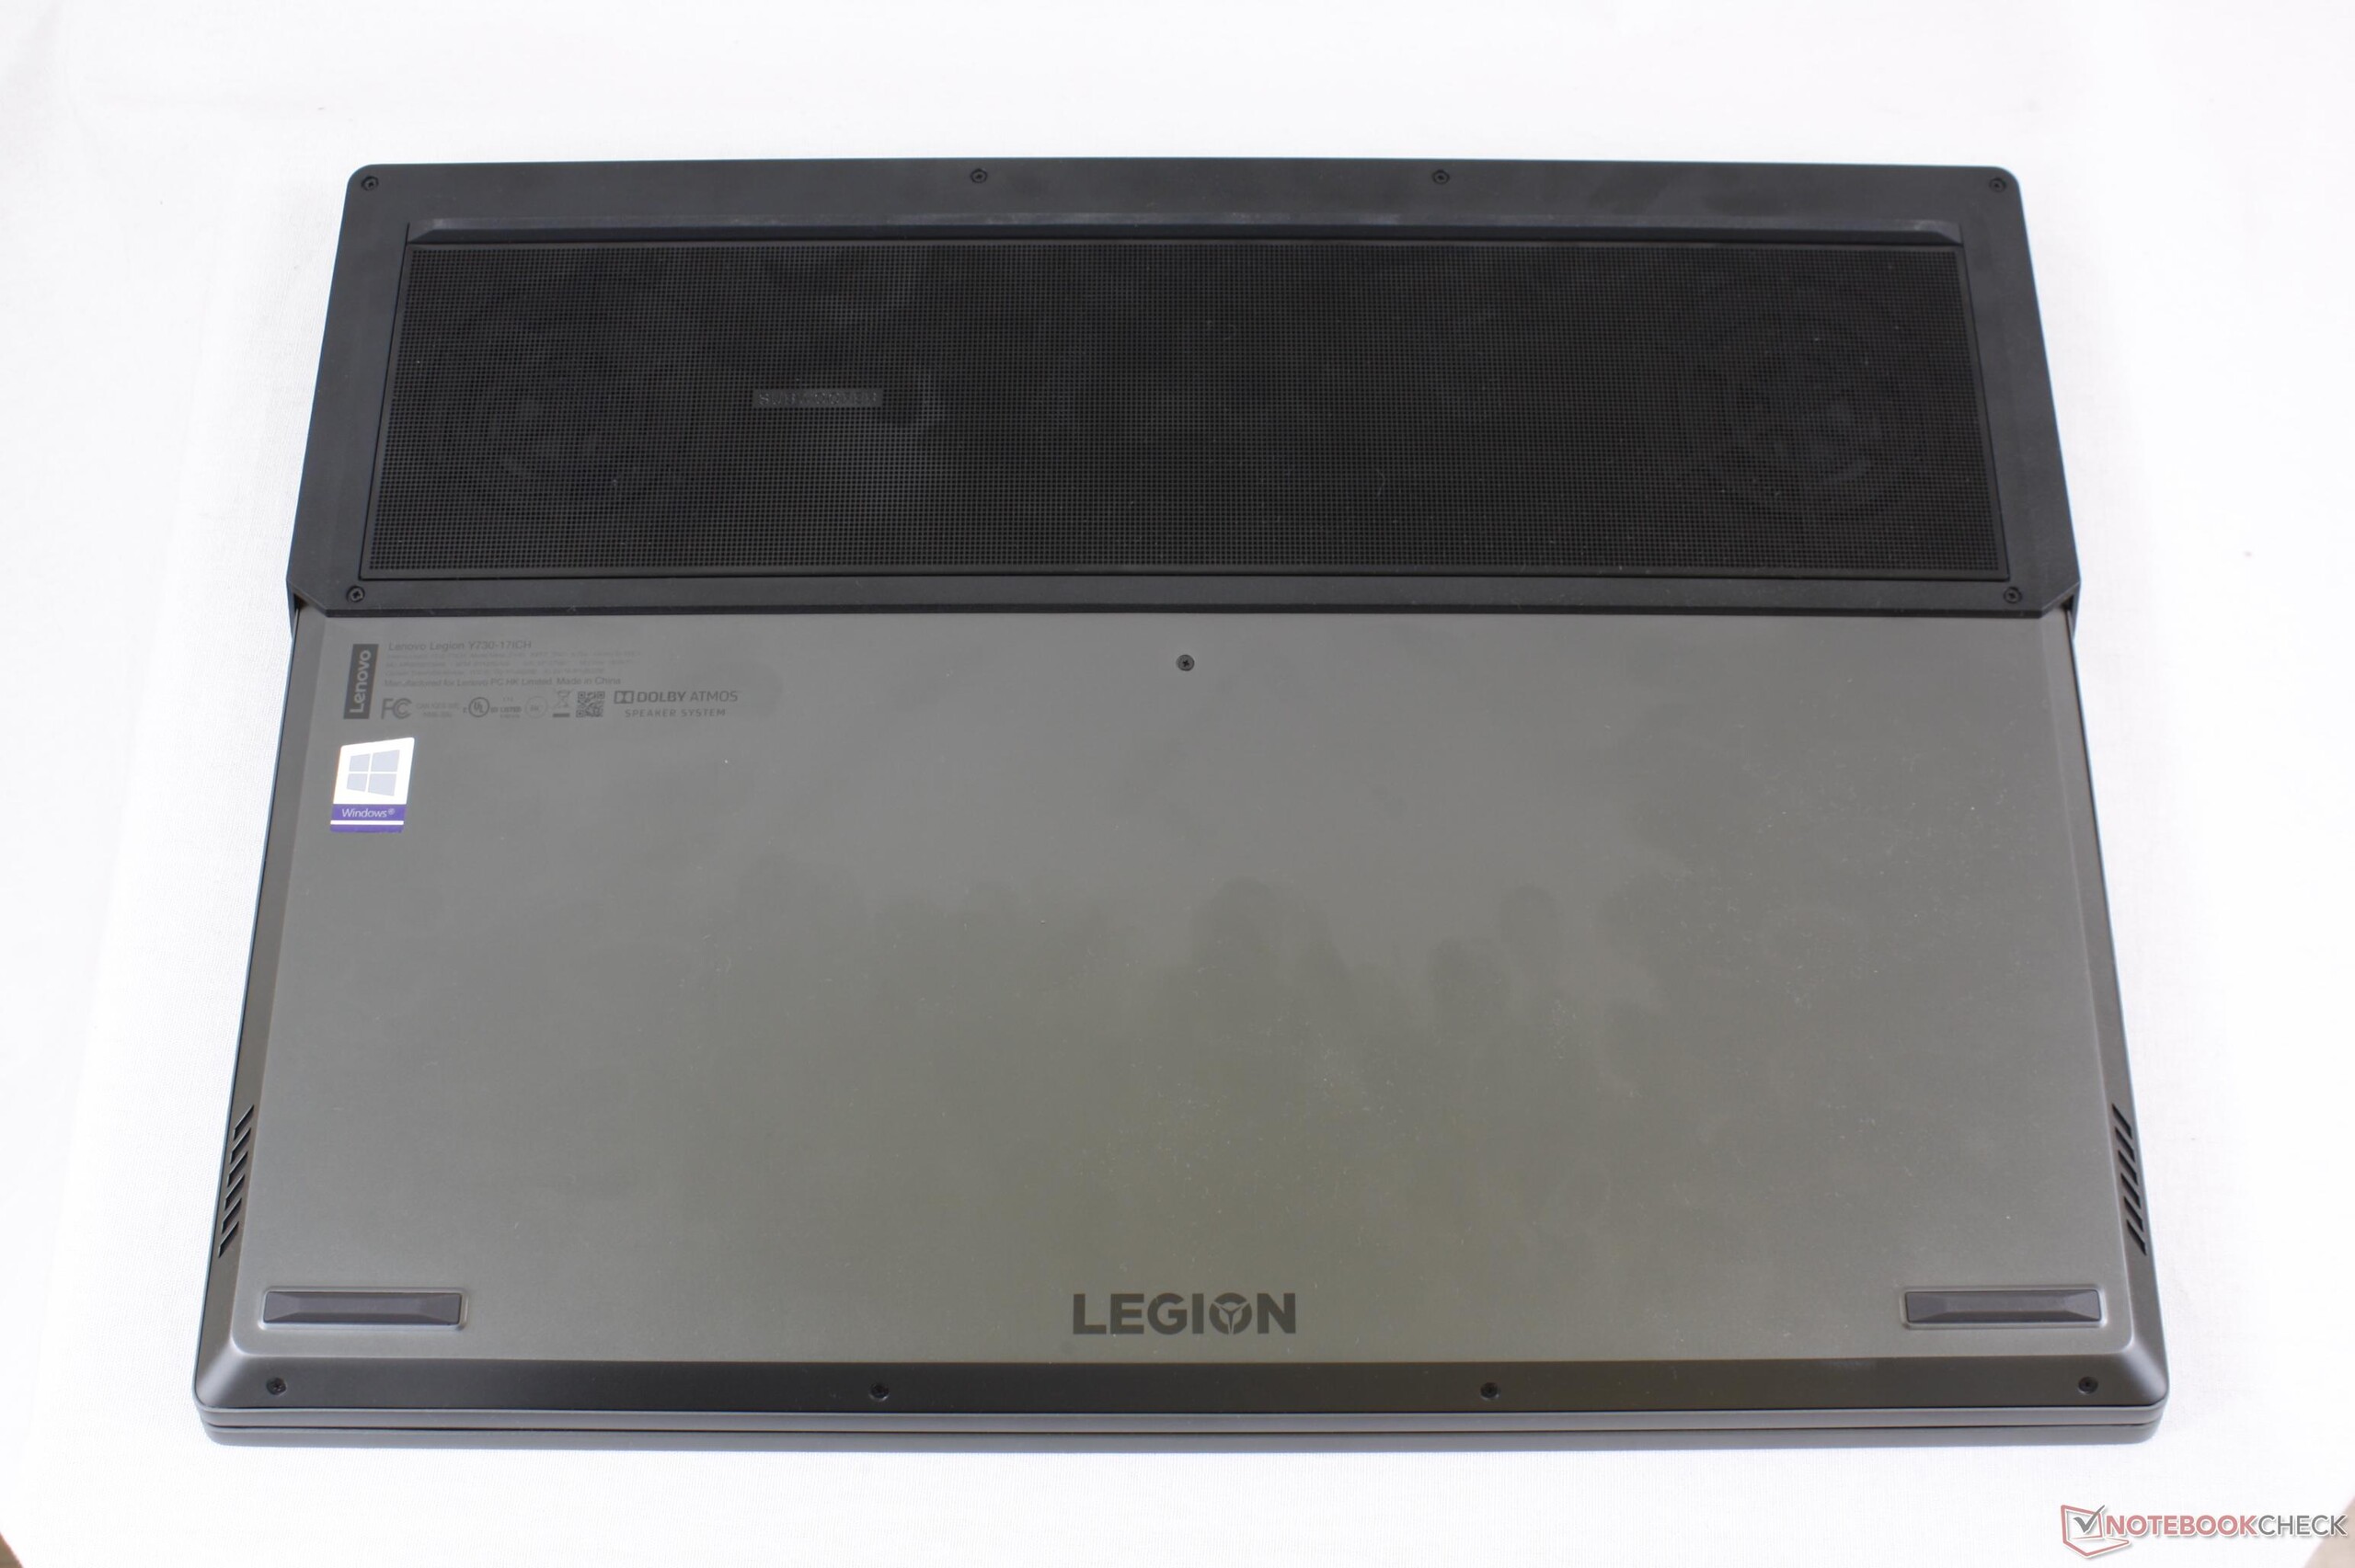
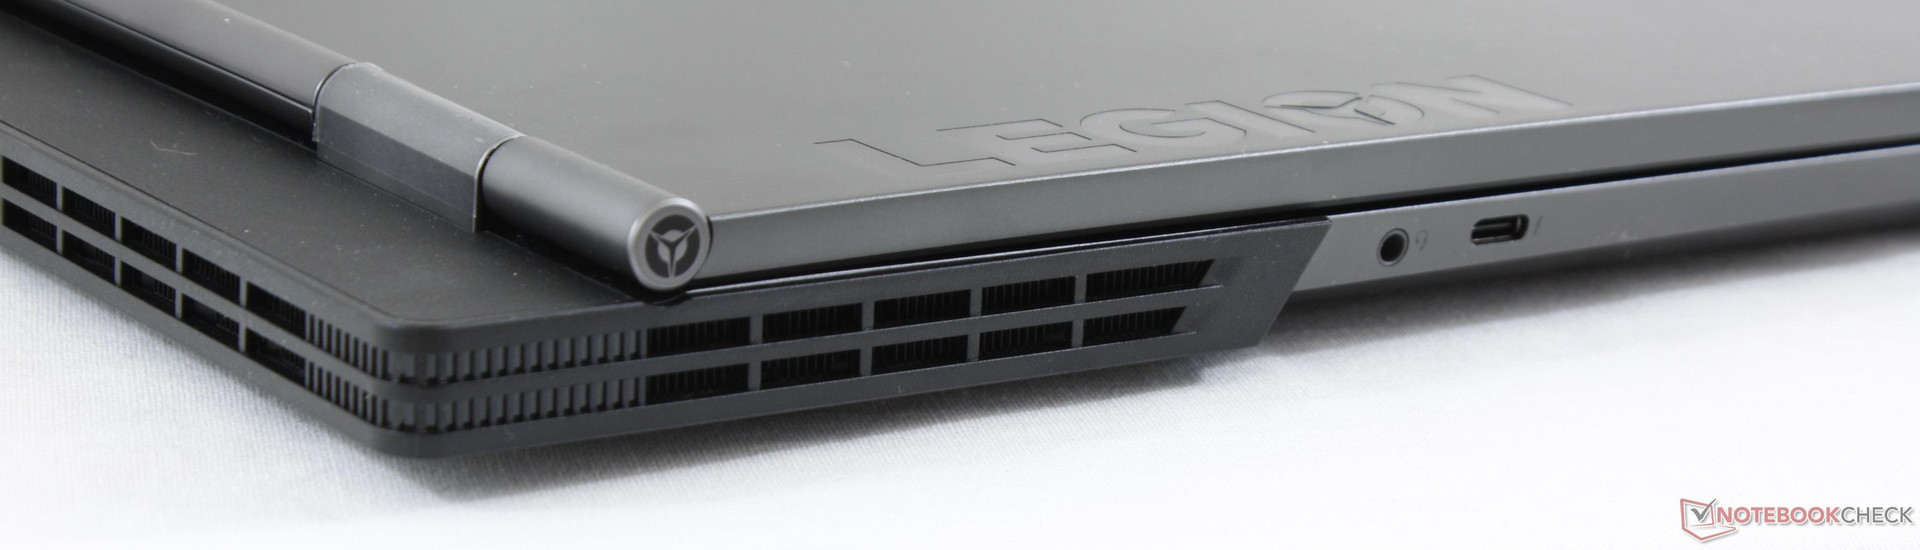
Tanto o Legion Y730 quanto o Y530 representam as maiores mudanças para a família até hoje. A fachada de negócios mais casual contrasta o hardware de jogos mainstream e luzes LED por baixo para uma abordagem muito diferente do que o Asus ROG, Acer Predator, e a série MSI G tem a oferecer. Ao mesmo tempo, o Y730 ainda consegue lançar alguns luxos como Thunderbolt 3, melhor resfriamento e luzes RGB por tecla que normalmente são reservadas para portáteis de jogos "hardcore". É uma combinação atípica que surpreendentemente funciona para o Y730.
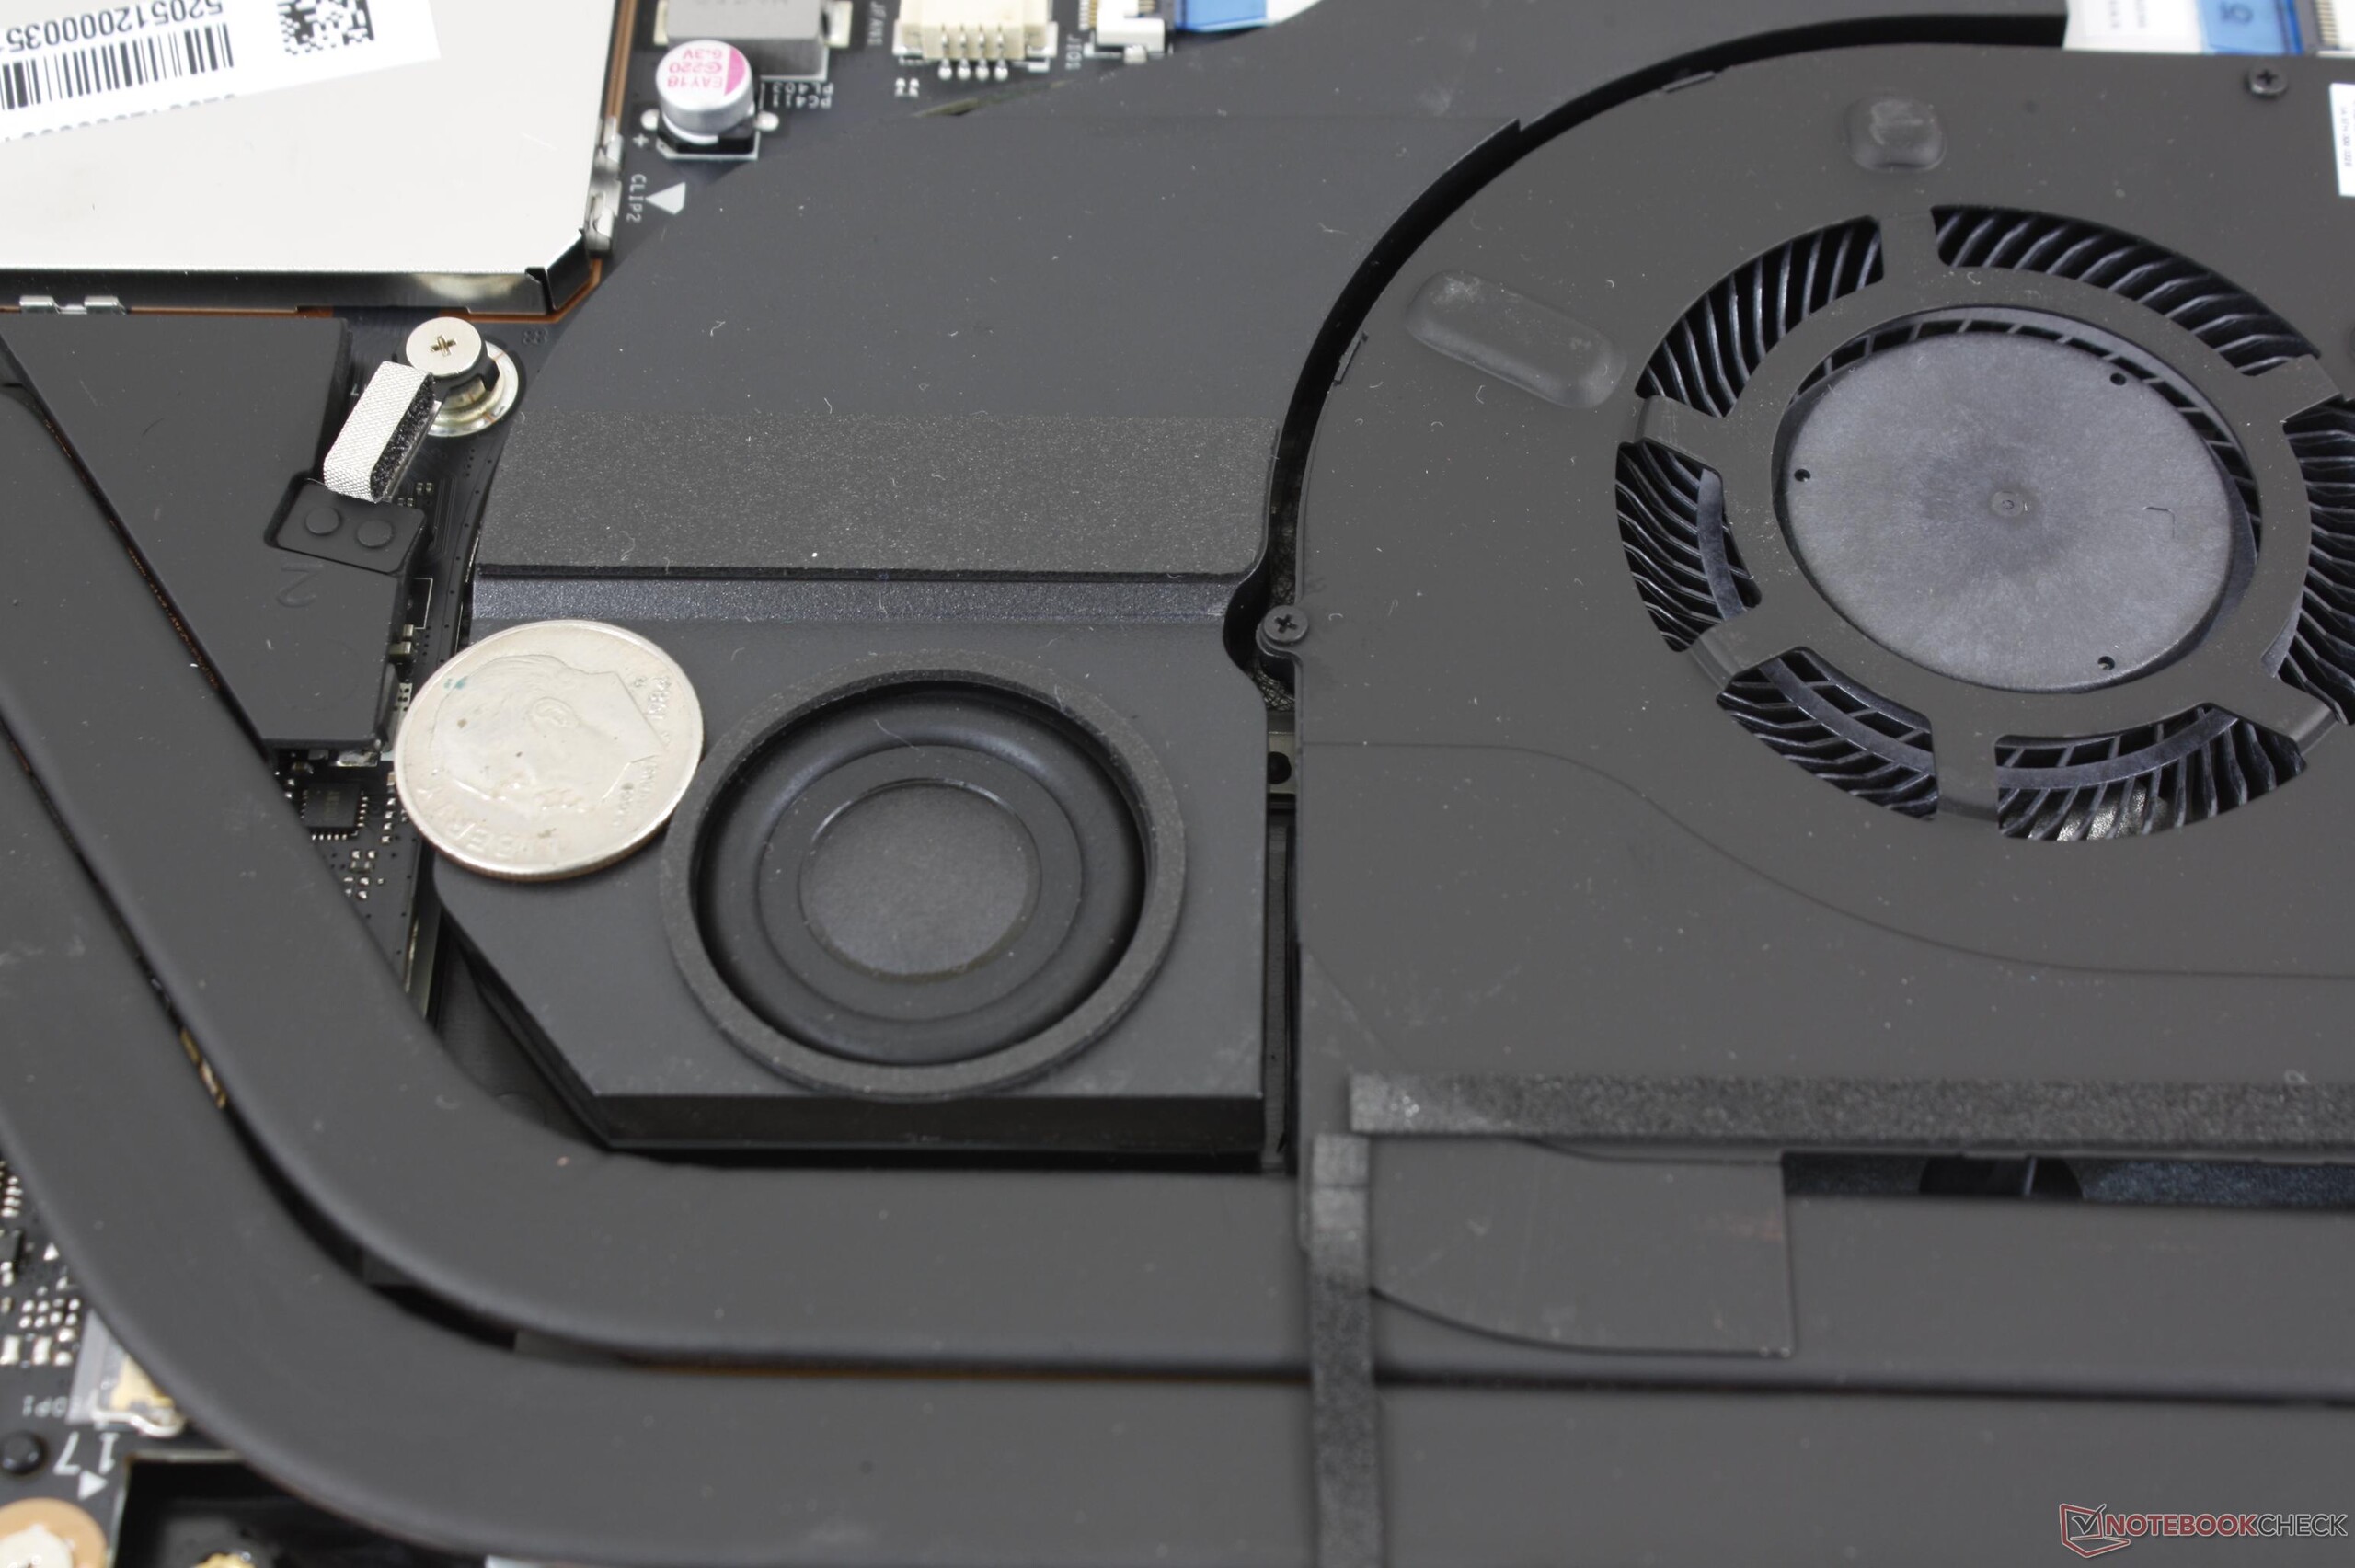
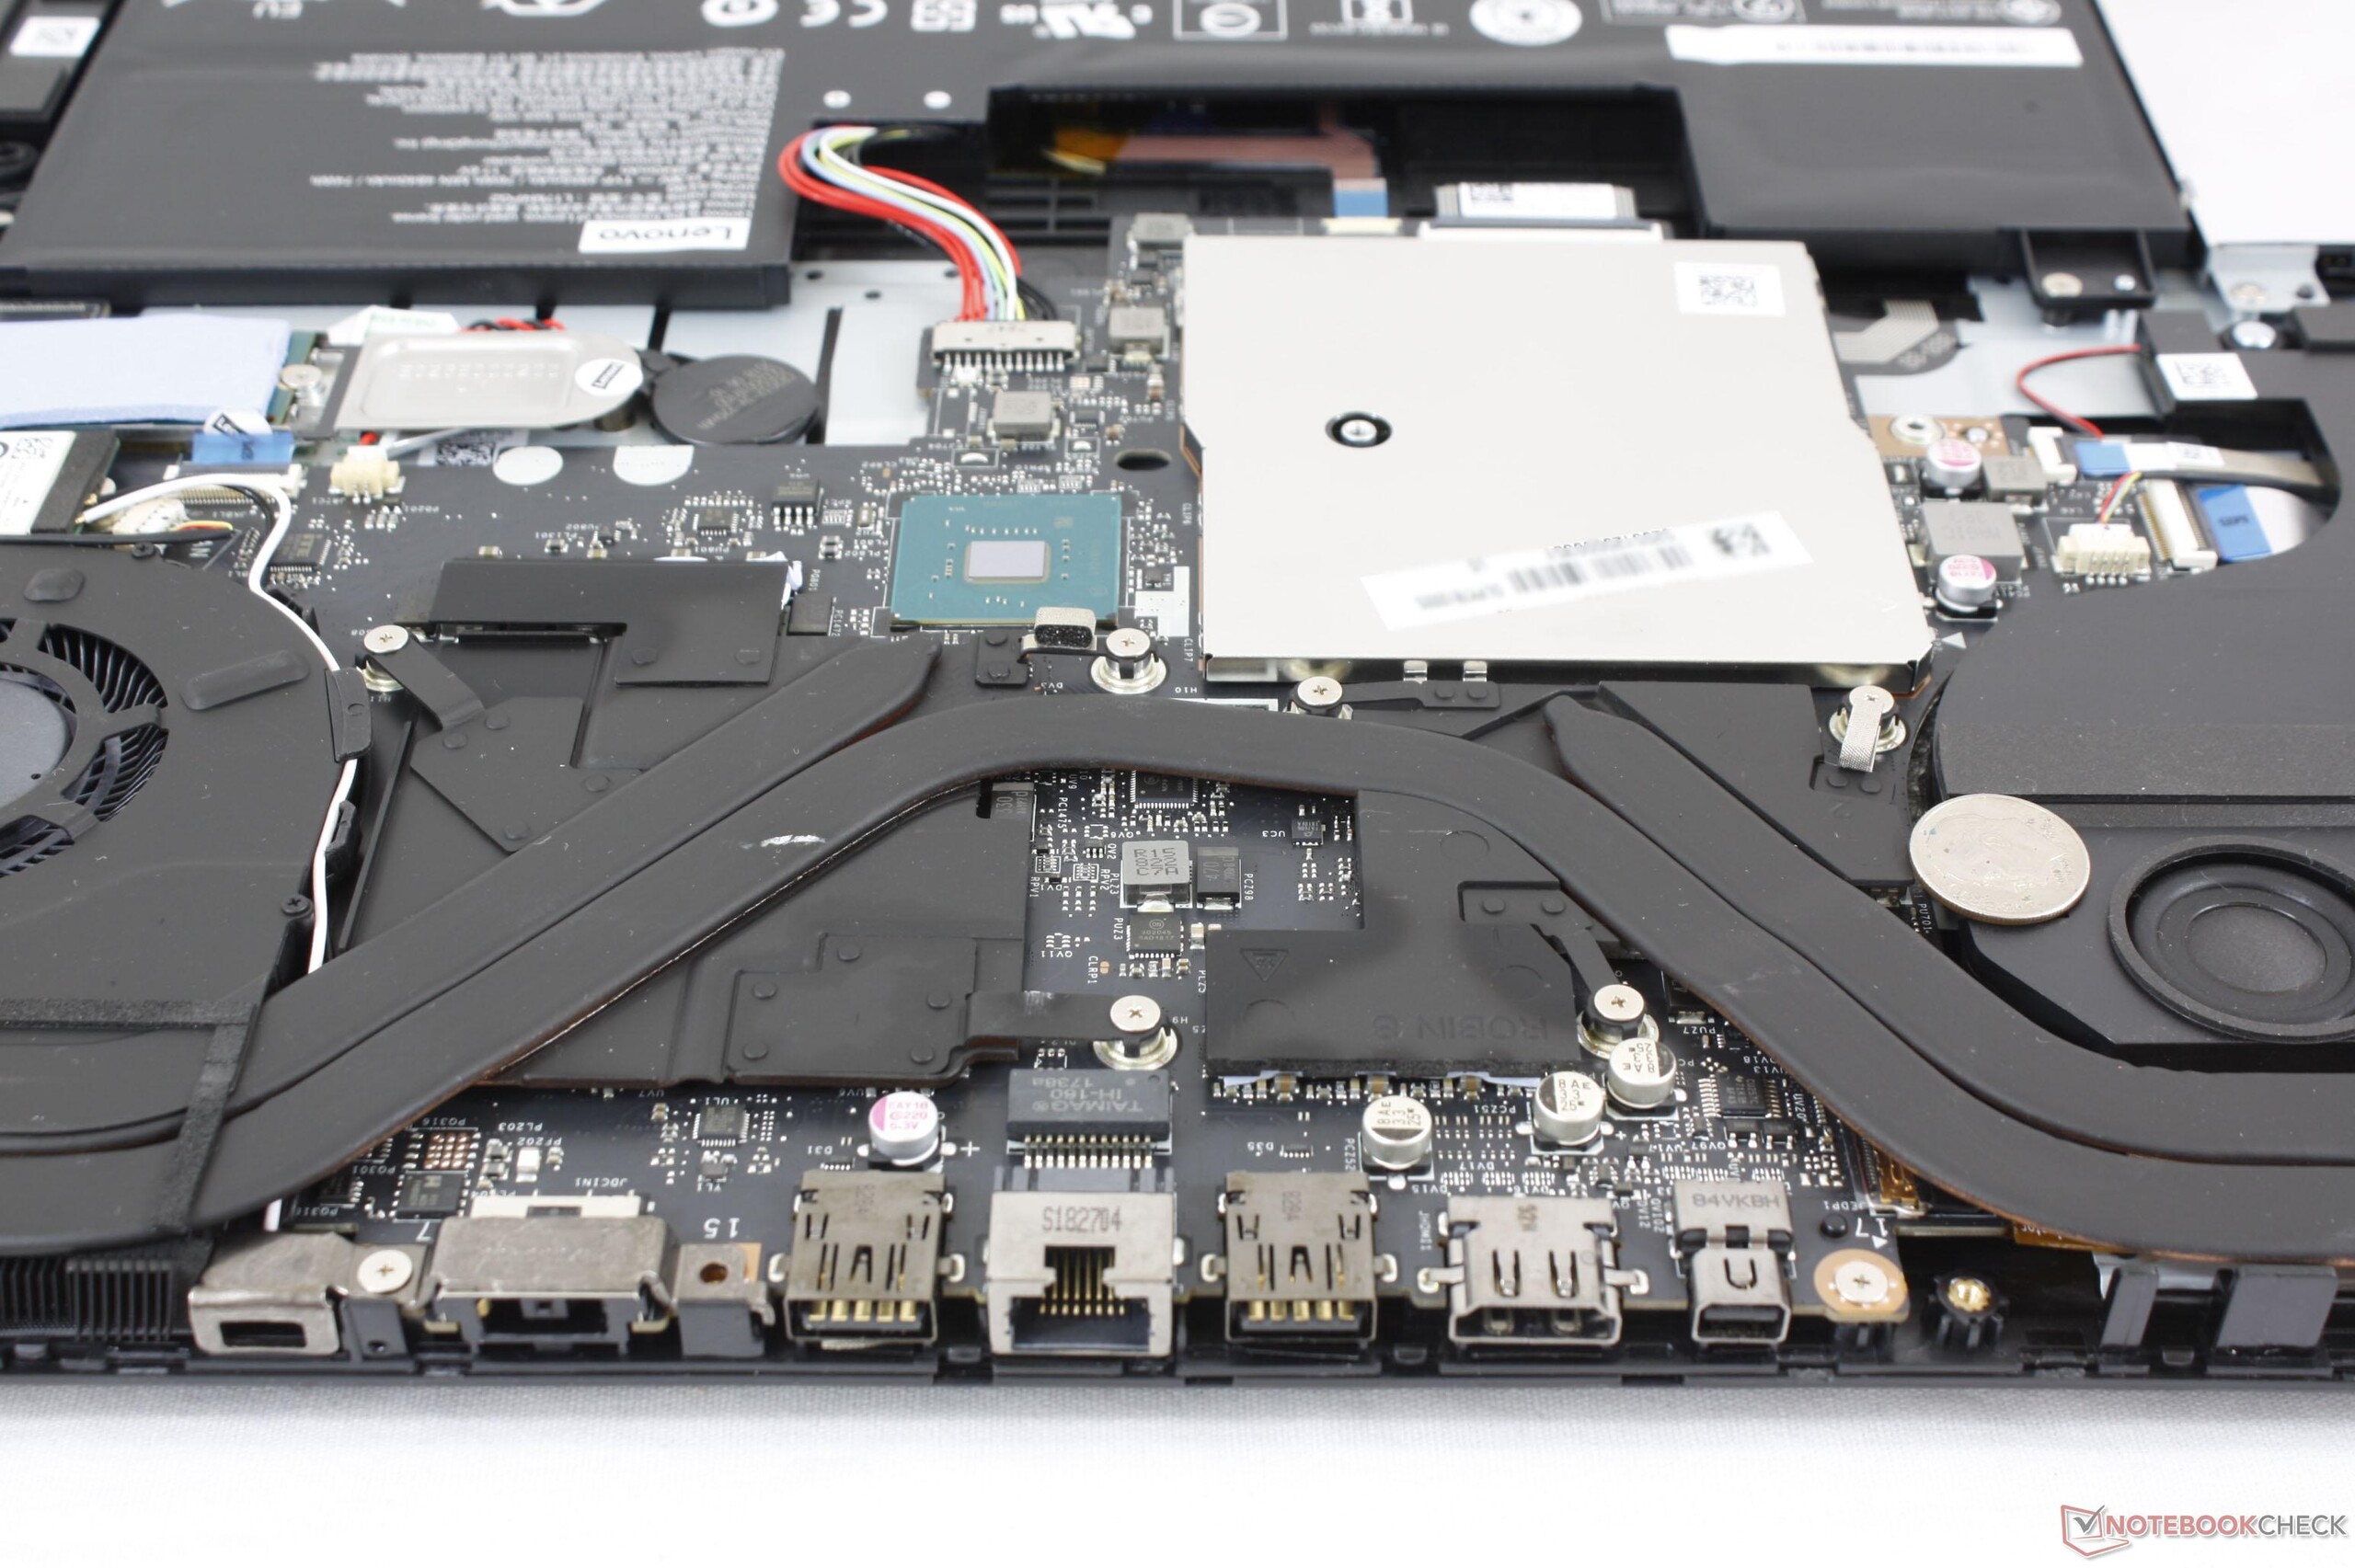
Além do visual, o desempenho também é de primeira qualidade. Sua CPU é capaz de manter velocidades Turbo Boost mais altas por períodos mais longos do que a média do Core i7-8750H e com temperaturas respeitáveis. Na verdade, com as temperaturas do núcleo pairando a apenas 65 °C ou mais baixas nos jogos, a Lenovo poderia ter omitido os ventiladores para uma experiência ainda mais silenciosa. Os alto-falantes são excelentes, os tempos de duração são longos e a tela IPS de 60 Hz padrão é perfeita para a GPU.
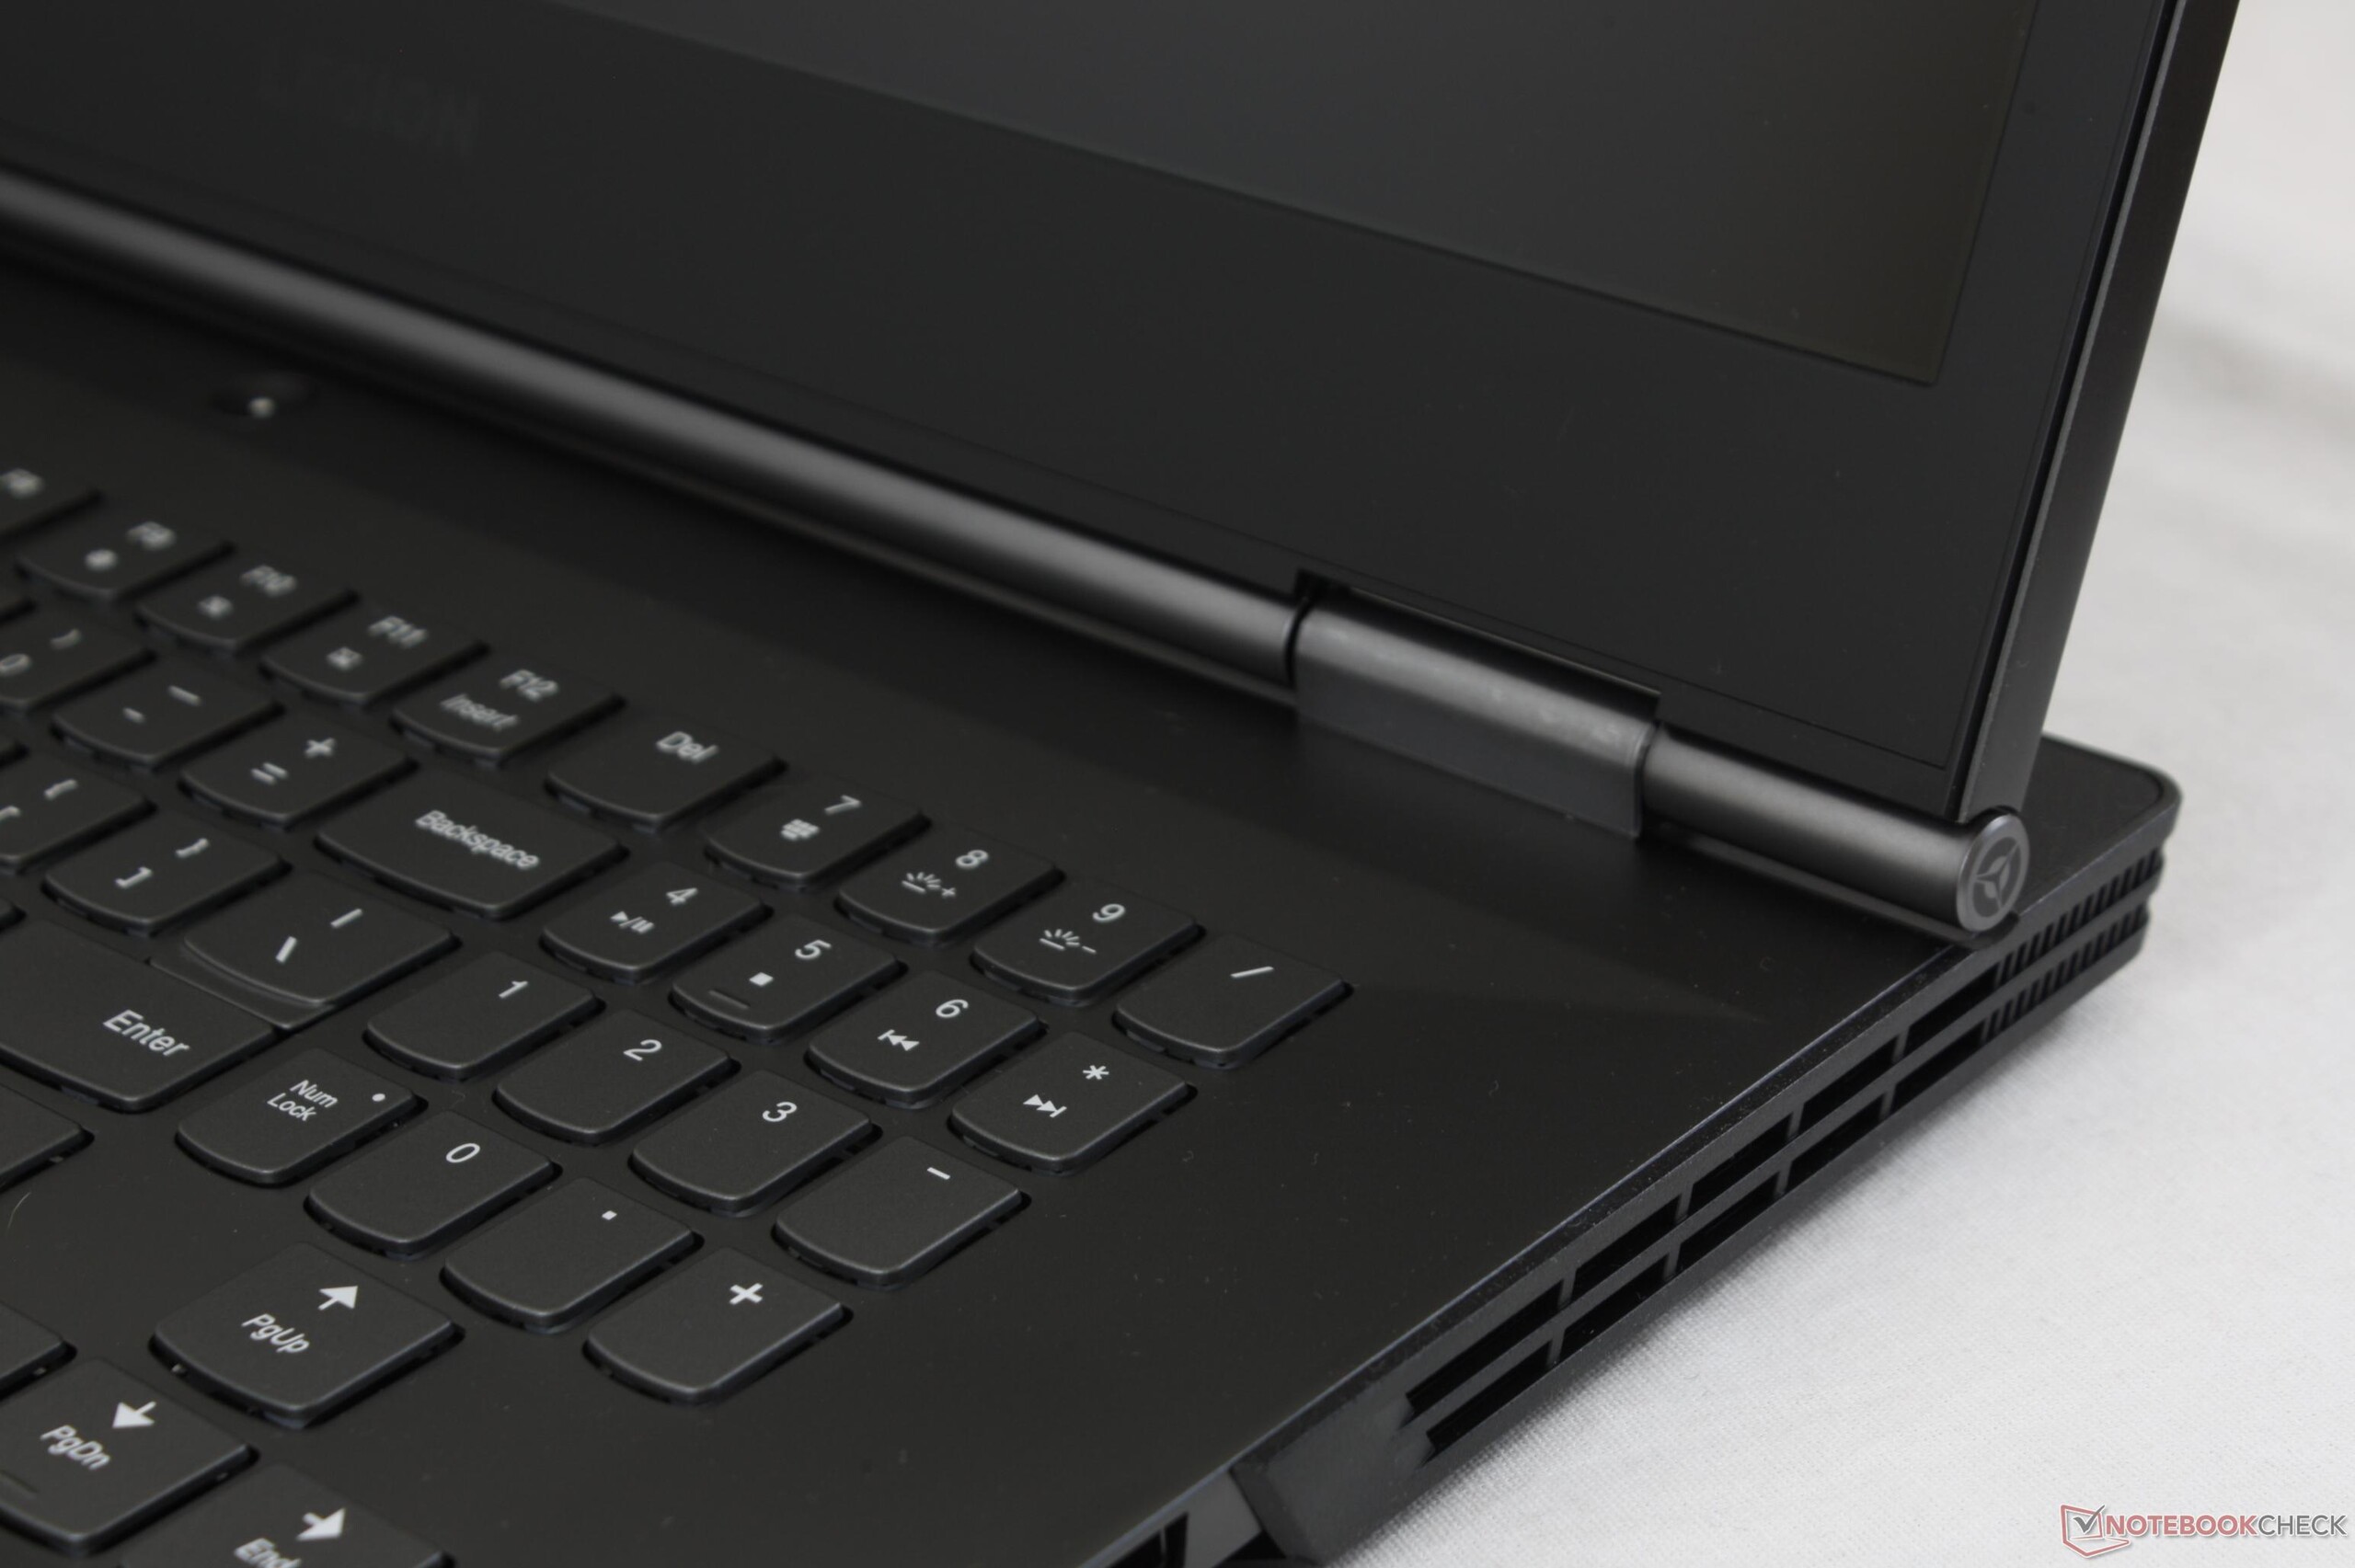
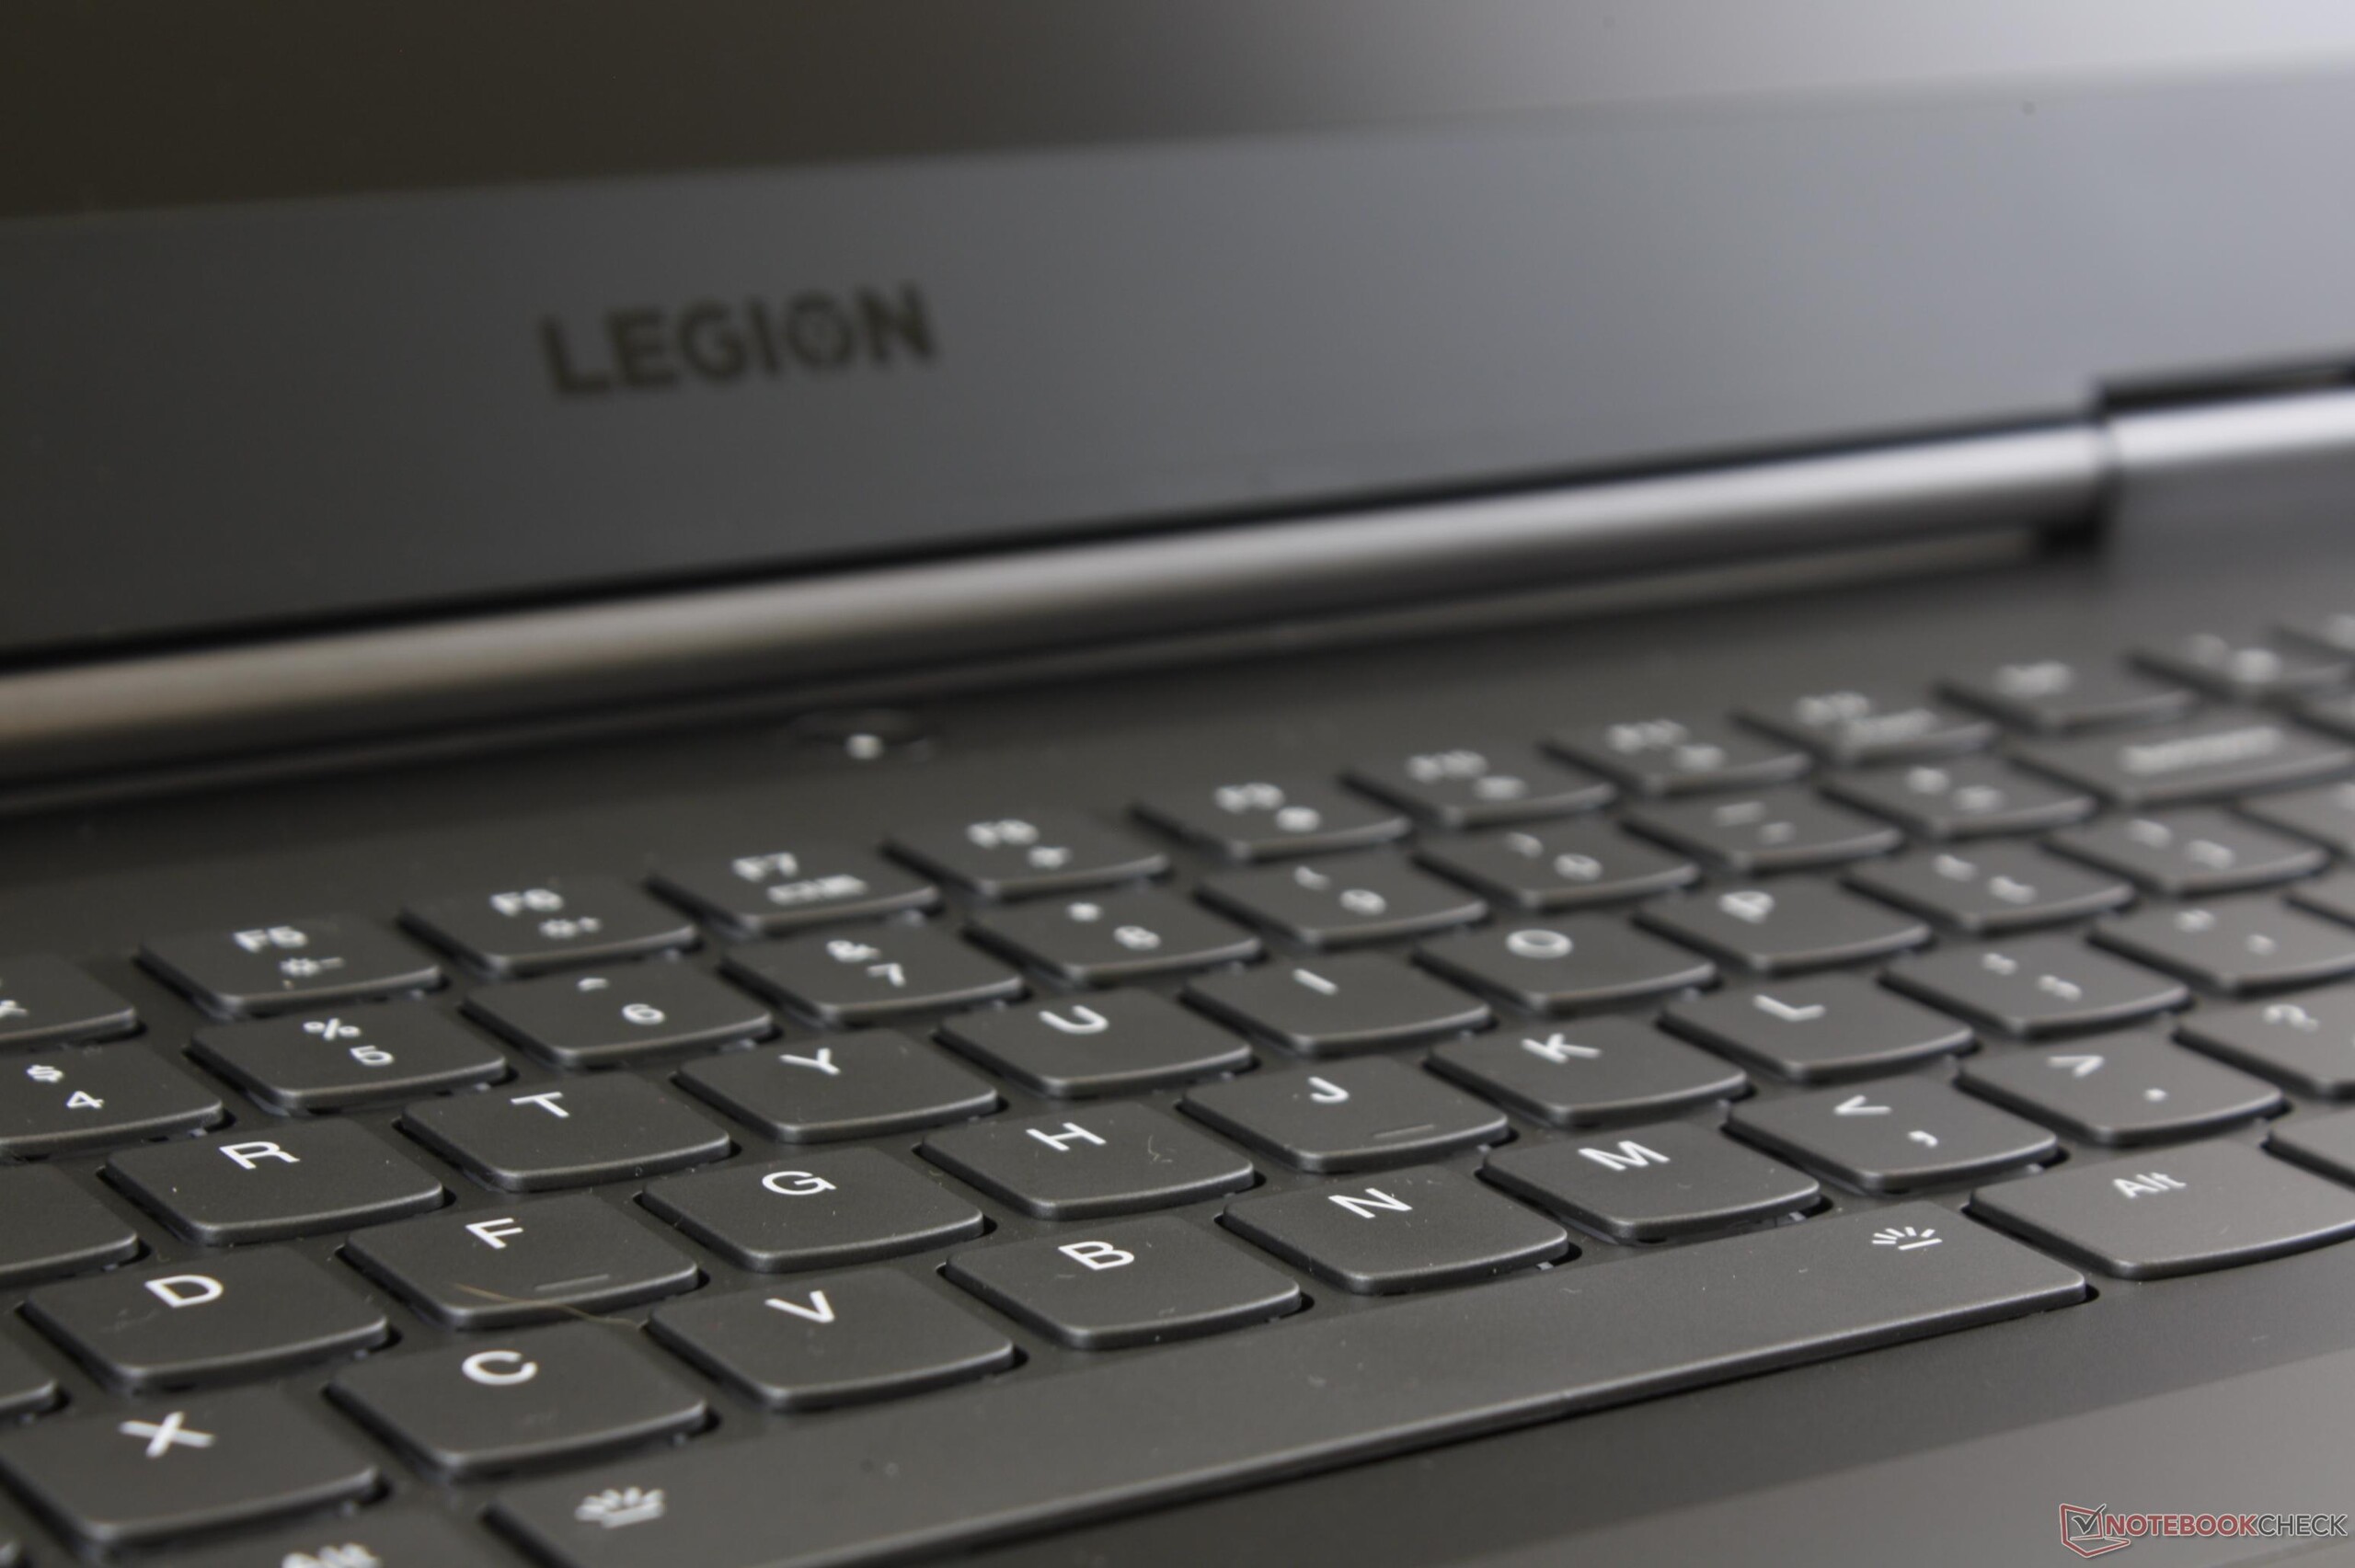
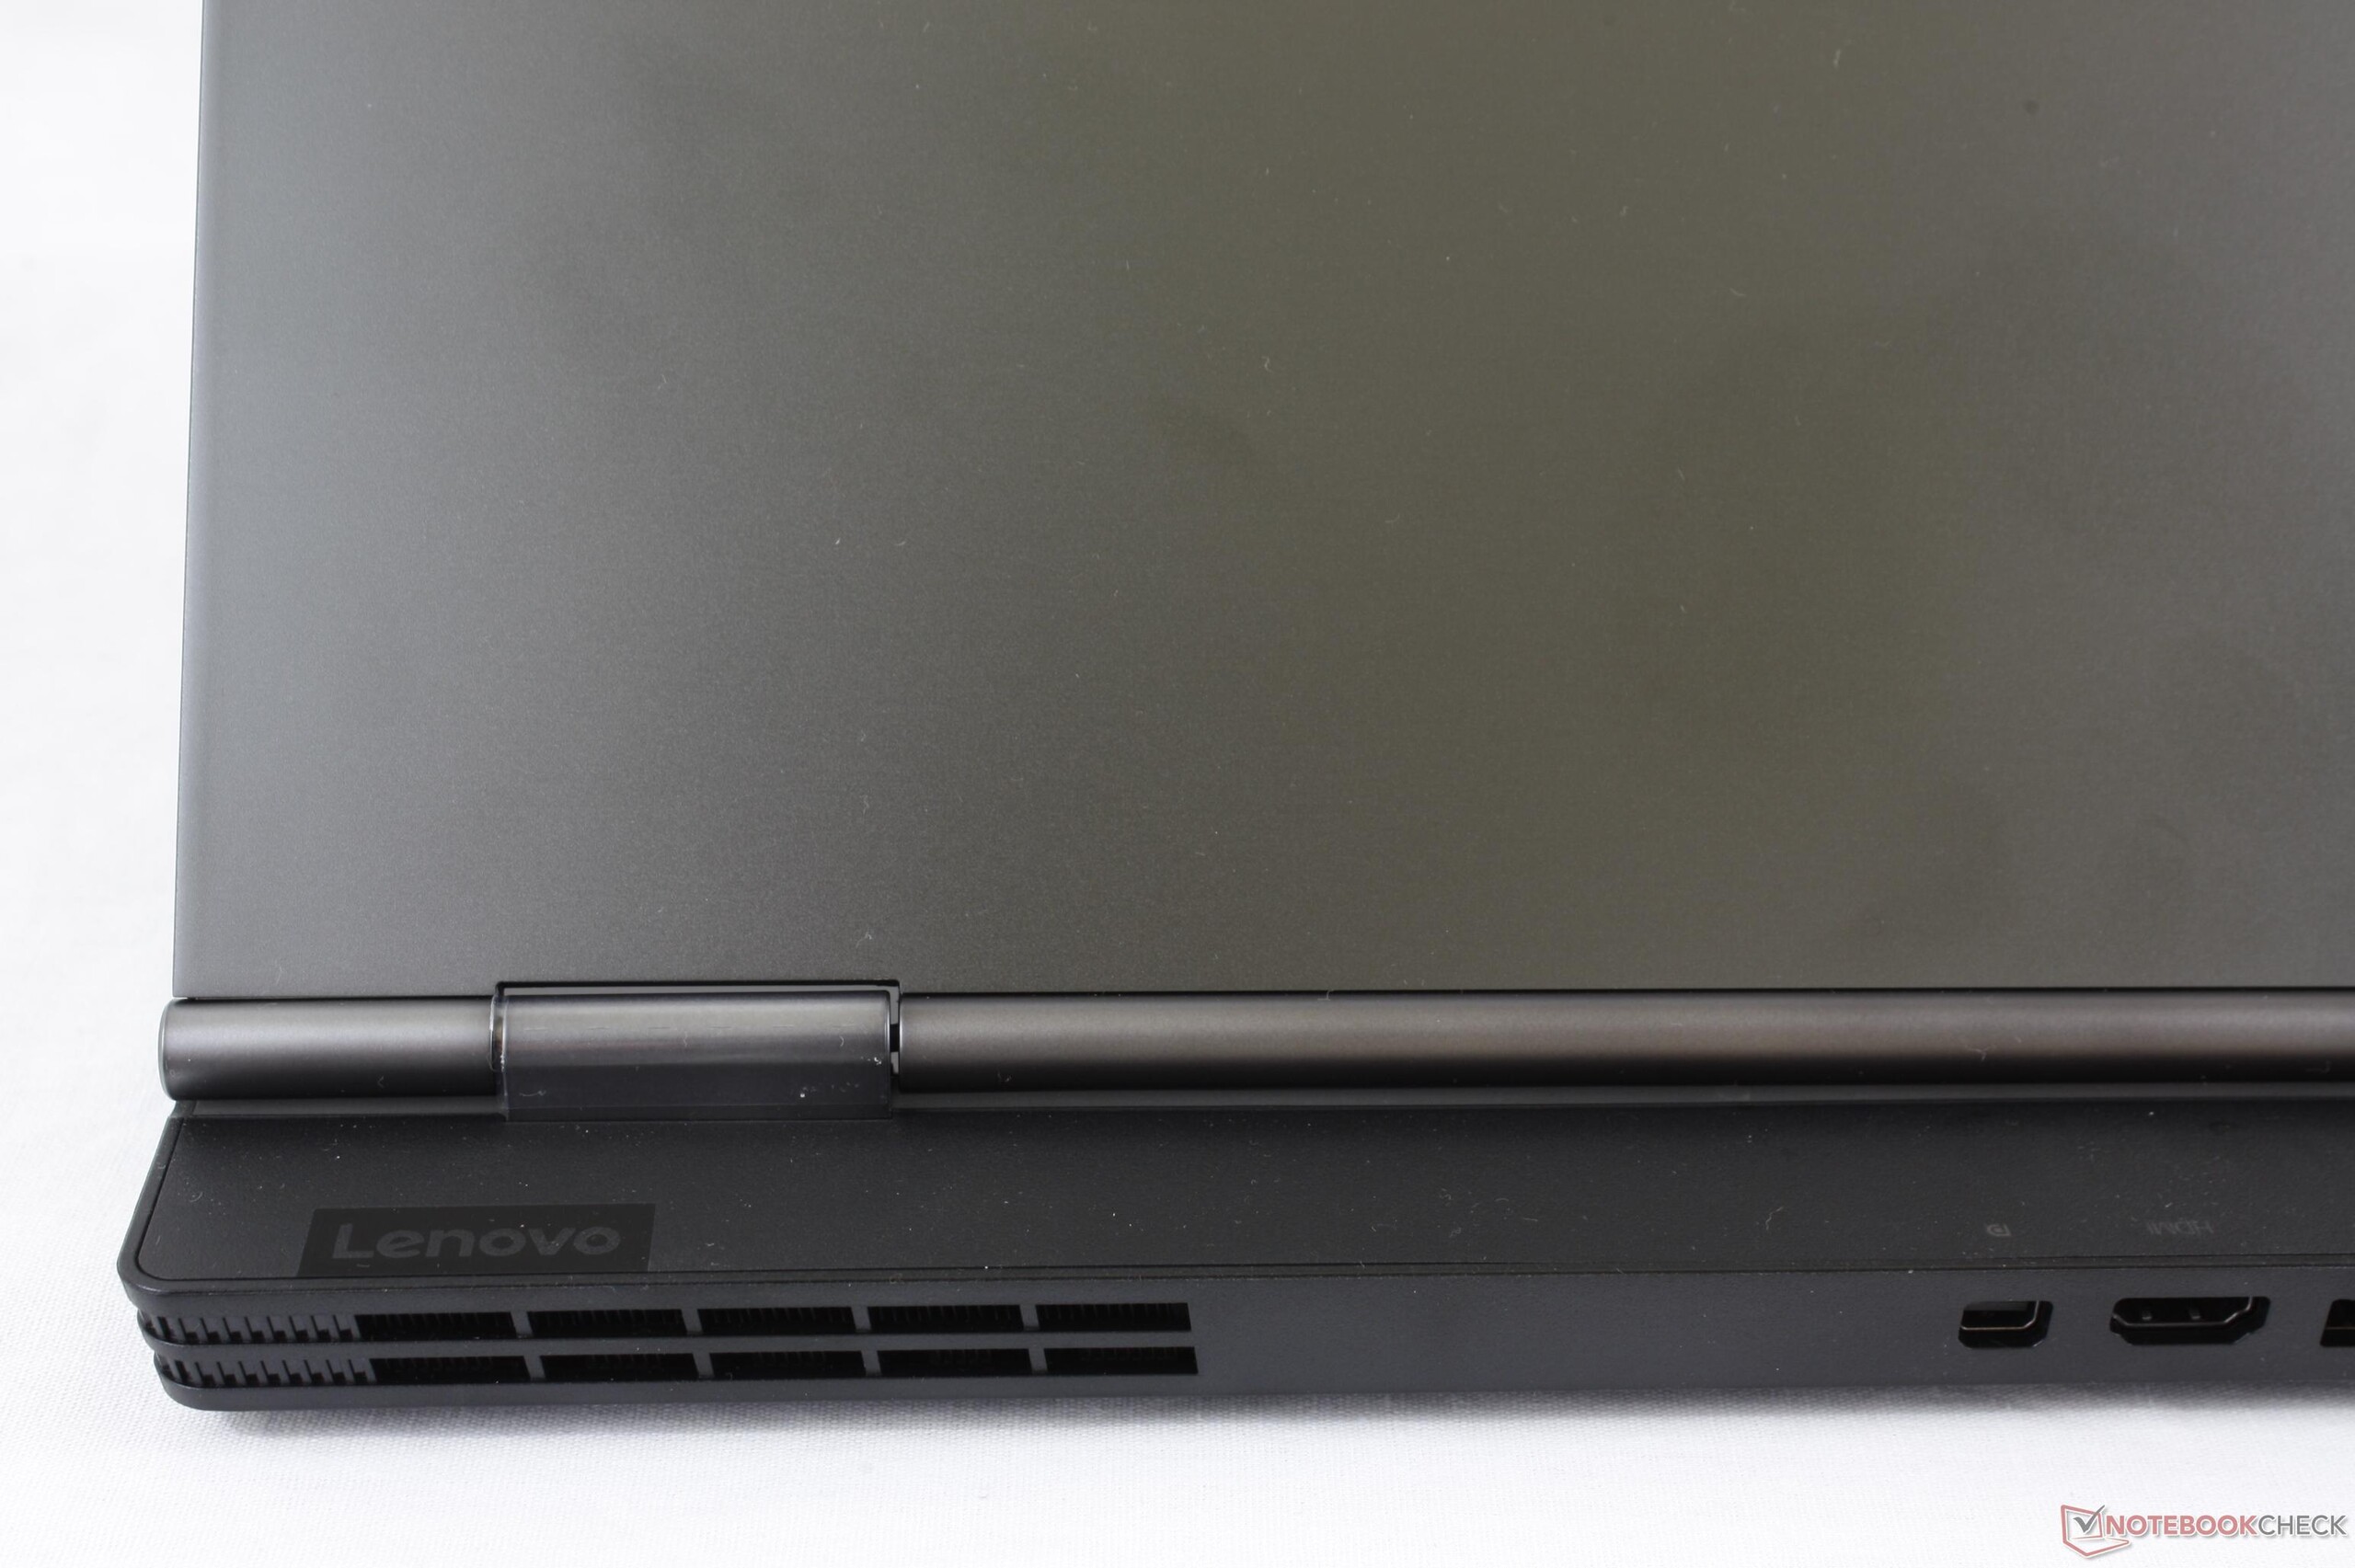
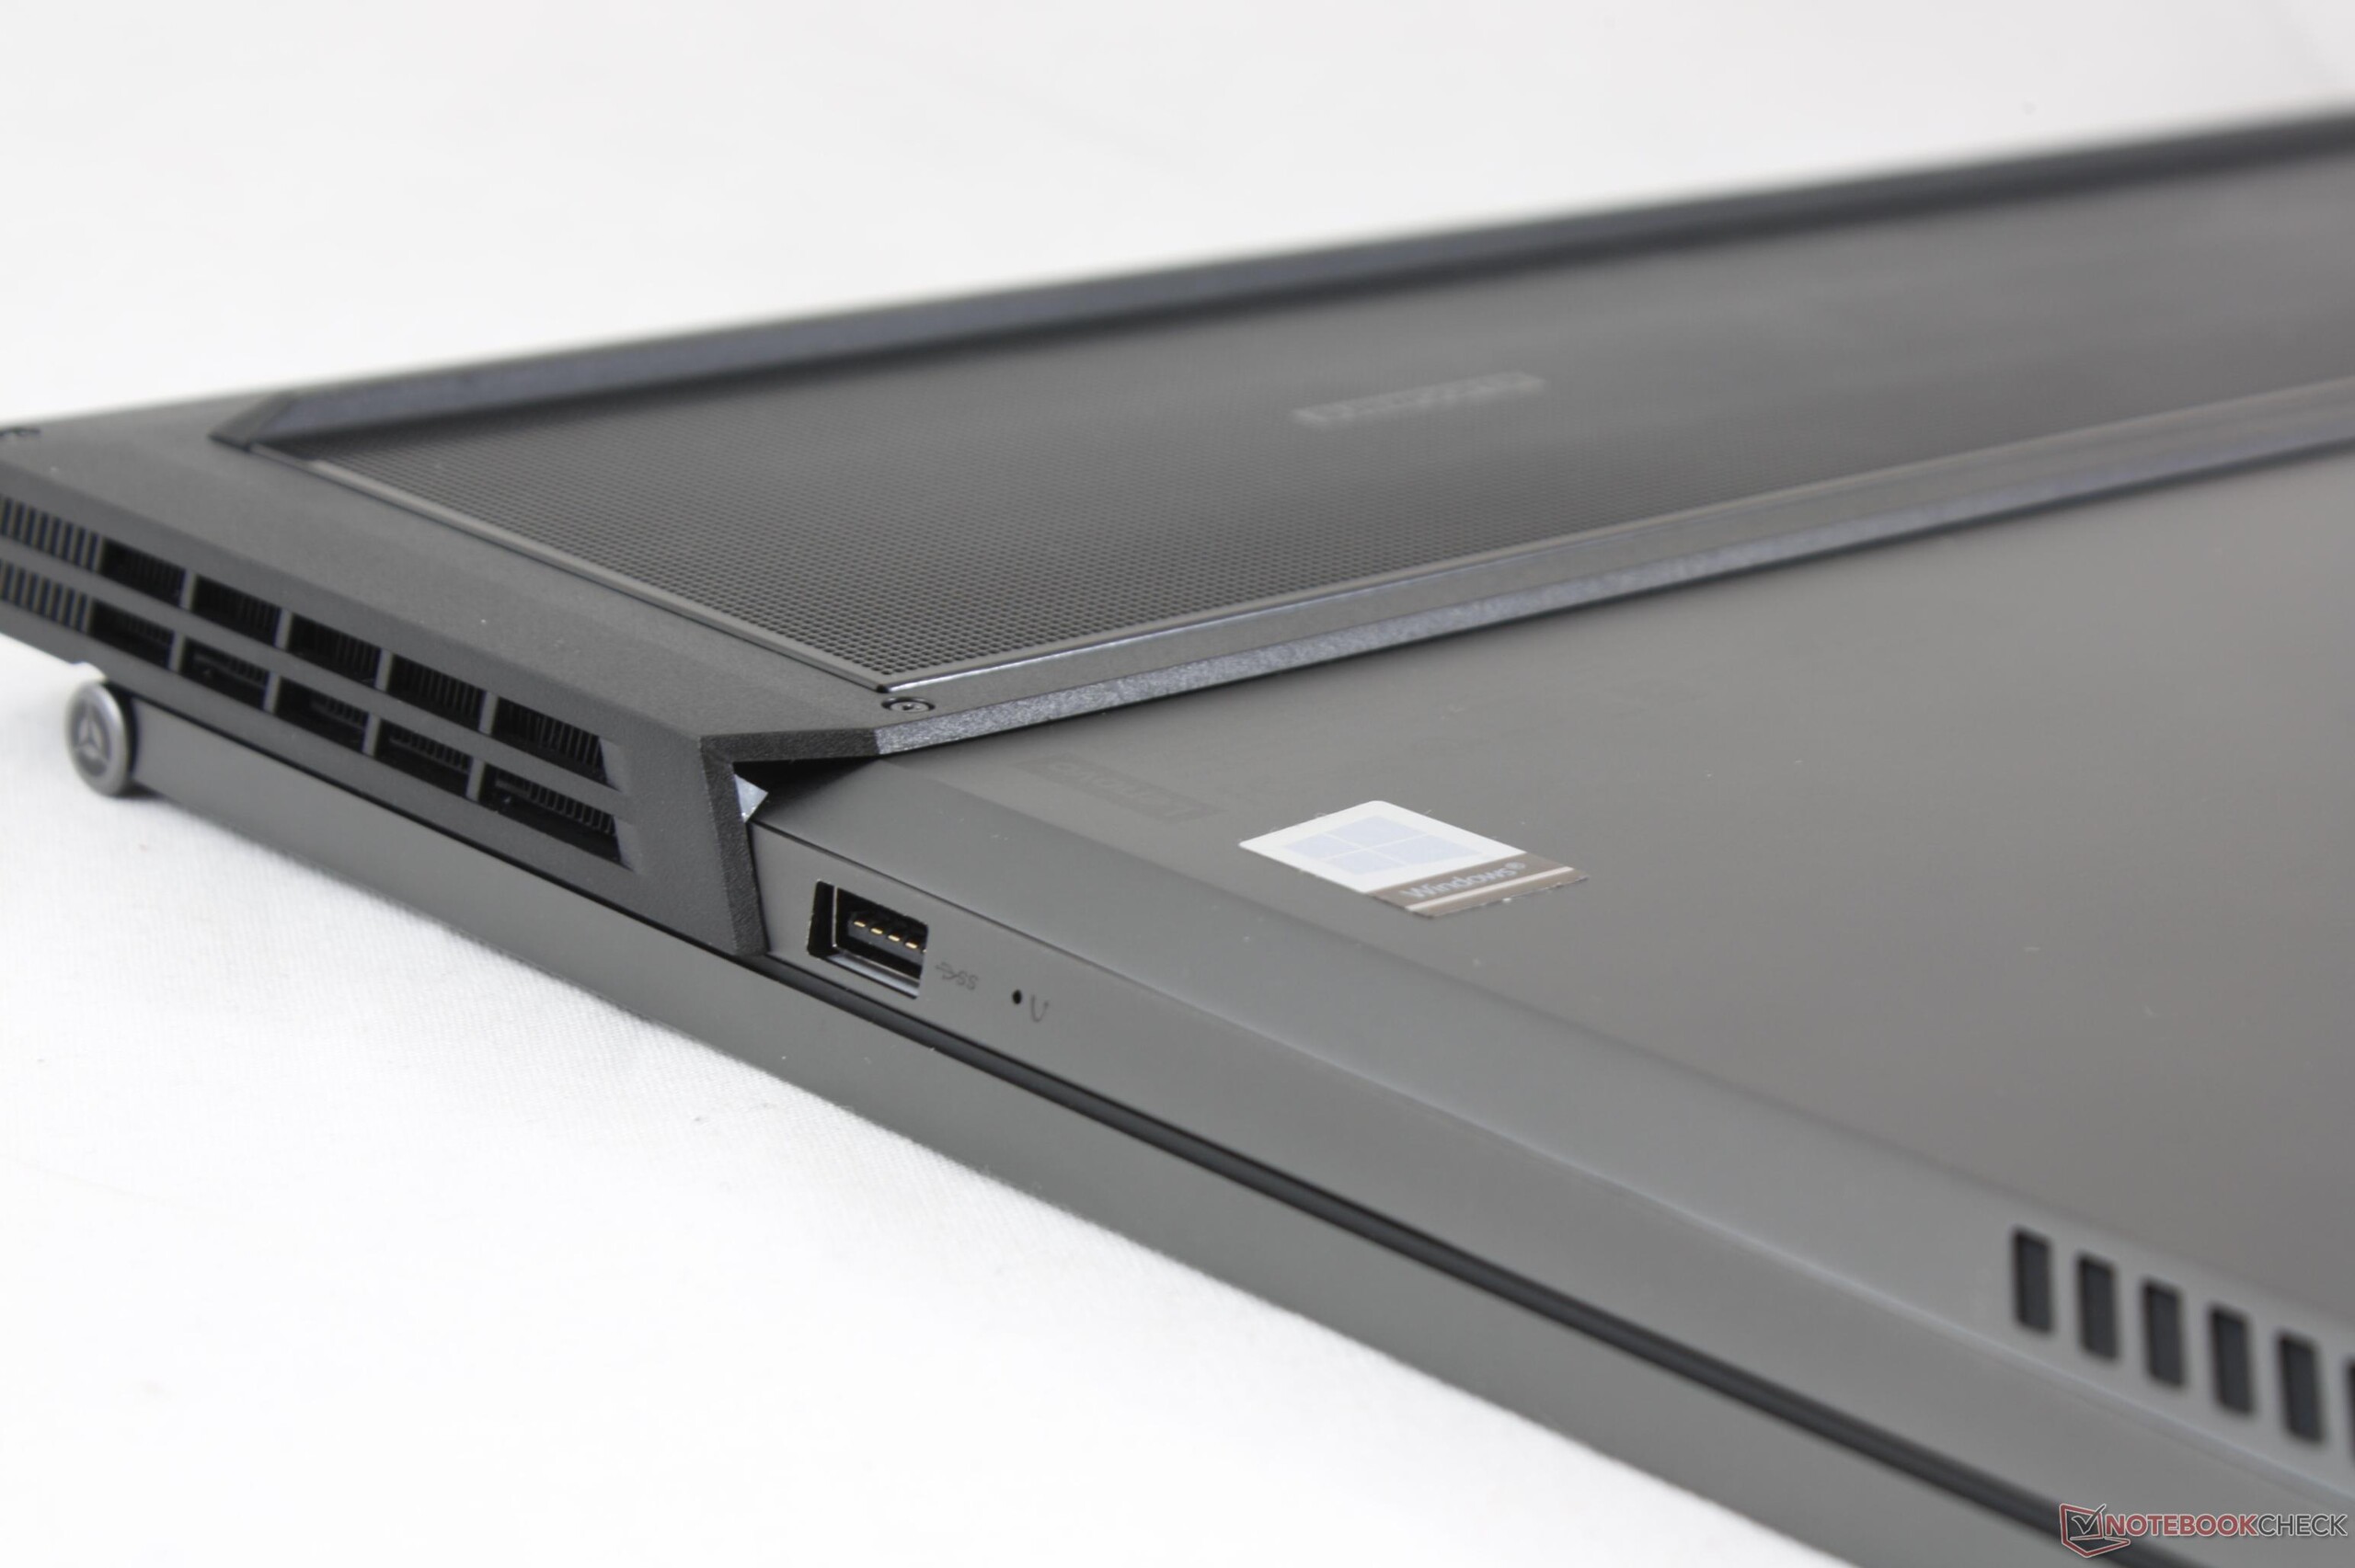
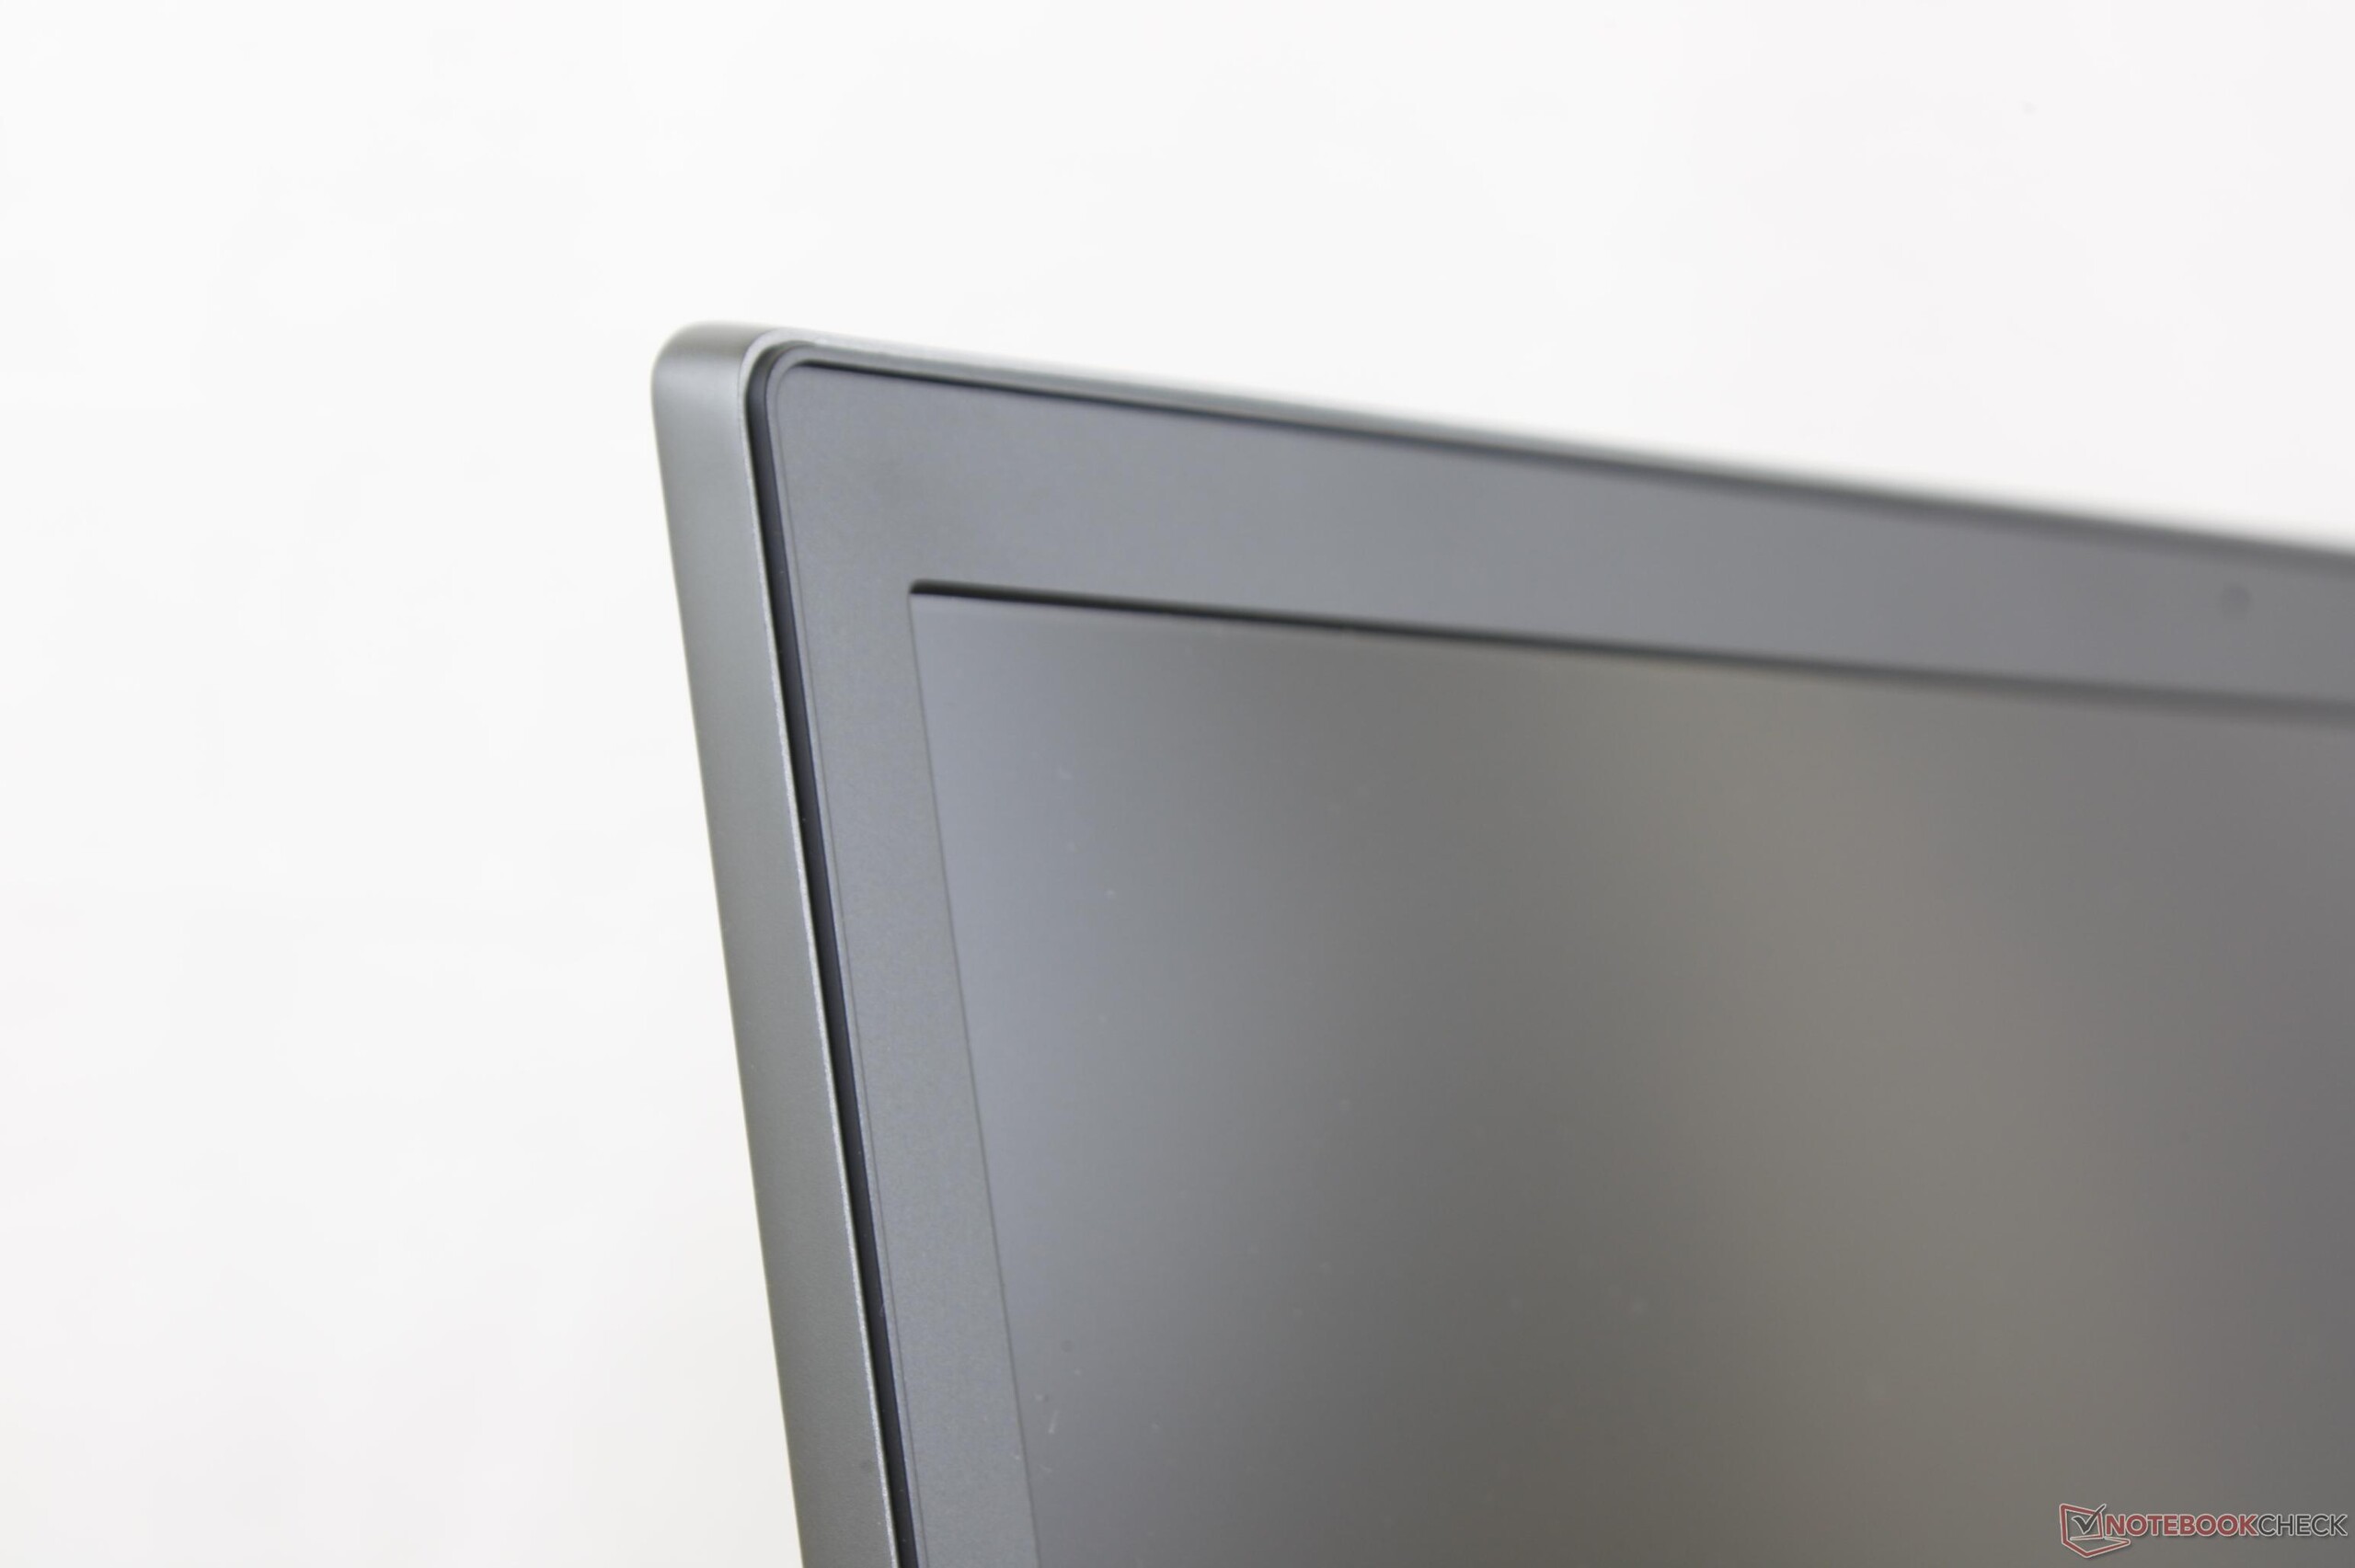
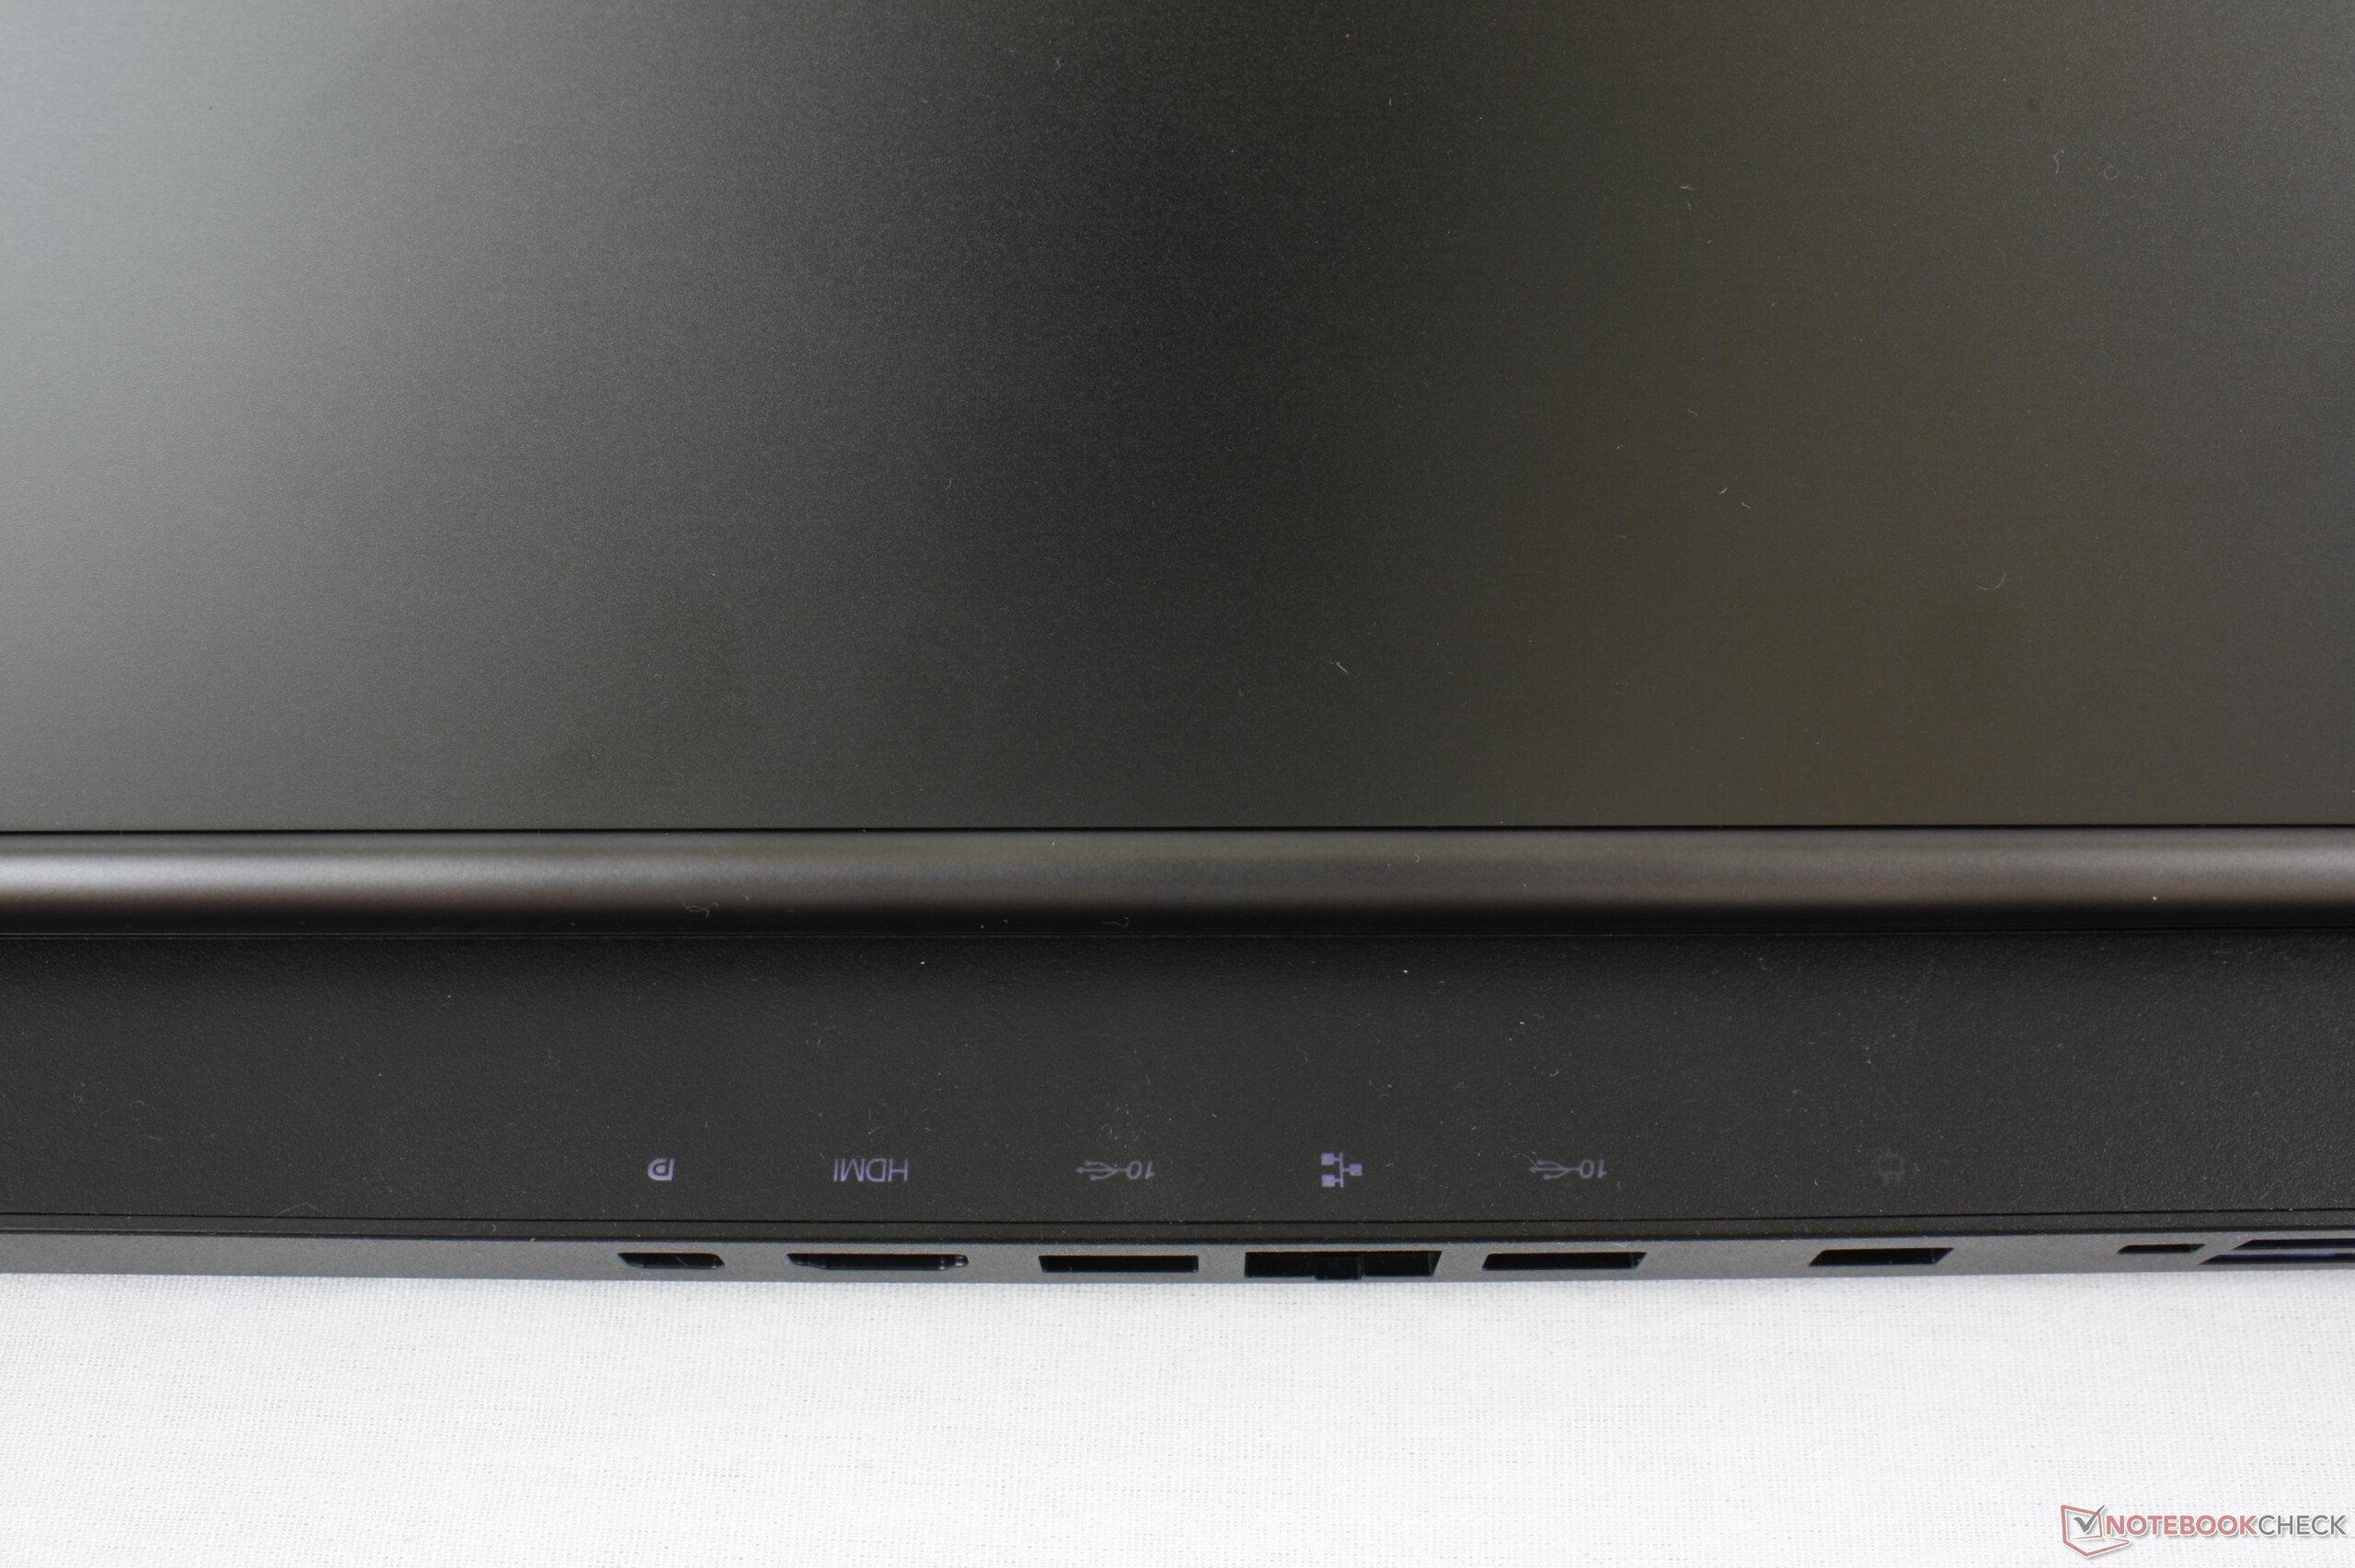
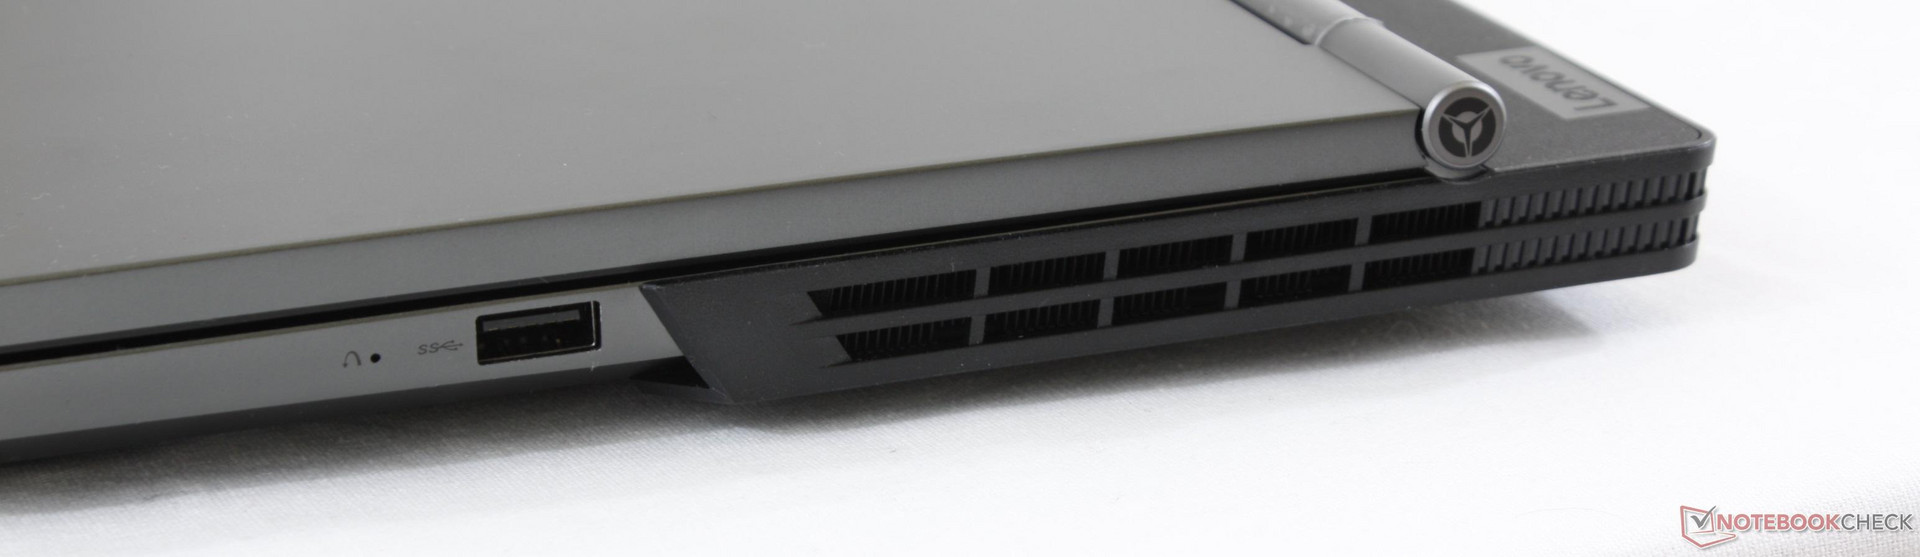
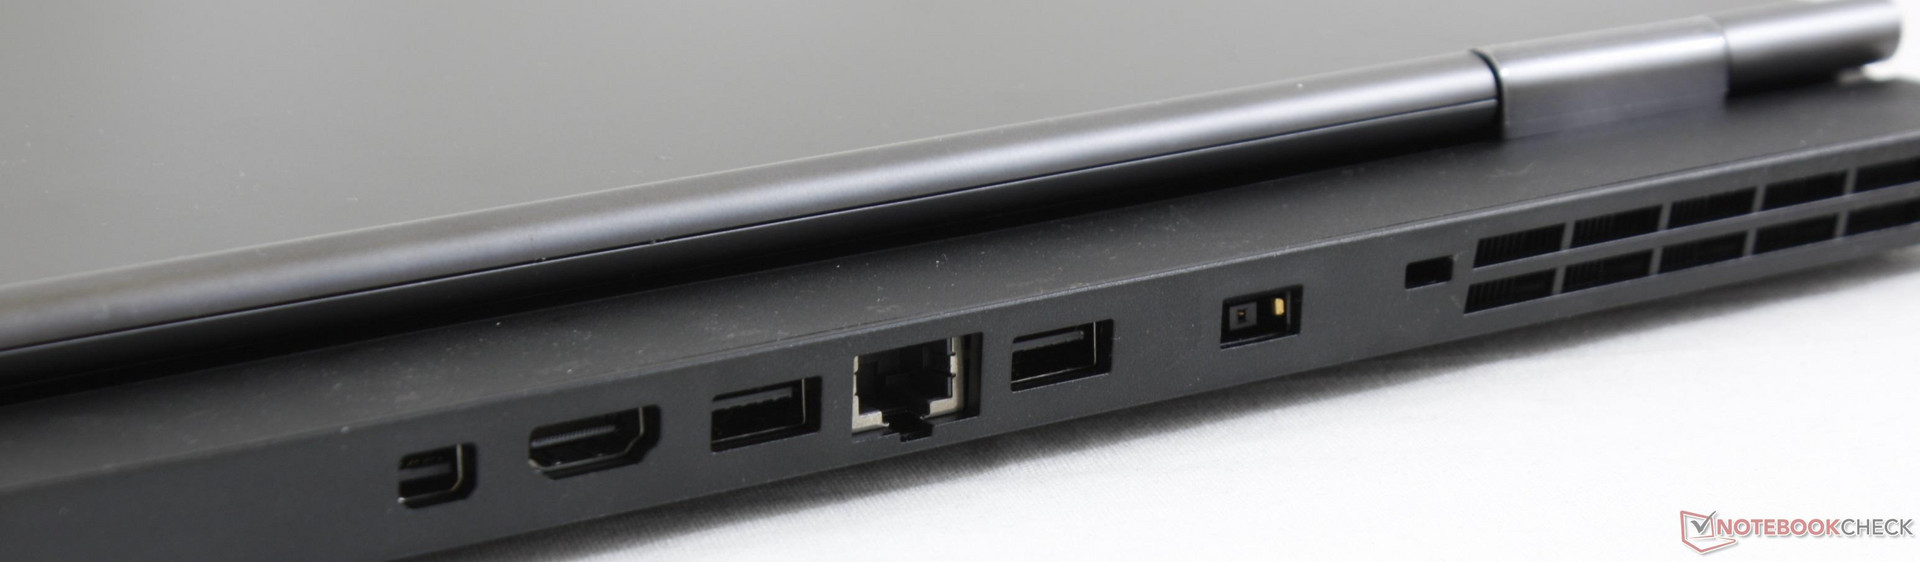
Naturalmente, ainda há muito espaço para melhorias. Controles de ventilador mais personalizados, melhor posicionamento das portas, marcos mais estreitos e resposta mais firme das teclas, tornariam o sistema ainda melhor com o preço inicial de $1.100. As dobradiças mais fortes estão definitivamente no topo da nossa lista, assim como as opções adicionais da GPU, como a GTX 1060 ou a 1060 Max-Q. O potencial está certamente lá para distinguir a série Legion ainda mais do seu portátil de jogos tradicional.
O Legion Y730 equilibra surpreendentemente um visual empresarial casual com recursos de jogos de alta qualidade por um preço inicial mais baixo do que a maioria. Se estiver com um orçamento apertado, o SKU Core i5-8300H de baixo custo é recomendado, pois o i7-8750H não aumentará significativamente o desempenho dos jogos quando combinado com uma GTX 1050 Ti.
Lenovo Legion Y730-17ICH, i7-8750H
- 09/20/2019 v7 (old)
Allen Ngo
Price comparison
