Breve Análise do Portátil Acer Predator Helios 700: Portátil para jogos inovador com muitos recursos
| |||||||||||||||||||||||||
iluminação: 85 %
iluminação com acumulador: 288 cd/m²
Contraste: 1440:1 (Preto: 0.2 cd/m²)
ΔE ColorChecker Calman: 5.79 | ∀{0.5-29.43 Ø4.72}
calibrated: 1.89
ΔE Greyscale Calman: 6.92 | ∀{0.09-98 Ø4.97}
92% sRGB (Argyll 1.6.3 3D)
60% AdobeRGB 1998 (Argyll 1.6.3 3D)
65.5% AdobeRGB 1998 (Argyll 3D)
92.1% sRGB (Argyll 3D)
64.4% Display P3 (Argyll 3D)
Gamma: 2.46
CCT: 8433 K
| Acer Predator Helios 700 PH717-71-785M AU Optronics B173HAN03.1 (AUO319D), IPS, 1920x1080 | HP Omen 17-cb0020ng CMN175D, IPS, 1920x1080 | MSI GE75 9SG Chi Mei N173HCE-G33, AHVA, 1920x1080 | MSI GT76 Titan DT 9SG Chi Mei N173HCE-G33 (CMN175C), IPS, 1920x1080 | Schenker XMG Ultra 17 Turing AU Optronics B173ZAN01.0 (AUO109B), IPS, 3840x2160 | Alienware Area-51m i9-9900K RTX 2080 LG Philips 173WFG, IPS, 1920x1080 | |
|---|---|---|---|---|---|---|
| Display | 1% | -3% | -1% | 31% | 3% | |
| Display P3 Coverage (%) | 64.4 | 63.7 -1% | 61.5 -5% | 62.3 -3% | 86.3 34% | 66.3 3% |
| sRGB Coverage (%) | 92.1 | 96 4% | 92 0% | 93.4 1% | 100 9% | 96.9 5% |
| AdobeRGB 1998 Coverage (%) | 65.5 | 65.8 0% | 63.5 -3% | 64.3 -2% | 99.1 51% | 66.5 2% |
| Response Times | -1% | 50% | 33% | -117% | 14% | |
| Response Time Grey 50% / Grey 80% * (ms) | 16.8 ? | 17.6 ? -5% | 7.2 ? 57% | 8 ? 52% | 41.6 ? -148% | 13.2 ? 21% |
| Response Time Black / White * (ms) | 11.6 ? | 11.2 ? 3% | 6.6 ? 43% | 10 ? 14% | 21.6 ? -86% | 10.8 ? 7% |
| PWM Frequency (Hz) | 25510 ? | 26040 ? | 26040 ? | |||
| Screen | 26% | 22% | 23% | 11% | -6% | |
| Brightness middle (cd/m²) | 288 | 360 25% | 400.7 39% | 396 38% | 343 19% | 335.2 16% |
| Brightness (cd/m²) | 271 | 342 26% | 372 37% | 373 38% | 328 21% | 297 10% |
| Brightness Distribution (%) | 85 | 91 7% | 89 5% | 89 5% | 82 -4% | 82 -4% |
| Black Level * (cd/m²) | 0.2 | 0.26 -30% | 0.34 -70% | 0.33 -65% | 0.31 -55% | 0.66 -230% |
| Contrast (:1) | 1440 | 1385 -4% | 1179 -18% | 1200 -17% | 1106 -23% | 508 -65% |
| Colorchecker dE 2000 * | 5.79 | 1.91 67% | 1.33 77% | 2.04 65% | 5.03 13% | 2.02 65% |
| Colorchecker dE 2000 max. * | 11.89 | 4.08 66% | 3.51 70% | 3.85 68% | 7.91 33% | 7.23 39% |
| Colorchecker dE 2000 calibrated * | 1.89 | 0.78 59% | 1.39 26% | 0.82 57% | 0.86 54% | 1.17 38% |
| Greyscale dE 2000 * | 6.92 | 2.72 61% | 1.3 81% | 2.83 59% | 6.29 9% | 3.2 54% |
| Gamma | 2.46 89% | 2.37 93% | 2.24 98% | 2.49 88% | 2.38 92% | 2.16 102% |
| CCT | 8433 77% | 6692 97% | 6735 97% | 7113 91% | 6389 102% | 6746 96% |
| Color Space (Percent of AdobeRGB 1998) (%) | 60 | 60 0% | 58.2 -3% | 59 -2% | 88 47% | 61.3 2% |
| Color Space (Percent of sRGB) (%) | 92 | 96 4% | 92.1 0% | 94 2% | 100 9% | 96.9 5% |
| Média Total (Programa/Configurações) | 9% /
18% | 23% /
21% | 18% /
19% | -25% /
-1% | 4% /
-2% |
* ... menor é melhor
Exibir tempos de resposta
| ↔ Tempo de resposta preto para branco | ||
|---|---|---|
| 11.6 ms ... ascensão ↗ e queda ↘ combinadas | ↗ 6 ms ascensão | 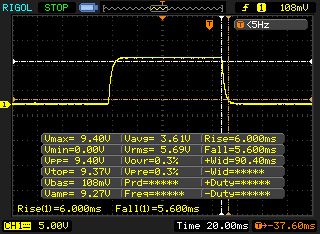 |
| ↘ 5.6 ms queda | ||
| A tela mostra boas taxas de resposta em nossos testes, mas pode ser muito lenta para jogadores competitivos. Em comparação, todos os dispositivos testados variam de 0.1 (mínimo) a 240 (máximo) ms. » 31 % de todos os dispositivos são melhores. Isso significa que o tempo de resposta medido é melhor que a média de todos os dispositivos testados (19.8 ms). | ||
| ↔ Tempo de resposta 50% cinza a 80% cinza | ||
| 16.8 ms ... ascensão ↗ e queda ↘ combinadas | ↗ 8.4 ms ascensão | 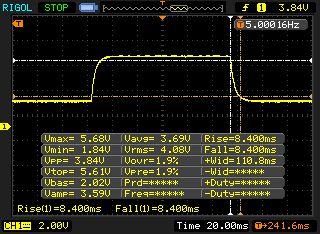 |
| ↘ 8.4 ms queda | ||
| A tela mostra boas taxas de resposta em nossos testes, mas pode ser muito lenta para jogadores competitivos. Em comparação, todos os dispositivos testados variam de 0.165 (mínimo) a 636 (máximo) ms. » 31 % de todos os dispositivos são melhores. Isso significa que o tempo de resposta medido é melhor que a média de todos os dispositivos testados (31 ms). | ||
Cintilação da tela / PWM (modulação por largura de pulso)
| Tela tremeluzindo / PWM não detectado | 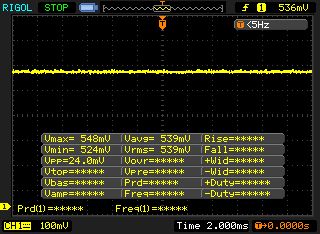 | ||
[pwm_comparison] Em comparação: 52 % de todos os dispositivos testados não usam PWM para escurecer a tela. Se PWM foi detectado, uma média de 7763 (mínimo: 5 - máximo: 343500) Hz foi medida. | |||
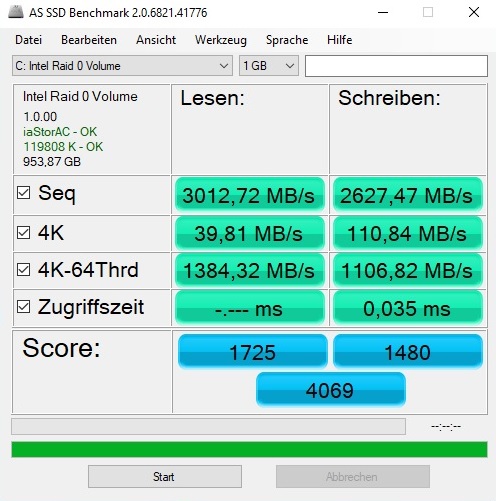
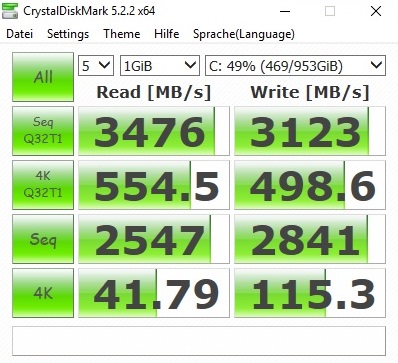
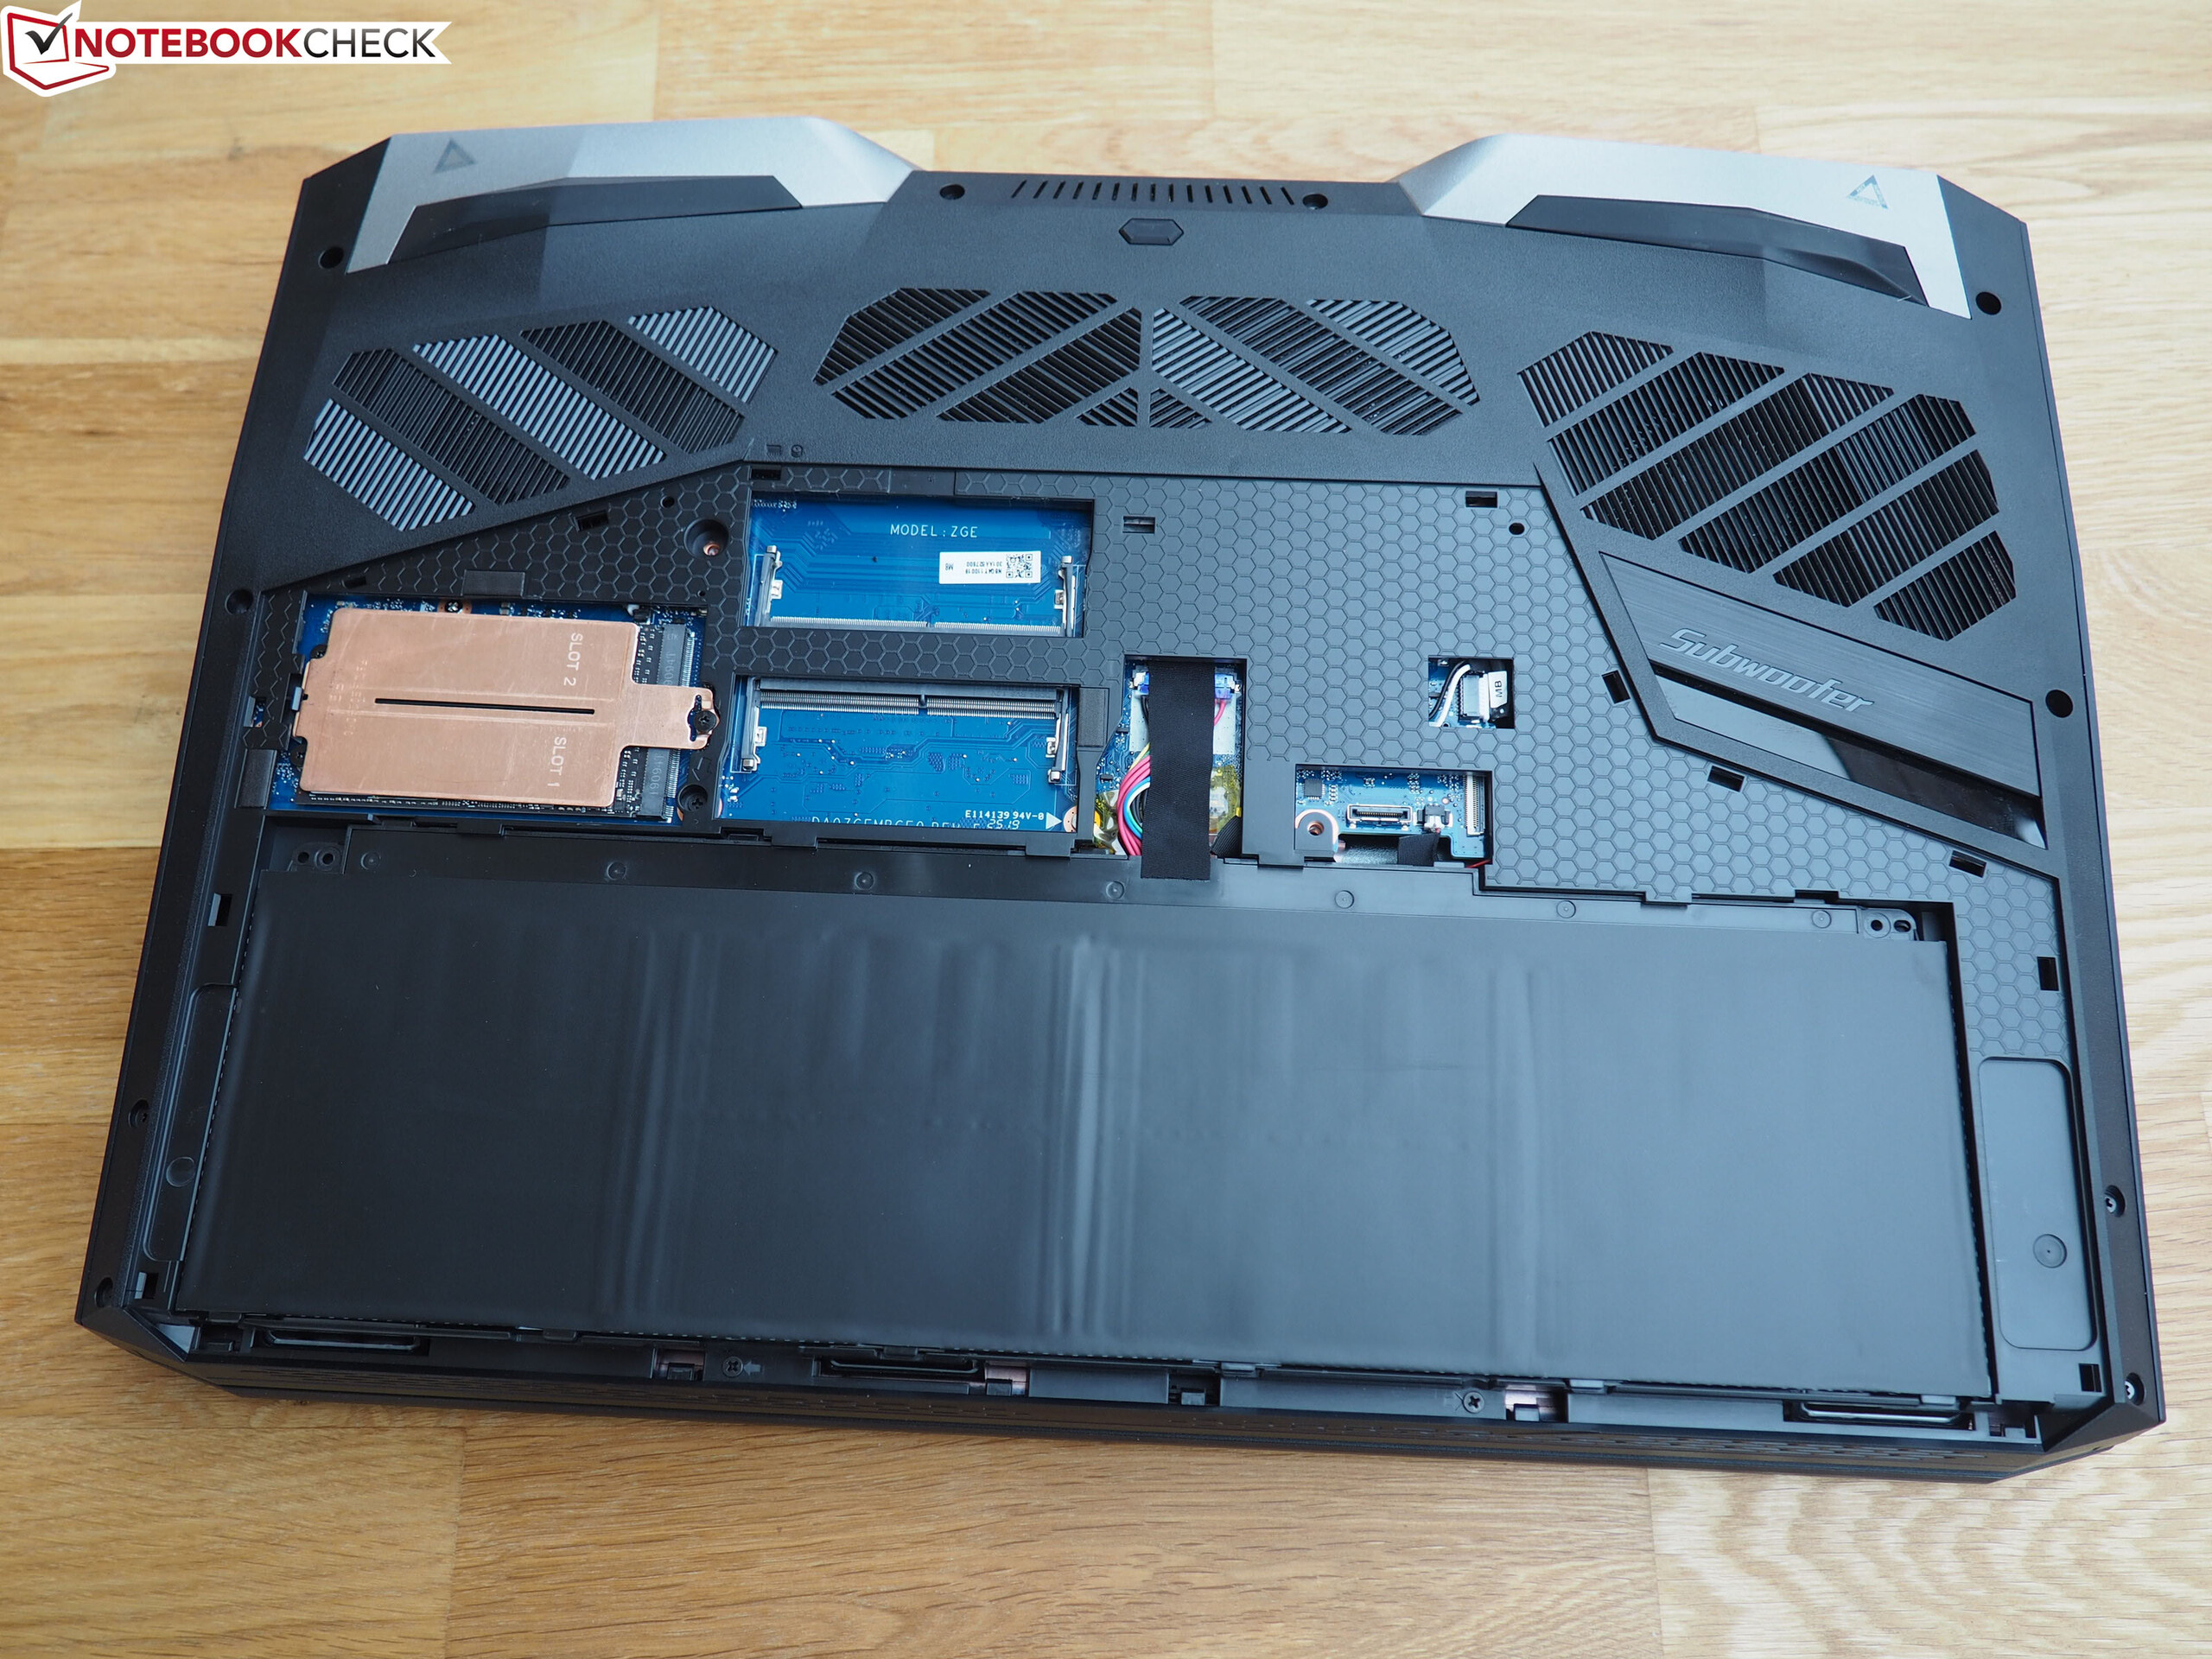
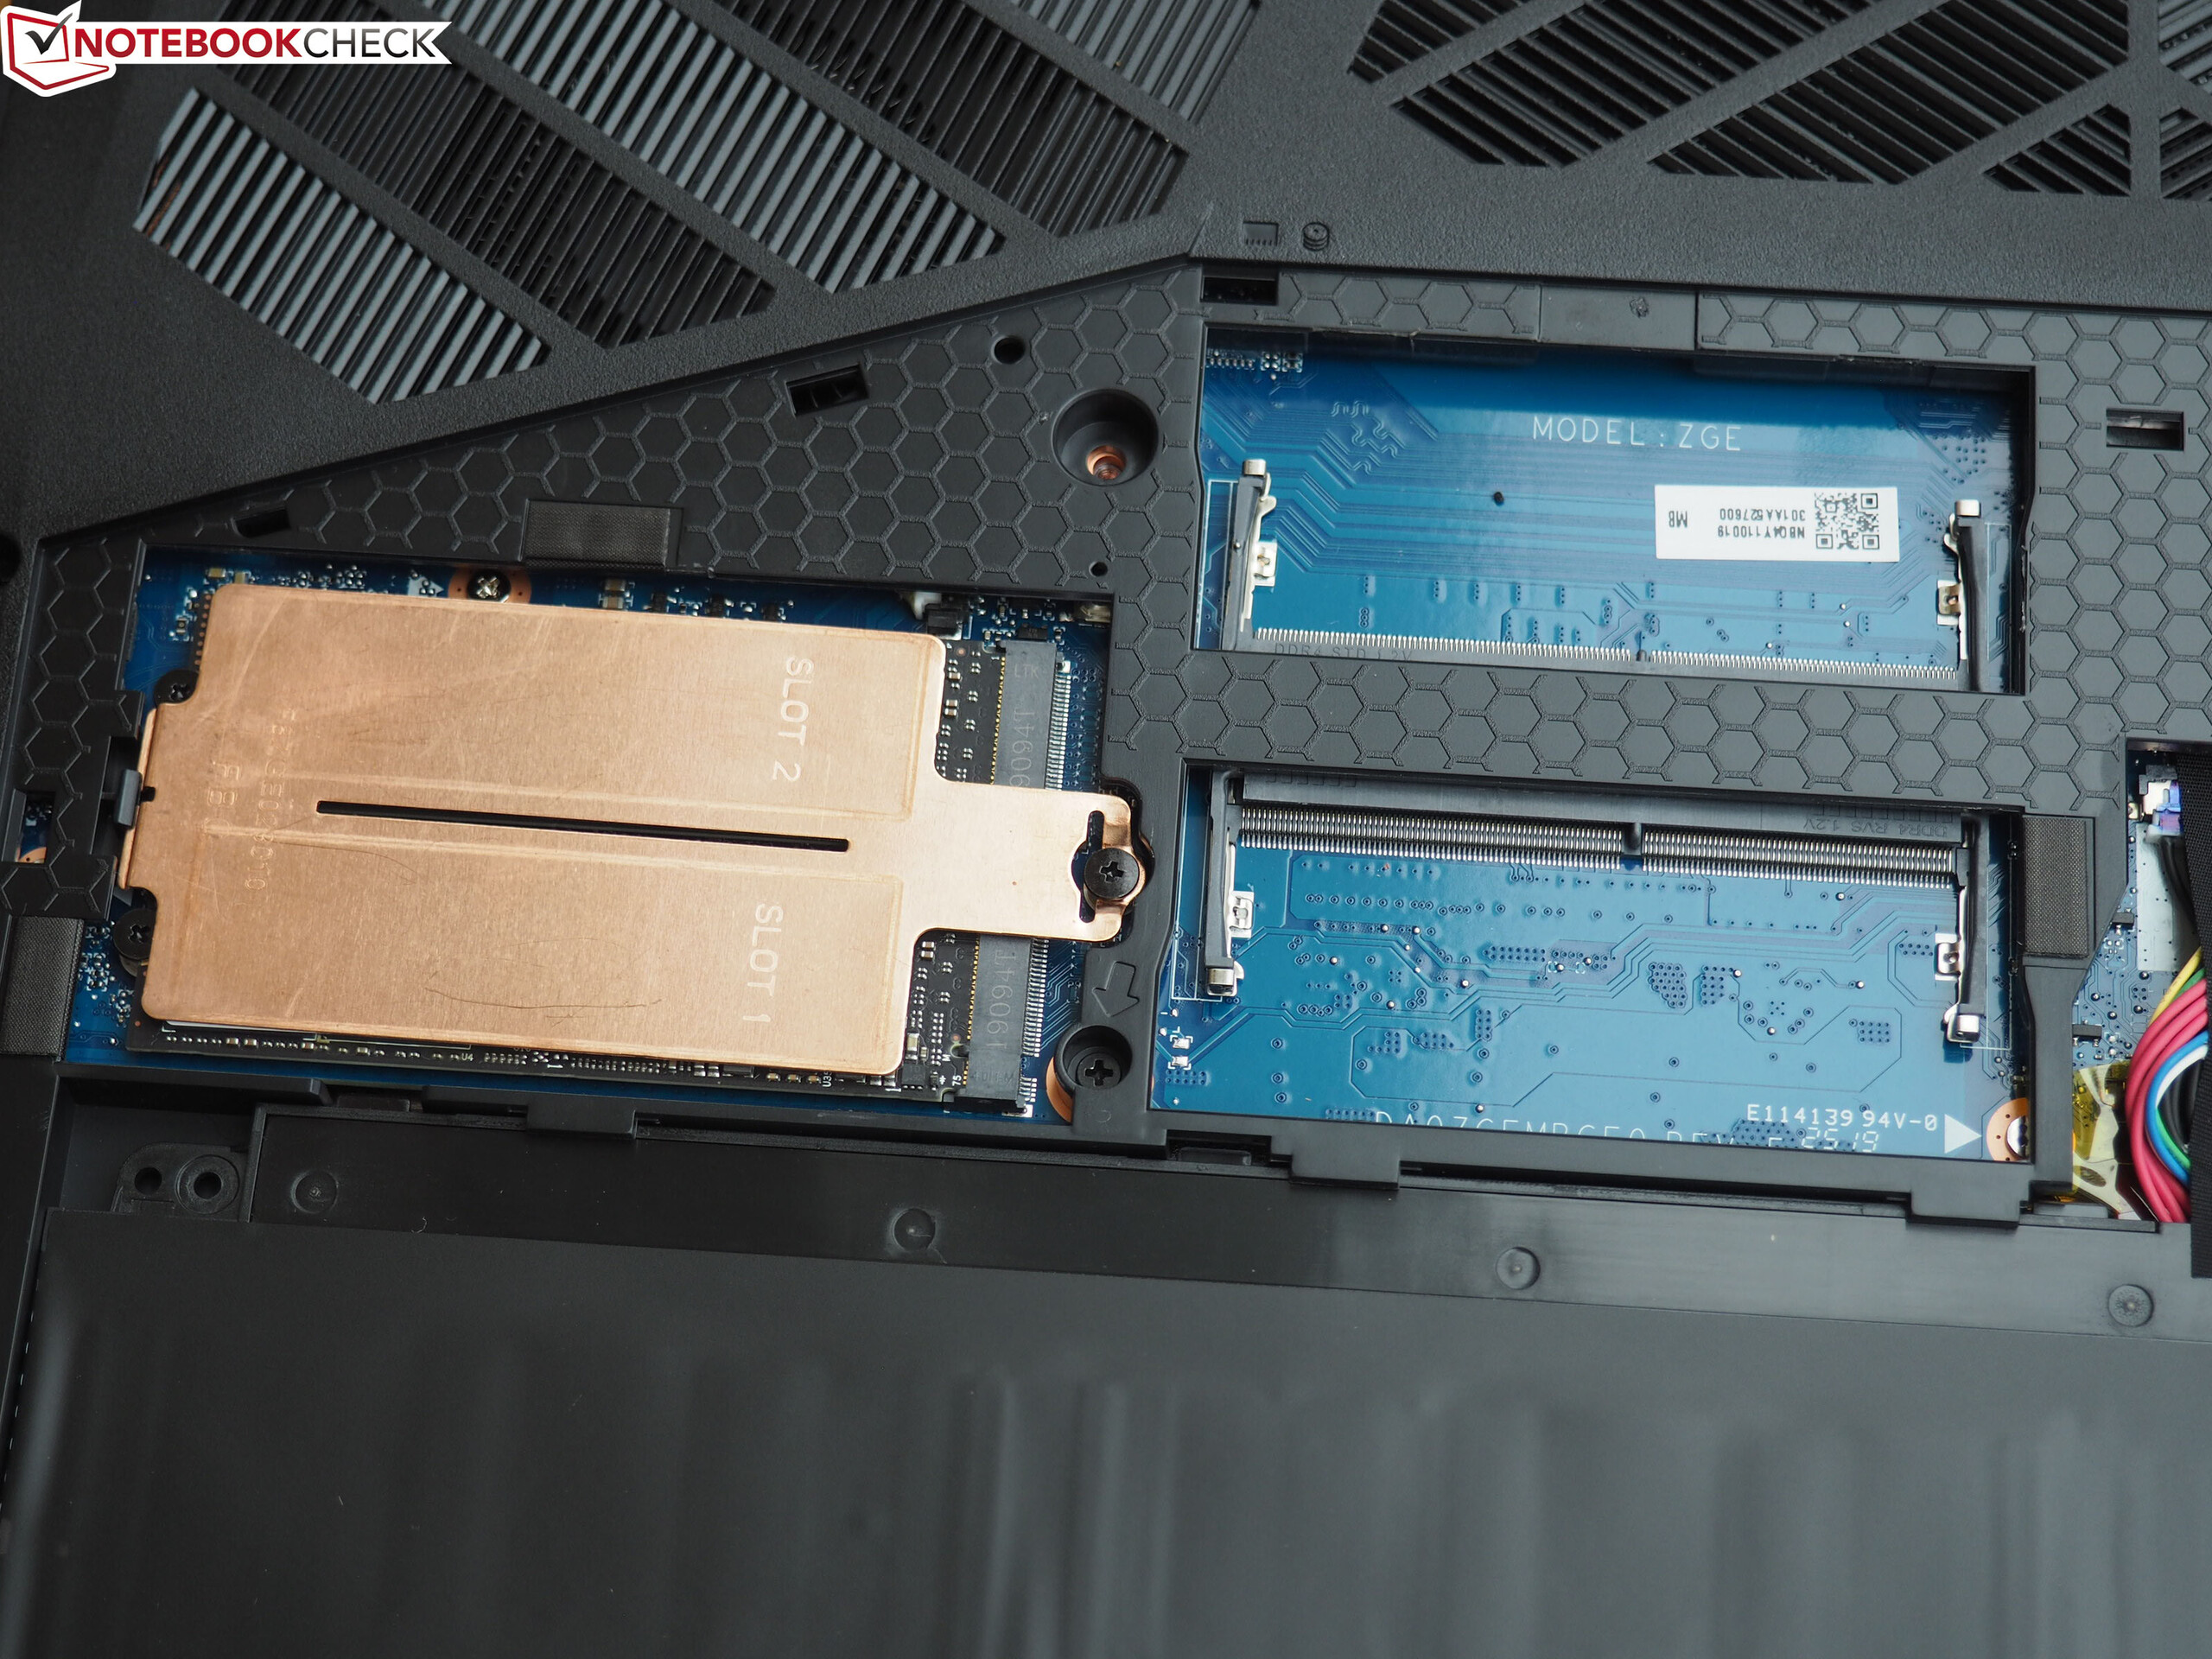
| Acer Predator Helios 700 PH717-71-785M 2x WDC PC SN720 SDAPNTW-512G-1014 (RAID 0) | HP Omen 17-cb0020ng 2x Samsung SSD PM981 MZVLB512HAJQ (RAID 0) | MSI GE75 9SG Samsung SSD PM981 MZVLB1T0HALR | MSI GT76 Titan DT 9SG 2x Samsung PM961 MZVLW256HEHP (RAID 0) | Schenker XMG Ultra 17 Turing Samsung SSD 970 EVO Plus 500GB | Alienware Area-51m i9-9900K RTX 2080 2x SK Hynix PC400 512GB (RAID 0) | |
|---|---|---|---|---|---|---|
| CrystalDiskMark 5.2 / 6 | -4% | -17% | -15% | 6% | 1% | |
| Write 4K (MB/s) | 115.3 | 103.8 -10% | 116.1 1% | 101.4 -12% | 183.2 59% | 111.1 -4% |
| Read 4K (MB/s) | 41.79 | 41.67 0% | 44.98 8% | 40.57 -3% | 52.4 25% | 45.47 9% |
| Write Seq (MB/s) | 2841 | 2639 -7% | 2370 -17% | 2229 -22% | 1790 -37% | 2454 -14% |
| Read Seq (MB/s) | 2547 | 2702 6% | 1465 -42% | 2528 -1% | 1743 -32% | 2212 -13% |
| Write 4K Q32T1 (MB/s) | 498.6 | 487.3 -2% | 337.5 -32% | 379.6 -24% | 550 10% | 622 25% |
| Read 4K Q32T1 (MB/s) | 555 | 555 0% | 453.6 -18% | 421.9 -24% | 648 17% | 695 25% |
| Write Seq Q32T1 (MB/s) | 3123 | 2967 -5% | 2399 -23% | 2439 -22% | 3236 4% | 2675 -14% |
| Read Seq Q32T1 (MB/s) | 3476 | 3102 -11% | 3087 -11% | 3199 -8% | 3538 2% | 3184 -8% |

| 3DMark 11 Performance | 26029 pontos | |
| 3DMark Cloud Gate Standard Score | 42055 pontos | |
| 3DMark Fire Strike Score | 21258 pontos | |
| 3DMark Time Spy Score | 9875 pontos | |
Ajuda | ||
| The Witcher 3 - 1920x1080 Ultra Graphics & Postprocessing (HBAO+) | |
| Média da turma Gaming (95 - 240, n=7, últimos 2 anos) | |
| Acer Predator Helios 700 PH717-71-785M | |
| Alienware Area-51m i9-9900K RTX 2080 | |
| MSI GT76 Titan DT 9SG | |
| MSI GE75 9SG | |
| Schenker XMG Ultra 17 Turing | |
| HP Omen 17-cb0020ng | |
| baixo | média | alto | ultra | |
|---|---|---|---|---|
| The Witcher 3 (2015) | 187 | 105 | ||
| Final Fantasy XV Benchmark (2018) | 108 | |||
| Kingdom Come: Deliverance (2018) | 117 | 78.6 | ||
| Monster Hunter World (2018) | 138 | 112 | ||
| FIFA 19 (2018) | 301 | 256 | ||
| Apex Legends (2019) | 144 | 144 | ||
| Far Cry New Dawn (2019) | 106 | 94 | ||
| Metro Exodus (2019) | 93.4 | 77.4 | ||
| Anthem (2019) | 108 | 104 | ||
| Dirt Rally 2.0 (2019) | 171 | 114 | ||
| The Division 2 (2019) | 134 | 108 | ||
| Anno 1800 (2019) | 74.8 | 43.6 | ||
| Rage 2 (2019) | 125 | 124 | ||
| F1 2019 (2019) | 155 | 152 |
Barulho
| Ocioso |
| 30 / 34 / 45 dB |
| Carga |
| 40 / 60 dB |
 | ||
30 dB silencioso 40 dB(A) audível 50 dB(A) ruidosamente alto |
||
min: | ||
| Acer Predator Helios 700 PH717-71-785M i7-9750H, GeForce RTX 2080 Mobile | HP Omen 17-cb0020ng i9-9880H, GeForce RTX 2080 Mobile | MSI GE75 9SG i9-9880H, GeForce RTX 2080 Mobile | MSI GT76 Titan DT 9SG i9-9900K, GeForce RTX 2080 Mobile | Schenker XMG Ultra 17 Turing i9-9900K, GeForce RTX 2080 Mobile | Alienware Area-51m i9-9900K RTX 2080 i9-9900K, GeForce RTX 2080 Mobile | Média da turma Gaming | |
|---|---|---|---|---|---|---|---|
| Noise | 1% | 9% | -2% | 3% | 2% | 15% | |
| desligado / ambiente * (dB) | 30 | 30 -0% | 28.2 6% | 30 -0% | 30 -0% | 28.1 6% | 24.1 ? 20% |
| Idle Minimum * (dB) | 30 | 34 -13% | 30.4 -1% | 33 -10% | 30 -0% | 28.1 6% | 25.9 ? 14% |
| Idle Average * (dB) | 34 | 35 -3% | 30.4 11% | 34 -0% | 33 3% | 28.6 16% | 27.4 ? 19% |
| Idle Maximum * (dB) | 45 | 36 20% | 33.4 26% | 44 2% | 35 22% | 51 -13% | 29.9 ? 34% |
| Load Average * (dB) | 40 | 51 -27% | 37.1 7% | 47 -18% | 44 -10% | 51 -27% | 43.3 ? -8% |
| Witcher 3 ultra * (dB) | 57 | 47 18% | 54.2 5% | 53 7% | 55 4% | 51 11% | |
| Load Maximum * (dB) | 60 | 51 15% | 56.4 6% | 59 2% | 58 3% | 51 15% | 54.2 ? 10% |
* ... menor é melhor
(+) A temperatura máxima no lado superior é 37 °C / 99 F, em comparação com a média de 40.4 °C / 105 F , variando de 21.2 a 68.8 °C para a classe Gaming.
(±) A parte inferior aquece até um máximo de 40 °C / 104 F, em comparação com a média de 43.2 °C / 110 F
(+) Em uso inativo, a temperatura média para o lado superior é 31.1 °C / 88 F, em comparação com a média do dispositivo de 33.9 °C / ### class_avg_f### F.
(+) Jogando The Witcher 3, a temperatura média para o lado superior é 30.4 °C / 87 F, em comparação com a média do dispositivo de 33.9 °C / ## #class_avg_f### F.
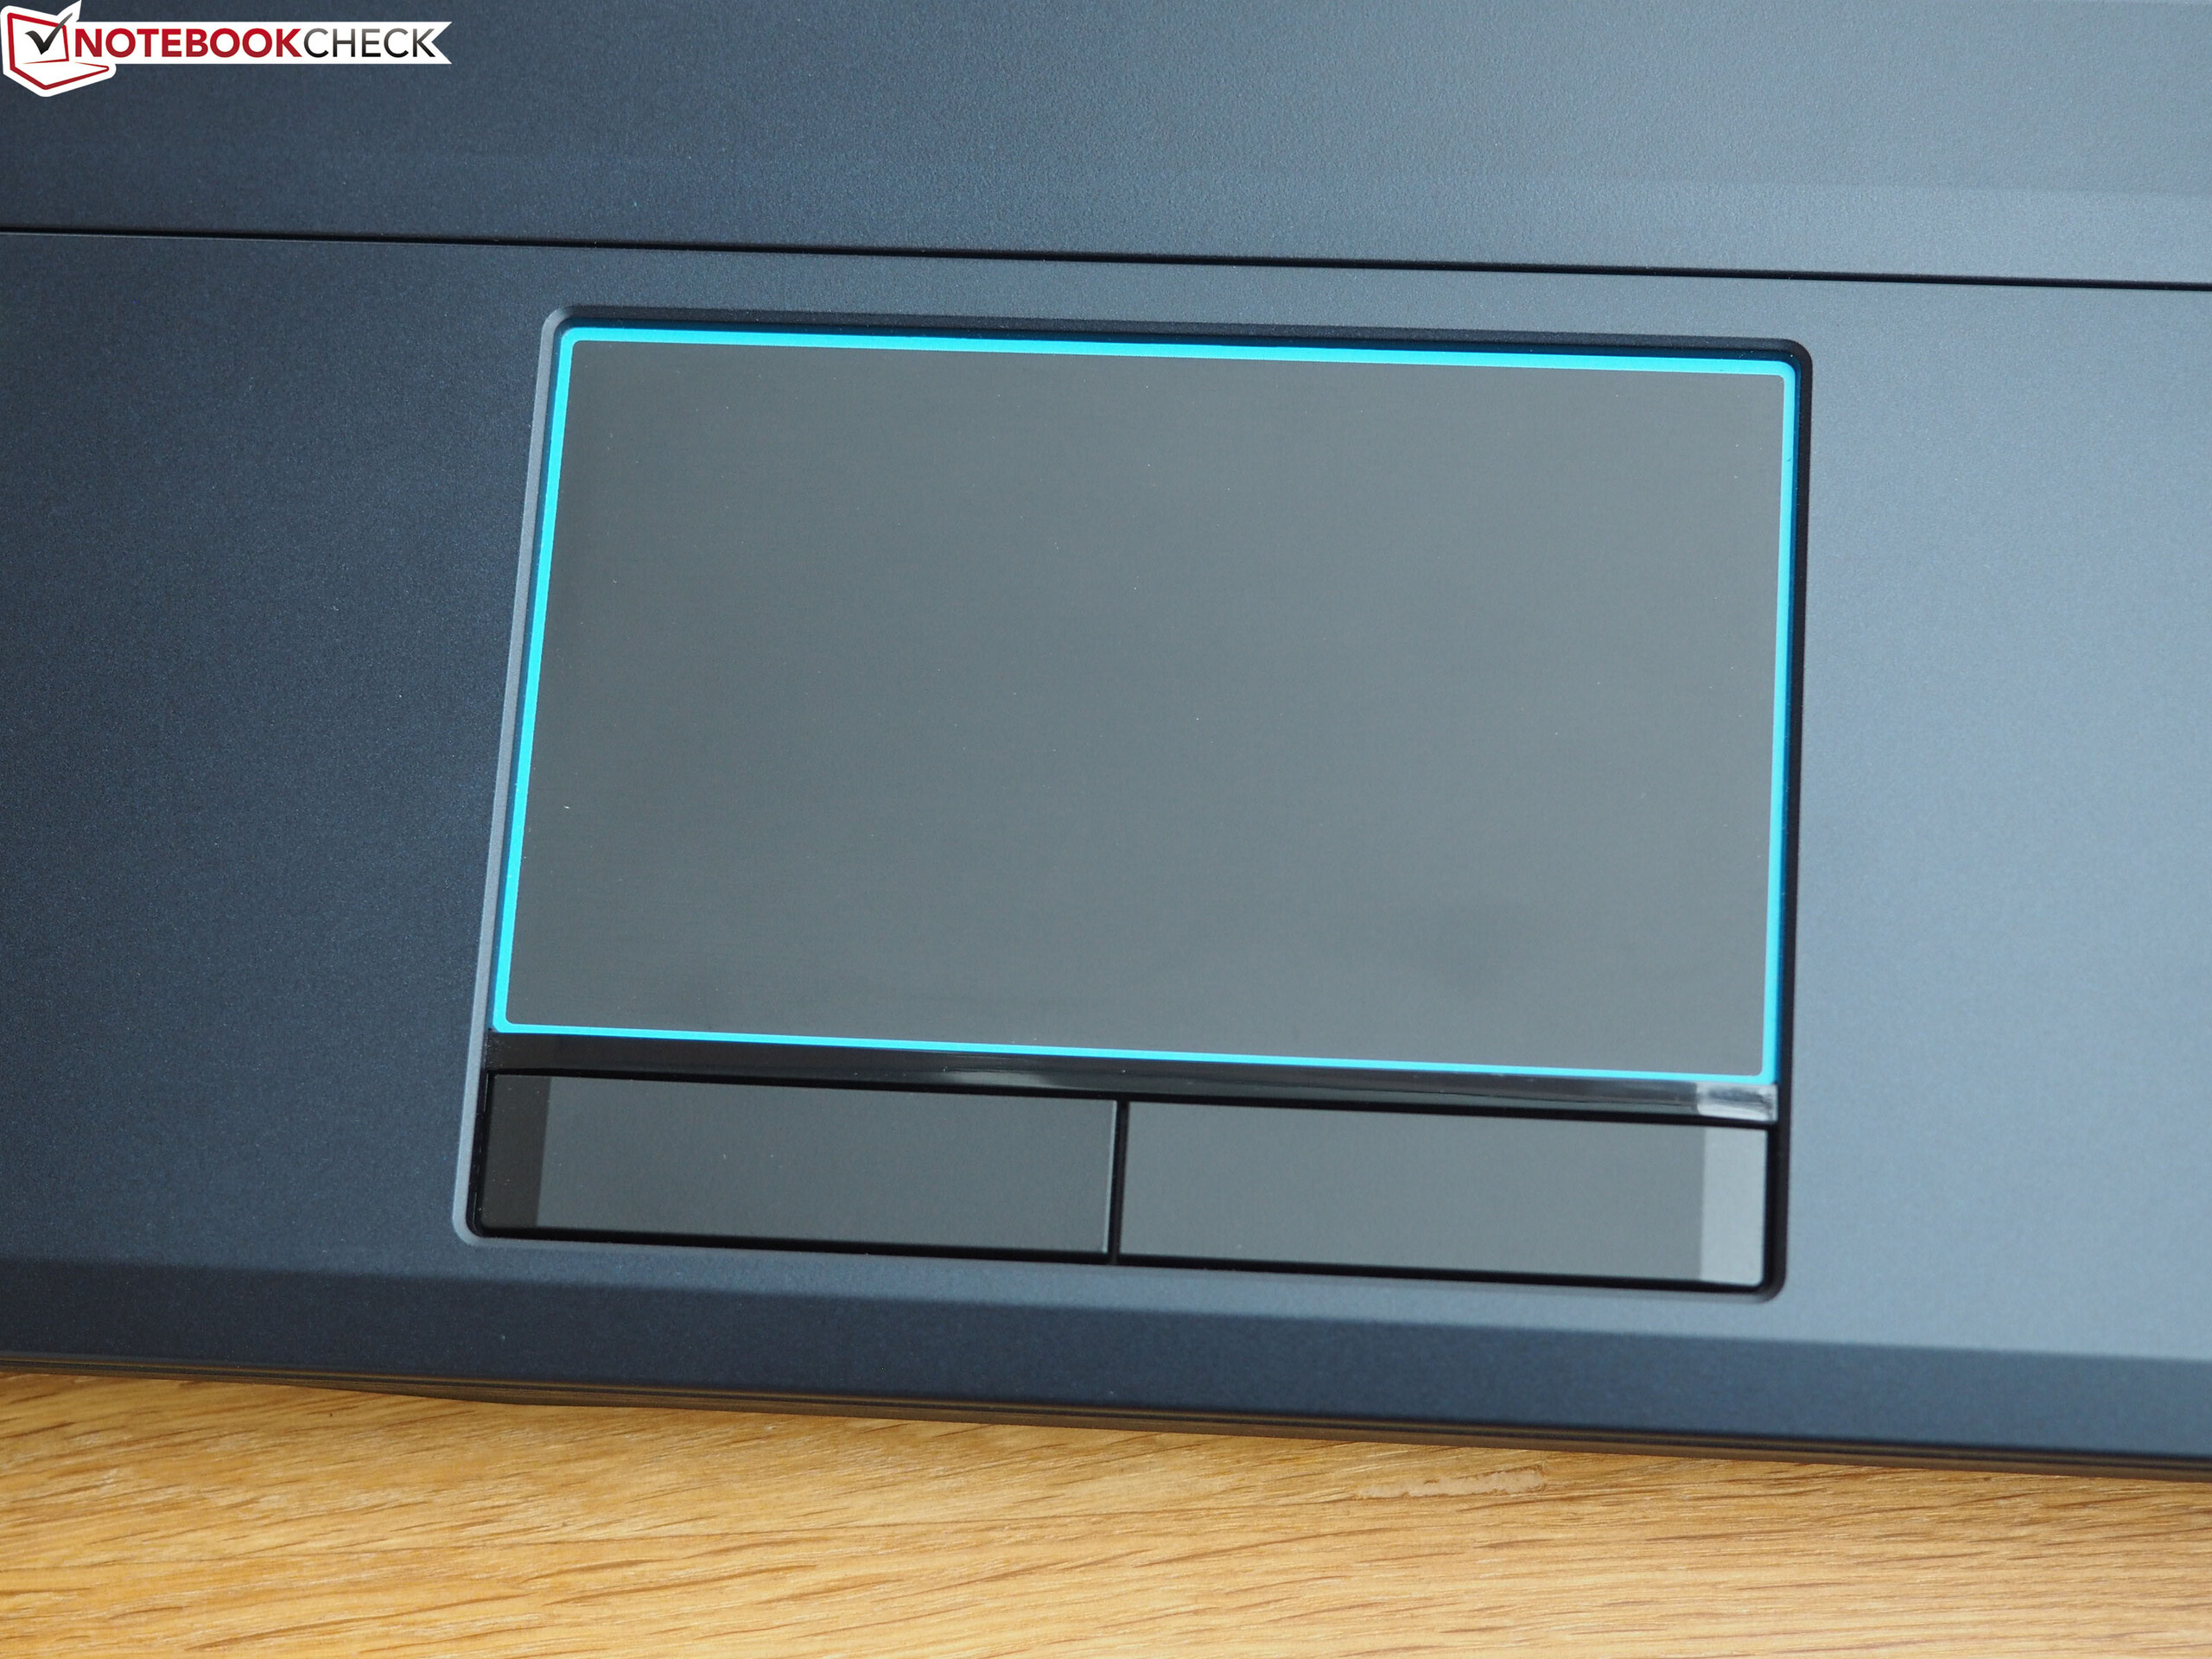
(+) Os apoios para as mãos e o touchpad são mais frios que a temperatura da pele, com um máximo de 30 °C / 86 F e, portanto, são frios ao toque.
(±) A temperatura média da área do apoio para as mãos de dispositivos semelhantes foi 28.8 °C / 83.8 F (-1.2 °C / -2.2 F).
| Acer Predator Helios 700 PH717-71-785M i7-9750H, GeForce RTX 2080 Mobile | HP Omen 17-cb0020ng i9-9880H, GeForce RTX 2080 Mobile | MSI GE75 9SG i9-9880H, GeForce RTX 2080 Mobile | MSI GT76 Titan DT 9SG i9-9900K, GeForce RTX 2080 Mobile | Schenker XMG Ultra 17 Turing i9-9900K, GeForce RTX 2080 Mobile | Alienware Area-51m i9-9900K RTX 2080 i9-9900K, GeForce RTX 2080 Mobile | Média da turma Gaming | |
|---|---|---|---|---|---|---|---|
| Heat | -10% | -23% | -9% | -8% | -16% | -7% | |
| Maximum Upper Side * (°C) | 37 | 47 -27% | 48.8 -32% | 51 -38% | 45 -22% | 47 -27% | 45.2 ? -22% |
| Maximum Bottom * (°C) | 40 | 54 -35% | 52 -30% | 57 -43% | 45 -13% | 58.8 -47% | 48.2 ? -21% |
| Idle Upper Side * (°C) | 34 | 32 6% | 36.2 -6% | 26 24% | 36 -6% | 31 9% | 31 ? 9% |
| Idle Bottom * (°C) | 36 | 30 17% | 44.4 -23% | 28 22% | 33 8% | 35 3% | 34.3 ? 5% |
* ... menor é melhor
Acer Predator Helios 700 PH717-71-785M análise de áudio
(+) | os alto-falantes podem tocar relativamente alto (###valor### dB)
Graves 100 - 315Hz
(-) | quase nenhum baixo - em média 15.4% menor que a mediana
(±) | a linearidade dos graves é média (11.8% delta para a frequência anterior)
Médios 400 - 2.000 Hz
(+) | médios equilibrados - apenas 2.2% longe da mediana
(+) | médios são lineares (5.7% delta para frequência anterior)
Altos 2 - 16 kHz
(+) | agudos equilibrados - apenas 2.1% longe da mediana
(+) | os máximos são lineares (5.7% delta da frequência anterior)
Geral 100 - 16.000 Hz
(+) | o som geral é linear (12.9% diferença em relação à mediana)
Comparado com a mesma classe
» 17% de todos os dispositivos testados nesta classe foram melhores, 4% semelhantes, 79% piores
» O melhor teve um delta de 6%, a média foi 18%, o pior foi 132%
Comparado com todos os dispositivos testados
» 12% de todos os dispositivos testados foram melhores, 3% semelhantes, 85% piores
» O melhor teve um delta de 4%, a média foi 23%, o pior foi 134%
Alienware Area-51m i9-9900K RTX 2080 análise de áudio
(+) | os alto-falantes podem tocar relativamente alto (###valor### dB)
Graves 100 - 315Hz
(±) | graves reduzidos - em média 11% menor que a mediana
(±) | a linearidade dos graves é média (14.5% delta para a frequência anterior)
Médios 400 - 2.000 Hz
(+) | médios equilibrados - apenas 3.4% longe da mediana
(±) | a linearidade dos médios é média (7.8% delta para frequência anterior)
Altos 2 - 16 kHz
(+) | agudos equilibrados - apenas 2.8% longe da mediana
(±) | a linearidade dos máximos é média (9.4% delta para frequência anterior)
Geral 100 - 16.000 Hz
(+) | o som geral é linear (11.9% diferença em relação à mediana)
Comparado com a mesma classe
» 12% de todos os dispositivos testados nesta classe foram melhores, 4% semelhantes, 85% piores
» O melhor teve um delta de 6%, a média foi 18%, o pior foi 132%
Comparado com todos os dispositivos testados
» 9% de todos os dispositivos testados foram melhores, 2% semelhantes, 89% piores
» O melhor teve um delta de 4%, a média foi 23%, o pior foi 134%
| desligado | |
| Ocioso | |
| Carga |
|
Key:
min: | |
| Acer Predator Helios 700 PH717-71-785M i7-9750H, GeForce RTX 2080 Mobile | HP Omen 17-cb0020ng i9-9880H, GeForce RTX 2080 Mobile | MSI GE75 9SG i9-9880H, GeForce RTX 2080 Mobile | MSI GT76 Titan DT 9SG i9-9900K, GeForce RTX 2080 Mobile | Schenker XMG Ultra 17 Turing i9-9900K, GeForce RTX 2080 Mobile | Alienware Area-51m i9-9900K RTX 2080 i9-9900K, GeForce RTX 2080 Mobile | Média da turma Gaming | |
|---|---|---|---|---|---|---|---|
| Power Consumption | 8% | 24% | 13% | -21% | -12% | 31% | |
| Idle Minimum * (Watt) | 28 | 26 7% | 13.9 50% | 14 50% | 39 -39% | 23.3 17% | 12.8 ? 54% |
| Idle Average * (Watt) | 34 | 29 15% | 18.8 45% | 18 47% | 45 -32% | 33.5 1% | 18.5 ? 46% |
| Idle Maximum * (Watt) | 45 | 38 16% | 23.1 49% | 23 49% | 55 -22% | 38.4 15% | 24 ? 47% |
| Load Average * (Watt) | 98 | 106 -8% | 112.3 -15% | 114 -16% | 122 -24% | 114.1 -16% | 108.2 ? -10% |
| Witcher 3 ultra * (Watt) | 263 | 228 13% | 231 12% | 283 -8% | 259 2% | 339.5 -29% | |
| Load Maximum * (Watt) | 307 | 287 7% | 291.5 5% | 443 -44% | 346 -13% | 485.1 -58% | 254 ? 17% |
* ... menor é melhor
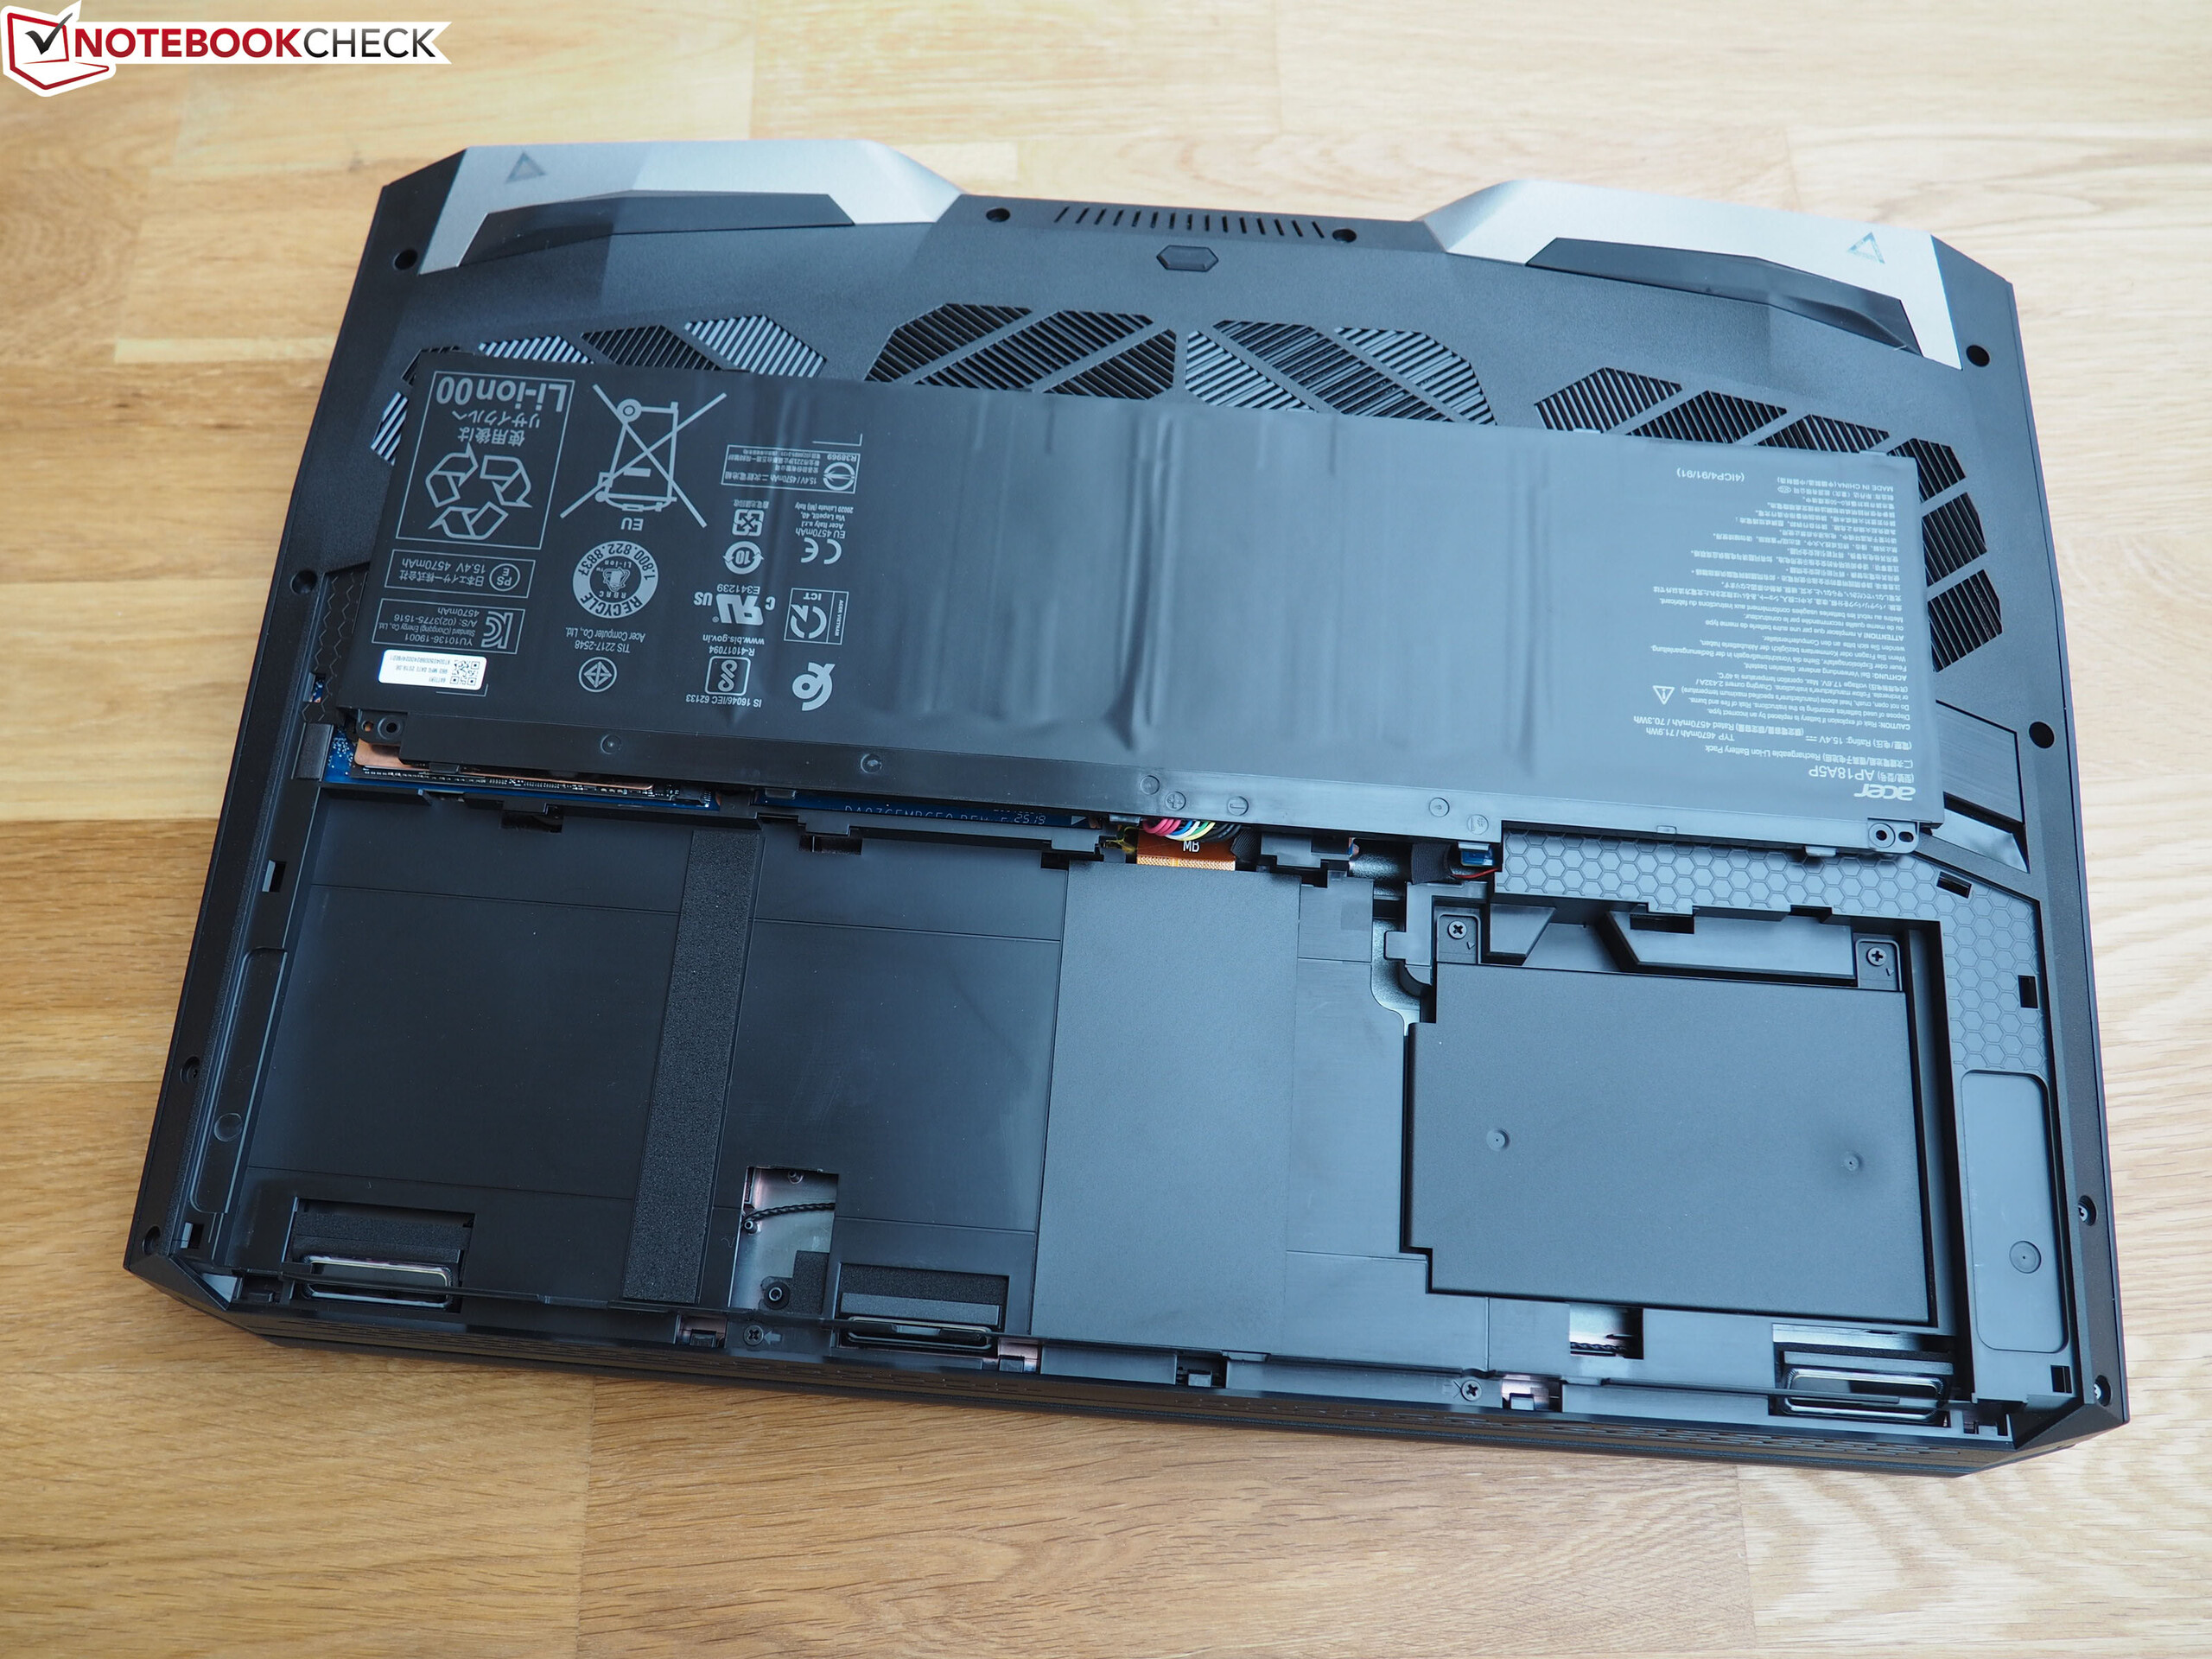
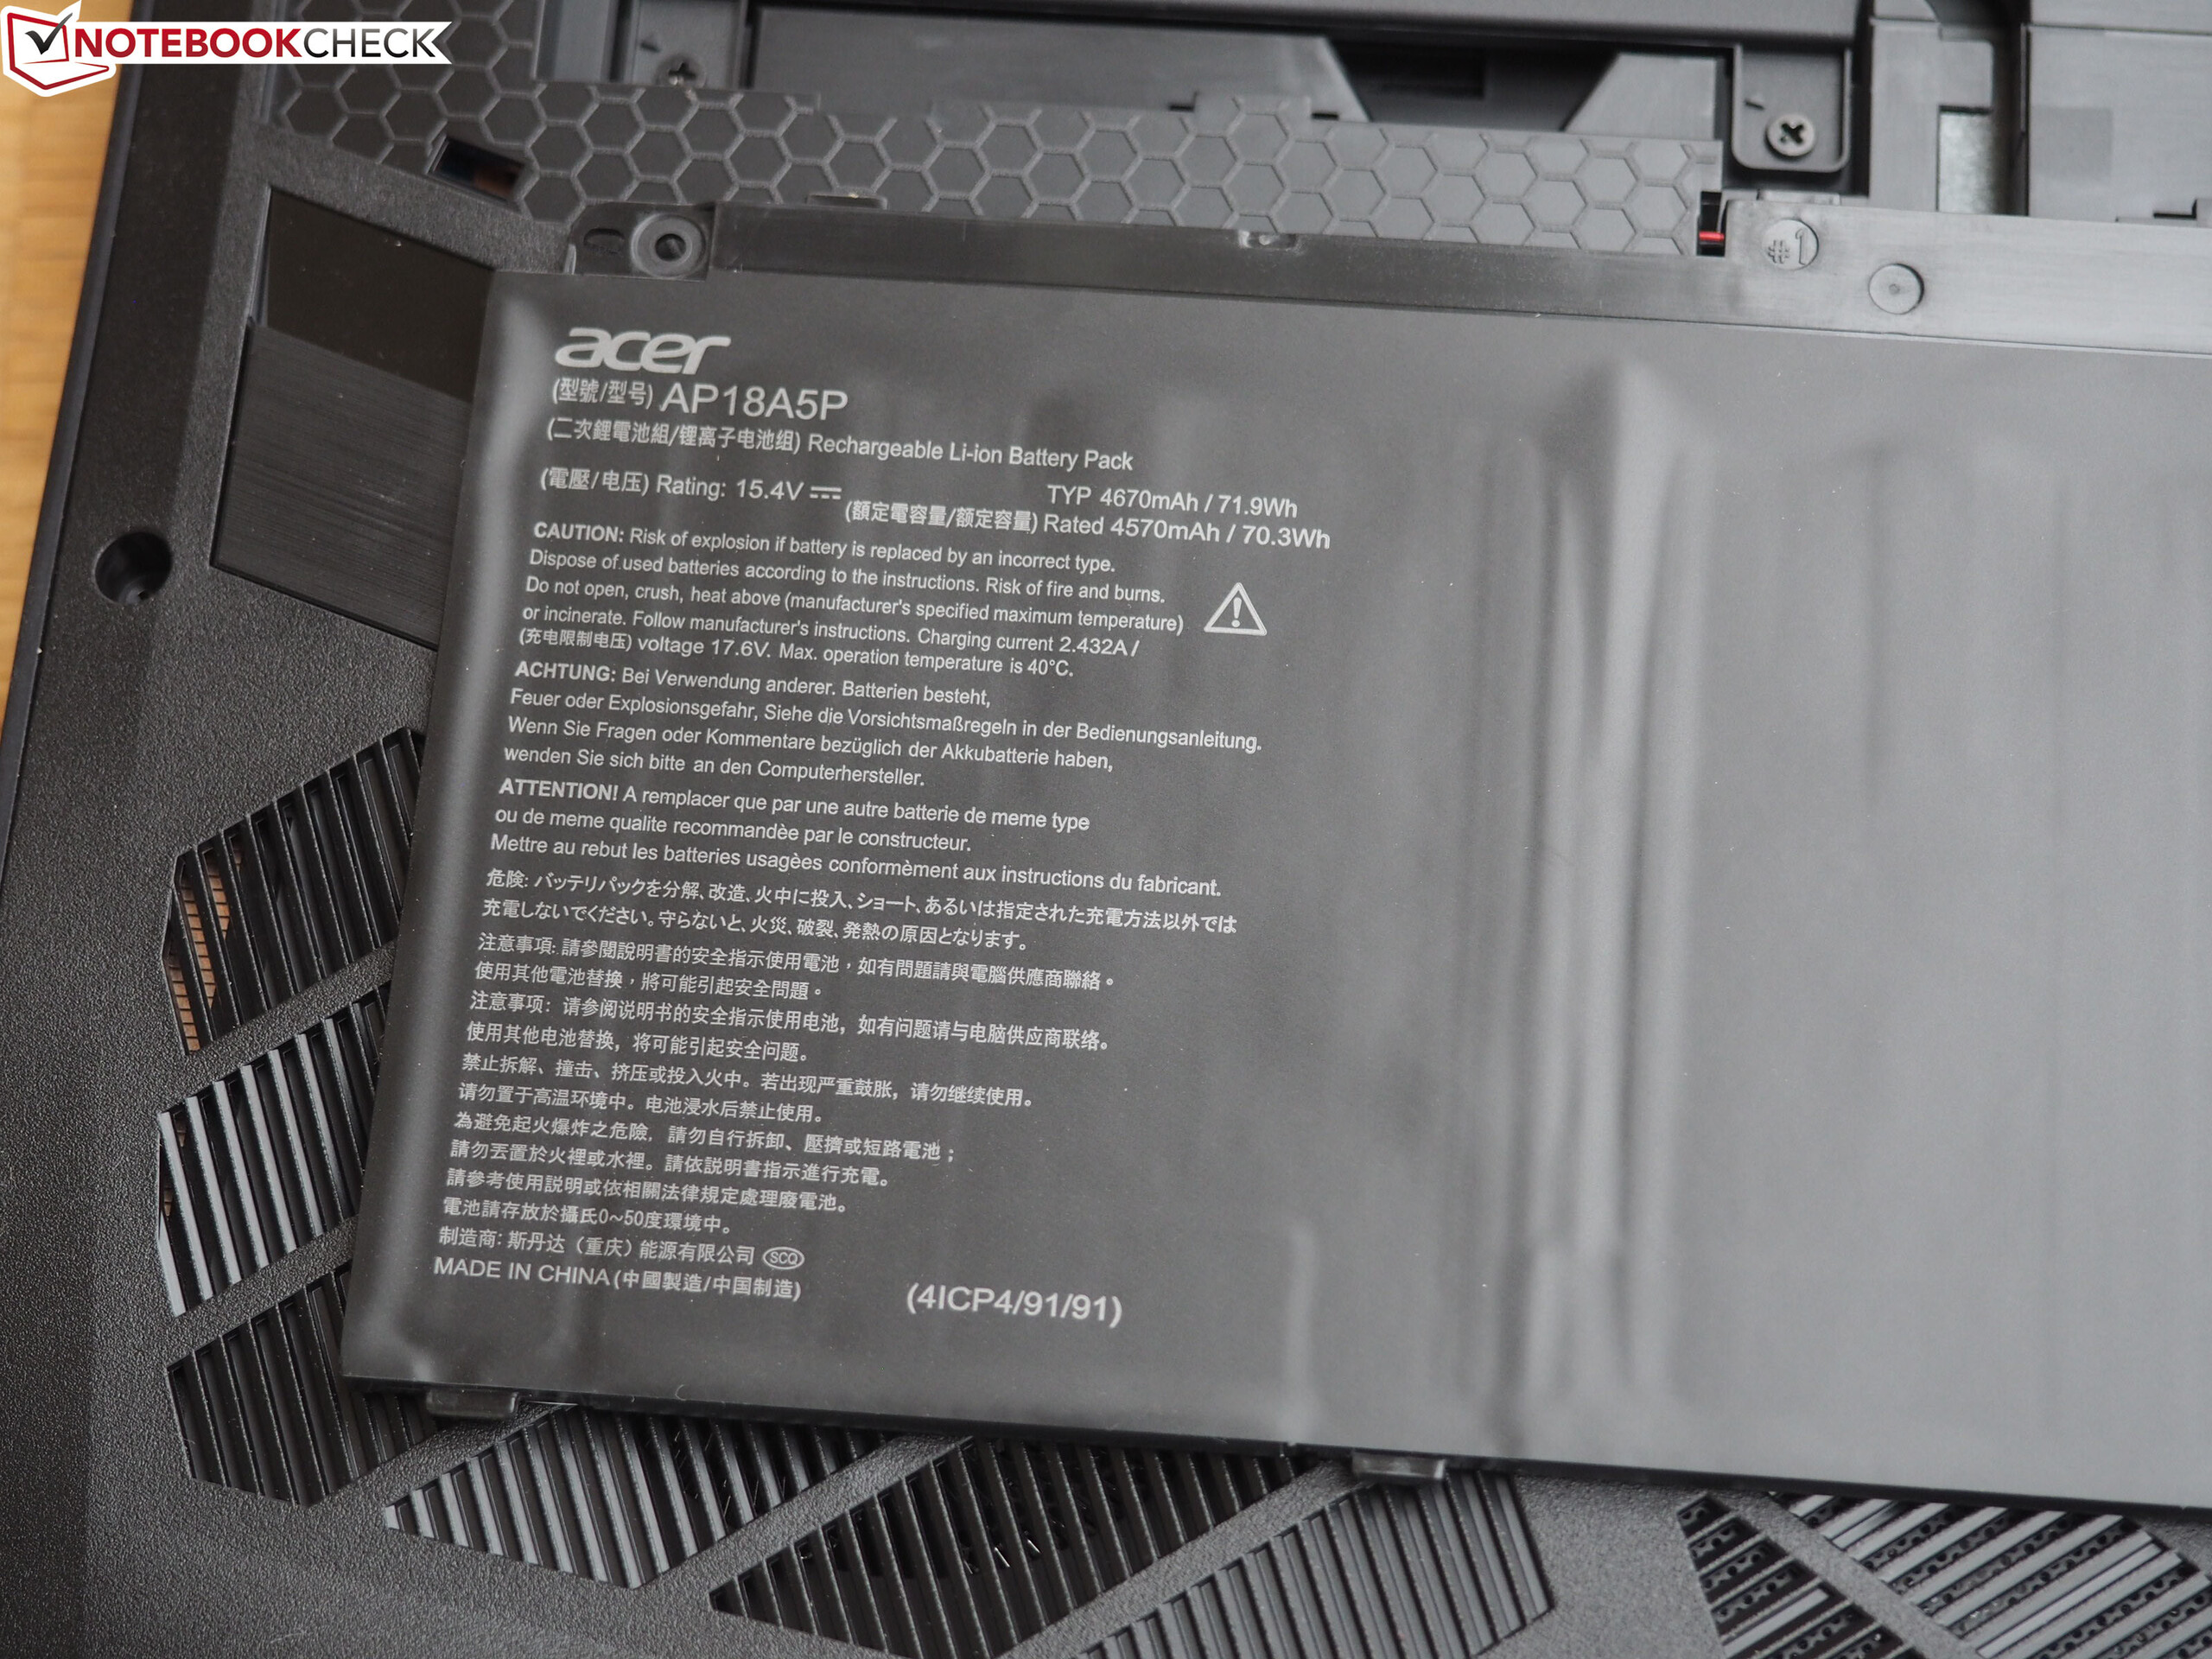
| Acer Predator Helios 700 PH717-71-785M i7-9750H, GeForce RTX 2080 Mobile, 72 Wh | HP Omen 17-cb0020ng i9-9880H, GeForce RTX 2080 Mobile, 70 Wh | MSI GE75 9SG i9-9880H, GeForce RTX 2080 Mobile, 65 Wh | MSI GT76 Titan DT 9SG i9-9900K, GeForce RTX 2080 Mobile, 90 Wh | Schenker XMG Ultra 17 Turing i9-9900K, GeForce RTX 2080 Mobile, 82 Wh | Alienware Area-51m i9-9900K RTX 2080 i9-9900K, GeForce RTX 2080 Mobile, 90 Wh | Média da turma Gaming | |
|---|---|---|---|---|---|---|---|
| Duração da bateria | 12% | 75% | 50% | -13% | -18% | 111% | |
| Reader / Idle (h) | 3.6 | 4.2 17% | 6.8 89% | 2.8 -22% | 2.6 -28% | 8.71 ? 142% | |
| WiFi v1.3 (h) | 2.8 | 3.3 18% | 4.9 75% | 5 79% | 2.3 -18% | 2.1 -25% | 7.09 ? 153% |
| Load (h) | 1.1 | 1.1 0% | 0.9 -18% | 1.1 0% | 1.1 0% | 1.51 ? 37% | |
| H.264 (h) | 2.3 | 8.9 ? |
Pro
Contra
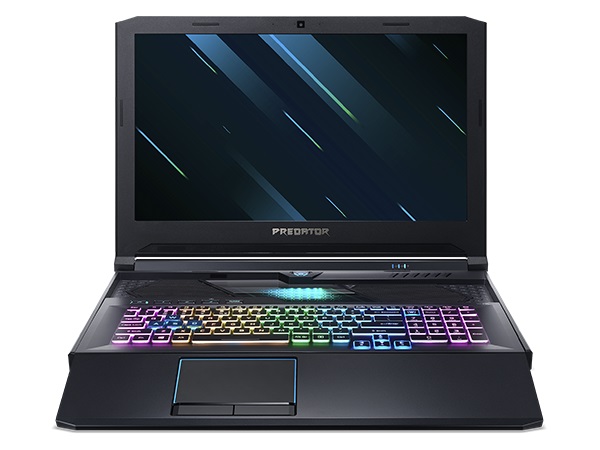
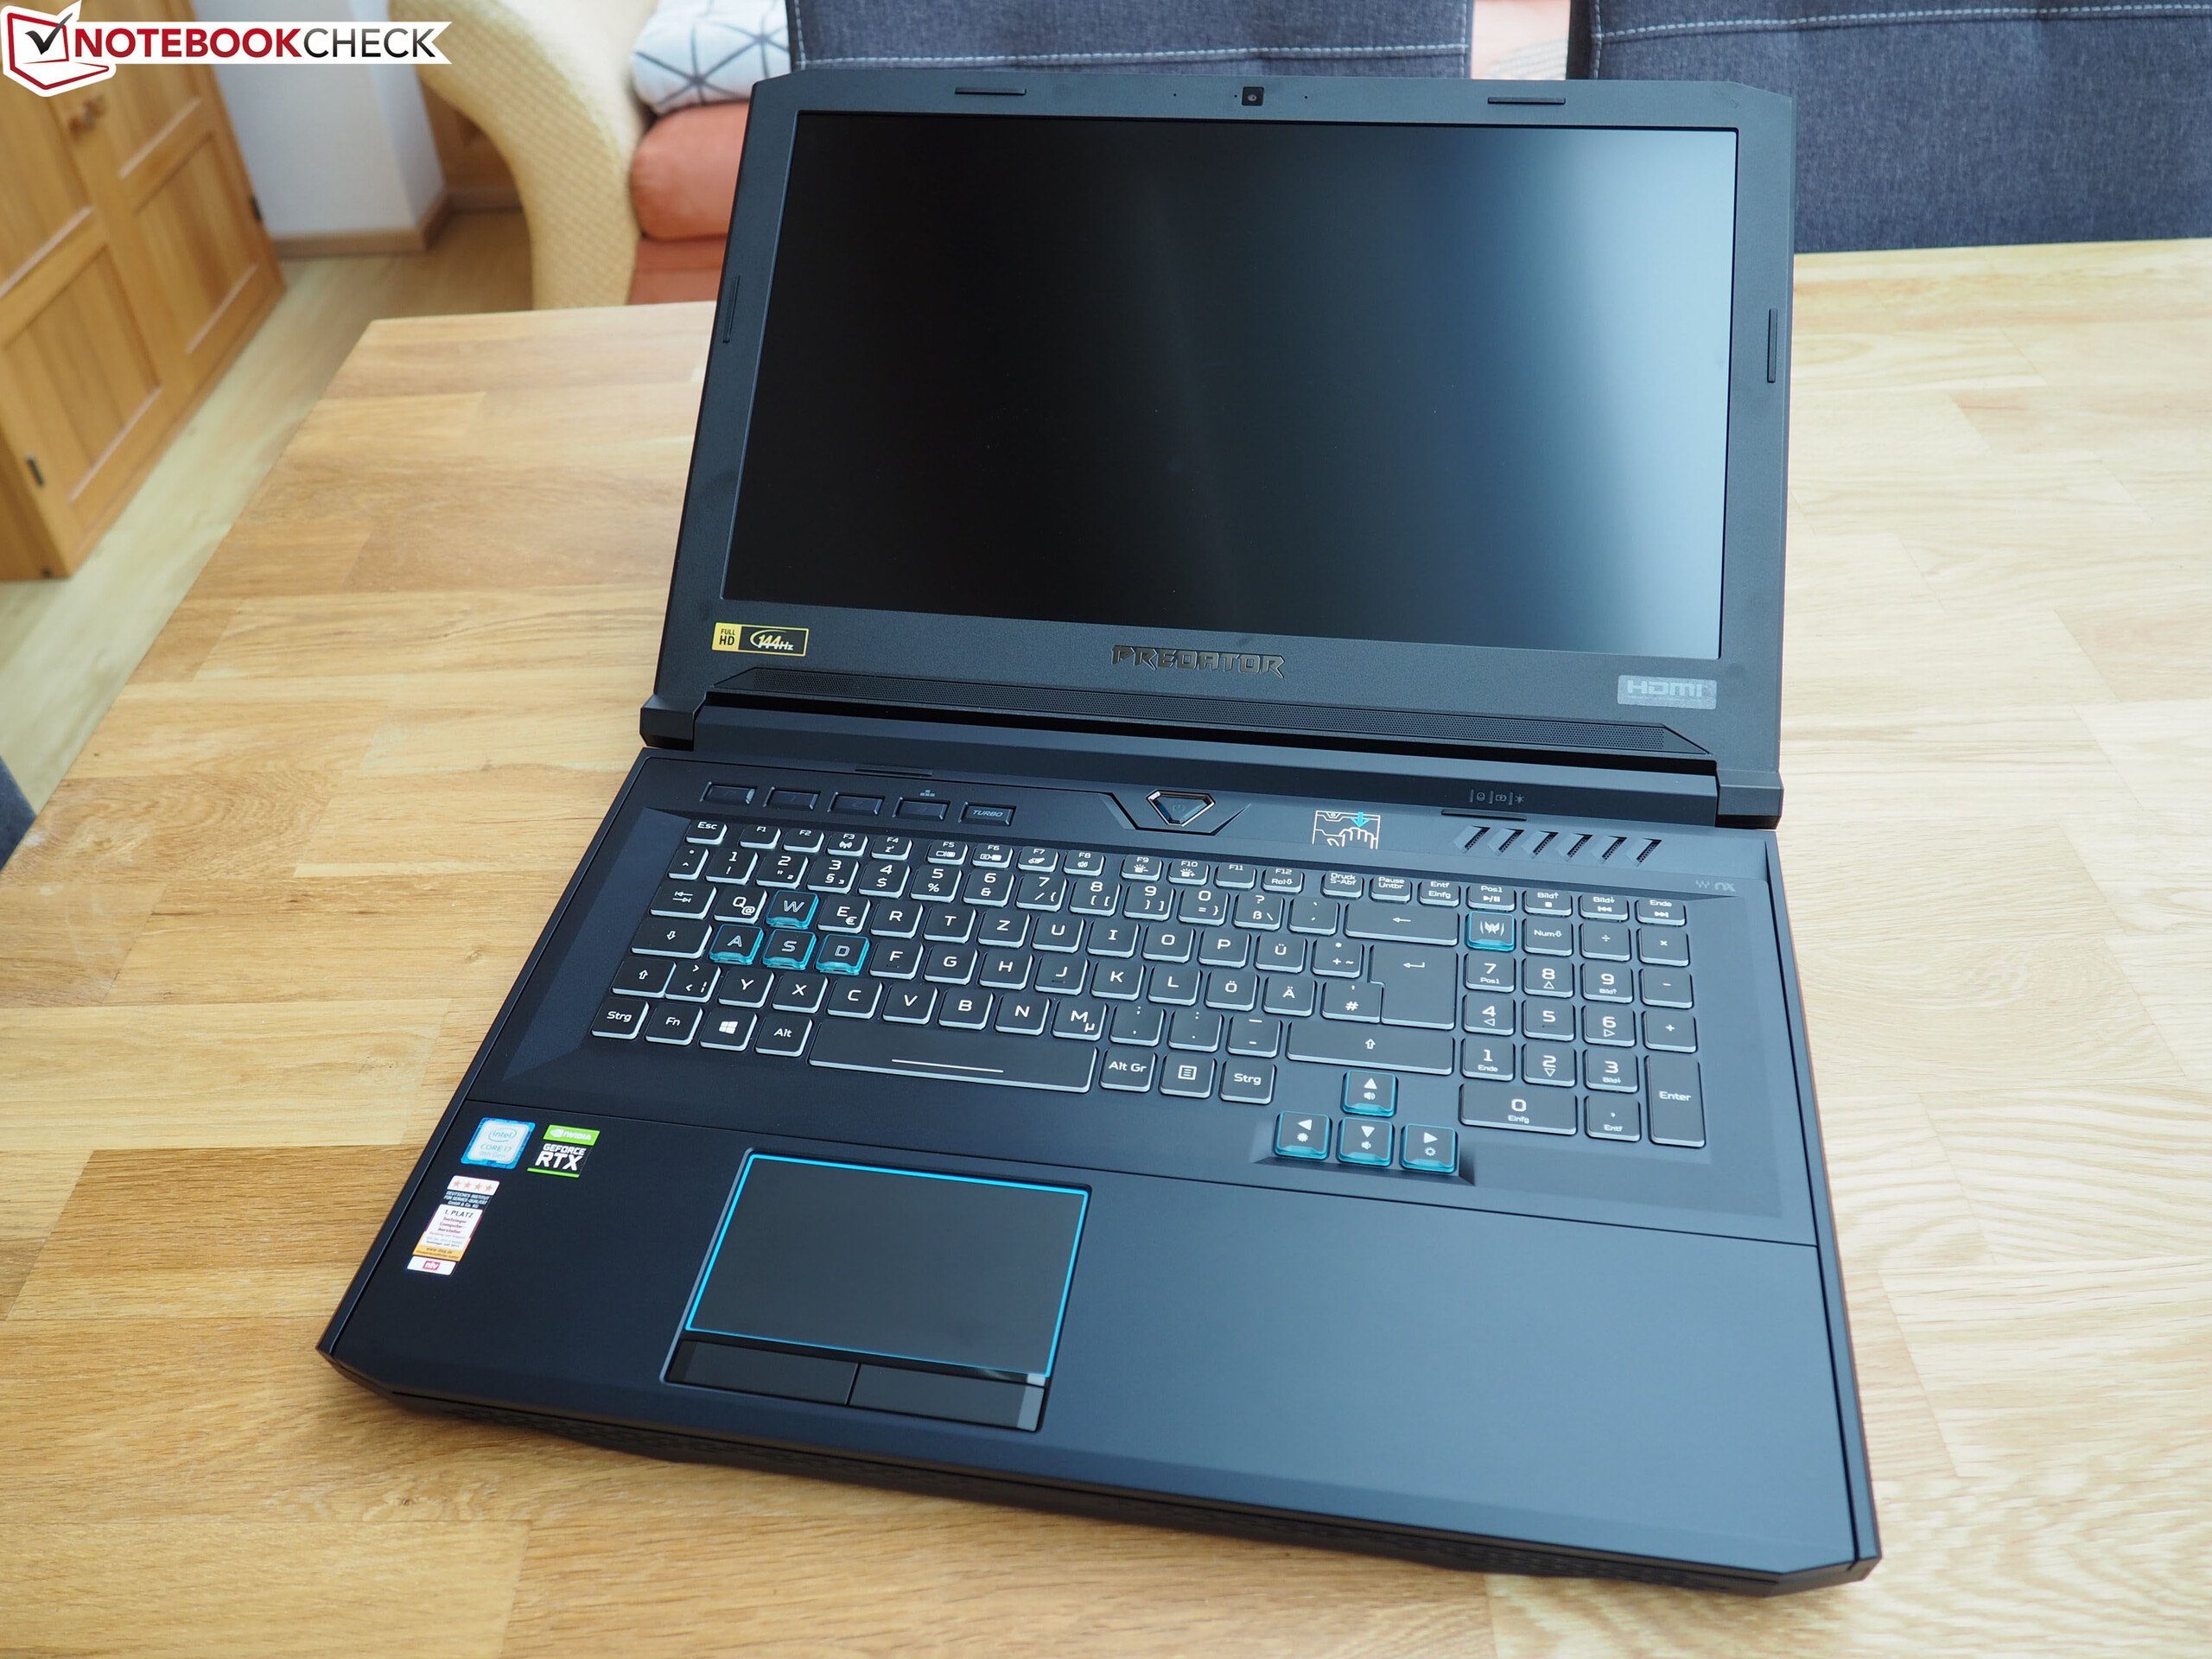
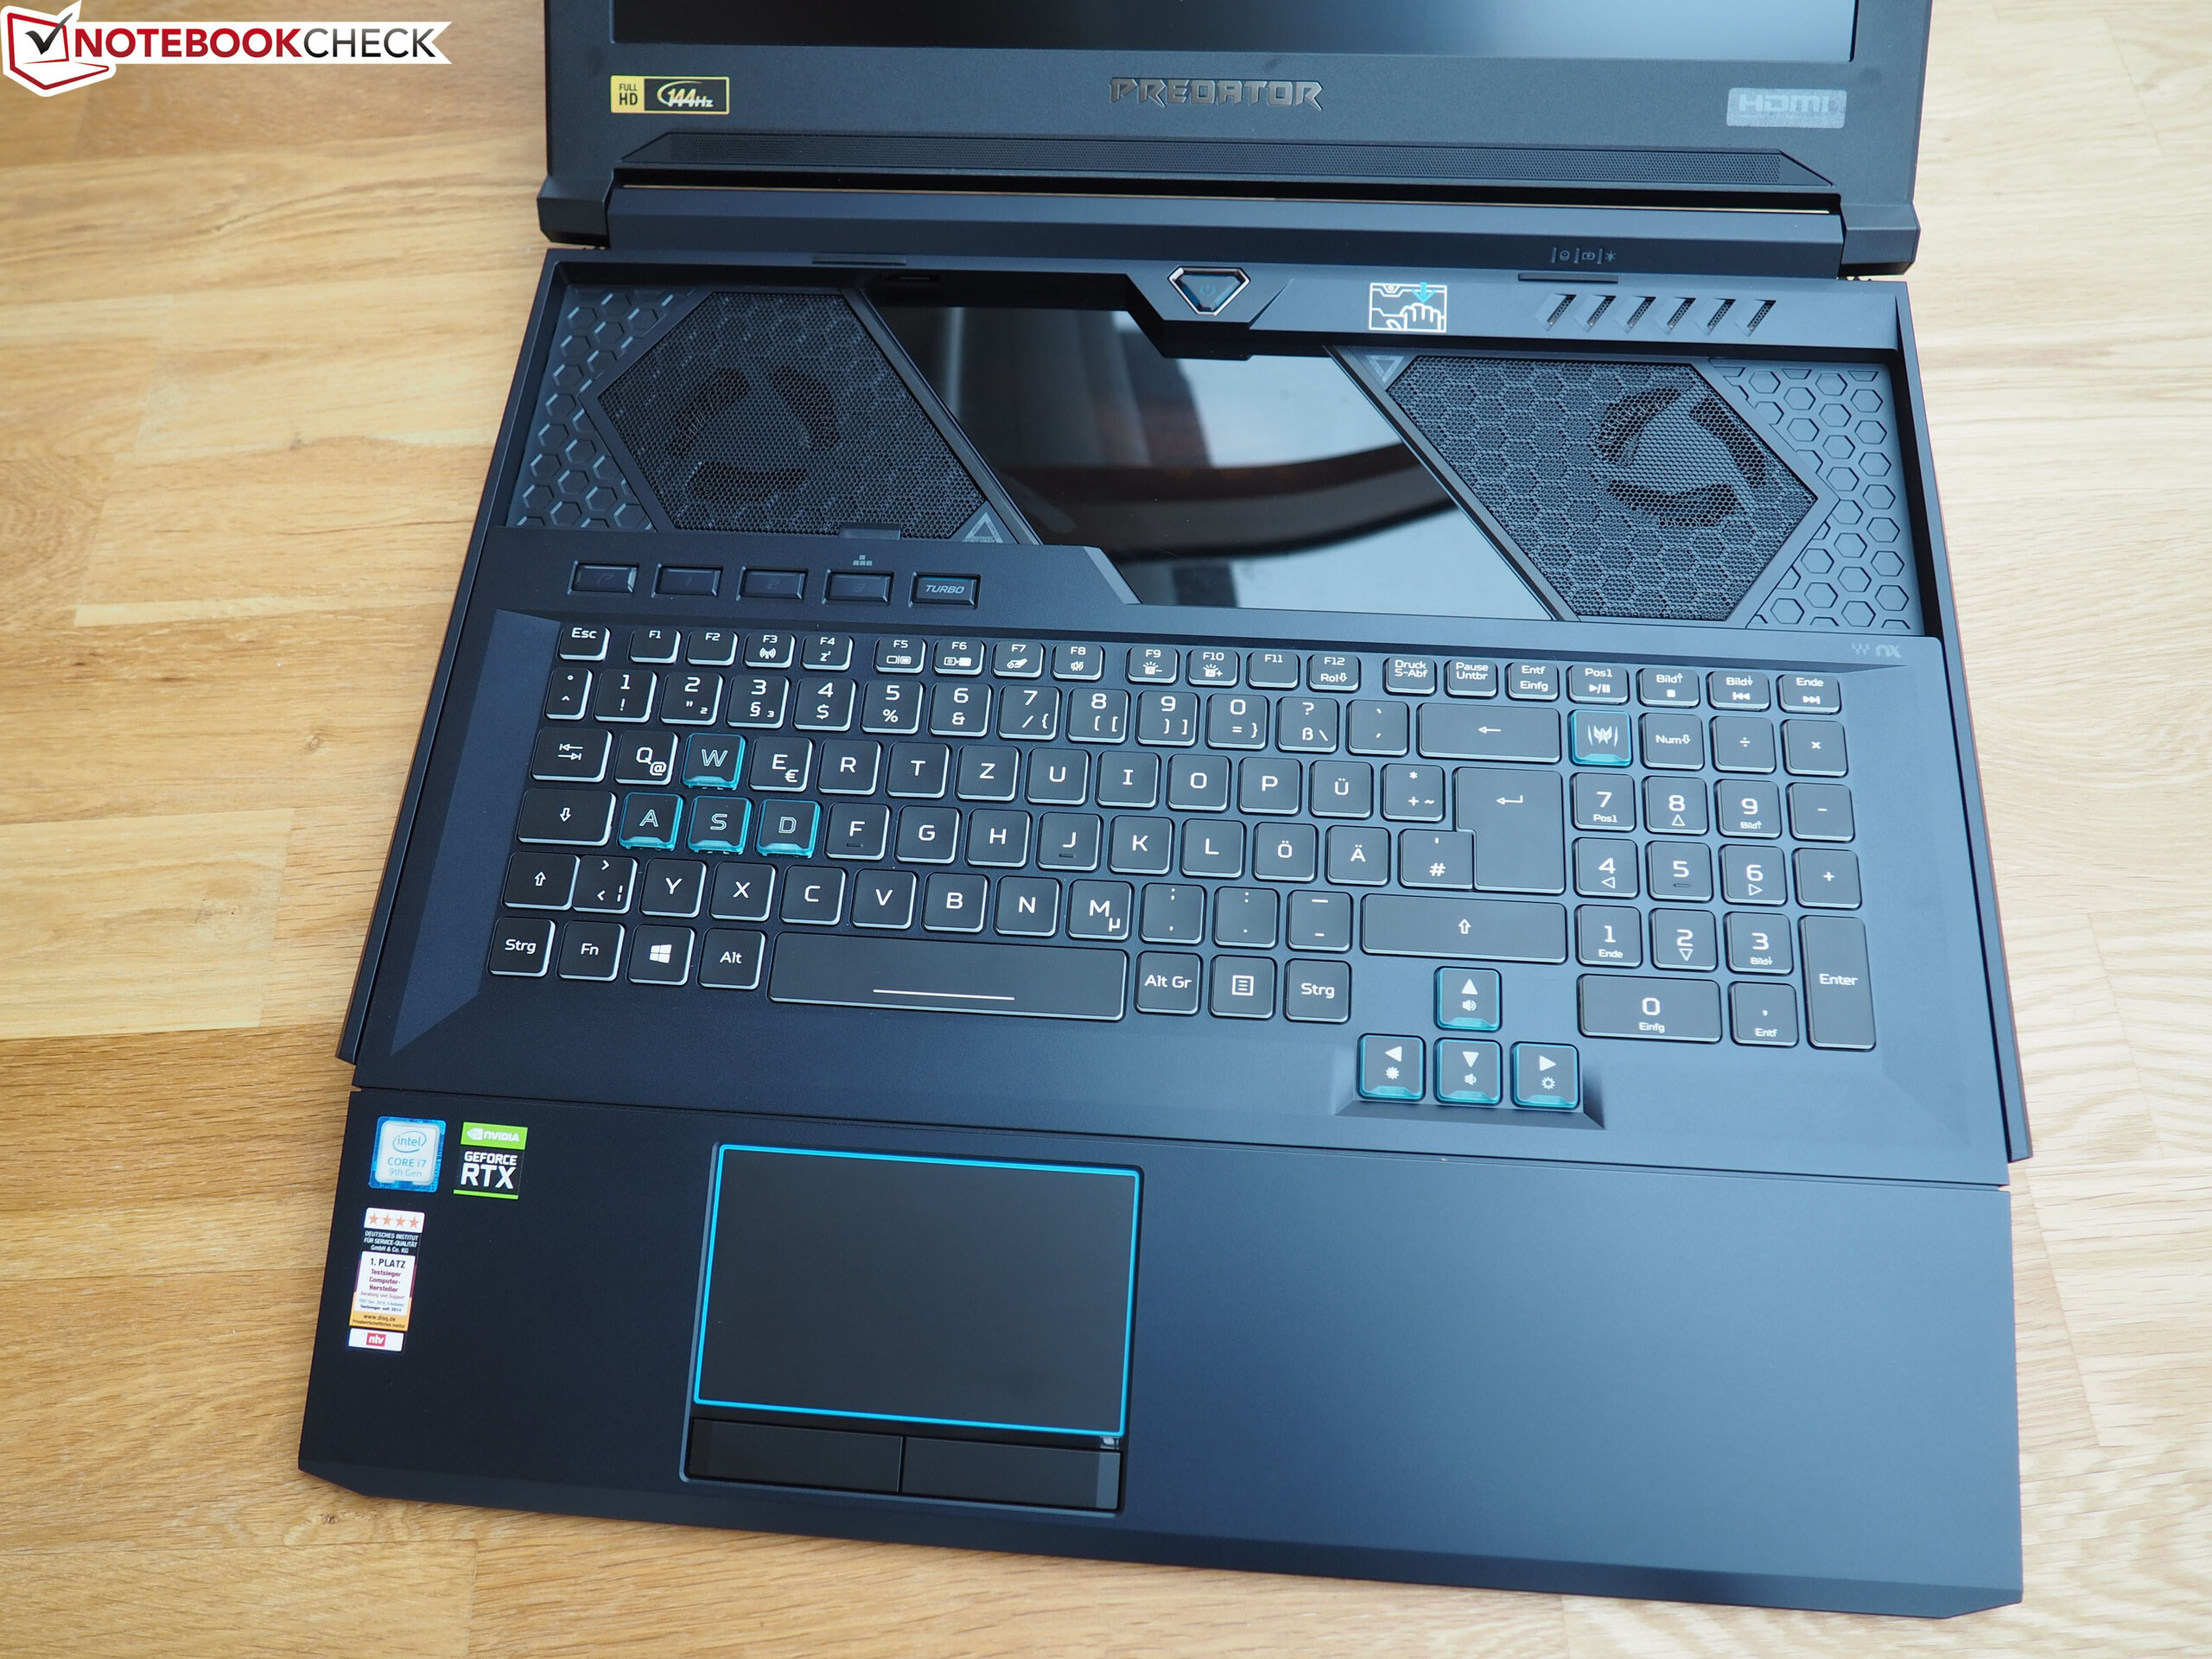
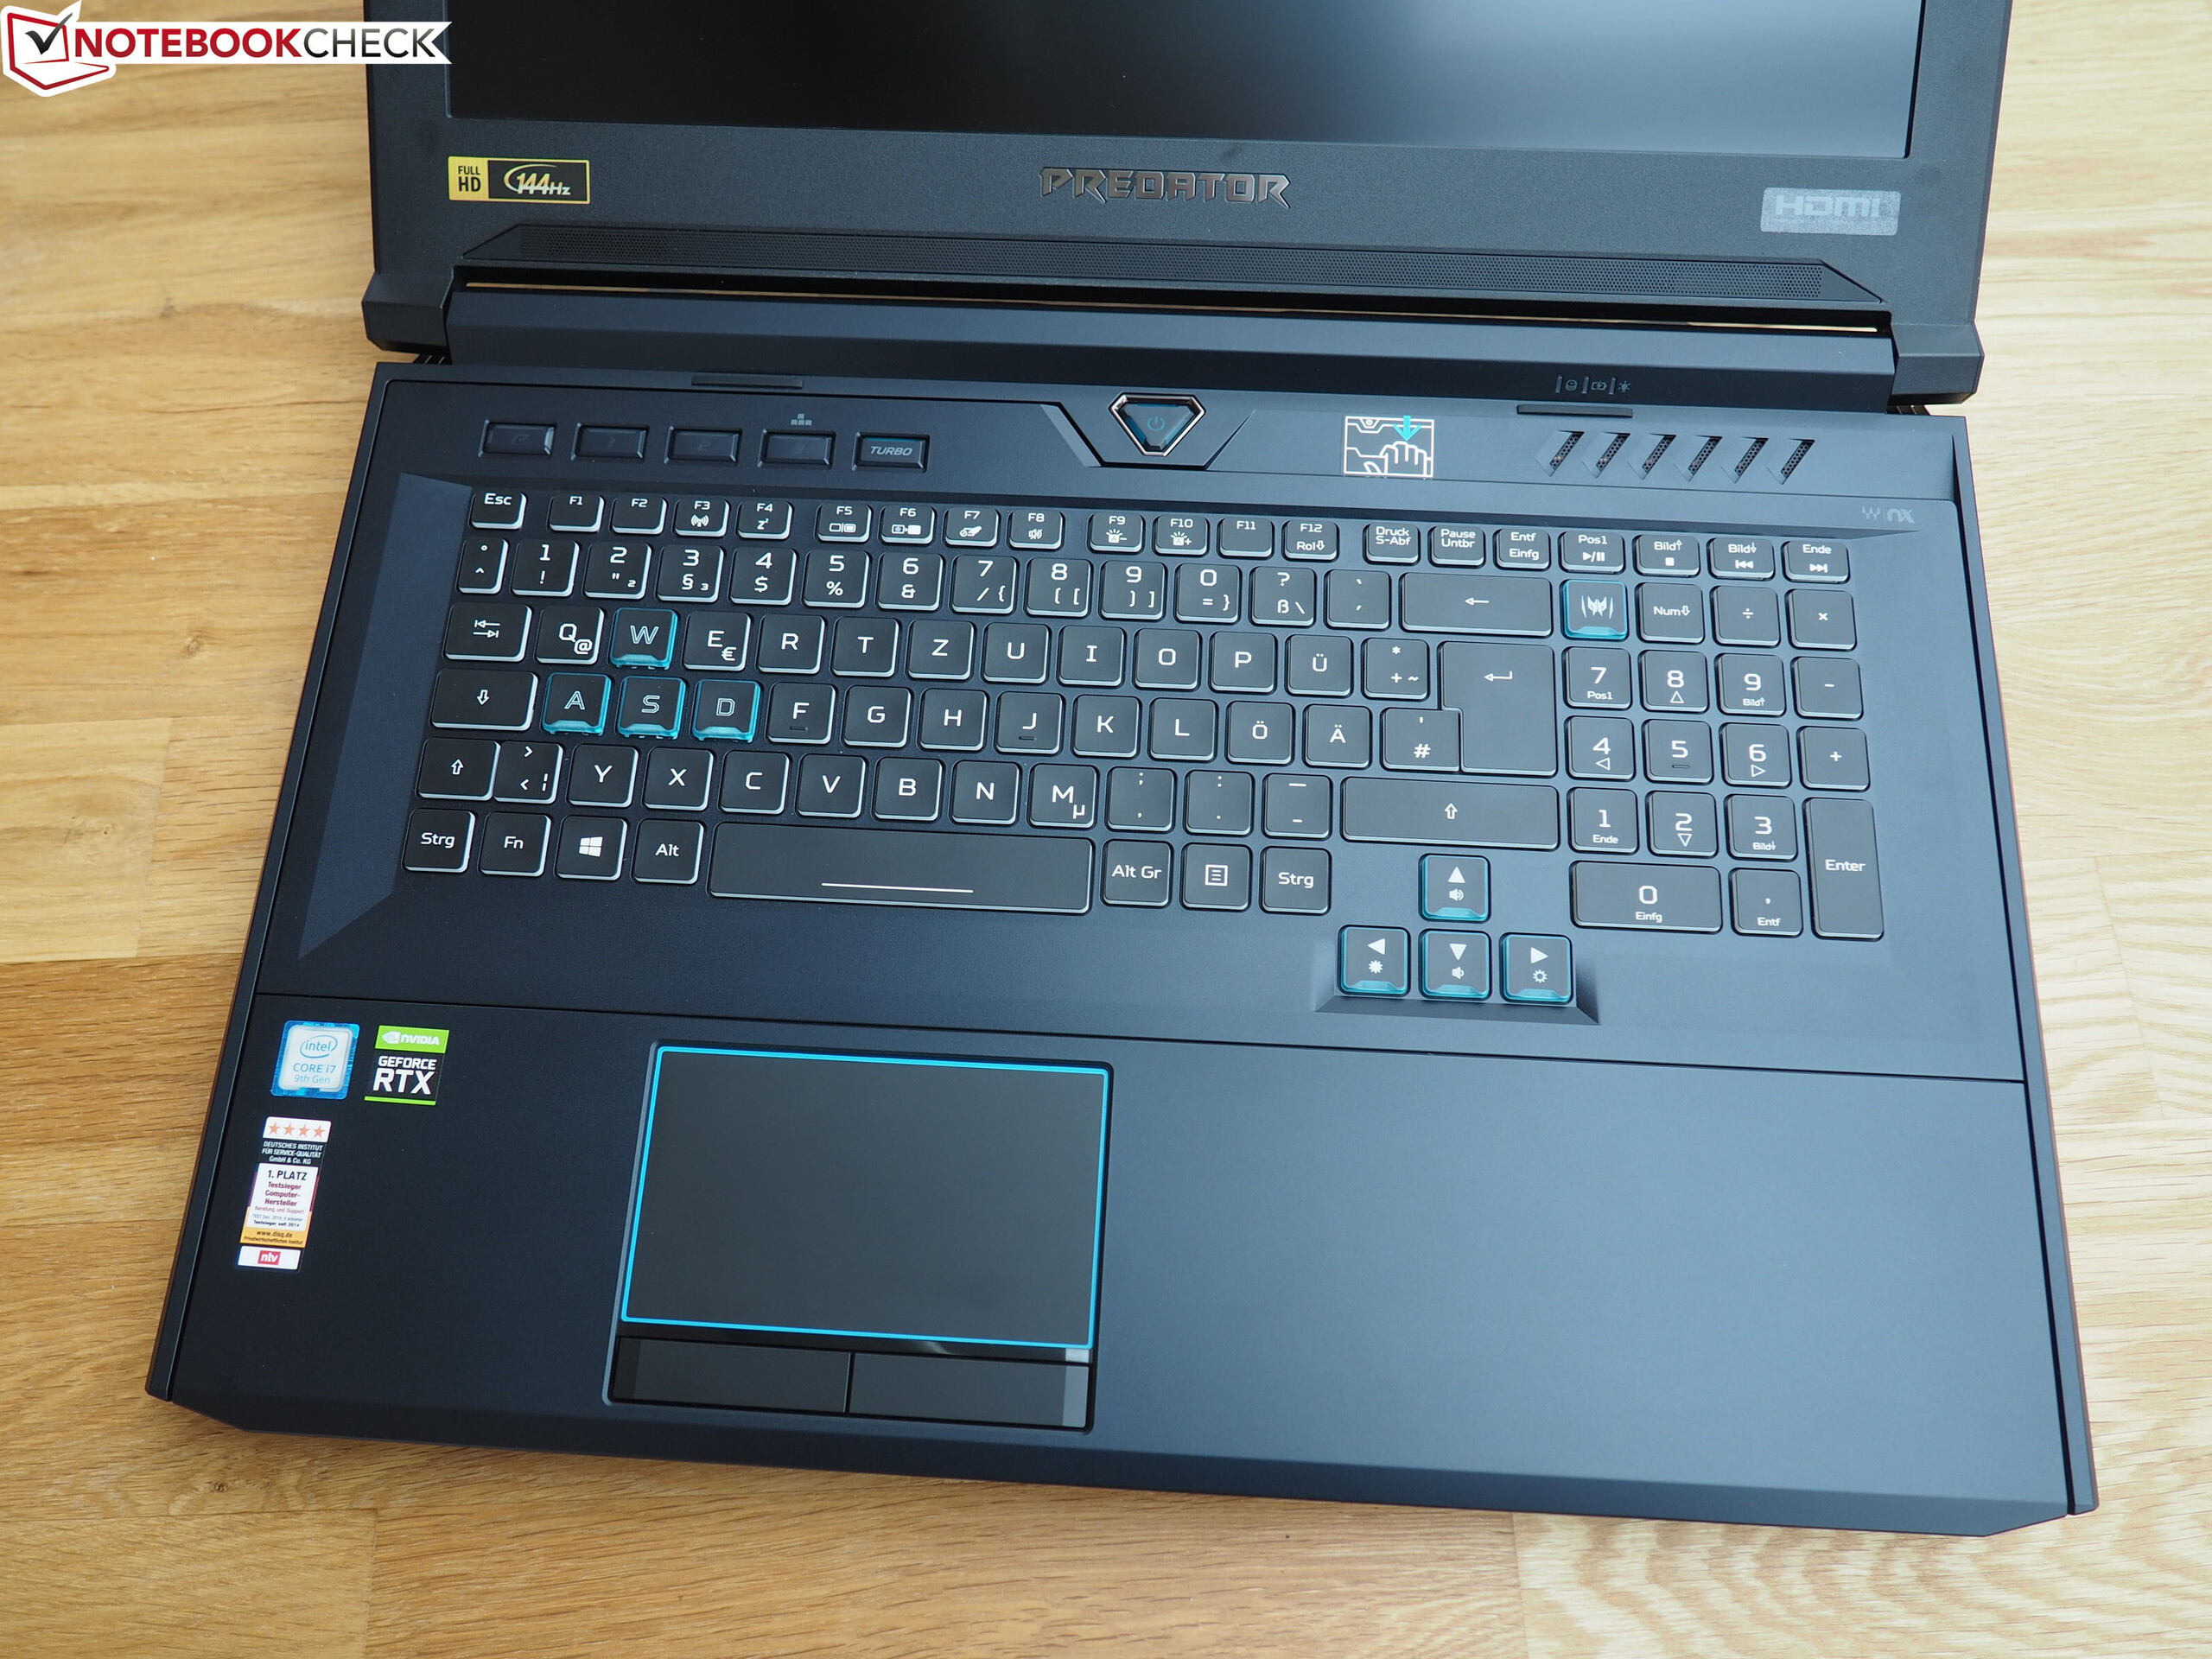
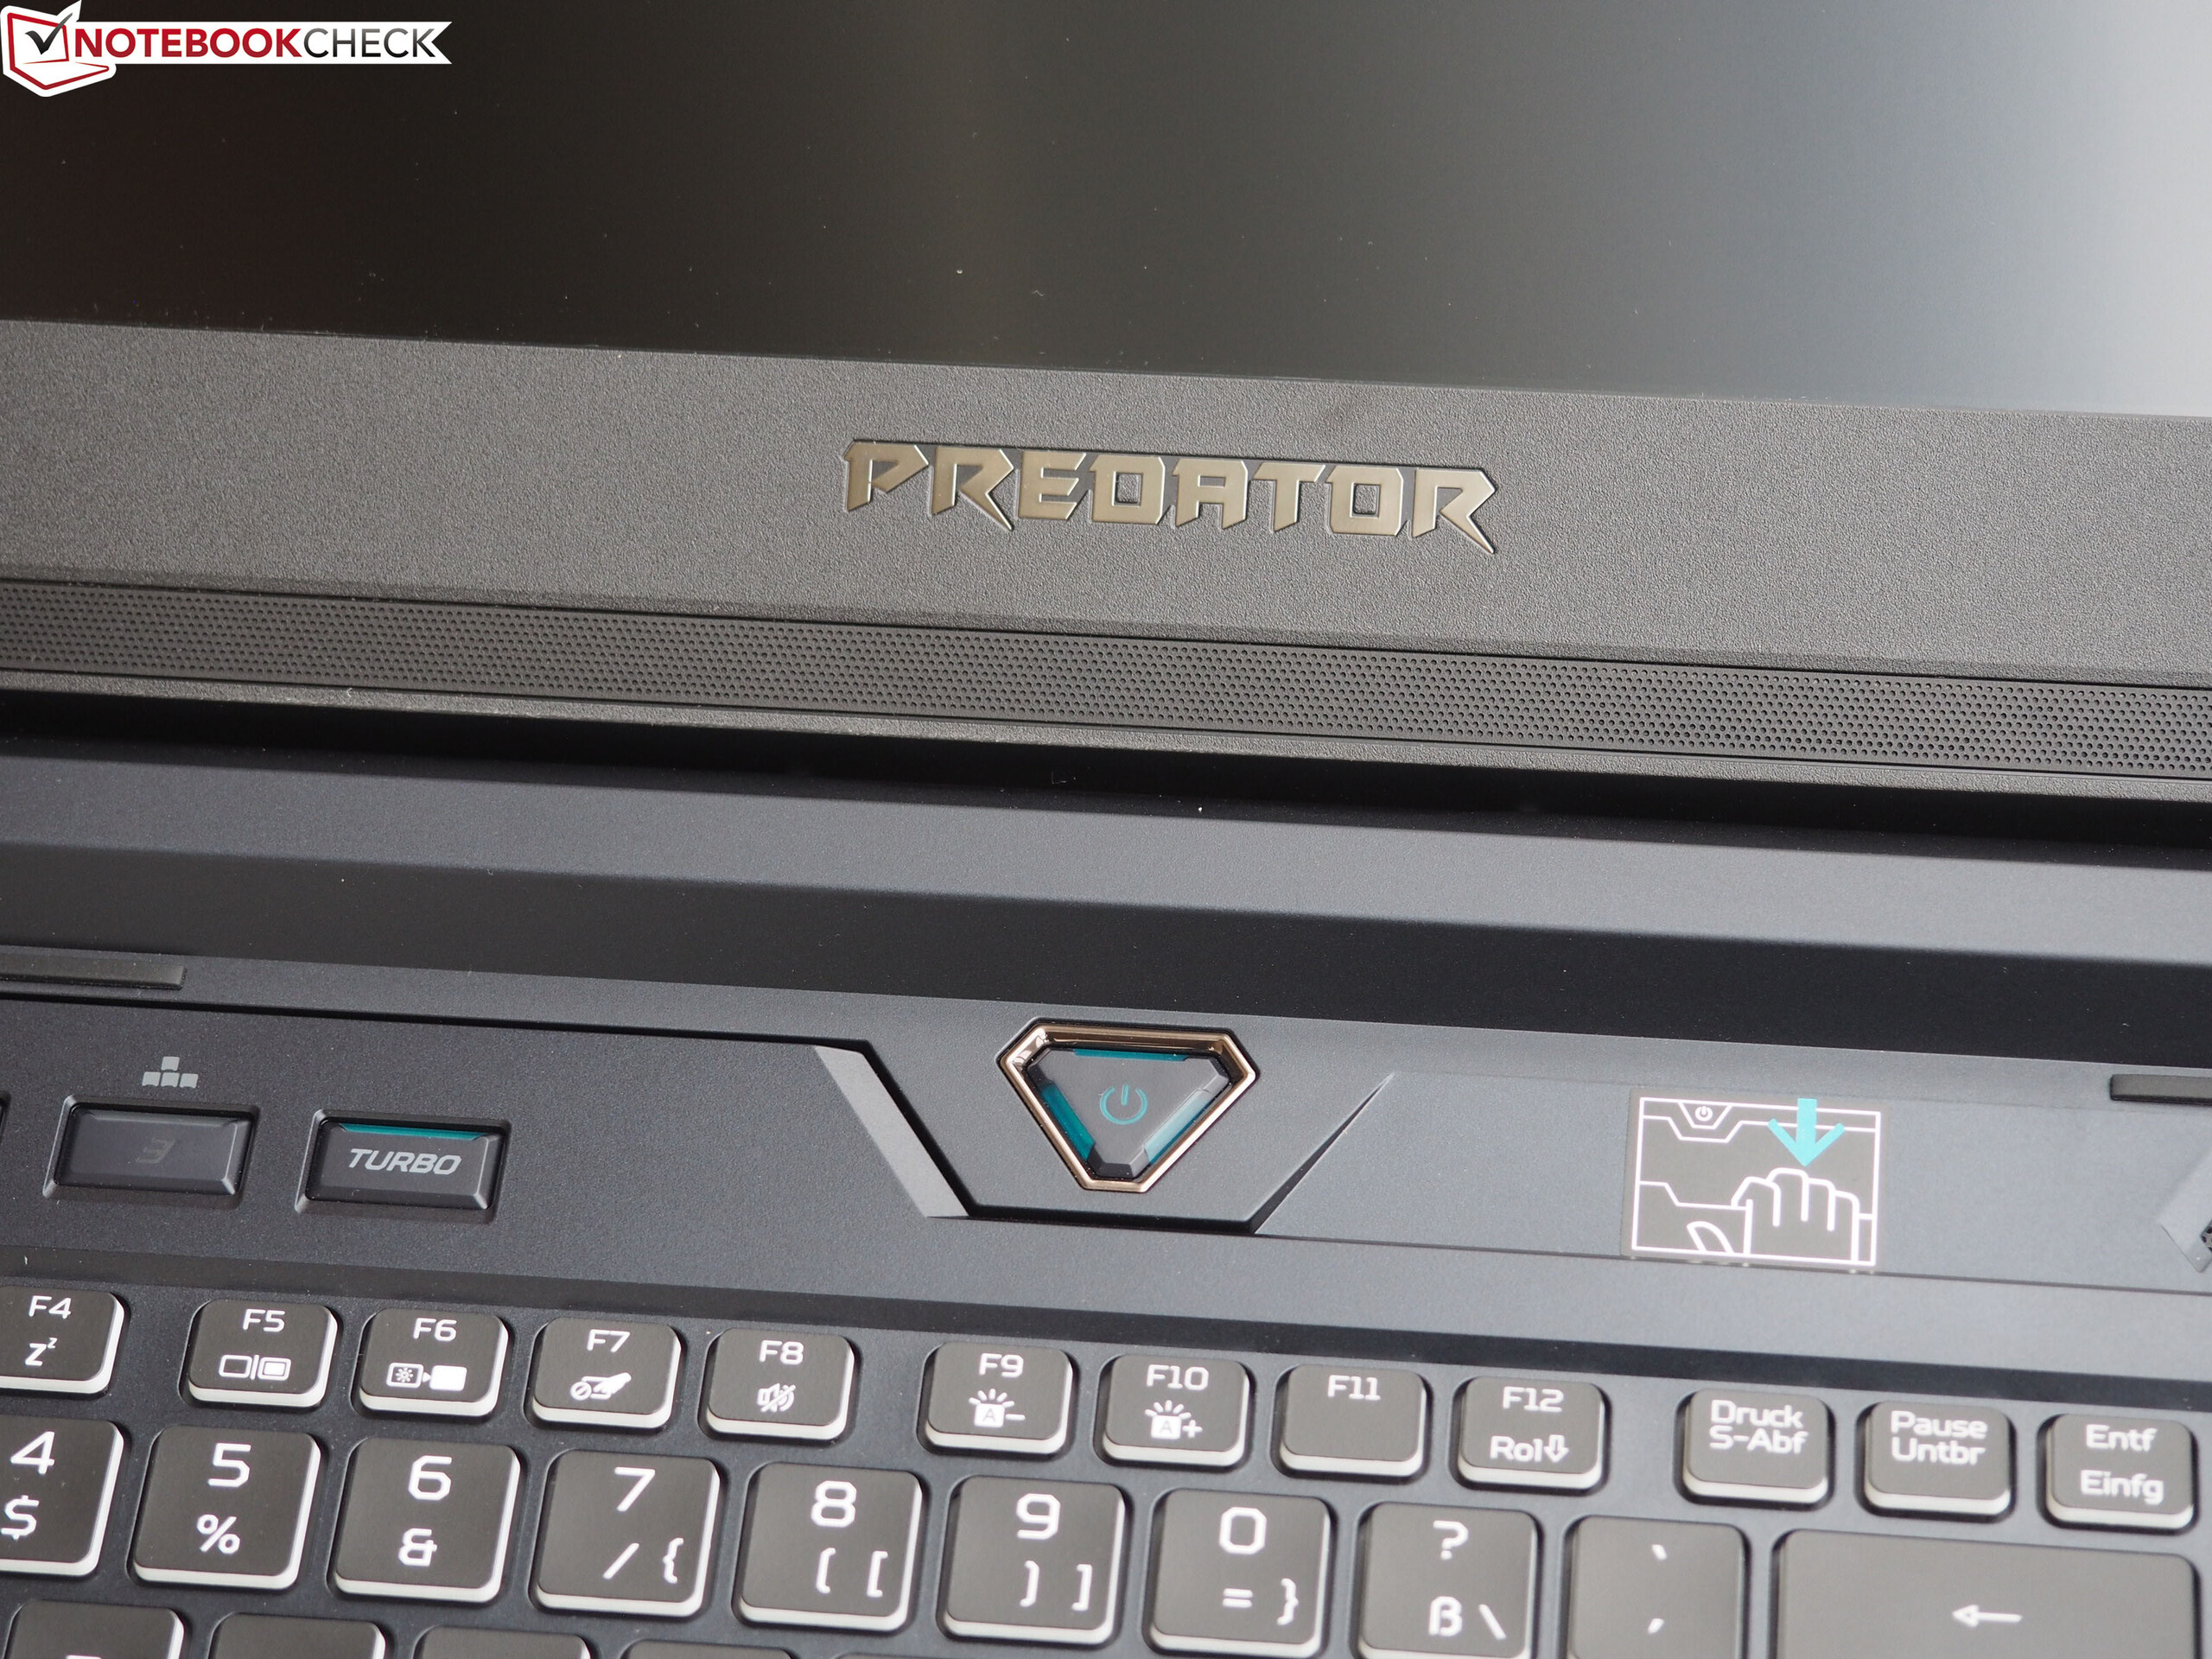
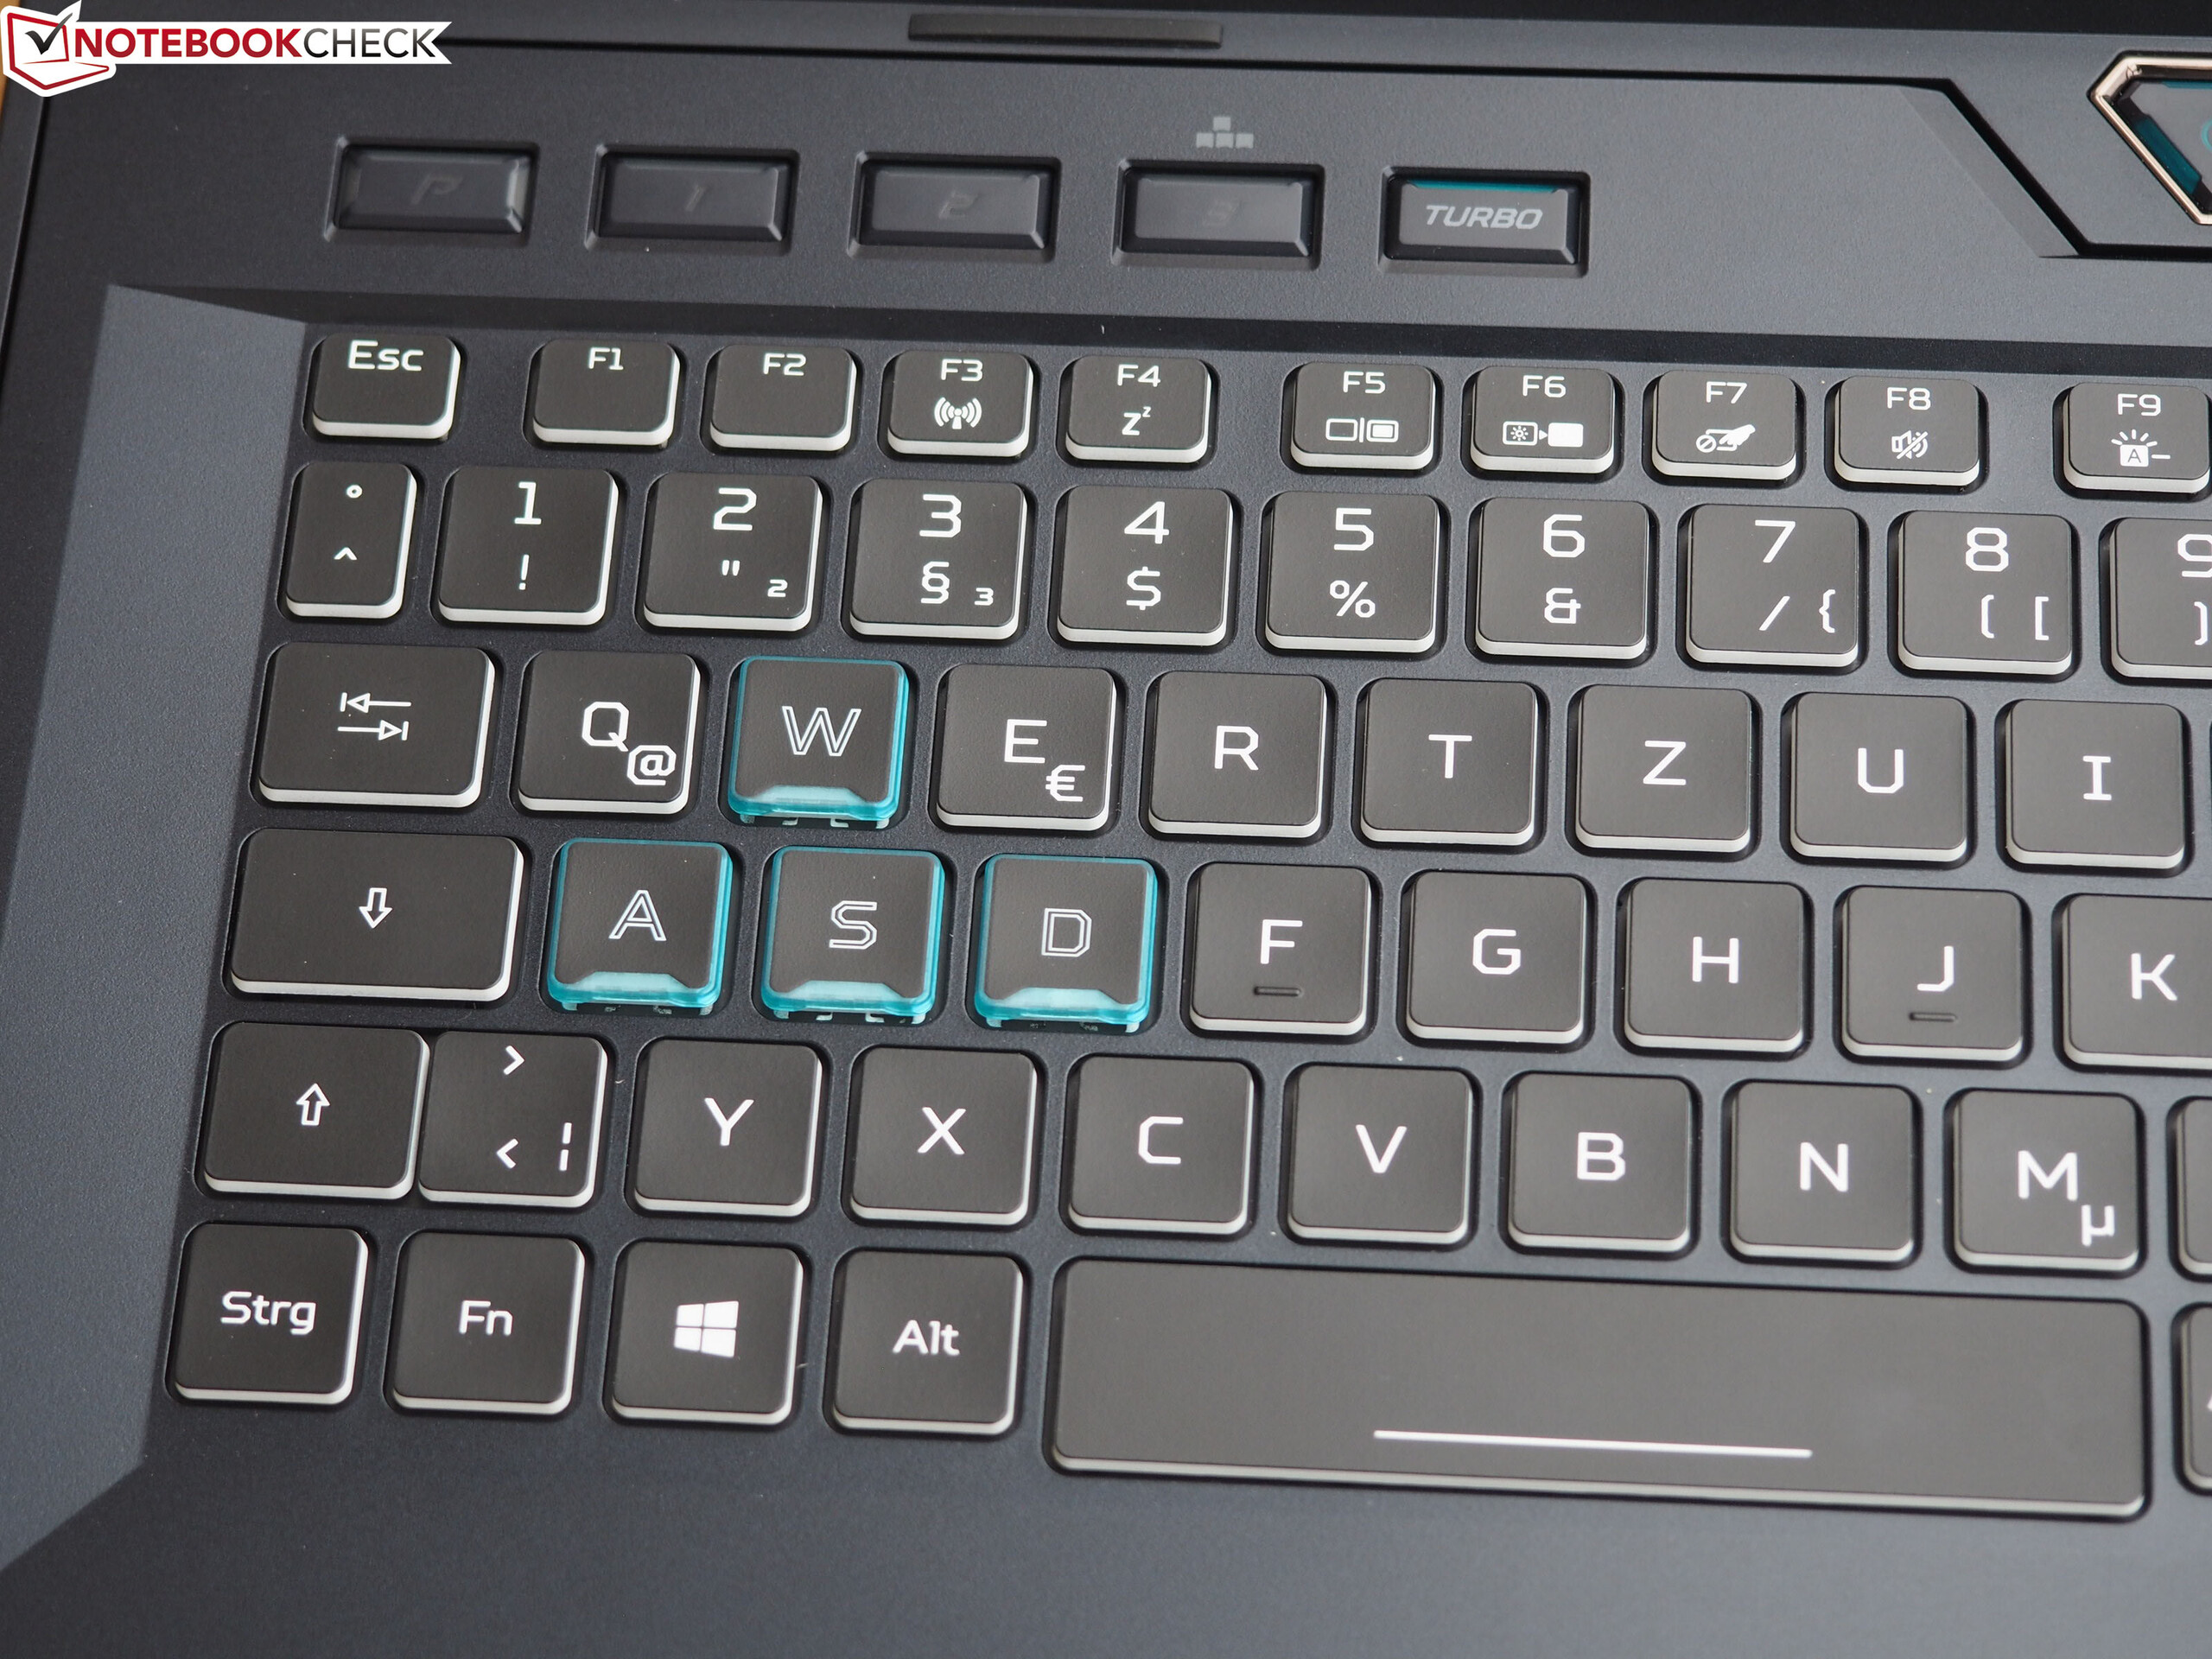
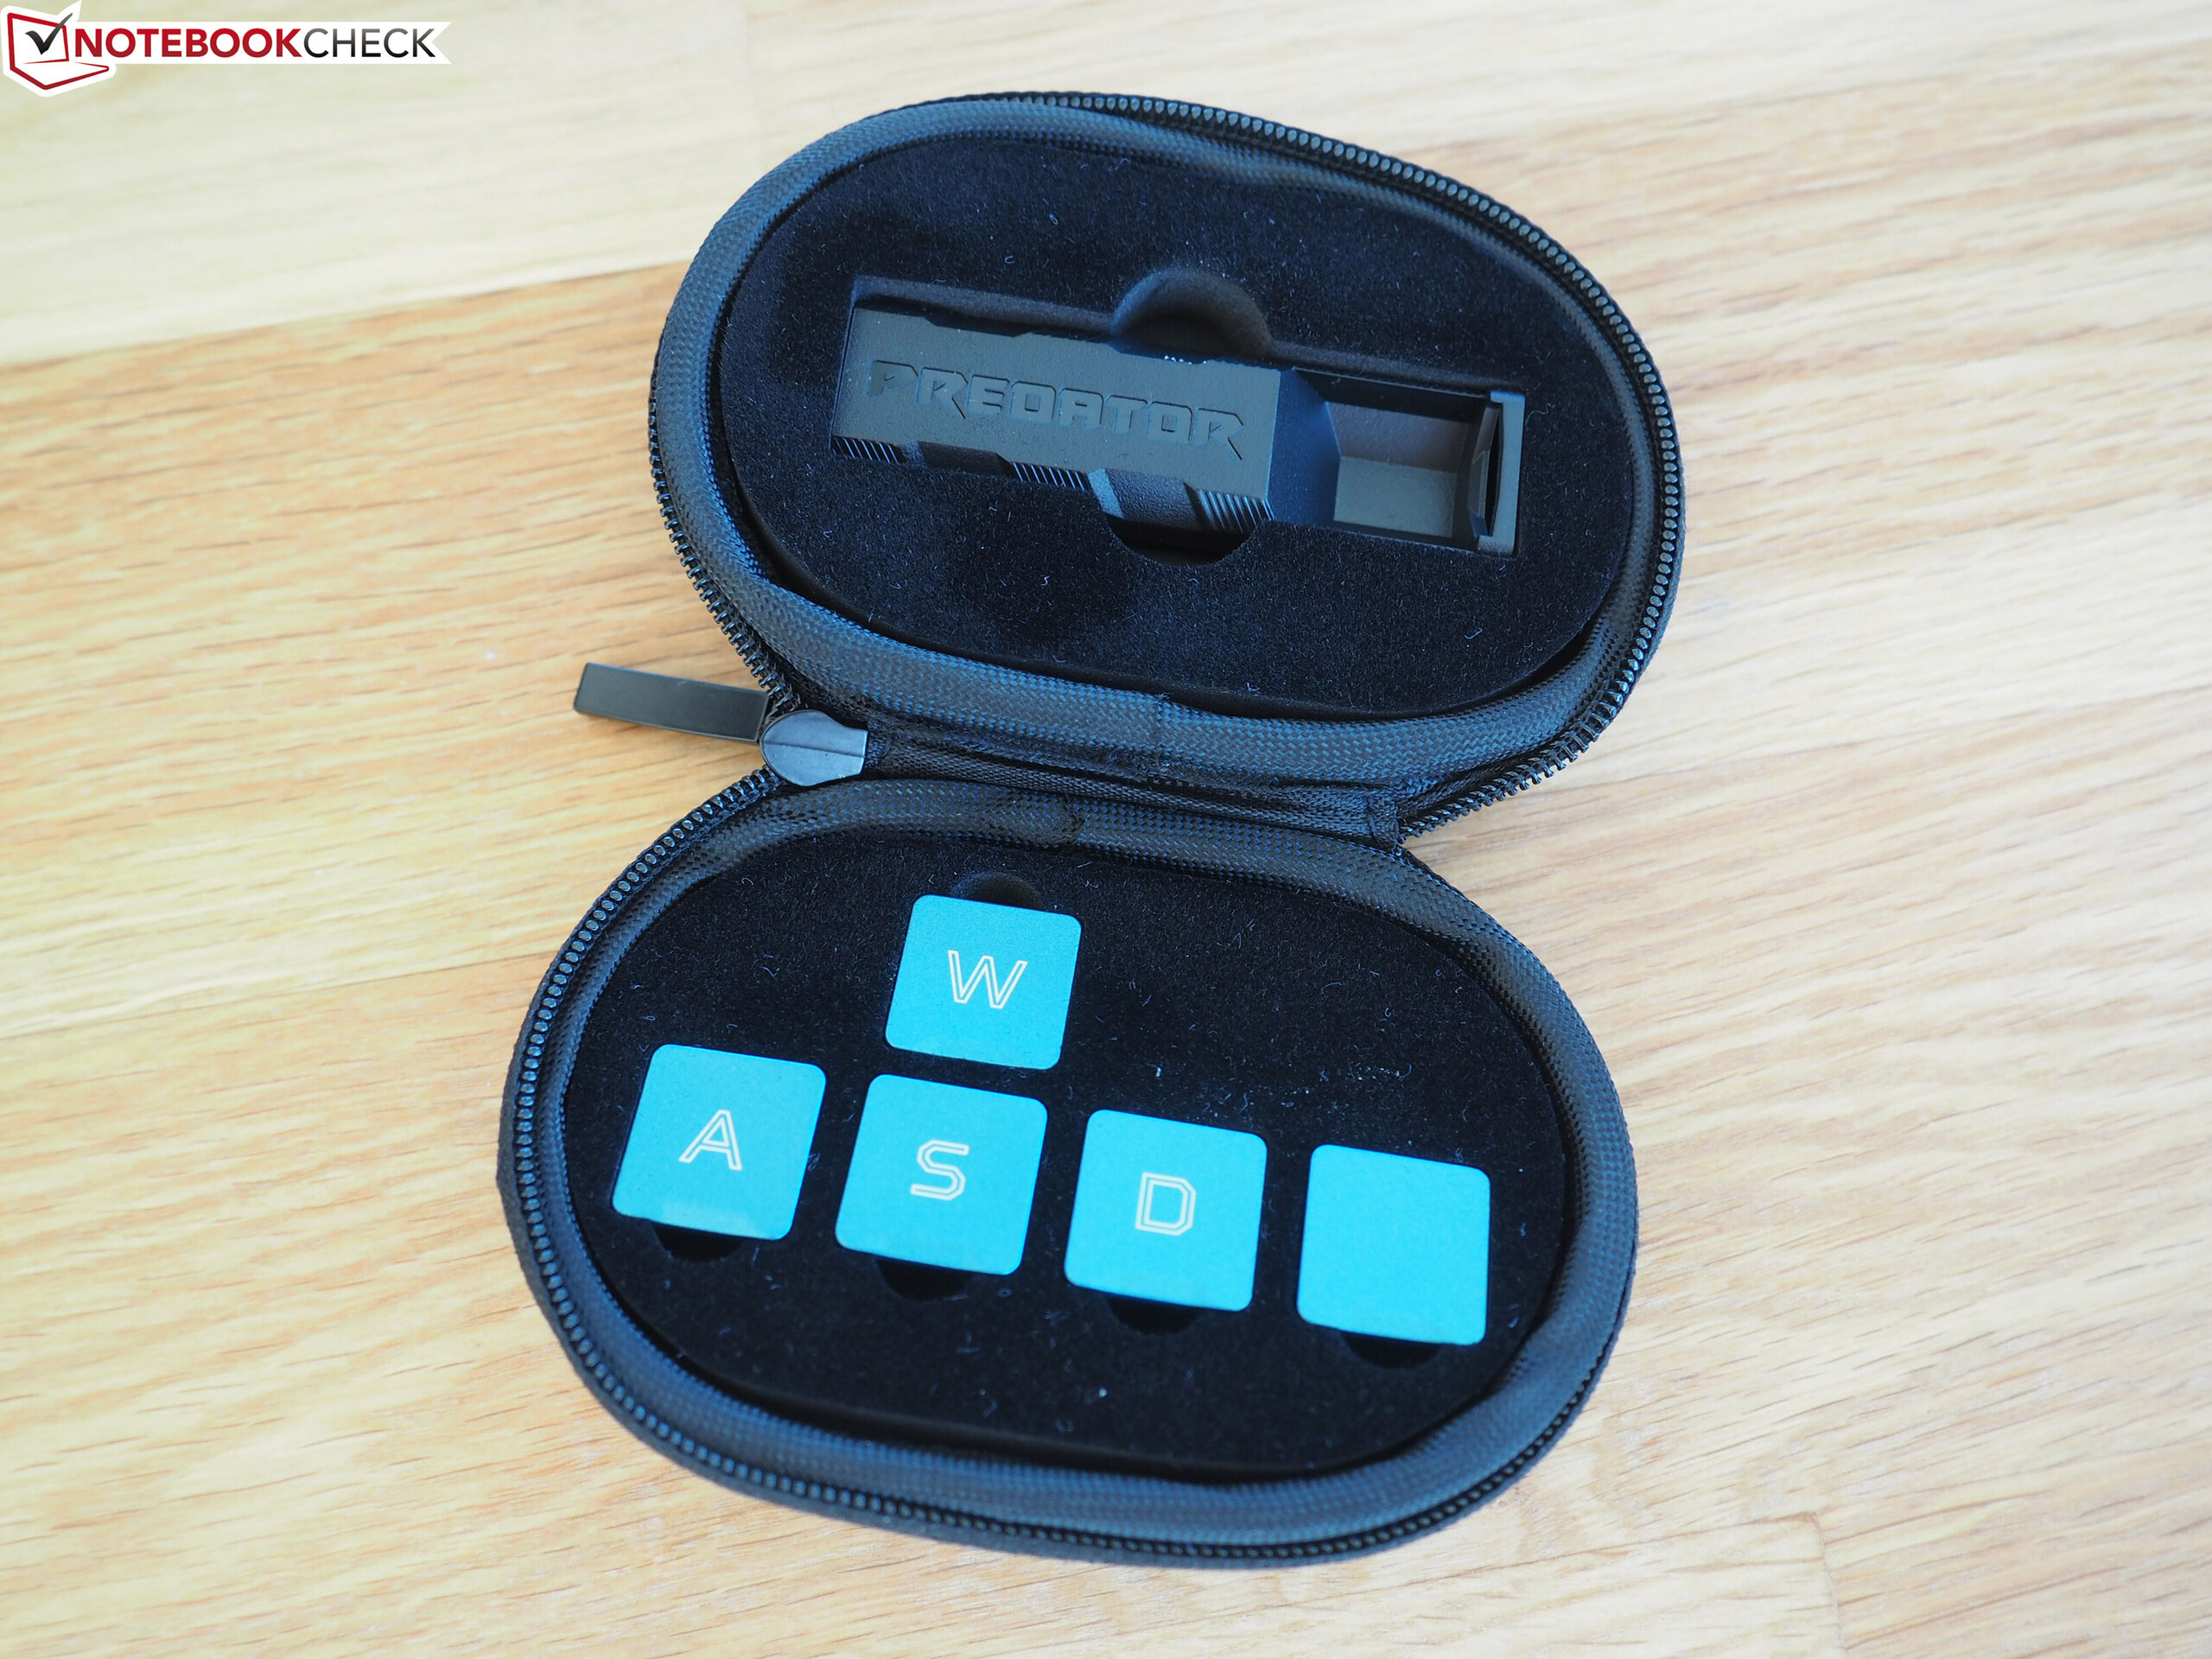
O Predator Helios 700 é um portátil para jogos muito interessante da Acer que apresenta muitas ideias e inovações - de teclas WASD trocáveis a um mecanismo deslizante para os dispositivos de entrada - embora a Acer não use este sistema de resfriamento aprimorado para limitar as emissões de ruído, mas para melhorar o desempenho.
O fabricante faz overclock de sua GPU GeForce para tirar o máximo proveito dela. O dispositivo permanece confortavelmente frio, mesmo durante o overclock, mas fica muito barulhento. Não foi tanto o nível geral de ruído que nos incomodou, mas mais as taxas de RPM flutuantes, que muitas vezes eram infundadas. Em resumo: A Acer definitivamente deve trabalhar em seu sistema de resfriamento.
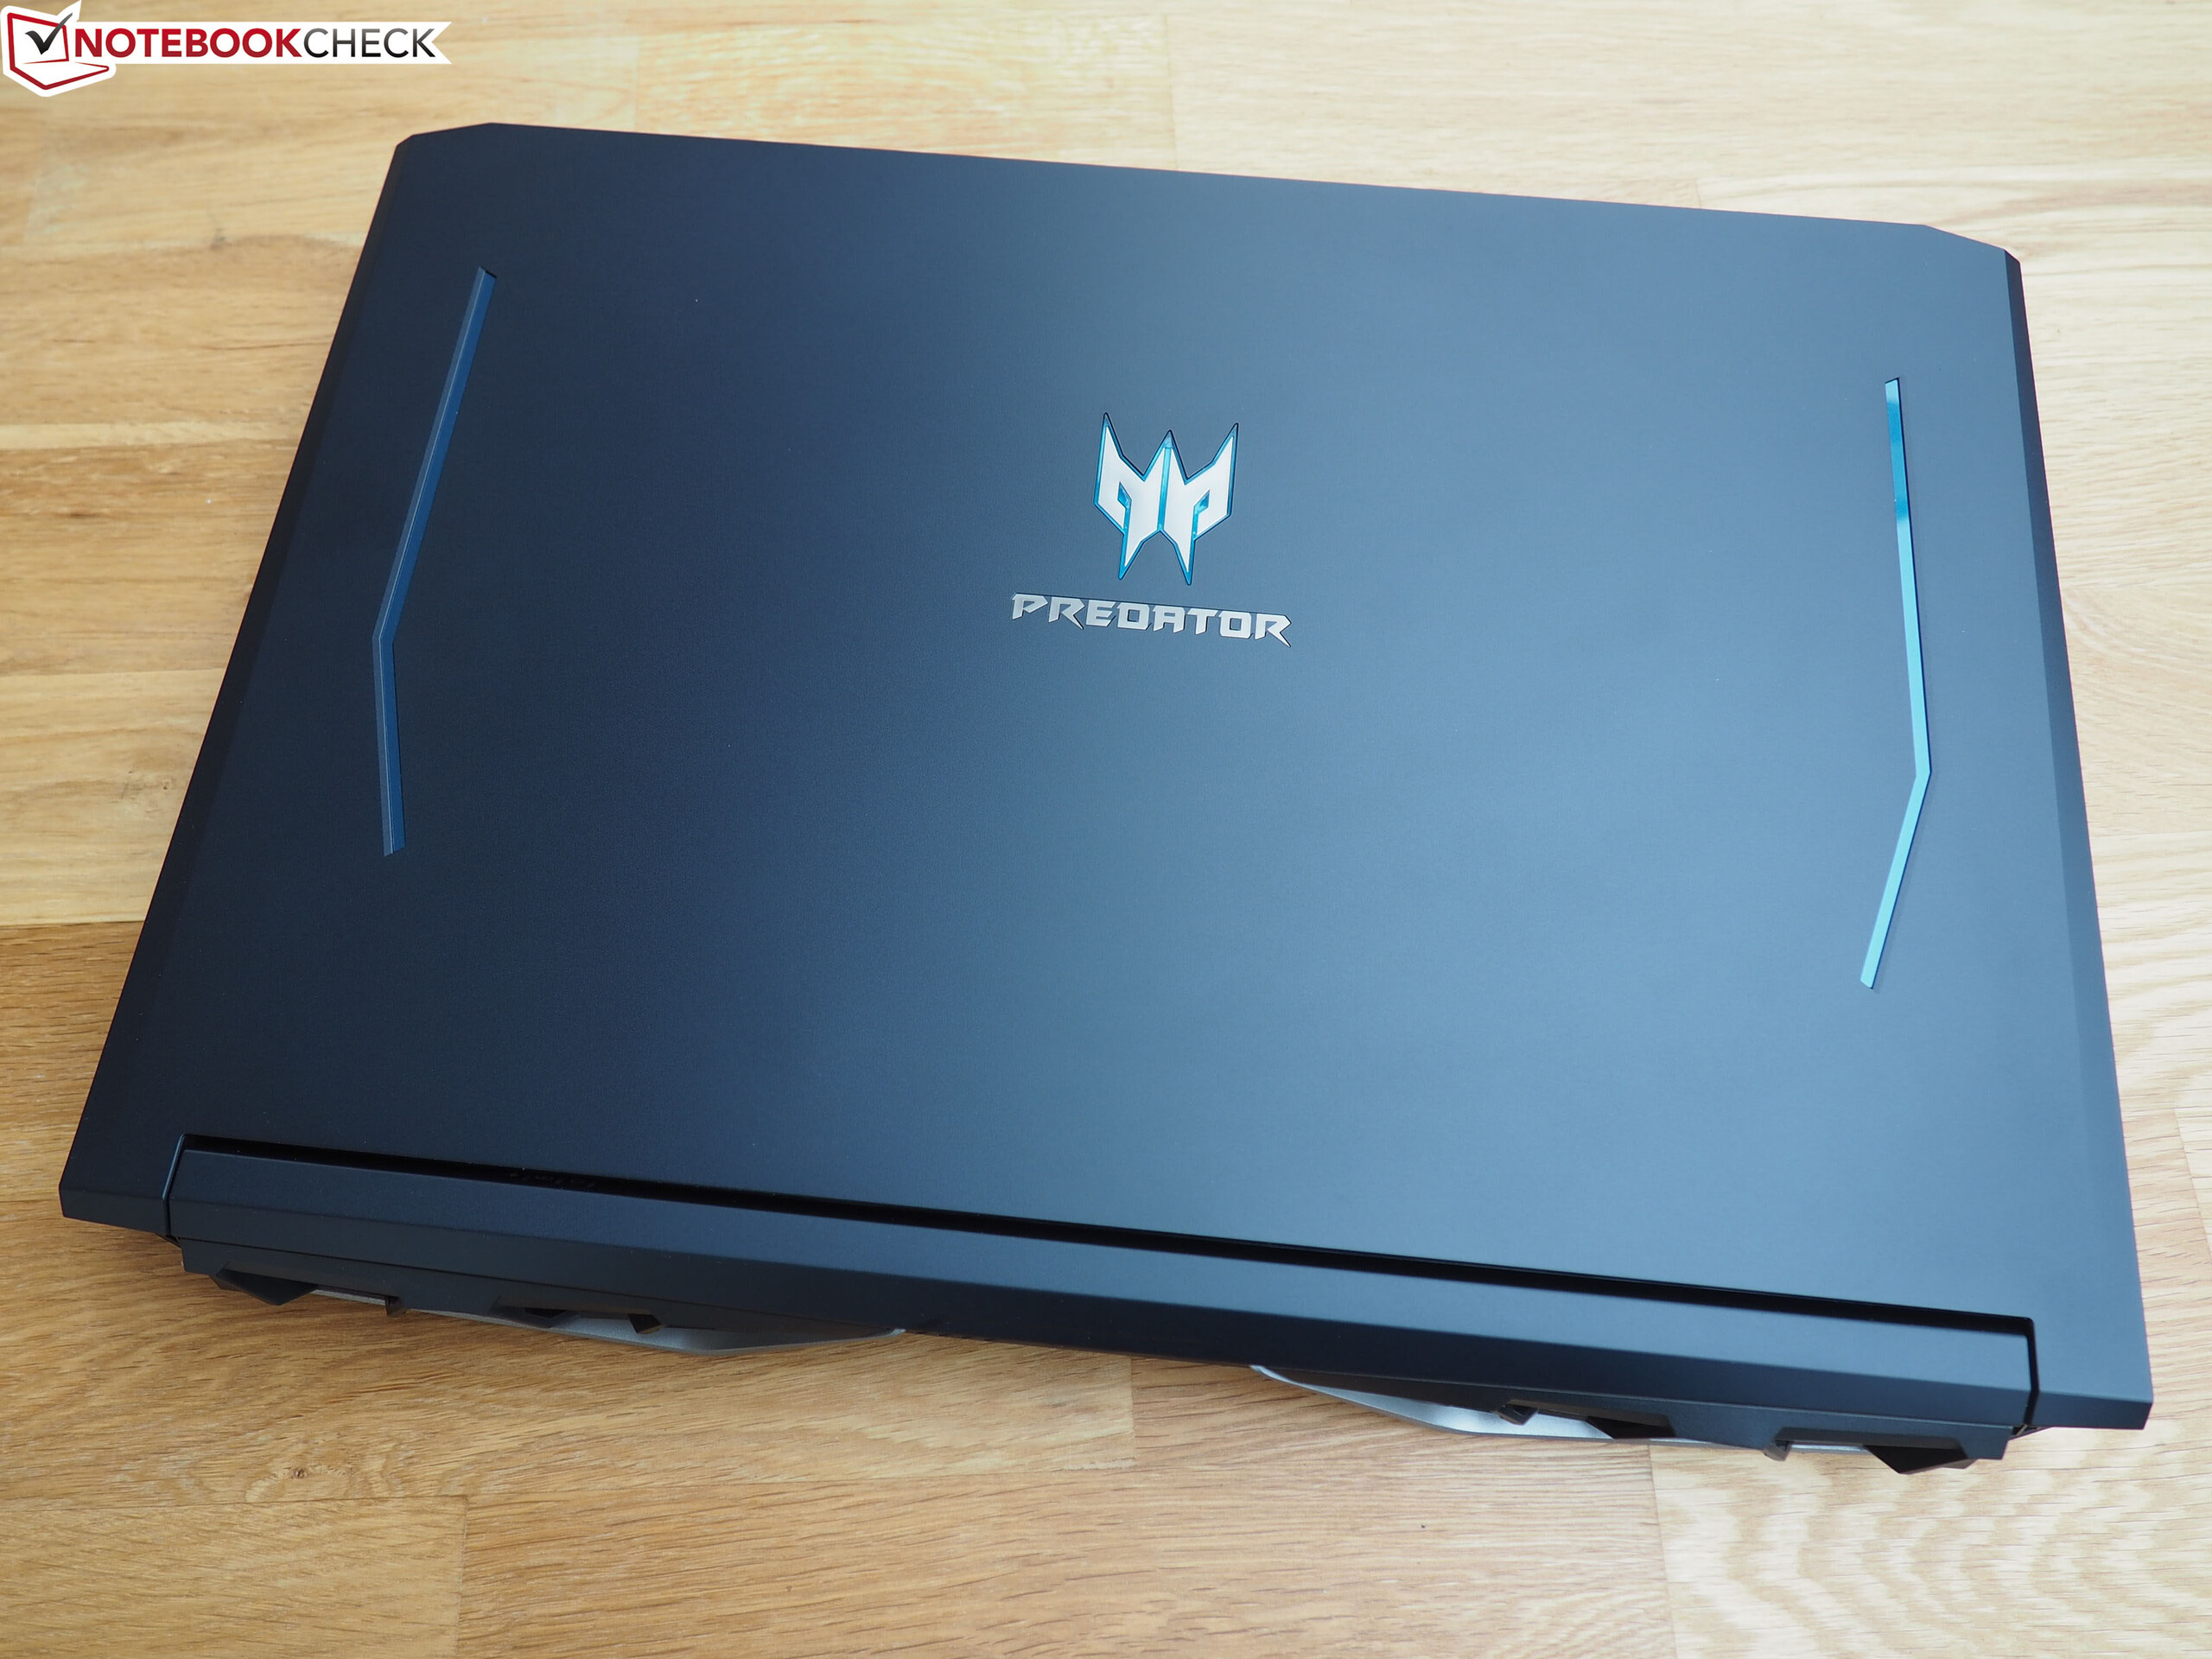
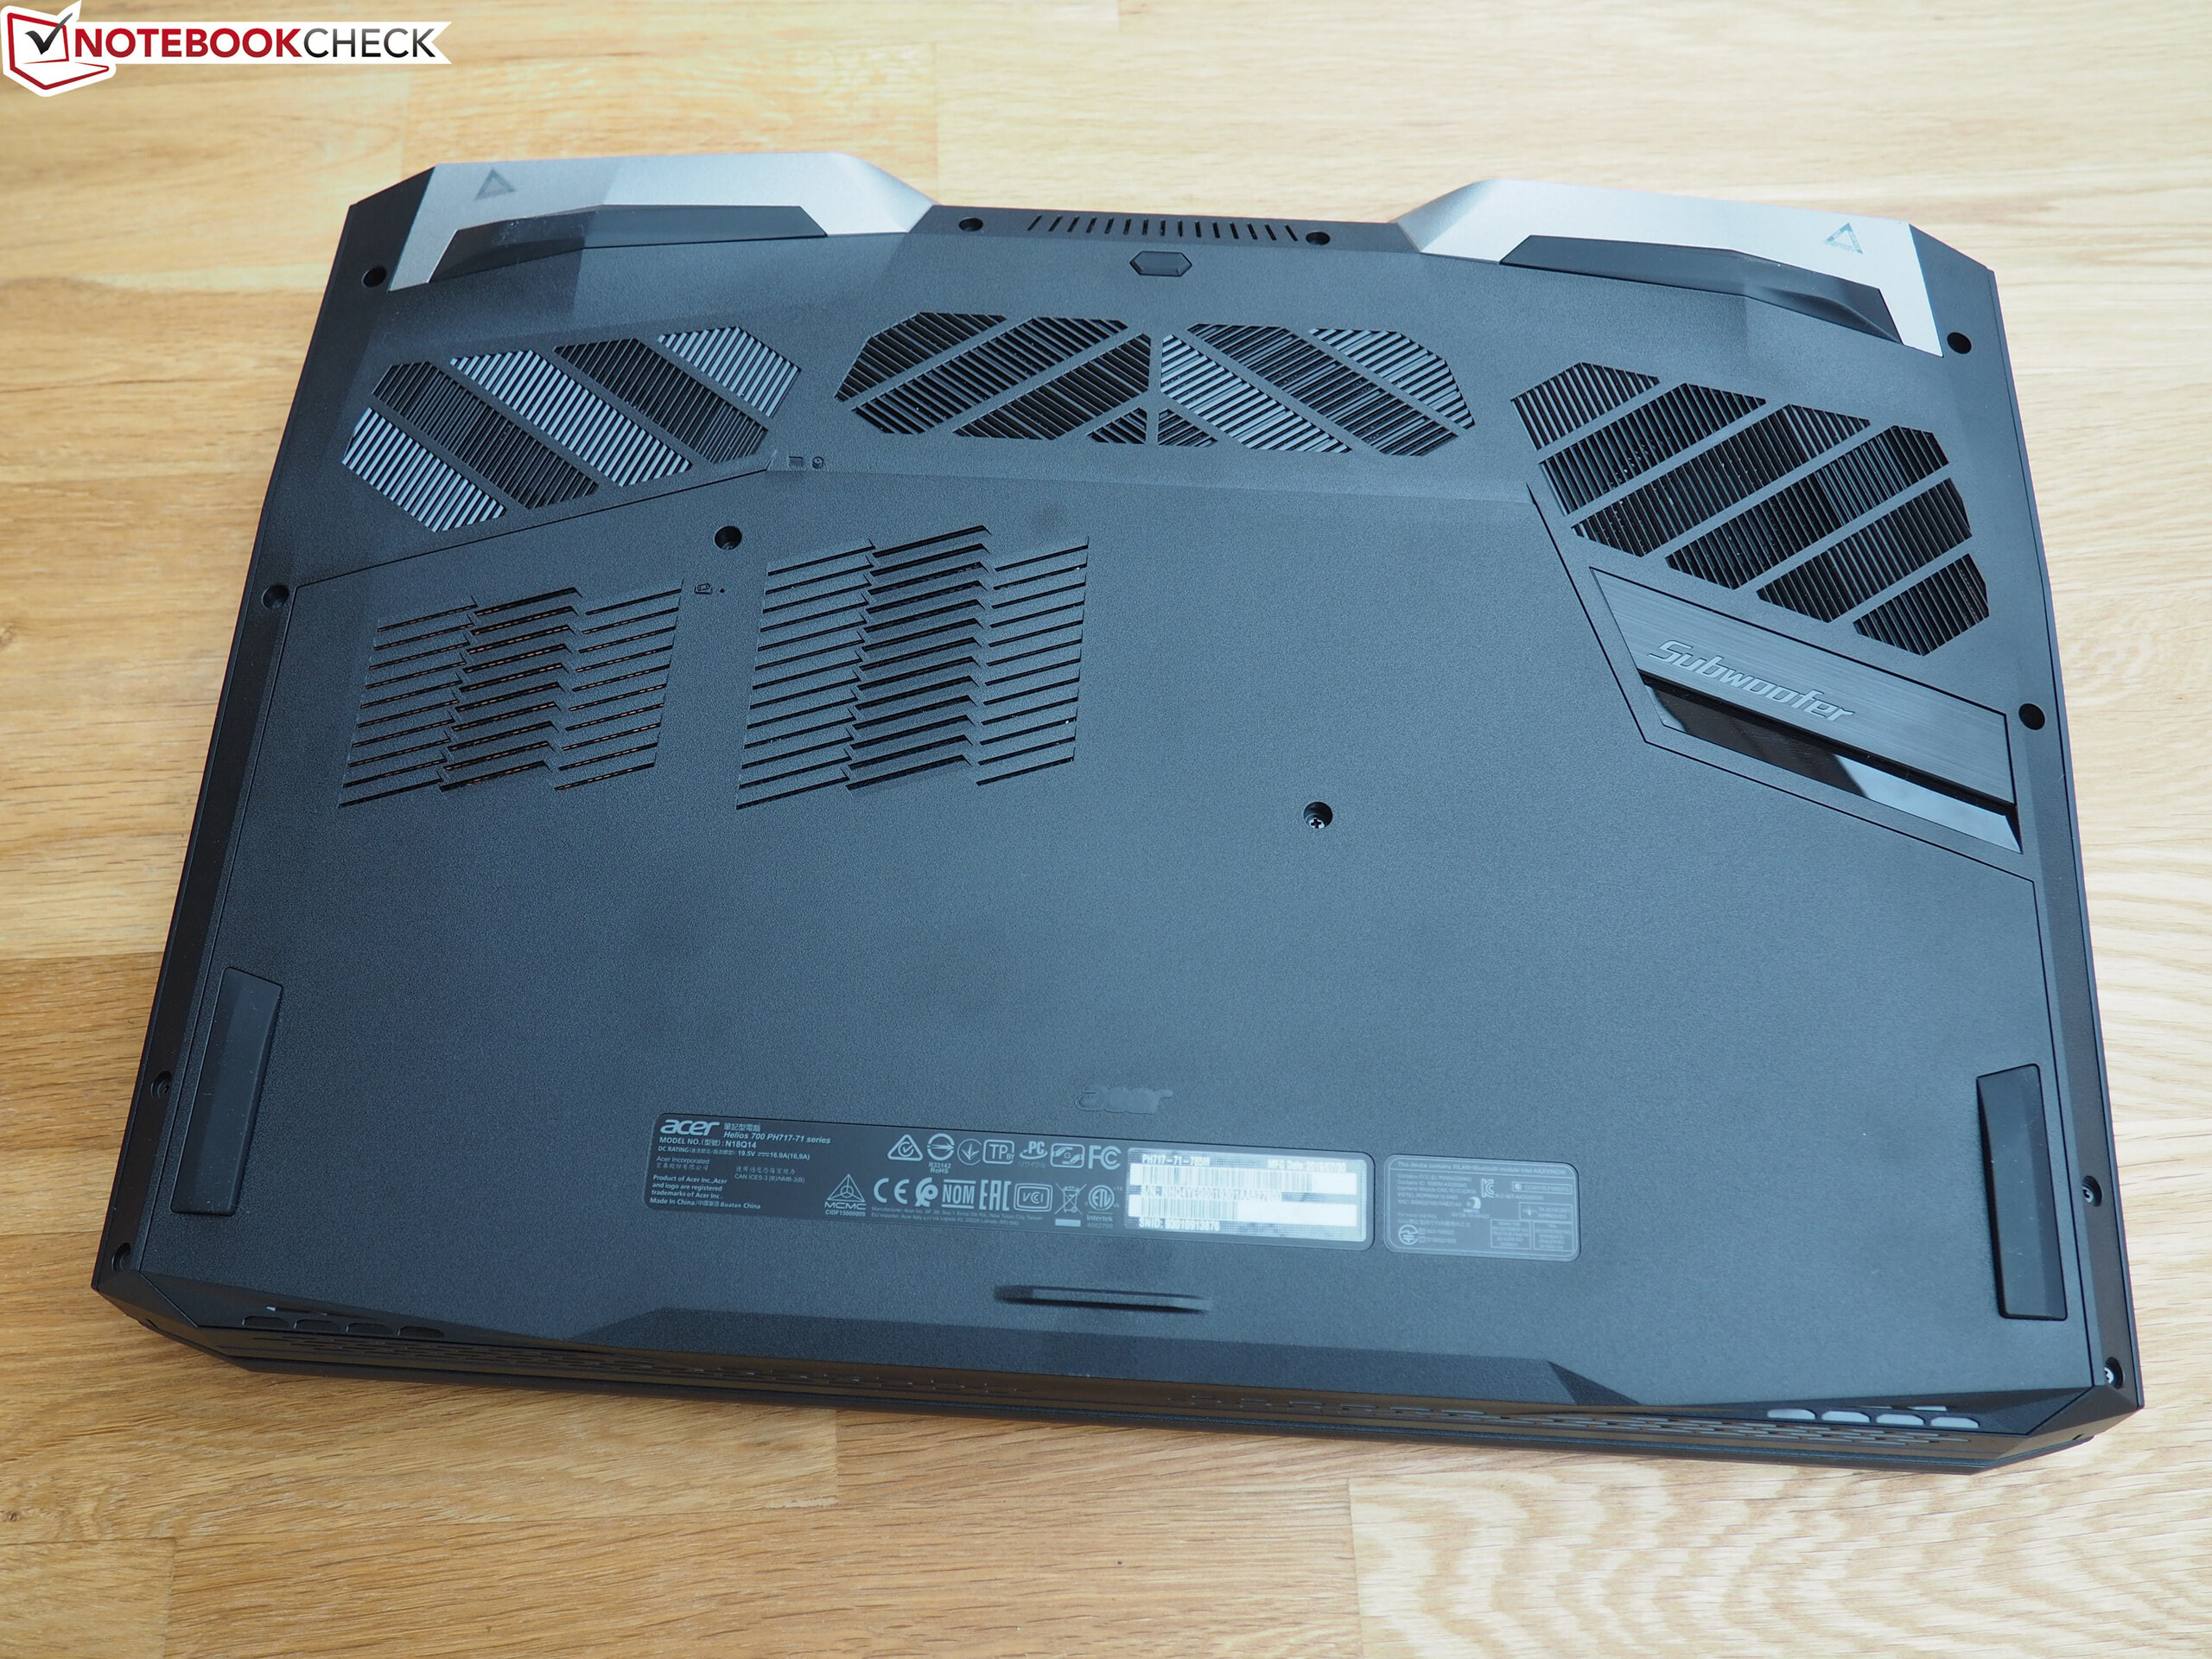
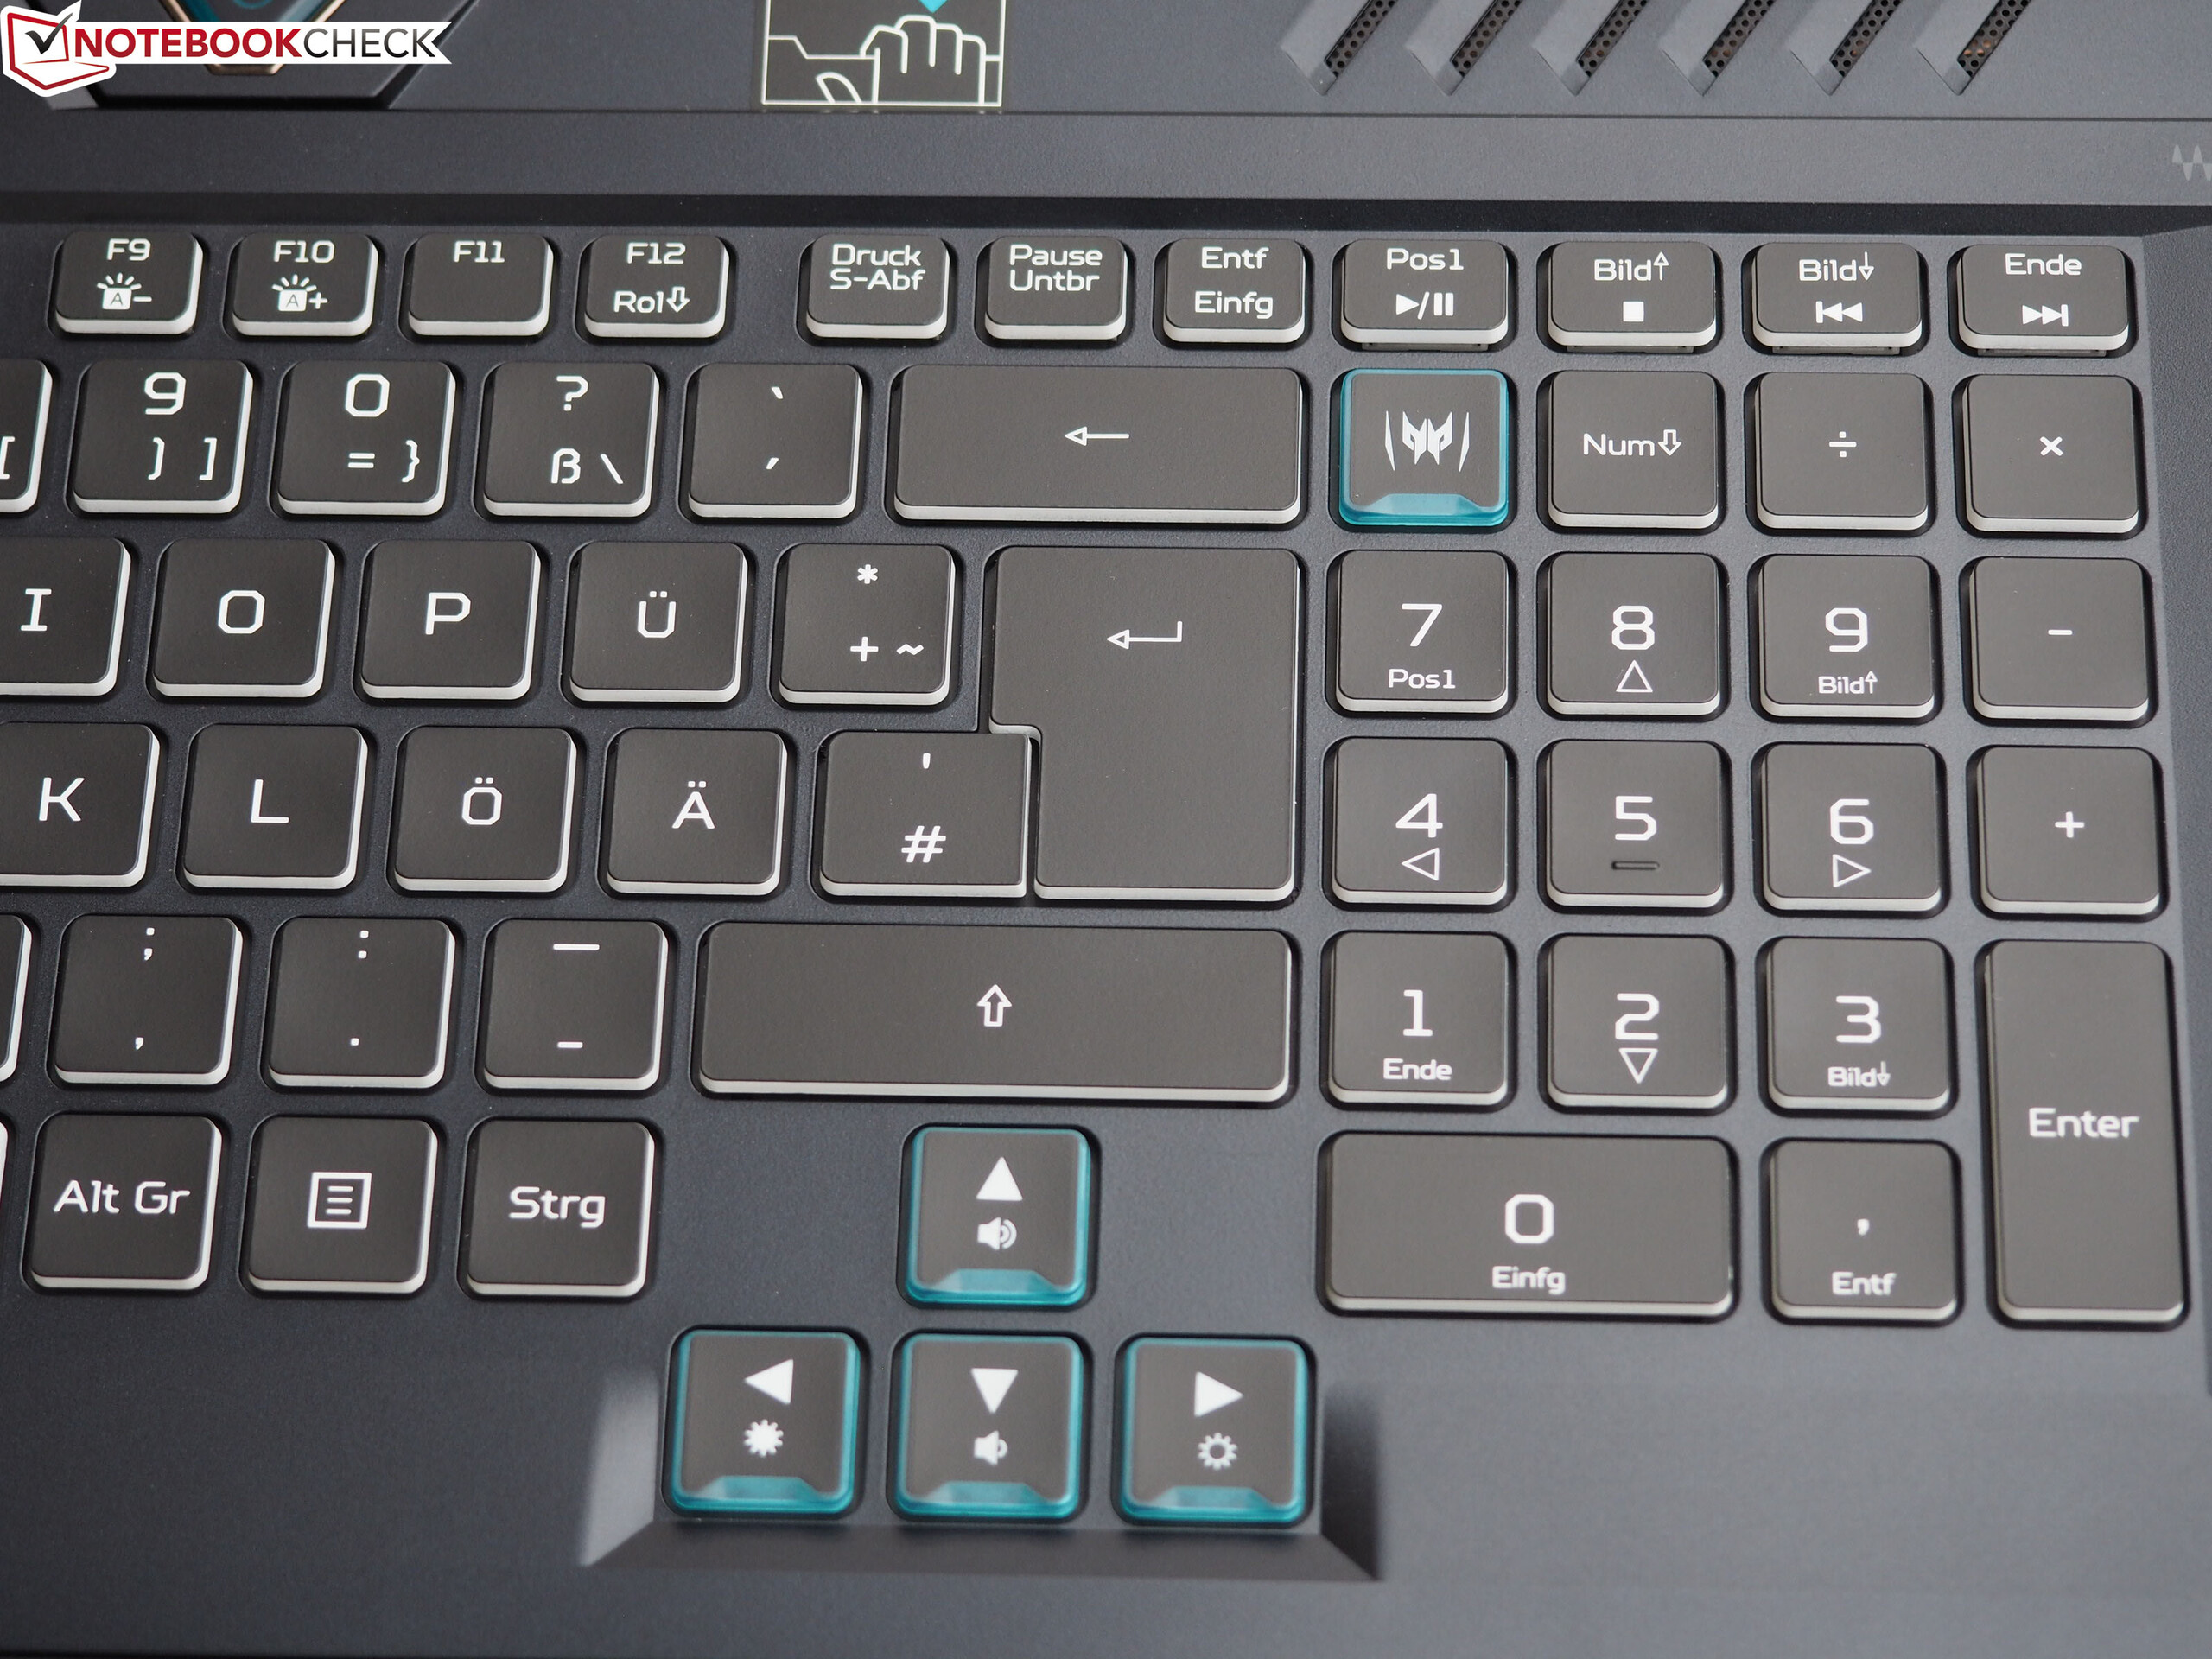
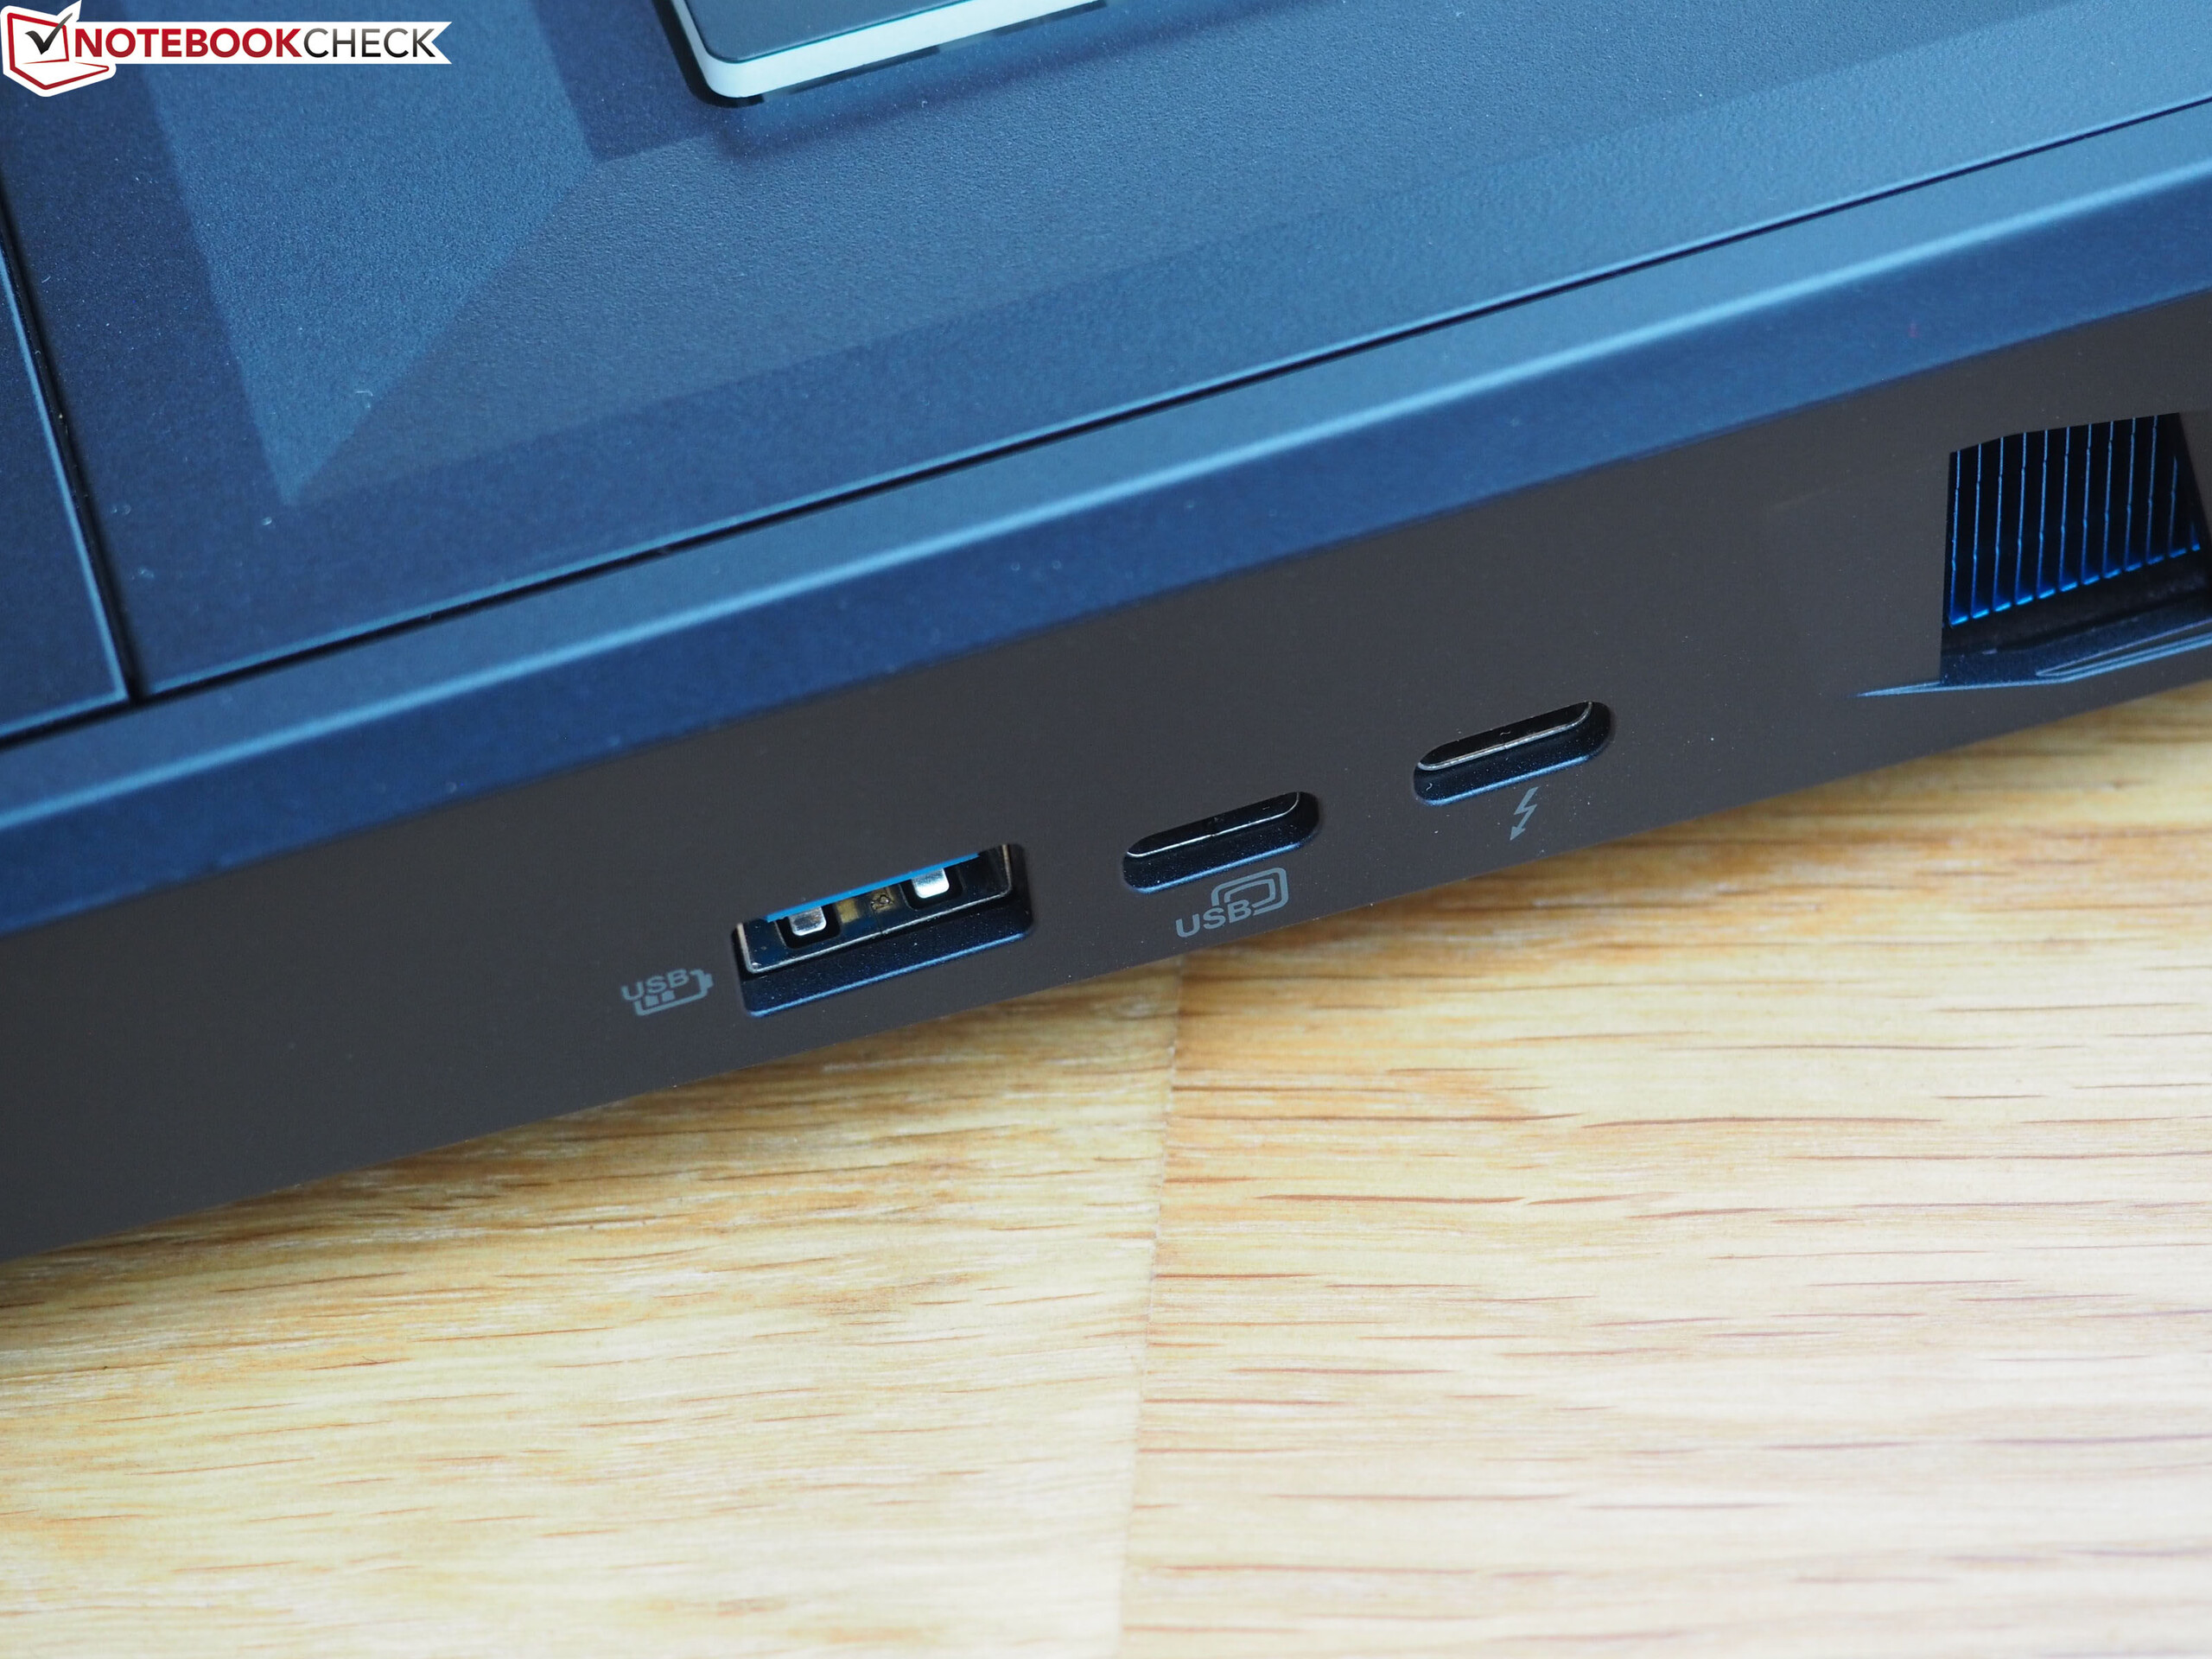
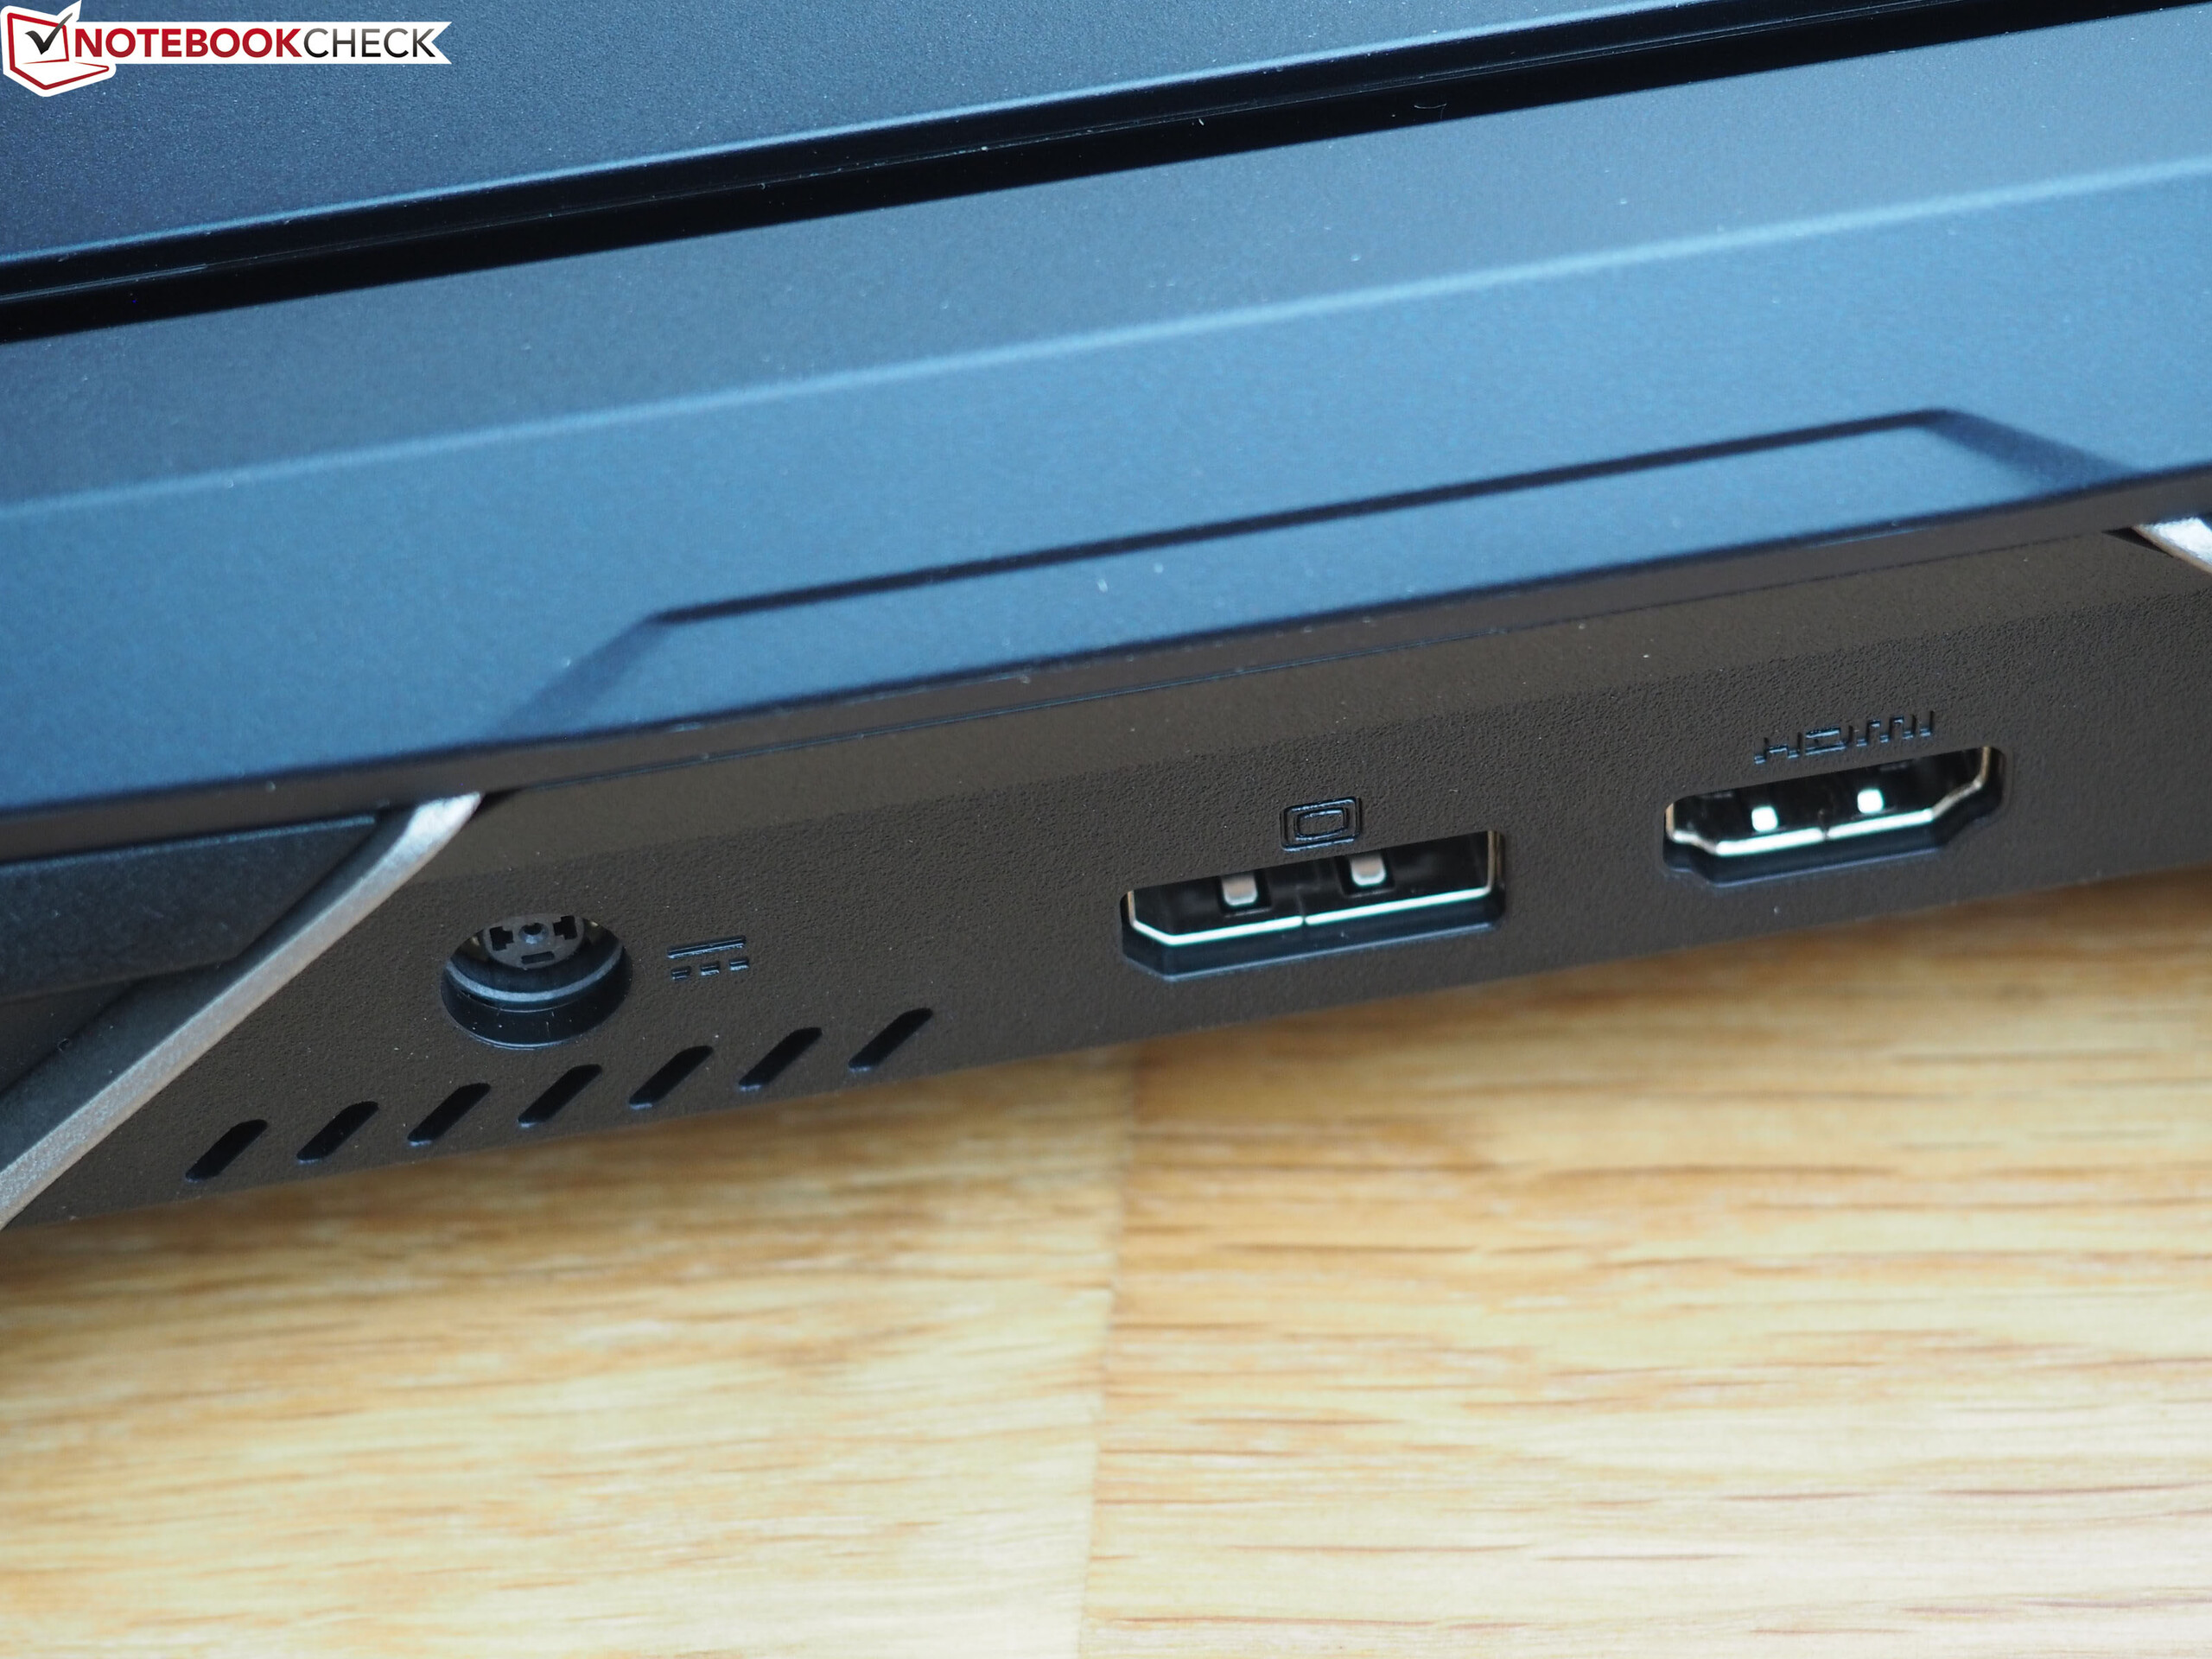
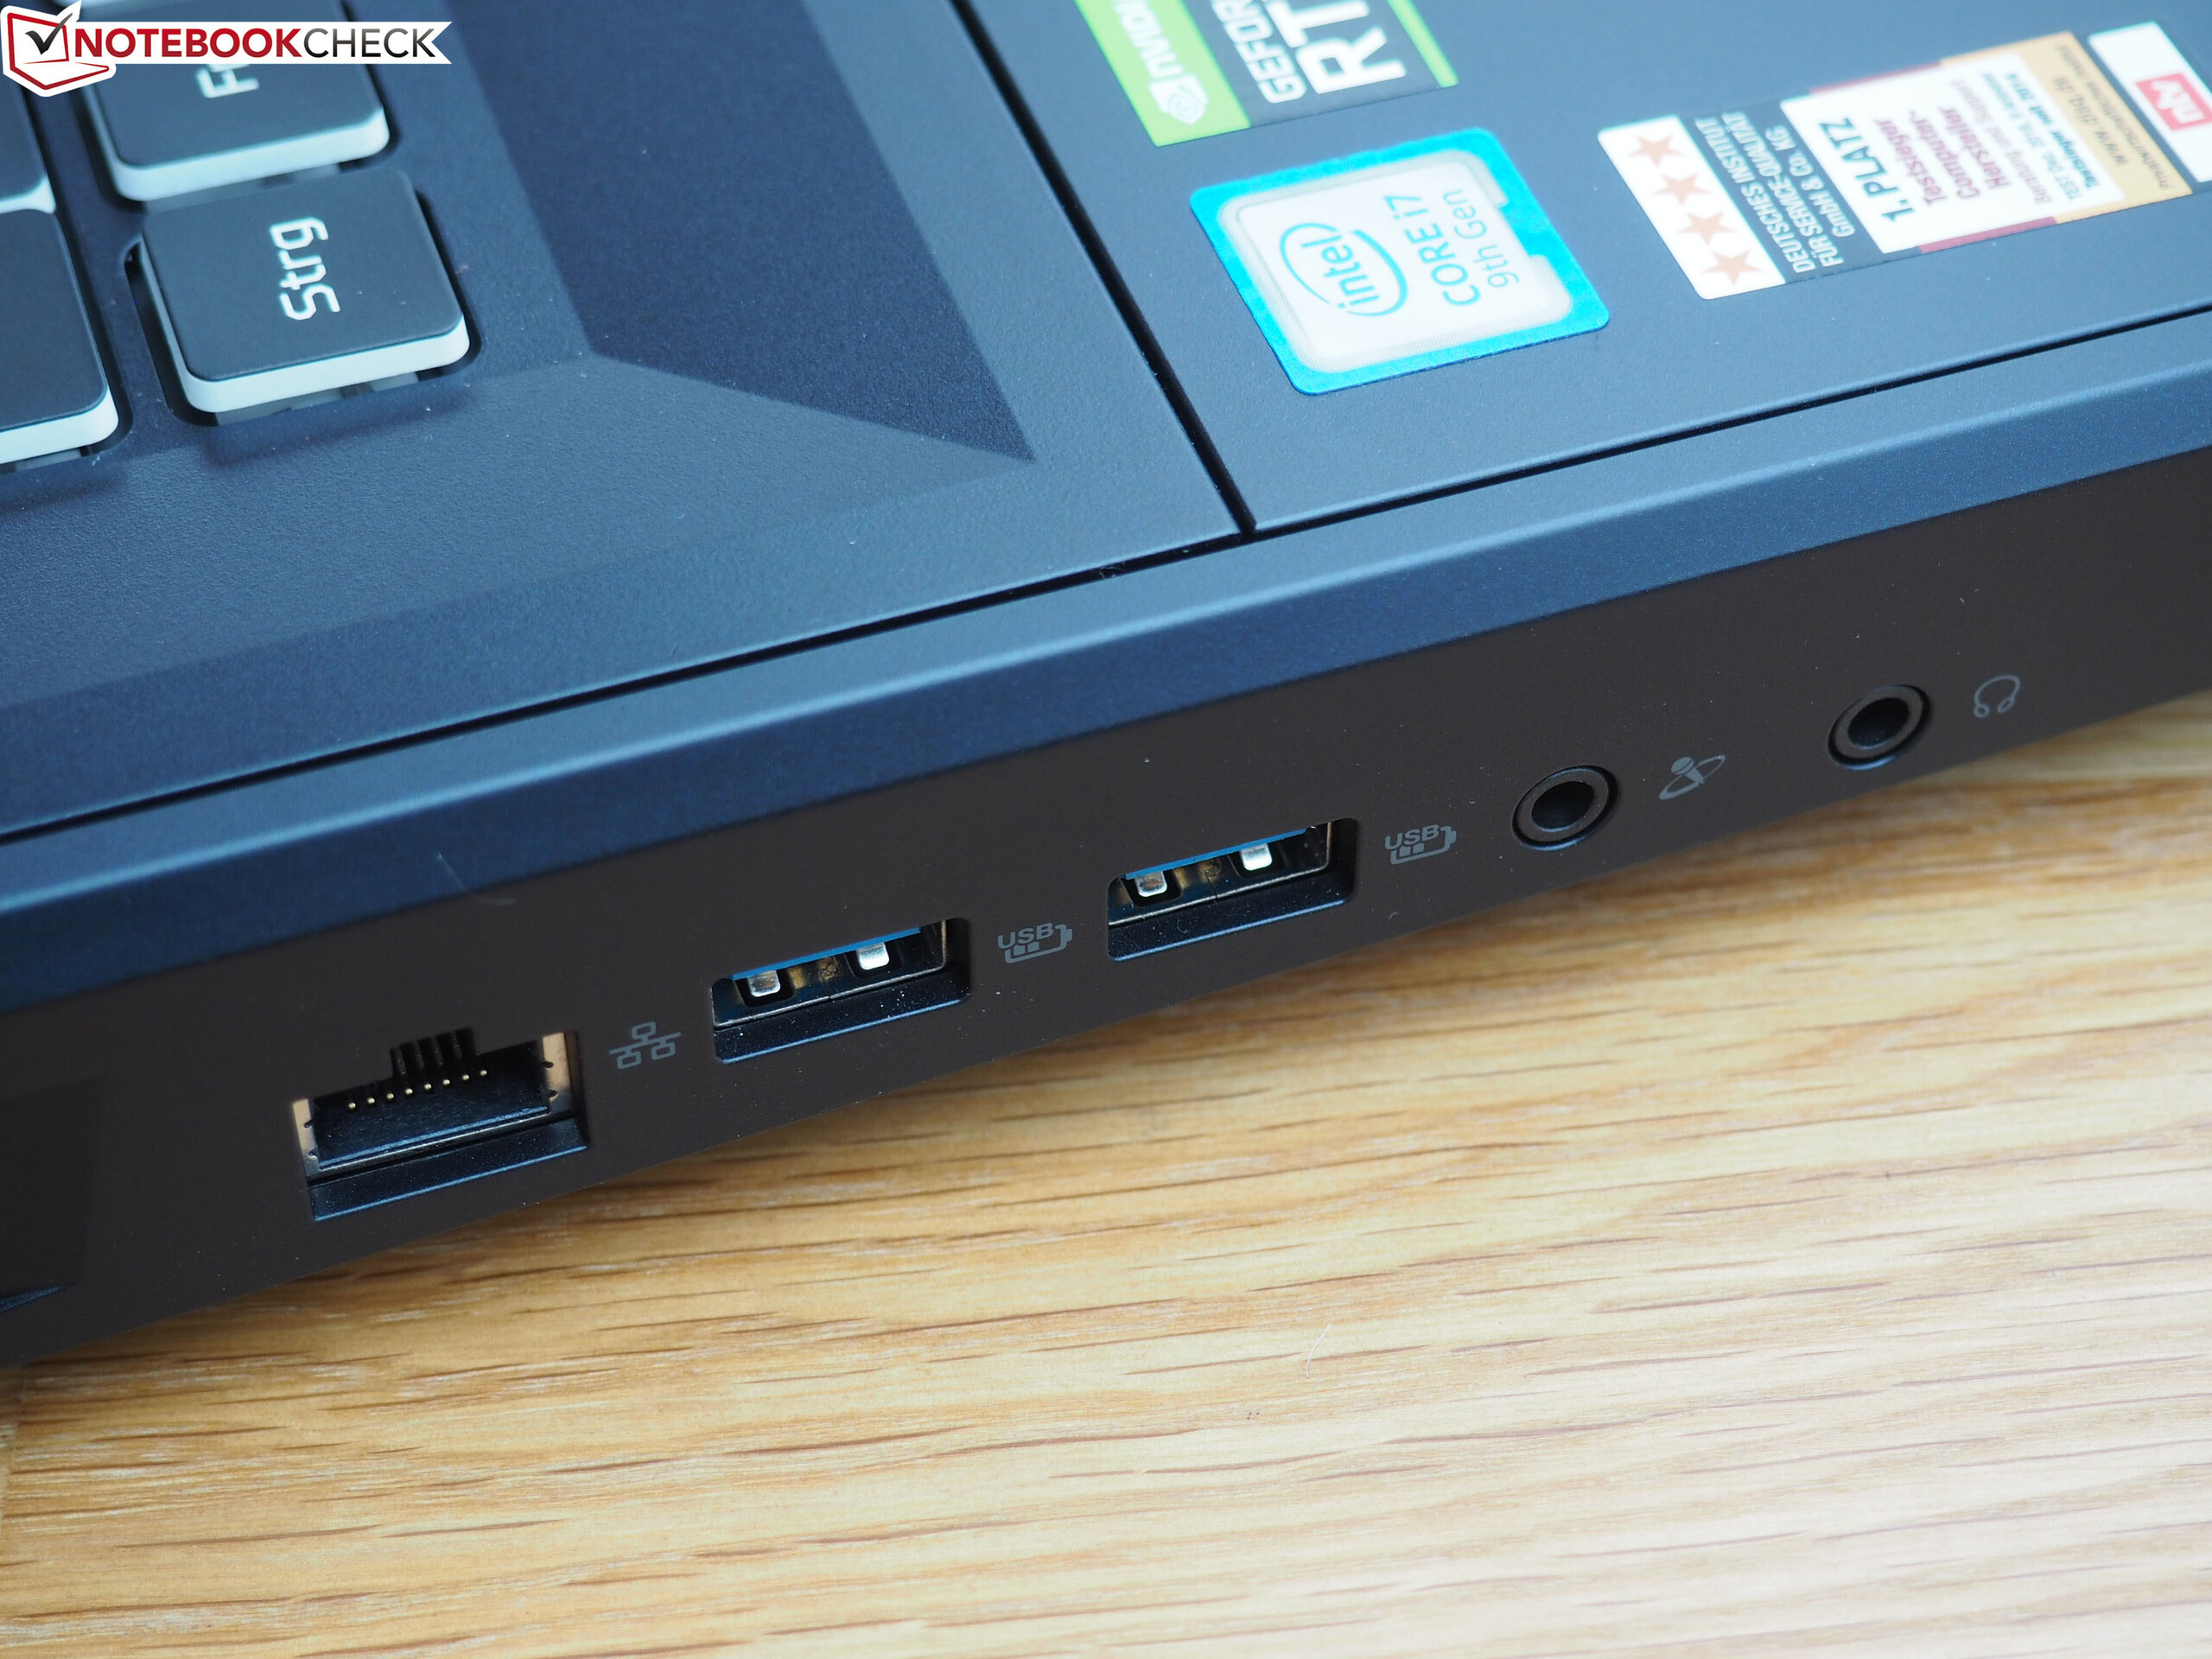
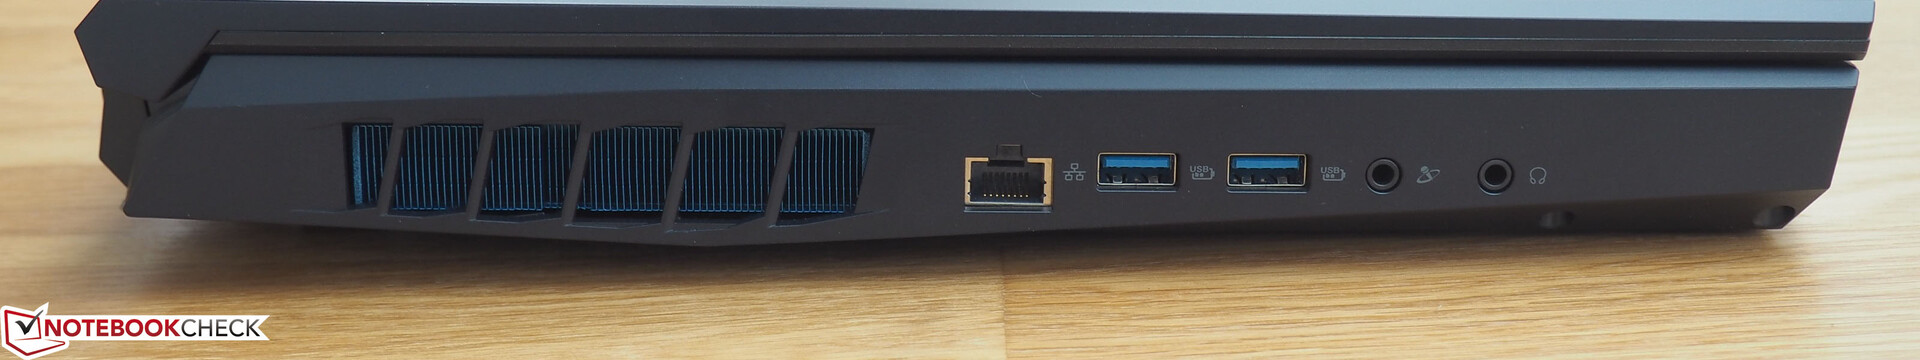
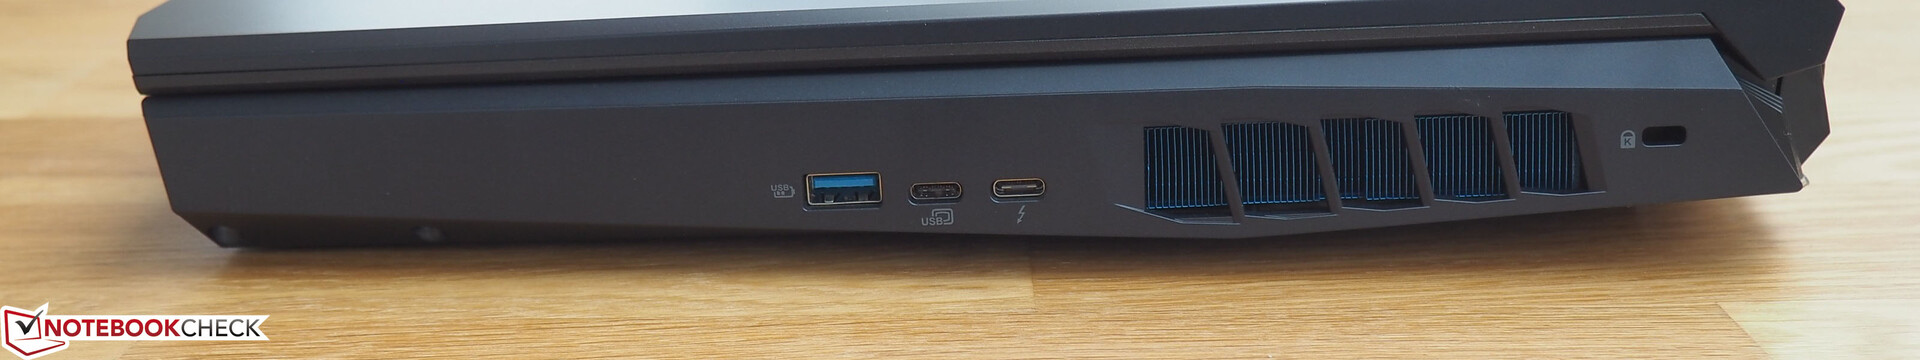
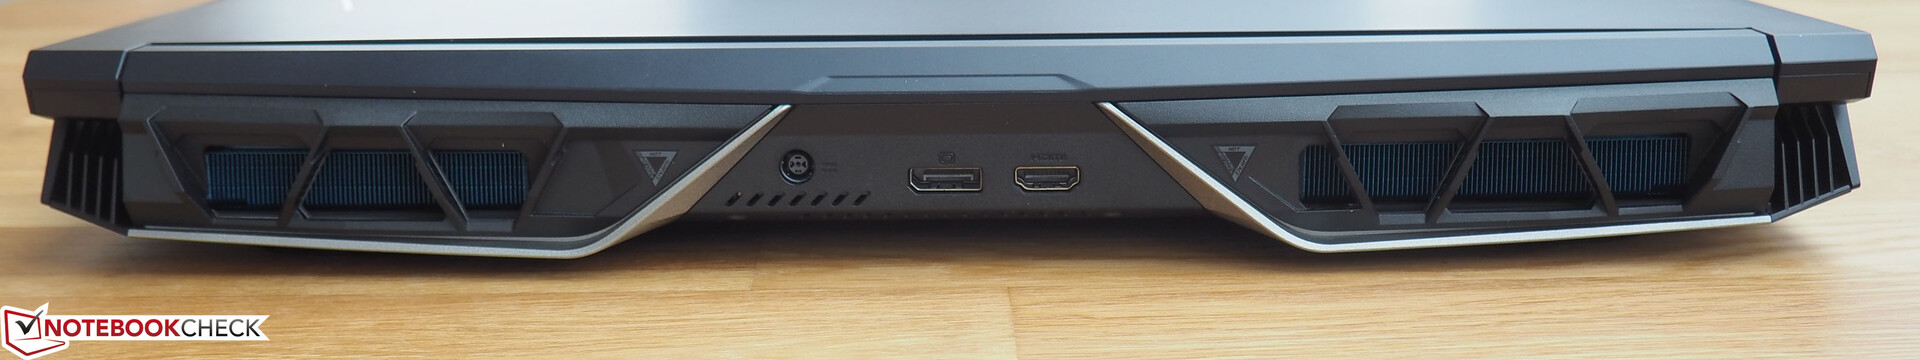
Outras fraquezas são o fato de que o touchpad é muito afundado na unidade base, o leitor de cartões ausente e a bateria com pouca duração. A carcaça nos deu uma impressão mista. Enquanto os gamers ficarão satisfeitos com as muitas portas, o bom teclado, os alto-falantes potentes e as muitas opções de iluminação de fundo, a construção pesada (sem marcos finos) e o alto peso não estão mais atualizados em 2019. Ficamos satisfeitos com a tela de 144 Hz de alto contraste, apesar de algumas fraquezas (precisão de cores, brilho e distribuição de brilho).
Em suma, os ventiladores da Acer que estão interessados em jogar todos os jogos modernos com altos detalhes e têm o dinheiro necessário disponível definitivamente devem dar uma olhada neste dispositivo de 17 polegadas. Qualquer pessoa pode preferir um portátil topo de linha mais clássico (e provavelmente mais barato) sem todos os sinos e assobios do Predator Helios 700 (por exemplo, o Helios 300 ou o Triton 500).
Cuidado: O Predator Helios 700 é um dos primeiros portáteis para jogos avaliado com base nas classificações estendidas (e mais difíceis) da v7 e, portanto, parece ter resultados piores do que sua concorrência de ponta testada recentemente. No futuro, todos os novos dispositivos gamers terão que passar na classificação v7.
Acer Predator Helios 700 PH717-71-785M
- 05/14/2020 v7 (old)
Florian Glaser
Price comparison