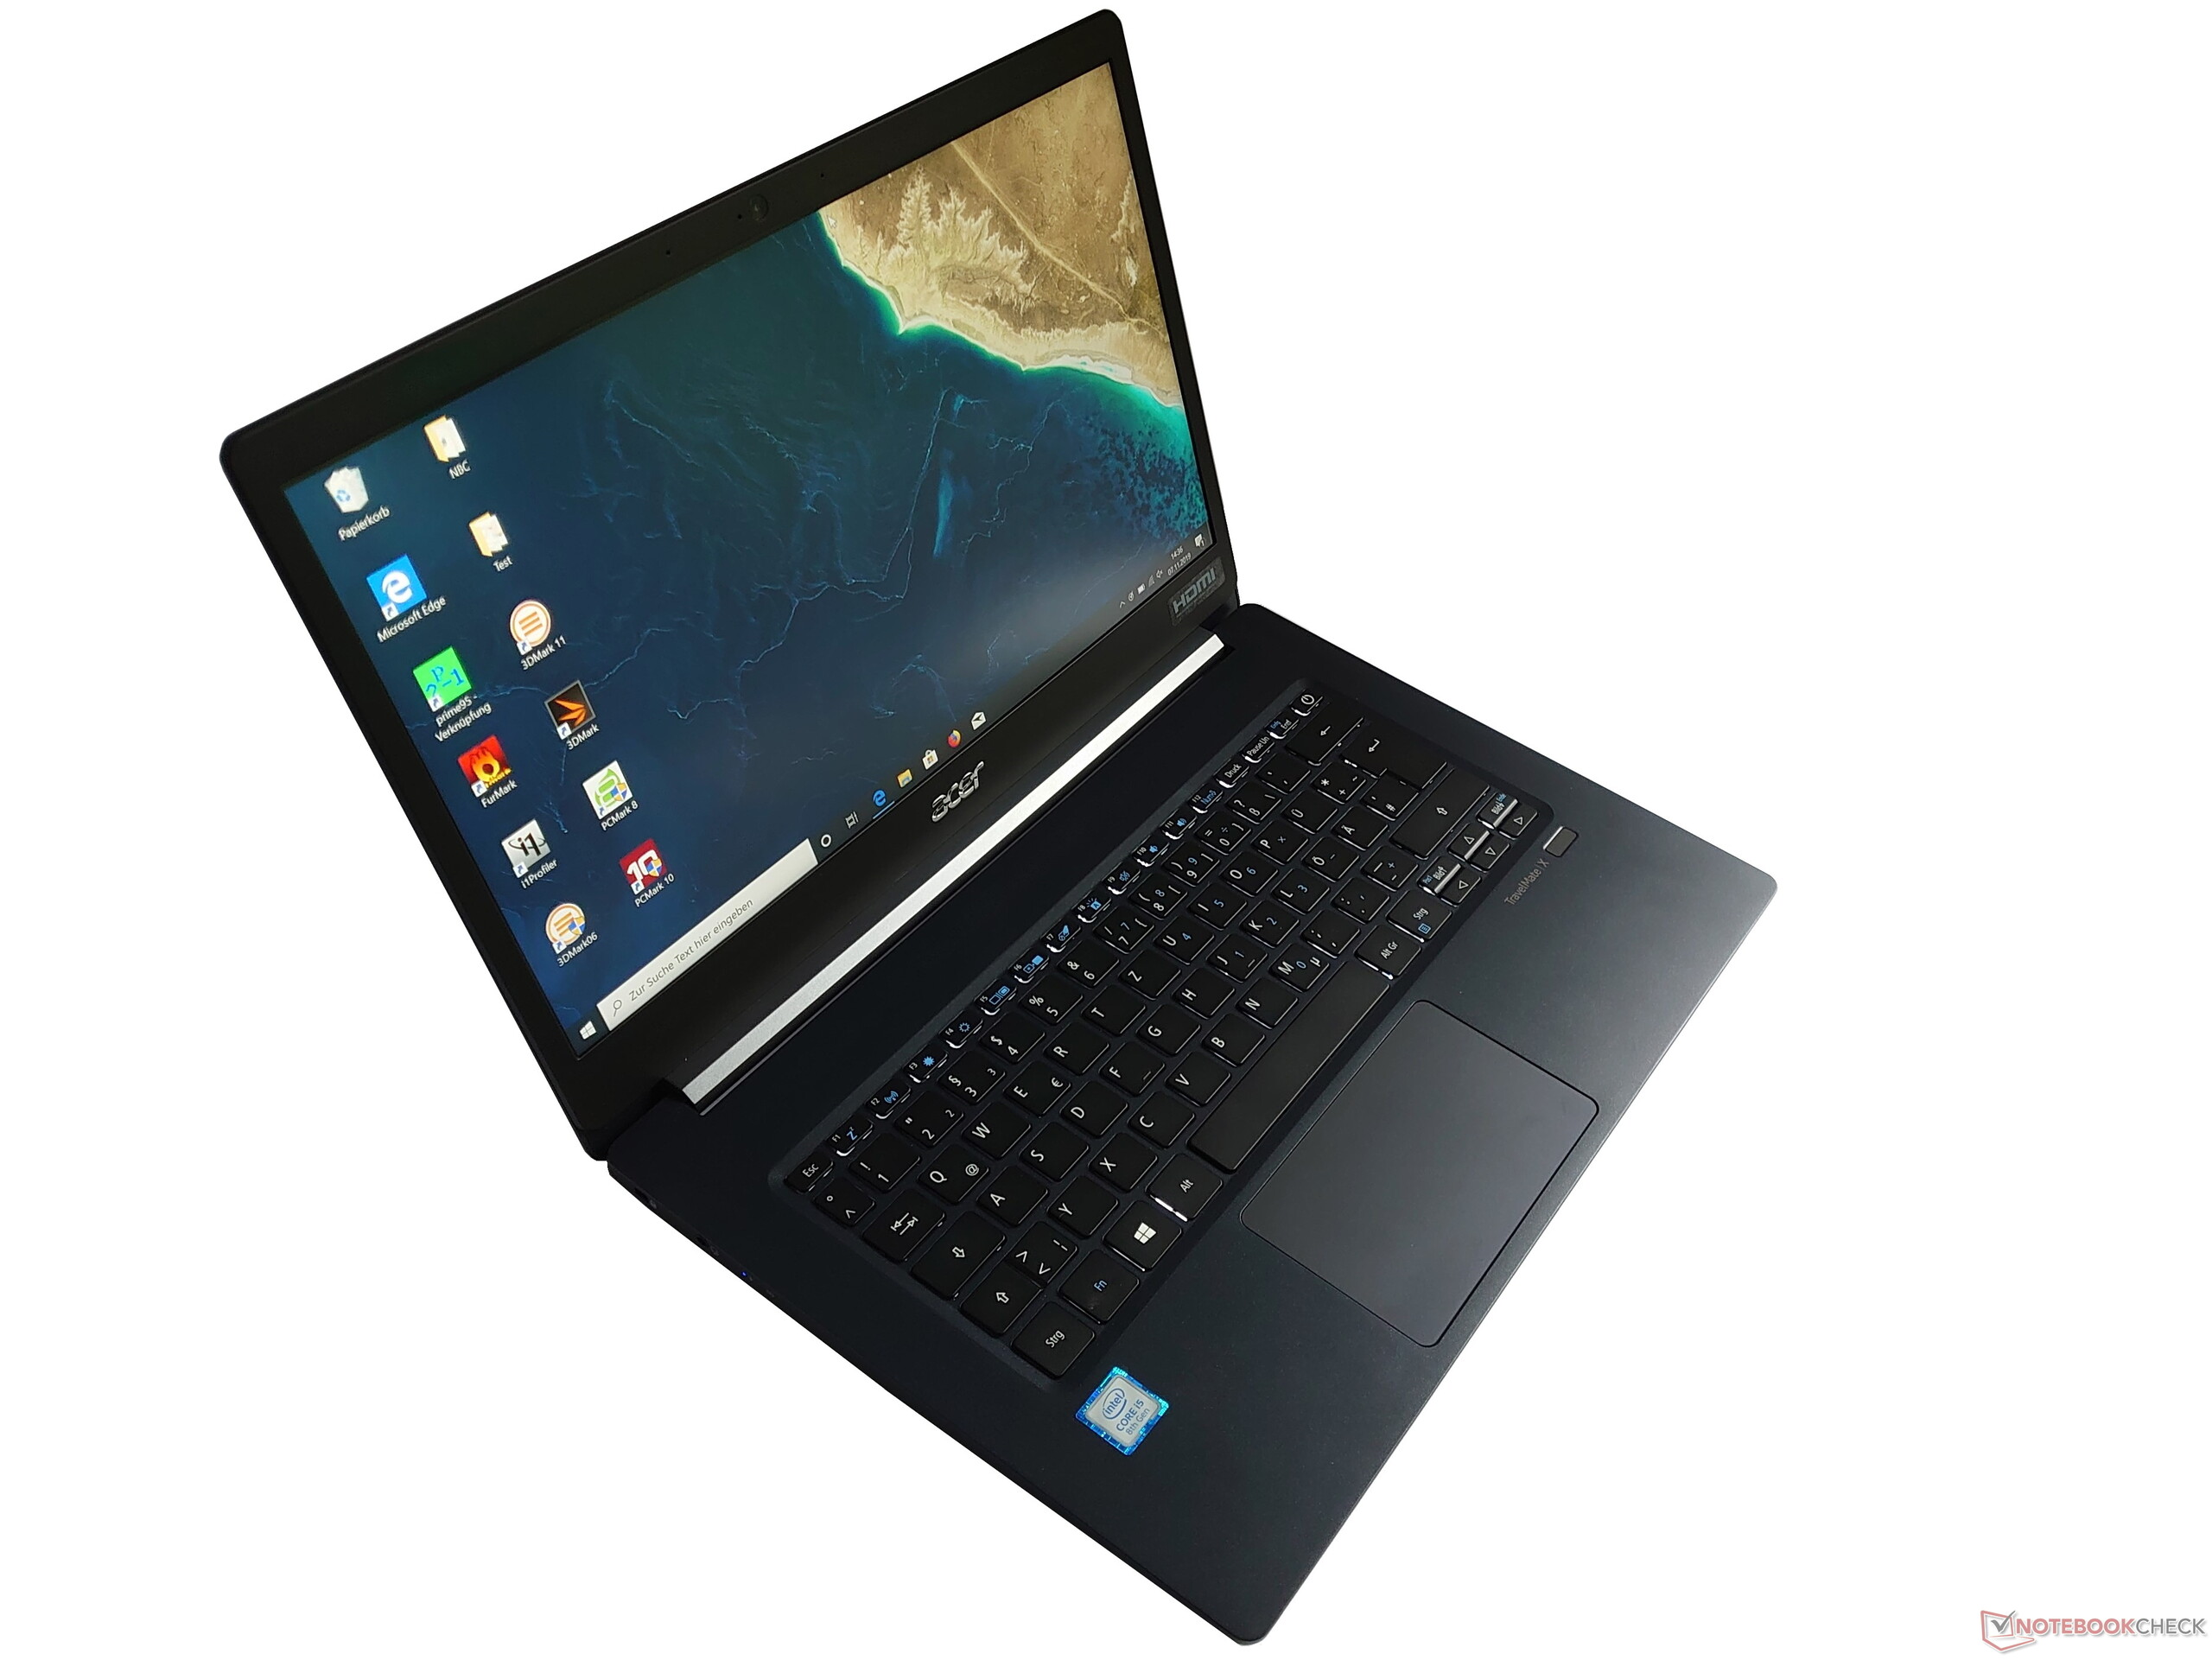
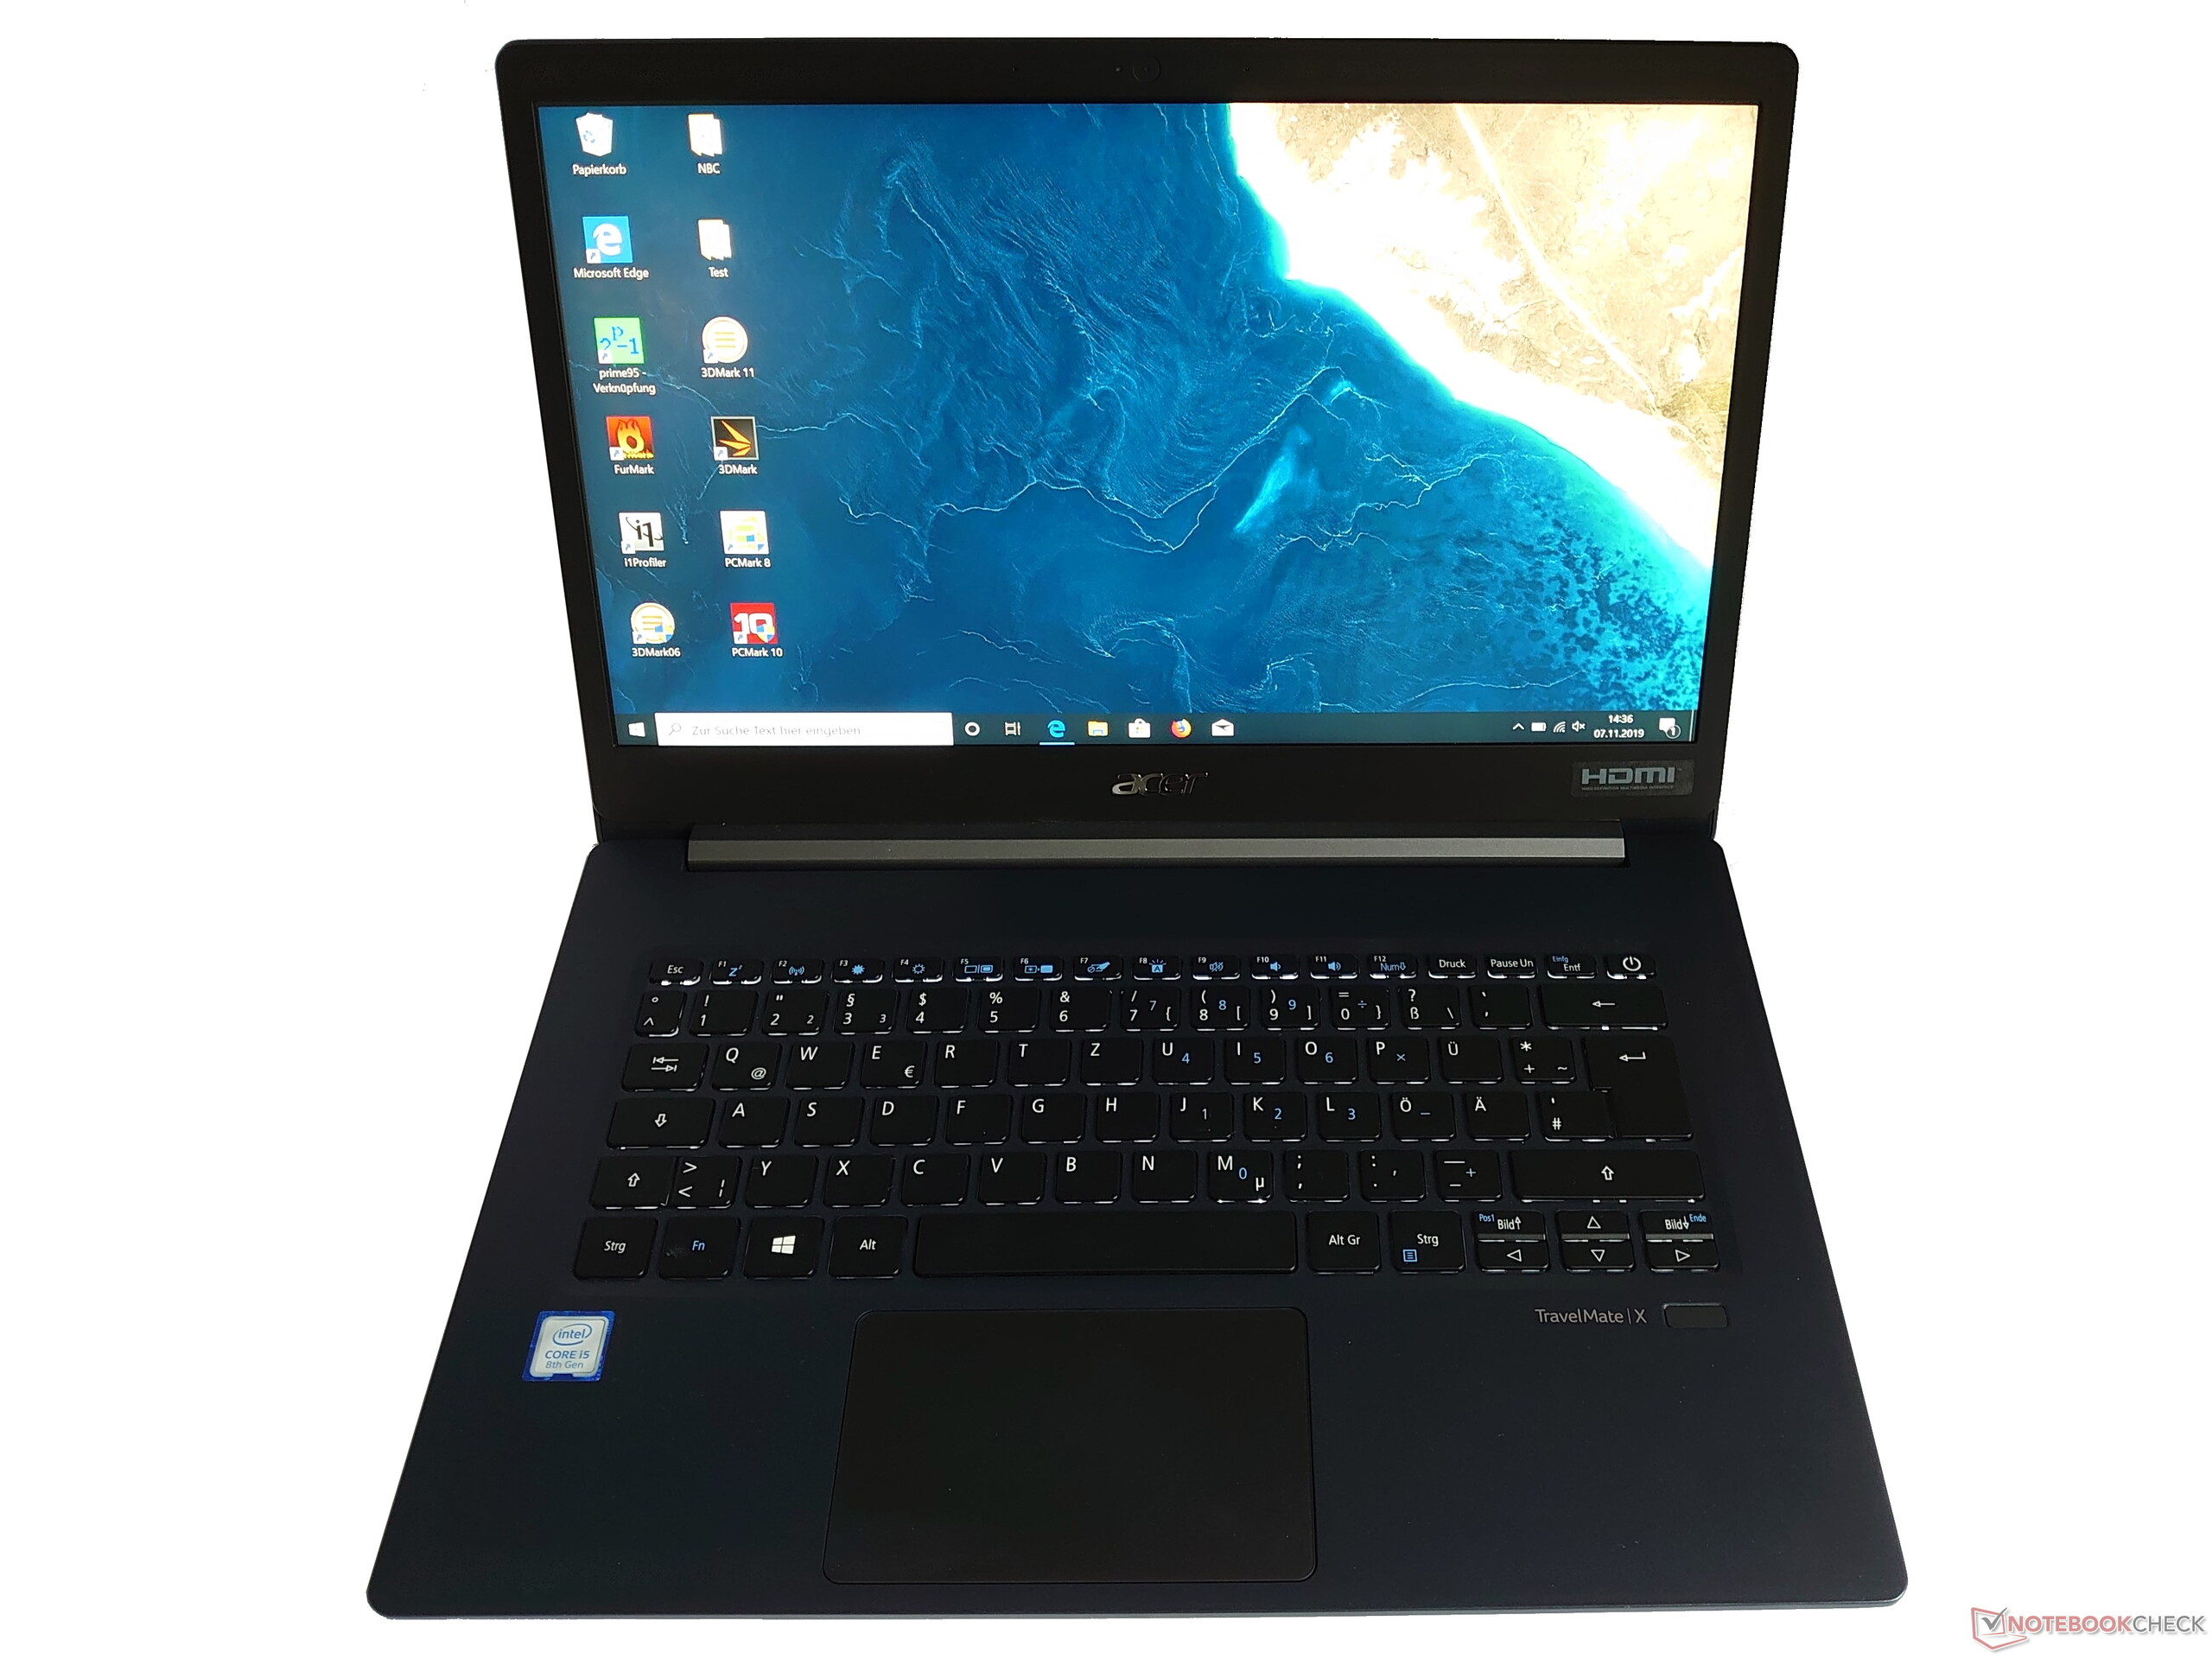
Breve Análise do Portátil Acer TravelMate X514: Uma pequena máquina de 14 polegadas destinada para profissionais
Avaliação | Data | Modelo | Peso | Altura | Size | Resolução | Preço |
|---|---|---|---|---|---|---|---|
| 83.9 % v7 (old) | 11/2019 | Acer TravelMate X514-51-511Q i5-8265U, UHD Graphics 620 | 980 g | 15 mm | 14.00" | 1920x1080 | |
| 88.4 % v7 (old) | 09/2019 | Lenovo ThinkPad T495s-20QKS01E00 R7 PRO 3700U, Vega 10 | 1.3 kg | 16.1 mm | 14.00" | 1920x1080 | |
| 86.2 % v6 (old) | 05/2019 | Acer Swift 3 SF314-55G-768V i7-8565U, GeForce MX250 | 1.5 kg | 14.9 mm | 14.00" | 1920x1080 | |
| 84.6 % v6 (old) | Asus VivoBook 14 F412FJ-EB084T i5-8265U, GeForce MX230 | 1.5 kg | 19 mm | 14.00" | 1920x1080 | ||
| 84.8 % v6 (old) | 04/2019 | Dell Latitude 14 5495 R7 2700U, Vega 10 | 1.7 kg | 22.45 mm | 14.00" | 1920x1080 |


| Networking | |
| iperf3 transmit AX12 | |
| Asus VivoBook 14 F412FJ-EB084T | |
| Lenovo ThinkPad T495s-20QKS01E00 | |
| Acer TravelMate X514-51-511Q | |
| Acer Swift 3 SF314-55G-768V | |
| Dell Latitude 14 5495 | |
| iperf3 receive AX12 | |
| Lenovo ThinkPad T495s-20QKS01E00 | |
| Asus VivoBook 14 F412FJ-EB084T | |
| Acer Swift 3 SF314-55G-768V | |
| Acer TravelMate X514-51-511Q | |
| Dell Latitude 14 5495 | |
| |||||||||||||||||||||||||
iluminação: 82 %
iluminação com acumulador: 288 cd/m²
Contraste: 1372:1 (Preto: 0.215 cd/m²)
ΔE ColorChecker Calman: 2.6 | ∀{0.5-29.43 Ø4.71}
ΔE Greyscale Calman: 3.4 | ∀{0.09-98 Ø4.96}
99% sRGB (Argyll 1.6.3 3D)
63% AdobeRGB 1998 (Argyll 1.6.3 3D)
68.6% AdobeRGB 1998 (Argyll 3D)
98.9% sRGB (Argyll 3D)
67% Display P3 (Argyll 3D)
Gamma: 2.08
CCT: 7192 K
| Acer TravelMate X514-51-511Q Chi mei CMN14D5, IPS, 1920x1080, 14" | Lenovo ThinkPad T495s-20QKS01E00 B140HAN05.7, IPS, 1920x1080, 14" | Acer Swift 3 SF314-55G-768V Chi Mei CMN14D5, IPS, 1920x1080, 14" | Asus VivoBook 14 F412FJ-EB084T AU Optronics AUO403D B140HAN04.0, IPS, 1920x1080, 14" | Dell Latitude 14 5495 CMN14C9, IPS LED, 1920x1080, 14" | |
|---|---|---|---|---|---|
| Display | -1% | 0% | -40% | -38% | |
| Display P3 Coverage (%) | 67 | 67 0% | 67.3 0% | 39.71 -41% | 40.94 -39% |
| sRGB Coverage (%) | 98.9 | 96.8 -2% | 98.9 0% | 59.6 -40% | 61.4 -38% |
| AdobeRGB 1998 Coverage (%) | 68.6 | 68.3 0% | 69.5 1% | 41.04 -40% | 42.32 -38% |
| Response Times | -46% | -2% | -4% | -7% | |
| Response Time Grey 50% / Grey 80% * (ms) | 40 ? | 60.8 ? -52% | 40 ? -0% | 40 ? -0% | 41 ? -2% |
| Response Time Black / White * (ms) | 27 ? | 37.6 ? -39% | 28 ? -4% | 29 ? -7% | 30 ? -11% |
| PWM Frequency (Hz) | 250 ? | 250 | 25000 ? | ||
| Screen | 1% | -14% | -12% | -27% | |
| Brightness middle (cd/m²) | 295 | 380 29% | 323 9% | 267 -9% | 212 -28% |
| Brightness (cd/m²) | 276 | 381 38% | 299 8% | 257 -7% | 200 -28% |
| Brightness Distribution (%) | 82 | 87 6% | 87 6% | 91 11% | 89 9% |
| Black Level * (cd/m²) | 0.215 | 0.22 -2% | 0.35 -63% | 0.2 7% | 0.23 -7% |
| Contrast (:1) | 1372 | 1727 26% | 923 -33% | 1335 -3% | 922 -33% |
| Colorchecker dE 2000 * | 2.6 | 4 -54% | 3.13 -20% | 3.79 -46% | 4.34 -67% |
| Colorchecker dE 2000 max. * | 5.6 | 5.7 -2% | 6.96 -24% | 8.18 -46% | 9.01 -61% |
| Greyscale dE 2000 * | 3.4 | 4.4 -29% | 4.32 -27% | 1.49 56% | 2.81 17% |
| Gamma | 2.08 106% | 2.54 87% | 2.29 96% | 2.48 89% | 2.22 99% |
| CCT | 7192 90% | 6963 93% | 7436 87% | 6659 98% | 6286 103% |
| Color Space (Percent of AdobeRGB 1998) (%) | 63 | 62.2 -1% | 64 2% | 38 -40% | 39 -38% |
| Color Space (Percent of sRGB) (%) | 99 | 96.6 -2% | 99 0% | 59 -40% | 61 -38% |
| Colorchecker dE 2000 calibrated * | 1.2 | 0.9 | 4.71 | ||
| Média Total (Programa/Configurações) | -15% /
-6% | -5% /
-10% | -19% /
-16% | -24% /
-27% |
* ... menor é melhor
Exibir tempos de resposta
| ↔ Tempo de resposta preto para branco | ||
|---|---|---|
| 27 ms ... ascensão ↗ e queda ↘ combinadas | ↗ 16 ms ascensão | 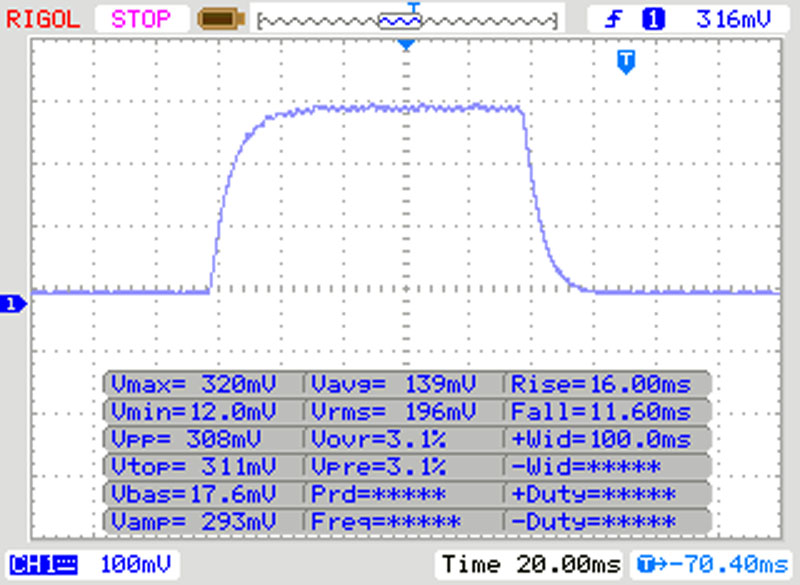 |
| ↘ 11 ms queda | ||
| A tela mostra taxas de resposta relativamente lentas em nossos testes e pode ser muito lenta para os jogadores. Em comparação, todos os dispositivos testados variam de 0.1 (mínimo) a 240 (máximo) ms. » 67 % de todos os dispositivos são melhores. Isso significa que o tempo de resposta medido é pior que a média de todos os dispositivos testados (19.8 ms). | ||
| ↔ Tempo de resposta 50% cinza a 80% cinza | ||
| 40 ms ... ascensão ↗ e queda ↘ combinadas | ↗ 21 ms ascensão | 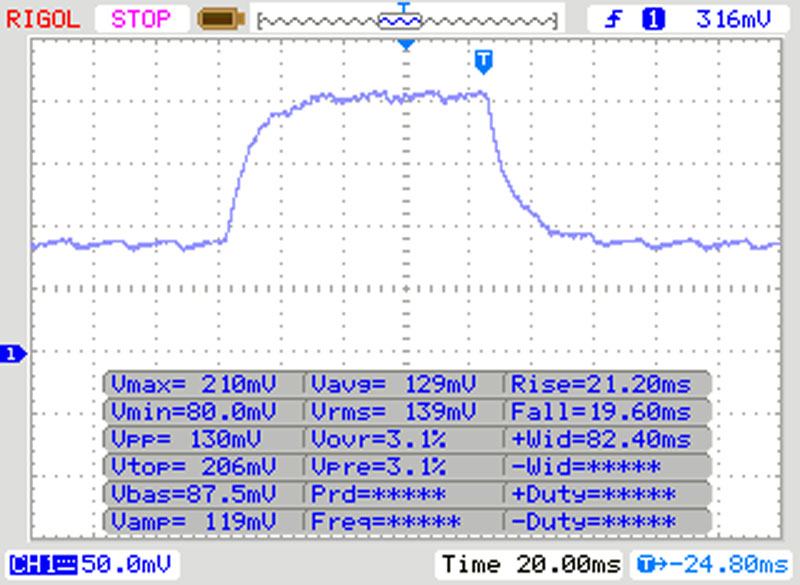 |
| ↘ 19 ms queda | ||
| A tela mostra taxas de resposta lentas em nossos testes e será insatisfatória para os jogadores. Em comparação, todos os dispositivos testados variam de 0.165 (mínimo) a 636 (máximo) ms. » 61 % de todos os dispositivos são melhores. Isso significa que o tempo de resposta medido é pior que a média de todos os dispositivos testados (30.9 ms). | ||
Cintilação da tela / PWM (modulação por largura de pulso)
| Tela tremeluzindo/PWM detectado | 250 Hz | ≤ 10 % configuração de brilho | 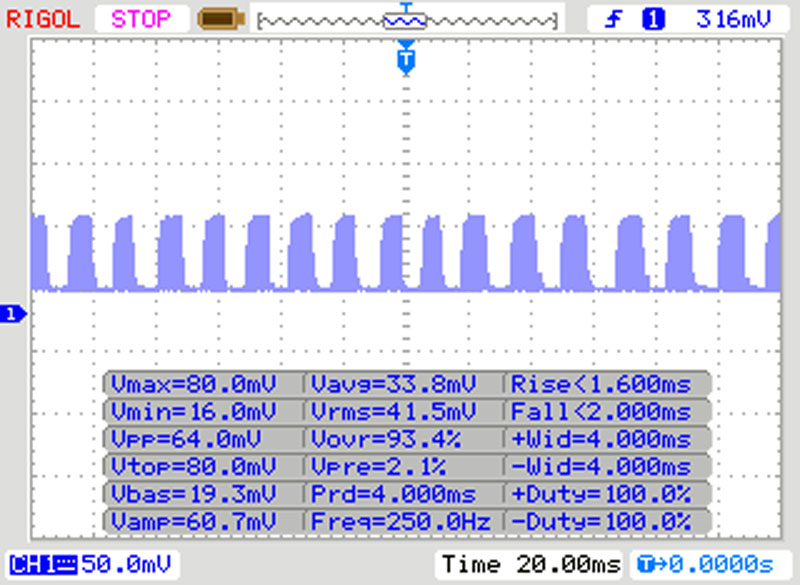 |
A luz de fundo da tela pisca em 250 Hz (pior caso, por exemplo, utilizando PWM) Cintilação detectada em uma configuração de brilho de 10 % e abaixo. Não deve haver cintilação ou PWM acima desta configuração de brilho. A frequência de 250 Hz é relativamente baixa, portanto, usuários sensíveis provavelmente notarão cintilação e sentirão fadiga ocular na configuração de brilho indicada e abaixo. [pwm_comparison] Em comparação: 52 % de todos os dispositivos testados não usam PWM para escurecer a tela. Se PWM foi detectado, uma média de 7748 (mínimo: 5 - máximo: 343500) Hz foi medida. | |||

| Cinebench R15 | |
| CPU Single 64Bit | |
| Média da turma Subnotebook (72.4 - 322, n=57, últimos 2 anos) | |
| Acer Swift 3 SF314-55G-768V | |
| Acer TravelMate X514-51-511Q | |
| Asus VivoBook 14 F412FJ-EB084T | |
| Média Intel Core i5-8265U (111 - 164, n=35) | |
| Lenovo ThinkPad T495s-20QKS01E00 | |
| Dell Latitude 14 5495 | |
| CPU Multi 64Bit | |
| Média da turma Subnotebook (327 - 3345, n=57, últimos 2 anos) | |
| Dell Latitude 14 5495 | |
| Lenovo ThinkPad T495s-20QKS01E00 | |
| Asus VivoBook 14 F412FJ-EB084T | |
| Média Intel Core i5-8265U (457 - 750, n=38) | |
| Acer Swift 3 SF314-55G-768V | |
| Acer TravelMate X514-51-511Q | |
| PCMark 8 Home Score Accelerated v2 | 3170 pontos | |
| PCMark 8 Work Score Accelerated v2 | 4698 pontos | |
| PCMark 10 Score | 3725 pontos | |
Ajuda | ||
| Acer TravelMate X514-51-511Q Kingston RBUSNS8154P3256GJ1 | Lenovo ThinkPad T495s-20QKS01E00 Samsung PM981a MZVLB1T0HBLR | Acer Swift 3 SF314-55G-768V WDC PC SN520 SDAPNUW-512G | Asus VivoBook 14 F412FJ-EB084T Kingston RBU-SNS8180DS3512GJ | Dell Latitude 14 5495 Intel SSDSCKKF256G8 | Média Kingston RBUSNS8154P3256GJ1 | |
|---|---|---|---|---|---|---|
| CrystalDiskMark 5.2 / 6 | 51% | 37% | -55% | -52% | 14% | |
| Write 4K (MB/s) | 122.3 | 142.3 16% | 185.5 52% | 55 -55% | 48.45 -60% | 141.1 ? 15% |
| Read 4K (MB/s) | 45.51 | 46.69 3% | 50.2 10% | 28.79 -37% | 25.11 -45% | 82.4 ? 81% |
| Write Seq (MB/s) | 667 | 1175 76% | 307.5 -54% | 341.2 -49% | 722 ? 8% | |
| Read Seq (MB/s) | 713 | 1132 59% | 430 -40% | 521 -27% | 974 ? 37% | |
| Write 4K Q32T1 (MB/s) | 411.8 | 268.3 -35% | 472.6 15% | 149.5 -64% | 202 -51% | 418 ? 2% |
| Read 4K Q32T1 (MB/s) | 559 | 359.6 -36% | 642 15% | 207.2 -63% | 243.5 -56% | 571 ? 2% |
| Write Seq Q32T1 (MB/s) | 892 | 3033 240% | 1453 63% | 389.2 -56% | 320.8 -64% | 717 ? -20% |
| Read Seq Q32T1 (MB/s) | 1639 | 3561 117% | 1738 6% | 497.1 -70% | 555 -66% | 1413 ? -14% |
| Write 4K Q8T8 (MB/s) | 1491 | 247.5 | 483 ? | |||
| Read 4K Q8T8 (MB/s) | 1499 | 253.4 | 684 ? | |||
| AS SSD | 93% | 42% | -139% | -73% | -20% | |
| Seq Read (MB/s) | 1222 | 2661 118% | 1438 18% | 487.6 -60% | 507 -59% | 1195 ? -2% |
| Seq Write (MB/s) | 775 | 2314 199% | 1352 74% | 392.7 -49% | 286.5 -63% | 668 ? -14% |
| 4K Read (MB/s) | 54.8 | 45.52 -17% | 47.35 -14% | 36.4 -34% | 19.76 -64% | 33.6 ? -39% |
| 4K Write (MB/s) | 114.4 | 105.3 -8% | 167.9 47% | 26.46 -77% | 34.58 -70% | 82.6 ? -28% |
| 4K-64 Read (MB/s) | 896 | 1806 102% | 1051 17% | 325.4 -64% | 238.4 -73% | 667 ? -26% |
| 4K-64 Write (MB/s) | 604 | 1650 173% | 1211 100% | 87.2 -86% | 225.2 -63% | 561 ? -7% |
| Access Time Read * (ms) | 0.04 | 0.432 | 0.128 | 0.117 ? | ||
| Access Time Write * (ms) | 0.044 | 0.041 7% | 0.03 32% | 0.4 -809% | 0.101 -130% | 0.05571 ? -27% |
| Score Read (Points) | 1073 | 2118 97% | 1242 16% | 411 -62% | 309 -71% | 820 ? -24% |
| Score Write (Points) | 796 | 1986 149% | 1514 90% | 153 -81% | 288 -64% | 710 ? -11% |
| Score Total (Points) | 2411 | 5169 114% | 3397 41% | 782 -68% | 751 -69% | 1931 ? -20% |
| Copy ISO MB/s (MB/s) | 1131 | 441.3 | 773 ? | |||
| Copy Program MB/s (MB/s) | 267.1 | 152.1 | 375 ? | |||
| Copy Game MB/s (MB/s) | 691 | 260 | 509 ? | |||
| Média Total (Programa/Configurações) | 72% /
77% | 40% /
40% | -97% /
-102% | -63% /
-64% | -3% /
-5% |
* ... menor é melhor

| 3DMark 11 - 1280x720 Performance GPU | |
| Média da turma Subnotebook (995 - 18489, n=55, últimos 2 anos) | |
| Lenovo ThinkPad T495s-20QKS01E00 | |
| Acer Swift 3 SF314-55G-768V | |
| Asus VivoBook 14 F412FJ-EB084T | |
| Dell Latitude 14 5495 | |
| Média Intel UHD Graphics 620 (1144 - 3432, n=244) | |
| Acer TravelMate X514-51-511Q | |
| 3DMark | |
| 1280x720 Cloud Gate Standard Graphics | |
| Média da turma Subnotebook (5577 - 61591, n=29, últimos 2 anos) | |
| Acer Swift 3 SF314-55G-768V | |
| Lenovo ThinkPad T495s-20QKS01E00 | |
| Asus VivoBook 14 F412FJ-EB084T | |
| Dell Latitude 14 5495 | |
| Acer TravelMate X514-51-511Q | |
| Média Intel UHD Graphics 620 (6205 - 16400, n=225) | |
| 1920x1080 Fire Strike Graphics | |
| Média da turma Subnotebook (832 - 32931, n=57, últimos 2 anos) | |
| Acer Swift 3 SF314-55G-768V | |
| Lenovo ThinkPad T495s-20QKS01E00 | |
| Asus VivoBook 14 F412FJ-EB084T | |
| Dell Latitude 14 5495 | |
| Média Intel UHD Graphics 620 (557 - 2608, n=213) | |
| Acer TravelMate X514-51-511Q | |
| 2560x1440 Time Spy Graphics | |
| Média da turma Subnotebook (804 - 14477, n=56, últimos 2 anos) | |
| Lenovo ThinkPad T495s-20QKS01E00 | |
| Asus VivoBook 14 F412FJ-EB084T | |
| Média Intel UHD Graphics 620 (299 - 797, n=88) | |
| 3DMark 11 Performance | 1917 pontos | |
| 3DMark Cloud Gate Standard Score | 7933 pontos | |
| 3DMark Fire Strike Score | 1035 pontos | |
Ajuda | ||
| BioShock Infinite | |
| 1280x720 Very Low Preset | |
| Acer Swift 3 SF314-55G-768V | |
| Asus VivoBook 14 F412FJ-EB084T | |
| Lenovo ThinkPad T495s-20QKS01E00 | |
| Dell Latitude 14 5495 | |
| Média Intel UHD Graphics 620 (18.3 - 90.2, n=187) | |
| Acer TravelMate X514-51-511Q | |
| 1366x768 Medium Preset | |
| Acer Swift 3 SF314-55G-768V | |
| Asus VivoBook 14 F412FJ-EB084T | |
| Acer TravelMate X514-51-511Q | |
| Média Intel UHD Graphics 620 (11.5 - 45.5, n=187) | |
| 1366x768 High Preset | |
| Acer Swift 3 SF314-55G-768V | |
| Asus VivoBook 14 F412FJ-EB084T | |
| Acer TravelMate X514-51-511Q | |
| Média Intel UHD Graphics 620 (8.1 - 35.9, n=187) | |
| 1920x1080 Ultra Preset, DX11 (DDOF) | |
| Acer Swift 3 SF314-55G-768V | |
| Asus VivoBook 14 F412FJ-EB084T | |
| Lenovo ThinkPad T495s-20QKS01E00 | |
| Dell Latitude 14 5495 | |
| Média Intel UHD Graphics 620 (4.5 - 17, n=176) | |
| Acer TravelMate X514-51-511Q | |
| Anno 1800 | |
| 1280x720 Low Graphics Quality (DX11) | |
| Média Intel UHD Graphics 620 (19.9 - 23.8, n=2) | |
| Acer TravelMate X514-51-511Q | |
| 1920x1080 Medium Graphics Quality (DX11) | |
| Média Intel UHD Graphics 620 (5.7 - 8, n=2) | |
| Acer TravelMate X514-51-511Q | |
| baixo | média | alto | ultra | |
|---|---|---|---|---|
| BioShock Infinite (2013) | 59.9 | 34.3 | 30.26 | 8.98 |
| Dota 2 Reborn (2015) | 73.9 | 46.7 | 20 | 17.7 |
| Anno 1800 (2019) | 19.9 | 5.7 |
Barulho
| Ocioso |
| 30.4 / 30.4 / 30.4 dB |
| Carga |
| 34.1 / 34.4 dB |
 | ||
30 dB silencioso 40 dB(A) audível 50 dB(A) ruidosamente alto |
||
min: | ||
(±) A temperatura máxima no lado superior é 44.9 °C / 113 F, em comparação com a média de 35.9 °C / 97 F , variando de 21.4 a 59 °C para a classe Subnotebook.
(±) A parte inferior aquece até um máximo de 44.2 °C / 112 F, em comparação com a média de 39.2 °C / 103 F
(+) Em uso inativo, a temperatura média para o lado superior é 24.8 °C / 77 F, em comparação com a média do dispositivo de 30.8 °C / ### class_avg_f### F.
(+) Os apoios para as mãos e o touchpad são mais frios que a temperatura da pele, com um máximo de 29.2 °C / 84.6 F e, portanto, são frios ao toque.
(±) A temperatura média da área do apoio para as mãos de dispositivos semelhantes foi 28.2 °C / 82.8 F (-1 °C / -1.8 F).
Acer TravelMate X514-51-511Q análise de áudio
(-) | alto-falantes não muito altos (###valor### dB)
Graves 100 - 315Hz
(-) | quase nenhum baixo - em média 17.4% menor que a mediana
(±) | a linearidade dos graves é média (10.9% delta para a frequência anterior)
Médios 400 - 2.000 Hz
(±) | médios mais altos - em média 6.8% maior que a mediana
(±) | a linearidade dos médios é média (7.1% delta para frequência anterior)
Altos 2 - 16 kHz
(+) | agudos equilibrados - apenas 1.5% longe da mediana
(+) | os máximos são lineares (6.6% delta da frequência anterior)
Geral 100 - 16.000 Hz
(±) | a linearidade do som geral é média (25.7% diferença em relação à mediana)
Comparado com a mesma classe
» 86% de todos os dispositivos testados nesta classe foram melhores, 3% semelhantes, 11% piores
» O melhor teve um delta de 5%, a média foi 18%, o pior foi 53%
Comparado com todos os dispositivos testados
» 79% de todos os dispositivos testados foram melhores, 4% semelhantes, 17% piores
» O melhor teve um delta de 4%, a média foi 23%, o pior foi 134%
Apple MacBook 12 (Early 2016) 1.1 GHz análise de áudio
(+) | os alto-falantes podem tocar relativamente alto (###valor### dB)
Graves 100 - 315Hz
(±) | graves reduzidos - em média 11.3% menor que a mediana
(±) | a linearidade dos graves é média (14.2% delta para a frequência anterior)
Médios 400 - 2.000 Hz
(+) | médios equilibrados - apenas 2.4% longe da mediana
(+) | médios são lineares (5.5% delta para frequência anterior)
Altos 2 - 16 kHz
(+) | agudos equilibrados - apenas 2% longe da mediana
(+) | os máximos são lineares (4.5% delta da frequência anterior)
Geral 100 - 16.000 Hz
(+) | o som geral é linear (10.2% diferença em relação à mediana)
Comparado com a mesma classe
» 7% de todos os dispositivos testados nesta classe foram melhores, 2% semelhantes, 90% piores
» O melhor teve um delta de 5%, a média foi 18%, o pior foi 53%
Comparado com todos os dispositivos testados
» 5% de todos os dispositivos testados foram melhores, 1% semelhantes, 94% piores
» O melhor teve um delta de 4%, a média foi 23%, o pior foi 134%
| desligado | |
| Ocioso | |
| Carga |
|
Key:
min: | |
| Acer TravelMate X514-51-511Q i5-8265U, UHD Graphics 620, Kingston RBUSNS8154P3256GJ1, IPS, 1920x1080, 14" | Lenovo ThinkPad T495s-20QKS01E00 R7 PRO 3700U, Vega 10, Samsung PM981a MZVLB1T0HBLR, IPS, 1920x1080, 14" | Acer Swift 3 SF314-55G-768V i7-8565U, GeForce MX250, WDC PC SN520 SDAPNUW-512G, IPS, 1920x1080, 14" | Asus VivoBook 14 F412FJ-EB084T i5-8265U, GeForce MX230, Kingston RBU-SNS8180DS3512GJ, IPS, 1920x1080, 14" | Dell Latitude 14 5495 R7 2700U, Vega 10, Intel SSDSCKKF256G8, IPS LED, 1920x1080, 14" | Média Intel UHD Graphics 620 | Média da turma Subnotebook | |
|---|---|---|---|---|---|---|---|
| Power Consumption | -75% | -109% | -68% | -49% | -58% | -70% | |
| Idle Minimum * (Watt) | 2.3 | 4.7 -104% | 7.4 -222% | 3.7 -61% | 4.3 -87% | 3.81 ? -66% | 3.71 ? -61% |
| Idle Average * (Watt) | 4.6 | 7.28 -58% | 9.9 -115% | 6.1 -33% | 6.6 -43% | 6.94 ? -51% | 6.54 ? -42% |
| Idle Maximum * (Watt) | 5.8 | 9.48 -63% | 11.7 -102% | 8.3 -43% | 7.7 -33% | 8.75 ? -51% | 7.89 ? -36% |
| Load Average * (Watt) | 22.4 | 35.3 -58% | 29 -29% | 43 -92% | 32 -43% | 35 ? -56% | 42.1 ? -88% |
| Load Maximum * (Watt) | 29 | 55.5 -91% | 52 -79% | 61.6 -112% | 40 -38% | 47.5 ? -64% | 65.1 ? -124% |
* ... menor é melhor
| Acer TravelMate X514-51-511Q i5-8265U, UHD Graphics 620, 36 Wh | Lenovo ThinkPad T495s-20QKS01E00 R7 PRO 3700U, Vega 10, 57 Wh | Acer Swift 3 SF314-55G-768V i7-8565U, GeForce MX250, 50.7 Wh | Asus VivoBook 14 F412FJ-EB084T i5-8265U, GeForce MX230, 37 Wh | Dell Latitude 14 5495 R7 2700U, Vega 10, 61 Wh | Média da turma Subnotebook | |
|---|---|---|---|---|---|---|
| Duração da bateria | 79% | 11% | -13% | 35% | 72% | |
| Reader / Idle (h) | 17.9 | 16.1 -10% | 18.2 2% | 28.6 ? 60% | ||
| WiFi v1.3 (h) | 6.3 | 11.3 79% | 8.1 29% | 5.5 -13% | 9.4 49% | 14.1 ? 124% |
| Load (h) | 1.5 | 1.7 13% | 2.3 53% | 1.998 ? 33% |
Pro
Contra
Veredicto - Um bom portátil de escritório para uso em movimento
O TravelMate X514 faz jus ao seu preço e, provavelmente, às intenções da Acer também. O laptop alcança um bom equilíbrio entre ser compacto e leve, com energia suficiente para todas as tarefas gerais do escritório. O dispositivo também possui uma duração de bateria adequada, sem ser sobrecarregado por uma bateria de alta capacidade que aumentaria seu peso total.
No entanto, a tela deixa uma impressão confusa. Por um lado, reproduz cores vivas, mantendo a precisão das cores, algo que deve impressionar os criadores de conteúdo ou aqueles que gostam de fazer stream em movimento. Por outro lado, seu brilho máximo é muito baixo para um dispositivo projetado para ser usado em movimento, o que é uma pena.
O Acer TravelMate X514-51-511Q é um portátil comercial leve e compacto competente, que se sai bem na maioria das áreas.
No entanto, existem algumas desvantagens em ter um design tão compacto. Em primeiro lugar, a Acer omitiu recursos empresariais, como uma porta Ethernet, portanto, você precisará de um adaptador se precisar de uma conexão de Internet com fio. Além disso, a Acer equipou o dispositivo com uma bateria relativamente pequena, que não aguentará um dia inteiro de uso intensivo longe da rede elétrica. Embora a célula de 36 Wh ajude a manter o dispositivo abaixo de 1 kg (~2,2 lb), a LG conseguiu equipar sua série Gram de 14 polegadas com baterias consideravelmente maiores, mantendo-se abaixo desse limite de peso.
Acer TravelMate X514-51-511Q
- 11/11/2019 v7 (old)
Mike Wobker
Price comparison
