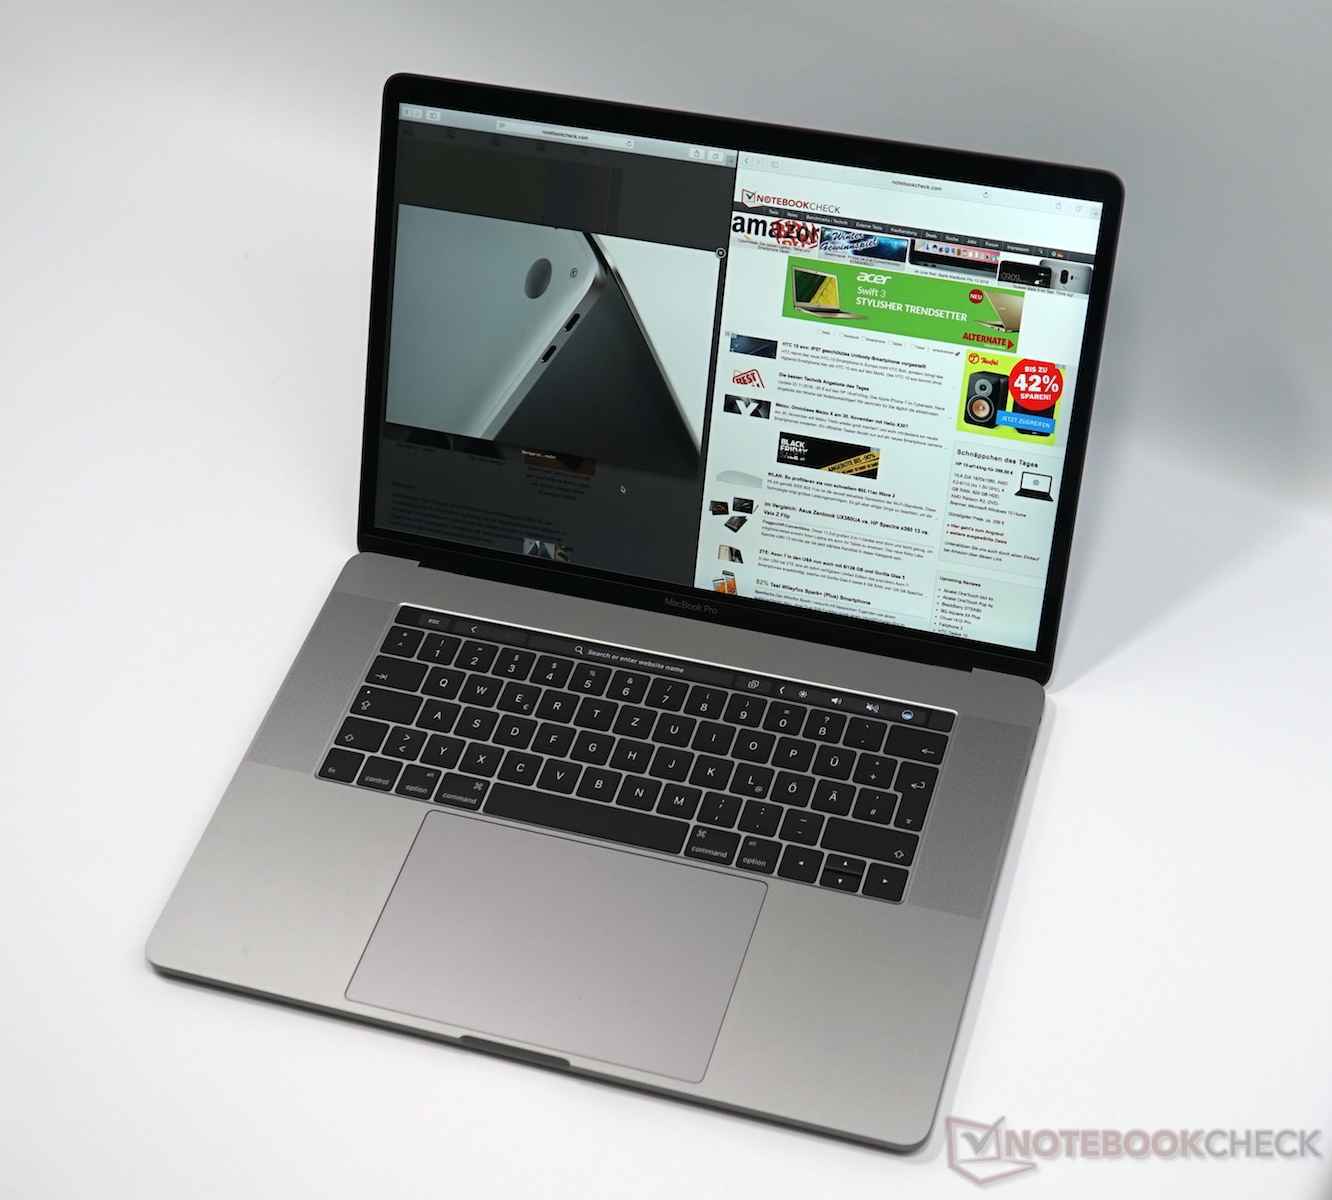
Breve Análise do Portátil Apple MacBook Pro 15 2017 (2.8 GHz, 555)


| |||||||||||||||||||||||||
iluminação: 86 %
iluminação com acumulador: 545 cd/m²
Contraste: 1239:1 (Preto: 0.44 cd/m²)
ΔE ColorChecker Calman: 1.6 | ∀{0.5-29.43 Ø4.71}
ΔE Greyscale Calman: 1.9 | ∀{0.09-98 Ø4.96}
85.9% AdobeRGB 1998 (Argyll 3D)
99.9% sRGB (Argyll 3D)
97.9% Display P3 (Argyll 3D)
Gamma: 2.26
CCT: 6834 K
| Apple MacBook Pro 15 2017 (2.8 GHz, 555) APPA031, , 2880x1800, 15.4" | Apple MacBook Pro 15 2016 (2.6 GHz, 450) 2880x1800, 15.4" | Apple MacBook Pro 15 2016 (2.7 GHz, 455) APPA031, , 2880x1800, 15.4" | Apple MacBook Pro 15 2016 (2.9 GHz, 460) Apple APPA030, , 2880x1800, 15.4" | Dell XPS 15 9560 (i7-7700HQ, UHD) 3840x2160, 15.6" | Lenovo ThinkPad P51s 20HB000SGE BOE NV156QUM-N44, , 3840x2160, 15.6" | |
|---|---|---|---|---|---|---|
| Display | 1% | 1% | 3% | -20% | ||
| Display P3 Coverage (%) | 97.9 | 98.5 1% | 99 1% | 89.7 -8% | 69.7 -29% | |
| sRGB Coverage (%) | 99.9 | 99.9 0% | 100 0% | 100 0% | 91.2 -9% | |
| AdobeRGB 1998 Coverage (%) | 85.9 | 86.4 1% | 87.3 2% | 100 16% | 66.8 -22% | |
| Response Times | 5% | -7% | -31% | -18% | 24% | |
| Response Time Grey 50% / Grey 80% * (ms) | 48 ? | 47.3 ? 1% | 46.4 ? 3% | 46 ? 4% | 57.2 ? -19% | 38.4 ? 20% |
| Response Time Black / White * (ms) | 33.8 ? | 31.2 ? 8% | 39.2 ? -16% | 56 ? -66% | 39.2 ? -16% | 24.8 ? 27% |
| PWM Frequency (Hz) | 119000 ? | 117000 ? | 119000 ? | 962 | 980 ? | |
| Screen | 10% | 14% | -23% | -75% | -50% | |
| Brightness middle (cd/m²) | 545 | 483 -11% | 568 4% | 420 -23% | 370.1 -32% | 317 -42% |
| Brightness (cd/m²) | 523 | 465 -11% | 532 2% | 401 -23% | 356 -32% | 290 -45% |
| Brightness Distribution (%) | 86 | 92 7% | 83 -3% | 90 5% | 87 1% | 85 -1% |
| Black Level * (cd/m²) | 0.44 | 0.33 25% | 0.297 32% | 0.3 32% | 0.37 16% | 0.32 27% |
| Contrast (:1) | 1239 | 1464 18% | 1912 54% | 1400 13% | 1000 -19% | 991 -20% |
| Colorchecker dE 2000 * | 1.6 | 1.4 13% | 1.4 13% | 3.33 -108% | 5.3 -231% | 3.6 -125% |
| Colorchecker dE 2000 max. * | 3.8 | 3 21% | 2.7 29% | 5.11 -34% | 9.9 -161% | 6.6 -74% |
| Greyscale dE 2000 * | 1.9 | 1.5 21% | 2.3 -21% | 2.73 -44% | 4.6 -142% | 4.2 -121% |
| Gamma | 2.26 97% | 2.34 94% | 2.29 96% | 2.48 89% | 2.31 95% | 2.24 98% |
| CCT | 6834 95% | 6650 98% | 7165 91% | 6457 101% | 6284 103% | 6740 96% |
| Color Space (Percent of AdobeRGB 1998) (%) | 77.4 | 78.09 | 88.3 | 59.5 | ||
| Color Space (Percent of sRGB) (%) | 99.9 | 99.97 | 100 | 91.1 | ||
| Média Total (Programa/Configurações) | 8% /
9% | 3% /
8% | -18% /
-19% | -30% /
-48% | -15% /
-32% |
* ... menor é melhor
Exibir tempos de resposta
| ↔ Tempo de resposta preto para branco | ||
|---|---|---|
| 33.8 ms ... ascensão ↗ e queda ↘ combinadas | ↗ 19.6 ms ascensão | 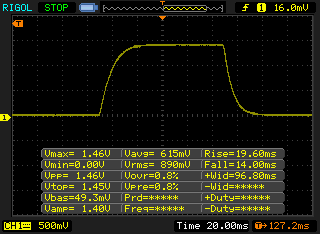 |
| ↘ 14.2 ms queda | ||
| A tela mostra taxas de resposta lentas em nossos testes e será insatisfatória para os jogadores. Em comparação, todos os dispositivos testados variam de 0.1 (mínimo) a 240 (máximo) ms. » 91 % de todos os dispositivos são melhores. Isso significa que o tempo de resposta medido é pior que a média de todos os dispositivos testados (19.8 ms). | ||
| ↔ Tempo de resposta 50% cinza a 80% cinza | ||
| 48 ms ... ascensão ↗ e queda ↘ combinadas | ↗ 23.6 ms ascensão | 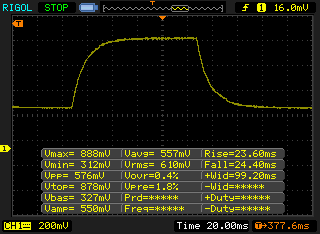 |
| ↘ 24.4 ms queda | ||
| A tela mostra taxas de resposta lentas em nossos testes e será insatisfatória para os jogadores. Em comparação, todos os dispositivos testados variam de 0.165 (mínimo) a 636 (máximo) ms. » 82 % de todos os dispositivos são melhores. Isso significa que o tempo de resposta medido é pior que a média de todos os dispositivos testados (31 ms). | ||
Cintilação da tela / PWM (modulação por largura de pulso)
| Tela tremeluzindo/PWM detectado | 119000 Hz | ≤ 80 % configuração de brilho | 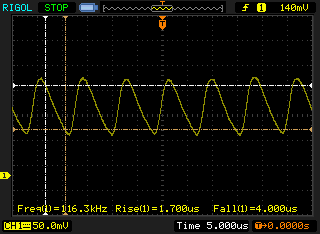 |
| ≤ 210 brilho cd/m² | |||
A luz de fundo da tela pisca em 119000 Hz (pior caso, por exemplo, utilizando PWM) Cintilação detectada em uma configuração de brilho de 80 % (210 cd/m²) e abaixo. Não deve haver cintilação ou PWM acima desta configuração de brilho. A frequência de 119000 Hz é bastante alta, então a maioria dos usuários sensíveis ao PWM não deve notar nenhuma oscilação. A cintilação ocorre mesmo com configurações de brilho alto e pode afetar o usuário durante o uso diário. [pwm_comparison] Em comparação: 52 % de todos os dispositivos testados não usam PWM para escurecer a tela. Se PWM foi detectado, uma média de 7754 (mínimo: 5 - máximo: 343500) Hz foi medida. | |||
| PCMark 8 Home Score Accelerated v2 | 4054 pontos | |
| PCMark 8 Creative Score Accelerated v2 | 4914 pontos | |
| PCMark 8 Work Score Accelerated v2 | 4648 pontos | |
| PCMark 10 Score | 4122 pontos | |
Ajuda | ||
| 3DMark 06 Standard Score | 26389 pontos | |
| 3DMark 11 Performance | 5566 pontos | |
| 3DMark Cloud Gate Standard Score | 15337 pontos | |
| 3DMark Fire Strike Score | 3430 pontos | |
| 3DMark Time Spy Score | 1207 pontos | |
Ajuda | ||
Barulho
| Ocioso |
| 31.3 / 31.3 / 31.7 dB |
| Carga |
| 39.7 / 48.6 dB |
 | ||
30 dB silencioso 40 dB(A) audível 50 dB(A) ruidosamente alto |
||
min: | ||
| Apple MacBook Pro 15 2017 (2.8 GHz, 555) Radeon Pro 555, i7-7700HQ, Apple SSD SM0256L | Apple MacBook Pro 15 2016 (2.6 GHz, 450) Radeon Pro 450, 6700HQ, Apple SSD SM0256L | Apple MacBook Pro 15 2016 (2.7 GHz, 455) Radeon Pro 455, 6820HQ, Apple SSD SM0512L | Apple MacBook Pro 15 2016 (2.9 GHz, 460) Radeon Pro 460, 6920HQ, Apple SSD SM1024L | Dell XPS 15 9560 (i7-7700HQ, UHD) GeForce GTX 1050 Mobile, i7-7700HQ, Lite-On CX2-8B512-Q11 | Lenovo ThinkPad P51s 20HB000SGE Quadro M520, i7-7600U, Samsung SSD PM961 1TB M.2 PCIe 3.0 x4 NVMe (MZVLW1T0) | |
|---|---|---|---|---|---|---|
| Noise | 5% | 2% | 6% | -6% | 8% | |
| desligado / ambiente * (dB) | 30.9 | 30.4 2% | 30.4 2% | 29 6% | 28.4 8% | 29.2 6% |
| Idle Minimum * (dB) | 31.3 | 30.6 2% | 30.8 2% | 30.3 3% | 29 7% | 29.2 7% |
| Idle Average * (dB) | 31.3 | 30.6 2% | 30.8 2% | 30.3 3% | 29 7% | 29.2 7% |
| Idle Maximum * (dB) | 31.7 | 30.6 3% | 30.8 3% | 30.3 4% | 32.2 -2% | 31.1 2% |
| Load Average * (dB) | 39.7 | 34.7 13% | 38.7 3% | 35.1 12% | 47.1 -19% | 36.7 8% |
| Witcher 3 ultra * (dB) | 35.5 | 52 -46% | ||||
| Load Maximum * (dB) | 48.6 | 46.3 5% | 48.8 -0% | 46 5% | 47.1 3% | 39.4 19% |
* ... menor é melhor
(±) A temperatura máxima no lado superior é 44 °C / 111 F, em comparação com a média de 36.8 °C / 98 F , variando de 21 a 71 °C para a classe Multimedia.
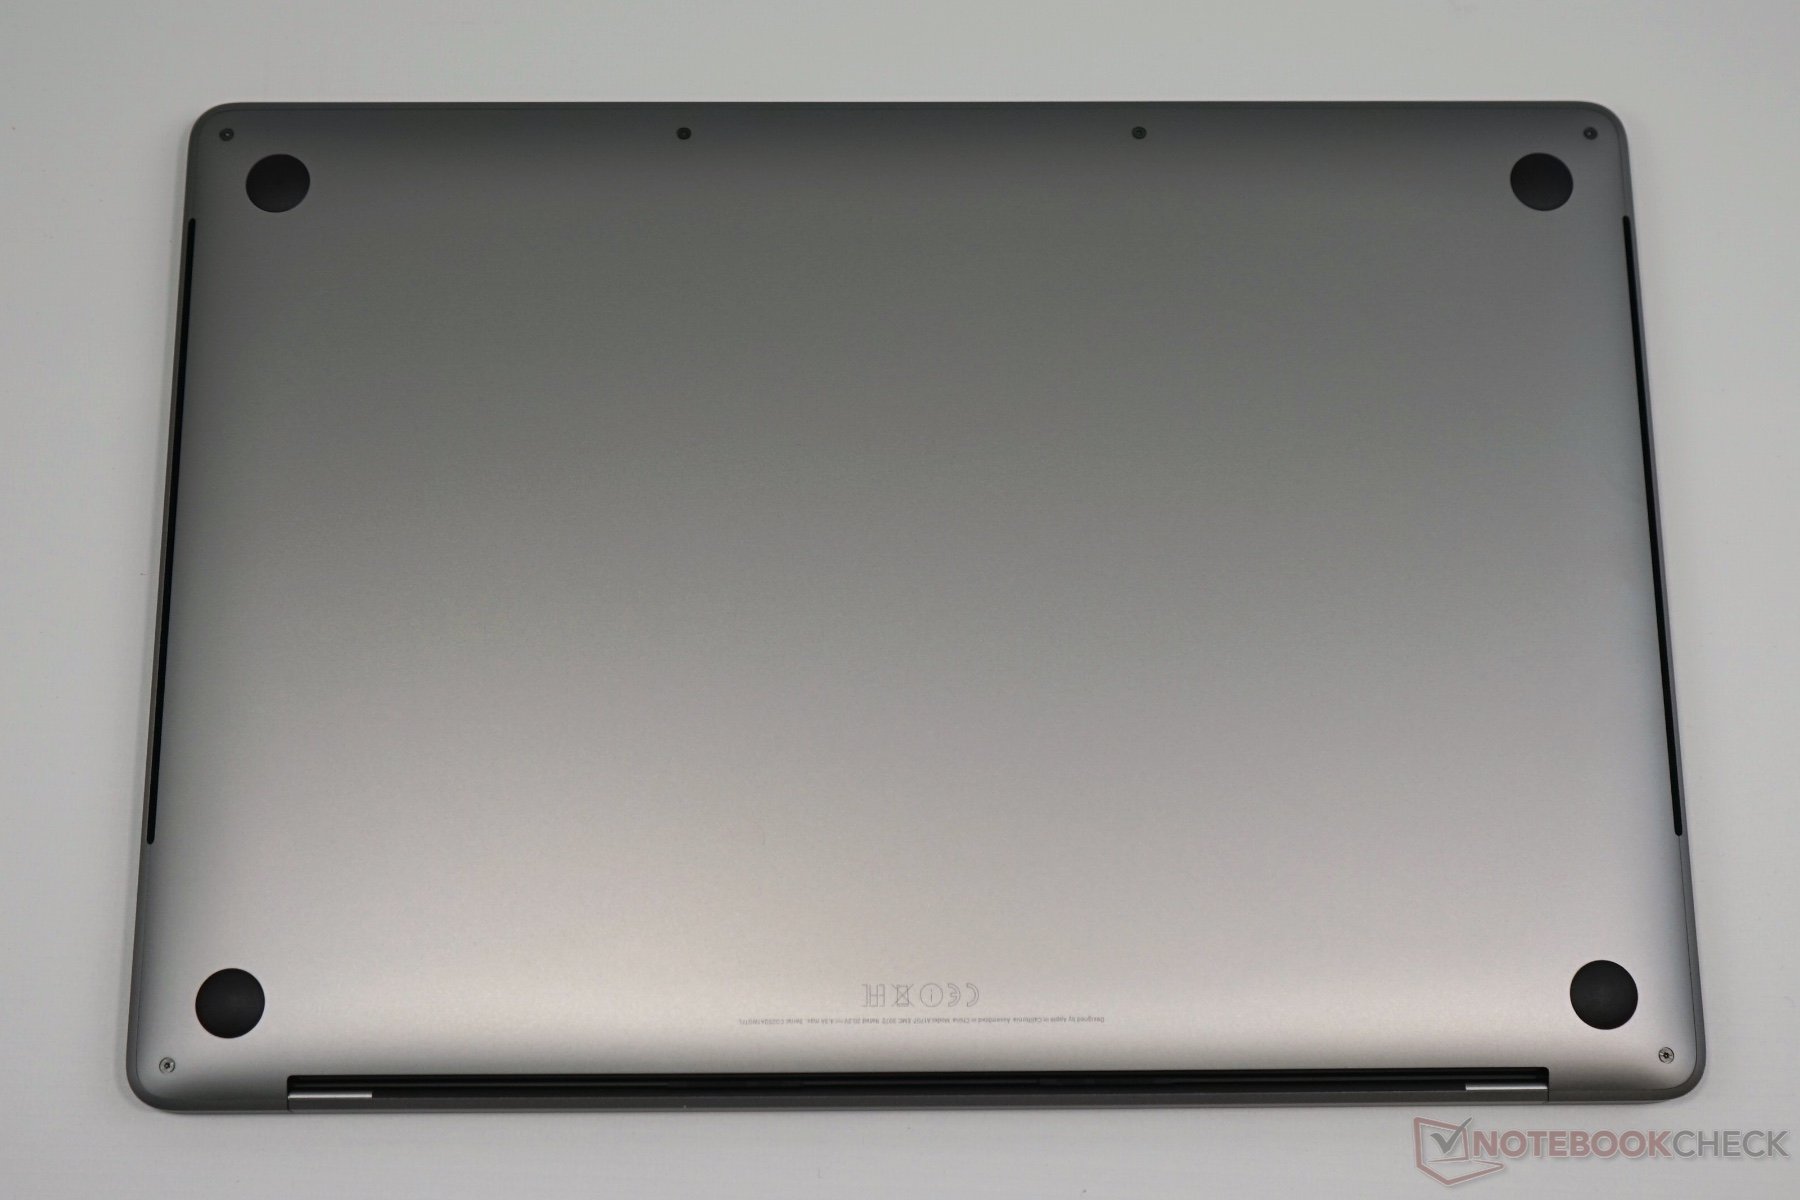
(±) A parte inferior aquece até um máximo de 41 °C / 106 F, em comparação com a média de 39.1 °C / 102 F
(+) Em uso inativo, a temperatura média para o lado superior é 22.8 °C / 73 F, em comparação com a média do dispositivo de 31.3 °C / ### class_avg_f### F.
(±) Jogando The Witcher 3, a temperatura média para o lado superior é 36.6 °C / 98 F, em comparação com a média do dispositivo de 31.3 °C / ## #class_avg_f### F.
(+) Os apoios para as mãos e o touchpad são mais frios que a temperatura da pele, com um máximo de 30 °C / 86 F e, portanto, são frios ao toque.
(±) A temperatura média da área do apoio para as mãos de dispositivos semelhantes foi 28.7 °C / 83.7 F (-1.3 °C / -2.3 F).
Apple MacBook Pro 15 2017 (2.8 GHz, 555) análise de áudio
(+) | os alto-falantes podem tocar relativamente alto (###valor### dB)
Graves 100 - 315Hz
(±) | graves reduzidos - em média 8.7% menor que a mediana
(±) | a linearidade dos graves é média (11.1% delta para a frequência anterior)
Médios 400 - 2.000 Hz
(+) | médios equilibrados - apenas 2.5% longe da mediana
(±) | a linearidade dos médios é média (7.5% delta para frequência anterior)
Altos 2 - 16 kHz
(+) | agudos equilibrados - apenas 1.7% longe da mediana
(+) | os máximos são lineares (5% delta da frequência anterior)
Geral 100 - 16.000 Hz
(+) | o som geral é linear (7.9% diferença em relação à mediana)
Comparado com a mesma classe
» 7% de todos os dispositivos testados nesta classe foram melhores, 2% semelhantes, 91% piores
» O melhor teve um delta de 5%, a média foi 17%, o pior foi 45%
Comparado com todos os dispositivos testados
» 2% de todos os dispositivos testados foram melhores, 1% semelhantes, 98% piores
» O melhor teve um delta de 4%, a média foi 23%, o pior foi 134%
Apple MacBook Pro 13 2017 Touchbar i5 análise de áudio
(+) | os alto-falantes podem tocar relativamente alto (###valor### dB)
Graves 100 - 315Hz
(±) | graves reduzidos - em média 11.5% menor que a mediana
(±) | a linearidade dos graves é média (10.8% delta para a frequência anterior)
Médios 400 - 2.000 Hz
(±) | médios mais altos - em média 5.2% maior que a mediana
(+) | médios são lineares (6.4% delta para frequência anterior)
Altos 2 - 16 kHz
(+) | agudos equilibrados - apenas 2.2% longe da mediana
(+) | os máximos são lineares (5.7% delta da frequência anterior)
Geral 100 - 16.000 Hz
(+) | o som geral é linear (11.9% diferença em relação à mediana)
Comparado com a mesma classe
» 13% de todos os dispositivos testados nesta classe foram melhores, 5% semelhantes, 82% piores
» O melhor teve um delta de 5%, a média foi 18%, o pior foi 53%
Comparado com todos os dispositivos testados
» 9% de todos os dispositivos testados foram melhores, 2% semelhantes, 89% piores
» O melhor teve um delta de 4%, a média foi 23%, o pior foi 134%
Dell XPS 15 9560 (i7-7700HQ, UHD) análise de áudio
(-) | alto-falantes não muito altos (###valor### dB)
Graves 100 - 315Hz
(±) | graves reduzidos - em média 12.9% menor que a mediana
(±) | a linearidade dos graves é média (14.3% delta para a frequência anterior)
Médios 400 - 2.000 Hz
(+) | médios equilibrados - apenas 3.5% longe da mediana
(±) | a linearidade dos médios é média (8.9% delta para frequência anterior)
Altos 2 - 16 kHz
(+) | agudos equilibrados - apenas 2.3% longe da mediana
(±) | a linearidade dos máximos é média (7.3% delta para frequência anterior)
Geral 100 - 16.000 Hz
(±) | a linearidade do som geral é média (16.2% diferença em relação à mediana)
Comparado com a mesma classe
» 41% de todos os dispositivos testados nesta classe foram melhores, 7% semelhantes, 51% piores
» O melhor teve um delta de 5%, a média foi 17%, o pior foi 45%
Comparado com todos os dispositivos testados
» 26% de todos os dispositivos testados foram melhores, 6% semelhantes, 68% piores
» O melhor teve um delta de 4%, a média foi 23%, o pior foi 134%
| Apple MacBook Pro 15 2017 (2.8 GHz, 555) i7-7700HQ, Radeon Pro 555, 76 Wh | Apple MacBook Pro 15 2016 (2.6 GHz, 450) 6700HQ, Radeon Pro 450, 76 Wh | Apple MacBook Pro 15 2016 (2.7 GHz, 455) 6820HQ, Radeon Pro 455, 76 Wh | Apple MacBook Pro 15 2016 (2.9 GHz, 460) 6920HQ, Radeon Pro 460, 76 Wh | Dell Precision 3520 i7-7820HQ, Quadro M620, 68 Wh | Dell XPS 15 9560 (i7-7700HQ, UHD) i7-7700HQ, GeForce GTX 1050 Mobile, 97 Wh | Lenovo ThinkPad P51s 20HB000SGE i7-7600U, Quadro M520, 104 Wh | |
|---|---|---|---|---|---|---|---|
| Duração da bateria | -5% | -6% | -2% | -1% | 19% | 163% | |
| H.264 (h) | 8.5 | 8.6 1% | 9.1 7% | 8.1 -5% | 11.7 38% | ||
| WiFi v1.3 (h) | 10.7 | 10 -7% | 10.6 -1% | 10.3 -4% | 7.6 -29% | 7.2 -33% | 11.9 11% |
| Witcher 3 ultra (h) | 1.5 | ||||||
| Load (h) | 1 | 0.9 -10% | 0.9 -10% | 0.9 -10% | 1.3 30% | 1.7 70% | 5.4 440% |
| Reader / Idle (h) | 16.6 | 13.9 | 26.4 |
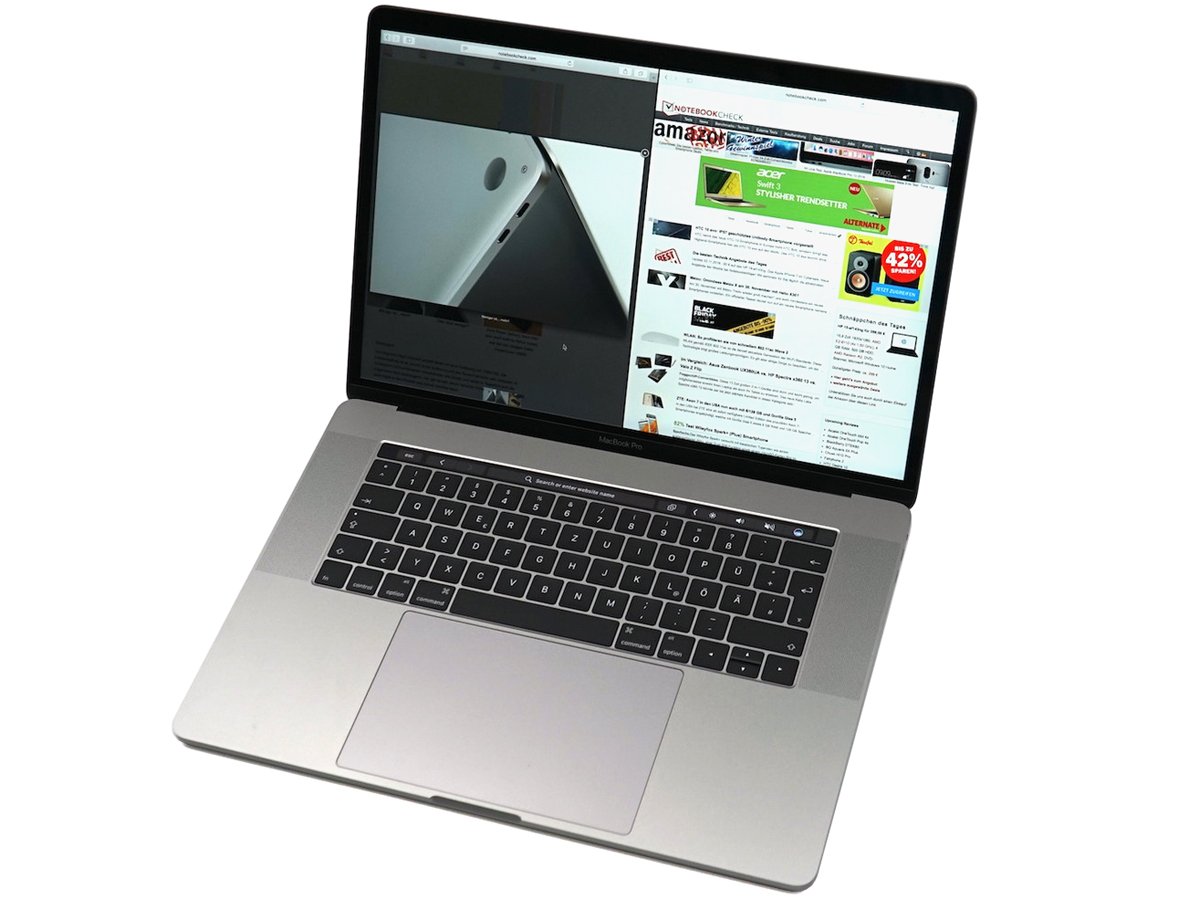
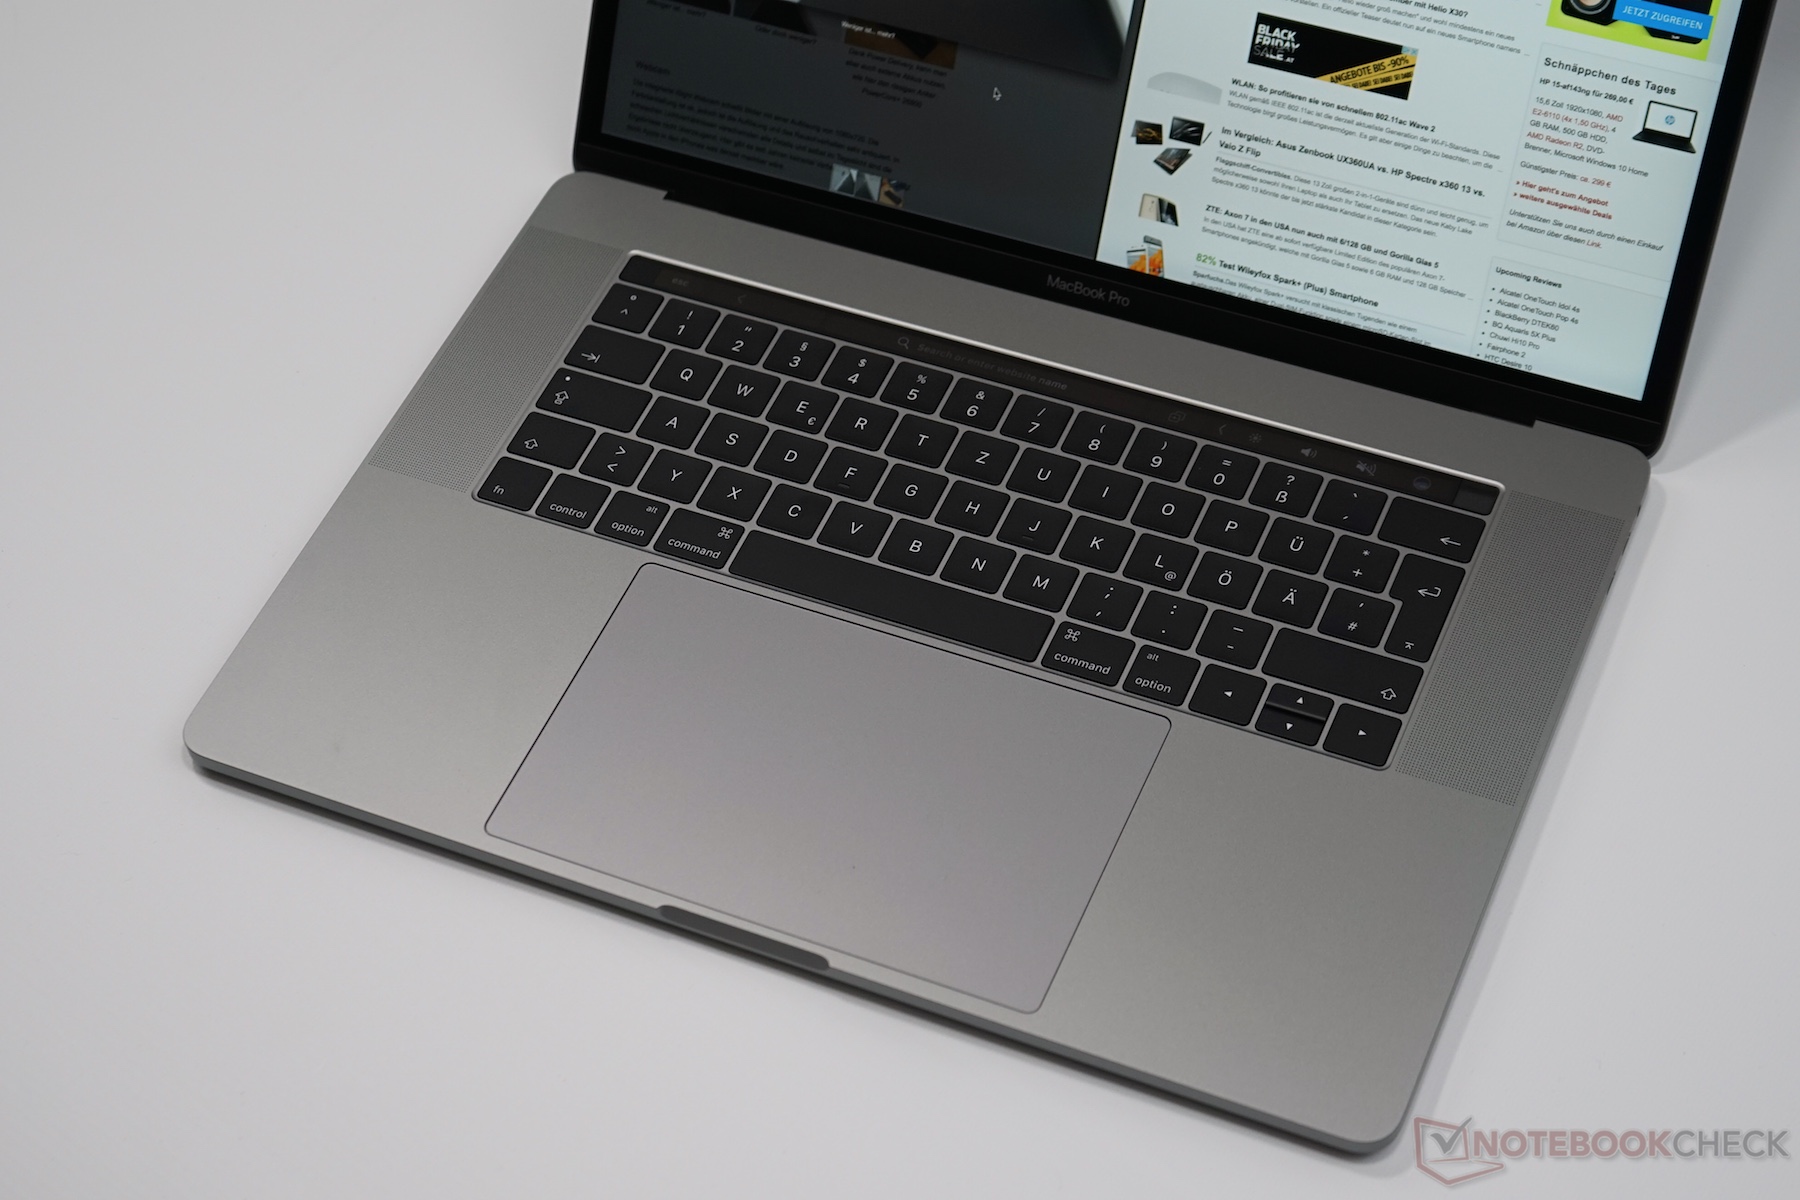
A primeira impressão do MacBook Pro 15 atual é boa após as nossas medições iniciais. O desempenho está a par com os rivais graças aos novos processadores Kaby Lake e o desempenho pode ser utilizado por longos períodos. A Apple agora usa GPUs mais velozes por padrão. Seu desempenho não pode competir com GPUs Pascal mainstream atuais da Nvidia, mas, em troca, os chips AMD são muito eficientes.
Vamos completar a análise nos próximos dias.
Price comparison
