Breve Análise do Portátil Apple MacBook Air 13 2017 (1.8 GHz)
| SD Card Reader | |
| average JPG Copy Test (av. of 3 runs) | |
| Dell XPS 13 9360 FHD i5 | |
| Apple MacBook Air 13.3" 1.8 GHz (2017) | |
| Asus Zenbook UX310UA-FC347T iGP | |
| maximum AS SSD Seq Read Test (1GB) | |
| Dell XPS 13 9360 FHD i5 | |
| Apple MacBook Air 13.3" 1.8 GHz (2017) | |
| Asus Zenbook UX310UA-FC347T iGP | |
| |||||||||||||||||||||||||
iluminação: 82 %
iluminação com acumulador: 327 cd/m²
Contraste: 812:1 (Preto: 0.405 cd/m²)
ΔE ColorChecker Calman: 3.96 | ∀{0.5-29.43 Ø4.72}
ΔE Greyscale Calman: 3.51 | ∀{0.09-98 Ø4.97}
59.8% sRGB (Argyll 1.6.3 3D)
38.4% AdobeRGB 1998 (Argyll 1.6.3 3D)
41.51% AdobeRGB 1998 (Argyll 3D)
59.8% sRGB (Argyll 3D)
40.1% Display P3 (Argyll 3D)
Gamma: 3.83
CCT: 6711 K
| Apple MacBook Air 13.3" 1.8 GHz (2017) 1440x900, 13.3" | Apple MacBook Air 13 inch 2015-03 Apple APP9CF0, , 1440x900, 13.3" | Apple MacBook 12 (Early 2016) 1.1 GHz APPA027, , 2304x1440, 12" | Apple MacBook Pro 13 2016 (2.9 GHz) APPA033, , 2560x1600, 13.3" | Dell XPS 13 9360 FHD i5 Sharp SHP1449 LQ133M1, , 1920x1080, 13.3" | Dell XPS 13 9360 QHD+ i7 Sharp SHP144A, , 3200x1800, 13.3" | |
|---|---|---|---|---|---|---|
| Display | ||||||
| Display P3 Coverage (%) | 40.1 | 66.8 | 99.2 | 48.94 | 62.8 | |
| sRGB Coverage (%) | 59.8 | 95.4 | 99.9 | 73.3 | 89.4 | |
| AdobeRGB 1998 Coverage (%) | 41.51 | 68 | 87.6 | 50.5 | 64.6 | |
| Response Times | 7% | -39% | 10% | 7% | ||
| Response Time Grey 50% / Grey 80% * (ms) | 52.4 ? | 41.2 ? 21% | 47.2 ? 10% | 32.8 ? 37% | 43.6 ? 17% | |
| Response Time Black / White * (ms) | 28.4 ? | 30.4 ? -7% | 53 ? -87% | 33.2 ? -17% | 29.2 ? -3% | |
| PWM Frequency (Hz) | 58000 | |||||
| Screen | ||||||
| Brightness middle (cd/m²) | 329 | 387 | 569 | 351.2 | 396.2 | |
| Black Level * (cd/m²) | 0.405 | 0.47 | 0.56 | 0.195 | 0.266 | |
| Brightness (cd/m²) | 310 | 358 | 542 | 325 | 357 | |
| Brightness Distribution (%) | 82 | 88 | 90 | 89 | 84 | |
| Contrast (:1) | 812 | 823 | 1016 | 1801 | 1489 | |
| Colorchecker dE 2000 * | 3.96 | 1.6 | 1.4 | 7.4 | 3.9 | |
| Colorchecker dE 2000 max. * | 7.51 | 4 | 2.9 | 9.08 | 7.58 | |
| Greyscale dE 2000 * | 3.51 | 1 | 1.8 | 6.71 | 4.16 | |
| Gamma | 3.83 57% | 2.26 97% | 2.16 102% | 2.74 80% | 2.31 95% | |
| CCT | 6711 97% | 6680 97% | 6877 95% | 7222 90% | 6514 100% | |
| Color Space (Percent of AdobeRGB 1998) (%) | 38.4 | 61.6 | 78.4 | 50.48 | 57.5 | |
| Color Space (Percent of sRGB) (%) | 59.8 | 82.2 | 99.3 | 73.31 | 88.7 | |
| Média Total (Programa/Configurações) | 7% /
7% | -39% /
-39% | 10% /
10% | 7% /
7% |
* ... menor é melhor
Exibir tempos de resposta
| ↔ Tempo de resposta preto para branco | ||
|---|---|---|
| 28.4 ms ... ascensão ↗ e queda ↘ combinadas | ↗ 18.4 ms ascensão | 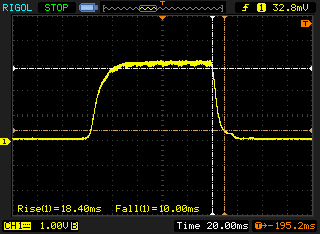 |
| ↘ 10 ms queda | ||
| A tela mostra taxas de resposta relativamente lentas em nossos testes e pode ser muito lenta para os jogadores. Em comparação, todos os dispositivos testados variam de 0.1 (mínimo) a 240 (máximo) ms. » 75 % de todos os dispositivos são melhores. Isso significa que o tempo de resposta medido é pior que a média de todos os dispositivos testados (19.8 ms). | ||
| ↔ Tempo de resposta 50% cinza a 80% cinza | ||
| 52.4 ms ... ascensão ↗ e queda ↘ combinadas | ↗ 30.4 ms ascensão | 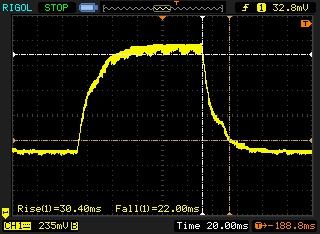 |
| ↘ 22 ms queda | ||
| A tela mostra taxas de resposta lentas em nossos testes e será insatisfatória para os jogadores. Em comparação, todos os dispositivos testados variam de 0.165 (mínimo) a 636 (máximo) ms. » 89 % de todos os dispositivos são melhores. Isso significa que o tempo de resposta medido é pior que a média de todos os dispositivos testados (31 ms). | ||
Cintilação da tela / PWM (modulação por largura de pulso)
| Tela tremeluzindo/PWM detectado | 58000 Hz | 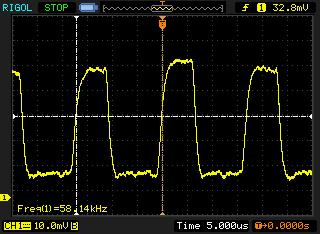 | |
A luz de fundo da tela pisca em 58000 Hz (pior caso, por exemplo, utilizando PWM) . A frequência de 58000 Hz é bastante alta, então a maioria dos usuários sensíveis ao PWM não deve notar nenhuma oscilação. [pwm_comparison] Em comparação: 52 % de todos os dispositivos testados não usam PWM para escurecer a tela. Se PWM foi detectado, uma média de 7747 (mínimo: 5 - máximo: 343500) Hz foi medida. | |||
| Cinebench R15 | |
| CPU Single 64Bit | |
| Asus Zenbook UX310UA-FC347T iGP | |
| Apple MacBook Pro 13 2016 (2.9 GHz) | |
| Dell Inspiron 13 5378-0K46 | |
| Apple MacBook Air 13.3" 1.8 GHz (2017) | |
| Apple MacBook Air 13 inch 2015-03 | |
| Apple MacBook 12 (Early 2016) 1.3 GHz | |
| CPU Multi 64Bit | |
| Asus Zenbook UX310UA-FC347T iGP | |
| Apple MacBook Pro 13 2016 (2.9 GHz) | |
| Dell Inspiron 13 5378-0K46 | |
| Apple MacBook Air 13 inch 2015-03 | |
| Apple MacBook Air 13.3" 1.8 GHz (2017) | |
| Apple MacBook 12 (Early 2016) 1.3 GHz | |
| PCMark 8 | |
| Home Score Accelerated v2 | |
| Apple MacBook Pro 15 2017 (2.8 GHz, 555) | |
| Apple MacBook Air 13 inch 2015-03 | |
| Apple MacBook Air 13.3" 1.8 GHz (2017) | |
| Apple MacBook 12 2017 | |
| Work Score Accelerated v2 | |
| Apple MacBook Pro 15 2017 (2.8 GHz, 555) | |
| Apple MacBook Air 13.3" 1.8 GHz (2017) | |
| Apple MacBook Air 13 inch 2015-03 | |
| Apple MacBook 12 2017 | |
| PCMark 8 Home Score Accelerated v2 | 3396 pontos | |
| PCMark 8 Creative Score Accelerated v2 | 4264 pontos | |
| PCMark 8 Work Score Accelerated v2 | 4371 pontos | |
| PCMark 10 Score | 2523 pontos | |
Ajuda | ||
| Apple MacBook Air 13.3" 1.8 GHz (2017) Apple SSD SM0128G | Apple MacBook Pro 13 2017 Touchbar i5 Apple SSD AP0256 | Apple MacBook Pro 15 2017 (2.8 GHz, 555) Apple SSD SM0256L | Apple MacBook 12 2017 Apple SSD AP0256 | Dell XPS 13 9360 FHD i7 Iris Toshiba XG4 NVMe (THNSN5512GPUK) | Asus Zenbook UX3430UQ-GV012T SanDisk SD8SN8U512G1002 | |
|---|---|---|---|---|---|---|
| CrystalDiskMark 3.0 | 19% | 35% | -5% | 73% | -3% | |
| Read Seq (MB/s) | 1390 | 1540 11% | 1557 12% | 955 -31% | 1314 -5% | 500 -64% |
| Write Seq (MB/s) | 731 | 1353 85% | 1505 106% | 899 23% | 617 -16% | 457.4 -37% |
| Read 512 (MB/s) | 899 | 926 3% | 968 8% | 658 -27% | 1058 18% | 345.6 -62% |
| Write 512 (MB/s) | 715 | 698 -2% | 1124 57% | 579 -19% | 502 -30% | 415 -42% |
| Read 4k (MB/s) | 16.29 | 9.92 -39% | 10.76 -34% | 9.721 -40% | 37.31 129% | 28.34 74% |
| Write 4k (MB/s) | 27.17 | 10.74 -60% | 12.87 -53% | 12.78 -53% | 133.6 392% | 56.8 109% |
| Read 4k QD32 (MB/s) | 300.9 | 618 105% | 631 110% | 521 73% | 425.1 41% | 311.3 3% |
| Write 4k QD32 (MB/s) | 273.7 | 403.8 48% | 468.4 71% | 370.1 35% | 431.3 58% | 251.1 -8% |

| 3DMark 11 - 1280x720 Performance GPU | |
| Apple MacBook Pro 15 2017 (2.8 GHz, 555) | |
| Apple MacBook Pro 13 2017 Touchbar i5 | |
| Dell XPS 13 9360 FHD i7 Iris | |
| Dell XPS 13 9360 FHD i5 | |
| Apple MacBook Air 13.3" 1.8 GHz (2017) | |
| Apple MacBook Air 13 inch 2015-03 | |
| Apple MacBook 12 2017 | |
| 3DMark | |
| 1280x720 Cloud Gate Standard Graphics | |
| Apple MacBook Pro 15 2017 (2.8 GHz, 555) | |
| Apple MacBook Pro 13 2017 Touchbar i5 | |
| Dell XPS 13 9360 FHD i7 Iris | |
| Dell XPS 13 9360 FHD i5 | |
| Apple MacBook Air 13.3" 1.8 GHz (2017) | |
| Apple MacBook Air 13 inch 2015-03 | |
| Apple MacBook 12 2017 | |
| 1920x1080 Fire Strike Graphics | |
| Apple MacBook Pro 15 2017 (2.8 GHz, 555) | |
| Apple MacBook Pro 13 2017 Touchbar i5 | |
| Dell XPS 13 9360 FHD i7 Iris | |
| Dell XPS 13 9360 FHD i5 | |
| Apple MacBook Air 13 inch 2015-03 | |
| 3DMark 11 Performance | 1591 pontos | |
| 3DMark Cloud Gate Standard Score | 5878 pontos | |
Ajuda | ||
| BioShock Infinite | |
| 1280x720 Very Low Preset | |
| Apple MacBook Pro 13 2016 (2.9 GHz) | |
| Apple MacBook Pro 13 2017 Touchbar i5 | |
| Asus Zenbook UX310UA-FC347T iGP | |
| Dell XPS 13 9360 FHD i7 Iris | |
| Apple MacBook Air 13 inch 2015-03 | |
| Apple MacBook Air 13.3" 1.8 GHz (2017) | |
| Apple MacBook Air 13 inch 2013 MD760D/A | |
| Apple MacBook Air 11 inch 2013-06 1.7 GHz 256 GB | |
| 1366x768 Medium Preset | |
| Apple MacBook Pro 13 2016 (2.9 GHz) | |
| Apple MacBook Pro 13 2017 Touchbar i5 | |
| Dell XPS 13 9360 FHD i7 Iris | |
| Asus Zenbook UX310UA-FC347T iGP | |
| Apple MacBook Air 13 inch 2015-03 | |
| Apple MacBook Air 13.3" 1.8 GHz (2017) | |
| Apple MacBook Air 13 inch 2013 MD760D/A | |
| Apple MacBook Air 11 inch 2013-06 1.7 GHz 256 GB | |
| baixo | média | alto | ultra | |
|---|---|---|---|---|
| BioShock Infinite (2013) | 42.9 | 26.4 |
(±) A temperatura máxima no lado superior é 42.8 °C / 109 F, em comparação com a média de 35.9 °C / 97 F , variando de 21.4 a 59 °C para a classe Subnotebook.
(±) A parte inferior aquece até um máximo de 41.5 °C / 107 F, em comparação com a média de 39.2 °C / 103 F
(+) Em uso inativo, a temperatura média para o lado superior é 26.3 °C / 79 F, em comparação com a média do dispositivo de 30.8 °C / ### class_avg_f### F.
(+) Os apoios para as mãos e o touchpad são mais frios que a temperatura da pele, com um máximo de 31.2 °C / 88.2 F e, portanto, são frios ao toque.
(-) A temperatura média da área do apoio para as mãos de dispositivos semelhantes foi 28.2 °C / 82.8 F (-3 °C / -5.4 F).
Apple MacBook Air 13.3" 1.8 GHz (2017) análise de áudio
(±) | o volume do alto-falante é médio, mas bom (###valor### dB)
Graves 100 - 315Hz
(±) | graves reduzidos - em média 9.2% menor que a mediana
(±) | a linearidade dos graves é média (11% delta para a frequência anterior)
Médios 400 - 2.000 Hz
(+) | médios equilibrados - apenas 3.6% longe da mediana
(±) | a linearidade dos médios é média (9.7% delta para frequência anterior)
Altos 2 - 16 kHz
(±) | máximos mais altos - em média 5.2% maior que a mediana
(±) | a linearidade dos máximos é média (8.4% delta para frequência anterior)
Geral 100 - 16.000 Hz
(±) | a linearidade do som geral é média (15.1% diferença em relação à mediana)
Comparado com a mesma classe
» 33% de todos os dispositivos testados nesta classe foram melhores, 5% semelhantes, 62% piores
» O melhor teve um delta de 5%, a média foi 18%, o pior foi 53%
Comparado com todos os dispositivos testados
» 21% de todos os dispositivos testados foram melhores, 4% semelhantes, 75% piores
» O melhor teve um delta de 4%, a média foi 23%, o pior foi 134%
Apple MacBook 12 (Early 2016) 1.1 GHz análise de áudio
(+) | os alto-falantes podem tocar relativamente alto (###valor### dB)
Graves 100 - 315Hz
(±) | graves reduzidos - em média 11.3% menor que a mediana
(±) | a linearidade dos graves é média (14.2% delta para a frequência anterior)
Médios 400 - 2.000 Hz
(+) | médios equilibrados - apenas 2.4% longe da mediana
(+) | médios são lineares (5.5% delta para frequência anterior)
Altos 2 - 16 kHz
(+) | agudos equilibrados - apenas 2% longe da mediana
(+) | os máximos são lineares (4.5% delta da frequência anterior)
Geral 100 - 16.000 Hz
(+) | o som geral é linear (10.2% diferença em relação à mediana)
Comparado com a mesma classe
» 7% de todos os dispositivos testados nesta classe foram melhores, 2% semelhantes, 90% piores
» O melhor teve um delta de 5%, a média foi 18%, o pior foi 53%
Comparado com todos os dispositivos testados
» 5% de todos os dispositivos testados foram melhores, 1% semelhantes, 94% piores
» O melhor teve um delta de 4%, a média foi 23%, o pior foi 134%
| desligado | |
| Ocioso | |
| Carga |
|
Key:
min: | |
| Apple MacBook Air 13.3" 1.8 GHz (2017) 5350U, HD Graphics 6000, Apple SSD SM0128G, TN LED, 1440x900, 13.3" | Apple MacBook Pro 15 2017 (2.8 GHz, 555) i7-7700HQ, Radeon Pro 555, Apple SSD SM0256L, IPS, 2880x1800, 15.4" | Apple MacBook 12 (Early 2016) 1.1 GHz 6Y30, HD Graphics 515, Apple SSD AP0256, IPS, 2304x1440, 12" | Apple MacBook Air 13 inch 2015-03 5650U, HD Graphics 6000, Apple SSD SD0256F, TN LED, 1440x900, 13.3" | Apple MacBook 12 2017 m3-7Y32, HD Graphics 615, Apple SSD AP0256, LED IPS, 2304x1440, 12" | Apple MacBook 12 (Early 2016) 1.3 GHz 6Y75, HD Graphics 515, Apple SSD AP0256, IPS, 2304x1440, 12" | Apple MacBook Pro 13 2017 Touchbar i5 i5-7267U, Iris Plus Graphics 650, Apple SSD AP0256, IPS, 2560x1600, 13.3" | |
|---|---|---|---|---|---|---|---|
| Power Consumption | -100% | 32% | 12% | 29% | 36% | -45% | |
| Idle Minimum * (Watt) | 3.4 | 3.4 -0% | 2.7 21% | 2.7 21% | 2 41% | 2 41% | 2.8 18% |
| Idle Average * (Watt) | 6.3 | 13.9 -121% | 2.7 57% | 5.7 10% | 5.4 14% | 2.06 67% | 10.9 -73% |
| Idle Maximum * (Watt) | 7 | 17.6 -151% | 7.2 -3% | 6 14% | 6.6 6% | 6.94 1% | 11.4 -63% |
| Load Average * (Watt) | 34.5 | 71.1 -106% | 22 36% | 32.1 7% | 22 36% | 22.52 35% | 55.4 -61% |
| Load Maximum * (Watt) | 40 | 88.5 -121% | 20.5 49% | 36.2 9% | 20 50% | 24.87 38% | 57.5 -44% |
| Witcher 3 ultra * (Watt) | 57.9 |
* ... menor é melhor
| Apple MacBook Air 13.3" 1.8 GHz (2017) 5350U, HD Graphics 6000, 54 Wh | Apple MacBook Pro 13 2017 Touchbar i5 i5-7267U, Iris Plus Graphics 650, 49.2 Wh | Apple MacBook 12 (Early 2016) 1.3 GHz 6Y75, HD Graphics 515, 41.4 Wh | Apple MacBook 12 2017 m3-7Y32, HD Graphics 615, 41.4 Wh | Apple MacBook Pro 13 2016 (2.9 GHz) 6267U, Iris Graphics 550, 49.2 Wh | Apple MacBook Air 13 inch 2015-03 5650U, HD Graphics 6000, 54 Wh | Apple MacBook Pro 15 2017 (2.8 GHz, 555) i7-7700HQ, Radeon Pro 555, 76 Wh | |
|---|---|---|---|---|---|---|---|
| Duração da bateria | -18% | -13% | -15% | -11% | -3% | 1% | |
| WiFi v1.3 (h) | 10.6 | 8.7 -18% | 9.2 -13% | 9 -15% | 9.4 -11% | 10.3 -3% | 10.7 1% |
| H.264 (h) | 6.9 | 10.3 | 8.1 | 8.5 | |||
| Load (h) | 1.2 | 3.5 | 1.1 | 1.6 | 1 | ||
| Reader / Idle (h) | 26.2 | ||||||
| Witcher 3 ultra (h) | 1.5 |
Pro
Contra
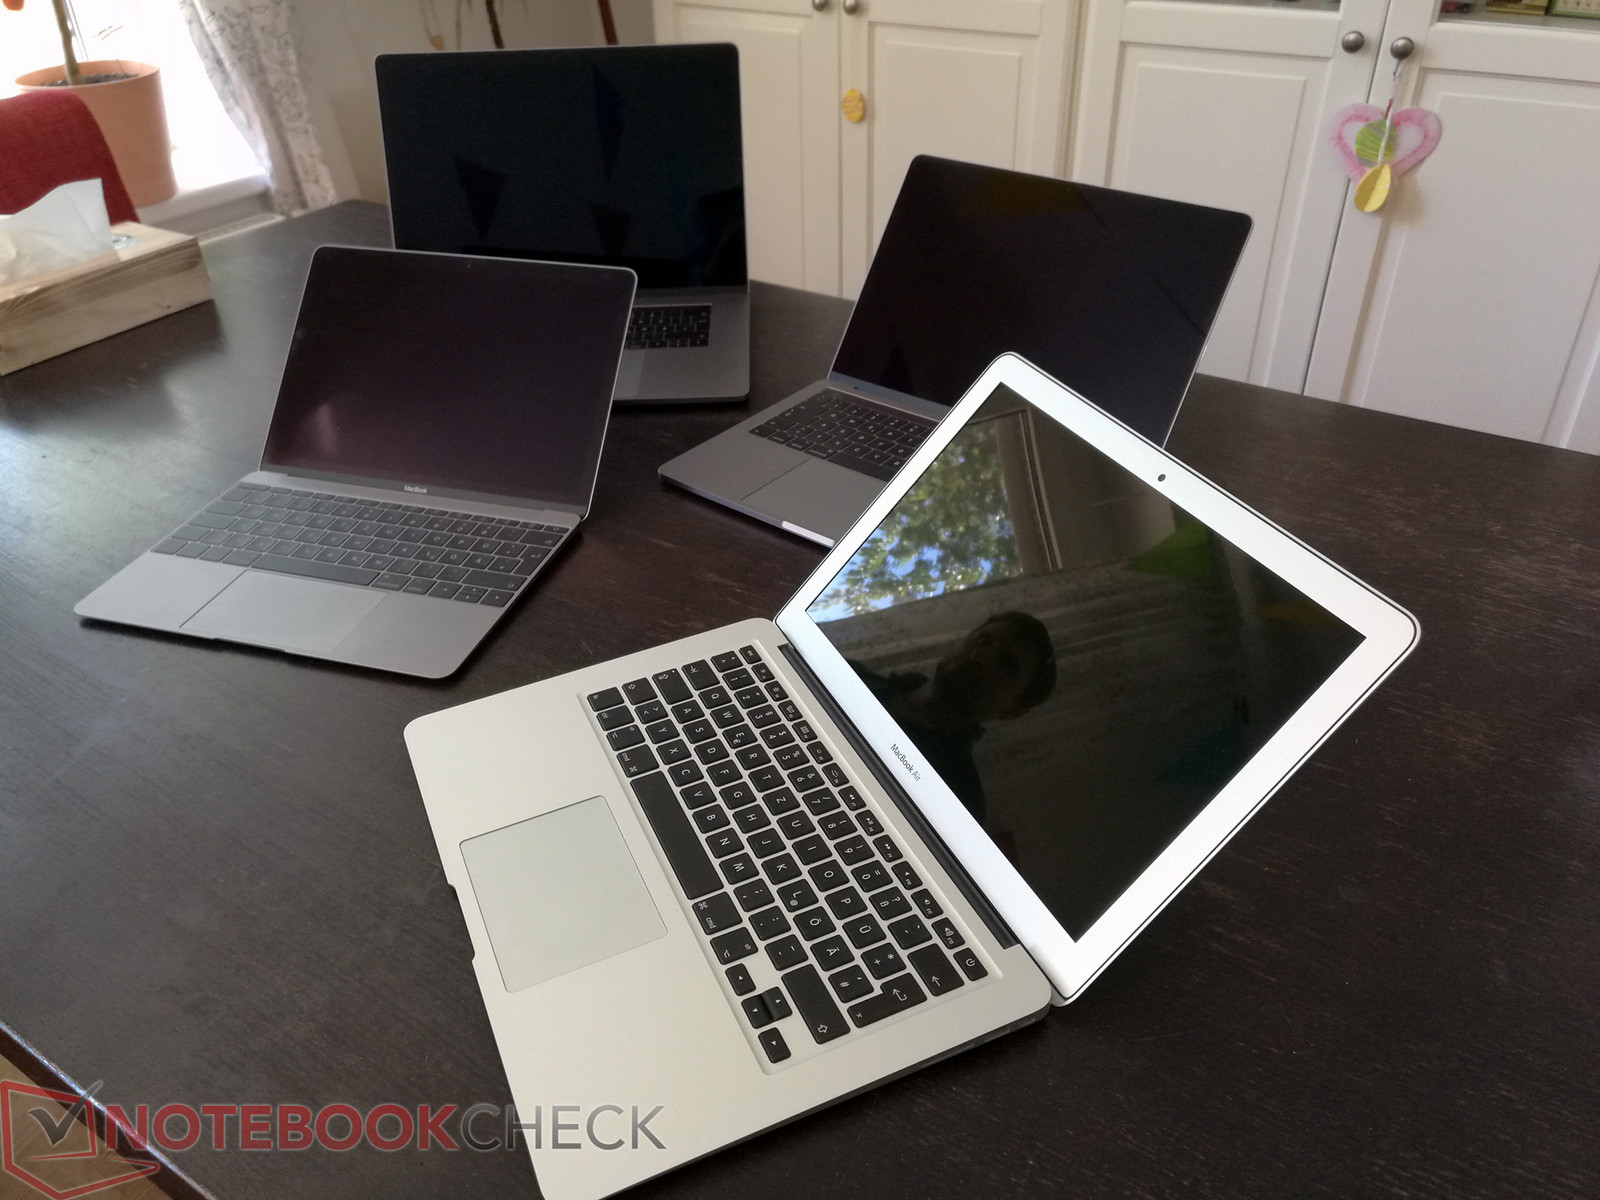
Os anos passam, mas o MacBook Air permanece inalterado ano após ano após ano. As mudanças mais significativas no design do portátil nos últimos anos, como resoluções de tela mais altas, painéis mais finos e telas maiores em carcaças de tamanho similar, todas passaram despercebidas pelo Air. Consequentemente, não nos surpreendeu que, ao contrário das atualizações do MacBook 12, a Apple fazer as atualizações do Air em silêncio. Aparentemente, o MacBook Air não é mais "apresentável", e de alguma forma não se encaixa no portfólio atual da Apple.
O maior problema que temos com o novo MacBook Air 13 é a sua tela. Com o seu painel TN de baixa resolução, certamente se sente muito desatualizado, no geral. Em 2017, nossas expectativas de um portátil de US $ 1000 incluem um painel IPS com resolução, pelo menos, FHD. Seu preço de $999 para o modelo de base de 128 GB é bastante elevado, e os $200 extras que a Apple cobra por um SSD de 256 GB é francamente um assalto à luz do dia.
No entanto, mesmo depois de todos esses anos, o conceito básico do Air ainda brilha em meio de toda essa escuridão e poeira. Uma carcaça de alumínio bem construída e de alta qualidade combinada com dispositivos de entrada decentes; desempenho Wi-Fi mais do que um decente; muito bom desempenho geral do sistema adequado para os cenários de uso pretendido; mais de 10 horas de duração da bateria; e por último, mas não menos importante, uma experiência de usuário silenciosa. Mesmo em 2017, todos esses aspectos merecem elogios.
Com cada ano que passa, o alto preço do Air está ficando cada vez mais difícil de justificar. Ainda assim, em resumo, o MacBook Air 13 2017 ainda é um portátil muito decente. Lembre-se, é o modelo de nível de entrada para entrar no universo da Apple e, portanto, a alternativa mais barata se preferir o MacOS em vez de Windows. E, embora seja altamente improvável que o MacBook Air receba mais uma atualização em 2018, a já Apple conseguiu nos surpreender com bastante frequência ...
Apple MacBook Air 13.3" 1.8 GHz (2017)
- 06/20/2017 v6 (old)
J. Simon Leitner
Price comparison
