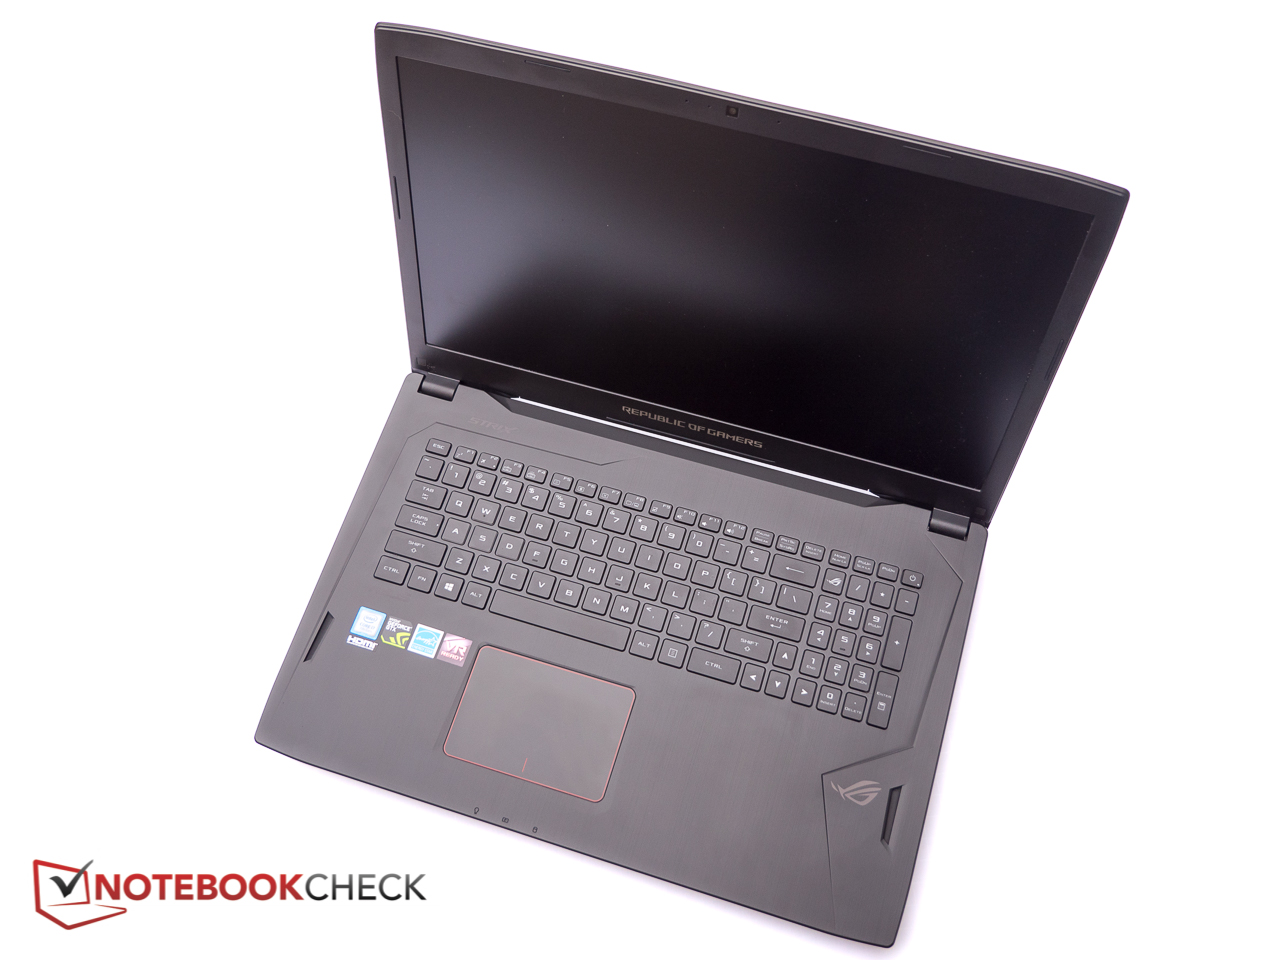
Breve Análise do Portátil Asus ROG Strix GL702VI (i7-7700HQ, GTX 1080)
| SD Card Reader | |
| average JPG Copy Test (av. of 3 runs) | |
| Aorus X7 v7 (Toshiba Exceria Pro SDXC 64 GB UHS-II) | |
| Schenker XMG U727 2017 (Toshiba Exceria Pro SDXC 64 GB UHS-II) | |
| Média da turma Gaming (20.9 - 210, n=54, últimos 2 anos) | |
| Acer Predator 17 X GX-792-76DL (Toshiba Exceria Pro SDXC 64 GB UHS-II) | |
| Asus ROG Strix GL702VI-WB74 | |
| Asus ROG Strix GL703VD-DB74 (Toshiba Exceria Pro SDXC 64 GB UHS-II) | |
| Razer Blade Pro 2017 (Toshiba Exceria Pro SDXC 64 GB UHS-II) | |
| maximum AS SSD Seq Read Test (1GB) | |
| Aorus X7 v7 (Toshiba Exceria Pro SDXC 64 GB UHS-II) | |
| Schenker XMG U727 2017 (Toshiba Exceria Pro SDXC 64 GB UHS-II) | |
| Média da turma Gaming (25.5 - 261, n=51, últimos 2 anos) | |
| Asus ROG Strix GL702VI-WB74 | |
| Acer Predator 17 X GX-792-76DL (Toshiba Exceria Pro SDXC 64 GB UHS-II) | |
| Asus ROG Strix GL703VD-DB74 (Toshiba Exceria Pro SDXC 64 GB UHS-II) | |
| Razer Blade Pro 2017 (Toshiba Exceria Pro SDXC 64 GB UHS-II) | |
| |||||||||||||||||||||||||
iluminação: 92 %
iluminação com acumulador: 312.9 cd/m²
Contraste: 1009:1 (Preto: 0.31 cd/m²)
ΔE ColorChecker Calman: 3.82 | ∀{0.5-29.43 Ø4.71}
ΔE Greyscale Calman: 3.3 | ∀{0.09-98 Ø4.96}
87.4% sRGB (Argyll 1.6.3 3D)
62.3% AdobeRGB 1998 (Argyll 1.6.3 3D)
62.6% AdobeRGB 1998 (Argyll 3D)
87.4% sRGB (Argyll 3D)
61.7% Display P3 (Argyll 3D)
Gamma: 2.18
CCT: 7037 K
| Asus ROG Strix GL702VI-WB74 AU Optronics B173HAN01.1, IPS, 17.3", 1920x1080 | Acer Predator 17 X GX-792-76DL LP173WF4-SPF5 (LGD056D), IPS, 17.3", 1920x1080 | Schenker XMG U727 2017 AU Optronics B173ZAN01.0 (AUO109B), AHVA, 17.3", 3840x2160 | Alienware 17 R4 TN LED, 17.3", 2560x1440 | Aorus X7 v7 AU Optronics B173QTN01.4 (AUO1496), TN LED, 17.3", 2560x1440 | Asus ROG Strix GL703VD-DB74 LG Philips LP173WF4-SPF5, IPS, 17.3", 1920x1080 | Razer Blade Pro 2017 Sharp LQ173D1JW33 (SHP145A), IGZO, 17.3", 3840x2160 | |
|---|---|---|---|---|---|---|---|
| Display | 0% | 38% | -3% | 1% | 3% | 39% | |
| Display P3 Coverage (%) | 61.7 | 66 7% | 86.6 40% | 61.2 -1% | 63 2% | 67.6 10% | 88.9 44% |
| sRGB Coverage (%) | 87.4 | 83.7 -4% | 99.9 14% | 82.9 -5% | 87.1 0% | 86.1 -1% | 100 14% |
| AdobeRGB 1998 Coverage (%) | 62.6 | 61.2 -2% | 99.5 59% | 60.5 -3% | 63.7 2% | 62.9 0% | 99.7 59% |
| Response Times | -21% | -20% | 30% | 52% | 15% | -65% | |
| Response Time Grey 50% / Grey 80% * (ms) | 32 ? | 45 ? -41% | 44 ? -38% | 30 ? 6% | 24 ? 25% | 30.8 ? 4% | 60.8 ? -90% |
| Response Time Black / White * (ms) | 27.6 ? | 28 ? -1% | 28 ? -1% | 12.8 ? 54% | 6 ? 78% | 20.4 ? 26% | 38.4 ? -39% |
| PWM Frequency (Hz) | 119000 ? | 204.9 ? | |||||
| Screen | -4% | 15% | -24% | -29% | -10% | -10% | |
| Brightness middle (cd/m²) | 312.9 | 380 21% | 362 16% | 402.3 29% | 375 20% | 421.2 35% | 230 -26% |
| Brightness (cd/m²) | 308 | 362 18% | 344 12% | 372 21% | 353 15% | 393 28% | 207 -33% |
| Brightness Distribution (%) | 92 | 91 -1% | 85 -8% | 86 -7% | 85 -8% | 85 -8% | 83 -10% |
| Black Level * (cd/m²) | 0.31 | 0.37 -19% | 0.35 -13% | 0.62 -100% | 0.58 -87% | 0.44 -42% | 0.2 35% |
| Contrast (:1) | 1009 | 1027 2% | 1034 2% | 649 -36% | 647 -36% | 957 -5% | 1150 14% |
| Colorchecker dE 2000 * | 3.82 | 4.12 -8% | 2.46 36% | 5.6 -47% | 6.06 -59% | 5 -31% | 5.62 -47% |
| Colorchecker dE 2000 max. * | 7.06 | 8.19 -16% | 4.26 40% | 9.8 -39% | 10.54 -49% | 8.8 -25% | 10.24 -45% |
| Greyscale dE 2000 * | 3.3 | 3.95 -20% | 2.9 12% | 4.7 -42% | 5.68 -72% | 5 -52% | 4.54 -38% |
| Gamma | 2.18 101% | 2.47 89% | 2.31 95% | 2.14 103% | 2.3 96% | 2.18 101% | 2.36 93% |
| CCT | 7037 92% | 6539 99% | 6120 106% | 7519 86% | 7998 81% | 6882 94% | 6625 98% |
| Color Space (Percent of AdobeRGB 1998) (%) | 62.3 | 55 -12% | 88 41% | 53.7 -14% | 57 -9% | 62.94 1% | 88 41% |
| Color Space (Percent of sRGB) (%) | 87.4 | 84 -4% | 100 14% | 82.2 -6% | 87 0% | 86.1 -1% | 100 14% |
| Média Total (Programa/Configurações) | -8% /
-5% | 11% /
15% | 1% /
-13% | 8% /
-12% | 3% /
-4% | -12% /
-7% |
* ... menor é melhor
Exibir tempos de resposta
| ↔ Tempo de resposta preto para branco | ||
|---|---|---|
| 27.6 ms ... ascensão ↗ e queda ↘ combinadas | ↗ 15.2 ms ascensão | 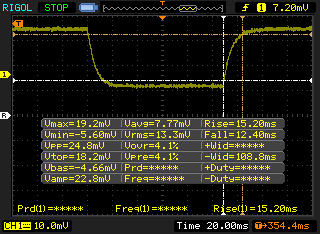 |
| ↘ 12.4 ms queda | ||
| A tela mostra taxas de resposta relativamente lentas em nossos testes e pode ser muito lenta para os jogadores. Em comparação, todos os dispositivos testados variam de 0.1 (mínimo) a 240 (máximo) ms. » 70 % de todos os dispositivos são melhores. Isso significa que o tempo de resposta medido é pior que a média de todos os dispositivos testados (19.8 ms). | ||
| ↔ Tempo de resposta 50% cinza a 80% cinza | ||
| 32 ms ... ascensão ↗ e queda ↘ combinadas | ↗ 15.6 ms ascensão | 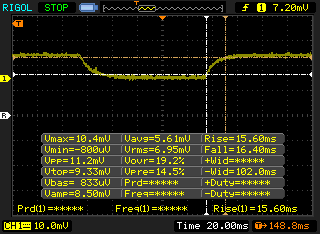 |
| ↘ 16.4 ms queda | ||
| A tela mostra taxas de resposta lentas em nossos testes e será insatisfatória para os jogadores. Em comparação, todos os dispositivos testados variam de 0.165 (mínimo) a 636 (máximo) ms. » 43 % de todos os dispositivos são melhores. Isso significa que o tempo de resposta medido é semelhante à média de todos os dispositivos testados (31 ms). | ||
Cintilação da tela / PWM (modulação por largura de pulso)
| Tela tremeluzindo / PWM não detectado |  | ||
[pwm_comparison] Em comparação: 52 % de todos os dispositivos testados não usam PWM para escurecer a tela. Se PWM foi detectado, uma média de 7754 (mínimo: 5 - máximo: 343500) Hz foi medida. | |||

| Cinebench R15 | |
| CPU Single 64Bit | |
| Média da turma Gaming (188.8 - 350, n=106, últimos 2 anos) | |
| Schenker XMG U727 2017 | |
| Acer Predator 17 X GX-792-76DL | |
| Alienware 17 R4 | |
| Aorus X7 v7 | |
| Razer Blade Pro 2017 | |
| Média Intel Core i7-7700HQ (120 - 162, n=110) | |
| Lenovo Legion Y520-15IKBM 80YY001APB | |
| Asus ROG Strix GL702VI-WB74 | |
| CPU Multi 64Bit | |
| Média da turma Gaming (1578 - 6330, n=105, últimos 2 anos) | |
| Schenker XMG U727 2017 | |
| Acer Predator 17 X GX-792-76DL | |
| Alienware 17 R4 | |
| Aorus X7 v7 | |
| Razer Blade Pro 2017 | |
| Média Intel Core i7-7700HQ (603 - 747, n=111) | |
| Asus ROG Strix GL702VI-WB74 | |
| Lenovo Legion Y520-15IKBM 80YY001APB | |
| wPrime 2.10 - 1024m | |
| Asus ROG Strix GL702VI-WB74 | |
| Lenovo Legion Y520-15IKBM 80YY001APB | |
| Média Intel Core i7-7700HQ (210 - 379, n=48) | |
| Alienware 17 R4 | |
| Média da turma Gaming (33 - 210, n=6, últimos 2 anos) | |
* ... menor é melhor
| PCMark 8 Home Score Accelerated v2 | 4970 pontos | |
| PCMark 8 Creative Score Accelerated v2 | 7853 pontos | |
| PCMark 8 Work Score Accelerated v2 | 5199 pontos | |
| PCMark 10 Score | 4632 pontos | |
Ajuda | ||
| Asus ROG Strix GL702VI-WB74 Samsung PM961 MZVLW256HEHP | Acer Predator 17 X GX-792-76DL Toshiba NVMe THNSN5512GPU7 | Schenker XMG U727 2017 Samsung SM961 MZVPW256 m.2 PCI-e | MSI GT75VR 7RF-012 Titan Pro 2x Samsung SM961 MZVPW256HEGL NVMe (RAID 0) | Alienware 17 R4 SK Hynix PC300 NVMe 512 GB | Aorus X7 v7 Samsung SM961 MZVPW256HEGL | Média Samsung PM961 MZVLW256HEHP | |
|---|---|---|---|---|---|---|---|
| AS SSD | 11% | 53% | 47% | -27% | 31% | -123% | |
| Score Total (Points) | 2536 | 2581 2% | 3938 55% | 3392 34% | 2072 -18% | 3668 45% | 2565 ? 1% |
| Score Write (Points) | 584 | 930 59% | 1187 103% | 1289 121% | 858 47% | 1021 75% | 587 ? 1% |
| Score Read (Points) | 1321 | 1118 -15% | 1858 41% | 1412 7% | 831 -37% | 1803 36% | 1378 ? 4% |
| Access Time Write * (ms) | 0.033 | 0.028 15% | 0.021 36% | 0.029 12% | 0.123 -273% | 0.031 6% | 0.4637 ? -1305% |
| Access Time Read * (ms) | 0.058 | 0.061 -5% | 0.033 43% | 0.041 29% | 0.042 28% | 0.059 -2% | 0.06777 ? -17% |
| 4K-64 Write (MB/s) | 352.7 | 623 77% | 866 146% | 925 162% | 671 90% | 791 124% | 419 ? 19% |
| 4K-64 Read (MB/s) | 1046 | 853 -18% | 1527 46% | 1048 0% | 620 -41% | 1485 42% | 1112 ? 6% |
| 4K Write (MB/s) | 114.1 | 133.8 17% | 175.9 54% | 128.8 13% | 113.4 -1% | 123.3 8% | 91.6 ? -20% |
| 4K Read (MB/s) | 49.71 | 39.52 -20% | 56.8 14% | 50.1 1% | 35.61 -28% | 48.35 -3% | 45.1 ? -9% |
| Seq Write (MB/s) | 1171 | 1338 14% | 1445 23% | 2352 101% | 735 -37% | 1067 -9% | 960 ? -18% |
| Seq Read (MB/s) | 2260 | 2261 0% | 2746 22% | 3137 39% | 1752 -22% | 2690 19% | 2019 ? -11% |
* ... menor é melhor

| 3DMark 11 Performance | 16156 pontos | |
| 3DMark Cloud Gate Standard Score | 26020 pontos | |
| 3DMark Fire Strike Score | 14301 pontos | |
Ajuda | ||
| Rise of the Tomb Raider - 1920x1080 Very High Preset AA:FX AF:16x (classificar por valor) | |
| Asus ROG Strix GL702VI-WB74 | |
| Acer Predator 17 X GX-792-76DL | |
| Alienware 17 R4 | |
| Asus Strix GL702VSK | |
| Média NVIDIA GeForce GTX 1080 Mobile (100.5 - 126.1, n=10) | |
| BioShock Infinite - 1920x1080 Ultra Preset, DX11 (DDOF) (classificar por valor) | |
| Asus ROG Strix GL702VI-WB74 | |
| Acer Predator 17 X GX-792-76DL | |
| Acer Predator 17 X GX-792-76DL | |
| Alienware 17 R4 | |
| Aorus X7 v7 | |
| Asus Strix GL702VSK | |
| Média NVIDIA GeForce GTX 1080 Mobile (151 - 181.2, n=12) | |
| The Witcher 3 - 1920x1080 Ultra Graphics & Postprocessing (HBAO+) (classificar por valor) | |
| Asus ROG Strix GL702VI-WB74 | |
| Acer Predator 17 X GX-792-76DL | |
| Schenker XMG U727 2017 | |
| Alienware 17 R4 | |
| Aorus X7 v7 | |
| Asus Strix GL702VSK | |
| Média NVIDIA GeForce GTX 1080 Mobile (61.7 - 78.1, n=23) | |
| Média da turma Gaming (104.7 - 240, n=7, últimos 2 anos) | |
| Middle-earth: Shadow of War - 1920x1080 Ultra Preset AA:T (classificar por valor) | |
| Asus ROG Strix GL702VI-WB74 | |
| Média NVIDIA GeForce GTX 1080 Mobile (85 - 99, n=4) | |
| Batman: Arkham Knight - 1920x1080 High / On AA:SM AF:16x (classificar por valor) | |
| Asus ROG Strix GL702VI-WB74 | |
| Alienware 17 R4 | |
| Média NVIDIA GeForce GTX 1080 Mobile (76 - 141, n=7) | |
| baixo | média | alto | ultra | |
|---|---|---|---|---|
| Hitman: Absolution (2012) | 94.3 | 86.1 | 77.3 | 72.6 |
| BioShock Infinite (2013) | 221 | 192.8 | 181.4 | 159.6 |
| Company of Heroes 2 (2013) | 59.9 | 57.9 | 55.9 | 54.4 |
| Middle-earth: Shadow of Mordor (2014) | 166.5 | 151.8 | 145.4 | 134.8 |
| The Witcher 3 (2015) | 190 | 164.6 | 123.6 | 72 |
| Batman: Arkham Knight (2015) | 121 | 118 | 105 | 76 |
| Rise of the Tomb Raider (2016) | 148.8 | 139 | 115.3 | 100.5 |
| Ashes of the Singularity (2016) | 52.6 | 50.9 | ||
| Deus Ex Mankind Divided (2016) | 95.6 | 89.8 | 64.2 | 52.1 |
| Ark Survival Evolved (2017) | 118.6 | 88.4 | 63 | 45.1 |
| Middle-earth: Shadow of War (2017) | 123 | 114 | 99 | 85 |
| The Evil Within 2 (2017) | 72.1 | 66 | 64.9 | 61.7 |
| ELEX (2017) | 119.2 | 117.6 | 99 | 90.6 |
Barulho
| Ocioso |
| 30.6 / 30.6 / 30.6 dB |
| Carga |
| 38.5 / 57 dB |
 | ||
30 dB silencioso 40 dB(A) audível 50 dB(A) ruidosamente alto |
||
min: | ||
| Asus ROG Strix GL702VI-WB74 GeForce GTX 1080 Mobile, i7-7700HQ, Samsung PM961 MZVLW256HEHP | Asus G701VIK-BA049T GeForce GTX 1080 Mobile, i7-7820HK, 2x Samsung SM961 MZVPW256HEGL NVMe (RAID 0) | Acer Predator 17 X GX-792-76DL GeForce GTX 1080 Mobile, i7-7820HK, Toshiba NVMe THNSN5512GPU7 | Schenker XMG U727 2017 GeForce GTX 1080 Mobile, i7-7700K, Samsung SM961 MZVPW256 m.2 PCI-e | Alienware 17 R4 GeForce GTX 1080 Mobile, i7-7820HK, SK Hynix PC300 NVMe 512 GB | Aorus X7 v7 GeForce GTX 1070 Mobile, i7-7820HK, Samsung SM961 MZVPW256HEGL | Asus ROG Strix GL703VD-DB74 GeForce GTX 1050 Mobile, i7-7700HQ, SanDisk SD8SN8U256G1002 | MSI GT75VR 7RF-012 Titan Pro GeForce GTX 1080 Mobile, i7-7820HK, 2x Samsung SM961 MZVPW256HEGL NVMe (RAID 0) | Asus Strix GL702VSK GeForce GTX 1070 Mobile, i7-7700HQ, HGST Travelstar 7K1000 HTS721010A9E630 | |
|---|---|---|---|---|---|---|---|---|---|
| Noise | -7% | -7% | -6% | -9% | -7% | 4% | -11% | 2% | |
| desligado / ambiente * (dB) | 28.2 | 30 -6% | 30 -6% | 30 -6% | 28.2 -0% | 30 -6% | 27.9 1% | 30 -6% | 28.6 -1% |
| Idle Minimum * (dB) | 30.6 | 30 2% | 33 -8% | 31 -1% | 35.6 -16% | 33 -8% | 30.4 1% | 33 -8% | 30.6 -0% |
| Idle Average * (dB) | 30.6 | 31 -1% | 35 -14% | 34 -11% | 35.6 -16% | 36 -18% | 30.4 1% | 34 -11% | 30.6 -0% |
| Idle Maximum * (dB) | 30.6 | 36 -18% | 37 -21% | 37 -21% | 35.7 -17% | 41 -34% | 30.4 1% | 38 -24% | 30.6 -0% |
| Load Average * (dB) | 38.5 | 47 -22% | 40 -4% | 44 -14% | 50.2 -30% | 41 -6% | 36.4 5% | 44 -14% | 39.8 -3% |
| Witcher 3 ultra * (dB) | 52 | 51 2% | 50.2 3% | 45 13% | 46 12% | 56 -8% | |||
| Load Maximum * (dB) | 57 | 56 2% | 50 12% | 52 9% | 50.2 12% | 52 9% | 53 7% | 62 -9% | 48 16% |
* ... menor é melhor
(+) A temperatura máxima no lado superior é 38.2 °C / 101 F, em comparação com a média de 40.4 °C / 105 F , variando de 21.2 a 68.8 °C para a classe Gaming.
(±) A parte inferior aquece até um máximo de 42 °C / 108 F, em comparação com a média de 43.2 °C / 110 F
(+) Em uso inativo, a temperatura média para o lado superior é 28.9 °C / 84 F, em comparação com a média do dispositivo de 33.9 °C / ### class_avg_f### F.
(+) Jogando The Witcher 3, a temperatura média para o lado superior é 29.5 °C / 85 F, em comparação com a média do dispositivo de 33.9 °C / ## #class_avg_f### F.
(+) Os apoios para as mãos e o touchpad são mais frios que a temperatura da pele, com um máximo de 26 °C / 78.8 F e, portanto, são frios ao toque.
(+) A temperatura média da área do apoio para as mãos de dispositivos semelhantes foi 28.8 °C / 83.8 F (+2.8 °C / 5 F).
Asus ROG Strix GL702VI-WB74 análise de áudio
(±) | o volume do alto-falante é médio, mas bom (###valor### dB)
Graves 100 - 315Hz
(±) | graves reduzidos - em média 7.5% menor que a mediana
(±) | a linearidade dos graves é média (7.5% delta para a frequência anterior)
Médios 400 - 2.000 Hz
(+) | médios equilibrados - apenas 3.9% longe da mediana
(+) | médios são lineares (4.8% delta para frequência anterior)
Altos 2 - 16 kHz
(+) | agudos equilibrados - apenas 3.7% longe da mediana
(±) | a linearidade dos máximos é média (10.4% delta para frequência anterior)
Geral 100 - 16.000 Hz
(+) | o som geral é linear (14.4% diferença em relação à mediana)
Comparado com a mesma classe
» 27% de todos os dispositivos testados nesta classe foram melhores, 7% semelhantes, 66% piores
» O melhor teve um delta de 6%, a média foi 18%, o pior foi 132%
Comparado com todos os dispositivos testados
» 18% de todos os dispositivos testados foram melhores, 4% semelhantes, 78% piores
» O melhor teve um delta de 4%, a média foi 23%, o pior foi 134%
Apple MacBook 12 (Early 2016) 1.1 GHz análise de áudio
(+) | os alto-falantes podem tocar relativamente alto (###valor### dB)
Graves 100 - 315Hz
(±) | graves reduzidos - em média 11.3% menor que a mediana
(±) | a linearidade dos graves é média (14.2% delta para a frequência anterior)
Médios 400 - 2.000 Hz
(+) | médios equilibrados - apenas 2.4% longe da mediana
(+) | médios são lineares (5.5% delta para frequência anterior)
Altos 2 - 16 kHz
(+) | agudos equilibrados - apenas 2% longe da mediana
(+) | os máximos são lineares (4.5% delta da frequência anterior)
Geral 100 - 16.000 Hz
(+) | o som geral é linear (10.2% diferença em relação à mediana)
Comparado com a mesma classe
» 7% de todos os dispositivos testados nesta classe foram melhores, 2% semelhantes, 90% piores
» O melhor teve um delta de 5%, a média foi 18%, o pior foi 53%
Comparado com todos os dispositivos testados
» 5% de todos os dispositivos testados foram melhores, 1% semelhantes, 94% piores
» O melhor teve um delta de 4%, a média foi 23%, o pior foi 134%
| desligado | |
| Ocioso | |
| Carga |
|
Key:
min: | |
| Asus ROG Strix GL702VI-WB74 i7-7700HQ, GeForce GTX 1080 Mobile, Samsung PM961 MZVLW256HEHP, IPS, 1920x1080, 17.3" | Acer Predator 17 X GX-792-76DL i7-7820HK, GeForce GTX 1080 Mobile, Toshiba NVMe THNSN5512GPU7, IPS, 1920x1080, 17.3" | Schenker XMG U727 2017 i7-7700K, GeForce GTX 1080 Mobile, Samsung SM961 MZVPW256 m.2 PCI-e, AHVA, 3840x2160, 17.3" | Alienware 17 R4 i7-7820HK, GeForce GTX 1080 Mobile, SK Hynix PC300 NVMe 512 GB, TN LED, 2560x1440, 17.3" | Aorus X7 v7 i7-7820HK, GeForce GTX 1070 Mobile, Samsung SM961 MZVPW256HEGL, TN LED, 2560x1440, 17.3" | MSI GT75VR 7RF-012 Titan Pro i7-7820HK, GeForce GTX 1080 Mobile, 2x Samsung SM961 MZVPW256HEGL NVMe (RAID 0), TN LED, 1920x1080, 17.3" | Asus G701VIK-BA049T i7-7820HK, GeForce GTX 1080 Mobile, 2x Samsung SM961 MZVPW256HEGL NVMe (RAID 0), IPS, 1920x1080, 17.3" | |
|---|---|---|---|---|---|---|---|
| Power Consumption | -37% | -73% | -47% | -33% | -62% | -39% | |
| Idle Minimum * (Watt) | 19.8 | 27 -36% | 32 -62% | 37.5 -89% | 27 -36% | 34 -72% | 24 -21% |
| Idle Average * (Watt) | 25.2 | 32 -27% | 43 -71% | 37.6 -49% | 33 -31% | 41 -63% | 31 -23% |
| Idle Maximum * (Watt) | 25.9 | 41 -58% | 51 -97% | 37.6 -45% | 40 -54% | 50 -93% | 38 -47% |
| Load Average * (Watt) | 84.1 | 102 -21% | 138 -64% | 122.4 -46% | 107 -27% | 106 -26% | 98 -17% |
| Witcher 3 ultra * (Watt) | 198.6 | 279 -40% | 180.3 9% | 190 4% | 257 -29% | ||
| Load Maximum * (Watt) | 171.1 | 248 -45% | 350 -105% | 277.4 -62% | 259 -51% | 320 -87% | 320 -87% |
* ... menor é melhor
| Asus ROG Strix GL702VI-WB74 i7-7700HQ, GeForce GTX 1080 Mobile, 88 Wh | Acer Predator 17 X GX-792-76DL i7-7820HK, GeForce GTX 1080 Mobile, 88.8 Wh | Schenker XMG U727 2017 i7-7700K, GeForce GTX 1080 Mobile, 89 Wh | Alienware 17 R4 i7-7820HK, GeForce GTX 1080 Mobile, 99 Wh | Aorus X7 v7 i7-7820HK, GeForce GTX 1070 Mobile, 94 Wh | MSI GT75VR 7RF-012 Titan Pro i7-7820HK, GeForce GTX 1080 Mobile, 75 Wh | Asus Strix GL702VSK i7-7700HQ, GeForce GTX 1070 Mobile, 76 Wh | Asus G701VIK-BA049T i7-7820HK, GeForce GTX 1080 Mobile, 93 Wh | |
|---|---|---|---|---|---|---|---|---|
| Duração da bateria | 0% | -18% | -21% | -21% | -37% | -10% | -1% | |
| Reader / Idle (h) | 6.4 | 5.2 -19% | 3.7 -42% | 4.6 -28% | 3.7 -42% | 3 -53% | 5.1 -20% | 5.7 -11% |
| WiFi v1.3 (h) | 3.5 | 4.2 20% | 2.8 -20% | 3 -14% | 3 -14% | 2.4 -31% | 3.4 -3% | 4 14% |
| Load (h) | 1.5 | 1.5 0% | 1.6 7% | 1.2 -20% | 1.4 -7% | 1.1 -27% | 1.4 -7% | 1.4 -7% |
Pro
Contra
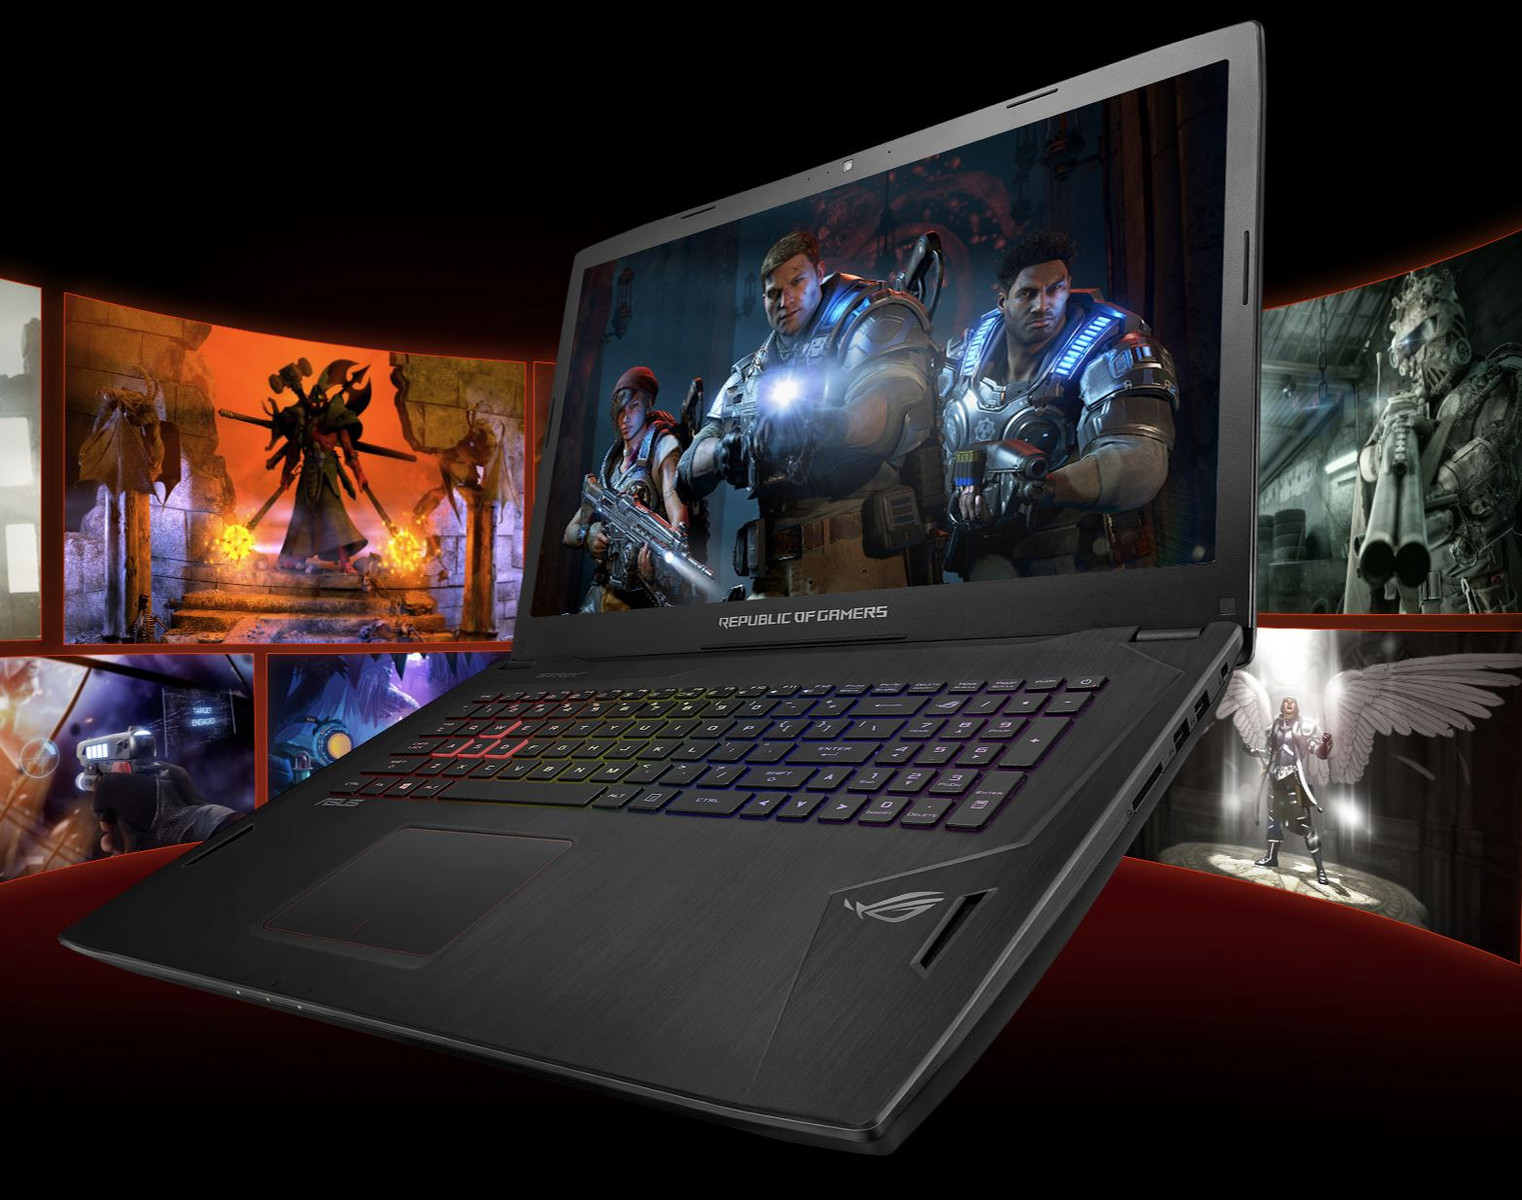

No geral, o Asus ROG Strix GL702VI é um portátil de jogos suficientemente bom, com muitas falhas óbvias. Embora certamente não possamos ignorar que o fato de que o sistema não alcança todo o seu potencial - a Asus parece errar do lado de cautela neste caso quando se trata do gerenciamento da temperatura - preferimos desistir de alguns pontos percentuais no desempenho, tendo que lidar com um sistema de ligação à distância de superaquecimento em todos os momentos. Dito isto, a Asus certamente pode ajustar o gerenciamento do ventilador com uma atualização de firmware e abordar o problema com a ciclagem da velocidade do ventilador ao mesmo tempo, pois esse comportamento pode ser realmente bastante irritante depois de um tempo. O bleeding da tela também é um problema, mas pode ser isolado na nossa unidade de teste.
Embora o Asus ROG Strix GL702VI está equipado com componentes de gama alta, fica um pouco mais curto quando se trata de desempenho bruto.
O teclado é bom o suficiente para sessões de digitação mais longas, os pousa palmas permanecem frios o tempo todo, e a seleção das portas é adequada. A jogabilidade é fluente graças à combinação de uma Nvidia GeForce GTX 1080 de gama alta com uma tela IPS de 120 Hz G-Sync Full HD e deve satisfazer a maioria por algum tempo. Os usuários que procuram levar seu hardware ao extremo precisam procurar em outros lugares, mas, de outra forma, o Strix GL702VI é uma escolha decente e bastante barata.
Asus ROG Strix GL702VI-WB74
- 02/14/2018 v6 (old)
Bernhard Pechlaner
Price comparison
