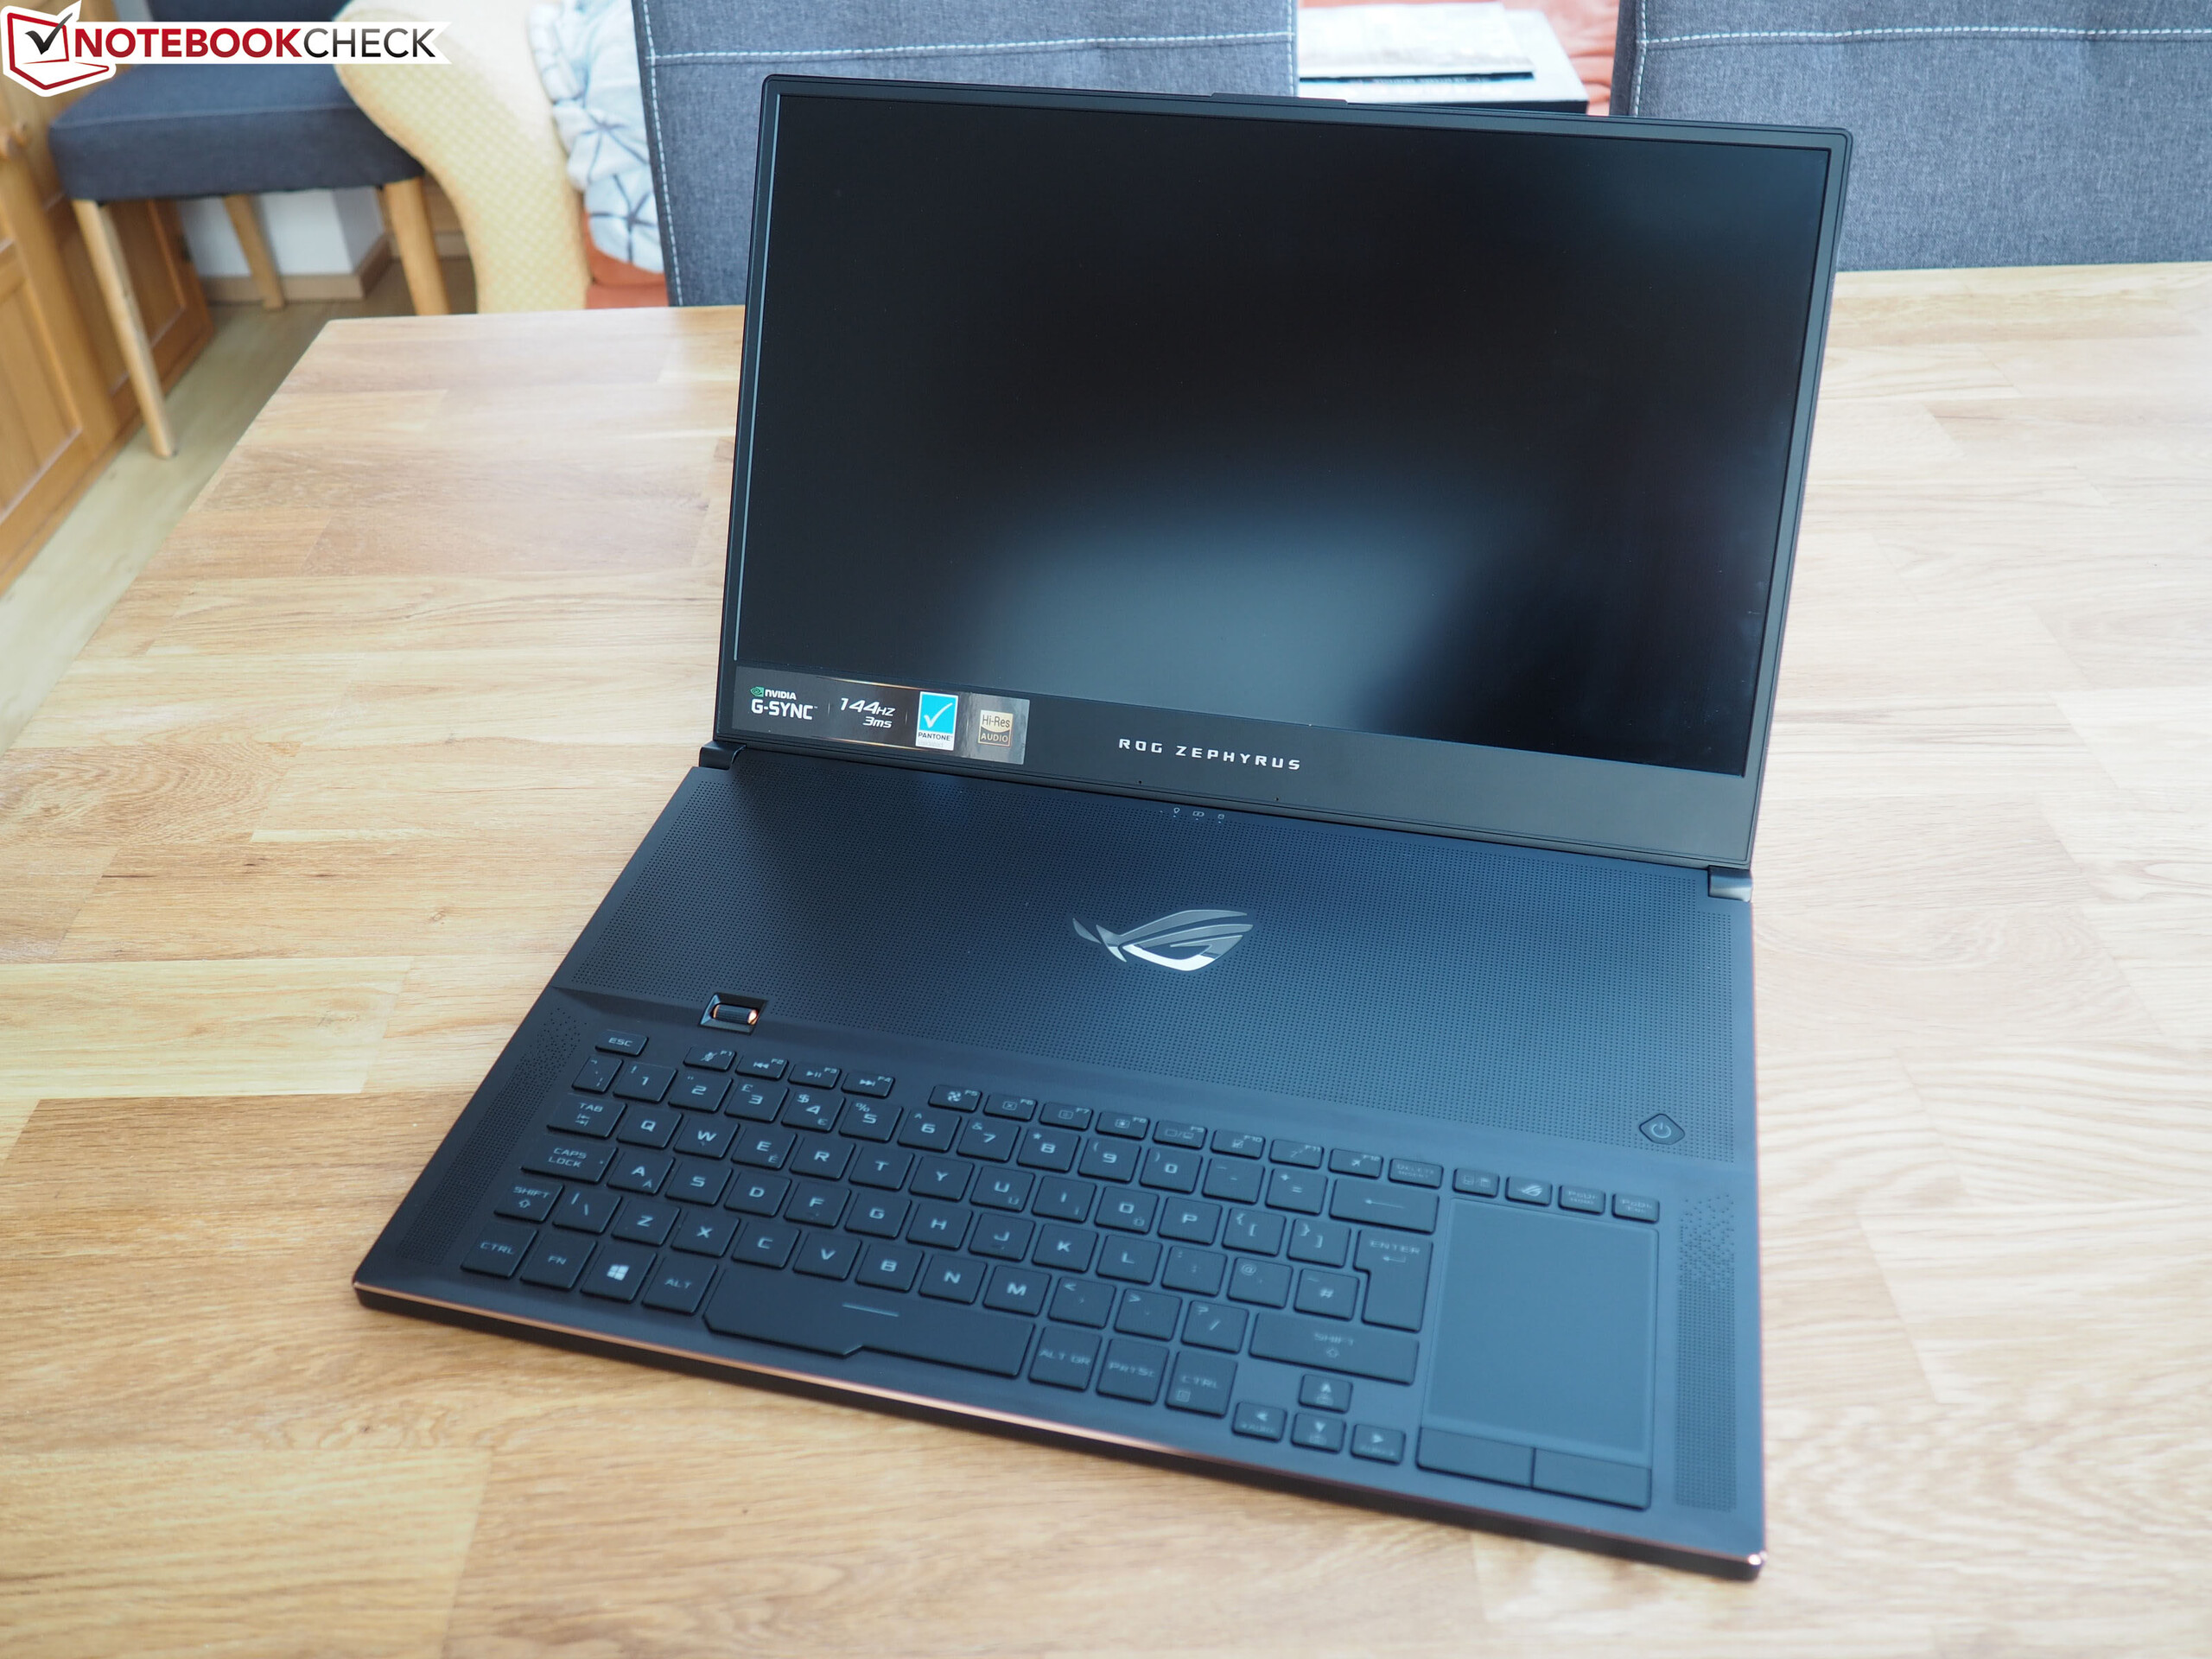
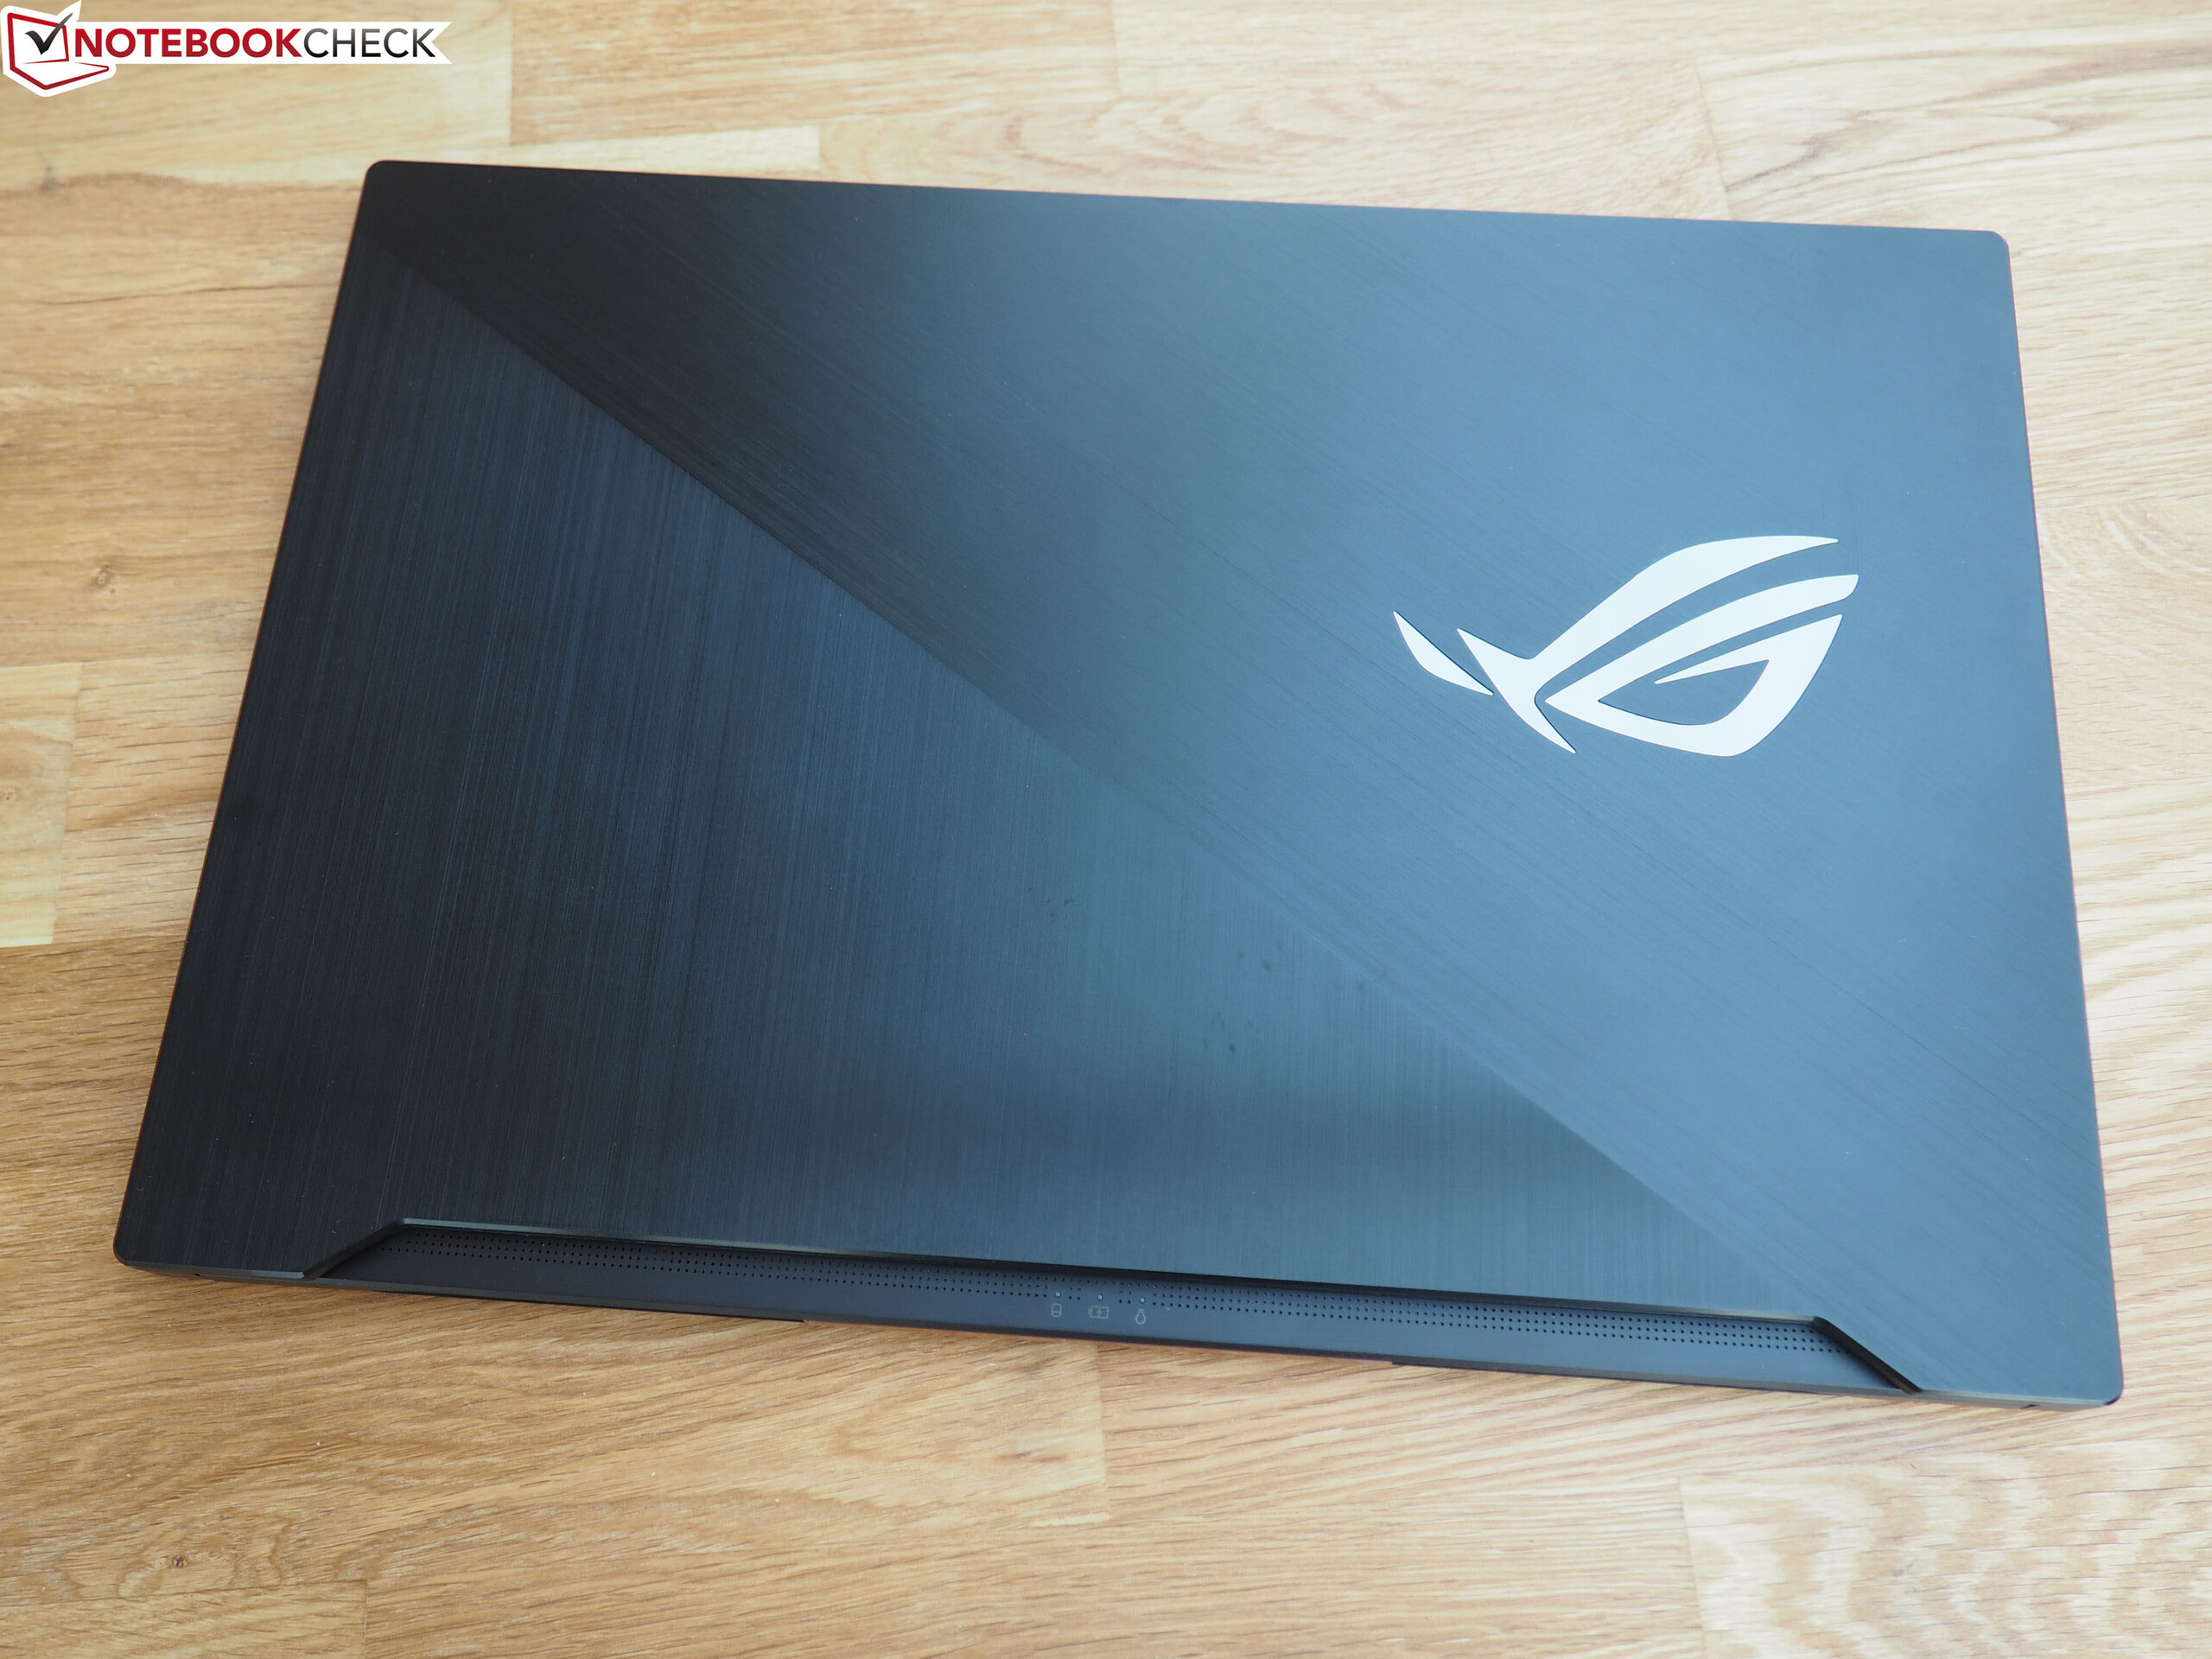
Breve Análise do Portátil Asus ROG Zephyrus S GX701GX (i7-8750H, RTX 2080 Max-Q)
| |||||||||||||||||||||||||
iluminação: 91 %
iluminação com acumulador: 288 cd/m²
Contraste: 1440:1 (Preto: 0.2 cd/m²)
ΔE ColorChecker Calman: 2.33 | ∀{0.5-29.43 Ø4.71}
calibrated: 2.47
ΔE Greyscale Calman: 1.19 | ∀{0.09-98 Ø4.96}
88% sRGB (Argyll 1.6.3 3D)
57% AdobeRGB 1998 (Argyll 1.6.3 3D)
63.9% AdobeRGB 1998 (Argyll 3D)
87.8% sRGB (Argyll 3D)
62.9% Display P3 (Argyll 3D)
Gamma: 2.41
CCT: 6710 K
| Asus Zephyrus S GX701GX B173HAN04.0 (AUO409D), IPS, 1920x1080, 17.3" | Acer Predator Triton 500 AU Optronics B156HAN08.2 (AUO82ED), IPS, 1920x1080, 15.6" | Razer Blade 15 RTX 2070 Max-Q LG Philips LGD05C0, IPS, 1920x1080, 15.6" | Gigabyte Aero 15-X9 LGD05C0, IPS, 1920x1080, 15.6" | MSI GE75 8SG Raider CMN N173HCE-G33 (CMN175C), AHVA, 1920x1080, 17.3" | Asus ROG Strix Scar II GL704GW B173HAN04.0 (AUO409D), AHVA, 1920x1080, 17.3" | |
|---|---|---|---|---|---|---|
| Display | 3% | 5% | 3% | -1% | -0% | |
| Display P3 Coverage (%) | 62.9 | 64.2 2% | 65.3 4% | 63.5 1% | 60.6 -4% | 62.9 0% |
| sRGB Coverage (%) | 87.8 | 92.6 5% | 94.9 8% | 93.1 6% | 91.2 4% | 87.1 -1% |
| AdobeRGB 1998 Coverage (%) | 63.9 | 65.7 3% | 66.3 4% | 64.5 1% | 62.6 -2% | 63.7 0% |
| Response Times | -14% | -77% | -85% | -4% | -81% | |
| Response Time Grey 50% / Grey 80% * (ms) | 7.2 ? | 8 ? -11% | 16.8 ? -133% | 16.4 ? -128% | 8 ? -11% | 17.6 ? -144% |
| Response Time Black / White * (ms) | 9.6 ? | 11.2 ? -17% | 11.6 ? -21% | 13.6 ? -42% | 9.2 ? 4% | 11.2 ? -17% |
| PWM Frequency (Hz) | 26040 ? | |||||
| Screen | -50% | -24% | -3% | -12% | -16% | |
| Brightness middle (cd/m²) | 288 | 304 6% | 314.7 9% | 250 -13% | 363 26% | 295 2% |
| Brightness (cd/m²) | 287 | 299 4% | 312 9% | 235 -18% | 342 19% | 291 1% |
| Brightness Distribution (%) | 91 | 89 -2% | 90 -1% | 85 -7% | 86 -5% | 96 5% |
| Black Level * (cd/m²) | 0.2 | 0.27 -35% | 0.38 -90% | 0.29 -45% | 0.27 -35% | 0.24 -20% |
| Contrast (:1) | 1440 | 1126 -22% | 828 -43% | 862 -40% | 1344 -7% | 1229 -15% |
| Colorchecker dE 2000 * | 2.33 | 4.66 -100% | 2.56 -10% | 1.46 37% | 2.29 2% | 3.2 -37% |
| Colorchecker dE 2000 max. * | 5.34 | 9.65 -81% | 4.89 8% | 2.47 54% | 4.54 15% | 6.64 -24% |
| Colorchecker dE 2000 calibrated * | 2.47 | 1.72 30% | 1.71 31% | 2.45 1% | 2.52 -2% | |
| Greyscale dE 2000 * | 1.19 | 5.53 -365% | 3.4 -186% | 1.27 -7% | 3.02 -154% | 2.16 -82% |
| Gamma | 2.41 91% | 2.5 88% | 2.3 96% | 2.4 92% | 2.38 92% | 2.46 89% |
| CCT | 6710 97% | 8028 81% | 6435 101% | 6749 96% | 7048 92% | 6872 95% |
| Color Space (Percent of AdobeRGB 1998) (%) | 57 | 60 5% | 60.7 6% | 60 5% | 58 2% | 57 0% |
| Color Space (Percent of sRGB) (%) | 88 | 93 6% | 94.6 8% | 93 6% | 91 3% | 87 -1% |
| Média Total (Programa/Configurações) | -20% /
-36% | -32% /
-25% | -28% /
-13% | -6% /
-9% | -32% /
-21% |
* ... menor é melhor
Exibir tempos de resposta
| ↔ Tempo de resposta preto para branco | ||
|---|---|---|
| 9.6 ms ... ascensão ↗ e queda ↘ combinadas | ↗ 4.4 ms ascensão |  |
| ↘ 5.2 ms queda | ||
| A tela mostra taxas de resposta rápidas em nossos testes e deve ser adequada para jogos. Em comparação, todos os dispositivos testados variam de 0.1 (mínimo) a 240 (máximo) ms. » 26 % de todos os dispositivos são melhores. Isso significa que o tempo de resposta medido é melhor que a média de todos os dispositivos testados (19.8 ms). | ||
| ↔ Tempo de resposta 50% cinza a 80% cinza | ||
| 7.2 ms ... ascensão ↗ e queda ↘ combinadas | ↗ 3.6 ms ascensão | 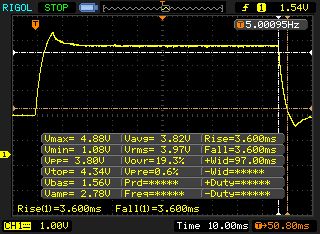 |
| ↘ 3.6 ms queda | ||
| A tela mostra taxas de resposta muito rápidas em nossos testes e deve ser muito adequada para jogos em ritmo acelerado. Em comparação, todos os dispositivos testados variam de 0.165 (mínimo) a 636 (máximo) ms. » 20 % de todos os dispositivos são melhores. Isso significa que o tempo de resposta medido é melhor que a média de todos os dispositivos testados (31 ms). | ||
Cintilação da tela / PWM (modulação por largura de pulso)
| Tela tremeluzindo / PWM não detectado |  | ||
[pwm_comparison] Em comparação: 52 % de todos os dispositivos testados não usam PWM para escurecer a tela. Se PWM foi detectado, uma média de 7754 (mínimo: 5 - máximo: 343500) Hz foi medida. | |||
| Cinebench R11.5 | |
| CPU Single 64Bit | |
| Média da turma Gaming (3.3 - 4.16, n=9, últimos 2 anos) | |
| Acer Predator Triton 500 | |
| Asus Zephyrus S GX701GX | |
| CPU Multi 64Bit | |
| Média da turma Gaming (29.8 - 76.7, n=9, últimos 2 anos) | |
| Asus Zephyrus S GX701GX | |
| Acer Predator Triton 500 | |
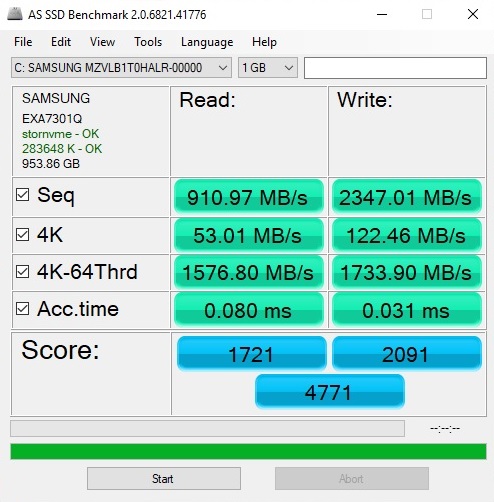
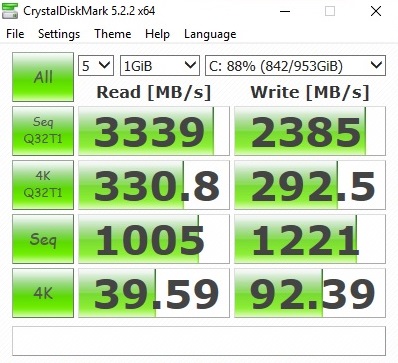
| Asus Zephyrus S GX701GX Samsung SSD PM981 MZVLB1T0HALR | Acer Predator Triton 500 2x WDC PC SN720 SDAPNTW-256G-1014 (RAID 0) | Razer Blade 15 RTX 2070 Max-Q Samsung SSD PM981 MZVLB512HAJQ | Gigabyte Aero 15-X9 Intel SSD 760p SSDPEKKW010T8 | MSI GE75 8SG Raider Kingston RBUSNS8154P3512GJ | Asus ROG Strix Scar II GL704GW Intel SSD 660p SSDPEKNW512G8 | |
|---|---|---|---|---|---|---|
| CrystalDiskMark 5.2 / 6 | 30% | 8% | 12% | -24% | -6% | |
| Write 4K (MB/s) | 92.4 | 93.6 1% | 93.9 2% | 97.1 5% | 73.4 -21% 73.4 -21% | 99.6 8% |
| Read 4K (MB/s) | 39.59 | 38.82 -2% | 40.56 2% | 53.7 36% | 31.97 -19% 31.93 -19% | 48.99 24% |
| Write Seq (MB/s) | 1221 | 2455 101% | 1468 20% | 1526 25% | 882 -28% | 972 -20% |
| Read Seq (MB/s) | 1005 | 2107 110% | 1540 53% | 2020 101% | 922 -8% | 1515 51% |
| Write 4K Q32T1 (MB/s) | 292.5 | 298.7 2% | 293.5 0% | 285.6 -2% | 310.1 6% 297.1 2% | 280.6 -4% |
| Read 4K Q32T1 (MB/s) | 330.8 | 338.7 2% | 346 5% | 321.8 -3% | 327.5 -1% 325.5 -2% | 327.8 -1% |
| Write Seq Q32T1 (MB/s) | 2385 | 2902 22% | 1941 -19% | 1533 -36% | 1007 -58% 929 -61% | 970 -59% |
| Read Seq Q32T1 (MB/s) | 3339 | 3536 6% | 3266 -2% | 2351 -30% | 1611 -52% 1607 -52% | 1757 -47% |
| Write 4K Q8T8 (MB/s) | 625 | |||||
| Read 4K Q8T8 (MB/s) | 818 |

| 3DMark 11 Performance | 21874 pontos | |
| 3DMark Ice Storm Standard Score | 161739 pontos | |
| 3DMark Cloud Gate Standard Score | 37830 pontos | |
| 3DMark Fire Strike Score | 18147 pontos | |
| 3DMark Time Spy Score | 8098 pontos | |
Ajuda | ||
| The Witcher 3 | |
| 1920x1080 Ultra Graphics & Postprocessing (HBAO+) | |
| Média da turma Gaming (104.7 - 240, n=7, últimos 2 anos) | |
| MSI GE75 8SG Raider | |
| Asus Zephyrus S GX701GX | |
| Acer Predator Triton 500 | |
| Asus ROG Strix Scar II GL704GW | |
| Razer Blade 15 RTX 2070 Max-Q | |
| Gigabyte Aero 15-X9 | |
| 1920x1080 High Graphics & Postprocessing (Nvidia HairWorks Off) | |
| Média da turma Gaming (341 - 404, n=2, últimos 2 anos) | |
| MSI GE75 8SG Raider | |
| Asus Zephyrus S GX701GX | |
| Acer Predator Triton 500 | |
| Asus ROG Strix Scar II GL704GW | |
| Razer Blade 15 RTX 2070 Max-Q | |
| Gigabyte Aero 15-X9 | |
| baixo | média | alto | ultra | QHD | 4K | |
|---|---|---|---|---|---|---|
| The Witcher 3 (2015) | 151 | 81.7 | 57.6 | |||
| Rainbow Six Siege (2015) | 230 | 217 | 98.2 | |||
| The Division (2016) | 127 | 100 | 51.7 | |||
| Doom (2016) | 134 | 129 | 79.3 | |||
| Overwatch (2016) | 292 | 196 | 111 | |||
| Mirror's Edge Catalyst (2016) | 135 | 123 | 50.2 | |||
| Deus Ex Mankind Divided (2016) | 107 | 63.5 | 40.6 | |||
| Battlefield 1 (2016) | 146 | 134 | 65 | |||
| Dishonored 2 (2016) | 109 | 94 | 61.1 | |||
| Resident Evil 7 (2017) | 360 | 220 | 182 | 65.1 | ||
| For Honor (2017) | 171 | 164 | 131 | 57.2 | ||
| Ghost Recon Wildlands (2017) | 105 | 98.2 | 58 | 42 | ||
| Prey (2017) | 142 | 141 | 139 | 69.5 | ||
| Rocket League (2017) | 248 | 218 | 112 | |||
| Dirt 4 (2017) | 225 | 150 | 102 | |||
| Playerunknown's Battlegrounds (PUBG) (2017) | 207 | 175 | 139 | 51.5 | ||
| Middle-earth: Shadow of War (2017) | 157 | 125 | 99 | 44 | ||
| ELEX (2017) | 117 | 115 | 99 | 68.1 | 35.7 | |
| Assassin´s Creed Origins (2017) | 82 | 80 | 69 | 61 | 39 | |
| Need for Speed Payback (2017) | 127 | 120 | 115 | 95.6 | 54.3 | |
| Star Wars Battlefront 2 (2017) | 145 | 131 | 117 | 80.9 | 42.7 | |
| Fortnite (2018) | 143 | 138 | 136 | 105 | 50.4 | |
| Final Fantasy XV Benchmark (2018) | 106 | 81.4 | 35.9 | |||
| Kingdom Come: Deliverance (2018) | 115 | 89.5 | 68.4 | 50.2 | 27.5 | |
| Far Cry 5 (2018) | 109 | 106 | 100 | 79 | 44 | |
| The Crew 2 (2018) | 60 | 60 | 60 | 60 | 39.9 | |
| Monster Hunter World (2018) | 123 | 111 | 90.9 | 58.4 | 29.7 | |
| F1 2018 (2018) | 169 | 130 | 102 | 87 | 56 | |
| Shadow of the Tomb Raider (2018) | 84 | 82 | 78 | 61 | 37 | |
| FIFA 19 (2018) | 271 | 254 | 248 | 237 | 188 | |
| Assassin´s Creed Odyssey (2018) | 87 | 76 | 59 | 48 | 32 | |
| Call of Duty Black Ops 4 (2018) | 151 | 138 | 131 | 91.4 | 41.6 | |
| Hitman 2 (2018) | 78.8 | 70.9 | 69.1 | 66 | ||
| Battlefield V (2018) | 143 | 130 | 122 | 98.2 | 57.8 | |
| Farming Simulator 19 (2018) | 161 | 141 | 131 | 113 | ||
| Darksiders III (2018) | 130 | 121 | 112 | 82.6 | 42.7 | |
| Just Cause 4 (2018) | 137 | 103 | 101 | 69.9 | 39.9 |
Barulho
| Ocioso |
| 29 / 32 / 33 dB |
| Carga |
| 47 / 51 dB |
 | ||
30 dB silencioso 40 dB(A) audível 50 dB(A) ruidosamente alto |
||
min: | ||
| Asus Zephyrus S GX701GX GeForce RTX 2080 Max-Q, i7-8750H | Acer Predator Triton 500 GeForce RTX 2080 Max-Q, i7-8750H | Razer Blade 15 RTX 2070 Max-Q GeForce RTX 2070 Max-Q, i7-8750H | Gigabyte Aero 15-X9 GeForce RTX 2070 Max-Q, i7-8750H | MSI GE75 8SG Raider GeForce RTX 2080 Mobile, i7-8750H | Asus ROG Strix Scar II GL704GW GeForce RTX 2070 Mobile, i7-8750H | Média da turma Gaming | |
|---|---|---|---|---|---|---|---|
| Noise | 2% | 10% | -0% | -7% | -4% | 9% | |
| desligado / ambiente * (dB) | 29 | 29 -0% | 28.8 1% | 30 -3% | 30 -3% | 29 -0% | 24.1 ? 17% |
| Idle Minimum * (dB) | 29 | 30 -3% | 28.8 1% | 32 -10% | 30 -3% | 29 -0% | 26 ? 10% |
| Idle Average * (dB) | 32 | 32 -0% | 28.8 10% | 34 -6% | 34 -6% | 32 -0% | 27.4 ? 14% |
| Idle Maximum * (dB) | 33 | 34 -3% | 29.4 11% | 36 -9% | 37 -12% | 40 -21% | 30.1 ? 9% |
| Load Average * (dB) | 47 | 44 6% | 35.7 24% | 42 11% | 52 -11% | 46 2% | 43.6 ? 7% |
| Witcher 3 ultra * (dB) | 49 | 46 6% | 42.5 13% | 44 10% | 53 -8% | 51 -4% | |
| Load Maximum * (dB) | 51 | 47 8% | 45 12% | 48 6% | 54 -6% | 52 -2% | 54.2 ? -6% |
* ... menor é melhor
(-) A temperatura máxima no lado superior é 53 °C / 127 F, em comparação com a média de 40.4 °C / 105 F , variando de 21.2 a 68.8 °C para a classe Gaming.
(-) A parte inferior aquece até um máximo de 50 °C / 122 F, em comparação com a média de 43.2 °C / 110 F
(+) Em uso inativo, a temperatura média para o lado superior é 26.7 °C / 80 F, em comparação com a média do dispositivo de 33.9 °C / ### class_avg_f### F.
(-) Jogando The Witcher 3, a temperatura média para o lado superior é 44.6 °C / 112 F, em comparação com a média do dispositivo de 33.9 °C / ## #class_avg_f### F.
(±) Os apoios para as mãos e o touchpad podem ficar muito quentes ao toque, com um máximo de 38 °C / 100.4 F.
(-) A temperatura média da área do apoio para as mãos de dispositivos semelhantes foi 28.8 °C / 83.8 F (-9.2 °C / -16.6 F).
| Asus Zephyrus S GX701GX GeForce RTX 2080 Max-Q, i7-8750H | Acer Predator Triton 500 GeForce RTX 2080 Max-Q, i7-8750H | Razer Blade 15 RTX 2070 Max-Q GeForce RTX 2070 Max-Q, i7-8750H | Gigabyte Aero 15-X9 GeForce RTX 2070 Max-Q, i7-8750H | MSI GE75 8SG Raider GeForce RTX 2080 Mobile, i7-8750H | Asus ROG Strix Scar II GL704GW GeForce RTX 2070 Mobile, i7-8750H | Média da turma Gaming | |
|---|---|---|---|---|---|---|---|
| Heat | -10% | 6% | -7% | 7% | -15% | -3% | |
| Maximum Upper Side * (°C) | 53 | 49 8% | 49 8% | 56 -6% | 46 13% | 59 -11% | 45.2 ? 15% |
| Maximum Bottom * (°C) | 50 | 58 -16% | 49 2% | 66 -32% | 45 10% | 54 -8% | 48.1 ? 4% |
| Idle Upper Side * (°C) | 27 | 33 -22% | 25.4 6% | 27 -0% | 27 -0% | 33 -22% | 31 ? -15% |
| Idle Bottom * (°C) | 30 | 33 -10% | 27.2 9% | 27 10% | 29 3% | 35 -17% | 34.2 ? -14% |
* ... menor é melhor
Asus Zephyrus S GX701GX análise de áudio
(+) | os alto-falantes podem tocar relativamente alto (###valor### dB)
Graves 100 - 315Hz
(±) | graves reduzidos - em média 8.3% menor que a mediana
(±) | a linearidade dos graves é média (11.3% delta para a frequência anterior)
Médios 400 - 2.000 Hz
(+) | médios equilibrados - apenas 3.3% longe da mediana
(+) | médios são lineares (2.5% delta para frequência anterior)
Altos 2 - 16 kHz
(±) | máximos reduzidos - em média 6.9% menor que a mediana
(+) | os máximos são lineares (6.2% delta da frequência anterior)
Geral 100 - 16.000 Hz
(±) | a linearidade do som geral é média (15.4% diferença em relação à mediana)
Comparado com a mesma classe
» 34% de todos os dispositivos testados nesta classe foram melhores, 7% semelhantes, 59% piores
» O melhor teve um delta de 6%, a média foi 18%, o pior foi 132%
Comparado com todos os dispositivos testados
» 23% de todos os dispositivos testados foram melhores, 4% semelhantes, 73% piores
» O melhor teve um delta de 4%, a média foi 23%, o pior foi 134%
MSI GE75 8SG Raider análise de áudio
(+) | os alto-falantes podem tocar relativamente alto (###valor### dB)
Graves 100 - 315Hz
(-) | quase nenhum baixo - em média 15.7% menor que a mediana
(±) | a linearidade dos graves é média (12.1% delta para a frequência anterior)
Médios 400 - 2.000 Hz
(±) | médios reduzidos - em média 5.1% menor que a mediana
(+) | médios são lineares (5.8% delta para frequência anterior)
Altos 2 - 16 kHz
(+) | agudos equilibrados - apenas 2.7% longe da mediana
(+) | os máximos são lineares (3.2% delta da frequência anterior)
Geral 100 - 16.000 Hz
(+) | o som geral é linear (12.8% diferença em relação à mediana)
Comparado com a mesma classe
» 16% de todos os dispositivos testados nesta classe foram melhores, 4% semelhantes, 80% piores
» O melhor teve um delta de 6%, a média foi 18%, o pior foi 132%
Comparado com todos os dispositivos testados
» 12% de todos os dispositivos testados foram melhores, 3% semelhantes, 85% piores
» O melhor teve um delta de 4%, a média foi 23%, o pior foi 134%
| desligado | |
| Ocioso | |
| Carga |
|
Key:
min: | |
| Asus Zephyrus S GX701GX GeForce RTX 2080 Max-Q, i7-8750H | Acer Predator Triton 500 GeForce RTX 2080 Max-Q, i7-8750H | Razer Blade 15 RTX 2070 Max-Q GeForce RTX 2070 Max-Q, i7-8750H | Gigabyte Aero 15-X9 GeForce RTX 2070 Max-Q, i7-8750H | MSI GE75 8SG Raider GeForce RTX 2080 Mobile, i7-8750H | Asus ROG Strix Scar II GL704GW GeForce RTX 2070 Mobile, i7-8750H | Média da turma Gaming | |
|---|---|---|---|---|---|---|---|
| Power Consumption | 8% | 26% | 20% | 14% | -4% | 6% | |
| Idle Minimum * (Watt) | 19 | 16 16% | 10.4 45% | 16 16% | 7 63% | 19 -0% | 13 ? 32% |
| Idle Average * (Watt) | 22 | 22 -0% | 14.6 34% | 18 18% | 15 32% | 22 -0% | 19 ? 14% |
| Idle Maximum * (Watt) | 30 | 32 -7% | 16.3 46% | 23 23% | 22 27% | 29 3% | 24.6 ? 18% |
| Load Average * (Watt) | 104 | 89 14% | 88.5 15% | 88 15% | 92 12% | 102 2% | 110.7 ? -6% |
| Witcher 3 ultra * (Watt) | 167 | 147 12% | 155.4 7% | 120 28% | 207 -24% | 190 -14% | |
| Load Maximum * (Watt) | 203 | 173 15% | 182.4 10% | 167 18% | 254 -25% | 231 -14% | 259 ? -28% |
* ... menor é melhor
| Asus Zephyrus S GX701GX GeForce RTX 2080 Max-Q, i7-8750H, 76 Wh | Acer Predator Triton 500 GeForce RTX 2080 Max-Q, i7-8750H, 82 Wh | Razer Blade 15 RTX 2070 Max-Q GeForce RTX 2070 Max-Q, i7-8750H, 80 Wh | Gigabyte Aero 15-X9 GeForce RTX 2070 Max-Q, i7-8750H, 94.24 Wh | MSI GE75 8SG Raider GeForce RTX 2080 Mobile, i7-8750H, 65 Wh | Asus ROG Strix Scar II GL704GW GeForce RTX 2070 Mobile, i7-8750H, 66 Wh | Média da turma Gaming | |
|---|---|---|---|---|---|---|---|
| Duração da bateria | 17% | 89% | 125% | 27% | 16% | 73% | |
| Reader / Idle (h) | 5 | 5.6 12% | 11.4 128% | 9.2 84% | 7.8 56% | 6.2 24% | 8.27 ? 65% |
| WiFi v1.3 (h) | 3.8 | 3.2 -16% | 6.5 71% | 6.4 68% | 4.7 24% | 3.9 3% | 7.11 ? 87% |
| Load (h) | 0.9 | 1.4 56% | 1.5 67% | 2.9 222% | 0.9 0% | 1.1 22% | 1.502 ? 67% |
| H.264 (h) | 6.1 | 8.32 ? | |||||
| Witcher 3 ultra (h) | 0.8 | 0.9 |
Pro
Contra
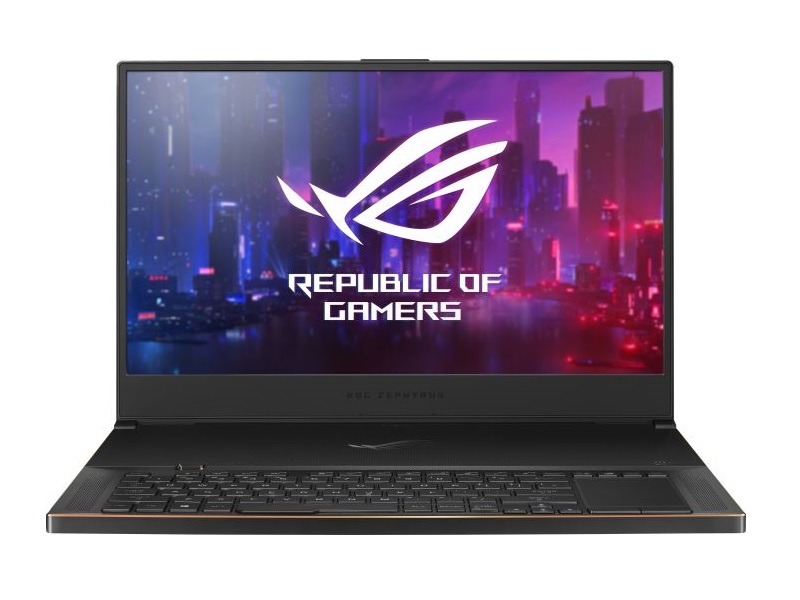
Devido a que as opções de portáteis muito finos e sofisticados de 17,3 polegadas são extremamente limitadas, a Asus tem um trunfo na manga com o novíssimo ROG Zephyrus S GX701GX.
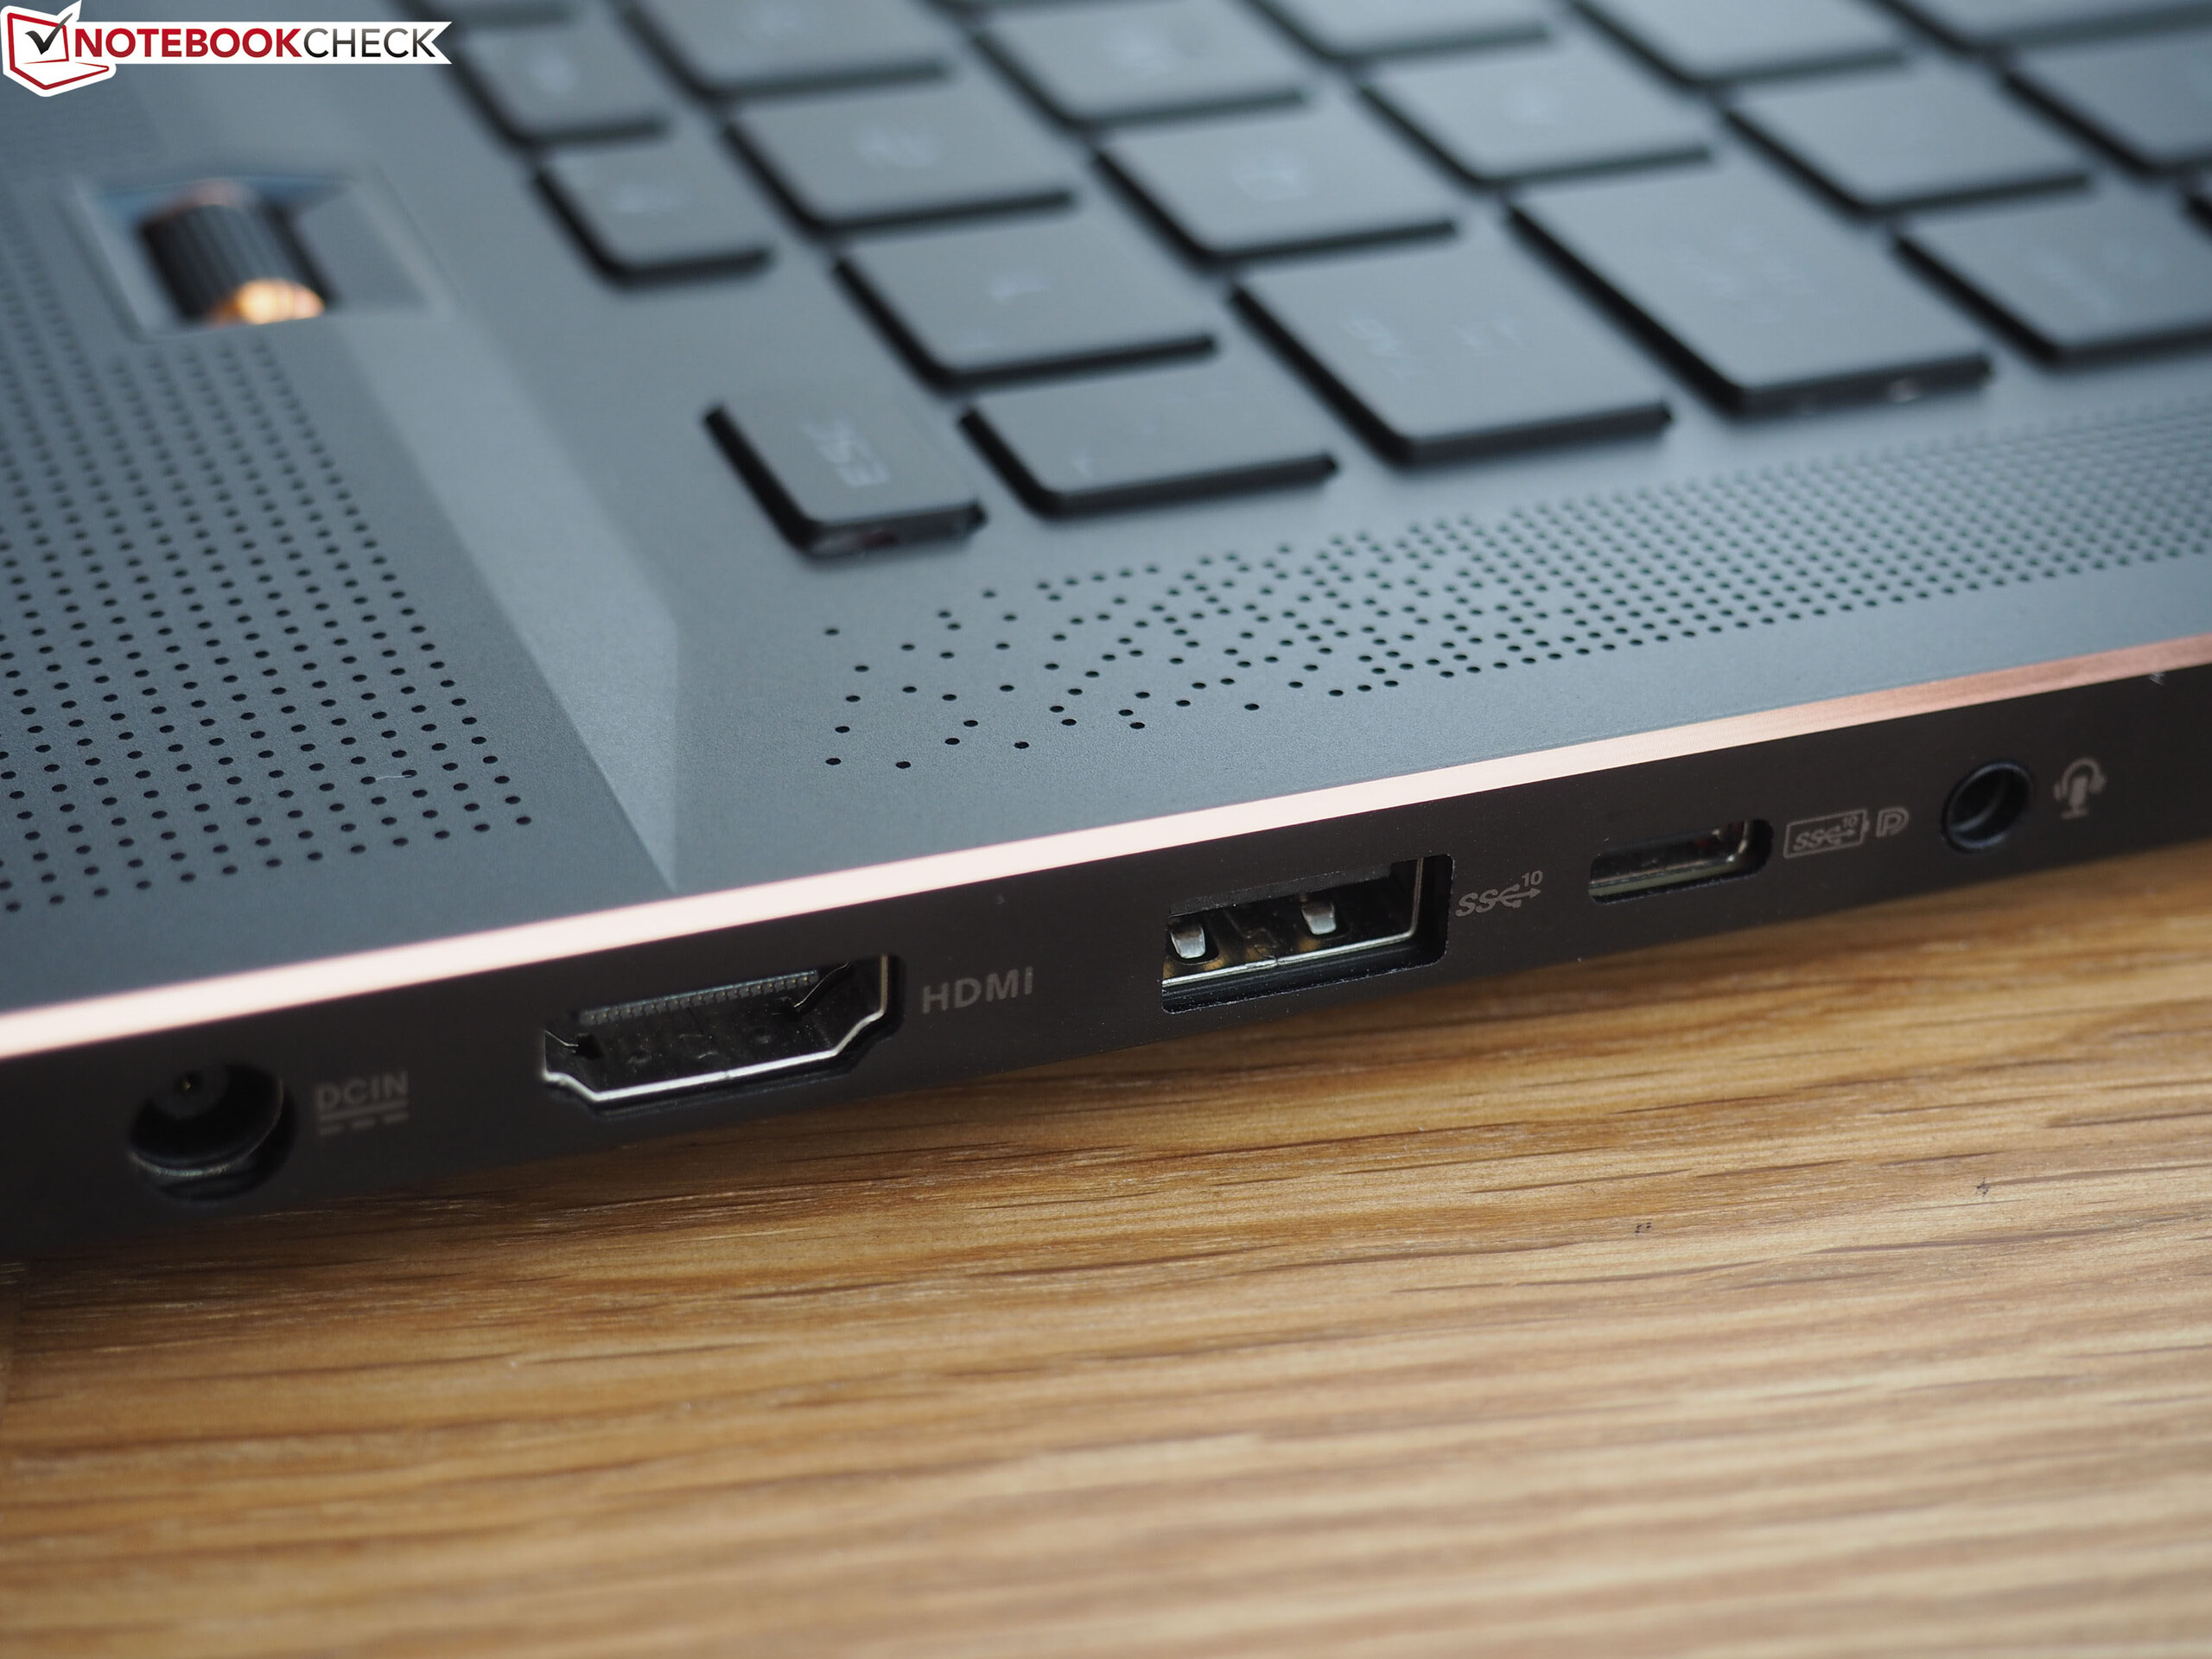
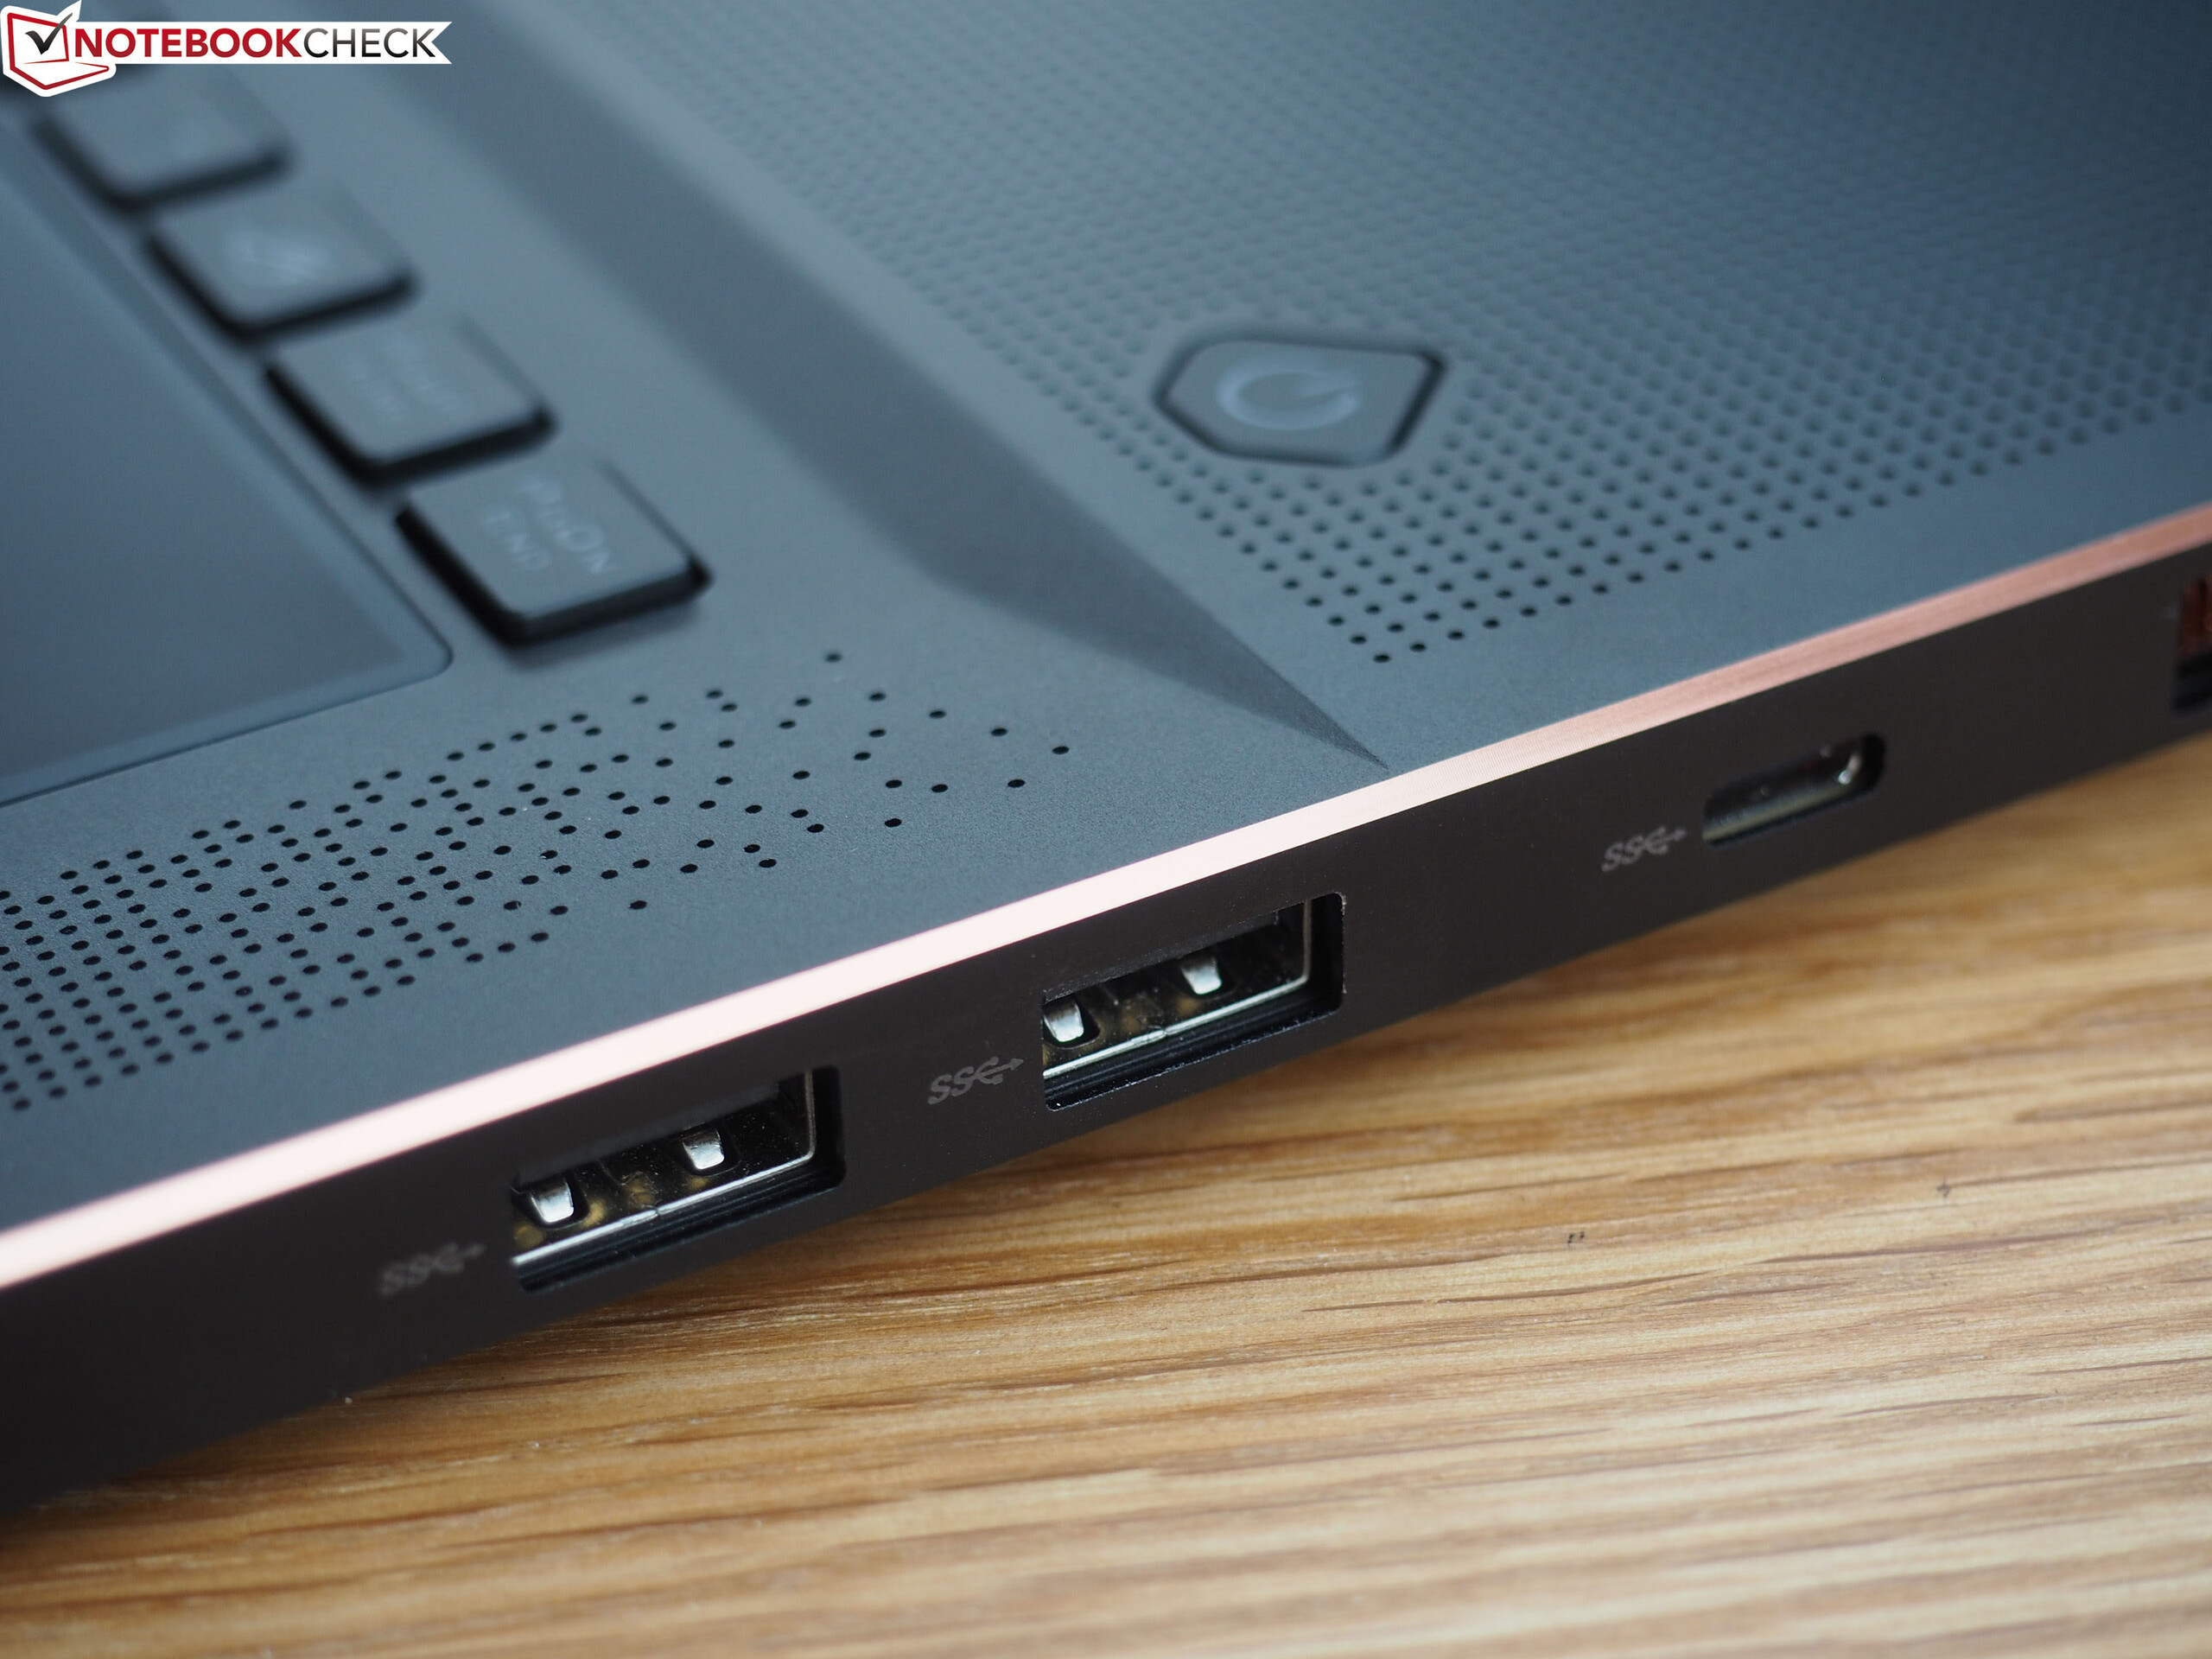
Claro, há detalhes para analisar, como a seleção de portas, controle do ventilador, opções de manutenção e dispositivos de entrada. No entanto, ainda estávamos agradavelmente surpresos com o portátil de 17 polegadas. Os usuários podem ficar entusiasmados, não apenas com o painel de 144 Hz colorido, mas também com uma das implementações mais rápidas do RTX 2080 Max-Q no mercado.
No entanto, este portátil tem um preço alto: A Asus pede 3000 Euros ($ 3407) pelo modelo topo de linha. Aqueles que preferem um dispositivo de 15 polegadas devem dar uma olhada no Acer Triton 500, o Razer Blade 15 ou o Gigabyte Aero 15 X9.
Asus Zephyrus S GX701GX
- 02/28/2019 v6 (old)
Florian Glaser
Price comparison