Breve Análise do Portátil Alienware m17 (i9-8950HK, RTX 2080 Max-Q, 4K UHD)

| |||||||||||||||||||||||||
iluminação: 94 %
iluminação com acumulador: 357.9 cd/m²
Contraste: 1085:1 (Preto: 0.33 cd/m²)
ΔE ColorChecker Calman: 6.57 | ∀{0.5-29.43 Ø4.73}
calibrated: 6.74
ΔE Greyscale Calman: 4.3 | ∀{0.09-98 Ø4.97}
100% sRGB (Argyll 1.6.3 3D)
88.4% AdobeRGB 1998 (Argyll 1.6.3 3D)
99.1% AdobeRGB 1998 (Argyll 3D)
99.9% sRGB (Argyll 3D)
86.4% Display P3 (Argyll 3D)
Gamma: 2.6
CCT: 6403 K
| Alienware m17 P37E AU Optronics B173ZAN01.0, IPS, 17.3", 3840x2160 | Alienware 17 R5 JYWWF_B173QTN (AUO1496), TN, 17.3", 2560x1440 | Asus ROG Strix Scar II GL704GW B173HAN04.0 (AUO409D), AHVA, 17.3", 1920x1080 | MSI GS75 8SG Stealth N173HCE-G33 (CMN175C), IPS, 17.3", 1920x1080 | Razer Blade Pro 2017 Sharp LQ173D1JW33 (SHP145A), IGZO, 17.3", 3840x2160 | Acer Predator Triton 700 AUO B156HAN04.2 (AUO42ED), IPS, 15.6", 1920x1080 | |
|---|---|---|---|---|---|---|
| Display | -26% | -25% | -22% | 1% | -25% | |
| Display P3 Coverage (%) | 86.4 | 63.4 -27% | 62.9 -27% | 63.6 -26% | 88.9 3% | 62.5 -28% |
| sRGB Coverage (%) | 99.9 | 86.1 -14% | 87.1 -13% | 95.4 -5% | 100 0% | 88.7 -11% |
| AdobeRGB 1998 Coverage (%) | 99.1 | 62.9 -37% | 63.7 -36% | 65.5 -34% | 99.7 1% | 63.5 -36% |
| Response Times | 61% | 56% | 73% | -54% | -16% | |
| Response Time Grey 50% / Grey 80% * (ms) | 35.6 ? | 20.8 ? 42% | 17.6 ? 51% | 7.6 ? 79% | 60.8 ? -71% | 44.8 ? -26% |
| Response Time Black / White * (ms) | 28 ? | 6 ? 79% | 11.2 ? 60% | 9.6 ? 66% | 38.4 ? -37% | 29.6 ? -6% |
| PWM Frequency (Hz) | 25510 ? | 204.9 ? | ||||
| Screen | -7% | 14% | 25% | -4% | -9% | |
| Brightness middle (cd/m²) | 357.9 | 398 11% | 295 -18% | 355 -1% | 230 -36% | 291 -19% |
| Brightness (cd/m²) | 347 | 367 6% | 291 -16% | 327 -6% | 207 -40% | 277 -20% |
| Brightness Distribution (%) | 94 | 86 -9% | 96 2% | 85 -10% | 83 -12% | 84 -11% |
| Black Level * (cd/m²) | 0.33 | 0.51 -55% | 0.24 27% | 0.26 21% | 0.2 39% | 0.22 33% |
| Contrast (:1) | 1085 | 780 -28% | 1229 13% | 1365 26% | 1150 6% | 1323 22% |
| Colorchecker dE 2000 * | 6.57 | 5.45 17% | 3.2 51% | 1.54 77% | 5.62 14% | 5.52 16% |
| Colorchecker dE 2000 max. * | 9.86 | 10.36 -5% | 6.64 33% | 3 70% | 10.24 -4% | 10.72 -9% |
| Colorchecker dE 2000 calibrated * | 6.74 | 2.56 62% | 2.52 63% | 0.77 89% | ||
| Greyscale dE 2000 * | 4.3 | 5.4 -26% | 2.16 50% | 2.19 49% | 4.54 -6% | 6.59 -53% |
| Gamma | 2.6 85% | 2.4 92% | 2.46 89% | 2.42 91% | 2.36 93% | 2.44 90% |
| CCT | 6403 102% | 7453 87% | 6872 95% | 6893 94% | 6625 98% | 7816 83% |
| Color Space (Percent of AdobeRGB 1998) (%) | 88.4 | 56 -37% | 57 -36% | 61 -31% | 88 0% | 58 -34% |
| Color Space (Percent of sRGB) (%) | 100 | 86 -14% | 87 -13% | 95 -5% | 100 0% | 89 -11% |
| Média Total (Programa/Configurações) | 9% /
-2% | 15% /
12% | 25% /
22% | -19% /
-10% | -17% /
-13% |
* ... menor é melhor
Exibir tempos de resposta
| ↔ Tempo de resposta preto para branco | ||
|---|---|---|
| 28 ms ... ascensão ↗ e queda ↘ combinadas | ↗ 16 ms ascensão | 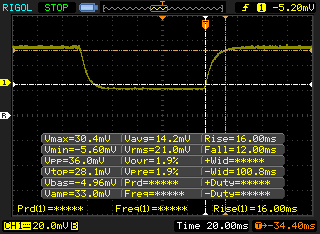 |
| ↘ 12 ms queda | ||
| A tela mostra taxas de resposta relativamente lentas em nossos testes e pode ser muito lenta para os jogadores. Em comparação, todos os dispositivos testados variam de 0.1 (mínimo) a 240 (máximo) ms. » 71 % de todos os dispositivos são melhores. Isso significa que o tempo de resposta medido é pior que a média de todos os dispositivos testados (19.9 ms). | ||
| ↔ Tempo de resposta 50% cinza a 80% cinza | ||
| 35.6 ms ... ascensão ↗ e queda ↘ combinadas | ↗ 19.6 ms ascensão | 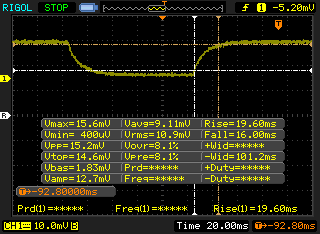 |
| ↘ 16 ms queda | ||
| A tela mostra taxas de resposta lentas em nossos testes e será insatisfatória para os jogadores. Em comparação, todos os dispositivos testados variam de 0.165 (mínimo) a 636 (máximo) ms. » 50 % de todos os dispositivos são melhores. Isso significa que o tempo de resposta medido é pior que a média de todos os dispositivos testados (31.1 ms). | ||
Cintilação da tela / PWM (modulação por largura de pulso)
| Tela tremeluzindo / PWM não detectado |  | ||
[pwm_comparison] Em comparação: 52 % de todos os dispositivos testados não usam PWM para escurecer a tela. Se PWM foi detectado, uma média de 7794 (mínimo: 5 - máximo: 343500) Hz foi medida. | |||
| PCMark 8 Home Score Accelerated v2 | 3812 pontos | |
| PCMark 8 Work Score Accelerated v2 | 4765 pontos | |
| PCMark 10 Score | 5632 pontos | |
Ajuda | ||
| Alienware m17 P37E SK Hynix PC401 512GB M.2 (HFS512GD9TNG) | Alienware 17 R5 SK hynix PC401 HFS256GD9TNG | Asus ROG Strix Scar II GL704GW Intel SSD 660p SSDPEKNW512G8 | MSI GS75 8SG Stealth 2x Samsung SSD PM981 MZVLB512HAJQ (RAID 0) | Razer Blade Pro 2017 2x Samsung SSD PM951 MZVLV256HCHP (RAID 0) | Acer Predator Triton 700 2x SK Hynix Canvas SC300 512GB M.2 (HFS512G39MND) (RAID 0) | |
|---|---|---|---|---|---|---|
| AS SSD | -28% | -14% | 60% | 14% | 36% | |
| Seq Read (MB/s) | 1835 | 2203 20% | 1315 -28% | 3005 64% | 2599 42% | 2517 37% |
| Seq Write (MB/s) | 1121 | 559 -50% | 927 -17% | 2668 138% | 588 -48% | 2372 112% |
| 4K Read (MB/s) | 23.98 | 38.74 62% | 52.4 119% | 40.89 71% | 37.57 57% | 41.47 73% |
| 4K Write (MB/s) | 100 | 92.7 -7% | 122.8 23% | 94.4 -6% | 104.4 4% | 93 -7% |
| 4K-64 Read (MB/s) | 687 | 447.2 -35% | 326.5 -52% | 1366 99% | 1116 62% | 1057 54% |
| 4K-64 Write (MB/s) | 776 | 279.1 -64% | 727 -6% | 1197 54% | 513 -34% | 913 18% |
| Access Time Read * (ms) | 0.047 | 0.091 -94% | 0.11 -134% | 0.055 -17% | 0.051 -9% | 0.062 -32% |
| Access Time Write * (ms) | 0.053 | 0.065 -23% | 0.045 15% | 0.039 26% | 0.036 32% | 0.041 23% |
| Score Read (Points) | 895 | 706 -21% | 510 -43% | 1708 91% | 1414 58% | 1350 51% |
| Score Write (Points) | 988 | 428 -57% | 942 -5% | 1558 58% | 676 -32% | 1243 26% |
| Score Total (Points) | 2306 | 1424 -38% | 1715 -26% | 4123 79% | 2715 18% | 3282 42% |
| Copy ISO MB/s (MB/s) | 773 | |||||
| Copy Program MB/s (MB/s) | 493 | |||||
| Copy Game MB/s (MB/s) | 647 |
* ... menor é melhor

| 3DMark 11 Performance | 21837 pontos | |
| 3DMark Cloud Gate Standard Score | 25513 pontos | |
| 3DMark Fire Strike Score | 17684 pontos | |
| 3DMark Time Spy Score | 7253 pontos | |
Ajuda | ||
| baixo | média | alto | ultra | 4K | |
|---|---|---|---|---|---|
| BioShock Infinite (2013) | 312.6 | 271 | 252.1 | 164.7 | |
| The Witcher 3 (2015) | 277.6 | 221.1 | 138.2 | 75.7 | 53 |
| Rise of the Tomb Raider (2016) | 196.4 | 165.7 | 131.9 | 113.1 | 52.4 |
| Alienware m17 P37E GeForce RTX 2080 Max-Q, i9-8950HK, SK Hynix PC401 512GB M.2 (HFS512GD9TNG) | Alienware 17 R5 GeForce GTX 1070 Mobile, i7-8750H, SK hynix PC401 HFS256GD9TNG | Asus ROG Strix Scar II GL704GW GeForce RTX 2070 Mobile, i7-8750H, Intel SSD 660p SSDPEKNW512G8 | MSI GS75 8SG Stealth GeForce RTX 2080 Max-Q, i7-8750H, 2x Samsung SSD PM981 MZVLB512HAJQ (RAID 0) | Razer Blade Pro 2017 GeForce GTX 1080 Mobile, i7-7820HK, 2x Samsung SSD PM951 MZVLV256HCHP (RAID 0) | Acer Predator Triton 700 GeForce GTX 1080 Max-Q, i7-7700HQ, 2x SK Hynix Canvas SC300 512GB M.2 (HFS512G39MND) (RAID 0) | |
|---|---|---|---|---|---|---|
| Noise | -4% | -6% | -6% | -5% | -5% | |
| desligado / ambiente * (dB) | 28.2 | 30 -6% | 29 -3% | 30 -6% | 30 -6% | 31 -10% |
| Idle Minimum * (dB) | 28.2 | 32 -13% | 29 -3% | 31 -10% | 30 -6% | 33 -17% |
| Idle Average * (dB) | 28.2 | 33 -17% | 32 -13% | 32 -13% | 31 -10% | 34 -21% |
| Idle Maximum * (dB) | 31 | 34 -10% | 40 -29% | 41 -32% | 33 -6% | 40 -29% |
| Load Average * (dB) | 50.8 | 43 15% | 46 9% | 47 7% | 43 15% | 41 19% |
| Witcher 3 ultra * (dB) | 50.8 | 51 -0% | 51 -0% | 47 7% | 55 -8% | 43 15% |
| Load Maximum * (dB) | 50.8 | 51 -0% | 52 -2% | 48 6% | 58 -14% | 48 6% |
* ... menor é melhor
Barulho
| Ocioso |
| 28.2 / 28.2 / 31 dB |
| Carga |
| 50.8 / 50.8 dB |
 | ||
30 dB silencioso 40 dB(A) audível 50 dB(A) ruidosamente alto |
||
min: | ||
(-) A temperatura máxima no lado superior é 55 °C / 131 F, em comparação com a média de 40.4 °C / 105 F , variando de 21.2 a 68.8 °C para a classe Gaming.
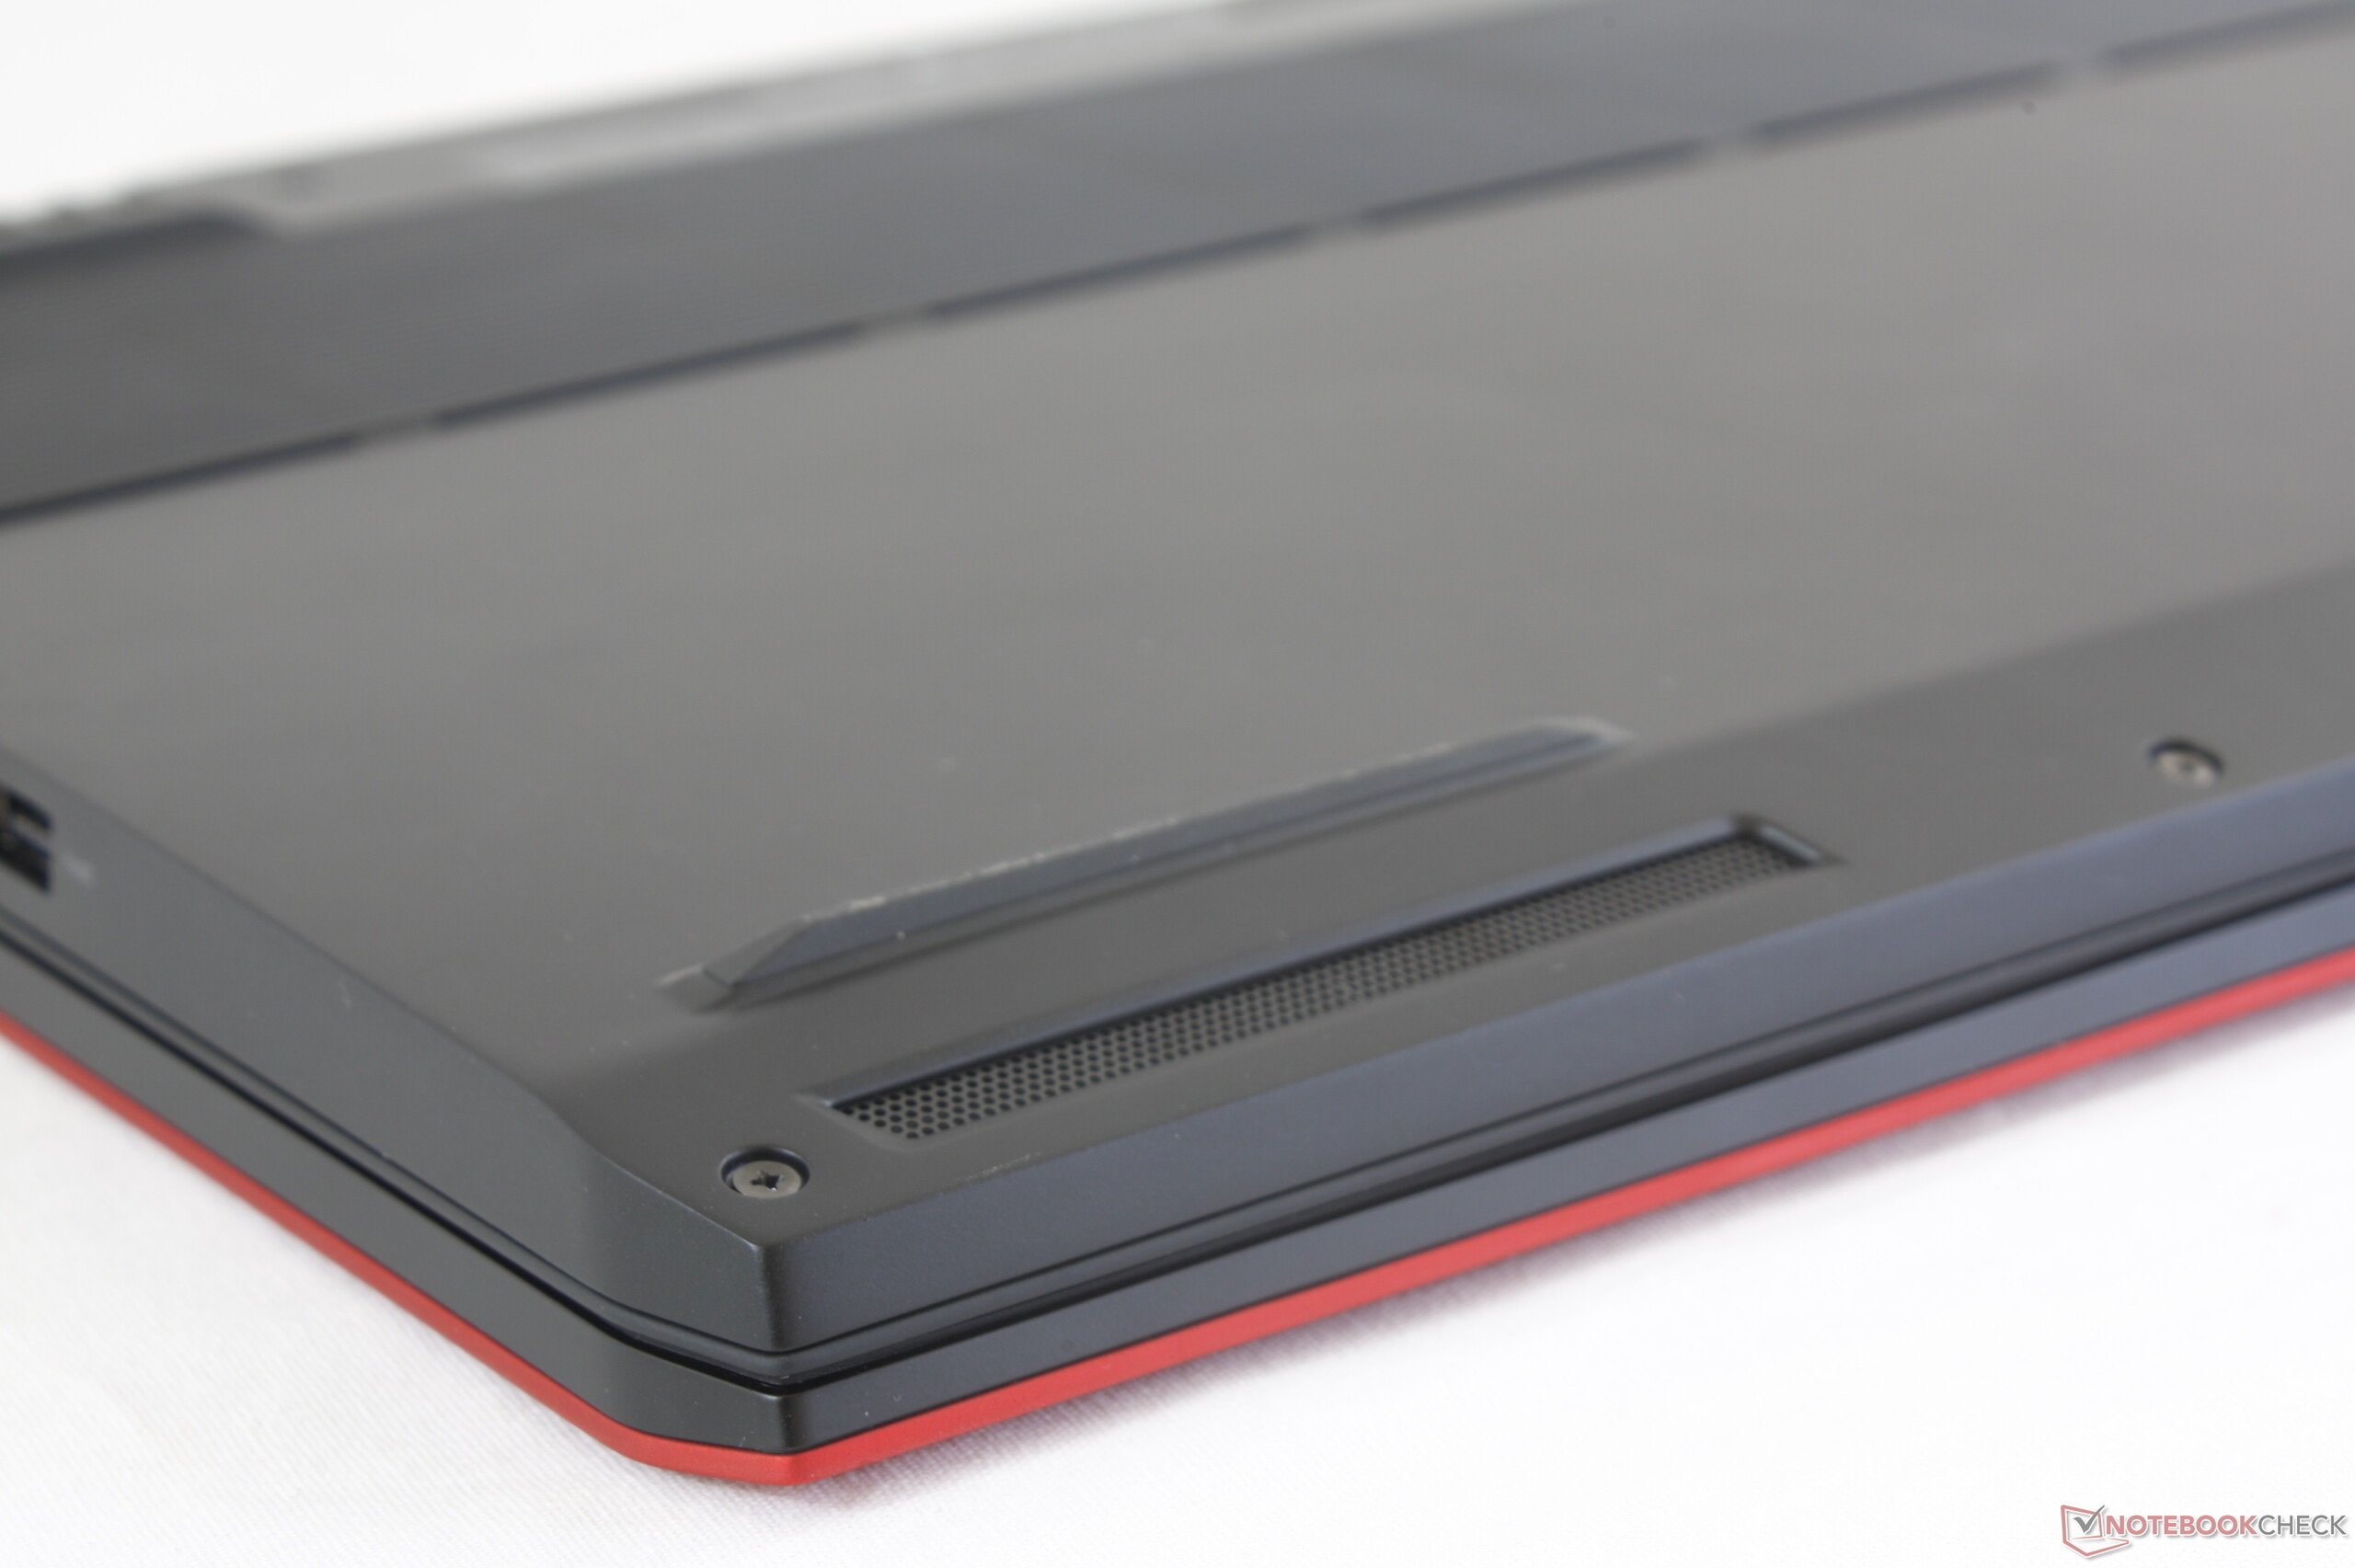
(-) A parte inferior aquece até um máximo de 60 °C / 140 F, em comparação com a média de 43.2 °C / 110 F
(+) Em uso inativo, a temperatura média para o lado superior é 27.3 °C / 81 F, em comparação com a média do dispositivo de 33.9 °C / ### class_avg_f### F.
(±) Jogando The Witcher 3, a temperatura média para o lado superior é 37.4 °C / 99 F, em comparação com a média do dispositivo de 33.9 °C / ## #class_avg_f### F.
(+) Os apoios para as mãos e o touchpad estão atingindo a temperatura máxima da pele (32.2 °C / 90 F) e, portanto, não estão quentes.
(-) A temperatura média da área do apoio para as mãos de dispositivos semelhantes foi 28.8 °C / 83.8 F (-3.4 °C / -6.2 F).
Alienware m17 P37E análise de áudio
(±) | o volume do alto-falante é médio, mas bom (###valor### dB)
Graves 100 - 315Hz
(±) | graves reduzidos - em média 11.4% menor que a mediana
(±) | a linearidade dos graves é média (12.4% delta para a frequência anterior)
Médios 400 - 2.000 Hz
(+) | médios equilibrados - apenas 3% longe da mediana
(+) | médios são lineares (6.1% delta para frequência anterior)
Altos 2 - 16 kHz
(+) | agudos equilibrados - apenas 4.3% longe da mediana
(+) | os máximos são lineares (5.2% delta da frequência anterior)
Geral 100 - 16.000 Hz
(+) | o som geral é linear (13.8% diferença em relação à mediana)
Comparado com a mesma classe
» 21% de todos os dispositivos testados nesta classe foram melhores, 7% semelhantes, 72% piores
» O melhor teve um delta de 6%, a média foi 18%, o pior foi 132%
Comparado com todos os dispositivos testados
» 15% de todos os dispositivos testados foram melhores, 4% semelhantes, 81% piores
» O melhor teve um delta de 4%, a média foi 24%, o pior foi 134%
Apple MacBook 12 (Early 2016) 1.1 GHz análise de áudio
(+) | os alto-falantes podem tocar relativamente alto (###valor### dB)
Graves 100 - 315Hz
(±) | graves reduzidos - em média 11.3% menor que a mediana
(±) | a linearidade dos graves é média (14.2% delta para a frequência anterior)
Médios 400 - 2.000 Hz
(+) | médios equilibrados - apenas 2.4% longe da mediana
(+) | médios são lineares (5.5% delta para frequência anterior)
Altos 2 - 16 kHz
(+) | agudos equilibrados - apenas 2% longe da mediana
(+) | os máximos são lineares (4.5% delta da frequência anterior)
Geral 100 - 16.000 Hz
(+) | o som geral é linear (10.2% diferença em relação à mediana)
Comparado com a mesma classe
» 7% de todos os dispositivos testados nesta classe foram melhores, 2% semelhantes, 91% piores
» O melhor teve um delta de 5%, a média foi 18%, o pior foi 53%
Comparado com todos os dispositivos testados
» 5% de todos os dispositivos testados foram melhores, 1% semelhantes, 94% piores
» O melhor teve um delta de 4%, a média foi 24%, o pior foi 134%
| desligado | |
| Ocioso | |
| Carga |
|
Key:
min: | |
| Alienware m17 P37E i9-8950HK, GeForce RTX 2080 Max-Q, SK Hynix PC401 512GB M.2 (HFS512GD9TNG), IPS, 3840x2160, 17.3" | Alienware 17 R5 i7-8750H, GeForce GTX 1070 Mobile, SK hynix PC401 HFS256GD9TNG, TN, 2560x1440, 17.3" | Asus ROG Strix Scar II GL704GW i7-8750H, GeForce RTX 2070 Mobile, Intel SSD 660p SSDPEKNW512G8, AHVA, 1920x1080, 17.3" | MSI GS75 8SG Stealth i7-8750H, GeForce RTX 2080 Max-Q, 2x Samsung SSD PM981 MZVLB512HAJQ (RAID 0), IPS, 1920x1080, 17.3" | Razer Blade Pro 2017 i7-7820HK, GeForce GTX 1080 Mobile, 2x Samsung SSD PM951 MZVLV256HCHP (RAID 0), IGZO, 3840x2160, 17.3" | Acer Predator Triton 700 i7-7700HQ, GeForce GTX 1080 Max-Q, 2x SK Hynix Canvas SC300 512GB M.2 (HFS512G39MND) (RAID 0), IPS, 1920x1080, 15.6" | |
|---|---|---|---|---|---|---|
| Power Consumption | -8% | 10% | 27% | -19% | -5% | |
| Idle Minimum * (Watt) | 21.2 | 28 -32% | 19 10% | 13 39% | 31 -46% | 28 -32% |
| Idle Average * (Watt) | 29.6 | 32 -8% | 22 26% | 17 43% | 36 -22% | 33 -11% |
| Idle Maximum * (Watt) | 34 | 37 -9% | 29 15% | 23 32% | 44 -29% | 41 -21% |
| Load Average * (Watt) | 130.9 | 112 14% | 102 22% | 90 31% | 107 18% | 94 28% |
| Witcher 3 ultra * (Watt) | 177.5 | 192 -8% | 190 -7% | 147 17% | 212 -19% | 160 10% |
| Load Maximum * (Watt) | 219.7 | 231 -5% | 231 -5% | 215 2% | 258 -17% | 222 -1% |
* ... menor é melhor
| Alienware m17 P37E i9-8950HK, GeForce RTX 2080 Max-Q, 90 Wh | Alienware 17 R5 i7-8750H, GeForce GTX 1070 Mobile, 99 Wh | Asus ROG Strix Scar II GL704GW i7-8750H, GeForce RTX 2070 Mobile, 66 Wh | MSI GS75 8SG Stealth i7-8750H, GeForce RTX 2080 Max-Q, 80.25 Wh | Razer Blade Pro 2017 i7-7820HK, GeForce GTX 1080 Mobile, 99 Wh | Acer Predator Triton 700 i7-7700HQ, GeForce GTX 1080 Max-Q, 54 Wh | |
|---|---|---|---|---|---|---|
| Duração da bateria | -13% | -5% | 2% | -4% | -25% | |
| Reader / Idle (h) | 9.1 | 4.5 -51% | 6.2 -32% | 7.7 -15% | 4.2 -54% | 2.5 -73% |
| WiFi v1.3 (h) | 4.9 | 3.6 -27% | 3.9 -20% | 5.3 8% | 3.3 -33% | 2.4 -51% |
| Load (h) | 0.8 | 1.1 38% | 1.1 38% | 0.9 13% | 1.4 75% | 1.2 50% |
| Witcher 3 ultra (h) | 0.9 |
Pro
Contra
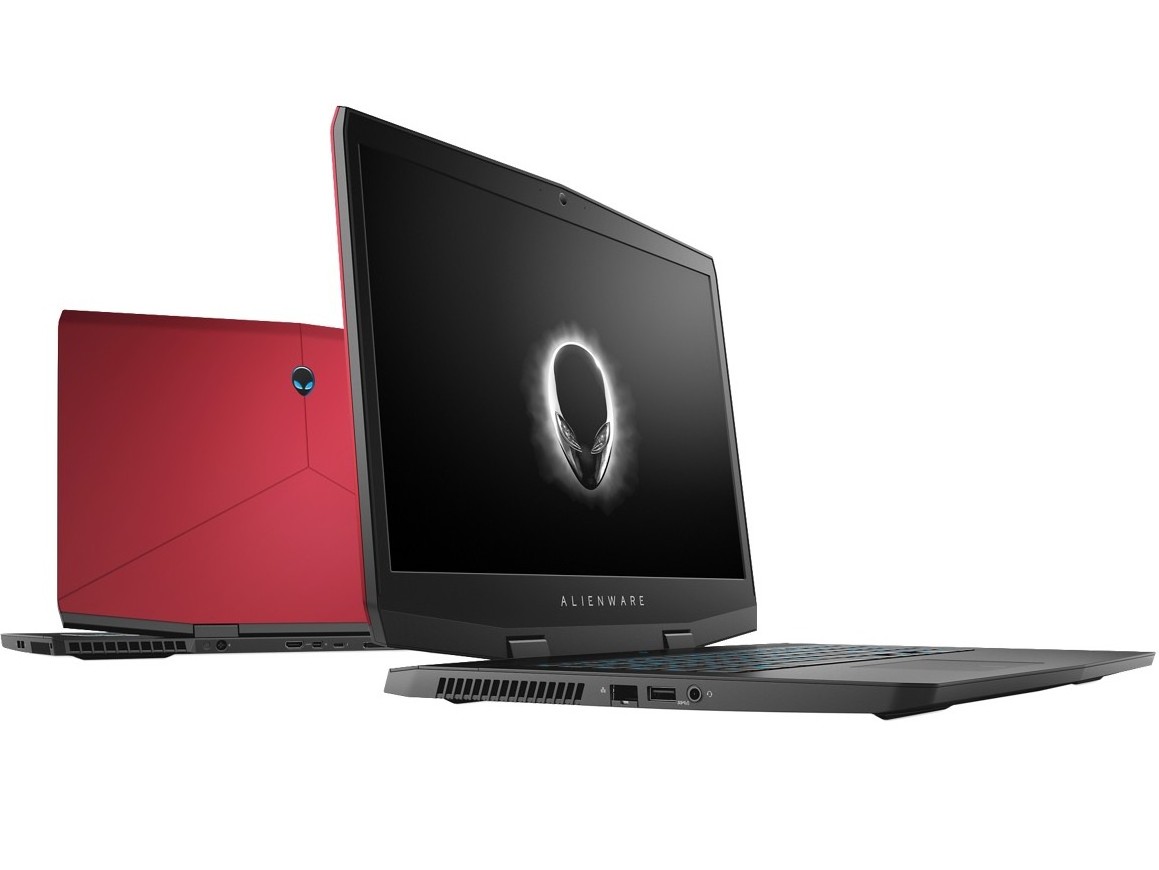
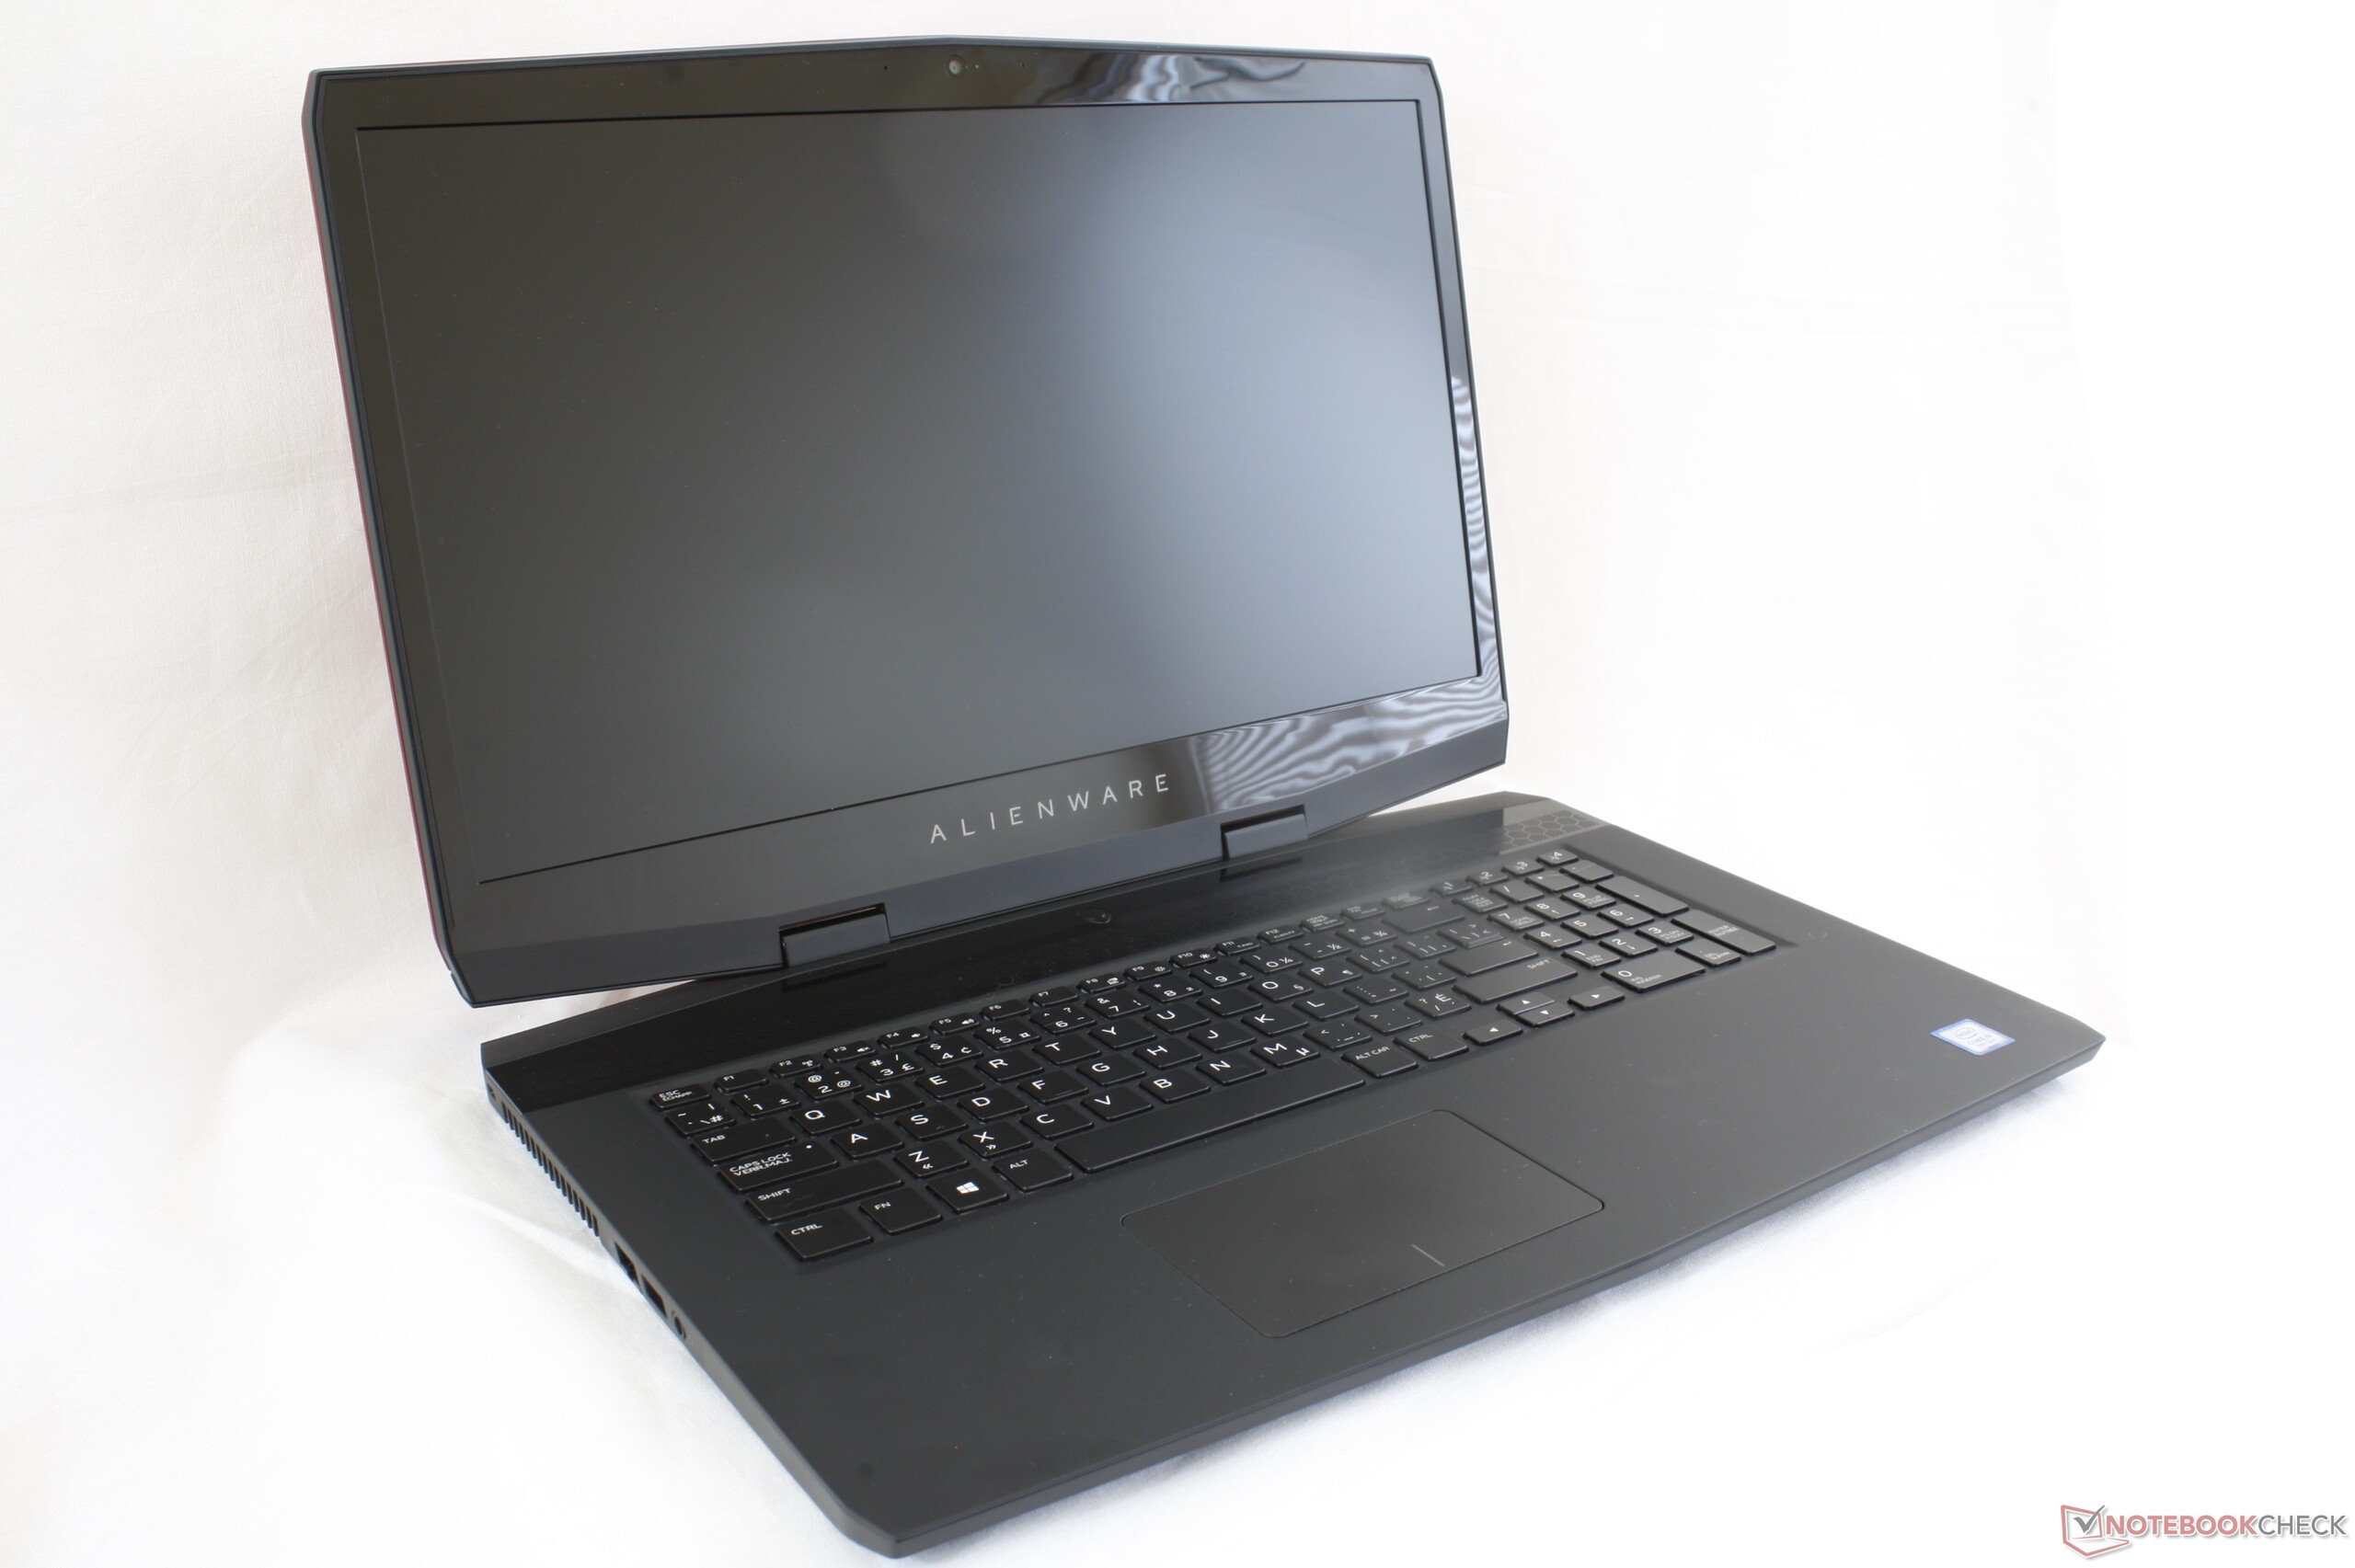
A Dell inteligentemente divide sua série Alienware 17 em duas versões muito distintas: o Alienware m17 e Alienware Area-51m. Enquanto o mais fino m17 foi despojado de recursos quando comparado com a série 17 original, o maior e totalmente equipado Area-51m pegou a folga. A uma vez volumosa série Alienware de 17 polegadas pode agora atrair jogadores que preferem portáteis mais finos, bem como jogadores que querem o máximo de potência possível de um formato portátil.
Como o m17 é essencialmente um "Alienware 17 Lite", no entanto, os fãs da série original lamentarão o fato de que ele sacrifica um punhado de recursos clássicos da Alienware, tudo em nome de ser mais fino e mais leve. Ainda não consegue ser tão fino ou leve como os modelos mais recentes da MSI, Asus, ou Acer e assim o m17 é mais uma solução intermediária entre ultra fino e grosso e pesado. Por outro lado, as dimensões extra tornam o chassi m17 mais inflexível do que muitas de suas alternativas de super finas, especialmente em relação à tampa.
Nossas maiores reclamações estão relacionadas às temperaturas do núcleo, ao ruído do ventilador e ao teclado. Atingir temperaturas do núcleo de 98 C, mesmo com os ventiladores funcionando ao máximo durante os jogos, pode ser difícil de engolir para muitos. Enquanto isso, a resposta das teclas suaves teria sido mais apropriada em um Ultrabook fino do que em um portátil de jogos como o m17. Os teclados SteelSeries nos portáteis MSI e Clevo oferecem uma resposta mais firme das teclas para uma experiência de jogo mais precisa. O layout de teclado chanfrado no Area-51m e na versão antiga do Alienware 17 também se sente melhor para jogos.
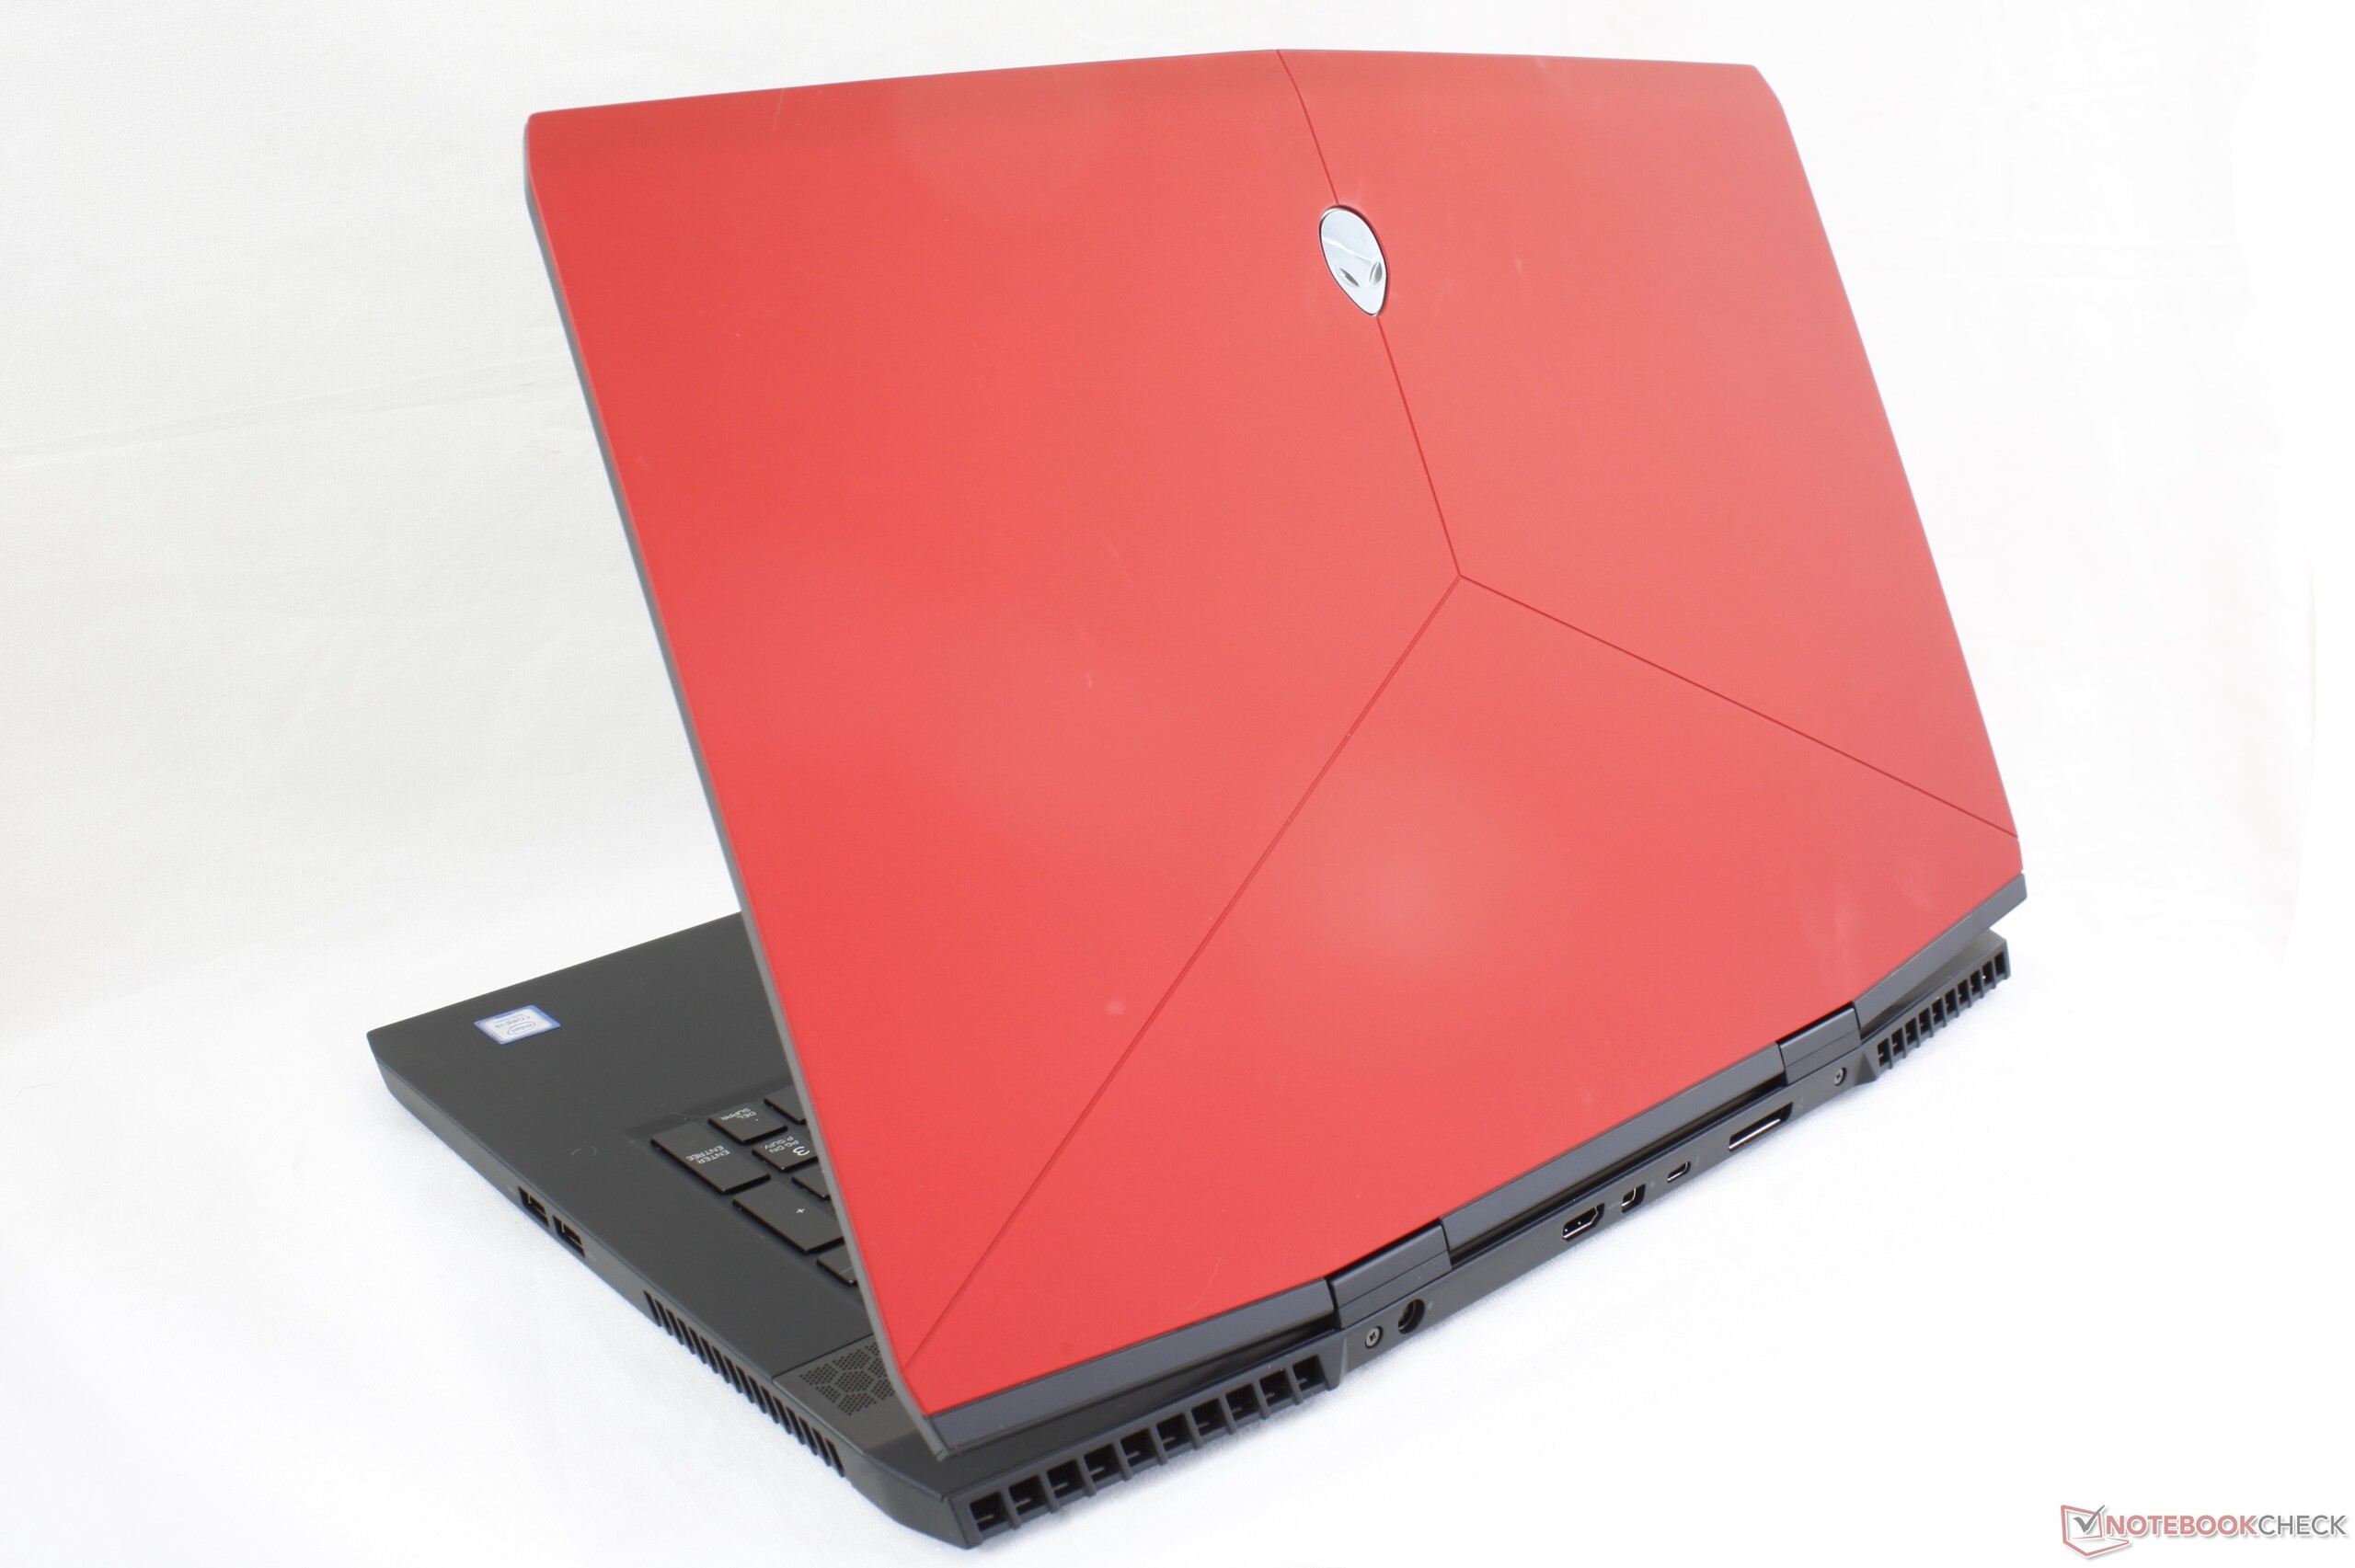
O Alienware m17 oferece uma enorme redução de peso e tamanho sobre o Alienware 17. As desvantagens, no entanto, são perceptíveis, incluindo a omissão de muitos recursos de hardware e a migração para GPUs Max-Q. Felizmente, os usuários que desejam uma experiência Alienware mais clássica podem optar pelo Area-51m, enquanto os recém-chegados à marca gostarão do m17 pelo seu design de chassi forte em comparação com outras alternativas ultra finas.
Alienware m17 P37E
- 04/14/2019 v6 (old)
Allen Ngo
Price comparison
