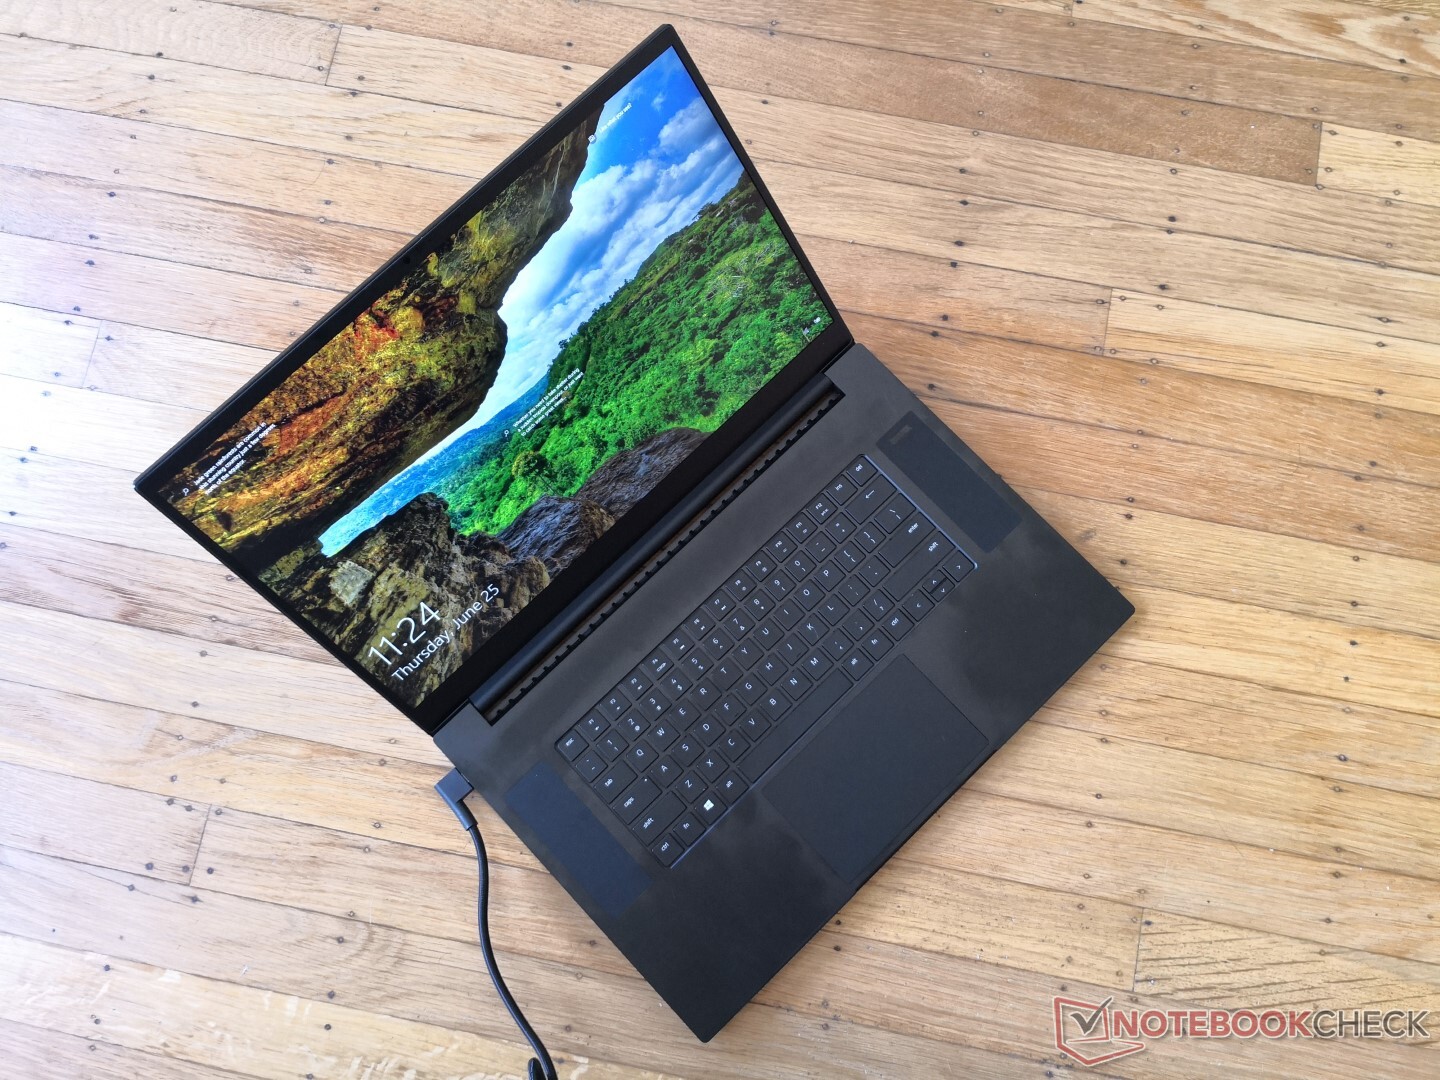
Breve Análise do Razer Blade Pro 17 2020: Você realmente precisa um portátil de 300 Hz?
Avaliação | Data | Modelo | Peso | Altura | Size | Resolução | Preço |
|---|---|---|---|---|---|---|---|
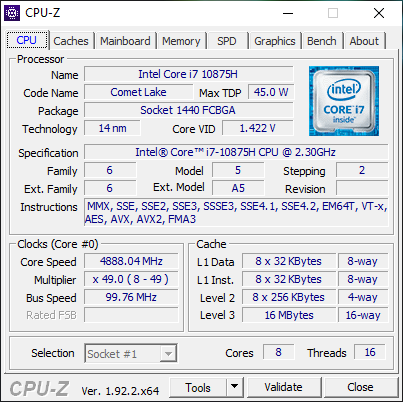
| 87.4 % v7 (old) | 06/2020 | Razer Blade Pro 17 RTX 2070 Max-Q 300 Hz i7-10875H, GeForce RTX 2070 Max-Q | 2.7 kg | 19.9 mm | 17.30" | 1920x1080 | |
| 81.2 % v7 (old) | 12/2019 | Asus ROG Zephyrus S GX701GXR i7-9750H, GeForce RTX 2080 Max-Q | 2.7 kg | 18.7 mm | 17.30" | 1920x1080 | |
| 82.9 % v7 (old) | 07/2019 | MSI GS75 Stealth 9SG i7-9750H, GeForce RTX 2080 Max-Q | 2.3 kg | 18.9 mm | 17.30" | 1920x1080 | |
| 84.2 % v7 (old) | 03/2020 | Alienware m17 R2 P41E i9-9980HK, GeForce RTX 2080 Max-Q | 2.6 kg | 20.5 mm | 17.30" | 1920x1080 | |
| 86.5 % v7 (old) | 05/2020 | Aorus 17G XB i7-10875H, GeForce RTX 2070 Super Max-Q | 2.7 kg | 26 mm | 17.30" | 1920x1080 |
| SD Card Reader | |
| average JPG Copy Test (av. of 3 runs) | |
| Aorus 17G XB (Toshiba Exceria Pro SDXC 64 GB UHS-II) | |
| Razer Blade Pro 17 RTX 2070 Max-Q 300 Hz (Toshiba Exceria Pro SDXC 64 GB UHS-II) | |
| Dell XPS 15 9500 Core i7 4K UHD (Toshiba Exceria Pro SDXC 64 GB UHS-II) | |
| Razer Blade Pro 17 4K UHD 120 Hz (Toshiba Exceria Pro SDXC 64 GB UHS-II) | |
| MSI GS63VR 7RG-005 (Toshiba Exceria Pro SDXC 64 GB UHS-II) | |
| maximum AS SSD Seq Read Test (1GB) | |
| Aorus 17G XB (Toshiba Exceria Pro SDXC 64 GB UHS-II) | |
| Razer Blade Pro 17 RTX 2070 Max-Q 300 Hz (Toshiba Exceria Pro SDXC 64 GB UHS-II) | |
| MSI GS63VR 7RG-005 (Toshiba Exceria Pro SDXC 64 GB UHS-II) | |
| Razer Blade Pro 17 4K UHD 120 Hz (Toshiba Exceria Pro SDXC 64 GB UHS-II) | |
| Dell XPS 15 9500 Core i7 4K UHD (Toshiba Exceria Pro SDXC 64 GB UHS-II) | |


| |||||||||||||||||||||||||
iluminação: 78 %
iluminação com acumulador: 328 cd/m²
Contraste: 937:1 (Preto: 0.35 cd/m²)
ΔE ColorChecker Calman: 4.74 | ∀{0.5-29.43 Ø4.72}
calibrated: 2.12
ΔE Greyscale Calman: 6.8 | ∀{0.09-98 Ø4.97}
98.6% sRGB (Argyll 1.6.3 3D)
64.8% AdobeRGB 1998 (Argyll 1.6.3 3D)
73% AdobeRGB 1998 (Argyll 3D)
98.5% sRGB (Argyll 3D)
72.2% Display P3 (Argyll 3D)
Gamma: 2.2
CCT: 6446 K
| Razer Blade Pro 17 RTX 2070 Max-Q 300 Hz Sharp LQ173M1JW02, IPS, 17.3", 1920x1080 | Asus ROG Zephyrus S GX701GXR AU Optronics B173HAN05.1, IPS, 17.3", 1920x1080 | MSI GS75 Stealth 9SG Chi Mei N173HCE-G33 (CMN175C), IPS, 17.3", 1920x1080 | Alienware m17 R2 P41E Chi Mei 173HCE, CMN175F, IPS, 17.3", 1920x1080 | Aorus 17G XB AU Optronics B173HAN05.0 (AUO509D), IPS, 17.3", 1920x1080 | Razer Blade Pro 17 4K UHD 120 Hz AU Optronics B173ZAN03.3, IPS, 17.3", 3840x2160 | |
|---|---|---|---|---|---|---|
| Display | -2% | -10% | -1% | -1% | 18% | |
| Display P3 Coverage (%) | 72.2 | 70 -3% | 62.6 -13% | 70.8 -2% | 70.6 -2% | 84.8 17% |
| sRGB Coverage (%) | 98.5 | 96.6 -2% | 93.5 -5% | 98.5 0% | 97.2 -1% | 99.9 1% |
| AdobeRGB 1998 Coverage (%) | 73 | 72.3 -1% | 64.7 -11% | 72.2 -1% | 72.8 0% | 98.6 35% |
| Response Times | 11% | -17% | -110% | -106% | -90% | |
| Response Time Grey 50% / Grey 80% * (ms) | 5.6 ? | 5.6 ? -0% | 7.2 ? -29% | 17.2 ? -207% | 16 ? -186% | 15.2 ? -171% |
| Response Time Black / White * (ms) | 9.6 ? | 7.6 ? 21% | 10 ? -4% | 10.8 ? -13% | 12 ? -25% | 10.4 ? -8% |
| PWM Frequency (Hz) | 25510 ? | 26320 ? | ||||
| Screen | 23% | 31% | 32% | 31% | 3% | |
| Brightness middle (cd/m²) | 328 | 288 -12% | 366 12% | 384.2 17% | 293 -11% | 346.7 6% |
| Brightness (cd/m²) | 329 | 276 -16% | 343 4% | 357 9% | 285 -13% | 332 1% |
| Brightness Distribution (%) | 78 | 93 19% | 91 17% | 90 15% | 95 22% | 91 17% |
| Black Level * (cd/m²) | 0.35 | 0.24 31% | 0.29 17% | 0.29 17% | 0.24 31% | 0.27 23% |
| Contrast (:1) | 937 | 1200 28% | 1262 35% | 1325 41% | 1221 30% | 1284 37% |
| Colorchecker dE 2000 * | 4.74 | 1.92 59% | 1.51 68% | 1.35 72% | 1.27 73% | 5.62 -19% |
| Colorchecker dE 2000 max. * | 8.99 | 4.57 49% | 3.22 64% | 3.45 62% | 2.24 75% | 9.36 -4% |
| Colorchecker dE 2000 calibrated * | 2.12 | 1.14 46% | 0.71 67% | 1.42 33% | 1.06 50% | 3.81 -80% |
| Greyscale dE 2000 * | 6.8 | 3.08 55% | 1.93 72% | 1.2 82% | 1.34 80% | 5.5 19% |
| Gamma | 2.2 100% | 2.42 91% | 2.38 92% | 2.23 99% | 2.38 92% | 2.25 98% |
| CCT | 6446 101% | 7055 92% | 6881 94% | 6580 99% | 6542 99% | 6175 105% |
| Color Space (Percent of AdobeRGB 1998) (%) | 64.8 | 65 0% | 60 -7% | 65.5 1% | 73 13% | 87.2 35% |
| Color Space (Percent of sRGB) (%) | 98.6 | 96 -3% | 94 -5% | 98.5 0% | 94 -5% | 100 1% |
| Média Total (Programa/Configurações) | 11% /
17% | 1% /
18% | -26% /
8% | -25% /
8% | -23% /
-6% |
* ... menor é melhor
Exibir tempos de resposta
| ↔ Tempo de resposta preto para branco | ||
|---|---|---|
| 9.6 ms ... ascensão ↗ e queda ↘ combinadas | ↗ 5.2 ms ascensão | 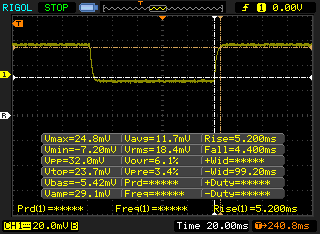 |
| ↘ 4.4 ms queda | ||
| A tela mostra taxas de resposta rápidas em nossos testes e deve ser adequada para jogos. Em comparação, todos os dispositivos testados variam de 0.1 (mínimo) a 240 (máximo) ms. » 26 % de todos os dispositivos são melhores. Isso significa que o tempo de resposta medido é melhor que a média de todos os dispositivos testados (19.8 ms). | ||
| ↔ Tempo de resposta 50% cinza a 80% cinza | ||
| 5.6 ms ... ascensão ↗ e queda ↘ combinadas | ↗ 2.6 ms ascensão | 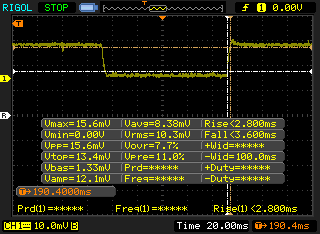 |
| ↘ 3 ms queda | ||
| A tela mostra taxas de resposta muito rápidas em nossos testes e deve ser muito adequada para jogos em ritmo acelerado. Em comparação, todos os dispositivos testados variam de 0.165 (mínimo) a 636 (máximo) ms. » 18 % de todos os dispositivos são melhores. Isso significa que o tempo de resposta medido é melhor que a média de todos os dispositivos testados (31 ms). | ||
Cintilação da tela / PWM (modulação por largura de pulso)
| Tela tremeluzindo / PWM não detectado | 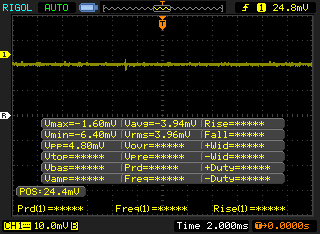 | ||
[pwm_comparison] Em comparação: 52 % de todos os dispositivos testados não usam PWM para escurecer a tela. Se PWM foi detectado, uma média de 7763 (mínimo: 5 - máximo: 343500) Hz foi medida. | |||
Cinebench R15: CPU Multi 64Bit | CPU Single 64Bit
Blender: v2.79 BMW27 CPU
7-Zip 18.03: 7z b 4 -mmt1 | 7z b 4
Geekbench 5.5: Single-Core | Multi-Core
HWBOT x265 Benchmark v2.2: 4k Preset
LibreOffice : 20 Documents To PDF
R Benchmark 2.5: Overall mean
| Blender / v2.79 BMW27 CPU | |
| MSI GF75 Thin 10SCXR | |
| Acer Nitro 5 AN517-52-77DS | |
| Acer Nitro 5 AN515-44-R5FT | |
| Média Intel Core i7-10875H (259 - 535, n=30) | |
| Razer Blade Pro 17 RTX 2070 Max-Q 300 Hz | |
| Asus Zephyrus G14 GA401IV | |
| MSI GE75 9SG | |
| MSI GE66 Raider 10SFS | |
| Asus TUF A17 FA706IU-AS76 | |
| 7-Zip 18.03 / 7z b 4 -mmt1 | |
| MSI GE66 Raider 10SFS | |
| Média Intel Core i7-10875H (5071 - 5780, n=31) | |
| Razer Blade Pro 17 RTX 2070 Max-Q 300 Hz | |
| Acer Nitro 5 AN517-52-77DS | |
| MSI GE75 9SG | |
| Asus TUF A17 FA706IU-AS76 | |
| MSI GF75 Thin 10SCXR | |
| Asus Zephyrus G14 GA401IV | |
| Acer Nitro 5 AN515-44-R5FT | |
| Geekbench 5.5 / Single-Core | |
| MSI GE66 Raider 10SFS | |
| Média Intel Core i7-10875H (1233 - 1371, n=29) | |
| Razer Blade Pro 17 RTX 2070 Max-Q 300 Hz | |
| Acer Nitro 5 AN517-52-77DS | |
| Asus Zephyrus G14 GA401IV | |
| Asus TUF A17 FA706IU-AS76 | |
| MSI GF75 Thin 10SCXR | |
| Acer Nitro 5 AN515-44-R5FT | |
| Geekbench 5.5 / Multi-Core | |
| MSI GE66 Raider 10SFS | |
| Asus TUF A17 FA706IU-AS76 | |
| Média Intel Core i7-10875H (5715 - 8620, n=29) | |
| Asus Zephyrus G14 GA401IV | |
| Razer Blade Pro 17 RTX 2070 Max-Q 300 Hz | |
| Acer Nitro 5 AN517-52-77DS | |
| Acer Nitro 5 AN515-44-R5FT | |
| MSI GF75 Thin 10SCXR | |
| HWBOT x265 Benchmark v2.2 / 4k Preset | |
| MSI GE66 Raider 10SFS | |
| Asus TUF A17 FA706IU-AS76 | |
| Asus Zephyrus G14 GA401IV | |
| MSI GE75 9SG | |
| Média Intel Core i7-10875H (7.27 - 14.1, n=27) | |
| Acer Nitro 5 AN517-52-77DS | |
| Acer Nitro 5 AN515-44-R5FT | |
| MSI GF75 Thin 10SCXR | |
| LibreOffice / 20 Documents To PDF | |
| Acer Nitro 5 AN515-44-R5FT | |
| Asus TUF A17 FA706IU-AS76 | |
| MSI GF75 Thin 10SCXR | |
| Razer Blade Pro 17 RTX 2070 Max-Q 300 Hz | |
| MSI GE66 Raider 10SFS | |
| Média Intel Core i7-10875H (30.2 - 84.3, n=30) | |
| Acer Nitro 5 AN517-52-77DS | |
| R Benchmark 2.5 / Overall mean | |
| MSI GF75 Thin 10SCXR | |
| Acer Nitro 5 AN517-52-77DS | |
| Acer Nitro 5 AN515-44-R5FT | |
| Asus TUF A17 FA706IU-AS76 | |
| Média Intel Core i7-10875H (0.546 - 0.662, n=29) | |
| MSI GE66 Raider 10SFS | |
* ... menor é melhor
| PCMark 8 Home Score Accelerated v2 | 5217 pontos | |
| PCMark 8 Work Score Accelerated v2 | 6317 pontos | |
| PCMark 10 Score | 6290 pontos | |
Ajuda | ||
| DPC Latencies / LatencyMon - interrupt to process latency (max), Web, Youtube, Prime95 | |
| Asus TUF A17 FA706IU-AS76 | |
| MSI GF75 Thin 10SCXR | |
| Asus Zephyrus G14 GA401IV | |
| Razer Blade Pro 17 RTX 2070 Max-Q 300 Hz | |
* ... menor é melhor
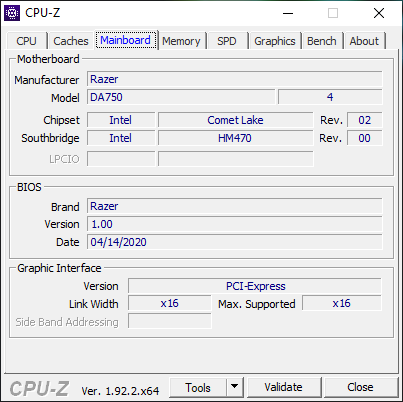
| Razer Blade Pro 17 RTX 2070 Max-Q 300 Hz Lite-On CA5-8D512 | MSI GS75 Stealth 9SG 2x Samsung SSD PM981 MZVLB1T0HALR (RAID 0) | Alienware m17 R2 P41E 2x SK Hynix PC601 NVMe 512 GB (RAID 0) | Aorus 17G XB Samsung SSD PM981a MZVLB512HBJQ | Razer Blade Pro 17 4K UHD 120 Hz Samsung SSD PM981 MZVLB1T0HALR | |
|---|---|---|---|---|---|
| AS SSD | 41% | 26% | 68% | 54% | |
| Seq Read (MB/s) | 2019 | 2855 41% | 1938 -4% | 1791 -11% | 1881 -7% |
| Seq Write (MB/s) | 1314 | 2687 104% | 2094 59% | 2193 67% | 2354 79% |
| 4K Read (MB/s) | 46.61 | 30.31 -35% | 25.88 -44% | 50.7 9% | 43.42 -7% |
| 4K Write (MB/s) | 90.2 | 96.3 7% | 100.8 12% | 116.8 29% | 104.1 15% |
| 4K-64 Read (MB/s) | 665 | 1460 120% | 1217 83% | 1525 129% | 1805 171% |
| 4K-64 Write (MB/s) | 813 | 1224 51% | 1137 40% | 1958 141% | 1775 118% |
| Access Time Read * (ms) | 0.058 | 0.054 7% | 0.051 12% | 0.07 -21% | 0.049 16% |
| Access Time Write * (ms) | 0.167 | 0.038 77% | 0.107 36% | 0.032 81% | 0.106 37% |
| Score Read (Points) | 913 | 1776 95% | 1437 57% | 1755 92% | 2037 123% |
| Score Write (Points) | 1034 | 1589 54% | 1447 40% | 2294 122% | 2115 105% |
| Score Total (Points) | 2392 | 4259 78% | 3624 52% | 4972 108% | 5215 118% |
| Copy ISO MB/s (MB/s) | 1715 | 2226 30% | 1926 12% | 1877 9% | |
| Copy Program MB/s (MB/s) | 622 | 426.4 -31% | 626 1% | 539 -13% | |
| Copy Game MB/s (MB/s) | 1506 | 1152 -24% | 1533 2% | 1368 -9% | |
| CrystalDiskMark 5.2 / 6 | 4% | -3% | 5% | -10% | |
| Write 4K (MB/s) | 119 | 95.5 -20% | 110.6 -7% | 123.4 4% | 121.7 2% |
| Read 4K (MB/s) | 51.9 | 42.59 -18% | 41.46 -20% | 45.02 -13% | 43.81 -16% |
| Write Seq (MB/s) | 2258 | 2851 26% | 2378 5% | 2526 12% | 1276 -43% |
| Read Seq (MB/s) | 2283 | 2696 18% | 2114 -7% | 2062 -10% | 1183 -48% |
| Write 4K Q32T1 (MB/s) | 491 | 402.6 -18% | 445.4 -9% | 497.9 1% | 527 7% |
| Read 4K Q32T1 (MB/s) | 540 | 443.9 -18% | 509 -6% | 579 7% | 592 10% |
| Write Seq Q32T1 (MB/s) | 2253 | 3420 52% | 2735 21% | 2982 32% | 2379 6% |
| Read Seq Q32T1 (MB/s) | 3172 | 3514 11% | 3206 1% | 3440 8% | 3213 1% |
| Média Total (Programa/Configurações) | 23% /
28% | 12% /
15% | 37% /
41% | 22% /
31% |
* ... menor é melhor

Disk Throttling: DiskSpd Read Loop, Queue Depth 8
| 3DMark 11 | |
| 1280x720 Performance GPU | |
| Eurocom Sky X4C i9-9900KS | |
| Razer Blade Pro 17 RTX 2080 Max-Q | |
| Aorus 17G XB | |
| Razer Blade Pro 17 RTX 2070 Max-Q 300 Hz | |
| MSI GS66 10SGS | |
| MSI RTX 2060 Gaming Z 6G | |
| Dell G5 15 SE 5505 P89F | |
| Asus ASUS ROG Strix SCAR III G731GW-XB74 | |
| Média NVIDIA GeForce RTX 2070 Max-Q (14723 - 27694, n=31) | |
| Razer Blade 15 GTX 1660 Ti | |
| Asus Strix GL703VM-DB74 | |
| MSI GF75 Thin 10SCXR | |
| 1280x720 Performance Combined | |
| Eurocom Sky X4C i9-9900KS | |
| Aorus 17G XB | |
| Razer Blade Pro 17 RTX 2070 Max-Q 300 Hz | |
| MSI RTX 2060 Gaming Z 6G | |
| MSI GS66 10SGS | |
| Dell G5 15 SE 5505 P89F | |
| Média NVIDIA GeForce RTX 2070 Max-Q (9107 - 17603, n=30) | |
| Razer Blade Pro 17 RTX 2080 Max-Q | |
| Razer Blade 15 GTX 1660 Ti | |
| Asus ASUS ROG Strix SCAR III G731GW-XB74 | |
| MSI GF75 Thin 10SCXR | |
| Asus Strix GL703VM-DB74 | |
| 3DMark 11 Performance | 23306 pontos | |
| 3DMark Cloud Gate Standard Score | 48701 pontos | |
| 3DMark Fire Strike Score | 18543 pontos | |
| 3DMark Time Spy Score | 8236 pontos | |
Ajuda | ||
| baixo | média | alto | ultra | |
|---|---|---|---|---|
| The Witcher 3 (2015) | 355.6 | 254.3 | 151.4 | 80.9 |
| Dota 2 Reborn (2015) | 143 | 138 | 135 | 126 |
| X-Plane 11.11 (2018) | 112 | 101 | 85.3 |
| Razer Blade Pro 17 RTX 2070 Max-Q 300 Hz GeForce RTX 2070 Max-Q, i7-10875H, Lite-On CA5-8D512 | Asus ROG Zephyrus S GX701GXR GeForce RTX 2080 Max-Q, i7-9750H, Samsung SSD PM981 MZVLB1T0HALR | MSI GS75 Stealth 9SG GeForce RTX 2080 Max-Q, i7-9750H, 2x Samsung SSD PM981 MZVLB1T0HALR (RAID 0) | Alienware m17 R2 P41E GeForce RTX 2080 Max-Q, i9-9980HK, 2x SK Hynix PC601 NVMe 512 GB (RAID 0) | Aorus 17G XB GeForce RTX 2070 Super Max-Q, i7-10875H, Samsung SSD PM981a MZVLB512HBJQ | Razer Blade Pro 17 RTX 2080 Max-Q GeForce RTX 2080 Max-Q, i7-9750H, Samsung SSD PM981 MZVLB512HAJQ | |
|---|---|---|---|---|---|---|
| Noise | -3% | -6% | -3% | -12% | 1% | |
| desligado / ambiente * (dB) | 28.2 | 30 -6% | 30 -6% | 29.1 -3% | 30 -6% | 28.2 -0% |
| Idle Minimum * (dB) | 28.2 | 32 -13% | 31 -10% | 29.4 -4% | 35 -24% | 28.2 -0% |
| Idle Average * (dB) | 28.2 | 33 -17% | 32 -13% | 29.4 -4% | 36 -28% | 28.2 -0% |
| Idle Maximum * (dB) | 30.5 | 34 -11% | 38 -25% | 31.5 -3% | 41 -34% | 30.8 -1% |
| Load Average * (dB) | 42.2 | 40 5% | 47 -11% | 49.7 -18% | 47 -11% | 42 -0% |
| Witcher 3 ultra * (dB) | 53 | 49 8% | 48 9% | 49.5 7% | 48 9% | 51 4% |
| Load Maximum * (dB) | 55.5 | 50 10% | 49 12% | 53.3 4% | 49 12% | 53 5% |
* ... menor é melhor
Barulho
| Ocioso |
| 28.2 / 28.2 / 30.5 dB |
| Carga |
| 42.2 / 55.5 dB |
 | ||
30 dB silencioso 40 dB(A) audível 50 dB(A) ruidosamente alto |
||
min: | ||
(±) A temperatura máxima no lado superior é 40.8 °C / 105 F, em comparação com a média de 40.4 °C / 105 F , variando de 21.2 a 68.8 °C para a classe Gaming.
(-) A parte inferior aquece até um máximo de 48.4 °C / 119 F, em comparação com a média de 43.2 °C / 110 F
(±) Em uso inativo, a temperatura média para o lado superior é 33.3 °C / 92 F, em comparação com a média do dispositivo de 33.9 °C / ### class_avg_f### F.
(±) Jogando The Witcher 3, a temperatura média para o lado superior é 35.4 °C / 96 F, em comparação com a média do dispositivo de 33.9 °C / ## #class_avg_f### F.
(+) Os apoios para as mãos e o touchpad estão atingindo a temperatura máxima da pele (33.2 °C / 91.8 F) e, portanto, não estão quentes.
(-) A temperatura média da área do apoio para as mãos de dispositivos semelhantes foi 28.8 °C / 83.8 F (-4.4 °C / -8 F).
| desligado | |
| Ocioso | |
| Carga |
|
Key:
min: | |
| Razer Blade Pro 17 RTX 2070 Max-Q 300 Hz i7-10875H, GeForce RTX 2070 Max-Q, Lite-On CA5-8D512, IPS, 1920x1080, 17.3" | Asus ROG Zephyrus S GX701GXR i7-9750H, GeForce RTX 2080 Max-Q, Samsung SSD PM981 MZVLB1T0HALR, IPS, 1920x1080, 17.3" | MSI GS75 Stealth 9SG i7-9750H, GeForce RTX 2080 Max-Q, 2x Samsung SSD PM981 MZVLB1T0HALR (RAID 0), IPS, 1920x1080, 17.3" | Alienware m17 R2 P41E i9-9980HK, GeForce RTX 2080 Max-Q, 2x SK Hynix PC601 NVMe 512 GB (RAID 0), IPS, 1920x1080, 17.3" | Aorus 17G XB i7-10875H, GeForce RTX 2070 Super Max-Q, Samsung SSD PM981a MZVLB512HBJQ, IPS, 1920x1080, 17.3" | Razer Blade Pro 17 4K UHD 120 Hz i7-9750H, GeForce RTX 2080 Max-Q, Samsung SSD PM981 MZVLB1T0HALR, IPS, 3840x2160, 17.3" | |
|---|---|---|---|---|---|---|
| Power Consumption | -14% | 16% | -39% | -3% | -32% | |
| Idle Minimum * (Watt) | 19.6 | 32 -63% | 13 34% | 24.7 -26% | 20 -2% | 34.2 -74% |
| Idle Average * (Watt) | 21.7 | 34 -57% | 17 22% | 35.9 -65% | 23 -6% | 37.2 -71% |
| Idle Maximum * (Watt) | 36.1 | 36 -0% | 25 31% | 69.6 -93% | 38 -5% | 50 -39% |
| Load Average * (Watt) | 115.6 | 95 18% | 96 17% | 141.8 -23% | 105 9% | 106.1 8% |
| Witcher 3 ultra * (Watt) | 157 | 155 1% | 156 1% | 185.8 -18% | 158 -1% | 178.7 -14% |
| Load Maximum * (Watt) | 219.9 | 187 15% | 239 -9% | 235.4 -7% | 243 -11% | 223.6 -2% |
* ... menor é melhor
| Razer Blade Pro 17 RTX 2070 Max-Q 300 Hz i7-10875H, GeForce RTX 2070 Max-Q, 70 Wh | Asus ROG Zephyrus S GX701GXR i7-9750H, GeForce RTX 2080 Max-Q, 76 Wh | MSI GS75 Stealth 9SG i7-9750H, GeForce RTX 2080 Max-Q, 80.25 Wh | Alienware m17 R2 P41E i9-9980HK, GeForce RTX 2080 Max-Q, 76 Wh | Aorus 17G XB i7-10875H, GeForce RTX 2070 Super Max-Q, 94 Wh | Razer Blade Pro 17 4K UHD 120 Hz i7-9750H, GeForce RTX 2080 Max-Q, 70 Wh | |
|---|---|---|---|---|---|---|
| Duração da bateria | -39% | 22% | -2% | 53% | -24% | |
| WiFi v1.3 (h) | 4.9 | 3 -39% | 6 22% | 4.8 -2% | 7.5 53% | 3.7 -24% |
| Reader / Idle (h) | 4.1 | 7.7 | 7.1 | 10 | ||
| Load (h) | 1.2 | 1.2 | 0.5 | 2.2 |
Pro
Contra
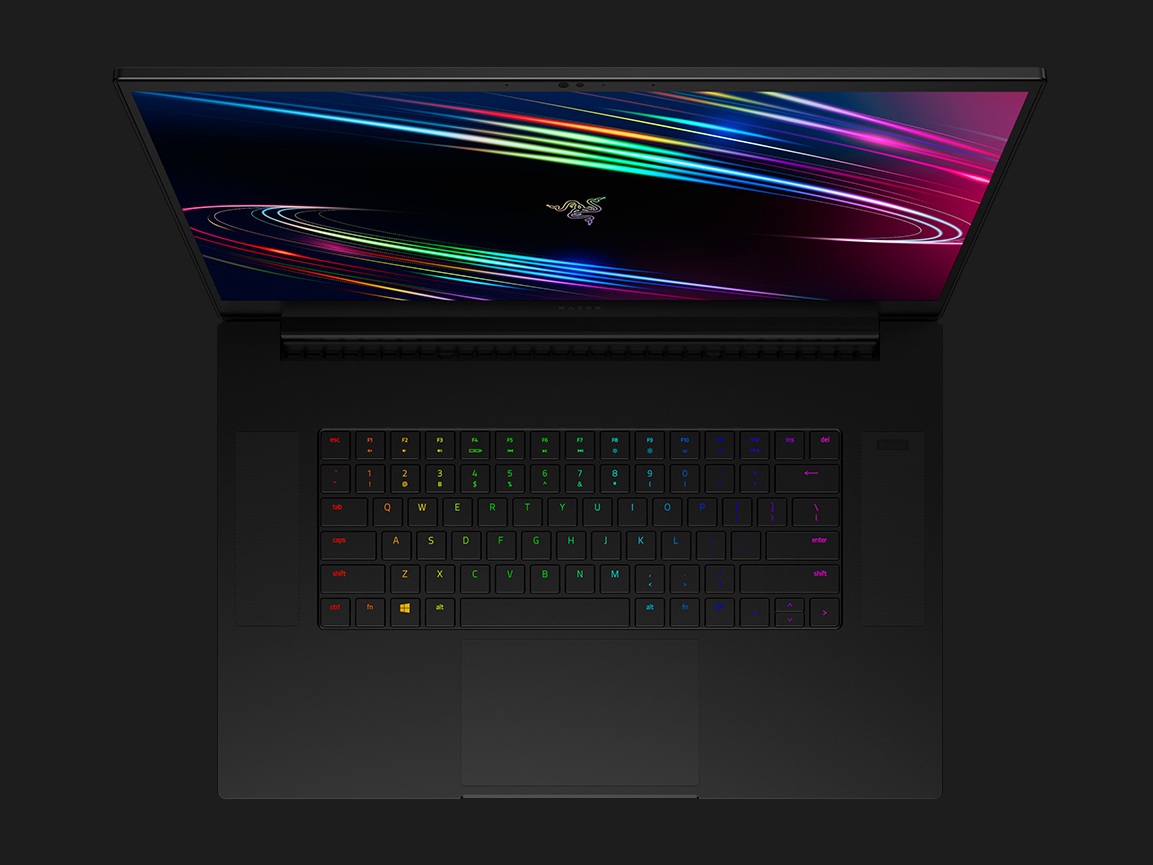
Muito parecido com a forma como o Blade 15 2020 é apenas uma atualização relativamente menor do Blade 15 2019, o Blade Pro 17 2020 é outra atualização menor ao Blade Pro 17 2019. A nova CPU de 8 núcleos, GPUs Super Max-Q e tela de 300 Hz são as principais razões para possuir um modelo 2020 em relação ao modelo 2019, que vem com uma CPU de 6 núcleos, GPU Max-Q e tela de 240 Hz em seu lugar. As atualizações internas melhoram apenas marginalmente a experiência dos jogos, o que significa que os usuários não vão perder muito ao optar pelo modelo do ano passado. Tenha em mente que você não tem que alcançar os 300 FPS ao jogar para aproveitar a tela de 300 Hz.
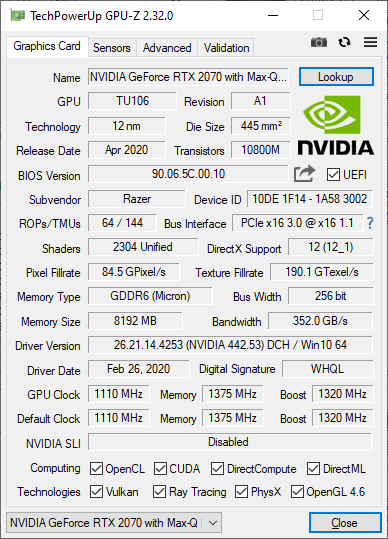
O aspecto mais surpreendente do Blade Pro 17 não é a CPU de 10º geração Core ou a tela de 300 Hz, mas é a rapidez com que o sistema pode fazer funcionar a GPU GeForce RTX 2070 Max-Q. Os resultados do 3DMark são cerca de 20% mais rápidos que a média da GeForce RTX 2070 Max-Q em nosso banco de dados. Assim, o RTX 2070 Max-Q no Blade Pro 17 é capaz de oferecer um desempenho gráfico mais rápido que até mesmo o mais novo RTX 2070 Super Max-Q ou RTX 2080 Super Max-Q em alguns outros portáteis para jogos. Se você vai com este modelo 2020 Blade Pro 17, então você pode pelo menos descansar tranquilo sabendo que é uma das opções mais rápidas lá fora com a GPU GeForce RTX 2070 Max-Q.
A taxa de atualização de 300 Hz é um luxo que somente os jogadores mais exigentes vão realmente querer. Para todos os outros, mesmo 240 Hz será mais do que suficiente. A série Blade Pro 2019 apela melhor para um público mais amplo por este motivo, especialmente porque a versão mais cara de 2020 não oferece tanta vantagem de desempenho ano após ano.
Razer Blade Pro 17 RTX 2070 Max-Q 300 Hz
- 06/27/2020 v7 (old)
Allen Ngo
Price comparison
