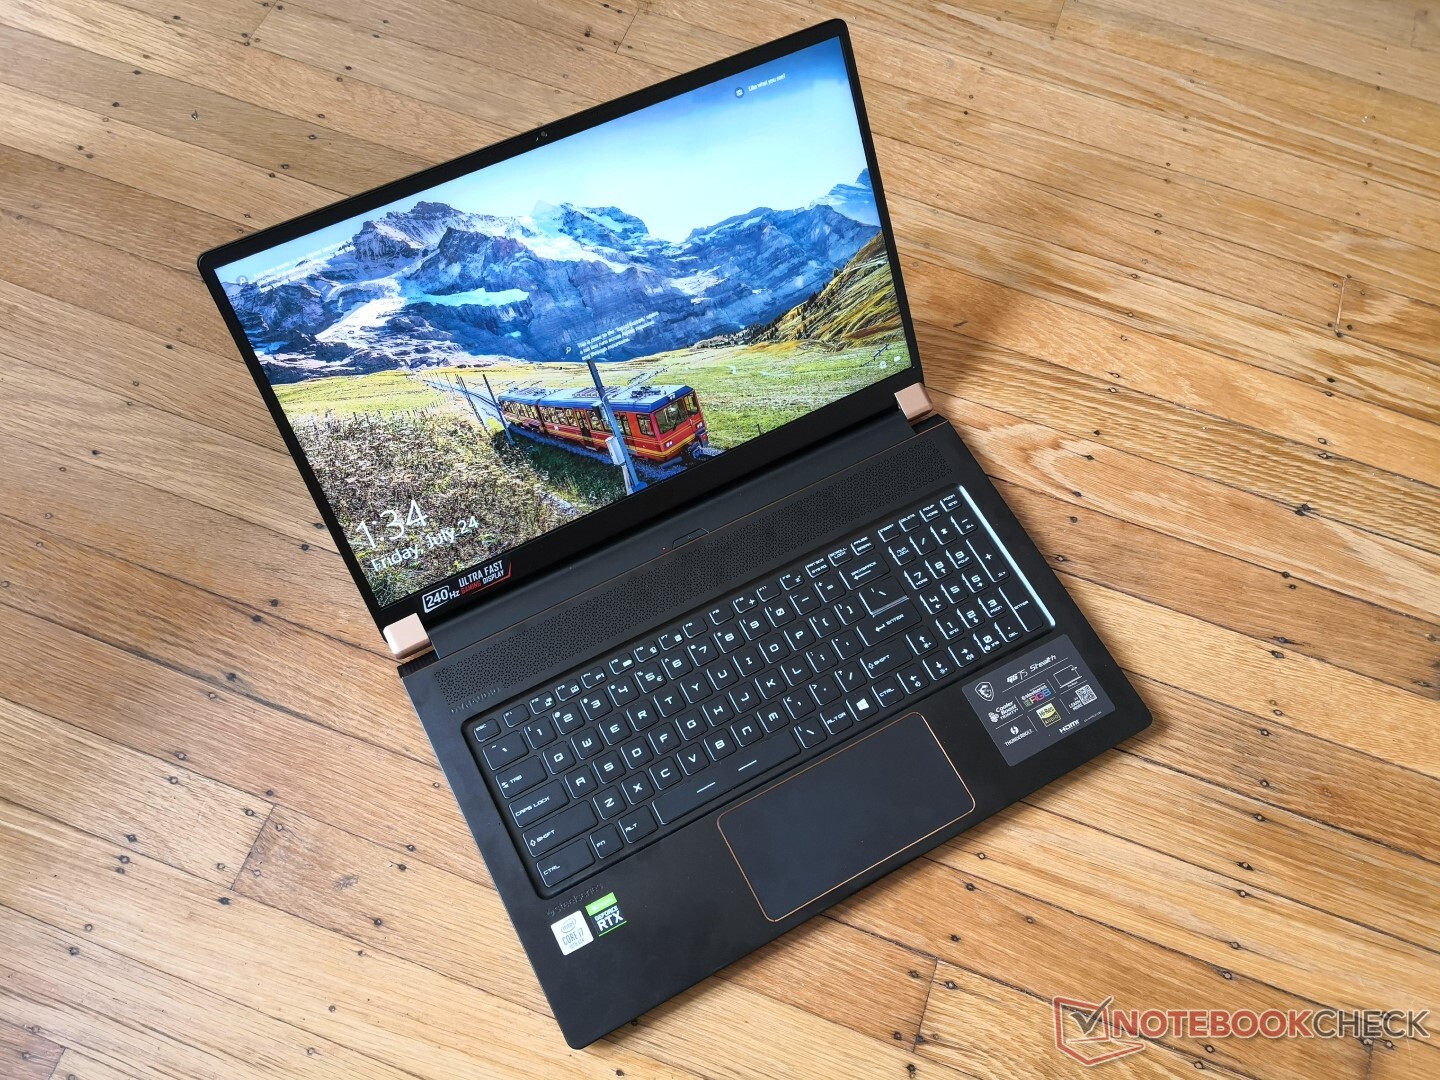
Breve Análise do Portátil MSI GS75 Stealth 10SF: Ótimo desempenho do Core i7-10875H
Avaliação | Data | Modelo | Peso | Altura | Size | Resolução | Preço |
|---|---|---|---|---|---|---|---|
| 83.7 % v7 (old) | 08/2020 | MSI GS75 10SF-609US i7-10875H, GeForce RTX 2070 Max-Q | 2.3 kg | 18.9 mm | 17.30" | 1920x1080 | |
| 87.4 % v7 (old) | 06/2020 | Razer Blade Pro 17 RTX 2070 Max-Q 300 Hz i7-10875H, GeForce RTX 2070 Max-Q | 2.7 kg | 19.9 mm | 17.30" | 1920x1080 | |
| 86.5 % v7 (old) | 05/2020 | Aorus 17G XB i7-10875H, GeForce RTX 2070 Super Max-Q | 2.7 kg | 26 mm | 17.30" | 1920x1080 | |
| 87 % v7 (old) | 04/2020 | Gigabyte Aero 17 HDR XB i7-10875H, GeForce RTX 2070 Super Max-Q | 2.7 kg | 21 mm | 17.30" | 3840x2160 | |
| 84.2 % v7 (old) | 03/2020 | Alienware m17 R2 P41E i9-9980HK, GeForce RTX 2080 Max-Q | 2.6 kg | 20.5 mm | 17.30" | 1920x1080 | |
| 82.4 % v7 (old) | 08/2020 | Asus Zephyrus S17 GX701LXS i7-10875H, GeForce RTX 2080 Super Max-Q | 2.6 kg | 18.7 mm | 17.30" | 1920x1080 |
| SD Card Reader | |
| average JPG Copy Test (av. of 3 runs) | |
| Aorus 17G XB (Toshiba Exceria Pro SDXC 64 GB UHS-II) | |
| Razer Blade Pro 17 RTX 2070 Max-Q 300 Hz (Toshiba Exceria Pro SDXC 64 GB UHS-II) | |
| Gigabyte Aero 17 HDR XB (Toshiba Exceria Pro SDXC 64 GB UHS-II) | |
| MSI GS75 10SF-609US (Toshiba Exceria Pro M501 UHS-II) | |
| MSI GS73 Stealth 8RF-011 (Toshiba Exceria Pro SDXC 64 GB UHS-II) | |
| maximum AS SSD Seq Read Test (1GB) | |
| Aorus 17G XB (Toshiba Exceria Pro SDXC 64 GB UHS-II) | |
| Gigabyte Aero 17 HDR XB (Toshiba Exceria Pro SDXC 64 GB UHS-II) | |
| MSI GS73 Stealth 8RF-011 (Toshiba Exceria Pro SDXC 64 GB UHS-II) | |
| MSI GS75 10SF-609US (Toshiba Exceria Pro M501 UHS-II) | |
| Razer Blade Pro 17 RTX 2070 Max-Q 300 Hz (Toshiba Exceria Pro SDXC 64 GB UHS-II) | |


| |||||||||||||||||||||||||
iluminação: 84 %
iluminação com acumulador: 299.4 cd/m²
Contraste: 966:1 (Preto: 0.31 cd/m²)
ΔE ColorChecker Calman: 1.82 | ∀{0.5-29.43 Ø4.73}
calibrated: 1.59
ΔE Greyscale Calman: 2.7 | ∀{0.09-98 Ø4.97}
99.8% sRGB (Argyll 1.6.3 3D)
67.1% AdobeRGB 1998 (Argyll 1.6.3 3D)
75.1% AdobeRGB 1998 (Argyll 3D)
99.8% sRGB (Argyll 3D)
75.6% Display P3 (Argyll 3D)
Gamma: 2.18
CCT: 6837 K
| MSI GS75 10SF-609US Sharp LQ173M1JW05, IPS, 17.3", 1920x1080 | Razer Blade Pro 17 RTX 2070 Max-Q 300 Hz Sharp LQ173M1JW02, IPS, 17.3", 1920x1080 | Aorus 17G XB AU Optronics B173HAN05.0 (AUO509D), IPS, 17.3", 1920x1080 | Alienware m17 R2 P41E Chi Mei 173HCE, CMN175F, IPS, 17.3", 1920x1080 | Asus ROG Zephyrus S GX701GXR AU Optronics B173HAN05.1, IPS, 17.3", 1920x1080 | MSI GS73 Stealth 8RF-011 CMN N173HHE-G32 (CMN1747), TN, 17.3", 1920x1080 | |
|---|---|---|---|---|---|---|
| Display | -3% | -4% | -4% | -5% | 11% | |
| Display P3 Coverage (%) | 75.6 | 72.2 -4% | 70.6 -7% | 70.8 -6% | 70 -7% | 90.8 20% |
| sRGB Coverage (%) | 99.8 | 98.5 -1% | 97.2 -3% | 98.5 -1% | 96.6 -3% | 99.9 0% |
| AdobeRGB 1998 Coverage (%) | 75.1 | 73 -3% | 72.8 -3% | 72.2 -4% | 72.3 -4% | 85.8 14% |
| Response Times | -29% | -151% | -154% | -14% | -25% | |
| Response Time Grey 50% / Grey 80% * (ms) | 5 ? | 5.6 ? -12% | 16 ? -220% | 17.2 ? -244% | 5.6 ? -12% | 7.8 ? -56% |
| Response Time Black / White * (ms) | 6.6 ? | 9.6 ? -45% | 12 ? -82% | 10.8 ? -64% | 7.6 ? -15% | 6.2 ? 6% |
| PWM Frequency (Hz) | 26320 ? | 25510 ? | ||||
| Screen | -44% | 19% | 18% | 3% | -17% | |
| Brightness middle (cd/m²) | 299.4 | 328 10% | 293 -2% | 384.2 28% | 288 -4% | 262 -12% |
| Brightness (cd/m²) | 299 | 329 10% | 285 -5% | 357 19% | 276 -8% | 261 -13% |
| Brightness Distribution (%) | 84 | 78 -7% | 95 13% | 90 7% | 93 11% | 94 12% |
| Black Level * (cd/m²) | 0.31 | 0.35 -13% | 0.24 23% | 0.29 6% | 0.24 23% | 0.2 35% |
| Contrast (:1) | 966 | 937 -3% | 1221 26% | 1325 37% | 1200 24% | 1310 36% |
| Colorchecker dE 2000 * | 1.82 | 4.74 -160% | 1.27 30% | 1.35 26% | 1.92 -5% | 3.96 -118% |
| Colorchecker dE 2000 max. * | 3.91 | 8.99 -130% | 2.24 43% | 3.45 12% | 4.57 -17% | 7.29 -86% |
| Colorchecker dE 2000 calibrated * | 1.59 | 2.12 -33% | 1.06 33% | 1.42 11% | 1.14 28% | 2.18 -37% |
| Greyscale dE 2000 * | 2.7 | 6.8 -152% | 1.34 50% | 1.2 56% | 3.08 -14% | 3.09 -14% |
| Gamma | 2.18 101% | 2.2 100% | 2.38 92% | 2.23 99% | 2.42 91% | 2.48 89% |
| CCT | 6837 95% | 6446 101% | 6542 99% | 6580 99% | 7055 92% | 6977 93% |
| Color Space (Percent of AdobeRGB 1998) (%) | 67.1 | 64.8 -3% | 73 9% | 65.5 -2% | 65 -3% | 76 13% |
| Color Space (Percent of sRGB) (%) | 99.8 | 98.6 -1% | 94 -6% | 98.5 -1% | 96 -4% | 100 0% |
| Média Total (Programa/Configurações) | -25% /
-34% | -45% /
-6% | -47% /
-8% | -5% /
-1% | -10% /
-13% |
* ... menor é melhor
Exibir tempos de resposta
| ↔ Tempo de resposta preto para branco | ||
|---|---|---|
| 6.6 ms ... ascensão ↗ e queda ↘ combinadas | ↗ 2.6 ms ascensão | 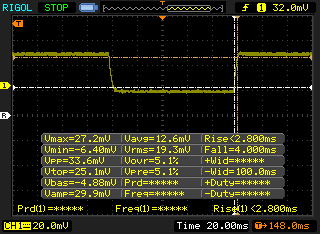 |
| ↘ 4 ms queda | ||
| A tela mostra taxas de resposta muito rápidas em nossos testes e deve ser muito adequada para jogos em ritmo acelerado. Em comparação, todos os dispositivos testados variam de 0.1 (mínimo) a 240 (máximo) ms. » 21 % de todos os dispositivos são melhores. Isso significa que o tempo de resposta medido é melhor que a média de todos os dispositivos testados (19.9 ms). | ||
| ↔ Tempo de resposta 50% cinza a 80% cinza | ||
| 5 ms ... ascensão ↗ e queda ↘ combinadas | ↗ 2.2 ms ascensão | 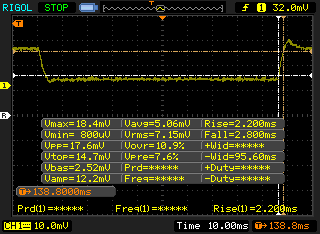 |
| ↘ 2.8 ms queda | ||
| A tela mostra taxas de resposta muito rápidas em nossos testes e deve ser muito adequada para jogos em ritmo acelerado. Em comparação, todos os dispositivos testados variam de 0.165 (mínimo) a 636 (máximo) ms. » 17 % de todos os dispositivos são melhores. Isso significa que o tempo de resposta medido é melhor que a média de todos os dispositivos testados (31.1 ms). | ||
Cintilação da tela / PWM (modulação por largura de pulso)
| Tela tremeluzindo / PWM não detectado | 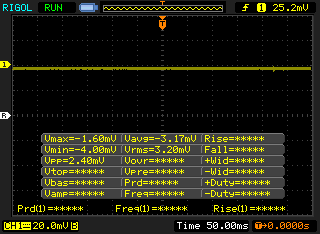 | ||
[pwm_comparison] Em comparação: 52 % de todos os dispositivos testados não usam PWM para escurecer a tela. Se PWM foi detectado, uma média de 7794 (mínimo: 5 - máximo: 343500) Hz foi medida. | |||
Cinebench R15: CPU Multi 64Bit | CPU Single 64Bit
Blender: v2.79 BMW27 CPU
7-Zip 18.03: 7z b 4 -mmt1 | 7z b 4
Geekbench 5.5: Single-Core | Multi-Core
HWBOT x265 Benchmark v2.2: 4k Preset
LibreOffice : 20 Documents To PDF
R Benchmark 2.5: Overall mean
| Cinebench R20 / CPU (Multi Core) | |
| Eurocom Sky X4C i9-9900KS | |
| Asus Zephyrus G14 GA401IV | |
| Asus TUF A17 FA706IU-AS76 | |
| MSI GS75 10SF-609US | |
| Asus Strix Scar 17 G732LXS | |
| MSI GE75 9SG | |
| Média Intel Core i7-10875H (1986 - 4176, n=32) | |
| Acer Nitro 5 AN515-44-R5FT | |
| MSI GE75 Raider 10SE-008US | |
| Asus ROG Zephyrus S GX701GXR | |
| MSI GF75 Thin 10SCXR | |
| Cinebench R20 / CPU (Single Core) | |
| Eurocom Sky X4C i9-9900KS | |
| Asus Zephyrus G14 GA401IV | |
| Asus Strix Scar 17 G732LXS | |
| Média Intel Core i7-10875H (430 - 524, n=32) | |
| Asus TUF A17 FA706IU-AS76 | |
| MSI GS75 10SF-609US | |
| MSI GE75 Raider 10SE-008US | |
| MSI GE75 9SG | |
| MSI GF75 Thin 10SCXR | |
| Acer Nitro 5 AN515-44-R5FT | |
| Asus ROG Zephyrus S GX701GXR | |
| Cinebench R15 / CPU Multi 64Bit | |
| Eurocom Sky X4C i9-9900KS | |
| Asus Zephyrus G14 GA401IV | |
| Asus TUF A17 FA706IU-AS76 | |
| Asus Strix Scar 17 G732LXS | |
| MSI GE75 9SG | |
| MSI GS75 10SF-609US | |
| Média Intel Core i7-10875H (1003 - 1833, n=38) | |
| Acer Nitro 5 AN515-44-R5FT | |
| MSI GE75 Raider 10SE-008US | |
| Asus ROG Zephyrus S GX701GXR | |
| MSI GF75 Thin 10SCXR | |
| Cinebench R15 / CPU Single 64Bit | |
| Eurocom Sky X4C i9-9900KS | |
| Média Intel Core i7-10875H (190 - 220, n=37) | |
| Asus Strix Scar 17 G732LXS | |
| MSI GS75 10SF-609US | |
| Asus Zephyrus G14 GA401IV | |
| MSI GE75 9SG | |
| Asus TUF A17 FA706IU-AS76 | |
| MSI GE75 Raider 10SE-008US | |
| MSI GF75 Thin 10SCXR | |
| Acer Nitro 5 AN515-44-R5FT | |
| Asus ROG Zephyrus S GX701GXR | |
| Blender / v2.79 BMW27 CPU | |
| MSI GF75 Thin 10SCXR | |
| MSI GE75 Raider 10SE-008US | |
| Acer Nitro 5 AN515-44-R5FT | |
| Média Intel Core i7-10875H (259 - 535, n=30) | |
| Asus Zephyrus G14 GA401IV | |
| MSI GE75 9SG | |
| Asus Strix Scar 17 G732LXS | |
| MSI GS75 10SF-609US | |
| Asus TUF A17 FA706IU-AS76 | |
| Eurocom Sky X4C i9-9900KS | |
| 7-Zip 18.03 / 7z b 4 -mmt1 | |
| Eurocom Sky X4C i9-9900KS | |
| Média Intel Core i7-10875H (5071 - 5780, n=31) | |
| Asus Strix Scar 17 G732LXS | |
| MSI GS75 10SF-609US | |
| MSI GE75 Raider 10SE-008US | |
| MSI GE75 9SG | |
| Asus TUF A17 FA706IU-AS76 | |
| MSI GF75 Thin 10SCXR | |
| Asus Zephyrus G14 GA401IV | |
| Acer Nitro 5 AN515-44-R5FT | |
| 7-Zip 18.03 / 7z b 4 | |
| Eurocom Sky X4C i9-9900KS | |
| Asus TUF A17 FA706IU-AS76 | |
| Asus Zephyrus G14 GA401IV | |
| MSI GS75 10SF-609US | |
| MSI GE75 9SG | |
| Asus Strix Scar 17 G732LXS | |
| Média Intel Core i7-10875H (29844 - 49562, n=31) | |
| Acer Nitro 5 AN515-44-R5FT | |
| MSI GE75 Raider 10SE-008US | |
| MSI GF75 Thin 10SCXR | |
| Geekbench 5.5 / Single-Core | |
| Eurocom Sky X4C i9-9900KS | |
| Média Intel Core i7-10875H (1233 - 1371, n=29) | |
| Asus Strix Scar 17 G732LXS | |
| MSI GS75 10SF-609US | |
| MSI GE75 Raider 10SE-008US | |
| Asus Zephyrus G14 GA401IV | |
| Asus TUF A17 FA706IU-AS76 | |
| MSI GF75 Thin 10SCXR | |
| Acer Nitro 5 AN515-44-R5FT | |
| Geekbench 5.5 / Multi-Core | |
| Eurocom Sky X4C i9-9900KS | |
| Asus Strix Scar 17 G732LXS | |
| MSI GS75 10SF-609US | |
| Asus TUF A17 FA706IU-AS76 | |
| Média Intel Core i7-10875H (5715 - 8620, n=29) | |
| Asus Zephyrus G14 GA401IV | |
| MSI GE75 Raider 10SE-008US | |
| Acer Nitro 5 AN515-44-R5FT | |
| MSI GF75 Thin 10SCXR | |
| HWBOT x265 Benchmark v2.2 / 4k Preset | |
| Eurocom Sky X4C i9-9900KS | |
| MSI GS75 10SF-609US | |
| Asus Strix Scar 17 G732LXS | |
| Asus TUF A17 FA706IU-AS76 | |
| Asus Zephyrus G14 GA401IV | |
| MSI GE75 9SG | |
| Média Intel Core i7-10875H (7.27 - 14.1, n=27) | |
| MSI GE75 Raider 10SE-008US | |
| Acer Nitro 5 AN515-44-R5FT | |
| MSI GF75 Thin 10SCXR | |
| LibreOffice / 20 Documents To PDF | |
| Acer Nitro 5 AN515-44-R5FT | |
| Asus TUF A17 FA706IU-AS76 | |
| MSI GF75 Thin 10SCXR | |
| MSI GE75 Raider 10SE-008US | |
| Asus Strix Scar 17 G732LXS | |
| Média Intel Core i7-10875H (30.2 - 84.3, n=30) | |
| MSI GS75 10SF-609US | |
| R Benchmark 2.5 / Overall mean | |
| MSI GF75 Thin 10SCXR | |
| Acer Nitro 5 AN515-44-R5FT | |
| MSI GE75 Raider 10SE-008US | |
| Asus TUF A17 FA706IU-AS76 | |
| MSI GS75 10SF-609US | |
| Média Intel Core i7-10875H (0.546 - 0.662, n=29) | |
| Asus Strix Scar 17 G732LXS | |
* ... menor é melhor
| PCMark 8 | |
| Home Score Accelerated v2 | |
| Asus ROG Zephyrus S GX701GXR | |
| Razer Blade Pro 17 RTX 2070 Max-Q 300 Hz | |
| Média Intel Core i7-10875H, NVIDIA GeForce RTX 2070 Max-Q (4388 - 5217, n=3) | |
| MSI GS75 10SF-609US | |
| MSI GS73 Stealth 8RF-011 | |
| Alienware m17 R2 P41E | |
| Work Score Accelerated v2 | |
| Asus ROG Zephyrus S GX701GXR | |
| Razer Blade Pro 17 RTX 2070 Max-Q 300 Hz | |
| MSI GS75 10SF-609US | |
| Média Intel Core i7-10875H, NVIDIA GeForce RTX 2070 Max-Q (5551 - 6317, n=3) | |
| Alienware m17 R2 P41E | |
| MSI GS73 Stealth 8RF-011 | |
| PCMark 8 Home Score Accelerated v2 | 4780 pontos | |
| PCMark 8 Work Score Accelerated v2 | 6191 pontos | |
| PCMark 10 Score | 6582 pontos | |
Ajuda | ||
| DPC Latencies / LatencyMon - interrupt to process latency (max), Web, Youtube, Prime95 | |
| Asus TUF A17 FA706IU-AS76 | |
| Aorus 17G XB | |
| Asus Strix Scar 17 G732LXS | |
| MSI GF75 Thin 10SCXR | |
| Gigabyte Aero 17 HDR XB | |
| MSI GE75 Raider 10SE-008US | |
| Razer Blade Pro 17 RTX 2070 Max-Q 300 Hz | |
| MSI GS75 10SF-609US | |
* ... menor é melhor
| MSI GS75 10SF-609US WDC PC SN730 SDBPNTY-512G | Razer Blade Pro 17 RTX 2070 Max-Q 300 Hz Lite-On CA5-8D512 | Aorus 17G XB Samsung SSD PM981a MZVLB512HBJQ | Alienware m17 R2 P41E 2x SK Hynix PC601 NVMe 512 GB (RAID 0) | Asus ROG Zephyrus S GX701GXR Samsung SSD PM981 MZVLB1T0HALR | MSI GS73 Stealth 8RF-011 Samsung PM961 MZVLW256HEHP | |
|---|---|---|---|---|---|---|
| AS SSD | -30% | 29% | -9% | 8% | -10% | |
| Seq Read (MB/s) | 2327 | 2019 -13% | 1791 -23% | 1938 -17% | 1662 -29% | 1749 -25% |
| Seq Write (MB/s) | 2479 | 1314 -47% | 2193 -12% | 2094 -16% | 2266 -9% | 1173 -53% |
| 4K Read (MB/s) | 45.46 | 46.61 3% | 50.7 12% | 25.88 -43% | 46.86 3% | 42.81 -6% |
| 4K Write (MB/s) | 157.4 | 90.2 -43% | 116.8 -26% | 100.8 -36% | 101.1 -36% | 98.4 -37% |
| 4K-64 Read (MB/s) | 1050 | 665 -37% | 1525 45% | 1217 16% | 1419 35% | 1238 18% |
| 4K-64 Write (MB/s) | 938 | 813 -13% | 1958 109% | 1137 21% | 1746 86% | 691 -26% |
| Access Time Read * (ms) | 0.076 | 0.058 24% | 0.07 8% | 0.051 33% | 0.047 38% | 0.077 -1% |
| Access Time Write * (ms) | 0.071 | 0.167 -135% | 0.032 55% | 0.107 -51% | 0.037 48% | 0.038 46% |
| Score Read (Points) | 1328 | 913 -31% | 1755 32% | 1437 8% | 1632 23% | 1456 10% |
| Score Write (Points) | 1343 | 1034 -23% | 2294 71% | 1447 8% | 2074 54% | 906 -33% |
| Score Total (Points) | 3366 | 2392 -29% | 4972 48% | 3624 8% | 4576 36% | 3083 -8% |
| Copy ISO MB/s (MB/s) | 3092 | 1715 -45% | 1926 -38% | 1398 -55% | ||
| Copy Program MB/s (MB/s) | 733 | 622 -15% | 626 -15% | 438.9 -40% | ||
| Copy Game MB/s (MB/s) | 1683 | 1506 -11% | 1533 -9% | 996 -41% | ||
| CrystalDiskMark 5.2 / 6 | -7% | -3% | -10% | -29% | -38% | |
| Write 4K (MB/s) | 177.9 | 119 -33% | 123.4 -31% | 110.6 -38% | 96.1 -46% | 90.1 -49% |
| Read 4K (MB/s) | 47.42 | 51.9 9% | 45.02 -5% | 41.46 -13% | 40.86 -14% | 39.07 -18% |
| Write Seq (MB/s) | 2707 | 2258 -17% | 2526 -7% | 2378 -12% | 1317 -51% | 1192 -56% |
| Read Seq (MB/s) | 2369 | 2283 -4% | 2062 -13% | 2114 -11% | 1030 -57% | 1135 -52% |
| Write 4K Q32T1 (MB/s) | 427.8 | 491 15% | 497.9 16% | 445.4 4% | 350.4 -18% | 290.9 -32% |
| Read 4K Q32T1 (MB/s) | 543 | 540 -1% | 579 7% | 509 -6% | 404.1 -26% | 343.9 -37% |
| Write Seq Q32T1 (MB/s) | 2703 | 2253 -17% | 2982 10% | 2735 1% | 2396 -11% | 1194 -56% |
| Read Seq Q32T1 (MB/s) | 3387 | 3172 -6% | 3440 2% | 3206 -5% | 3194 -6% | 3199 -6% |
| Média Total (Programa/Configurações) | -19% /
-21% | 13% /
16% | -10% /
-10% | -11% /
-5% | -24% /
-22% |
* ... menor é melhor

Disk Throttling: DiskSpd Read Loop, Queue Depth 8
| 3DMark 11 | |
| 1280x720 Performance GPU | |
| Asus Strix Scar 17 G732LXS | |
| MSI RTX 2070 Gaming Z 8G | |
| Alienware m17 R2 P41E | |
| Aorus 17G XB | |
| MSI RTX 2060 Gaming Z 6G | |
| Dell G5 15 SE 5505 P89F | |
| MSI GE75 Raider 10SE-008US | |
| Asus ASUS ROG Strix SCAR III G731GW-XB74 | |
| MSI GS75 10SF-609US | |
| MSI GE73 8RF-008 Raider RGB | |
| Média NVIDIA GeForce RTX 2070 Max-Q (14723 - 27694, n=31) | |
| Asus ROG Strix G GL731GU-RB74 | |
| HP Omen 15-dc0015ng | |
| MSI GF75 Thin 10SCXR | |
| 1280x720 Performance Combined | |
| Asus Strix Scar 17 G732LXS | |
| MSI GS75 10SF-609US | |
| Aorus 17G XB | |
| Alienware m17 R2 P41E | |
| MSI RTX 2060 Gaming Z 6G | |
| MSI RTX 2070 Gaming Z 8G | |
| MSI GE75 Raider 10SE-008US | |
| Dell G5 15 SE 5505 P89F | |
| Asus ROG Strix G GL731GU-RB74 | |
| Média NVIDIA GeForce RTX 2070 Max-Q (9107 - 17603, n=30) | |
| HP Omen 15-dc0015ng | |
| MSI GE73 8RF-008 Raider RGB | |
| Asus ASUS ROG Strix SCAR III G731GW-XB74 | |
| MSI GF75 Thin 10SCXR | |
| 3DMark 11 Performance | 22303 pontos | |
| 3DMark Cloud Gate Standard Score | 51136 pontos | |
| 3DMark Fire Strike Score | 17066 pontos | |
| 3DMark Time Spy Score | 7392 pontos | |
Ajuda | ||
| The Witcher 3 - 1920x1080 Ultra Graphics & Postprocessing (HBAO+) | |
| MSI GE75 9SG | |
| Asus Strix Scar 17 G732LXS | |
| MSI RTX 2070 Gaming Z 8G | |
| Asus Zephyrus S17 GX701LXS | |
| Razer Blade Pro 17 RTX 2070 Max-Q 300 Hz | |
| Asus ROG Zephyrus S GX701GXR | |
| Alienware m17 R2 P41E | |
| MSI GS75 Stealth 9SG | |
| Gigabyte Aero 17 HDR XB | |
| MSI RTX 2060 Gaming Z 6G | |
| MSI GS75 10SF-609US | |
| Média NVIDIA GeForce RTX 2070 Max-Q (56 - 83.8, n=31) | |
| Dell G5 15 SE 5505 P89F | |
| MSI GE75 Raider 10SE-008US | |
| Asus ASUS ROG Strix SCAR III G731GW-XB74 | |
| MSI GE73 8RF-008 Raider RGB | |
| Asus Zephyrus G14 GA401IV | |
| Dell XPS 17 9700 Core i7 RTX 2060 Max-Q | |
| Asus TUF A17 FA706IU-AS76 | |
| HP Omen 15-dc0015ng | |
| Asus ROG Strix G GL731GU-RB74 | |
| MSI GS73 Stealth 8RF-011 | |
| Acer Nitro 5 AN515-44-R5FT | |
| MSI GF75 Thin 10SCXR | |
| baixo | média | alto | ultra | |
|---|---|---|---|---|
| The Witcher 3 (2015) | 349.7 | 231.3 | 131.3 | 67.5 |
| Dota 2 Reborn (2015) | 164 | 141 | 133 | 126 |
| X-Plane 11.11 (2018) | 112 | 100 | 83.7 | |
| Shadow of the Tomb Raider (2018) | 161 | 110 | 98 | 89 |
| MSI GS75 10SF-609US GeForce RTX 2070 Max-Q, i7-10875H, WDC PC SN730 SDBPNTY-512G | Razer Blade Pro 17 RTX 2070 Max-Q 300 Hz GeForce RTX 2070 Max-Q, i7-10875H, Lite-On CA5-8D512 | Aorus 17G XB GeForce RTX 2070 Super Max-Q, i7-10875H, Samsung SSD PM981a MZVLB512HBJQ | Alienware m17 R2 P41E GeForce RTX 2080 Max-Q, i9-9980HK, 2x SK Hynix PC601 NVMe 512 GB (RAID 0) | Asus ROG Zephyrus S GX701GXR GeForce RTX 2080 Max-Q, i7-9750H, Samsung SSD PM981 MZVLB1T0HALR | MSI GS73 Stealth 8RF-011 GeForce GTX 1070 Max-Q, i7-8750H, Samsung PM961 MZVLW256HEHP | |
|---|---|---|---|---|---|---|
| Noise | 6% | -5% | 3% | 2% | 4% | |
| desligado / ambiente * (dB) | 26.2 | 28.2 -8% | 30 -15% | 29.1 -11% | 30 -15% | 30 -15% |
| Idle Minimum * (dB) | 31.2 | 28.2 10% | 35 -12% | 29.4 6% | 32 -3% | 30 4% |
| Idle Average * (dB) | 31.4 | 28.2 10% | 36 -15% | 29.4 6% | 33 -5% | 34 -8% |
| Idle Maximum * (dB) | 34 | 30.5 10% | 41 -21% | 31.5 7% | 34 -0% | 36 -6% |
| Load Average * (dB) | 49.5 | 42.2 15% | 47 5% | 49.7 -0% | 40 19% | 43 13% |
| Witcher 3 ultra * (dB) | 50.6 | 53 -5% | 48 5% | 49.5 2% | 49 3% | 45 11% |
| Load Maximum * (dB) | 60.7 | 55.5 9% | 49 19% | 53.3 12% | 50 18% | 45 26% |
* ... menor é melhor
Barulho
| Ocioso |
| 31.2 / 31.4 / 34 dB |
| Carga |
| 49.5 / 60.7 dB |
 | ||
30 dB silencioso 40 dB(A) audível 50 dB(A) ruidosamente alto |
||
min: | ||
(-) A temperatura máxima no lado superior é 49.8 °C / 122 F, em comparação com a média de 40.4 °C / 105 F , variando de 21.2 a 68.8 °C para a classe Gaming.
(-) A parte inferior aquece até um máximo de 55.6 °C / 132 F, em comparação com a média de 43.2 °C / 110 F
(+) Em uso inativo, a temperatura média para o lado superior é 25.9 °C / 79 F, em comparação com a média do dispositivo de 33.9 °C / ### class_avg_f### F.
(±) Jogando The Witcher 3, a temperatura média para o lado superior é 34.8 °C / 95 F, em comparação com a média do dispositivo de 33.9 °C / ## #class_avg_f### F.
(+) Os apoios para as mãos e o touchpad estão atingindo a temperatura máxima da pele (33.8 °C / 92.8 F) e, portanto, não estão quentes.
(-) A temperatura média da área do apoio para as mãos de dispositivos semelhantes foi 28.8 °C / 83.8 F (-5 °C / -9 F).
MSI GS75 10SF-609US análise de áudio
(+) | os alto-falantes podem tocar relativamente alto (###valor### dB)
Graves 100 - 315Hz
(-) | quase nenhum baixo - em média 28.5% menor que a mediana
(+) | o baixo é linear (3% delta para a frequência anterior)
Médios 400 - 2.000 Hz
(+) | médios equilibrados - apenas 4.8% longe da mediana
(+) | médios são lineares (6.3% delta para frequência anterior)
Altos 2 - 16 kHz
(+) | agudos equilibrados - apenas 1.5% longe da mediana
(+) | os máximos são lineares (2.6% delta da frequência anterior)
Geral 100 - 16.000 Hz
(±) | a linearidade do som geral é média (17.8% diferença em relação à mediana)
Comparado com a mesma classe
» 53% de todos os dispositivos testados nesta classe foram melhores, 10% semelhantes, 37% piores
» O melhor teve um delta de 6%, a média foi 18%, o pior foi 132%
Comparado com todos os dispositivos testados
» 36% de todos os dispositivos testados foram melhores, 8% semelhantes, 56% piores
» O melhor teve um delta de 4%, a média foi 24%, o pior foi 134%
Apple MacBook 12 (Early 2016) 1.1 GHz análise de áudio
(+) | os alto-falantes podem tocar relativamente alto (###valor### dB)
Graves 100 - 315Hz
(±) | graves reduzidos - em média 11.3% menor que a mediana
(±) | a linearidade dos graves é média (14.2% delta para a frequência anterior)
Médios 400 - 2.000 Hz
(+) | médios equilibrados - apenas 2.4% longe da mediana
(+) | médios são lineares (5.5% delta para frequência anterior)
Altos 2 - 16 kHz
(+) | agudos equilibrados - apenas 2% longe da mediana
(+) | os máximos são lineares (4.5% delta da frequência anterior)
Geral 100 - 16.000 Hz
(+) | o som geral é linear (10.2% diferença em relação à mediana)
Comparado com a mesma classe
» 7% de todos os dispositivos testados nesta classe foram melhores, 2% semelhantes, 91% piores
» O melhor teve um delta de 5%, a média foi 18%, o pior foi 53%
Comparado com todos os dispositivos testados
» 5% de todos os dispositivos testados foram melhores, 1% semelhantes, 94% piores
» O melhor teve um delta de 4%, a média foi 24%, o pior foi 134%
| desligado | |
| Ocioso | |
| Carga |
|
Key:
min: | |
| MSI GS75 10SF-609US i7-10875H, GeForce RTX 2070 Max-Q, WDC PC SN730 SDBPNTY-512G, IPS, 1920x1080, 17.3" | Razer Blade Pro 17 RTX 2070 Max-Q 300 Hz i7-10875H, GeForce RTX 2070 Max-Q, Lite-On CA5-8D512, IPS, 1920x1080, 17.3" | Aorus 17G XB i7-10875H, GeForce RTX 2070 Super Max-Q, Samsung SSD PM981a MZVLB512HBJQ, IPS, 1920x1080, 17.3" | Asus ROG Zephyrus S GX701GXR i7-9750H, GeForce RTX 2080 Max-Q, Samsung SSD PM981 MZVLB1T0HALR, IPS, 1920x1080, 17.3" | MSI GS73 Stealth 8RF-011 i7-8750H, GeForce GTX 1070 Max-Q, Samsung PM961 MZVLW256HEHP, TN, 1920x1080, 17.3" | MSI GS75 Stealth 9SG i7-9750H, GeForce RTX 2080 Max-Q, 2x Samsung SSD PM981 MZVLB1T0HALR (RAID 0), IPS, 1920x1080, 17.3" | |
|---|---|---|---|---|---|---|
| Power Consumption | 1% | -2% | -14% | 28% | 17% | |
| Idle Minimum * (Watt) | 19.2 | 19.6 -2% | 20 -4% | 32 -67% | 8 58% | 13 32% |
| Idle Average * (Watt) | 22.4 | 21.7 3% | 23 -3% | 34 -52% | 14 37% | 17 24% |
| Idle Maximum * (Watt) | 34.7 | 36.1 -4% | 38 -10% | 36 -4% | 22 37% | 25 28% |
| Load Average * (Watt) | 106.7 | 115.6 -8% | 105 2% | 95 11% | 92 14% | 96 10% |
| Witcher 3 ultra * (Watt) | 160.5 | 157 2% | 158 2% | 155 3% | 154 4% | 156 3% |
| Load Maximum * (Watt) | 248.7 | 219.9 12% | 243 2% | 187 25% | 207 17% | 239 4% |
* ... menor é melhor
| MSI GS75 10SF-609US i7-10875H, GeForce RTX 2070 Max-Q, 80.25 Wh | Razer Blade Pro 17 RTX 2070 Max-Q 300 Hz i7-10875H, GeForce RTX 2070 Max-Q, 70 Wh | Aorus 17G XB i7-10875H, GeForce RTX 2070 Super Max-Q, 94 Wh | Alienware m17 R2 P41E i9-9980HK, GeForce RTX 2080 Max-Q, 76 Wh | Asus ROG Zephyrus S GX701GXR i7-9750H, GeForce RTX 2080 Max-Q, 76 Wh | MSI GS73 Stealth 8RF-011 i7-8750H, GeForce GTX 1070 Max-Q, 51 Wh | |
|---|---|---|---|---|---|---|
| Duração da bateria | 0% | 8% | -36% | -54% | -47% | |
| Reader / Idle (h) | 8.6 | 10 16% | 7.1 -17% | 4.1 -52% | 5.8 -33% | |
| WiFi v1.3 (h) | 4.9 | 4.9 0% | 7.5 53% | 4.8 -2% | 3 -39% | 3.3 -33% |
| Load (h) | 4.1 | 2.2 -46% | 0.5 -88% | 1.2 -71% | 1 -76% |
Pro
Contra

A maior fortaleza do GS75 é o seu alto desempenho por peso. Você não encontrará outro portátil para jogos de 17,3 polegadas com Core i9 e gráficos GeForce RTX 2080 Max-Q que são tão leves quanto o nosso MSI.
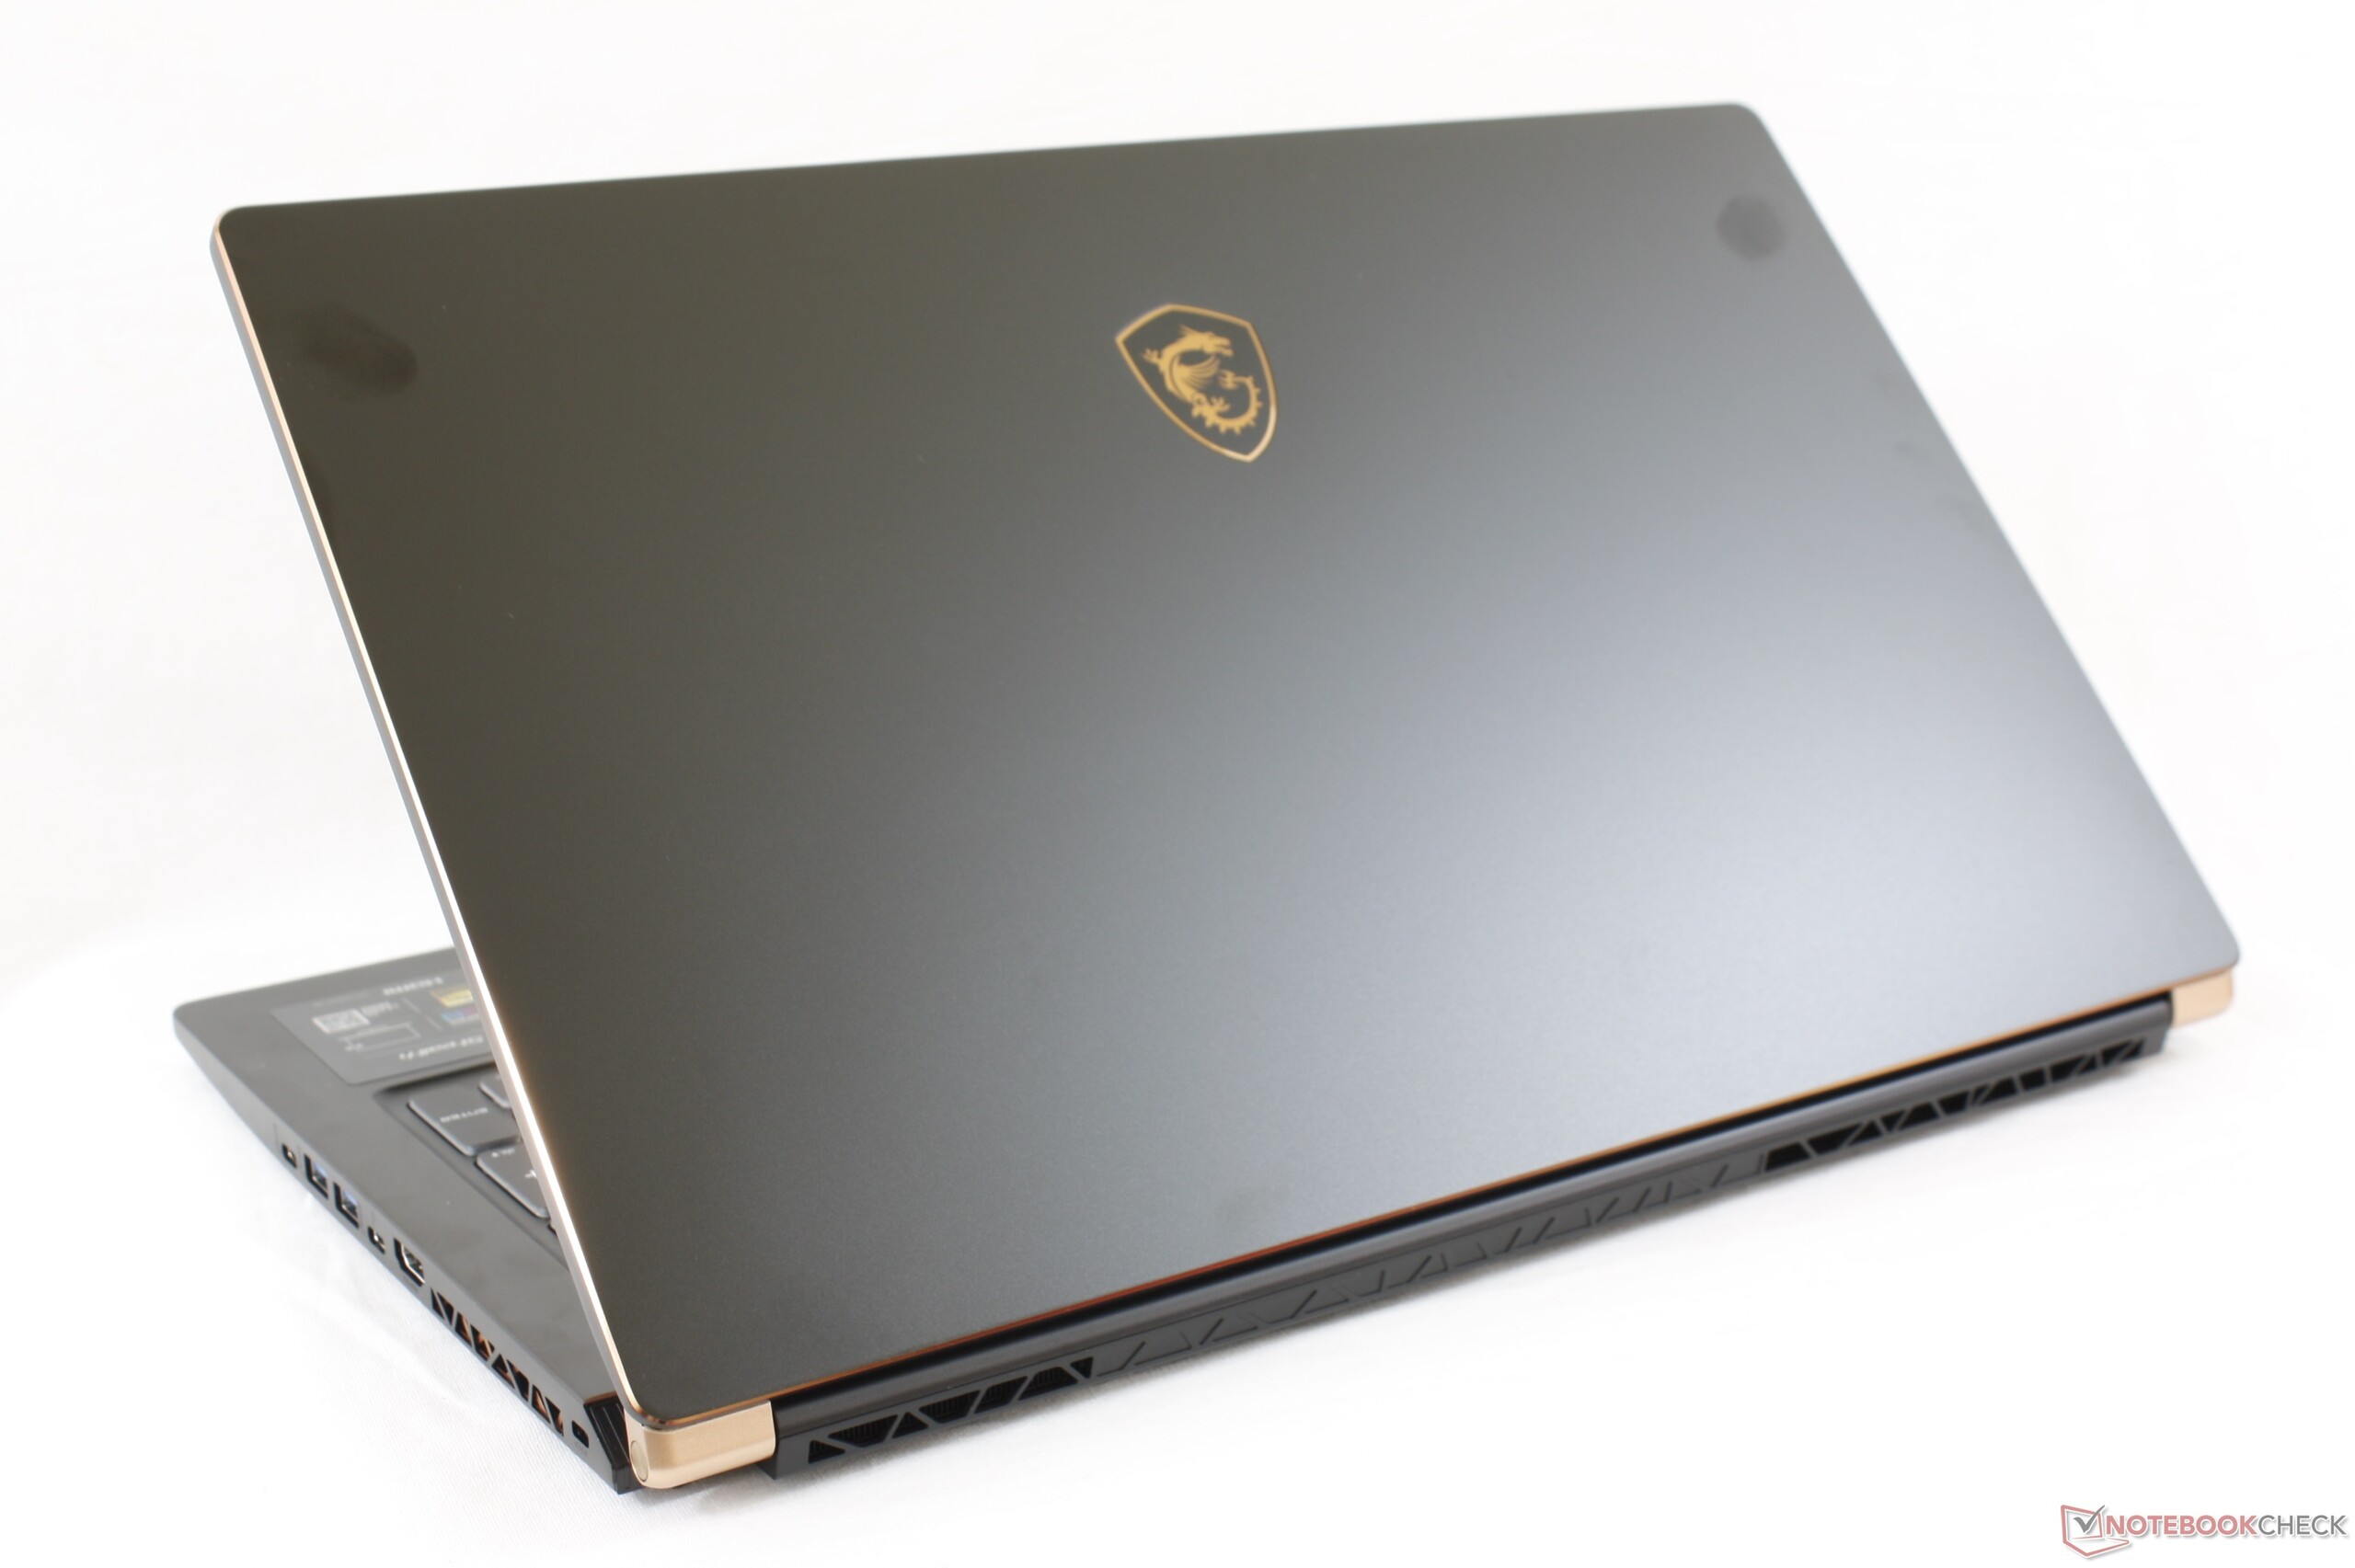
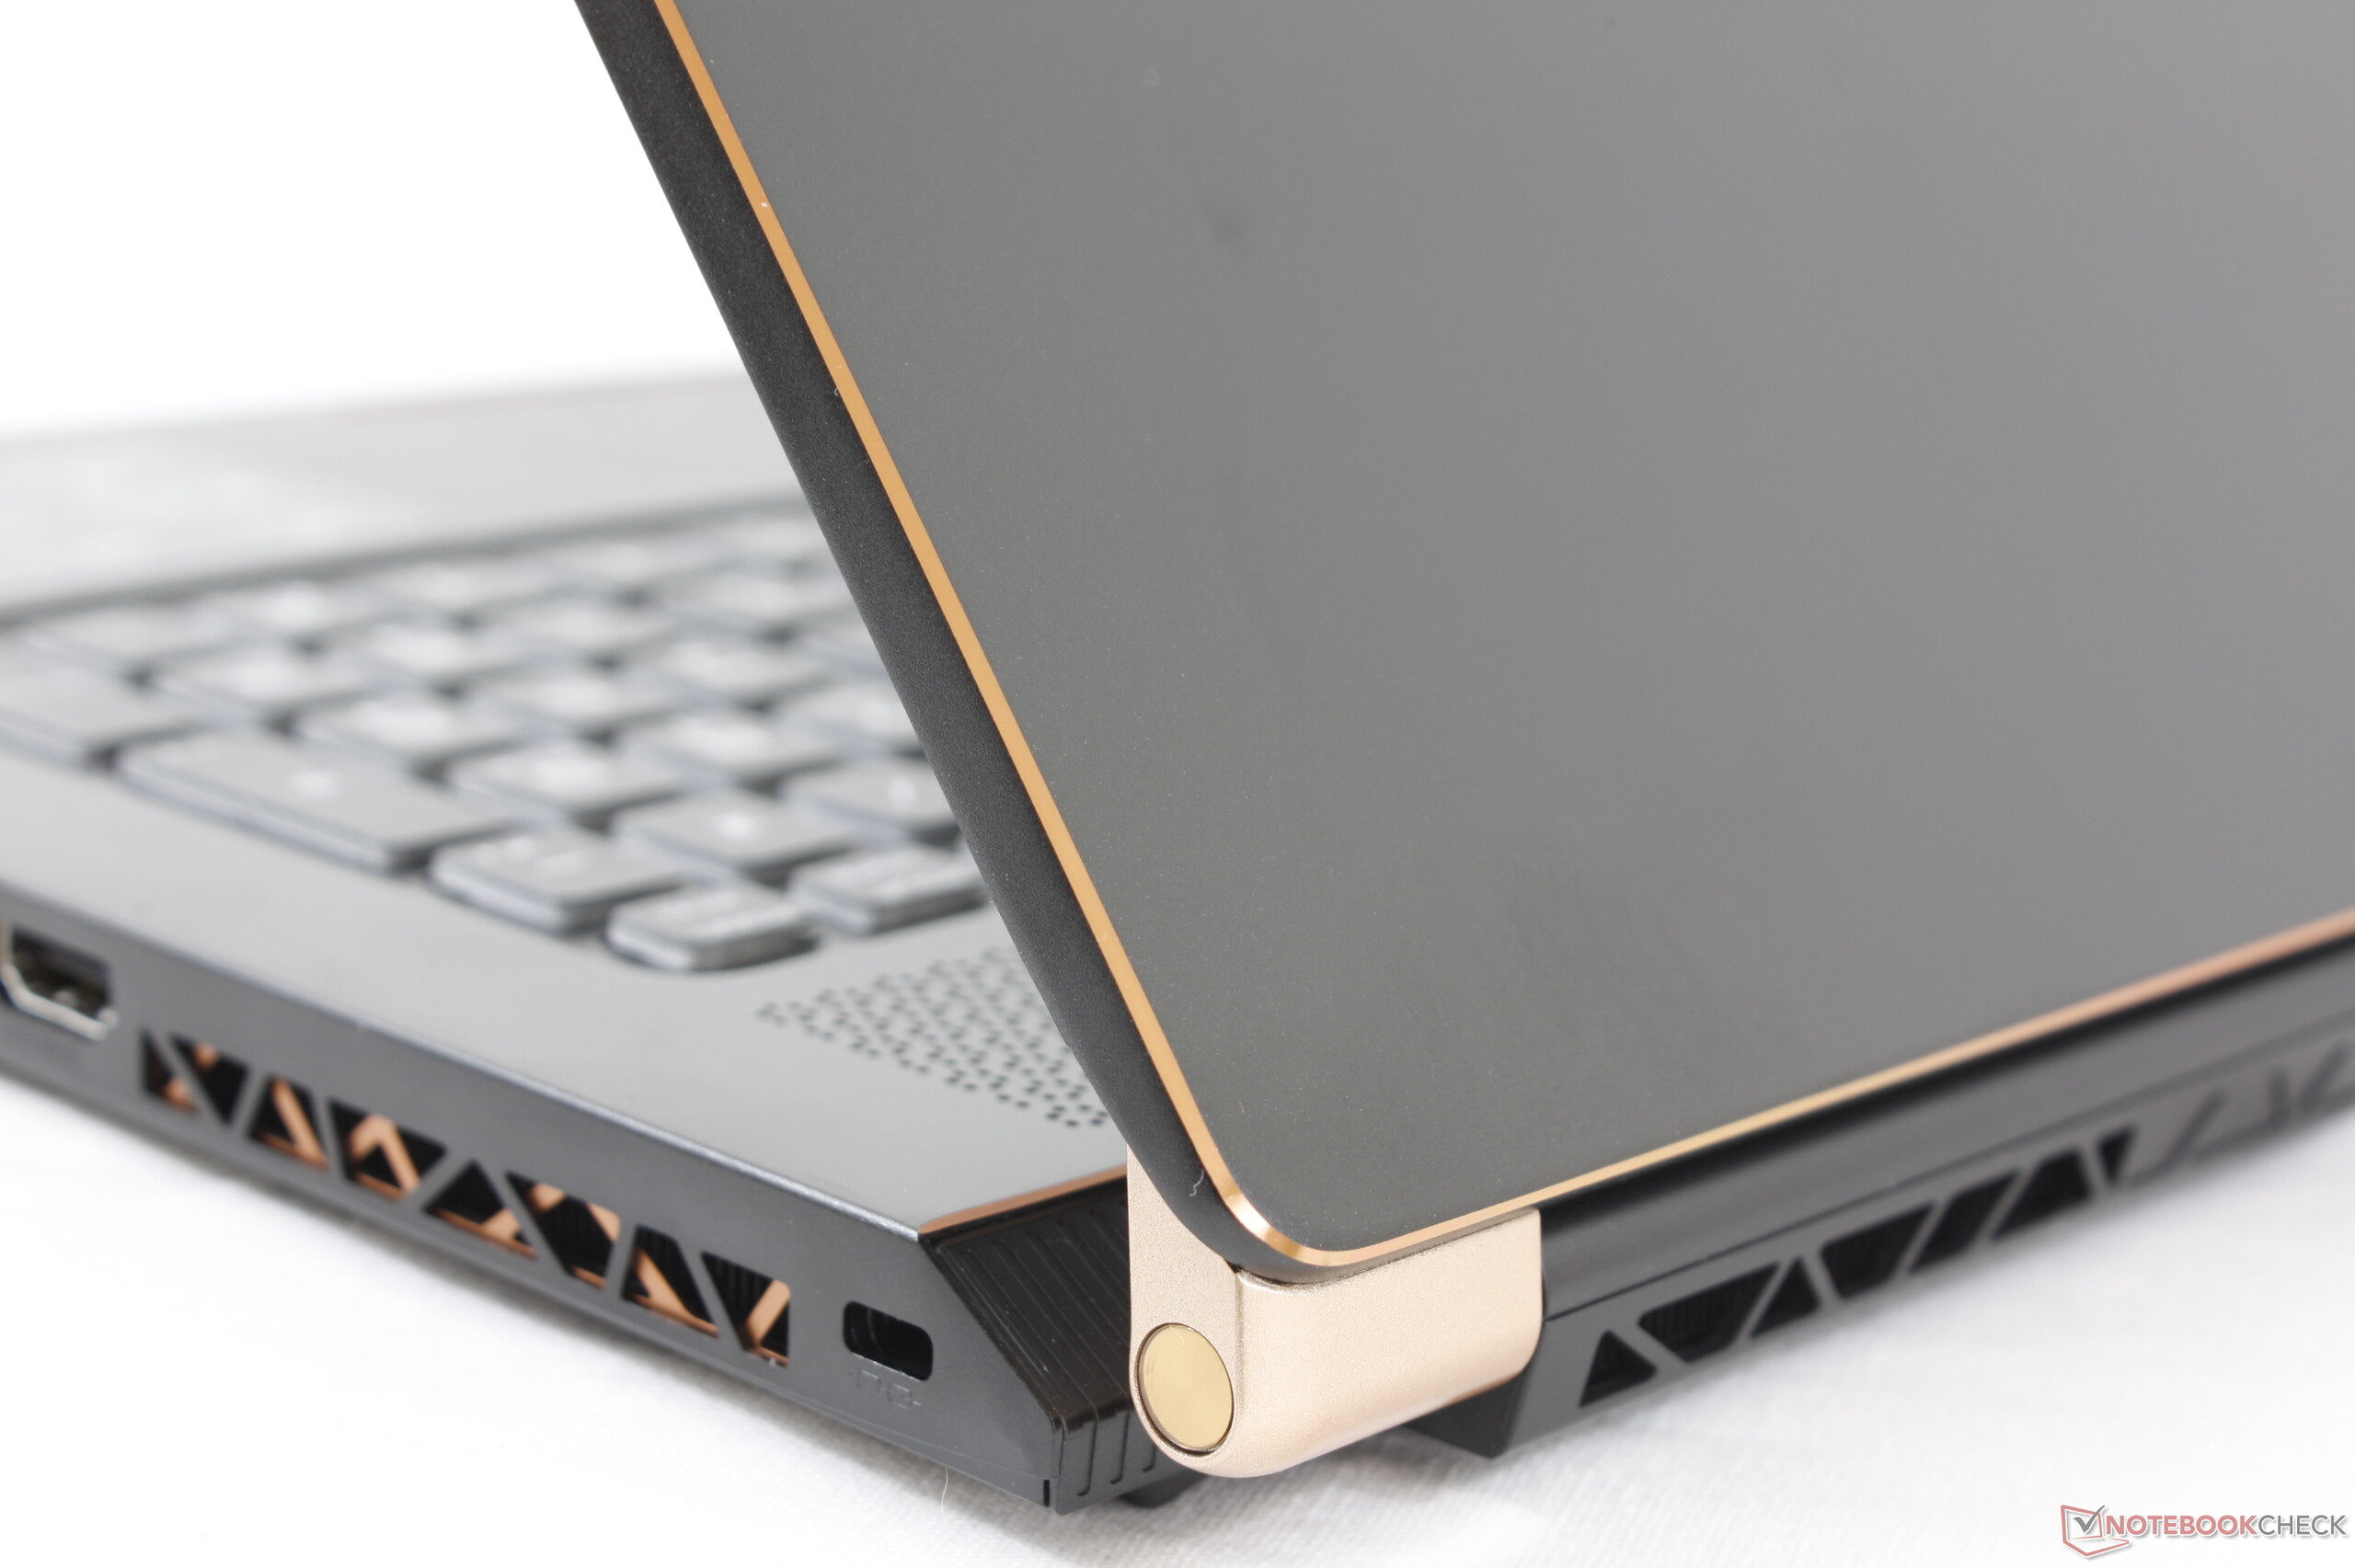
No entanto, a maior vantagem do sistema está diretamente ligada à sua maior desvantagem. Por ser tão leve, o chassi se dobra, range e flexiona mais do que a maioria dos outros portáteis para jogos, como o Razer Blade Pro ou o Alienware m17. Você provavelmente vai querer um mochila de alta qualidade, se pretende viajar muito com o sistema.
Quanto às novas opções de CPU e GPU, o Core i9 e o RTX 2070 Super Max-Q oferecem melhorias apenas marginais em relação ao Core i7-10875H e RTX 2070 Max-Q, respectivamente. Os usuários obterão melhor desempenho por dólar aderindo à nossa configuração de Core i7 e RTX 2070 Max-Q aqui ou fazendo todo o possível para o RTX 2080 Super Max-Q.
Se você viaja muito, o leve MSI GS75 parecerá uma oferta atraente, especialmente considerando o hardware de última geração. Se você estiver trabalhando ou jogando principalmente em ambientes fechados ou em escritórios, outras opções estarão disponíveis com designs de chassi mais rígidos.
MSI GS75 10SF-609US
- 07/29/2020 v7 (old)
Allen Ngo
Price comparison
