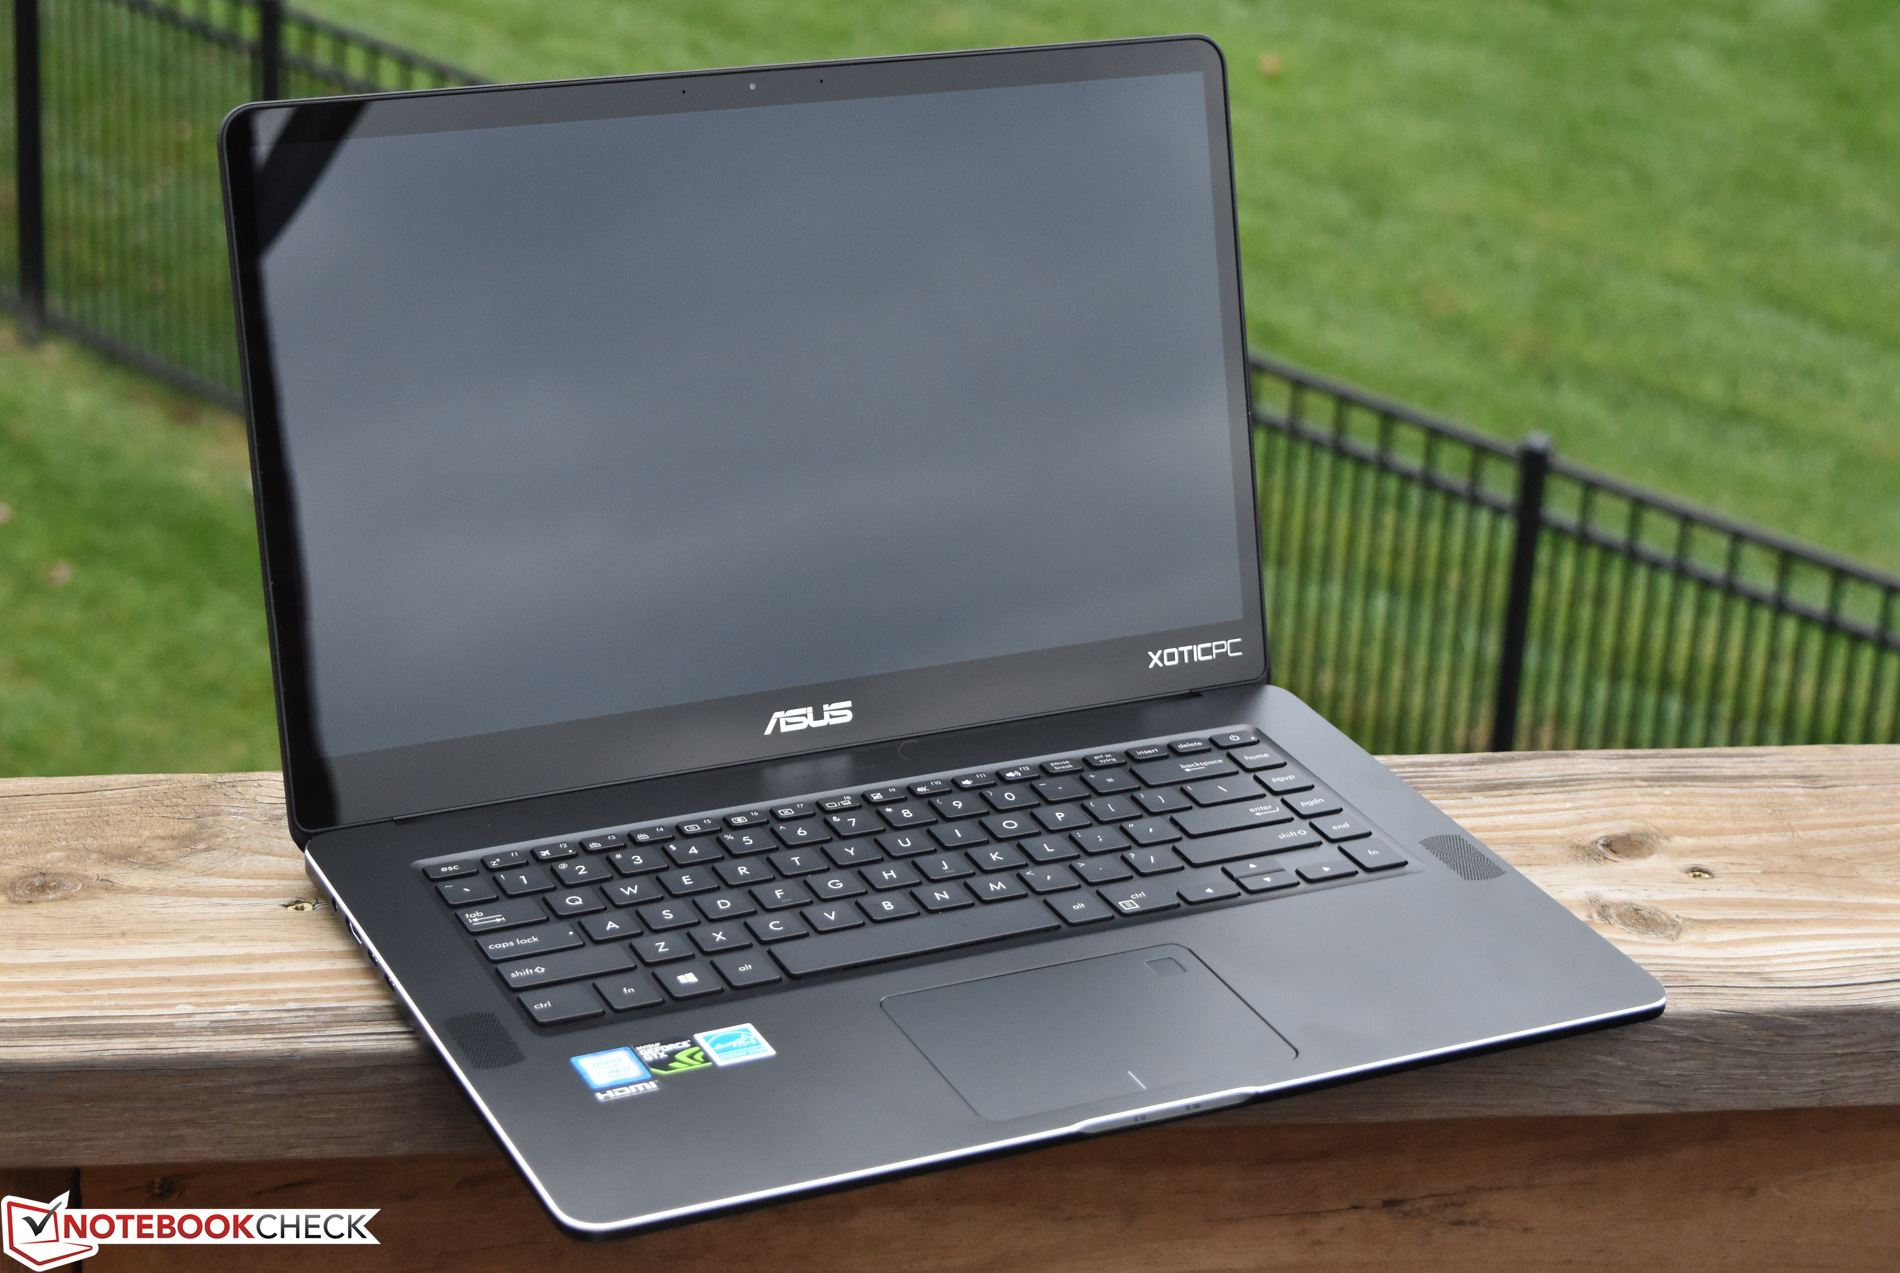
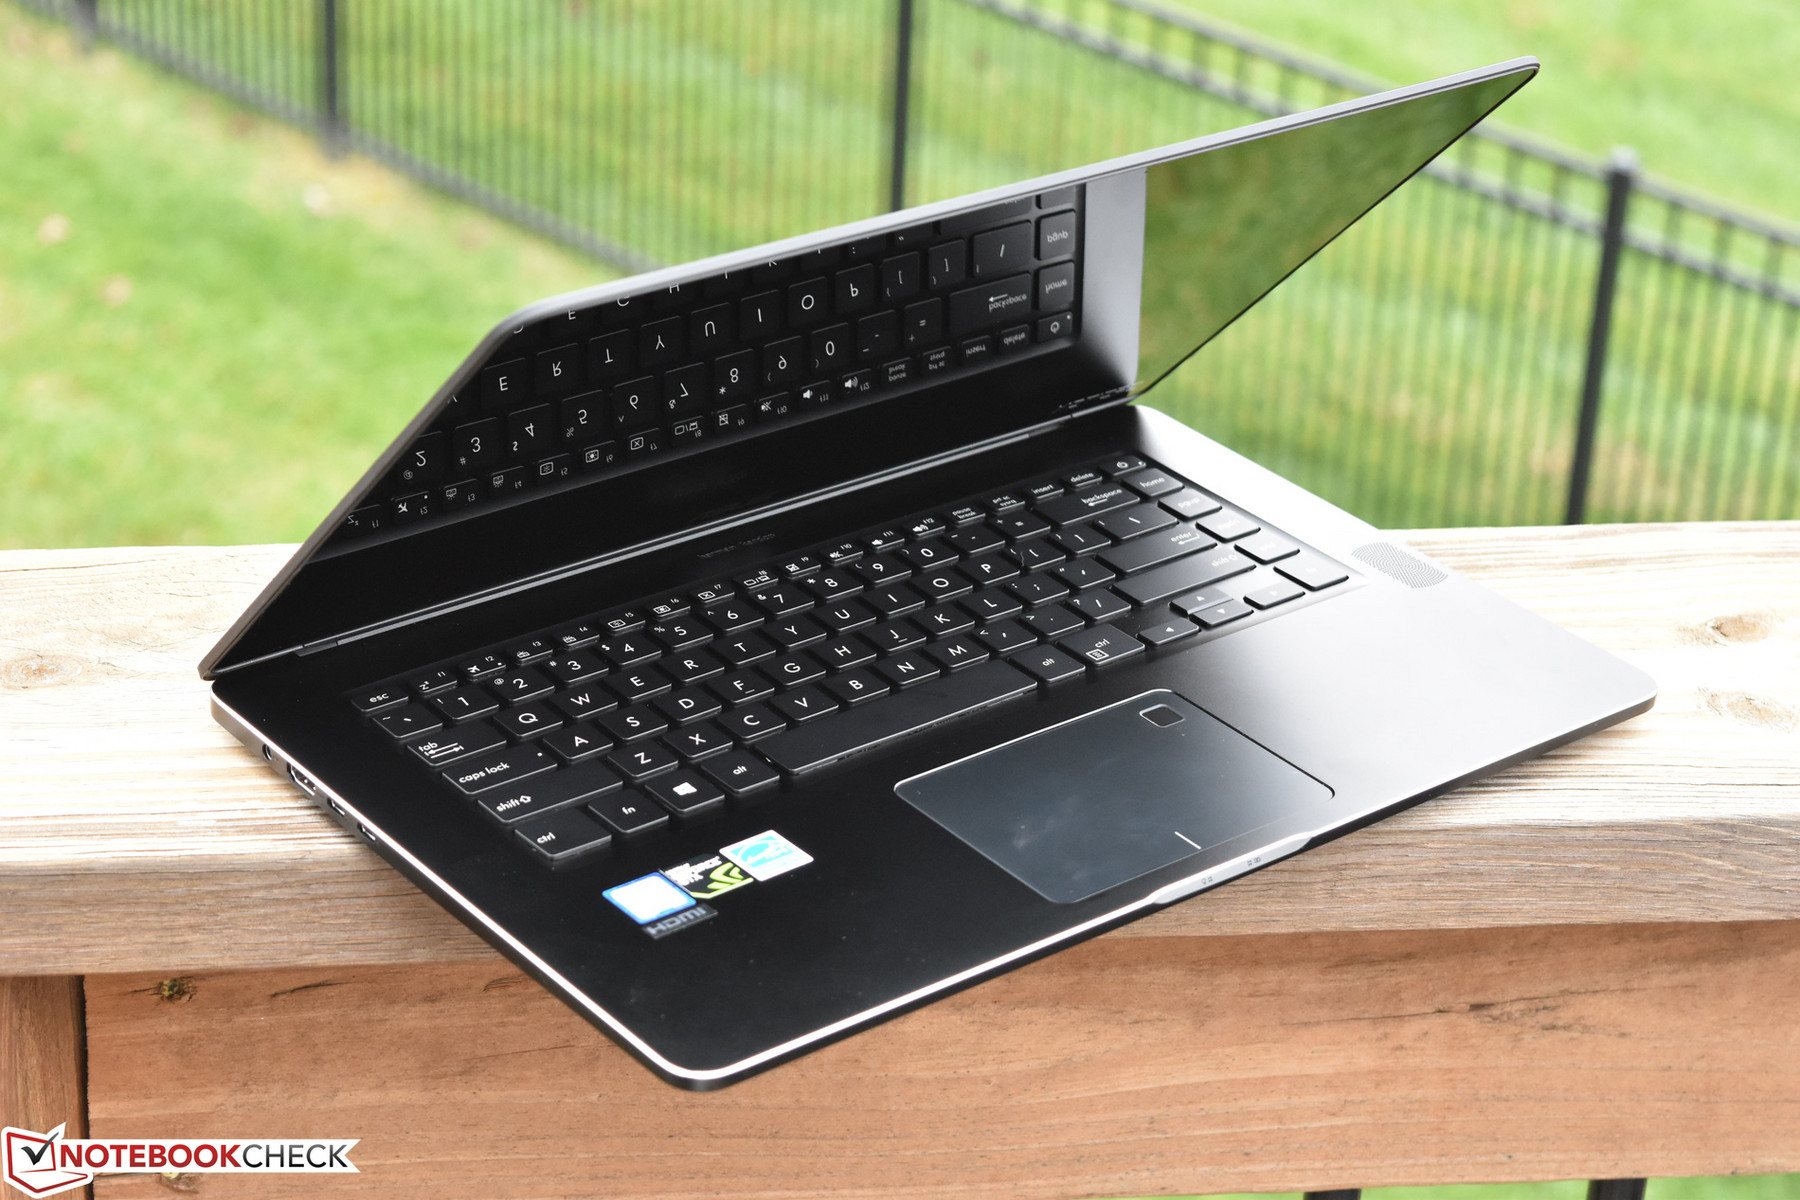
Breve Análise do Portátil Asus Zenbook Pro UX550VE (i7-7700HQ, GTX 1050 Ti)
| SD Card Reader | |
| average JPG Copy Test (av. of 3 runs) | |
| Microsoft Surface Book 2 | |
| Dell XPS 15 9560 (i7-7700HQ, UHD) | |
| Asus ZenBook Pro UX550VD | |
| Asus Zenbook Pro UX550VE-DB71T | |
| MSI GS63VR 7RF-228US | |
| maximum AS SSD Seq Read Test (1GB) | |
| Dell XPS 15 9560 (i7-7700HQ, UHD) | |
| Microsoft Surface Book 2 | |
| Asus Zenbook Pro UX550VE-DB71T | |
| MSI GS63VR 7RF-228US | |
| |||||||||||||||||||||||||
iluminação: 75 %
iluminação com acumulador: 288.2 cd/m²
Contraste: 961:1 (Preto: 0.3 cd/m²)
ΔE ColorChecker Calman: 5.5 | ∀{0.5-29.43 Ø4.73}
ΔE Greyscale Calman: 7.9 | ∀{0.09-98 Ø4.97}
90% sRGB (Argyll 1.6.3 3D)
58.5% AdobeRGB 1998 (Argyll 1.6.3 3D)
65.3% AdobeRGB 1998 (Argyll 3D)
90.4% sRGB (Argyll 3D)
64.3% Display P3 (Argyll 3D)
Gamma: 2.09
CCT: 6559 K
| Asus Zenbook Pro UX550VE-DB71T N156HCE-EN1 (CMN15E8), IPS, 15.6", 1920x1080 | Lenovo Yoga 720-15IKB-80X7 Chi Mei CMN N156HCE-EN1, IPS, 15.6", 1920x1080 | MSI GS63VR 7RF-228US IPS, 15.6", 3840x2160 | Dell XPS 15 9560 (i7-7700HQ, UHD) IGZO IPS, 15.6", 3840x2160 | Microsoft Surface Book 2 Panasonic MEI96A2 , IPS, 13.5", 3000x2000 | |
|---|---|---|---|---|---|
| Display | 1% | -23% | 35% | 6% | |
| Display P3 Coverage (%) | 64.3 | 65 1% | 48.21 -25% | 89.7 40% | 67.9 6% |
| sRGB Coverage (%) | 90.4 | 90.8 0% | 72.6 -20% | 100 11% | 95.7 6% |
| AdobeRGB 1998 Coverage (%) | 65.3 | 65.8 1% | 49.81 -24% | 100 53% | 69.4 6% |
| Response Times | 26% | 32% | -26% | -7% | |
| Response Time Grey 50% / Grey 80% * (ms) | 43.2 ? | 29.6 ? 31% | 28 ? 35% | 57.2 ? -32% | 52.8 ? -22% |
| Response Time Black / White * (ms) | 32.8 ? | 26.4 ? 20% | 23.6 ? 28% | 39.2 ? -20% | 30 ? 9% |
| PWM Frequency (Hz) | 25510 ? | 25510 ? | 1351 ? | 962 | |
| Screen | 12% | -20% | 18% | 44% | |
| Brightness middle (cd/m²) | 288.2 | 300.9 4% | 274.2 -5% | 370.1 28% | 385 34% |
| Brightness (cd/m²) | 266 | 285 7% | 263 -1% | 356 34% | 372 40% |
| Brightness Distribution (%) | 75 | 92 23% | 92 23% | 87 16% | 89 19% |
| Black Level * (cd/m²) | 0.3 | 0.24 20% | 0.44 -47% | 0.37 -23% | 0.21 30% |
| Contrast (:1) | 961 | 1254 30% | 623 -35% | 1000 4% | 1833 91% |
| Colorchecker dE 2000 * | 5.5 | 5 9% | 8 -45% | 5.3 4% | 1.6 71% |
| Colorchecker dE 2000 max. * | 11.3 | 10.2 10% | 14.6 -29% | 9.9 12% | 4.5 60% |
| Greyscale dE 2000 * | 7.9 | 7 11% | 9.1 -15% | 4.6 42% | 1.5 81% |
| Gamma | 2.09 105% | 2.34 94% | 2.24 98% | 2.31 95% | 2.22 99% |
| CCT | 6559 99% | 6578 99% | 5020 129% | 6284 103% | 6502 100% |
| Color Space (Percent of AdobeRGB 1998) (%) | 58.5 | 59 1% | 45.7 -22% | 88.3 51% | 64 9% |
| Color Space (Percent of sRGB) (%) | 90 | 90 0% | 72.1 -20% | 100 11% | 95.9 7% |
| Média Total (Programa/Configurações) | 13% /
11% | -4% /
-13% | 9% /
15% | 14% /
30% |
* ... menor é melhor
Exibir tempos de resposta
| ↔ Tempo de resposta preto para branco | ||
|---|---|---|
| 32.8 ms ... ascensão ↗ e queda ↘ combinadas | ↗ 18 ms ascensão | 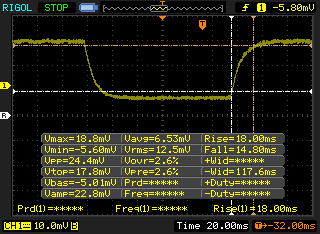 |
| ↘ 14.8 ms queda | ||
| A tela mostra taxas de resposta lentas em nossos testes e será insatisfatória para os jogadores. Em comparação, todos os dispositivos testados variam de 0.1 (mínimo) a 240 (máximo) ms. » 88 % de todos os dispositivos são melhores. Isso significa que o tempo de resposta medido é pior que a média de todos os dispositivos testados (19.9 ms). | ||
| ↔ Tempo de resposta 50% cinza a 80% cinza | ||
| 43.2 ms ... ascensão ↗ e queda ↘ combinadas | ↗ 20.4 ms ascensão | 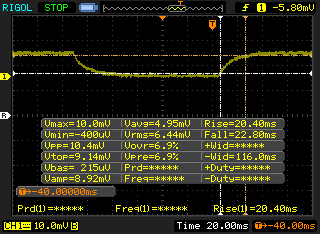 |
| ↘ 22.8 ms queda | ||
| A tela mostra taxas de resposta lentas em nossos testes e será insatisfatória para os jogadores. Em comparação, todos os dispositivos testados variam de 0.165 (mínimo) a 636 (máximo) ms. » 72 % de todos os dispositivos são melhores. Isso significa que o tempo de resposta medido é pior que a média de todos os dispositivos testados (31.1 ms). | ||
Cintilação da tela / PWM (modulação por largura de pulso)
| Tela tremeluzindo/PWM detectado | 25510 Hz | ≤ 29 % configuração de brilho | 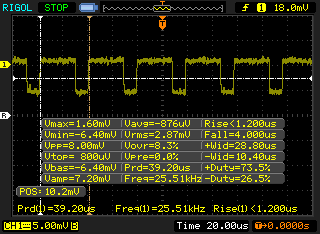 |
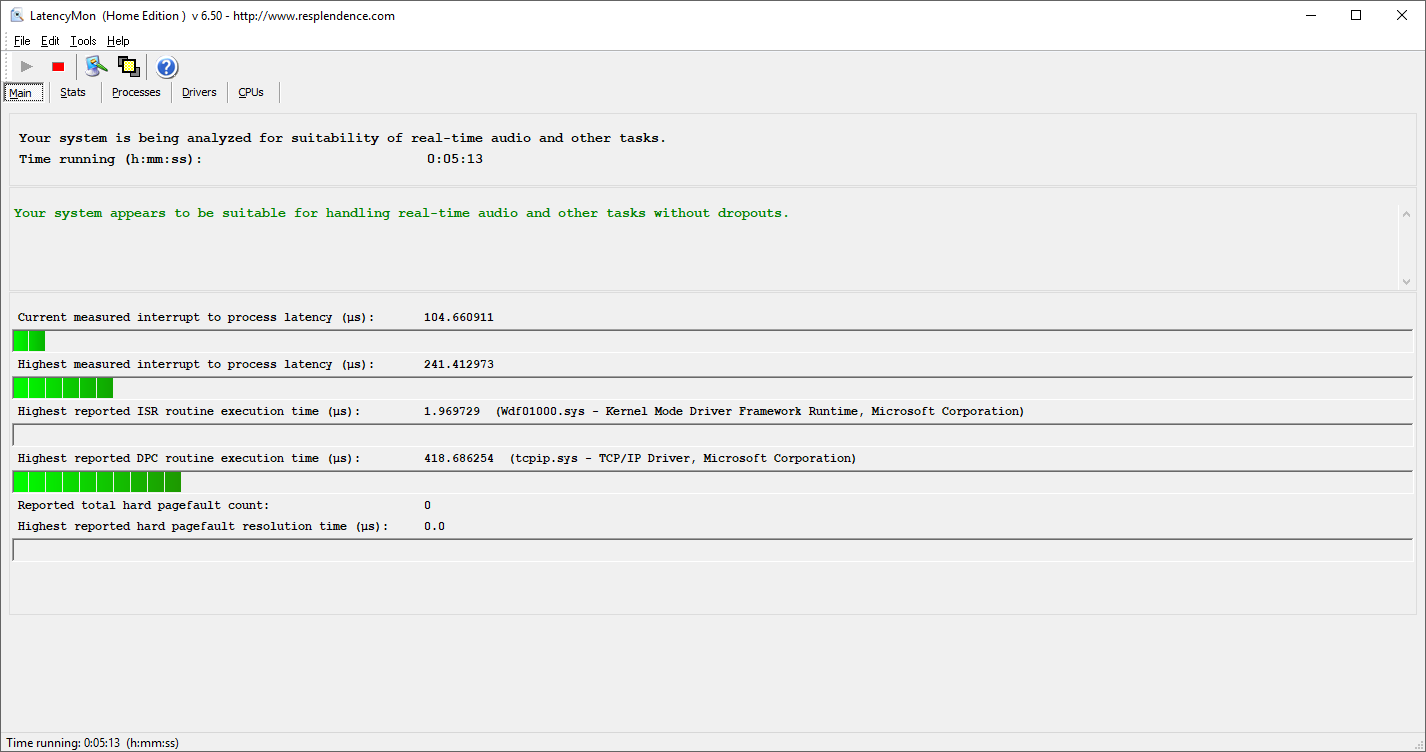
A luz de fundo da tela pisca em 25510 Hz (pior caso, por exemplo, utilizando PWM) Cintilação detectada em uma configuração de brilho de 29 % e abaixo. Não deve haver cintilação ou PWM acima desta configuração de brilho. A frequência de 25510 Hz é bastante alta, então a maioria dos usuários sensíveis ao PWM não deve notar nenhuma oscilação. [pwm_comparison] Em comparação: 52 % de todos os dispositivos testados não usam PWM para escurecer a tela. Se PWM foi detectado, uma média de 7798 (mínimo: 5 - máximo: 343500) Hz foi medida. | |||
| wPrime 2.10 - 1024m | |
| Asus Zenbook Pro UX550VE-DB71T | |
| Lenovo Yoga 720-15IKB-80X7 | |
| MSI GS63VR 7RF-228US | |
| Dell XPS 15 9560 (i7-7700HQ, UHD) | |
* ... menor é melhor
| PCMark 10 - Score | |
| Asus Zenbook Pro UX550VE-DB71T | |
| Asus ZenBook Pro UX550VD | |
| Microsoft Surface Book 2 | |
| PCMark 8 Home Score Accelerated v2 | 4184 pontos | |
| PCMark 8 Creative Score Accelerated v2 | 5328 pontos | |
| PCMark 8 Work Score Accelerated v2 | 5141 pontos | |
| PCMark 10 Score | 4552 pontos | |
Ajuda | ||
| Asus Zenbook Pro UX550VE-DB71T Samsung PM961 NVMe MZVLW512HMJP | Asus ZenBook Pro UX550VD Samsung PM961 NVMe MZVLW512HMJP | Lenovo Yoga 720-15IKB-80X7 Samsung PM961 MZVLW256HEHP | MSI GS63VR 7RF-228US Samsung SM961 MZVKW512HMJP m.2 PCI-e | Dell XPS 15 9560 (i7-7700HQ, UHD) Lite-On CX2-8B512-Q11 | |
|---|---|---|---|---|---|
| AS SSD | 15% | -1158% | 19% | -6% | |
| Copy Game MB/s (MB/s) | 477.1 | 889 86% | 1082 127% | 540 13% | |
| Copy Program MB/s (MB/s) | 294.6 | 336.4 14% | 401.9 36% | 411.5 40% | |
| Copy ISO MB/s (MB/s) | 1269 | 1678 32% | 1666 31% | 1272 0% | |
| Score Total (Points) | 3721 | 3731 0% | 942 -75% | 3756 1% | 2810 -24% |
| Score Write (Points) | 1421 | 1158 -19% | 48 -97% | 1468 3% | 1022 -28% |
| Score Read (Points) | 1541 | 1727 12% | 646 -58% | 1549 1% | 1206 -22% |
| Access Time Write * (ms) | 0.034 | 0.028 18% | 4.15 -12106% | 0.029 15% | 0.034 -0% |
| Access Time Read * (ms) | 0.054 | 0.031 43% | 0.08 -48% | 0.041 24% | 0.034 37% |
| 4K-64 Write (MB/s) | 1160 | 870 -25% | 15.3 -99% | 1185 2% | 789 -32% |
| 4K-64 Read (MB/s) | 1269 | 1430 13% | 371.6 -71% | 1229 -3% | 962 -24% |
| 4K Write (MB/s) | 112.8 | 133.2 18% | 1.2 -99% | 127.6 13% | 112.2 -1% |
| 4K Read (MB/s) | 51 | 54 6% | 47.1 -8% | 48.01 -6% | 41.34 -19% |
| Seq Write (MB/s) | 1475 | 1540 4% | 311.7 -79% | 1550 5% | 1207 -18% |
| Seq Read (MB/s) | 2208 | 2429 10% | 2277 3% | 2719 23% | 2026 -8% |
* ... menor é melhor

| 3DMark 11 | |
| 1280x720 Performance GPU | |
| MSI GS63VR 7RF-228US | |
| Asus Zenbook Pro UX550VE-DB71T | |
| Microsoft Surface Book 2 | |
| Asus ZenBook Pro UX550VD | |
| 1280x720 Performance Combined | |
| MSI GS63VR 7RF-228US | |
| Asus Zenbook Pro UX550VE-DB71T | |
| Asus ZenBook Pro UX550VD | |
| Microsoft Surface Book 2 | |
| 3DMark | |
| 1280x720 Cloud Gate Standard Graphics | |
| Asus Zenbook Pro UX550VE-DB71T | |
| Lenovo Yoga 720-15IKB-80X7 | |
| Asus ZenBook Pro UX550VD | |
| MSI GS63VR 7RF-228US | |
| Dell XPS 15 9560 (i7-7700HQ, UHD) | |
| Microsoft Surface Book 2 | |
| 1920x1080 Fire Strike Graphics | |
| MSI GS63VR 7RF-228US | |
| Asus Zenbook Pro UX550VE-DB71T | |
| Dell XPS 15 9560 (i7-7700HQ, UHD) | |
| Asus ZenBook Pro UX550VD | |
| Lenovo Yoga 720-15IKB-80X7 | |
| Microsoft Surface Book 2 | |
| 1920x1080 Ice Storm Extreme Graphics | |
| Asus Zenbook Pro UX550VE-DB71T | |
| Dell XPS 15 9560 (i7-7700HQ, UHD) | |
| Lenovo Yoga 720-15IKB-80X7 | |
| Microsoft Surface Book 2 | |
| 3DMark 06 Standard Score | 27473 pontos | |
| 3DMark 11 Performance | 9125 pontos | |
| 3DMark Ice Storm Standard Score | 104111 pontos | |
| 3DMark Cloud Gate Standard Score | 20838 pontos | |
| 3DMark Fire Strike Score | 6564 pontos | |
| 3DMark Fire Strike Extreme Score | 3518 pontos | |
| 3DMark Time Spy Score | 2373 pontos | |
Ajuda | ||
| Batman: Arkham Knight - 1920x1080 High / On AA:SM AF:16x (classificar por valor) | |
| Asus Zenbook Pro UX550VE-DB71T | |
| MSI GS63VR 7RF-228US | |
| Dell XPS 15 9560 (i7-7700HQ, UHD) | |
| Doom - 1920x1080 Ultra Preset AA:SM (classificar por valor) | |
| Asus Zenbook Pro UX550VE-DB71T | |
| Lenovo Yoga 720-15IKB-80X7 | |
| MSI GS63VR 7RF-228US | |
| Dell XPS 15 9560 (i7-7700HQ, UHD) | |
| Rise of the Tomb Raider - 1920x1080 Very High Preset AA:FX AF:16x (classificar por valor) | |
| Asus Zenbook Pro UX550VE-DB71T | |
| Asus ZenBook Pro UX550VD | |
| Lenovo Yoga 720-15IKB-80X7 | |
| MSI GS63VR 7RF-228US | |
| Dell XPS 15 9560 (i7-7700HQ, UHD) | |
| Microsoft Surface Book 2 | |
| The Witcher 3 - 1920x1080 Ultra Graphics & Postprocessing (HBAO+) (classificar por valor) | |
| Asus Zenbook Pro UX550VE-DB71T | |
| Asus ZenBook Pro UX550VD | |
| Lenovo Yoga 720-15IKB-80X7 | |
| MSI GS63VR 7RF-228US | |
| Dell XPS 15 9560 (i7-7700HQ, UHD) | |
| Microsoft Surface Book 2 | |
| baixo | média | alto | ultra | |
|---|---|---|---|---|
| The Witcher 3 (2015) | 24 | |||
| Batman: Arkham Knight (2015) | 37 | |||
| Rise of the Tomb Raider (2016) | 39 | |||
| Doom (2016) | 54 |
Barulho
| Ocioso |
| 30.4 / 31 / 31.2 dB |
| Carga |
| 43.3 / 46.2 dB |
 | ||
30 dB silencioso 40 dB(A) audível 50 dB(A) ruidosamente alto |
||
min: | ||
| Asus Zenbook Pro UX550VE-DB71T GeForce GTX 1050 Ti Mobile, i7-7700HQ, Samsung PM961 NVMe MZVLW512HMJP | Asus ZenBook Pro UX550VD GeForce GTX 1050 Mobile, i7-7700HQ, Samsung PM961 NVMe MZVLW512HMJP | Lenovo Yoga 720-15IKB-80X7 GeForce GTX 1050 Mobile, i7-7700HQ, Samsung PM961 MZVLW256HEHP | MSI GS63VR 7RF-228US GeForce GTX 1060 Mobile, i7-7700HQ, Samsung SM961 MZVKW512HMJP m.2 PCI-e | Dell XPS 15 9560 (i7-7700HQ, UHD) GeForce GTX 1050 Mobile, i7-7700HQ, Lite-On CX2-8B512-Q11 | |
|---|---|---|---|---|---|
| Noise | 7% | 6% | -2% | -2% | |
| desligado / ambiente * (dB) | 28.3 | 29.4 -4% | 28.2 -0% | 28.8 -2% | 28.4 -0% |
| Idle Minimum * (dB) | 30.4 | 29.4 3% | 28.2 7% | 33.1 -9% | 29 5% |
| Idle Average * (dB) | 31 | 29.9 4% | 28.2 9% | 33.1 -7% | 29 6% |
| Idle Maximum * (dB) | 31.2 | 29.9 4% | 28.2 10% | 34 -9% | 32.2 -3% |
| Load Average * (dB) | 43.3 | 38.3 12% | 39 10% | 37.2 14% | 47.1 -9% |
| Witcher 3 ultra * (dB) | 46.2 | 39.8 14% | 46.1 -0% | 52 -13% | |
| Load Maximum * (dB) | 46.2 | 39.6 14% | 46.3 -0% | 47.1 -2% | 47.1 -2% |
* ... menor é melhor
(±) A temperatura máxima no lado superior é 43.2 °C / 110 F, em comparação com a média de 36.8 °C / 98 F , variando de 21 a 71 °C para a classe Multimedia.
(-) A parte inferior aquece até um máximo de 49.8 °C / 122 F, em comparação com a média de 39.1 °C / 102 F
(+) Em uso inativo, a temperatura média para o lado superior é 24 °C / 75 F, em comparação com a média do dispositivo de 31.3 °C / ### class_avg_f### F.
(+) Jogando The Witcher 3, a temperatura média para o lado superior é 31.7 °C / 89 F, em comparação com a média do dispositivo de 31.3 °C / ## #class_avg_f### F.
(+) Os apoios para as mãos e o touchpad são mais frios que a temperatura da pele, com um máximo de 28.4 °C / 83.1 F e, portanto, são frios ao toque.
(±) A temperatura média da área do apoio para as mãos de dispositivos semelhantes foi 28.7 °C / 83.7 F (+0.3 °C / 0.6 F).
Asus Zenbook Pro UX550VE-DB71T análise de áudio
(±) | o volume do alto-falante é médio, mas bom (###valor### dB)
Graves 100 - 315Hz
(±) | graves reduzidos - em média 8.2% menor que a mediana
(±) | a linearidade dos graves é média (10.9% delta para a frequência anterior)
Médios 400 - 2.000 Hz
(+) | médios equilibrados - apenas 3.2% longe da mediana
(±) | a linearidade dos médios é média (7% delta para frequência anterior)
Altos 2 - 16 kHz
(+) | agudos equilibrados - apenas 4.1% longe da mediana
(+) | os máximos são lineares (5.3% delta da frequência anterior)
Geral 100 - 16.000 Hz
(±) | a linearidade do som geral é média (16.3% diferença em relação à mediana)
Comparado com a mesma classe
» 41% de todos os dispositivos testados nesta classe foram melhores, 8% semelhantes, 51% piores
» O melhor teve um delta de 5%, a média foi 17%, o pior foi 45%
Comparado com todos os dispositivos testados
» 27% de todos os dispositivos testados foram melhores, 6% semelhantes, 68% piores
» O melhor teve um delta de 4%, a média foi 24%, o pior foi 134%
Dell XPS 15 9560 (i7-7700HQ, UHD) análise de áudio
(-) | alto-falantes não muito altos (###valor### dB)
Graves 100 - 315Hz
(±) | graves reduzidos - em média 12.9% menor que a mediana
(±) | a linearidade dos graves é média (14.3% delta para a frequência anterior)
Médios 400 - 2.000 Hz
(+) | médios equilibrados - apenas 3.5% longe da mediana
(±) | a linearidade dos médios é média (8.9% delta para frequência anterior)
Altos 2 - 16 kHz
(+) | agudos equilibrados - apenas 2.3% longe da mediana
(±) | a linearidade dos máximos é média (7.3% delta para frequência anterior)
Geral 100 - 16.000 Hz
(±) | a linearidade do som geral é média (16.2% diferença em relação à mediana)
Comparado com a mesma classe
» 41% de todos os dispositivos testados nesta classe foram melhores, 7% semelhantes, 51% piores
» O melhor teve um delta de 5%, a média foi 17%, o pior foi 45%
Comparado com todos os dispositivos testados
» 26% de todos os dispositivos testados foram melhores, 6% semelhantes, 68% piores
» O melhor teve um delta de 4%, a média foi 24%, o pior foi 134%
| desligado | |
| Ocioso | |
| Carga |
|
Key:
min: | |
| Asus Zenbook Pro UX550VE-DB71T i7-7700HQ, GeForce GTX 1050 Ti Mobile, Samsung PM961 NVMe MZVLW512HMJP, IPS, 1920x1080, 15.6" | Asus ZenBook Pro UX550VD i7-7700HQ, GeForce GTX 1050 Mobile, Samsung PM961 NVMe MZVLW512HMJP, IPS, 1920x1080, 15.6" | Lenovo Yoga 720-15IKB-80X7 i7-7700HQ, GeForce GTX 1050 Mobile, Samsung PM961 MZVLW256HEHP, IPS, 1920x1080, 15.6" | MSI GS63VR 7RF-228US i7-7700HQ, GeForce GTX 1060 Mobile, Samsung SM961 MZVKW512HMJP m.2 PCI-e, IPS, 3840x2160, 15.6" | Dell XPS 15 9560 (i7-7700HQ, UHD) i7-7700HQ, GeForce GTX 1050 Mobile, Lite-On CX2-8B512-Q11, IGZO IPS, 3840x2160, 15.6" | |
|---|---|---|---|---|---|
| Power Consumption | -8% | -14% | -82% | -60% | |
| Idle Minimum * (Watt) | 6.3 | 5.05 20% | 8.3 -32% | 14.5 -130% | 11.9 -89% |
| Idle Average * (Watt) | 7.9 | 8.2 -4% | 10.2 -29% | 17.3 -119% | 17.1 -116% |
| Idle Maximum * (Watt) | 8.1 | 12.2 -51% | 10.4 -28% | 17.4 -115% | 17.3 -114% |
| Load Average * (Watt) | 84.9 | 82 3% | 67.5 20% | 93 -10% | 94.7 -12% |
| Witcher 3 ultra * (Watt) | 96.3 | 93.1 3% | 96.5 -0% | 128.8 -34% | 104.8 -9% |
| Load Maximum * (Watt) | 102.4 | 120 -17% | 117.2 -14% | 122 -19% |
* ... menor é melhor
| Asus Zenbook Pro UX550VE-DB71T i7-7700HQ, GeForce GTX 1050 Ti Mobile, 73 Wh | Asus ZenBook Pro UX550VD i7-7700HQ, GeForce GTX 1050 Mobile, 73 Wh | Lenovo Yoga 720-15IKB-80X7 i7-7700HQ, GeForce GTX 1050 Mobile, 72 Wh | MSI GS63VR 7RF-228US i7-7700HQ, GeForce GTX 1060 Mobile, 65 Wh | Dell XPS 15 9560 (i7-7700HQ, UHD) i7-7700HQ, GeForce GTX 1050 Mobile, 97 Wh | Microsoft Surface Book 2 i7-8650U, GeForce GTX 1050 Mobile, 75 Wh | |
|---|---|---|---|---|---|---|
| Duração da bateria | 1% | 9% | -37% | 1% | 78% | |
| Reader / Idle (h) | 17.1 | 17.7 4% | 17.8 4% | 6.4 -63% | 13.9 -19% | 24.5 43% |
| WiFi v1.3 (h) | 8.9 | 8.9 0% | 8.1 -9% | 3.9 -56% | 7.2 -19% | 11.1 25% |
| Load (h) | 1.2 | 1.2 0% | 1.6 33% | 1.3 8% | 1.7 42% | 3.2 167% |
| Witcher 3 ultra (h) | 1.1 | 3.8 |
Pro
Contra

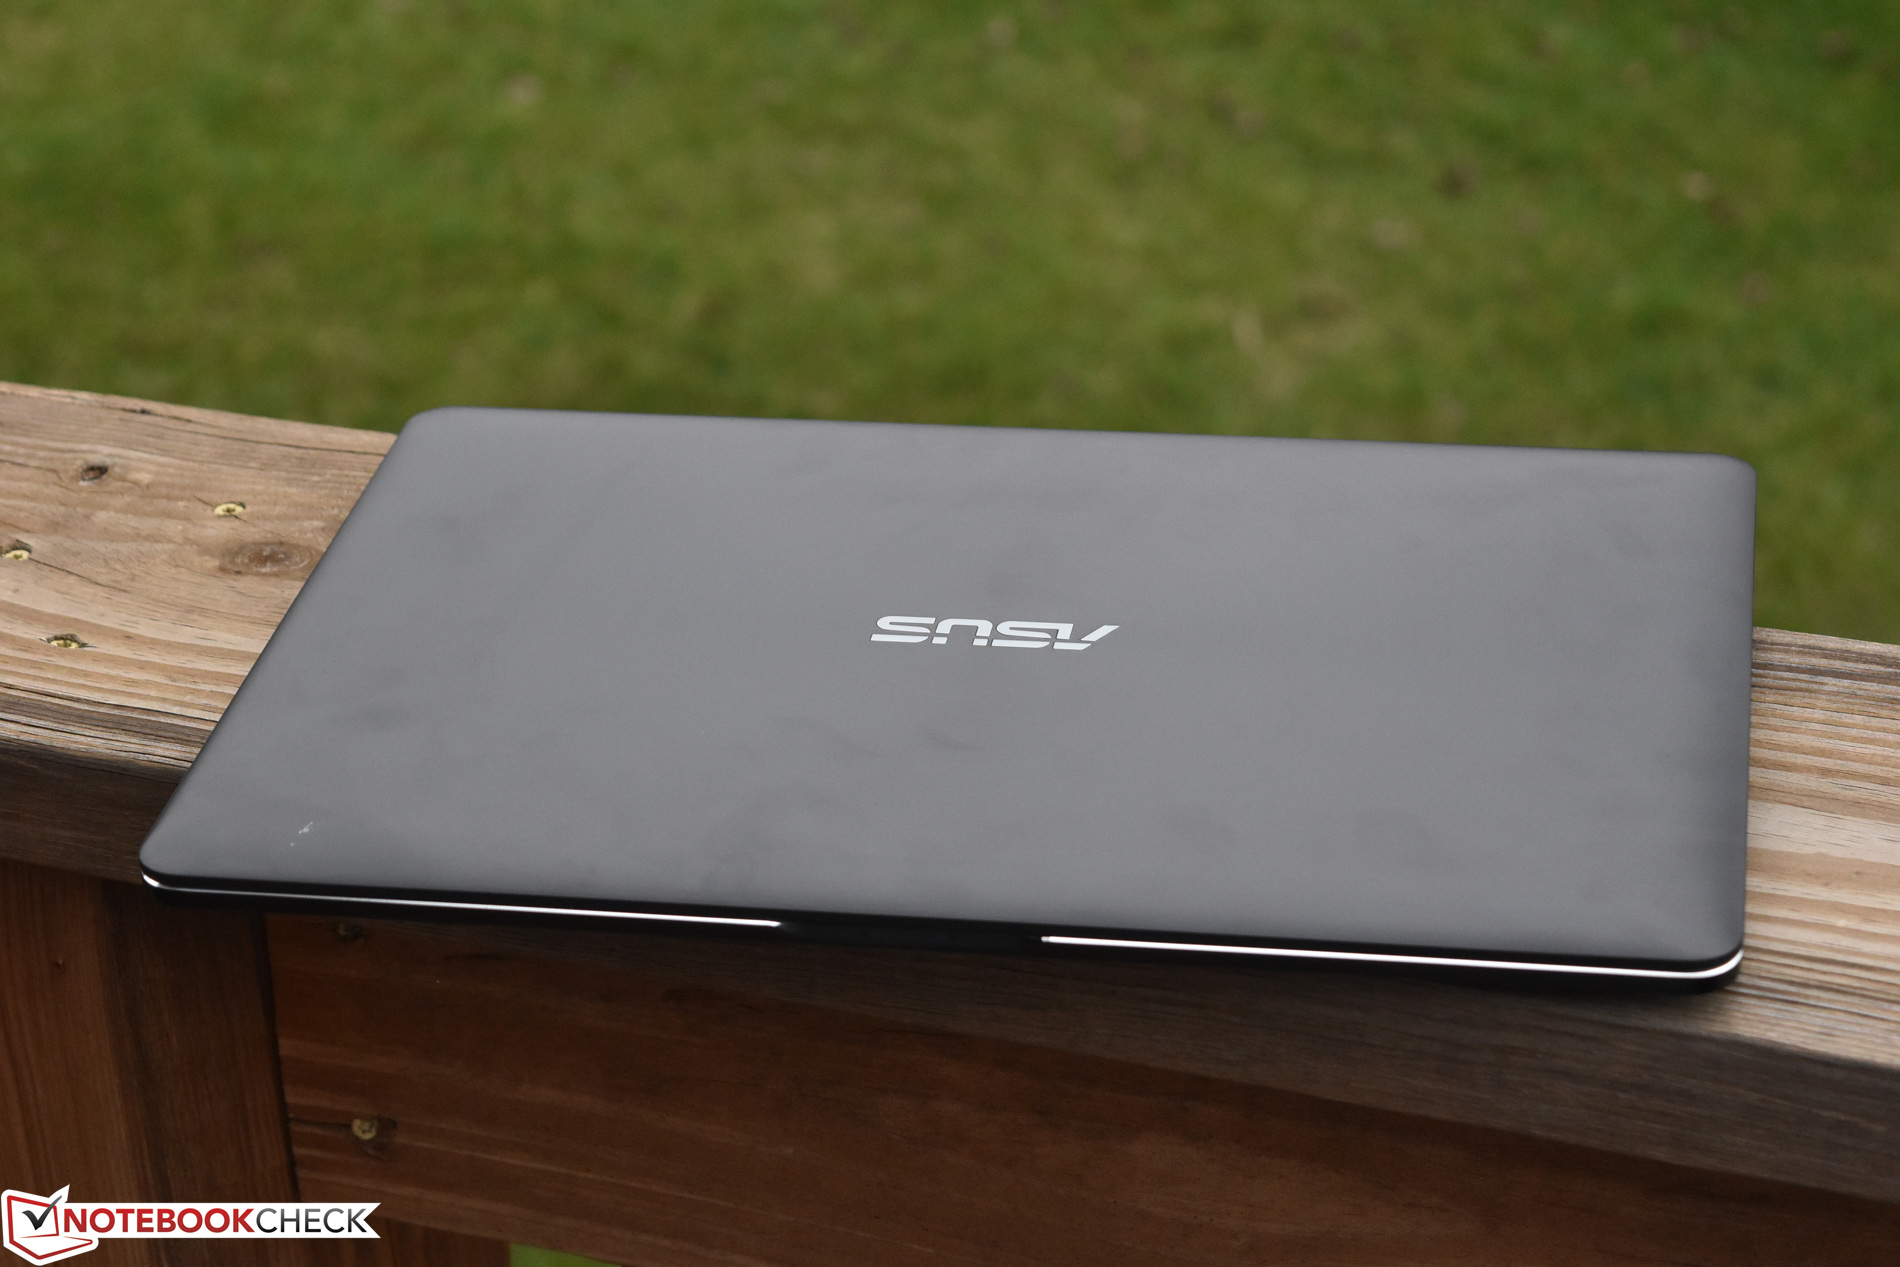
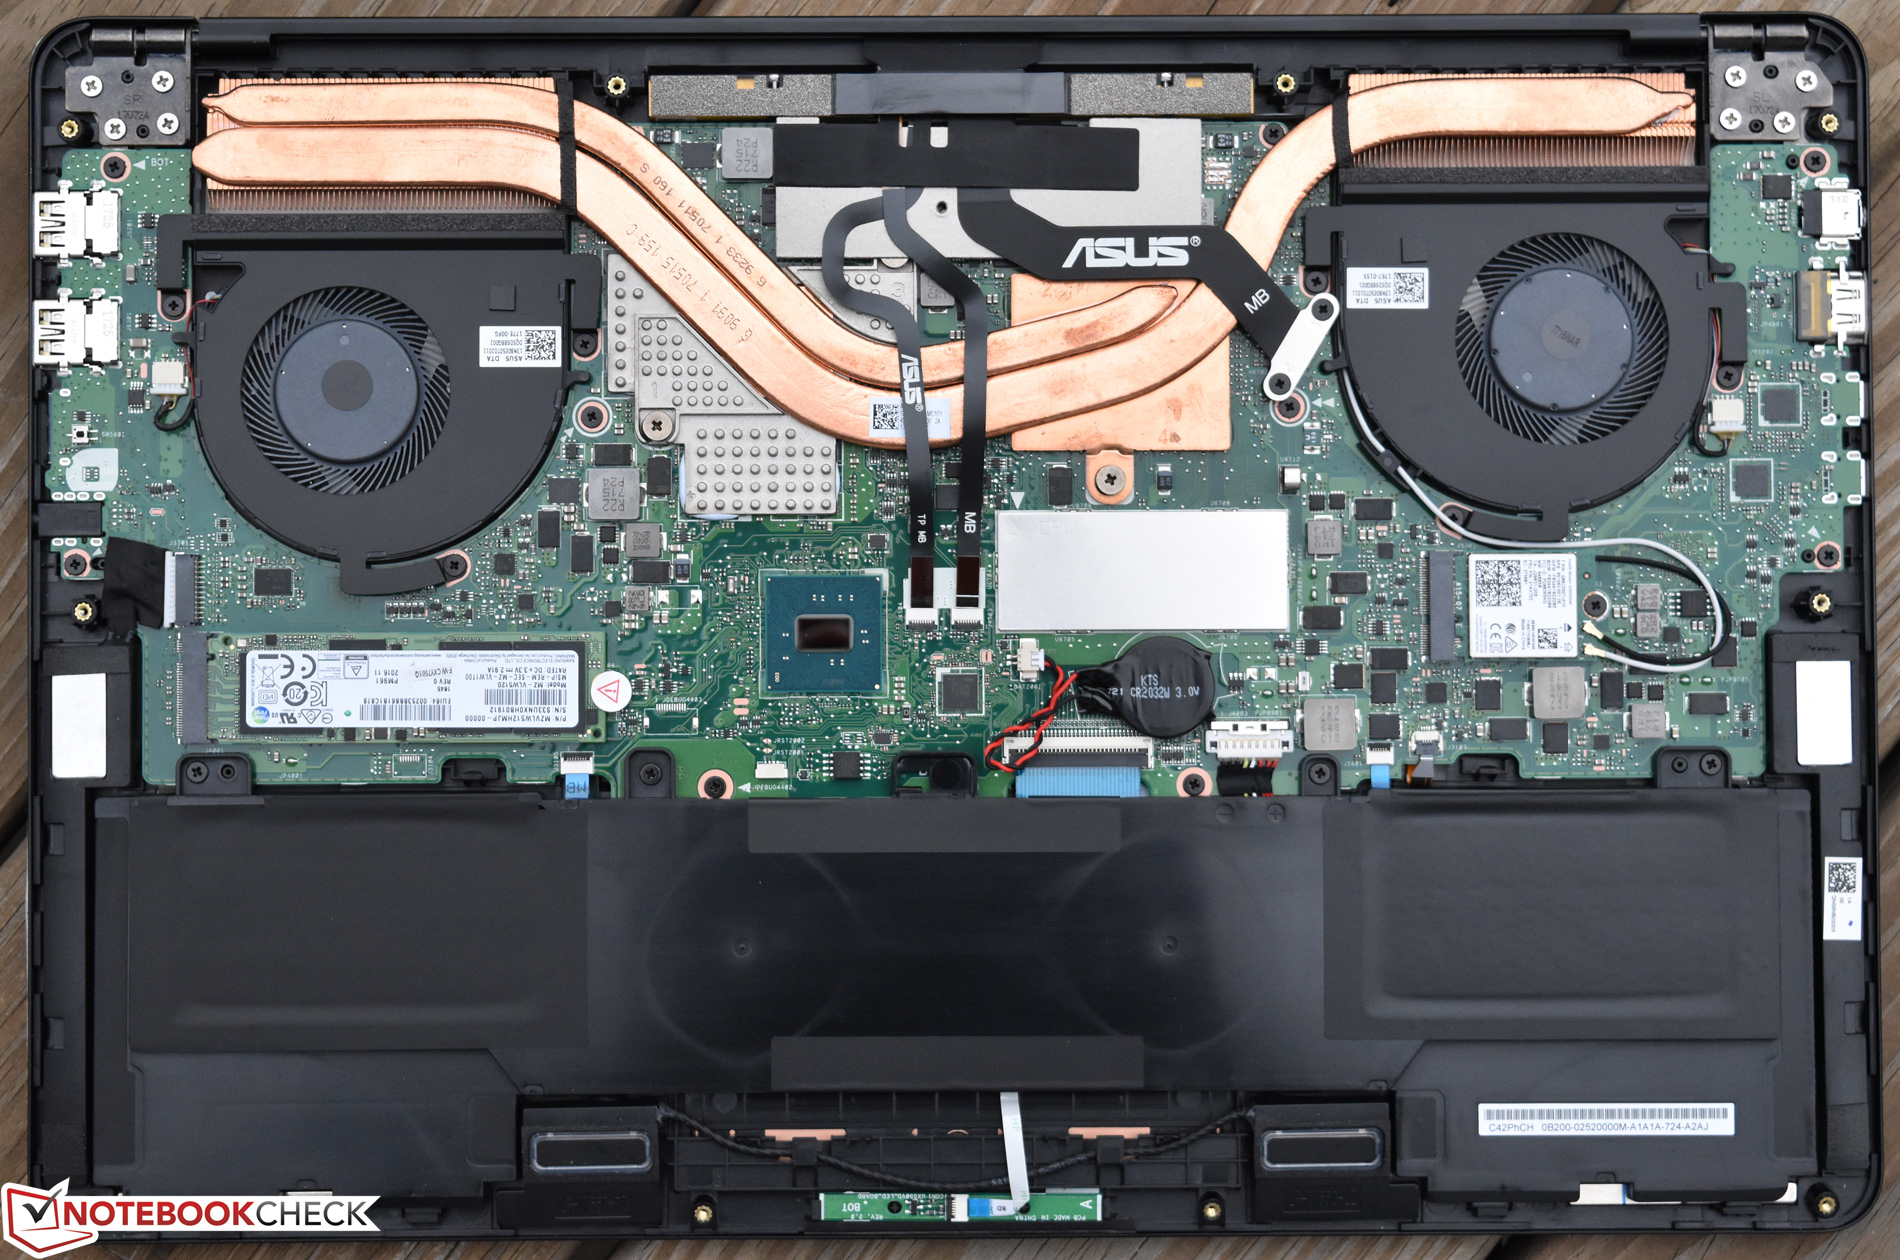
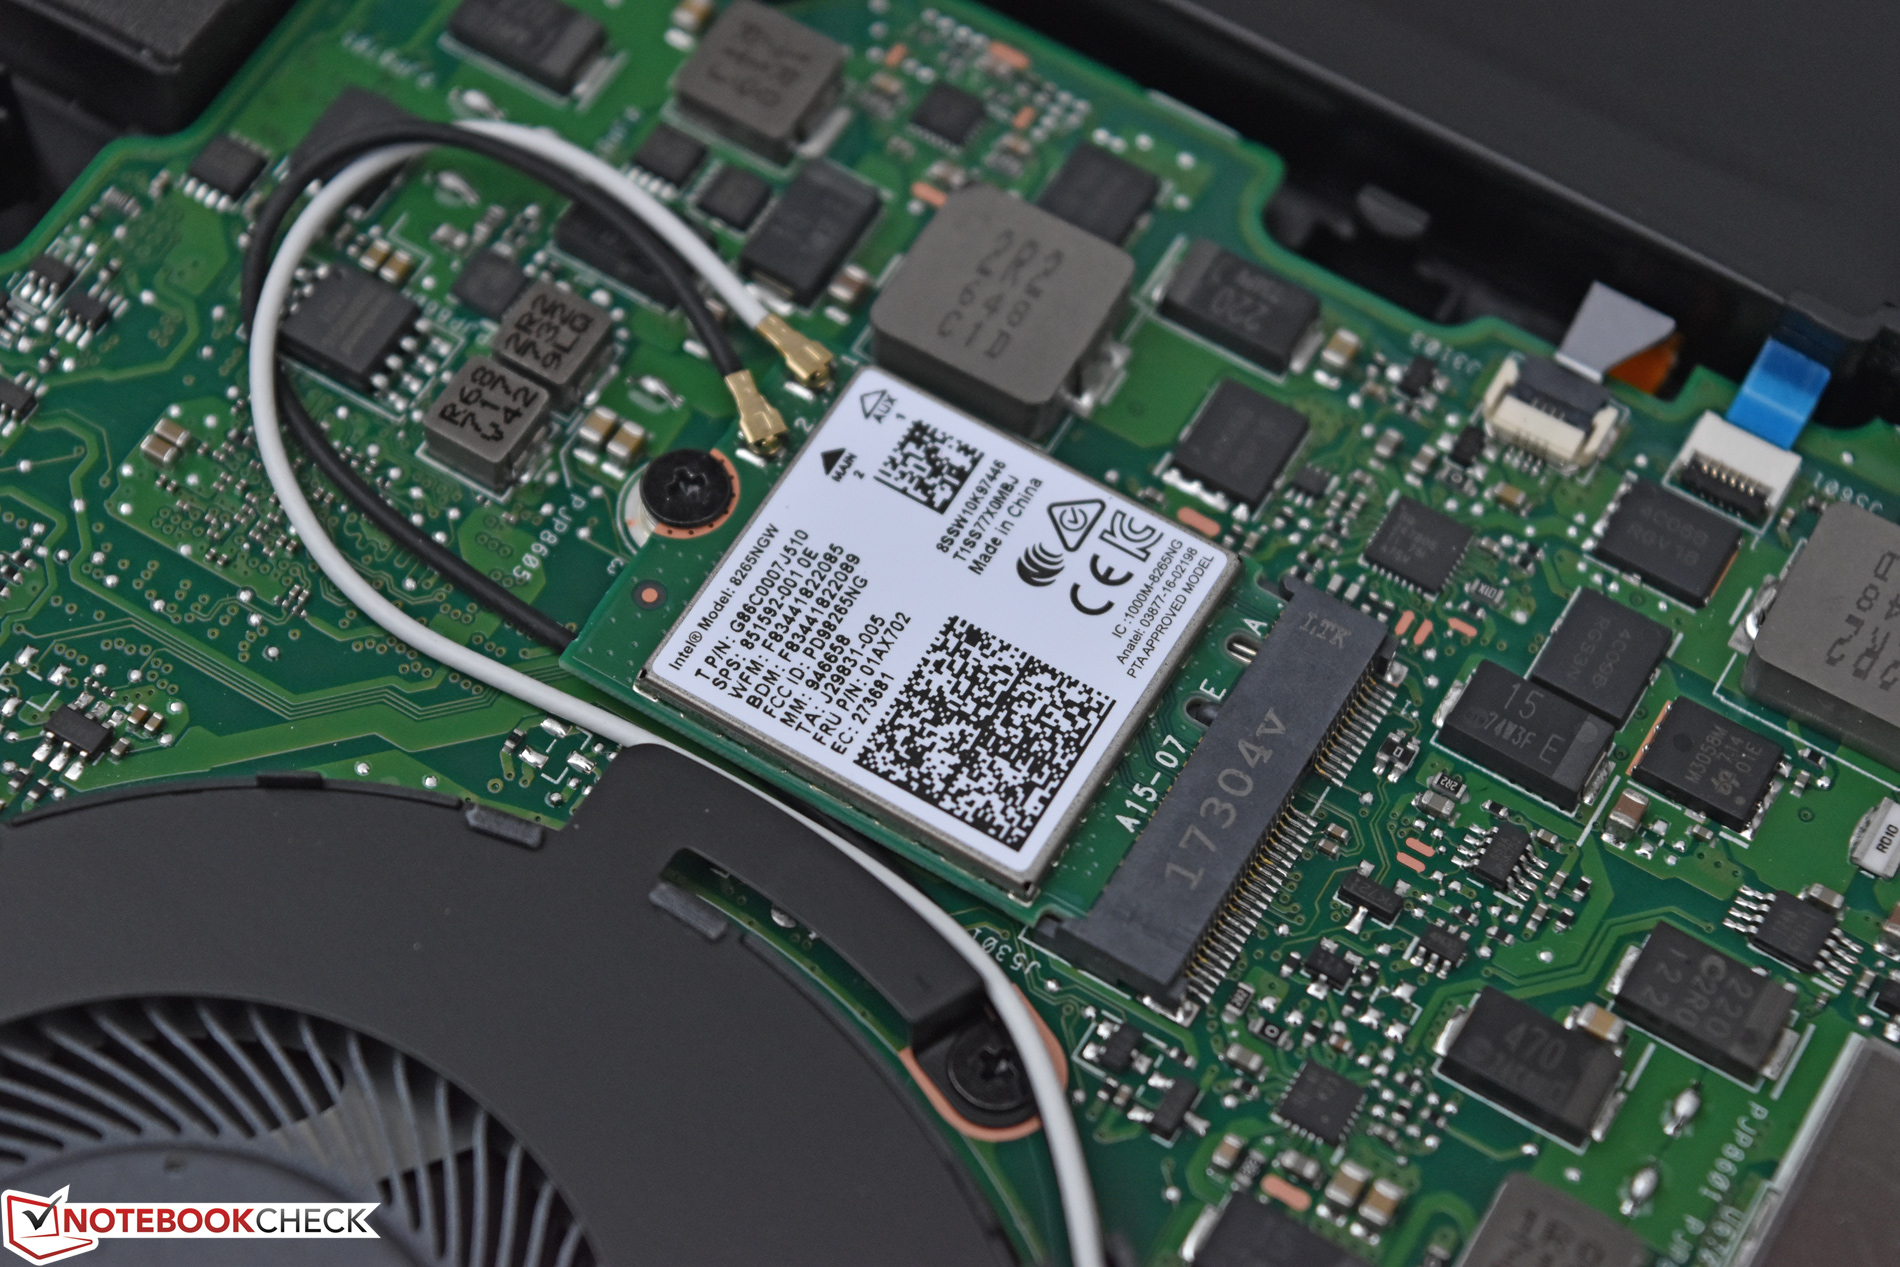
O ASUS Zenbook Pro UX550VE de $1.700, com sua GTX 1050 Ti, melhora o desempenho do UX550VD equipado com GTX 1050com muitas poucas desvantagens. Recebemos a mesma carcaça de alumínio unibody atrativa, que fornece peso e tamanho razoáveis, bem como uma seleção de portas versátil (embora o último, que substitui duas portas USB convencionais tipo A por Thunderbolt/Type-C, pode estar ligeiramente à frente de seu tempo). O aparelho também oferece um desempenho forte em rajadas curtas (bem como para o uso geral da aplicativos), tudo ao mesmo tempo que mantém os tempos de funcionamento da bateria que são bem melhores do que aqueles da concorrência. Além disso, a máquina é facilmente mantida através do painel traseiro removível.
No geral, o ZenBook Pro, no entanto, continua a ser um pacote convincente, sem maiores aspectos negativos, além de uma redução desafortunada do desempenho sob uso intenso contínuo.
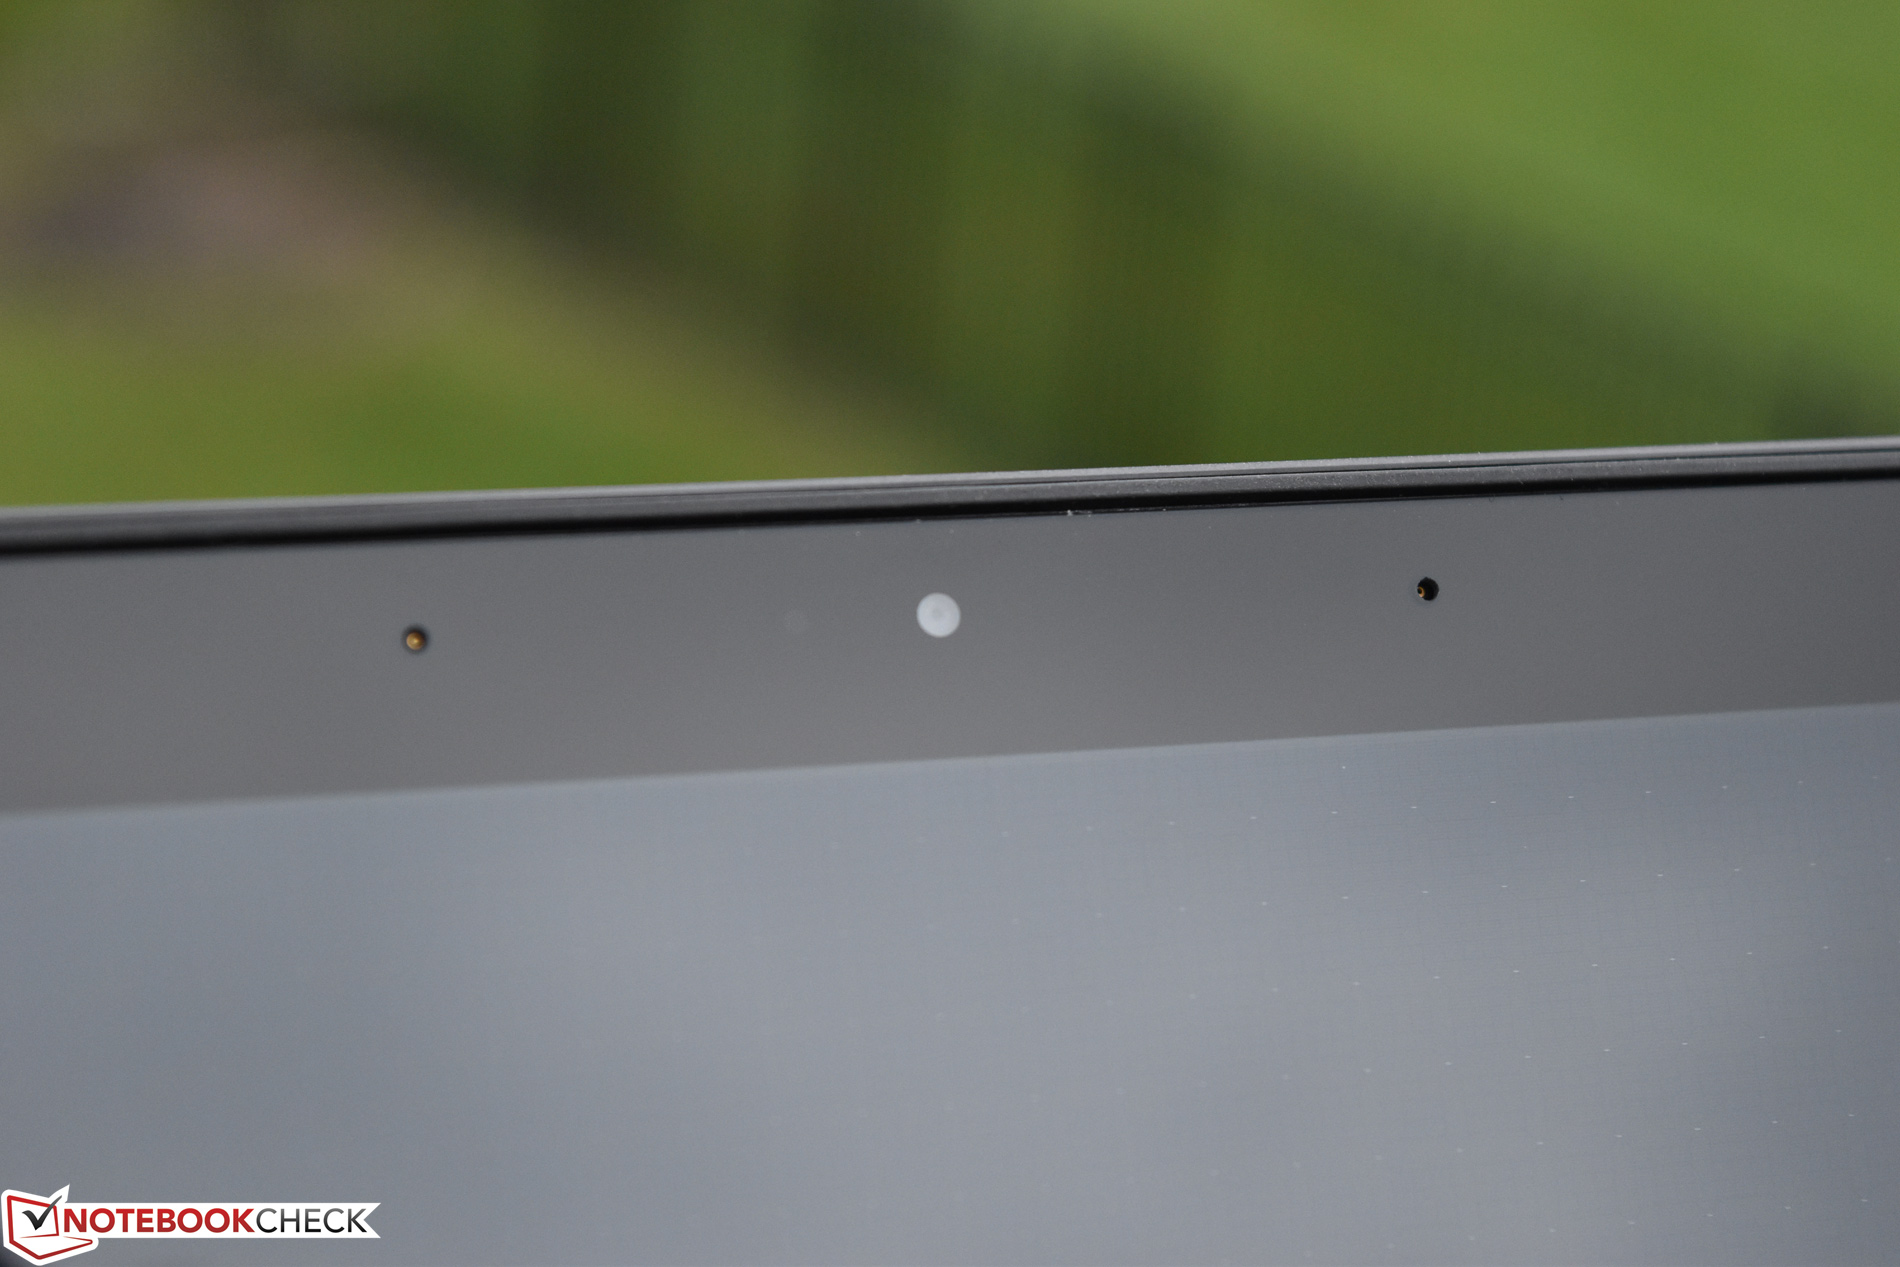
As queixas da nossa unidade de revisão anterior incluem o afogamento da CPU e GPU sob carga combinada, bem como o fato de que a GTX 1050 Ti nunca mostra todo seu potencial no Zenbook Pro mesmo quando estressado independentemente. O desempenho ainda está bem acima o modelo GTX 1050—bem como a maioria dos concorrentes de tamanho semelhante em sua classe—mas poderia ter sido ainda melhor com um sistema de resfriamento mais agressivo. Os níveis de ruído também ficaram um pouco altos sob uso intenso (conforme medido através da unidade de análise de hoje, o que, é claro, foi prejudicado pelo que parecia ser uma ventoinha de resfriamento ruim), de modo que essa é outra falha potencial em relação ao modelo anterior. Além disso, algumas outras queixas menores se aplicam - como a webcam pobre e o uso de PWM (embora, de alta frequência) em configurações de brilho abaixo de 30%, mas esse é realmente o único outro ponto negativo significativo.
Carcaças mais resistentes, melhores dispositivos de entrada e telas de maior qualidade também podem ser obtidos em portáteis concorrentes mais caros. Algumas alternativas incluem—entre outros—o Dell XPS 15 9560, Lenovo Yoga 720, MSI GS63VR, e Microsoft Surface Book 2. Mas, no geral, o ZenBook Pro, no entanto, continua a ser um pacote convincente, sem maiores aspectos negativos, além de uma redução desafortunada do desempenho sob uso intenso contínuo.
Asus Zenbook Pro UX550VE-DB71T
- 11/23/2017 v6 (old)
Steve Schardein
Price comparison
