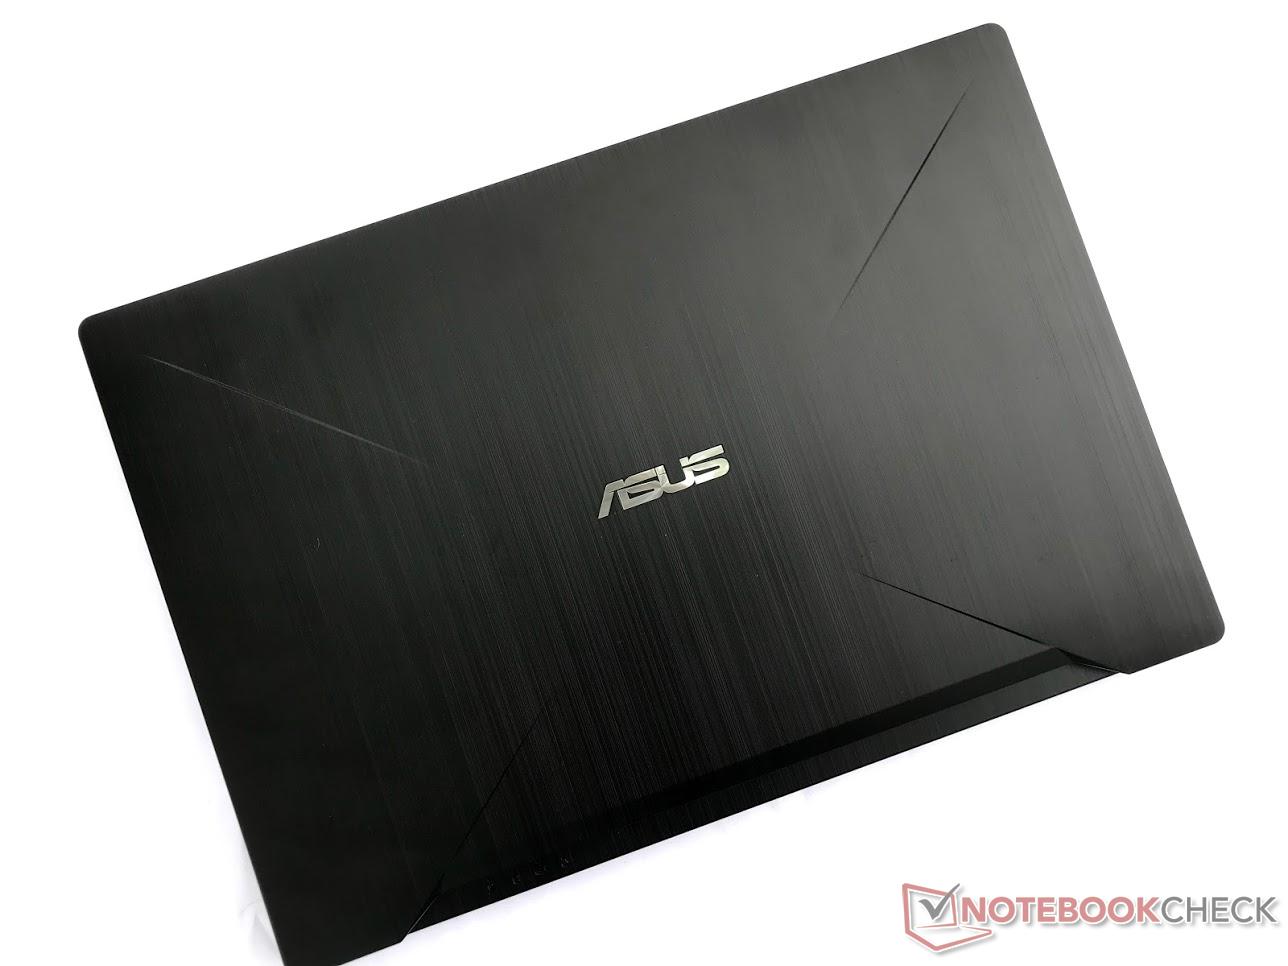
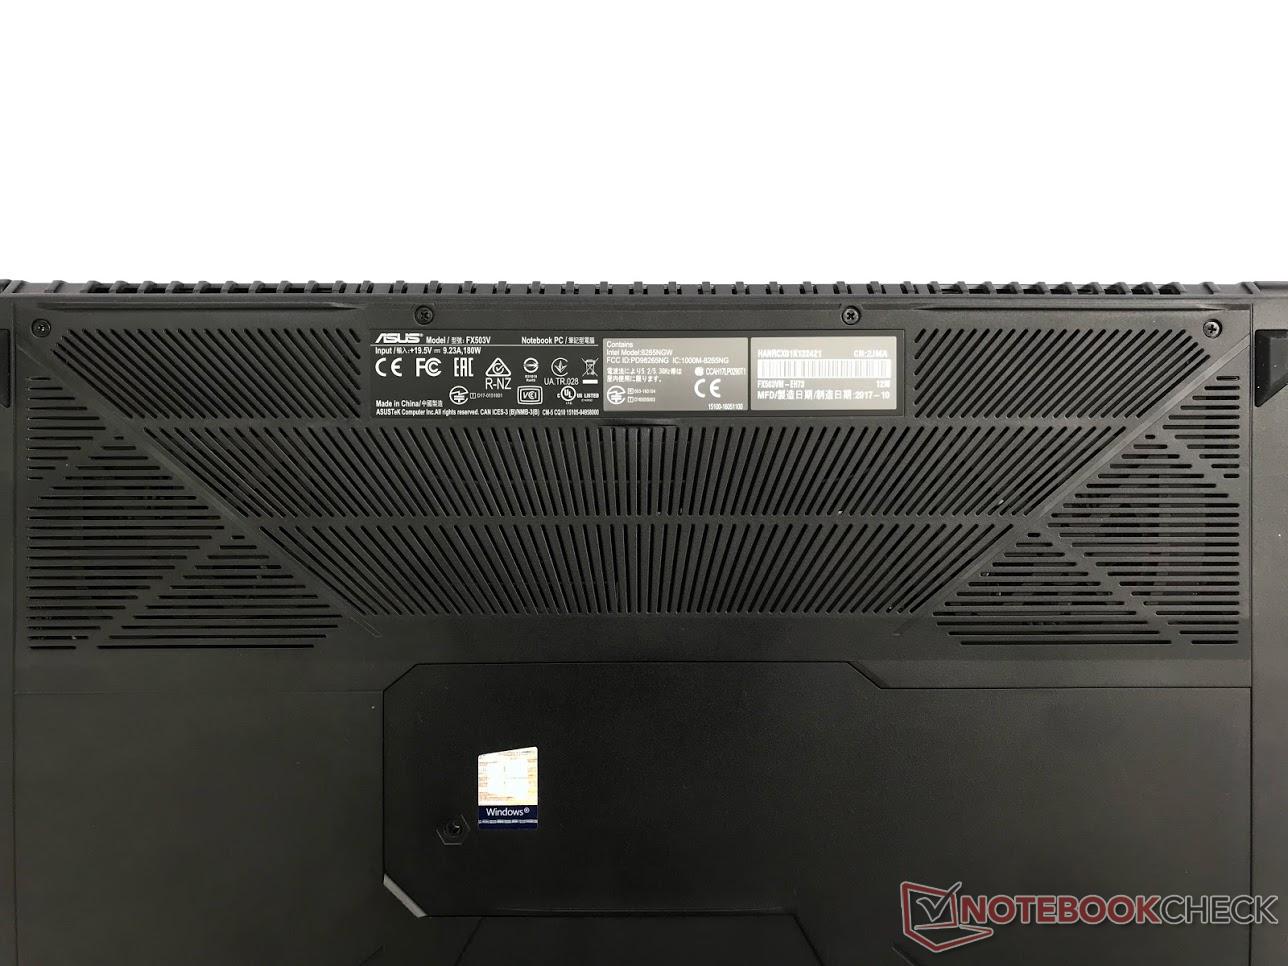
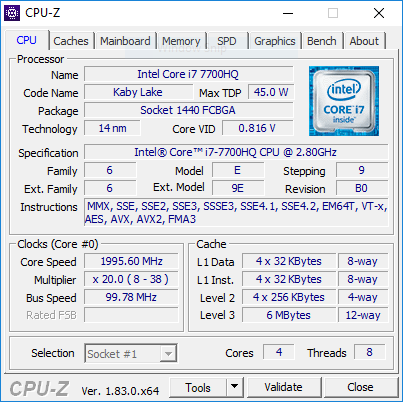
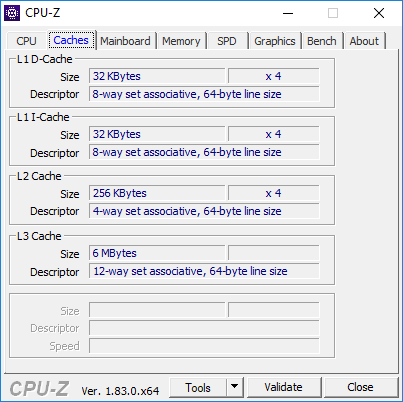
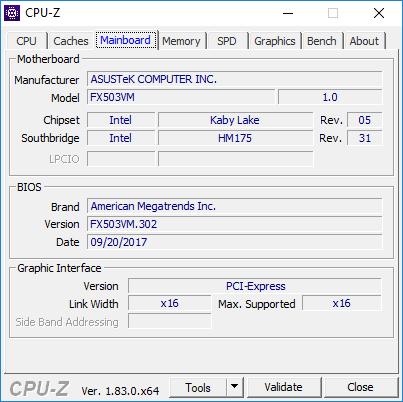
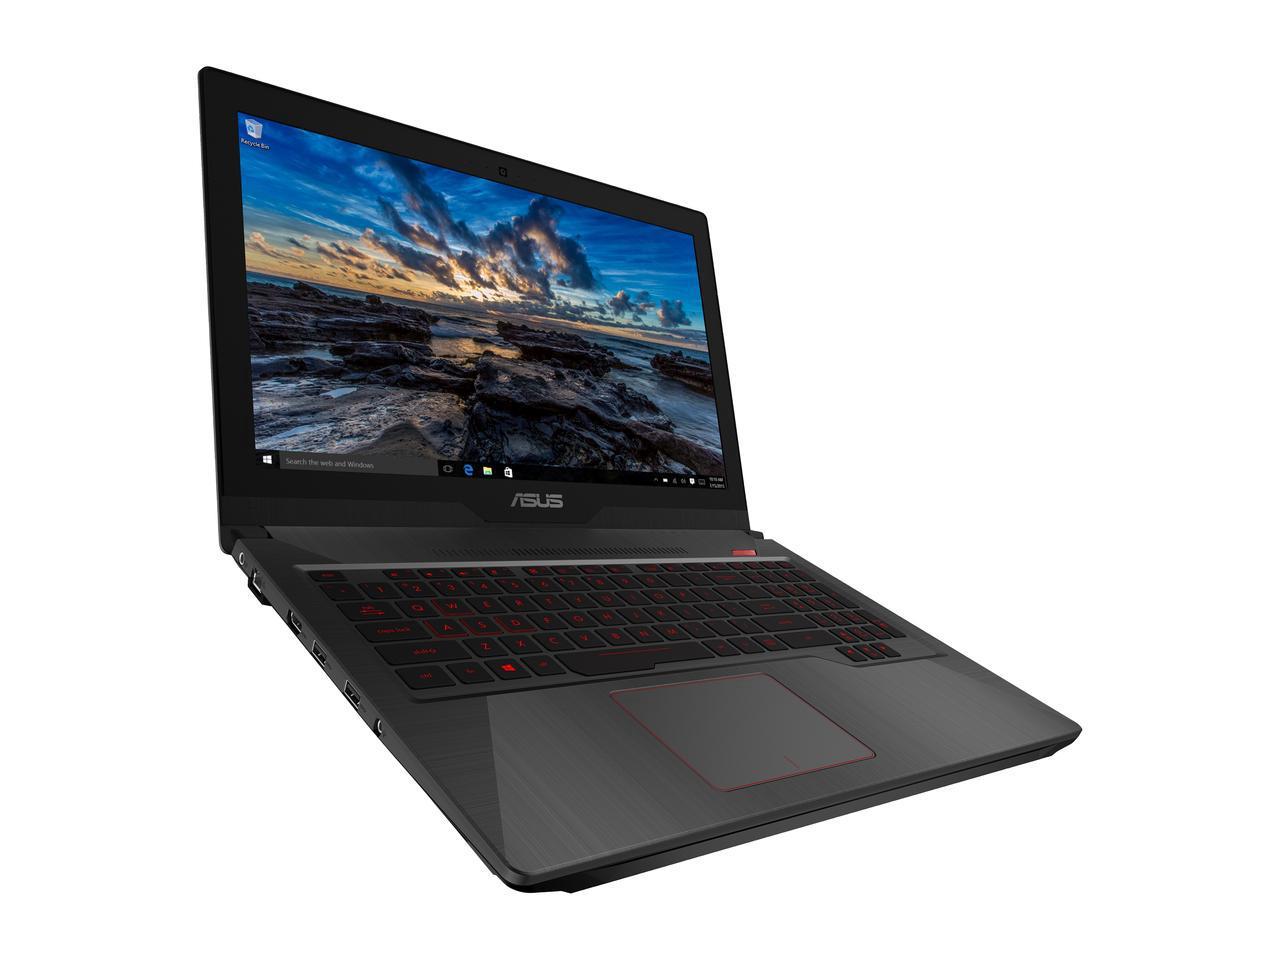
Breve Análise do Portátil Asus FX503VM (7700HQ, GTX 1060, FHD)
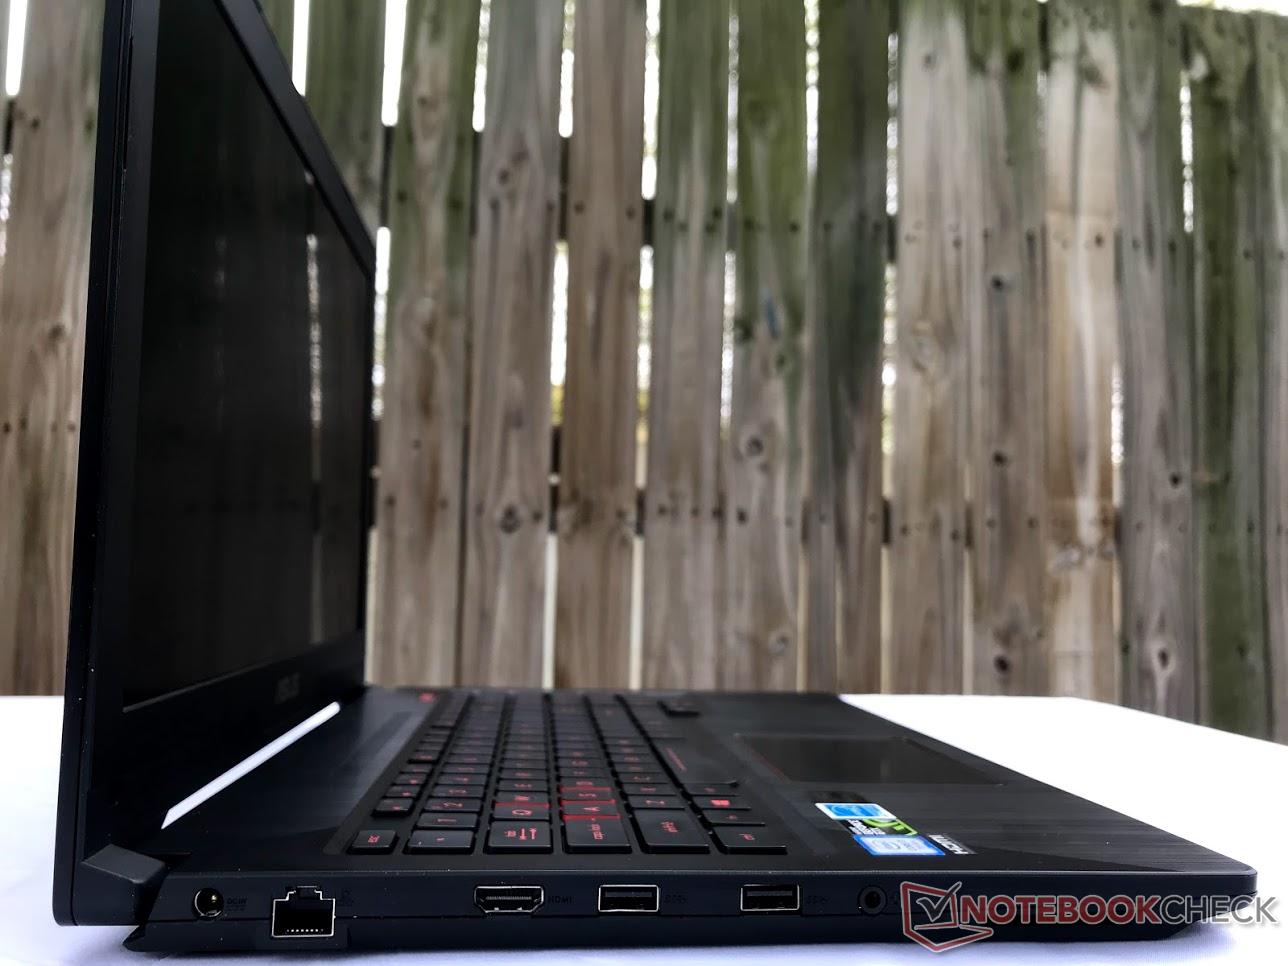
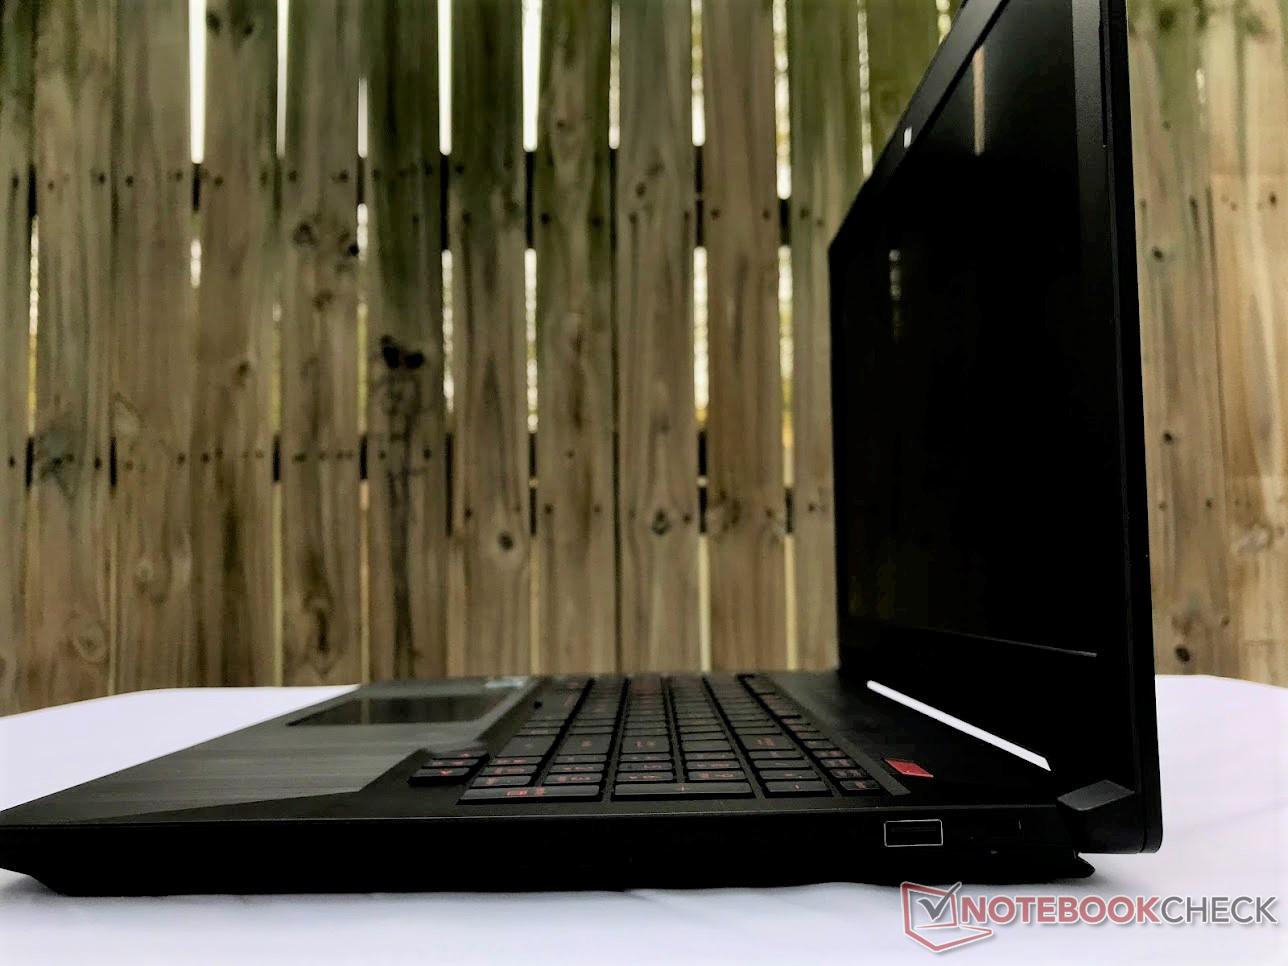
| SD Card Reader | |
| average JPG Copy Test (av. of 3 runs) | |
| Média da turma Gaming (20.9 - 210, n=54, últimos 2 anos) | |
| Asus FX502VM-AS73 (Toshiba Exceria Pro SDXC 64 GB UHS-II) | |
| HP Omen 15-ce002ng (Toshiba Exceria Pro SDXC 64 GB UHS-II) | |
| Asus FX503VM-EH73 (Toshiba Exceria Pro SDXC 64 GB UHS-II) | |
| Dell Inspiron 15 7000 7577 (Toshiba Exceria Pro SDXC 64 GB UHS-II) | |
| Acer Aspire VX5-591G-75C4 VX15 | |
| Acer Aspire VN7-593G-73HP V15 Nitro BE | |
| maximum AS SSD Seq Read Test (1GB) | |
| Média da turma Gaming (25.5 - 261, n=51, últimos 2 anos) | |
| HP Omen 15-ce002ng (Toshiba Exceria Pro SDXC 64 GB UHS-II) | |
| Asus FX502VM-AS73 (Toshiba Exceria Pro SDXC 64 GB UHS-II) | |
| Asus FX503VM-EH73 (Toshiba Exceria Pro SDXC 64 GB UHS-II) | |
| Dell Inspiron 15 7000 7577 (Toshiba Exceria Pro SDXC 64 GB UHS-II) | |
| Acer Aspire VX5-591G-75C4 VX15 | |
| Acer Aspire VN7-593G-73HP V15 Nitro BE | |
| |||||||||||||||||||||||||
iluminação: 91 %
iluminação com acumulador: 235.9 cd/m²
Contraste: 874:1 (Preto: 0.27 cd/m²)
ΔE ColorChecker Calman: 4.81 | ∀{0.5-29.43 Ø4.71}
ΔE Greyscale Calman: 3.1 | ∀{0.09-98 Ø4.96}
56% sRGB (Argyll 1.6.3 3D)
36% AdobeRGB 1998 (Argyll 1.6.3 3D)
38.72% AdobeRGB 1998 (Argyll 3D)
56.3% sRGB (Argyll 3D)
37.48% Display P3 (Argyll 3D)
Gamma: 2.31
CCT: 6984 K
| Asus FX503VM-EH73 AU Optronics B156HAN06.1, IPS, 15.6", 1920x1080 | Asus FX502VM-AS73 TN LED, 15.6", 1920x1080 | Dell Inspiron 15 7000 7577 ID: LG Philips LGD053F, Name: 156WF6, Dell P/N: 4XK13, IPS, 15.6", 1920x1080 | HP Omen 15-ce002ng AUO42ED, IPS, 15.6", 1920x1080 | Acer Aspire VN7-593G-73HP V15 Nitro BE LG Display LP156WF6-SPP1, AH-IPS, Normally Black, Transmissive, 15.6", 1920x1080 | Acer Nitro 5 AN515-51-788E LG Philips LP156WF6-SPK6, IPS, 15.6", 1920x1080 | Acer Aspire VX5-591G-75C4 VX15 LG Philips LGD0550 / LP156WF6-SPK4, IPS, 15.6", 1920x1080 | |
|---|---|---|---|---|---|---|---|
| Display | 2% | -1% | 70% | 63% | 11% | 4% | |
| Display P3 Coverage (%) | 37.48 | 38.28 2% | 37.07 -1% | 65.8 76% | 65.8 76% | 41.7 11% | 38.88 4% |
| sRGB Coverage (%) | 56.3 | 56.9 1% | 55.6 -1% | 90.9 61% | 85.1 51% | 62.2 10% | 58.2 3% |
| AdobeRGB 1998 Coverage (%) | 38.72 | 39.47 2% | 38.32 -1% | 66.5 72% | 62.2 61% | 43.17 11% | 40.2 4% |
| Response Times | 26% | 8% | -8% | -10% | 18% | 34% | |
| Response Time Grey 50% / Grey 80% * (ms) | 36.8 ? | 28.4 ? 23% | 35.6 ? 3% | 43.2 ? -17% | 41 ? -11% | 35 ? 5% | 22 ? 40% |
| Response Time Black / White * (ms) | 31.6 ? | 22.4 ? 29% | 27.6 ? 13% | 31.2 ? 1% | 34 ? -8% | 22 ? 30% | 23 ? 27% |
| PWM Frequency (Hz) | |||||||
| Screen | -19% | -4% | 33% | 22% | 3% | 1% | |
| Brightness middle (cd/m²) | 235.9 | 209.5 -11% | 235.4 0% | 304 29% | 322 36% | 276 17% | 281 19% |
| Brightness (cd/m²) | 235 | 205 -13% | 223 -5% | 289 23% | 297 26% | 265 13% | 257 9% |
| Brightness Distribution (%) | 91 | 92 1% | 91 0% | 86 -5% | 86 -5% | 91 0% | 85 -7% |
| Black Level * (cd/m²) | 0.27 | 0.69 -156% | 0.28 -4% | 0.26 4% | 0.31 -15% | 0.25 7% | 0.32 -19% |
| Contrast (:1) | 874 | 304 -65% | 841 -4% | 1169 34% | 1039 19% | 1104 26% | 878 0% |
| Colorchecker dE 2000 * | 4.81 | 4.7 2% | 5.6 -16% | 3.46 28% | 4.73 2% | 5.06 -5% | 5.16 -7% |
| Colorchecker dE 2000 max. * | 21.55 | 19.7 9% | 20.3 6% | 7.72 64% | 12.37 43% | 10.13 53% | 9.09 58% |
| Greyscale dE 2000 * | 3.1 | 1.8 42% | 3.6 -16% | 2.46 21% | 2.99 4% | 6.25 -102% | 4.57 -47% |
| Gamma | 2.31 95% | 2.23 99% | 2.23 99% | 2.38 92% | 2.32 95% | 1.76 125% | 2.59 85% |
| CCT | 6984 93% | 6975 93% | 7214 90% | 6915 94% | 6905 94% | 6873 95% | 6931 94% |
| Color Space (Percent of AdobeRGB 1998) (%) | 36 | 36.2 1% | 35.2 -2% | 59 64% | 56 56% | 40 11% | 37 3% |
| Color Space (Percent of sRGB) (%) | 56 | 56.6 1% | 55.4 -1% | 91 63% | 85 52% | 62 11% | 58 4% |
| Média Total (Programa/Configurações) | 3% /
-9% | 1% /
-2% | 32% /
35% | 25% /
26% | 11% /
7% | 13% /
6% |
* ... menor é melhor
Exibir tempos de resposta
| ↔ Tempo de resposta preto para branco | ||
|---|---|---|
| 31.6 ms ... ascensão ↗ e queda ↘ combinadas | ↗ 18.4 ms ascensão |  |
| ↘ 13.2 ms queda | ||
| A tela mostra taxas de resposta lentas em nossos testes e será insatisfatória para os jogadores. Em comparação, todos os dispositivos testados variam de 0.1 (mínimo) a 240 (máximo) ms. » 85 % de todos os dispositivos são melhores. Isso significa que o tempo de resposta medido é pior que a média de todos os dispositivos testados (19.8 ms). | ||
| ↔ Tempo de resposta 50% cinza a 80% cinza | ||
| 36.8 ms ... ascensão ↗ e queda ↘ combinadas | ↗ 19.6 ms ascensão | 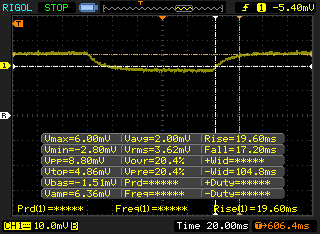 |
| ↘ 17.2 ms queda | ||
| A tela mostra taxas de resposta lentas em nossos testes e será insatisfatória para os jogadores. Em comparação, todos os dispositivos testados variam de 0.165 (mínimo) a 636 (máximo) ms. » 53 % de todos os dispositivos são melhores. Isso significa que o tempo de resposta medido é pior que a média de todos os dispositivos testados (31 ms). | ||
Cintilação da tela / PWM (modulação por largura de pulso)
| Tela tremeluzindo / PWM não detectado | 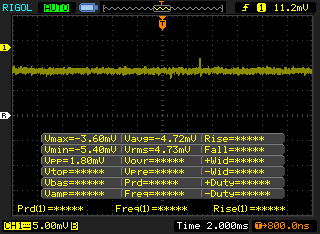 | ||
[pwm_comparison] Em comparação: 52 % de todos os dispositivos testados não usam PWM para escurecer a tela. Se PWM foi detectado, uma média de 7757 (mínimo: 5 - máximo: 343500) Hz foi medida. | |||
| Cinebench R15 | |
| CPU Single 64Bit | |
| Média da turma Gaming (188.8 - 350, n=106, últimos 2 anos) | |
| Asus ZenBook Flip 15 UX561UD | |
| HP Omen X 17-ap0xx | |
| HP Omen 15-ce002ng | |
| Asus FX503VM-EH73 | |
| Média Intel Core i7-7700HQ (120 - 162, n=110) | |
| Acer Aspire 5 A515-51G-509A | |
| Asus FX502VM-AS73 | |
| Alienware 13 R3 (i5-7300HQ, GTX 1050 Ti) | |
| Dell Inspiron 15 7000 7577 | |
| CPU Multi 64Bit | |
| Média da turma Gaming (1578 - 6330, n=105, últimos 2 anos) | |
| HP Omen X 17-ap0xx | |
| Asus ZenBook Flip 15 UX561UD | |
| HP Omen 15-ce002ng | |
| Asus FX503VM-EH73 | |
| Média Intel Core i7-7700HQ (603 - 747, n=111) | |
| Asus FX502VM-AS73 | |
| Acer Aspire 5 A515-51G-509A | |
| Dell Inspiron 15 7000 7577 | |
| Alienware 13 R3 (i5-7300HQ, GTX 1050 Ti) | |
* ... menor é melhor
| PCMark 8 Home Score Accelerated v2 | 4940 pontos | |
| PCMark 8 Creative Score Accelerated v2 | 7238 pontos | |
| PCMark 8 Work Score Accelerated v2 | 5174 pontos | |
| PCMark 10 Score | 4856 pontos | |
Ajuda | ||
| Asus FX503VM-EH73 SanDisk SD8SN8U128G1002 | Asus FX502VM-AS73 SK Hynix HFS256G39TND-N210A | Dell Inspiron 15 7000 7577 Samsung PM961 MZVLW256HEHP | Lenovo Legion Y520-15IKBM 80YY001APB ADATA SX7000NP 256 GB | Acer Nitro 5 AN515-51-788E Intel SSD 600p SSDPEKKW256G7 | |
|---|---|---|---|---|---|
| AS SSD | -9% | 199% | 60% | 41% | |
| Copy Game MB/s (MB/s) | 155.3 | 382.5 | 708 | ||
| Copy Program MB/s (MB/s) | 120.7 | 274.8 | 225.8 | ||
| Copy ISO MB/s (MB/s) | 202.2 | 814 | 1076 | ||
| Score Total (Points) | 798 | 822 3% | 2405 201% | 898 13% | 984 23% |
| Score Write (Points) | 178 | 200 12% | 594 234% | 291 63% | 344 93% |
| Score Read (Points) | 411 | 418 2% | 1241 202% | 409 0% | 446 9% |
| Access Time Write * (ms) | 0.09 | 0.266 -196% | 0.037 59% | 0.033 63% | 0.231 -157% |
| Access Time Read * (ms) | 0.17 | 0.104 39% | 0.058 66% | 0.069 59% | 0.129 24% |
| 4K-64 Write (MB/s) | 95.5 | 123.8 30% | 375.8 294% | 100.7 5% | 217.1 127% |
| 4K-64 Read (MB/s) | 343.4 | 342.3 0% | 929 171% | 255.9 -25% | 278 -19% |
| 4K Write (MB/s) | 46.48 | 63.6 37% | 100.2 116% | 110.6 138% | 75 61% |
| 4K Read (MB/s) | 20.44 | 26.01 27% | 46.95 130% | 30.9 51% | 27.86 36% |
| Seq Write (MB/s) | 328.4 | 130 -60% | 1181 260% | 795 142% | 521 59% |
| Seq Read (MB/s) | 476.3 | 492.6 3% | 2652 457% | 1221 156% | 1404 195% |
* ... menor é melhor

| 3DMark 11 Performance | 11823 pontos | |
| 3DMark Ice Storm Standard Score | 132724 pontos | |
| 3DMark Cloud Gate Standard Score | 25238 pontos | |
| 3DMark Fire Strike Score | 9739 pontos | |
| 3DMark Fire Strike Extreme Score | 5094 pontos | |
| 3DMark Time Spy Score | 3621 pontos | |
Ajuda | ||
| The Witcher 3 - 1920x1080 Ultra Graphics & Postprocessing (HBAO+) (classificar por valor) | |
| Asus FX503VM-EH73 | |
| Dell Inspiron 15 7000 7577 | |
| Lenovo Legion Y520-15IKBM 80YY001APB | |
| HP Omen 15-ce002ng | |
| Acer Aspire VN7-593G-73HP V15 Nitro BE | |
| Acer Nitro 5 AN515-51-788E | |
| Acer Aspire VX5-591G-75C4 VX15 | |
| MSI GE63VR 7RF Raider | |
| Gigabyte Aero 15X | |
| Aorus X5 v7 | |
| Média NVIDIA GeForce GTX 1060 Mobile (24 - 42.3, n=60) | |
| Média da turma Gaming (104.7 - 240, n=7, últimos 2 anos) | |
| Fallout 4 - 1920x1080 Ultra Preset AA:T AF:16x (classificar por valor) | |
| Asus FX503VM-EH73 | |
| Asus FX502VM-AS73 | |
| Dell Inspiron 15 7000 7577 | |
| Média NVIDIA GeForce GTX 1060 Mobile (57.1 - 77, n=17) | |
| Rise of the Tomb Raider - 1920x1080 Very High Preset AA:FX AF:16x (classificar por valor) | |
| Asus FX503VM-EH73 | |
| Asus FX502VM-AS73 | |
| Dell Inspiron 15 7000 7577 | |
| HP Omen 15-ce002ng | |
| Acer Aspire VN7-593G-73HP V15 Nitro BE | |
| MSI GE63VR 7RF Raider | |
| Aorus X5 v7 | |
| Acer Nitro 5 Spin NP515-51-86CX | |
| Média NVIDIA GeForce GTX 1060 Mobile (51 - 68.8, n=37) | |
| Hitman 2016 - 1920x1080 Ultra / On AA:SM AF:16x (classificar por valor) | |
| Asus FX503VM-EH73 | |
| Média NVIDIA GeForce GTX 1060 Mobile (46 - 61, n=7) | |
| Doom - 1920x1080 Ultra Preset AA:SM (classificar por valor) | |
| Asus FX503VM-EH73 | |
| Asus FX502VM-AS73 | |
| HP Omen 15-ce002ng | |
| Aorus X5 v7 | |
| Média NVIDIA GeForce GTX 1060 Mobile (66 - 103.3, n=17) | |
| Deus Ex Mankind Divided - 1920x1080 Ultra Preset AA:2xMS AF:8x (classificar por valor) | |
| Asus FX503VM-EH73 | |
| HP Omen 15-ce002ng | |
| Acer Aspire VN7-593G-73HP V15 Nitro BE | |
| MSI GE63VR 7RF Raider | |
| Média NVIDIA GeForce GTX 1060 Mobile (26.9 - 39, n=11) | |
| Civilization 6 - 1920x1080 Ultra Preset AA:4xMS (classificar por valor) | |
| Asus FX503VM-EH73 | |
| Média NVIDIA GeForce GTX 1060 Mobile (42.8 - 71, n=5) | |
| Prey - 1920x1080 Very High Preset AA:2TX SM AF:16x (classificar por valor) | |
| Asus FX503VM-EH73 | |
| Dell Inspiron 15 7000 7577 | |
| HP Omen 15-ce002ng | |
| Acer Nitro 5 AN515-51-788E | |
| Média NVIDIA GeForce GTX 1060 Mobile (97 - 110.3, n=7) | |
| Rocket League - 1920x1080 High Quality AA:High FX (classificar por valor) | |
| Asus FX503VM-EH73 | |
| HP Omen 15-ce002ng | |
| Acer Nitro 5 AN515-51-788E | |
| Média NVIDIA GeForce GTX 1060 Mobile (136 - 181, n=7) | |
| Playerunknown's Battlegrounds (PUBG) - 1920x1080 High Preset (classificar por valor) | |
| Asus FX503VM-EH73 | |
| Acer Nitro 5 AN515-51-788E | |
| Média NVIDIA GeForce GTX 1060 Mobile (61 - 69.4, n=4) | |
| Middle-earth: Shadow of War - 1920x1080 Ultra Preset AA:T (classificar por valor) | |
| Asus FX503VM-EH73 | |
| Dell Inspiron 15 7000 7577 | |
| Gigabyte Aero 15X | |
| Média NVIDIA GeForce GTX 1060 Mobile (52 - 54, n=5) | |
| Kingdom Come: Deliverance - 1920x1080 Ultra High Preset (classificar por valor) | |
| Asus FX503VM-EH73 | |
| Média NVIDIA GeForce GTX 1060 Mobile (36 - 45.2, n=5) | |
| baixo | média | alto | ultra | |
|---|---|---|---|---|
| The Witcher 3 (2015) | 37 | |||
| Fallout 4 (2015) | 73 | |||
| Rise of the Tomb Raider (2016) | 57 | |||
| Hitman 2016 (2016) | 61 | |||
| Doom (2016) | 92 | |||
| Deus Ex Mankind Divided (2016) | 39 | |||
| Civilization 6 (2016) | 71 | |||
| Prey (2017) | 97 | |||
| Rocket League (2017) | 145 | |||
| Playerunknown's Battlegrounds (PUBG) (2017) | 61 | |||
| Middle-earth: Shadow of War (2017) | 52 | |||
| Kingdom Come: Deliverance (2018) | 38 |
Barulho
| Ocioso |
| 29.6 / 29.6 / 29.6 dB |
| Carga |
| 37.3 / 53.7 dB |
 | ||
30 dB silencioso 40 dB(A) audível 50 dB(A) ruidosamente alto |
||
min: | ||
| Asus FX503VM-EH73 GeForce GTX 1060 Mobile, i7-7700HQ, SanDisk SD8SN8U128G1002 | Asus FX502VM-AS73 GeForce GTX 1060 Mobile, i7-7700HQ, SK Hynix HFS256G39TND-N210A | Dell Inspiron 15 7000 7577 GeForce GTX 1060 Max-Q, i5-7300HQ, Samsung PM961 MZVLW256HEHP | Lenovo Legion Y520-15IKBM 80YY001APB GeForce GTX 1060 Max-Q, i5-7300HQ, ADATA SX7000NP 256 GB | HP Omen 15-ce002ng GeForce GTX 1060 Max-Q, i7-7700HQ, Samsung PM961 MZVLW256HEHP | Acer Aspire VN7-593G-73HP V15 Nitro BE GeForce GTX 1060 Mobile, i7-7700HQ, Seagate Mobile HDD 1TB ST1000LM035 | Acer Nitro 5 AN515-51-788E GeForce GTX 1050 Ti Mobile, i7-7700HQ, Intel SSD 600p SSDPEKKW256G7 | Acer Aspire VX5-591G-75C4 VX15 GeForce GTX 1050 Ti Mobile, i7-7700HQ, Toshiba MQ01ABD100 | |
|---|---|---|---|---|---|---|---|---|
| Noise | -6% | 10% | -4% | -5% | -1% | -0% | -1% | |
| desligado / ambiente * (dB) | 27.8 | 28.7 -3% | 28 -1% | 30 -8% | 30.4 -9% | 30.6 -10% | 30.4 -9% | |
| Idle Minimum * (dB) | 29.6 | 30.6 -3% | 28 5% | 30.5 -3% | 30 -1% | 30.9 -4% | 30.6 -3% | 31.4 -6% |
| Idle Average * (dB) | 29.6 | 30.6 -3% | 28 5% | 33 -11% | 33 -11% | 30.9 -4% | 30.7 -4% | 31.4 -6% |
| Idle Maximum * (dB) | 29.6 | 31 -5% | 28 5% | 36.1 -22% | 37 -25% | 31.5 -6% | 30.7 -4% | 31.4 -6% |
| Load Average * (dB) | 37.3 | 46.2 -24% | 30.3 19% | 39.4 -6% | 41 -10% | 40.7 -9% | 43 -15% | 36.8 1% |
| Witcher 3 ultra * (dB) | 49.8 | 39.5 21% | 42 16% | 45.5 9% | 39.7 20% | |||
| Load Maximum * (dB) | 53.7 | 52.3 3% | 46.5 13% | 41.5 23% | 50 7% | 43.9 18% | 45.8 15% | 41.3 23% |
* ... menor é melhor
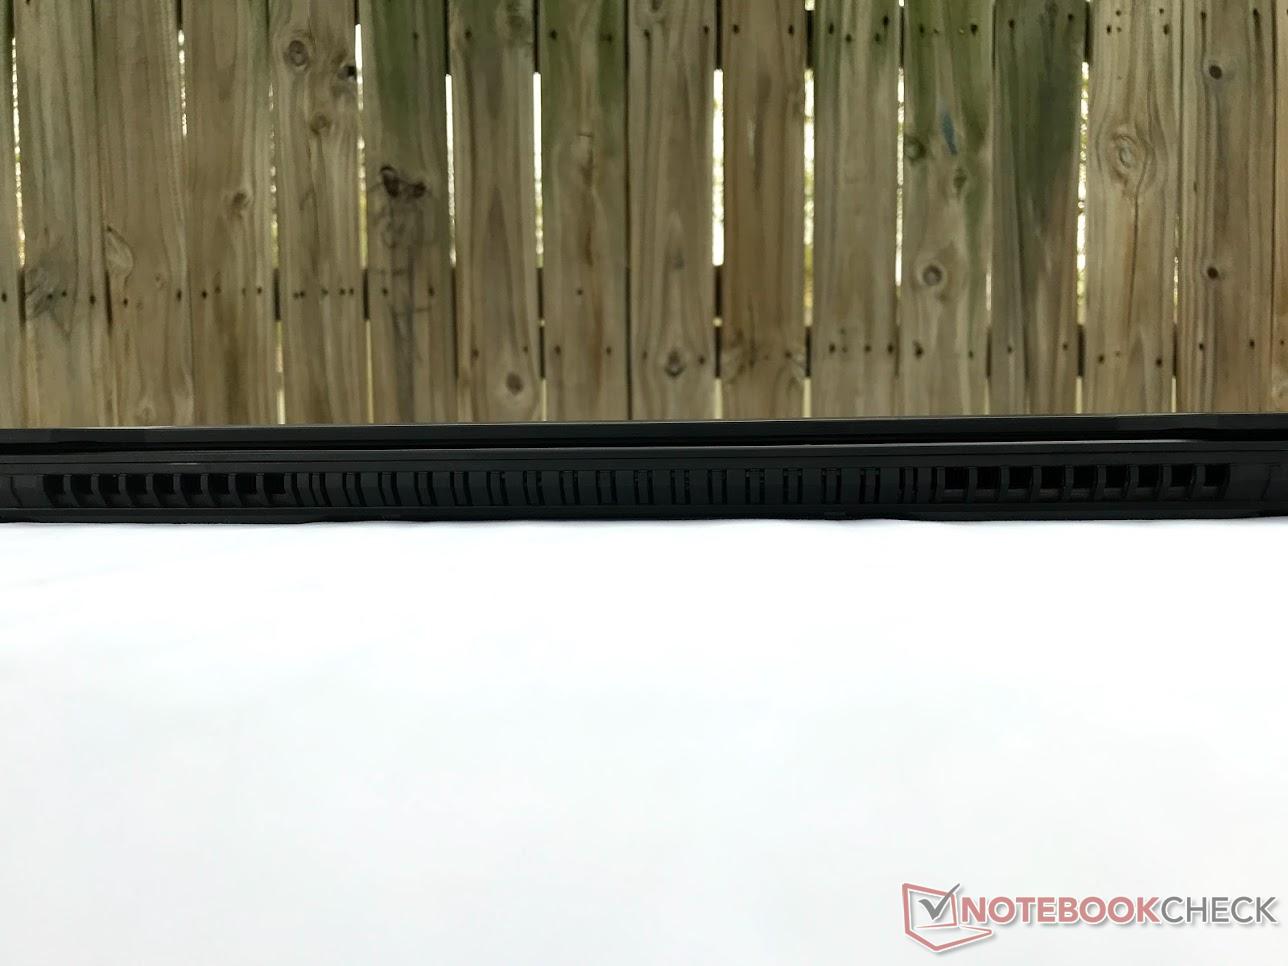
(-) A temperatura máxima no lado superior é 59.6 °C / 139 F, em comparação com a média de 40.4 °C / 105 F , variando de 21.2 a 68.8 °C para a classe Gaming.
(-) A parte inferior aquece até um máximo de 56 °C / 133 F, em comparação com a média de 43.2 °C / 110 F
(+) Em uso inativo, a temperatura média para o lado superior é 28.3 °C / 83 F, em comparação com a média do dispositivo de 33.9 °C / ### class_avg_f### F.
(±) Jogando The Witcher 3, a temperatura média para o lado superior é 33.5 °C / 92 F, em comparação com a média do dispositivo de 33.9 °C / ## #class_avg_f### F.
(+) Os apoios para as mãos e o touchpad são mais frios que a temperatura da pele, com um máximo de 25.2 °C / 77.4 F e, portanto, são frios ao toque.
(+) A temperatura média da área do apoio para as mãos de dispositivos semelhantes foi 28.8 °C / 83.8 F (+3.6 °C / 6.4 F).
Asus FX503VM-EH73 análise de áudio
(-) | alto-falantes não muito altos (###valor### dB)
Graves 100 - 315Hz
(±) | graves reduzidos - em média 11.5% menor que a mediana
(±) | a linearidade dos graves é média (14.8% delta para a frequência anterior)
Médios 400 - 2.000 Hz
(+) | médios equilibrados - apenas 1.9% longe da mediana
(+) | médios são lineares (6.7% delta para frequência anterior)
Altos 2 - 16 kHz
(+) | agudos equilibrados - apenas 4.2% longe da mediana
(±) | a linearidade dos máximos é média (7.6% delta para frequência anterior)
Geral 100 - 16.000 Hz
(±) | a linearidade do som geral é média (19.4% diferença em relação à mediana)
Comparado com a mesma classe
» 67% de todos os dispositivos testados nesta classe foram melhores, 7% semelhantes, 26% piores
» O melhor teve um delta de 6%, a média foi 18%, o pior foi 132%
Comparado com todos os dispositivos testados
» 48% de todos os dispositivos testados foram melhores, 7% semelhantes, 45% piores
» O melhor teve um delta de 4%, a média foi 23%, o pior foi 134%
Asus FX502VM-AS73 análise de áudio
(-) | alto-falantes não muito altos (###valor### dB)
Graves 100 - 315Hz
(±) | graves reduzidos - em média 14% menor que a mediana
(±) | a linearidade dos graves é média (12.6% delta para a frequência anterior)
Médios 400 - 2.000 Hz
(+) | médios equilibrados - apenas 2.7% longe da mediana
(±) | a linearidade dos médios é média (11.5% delta para frequência anterior)
Altos 2 - 16 kHz
(+) | agudos equilibrados - apenas 4.9% longe da mediana
(±) | a linearidade dos máximos é média (11.4% delta para frequência anterior)
Geral 100 - 16.000 Hz
(±) | a linearidade do som geral é média (29.9% diferença em relação à mediana)
Comparado com a mesma classe
» 95% de todos os dispositivos testados nesta classe foram melhores, 2% semelhantes, 3% piores
» O melhor teve um delta de 6%, a média foi 18%, o pior foi 132%
Comparado com todos os dispositivos testados
» 88% de todos os dispositivos testados foram melhores, 3% semelhantes, 9% piores
» O melhor teve um delta de 4%, a média foi 23%, o pior foi 134%
Dell Inspiron 15 7000 7577 análise de áudio
(±) | o volume do alto-falante é médio, mas bom (###valor### dB)
Graves 100 - 315Hz
(±) | graves reduzidos - em média 13% menor que a mediana
(+) | o baixo é linear (6.8% delta para a frequência anterior)
Médios 400 - 2.000 Hz
(+) | médios equilibrados - apenas 2.7% longe da mediana
(+) | médios são lineares (5.3% delta para frequência anterior)
Altos 2 - 16 kHz
(±) | máximos mais altos - em média 8% maior que a mediana
(±) | a linearidade dos máximos é média (10.6% delta para frequência anterior)
Geral 100 - 16.000 Hz
(±) | a linearidade do som geral é média (18.9% diferença em relação à mediana)
Comparado com a mesma classe
» 63% de todos os dispositivos testados nesta classe foram melhores, 8% semelhantes, 29% piores
» O melhor teve um delta de 6%, a média foi 18%, o pior foi 132%
Comparado com todos os dispositivos testados
» 44% de todos os dispositivos testados foram melhores, 8% semelhantes, 48% piores
» O melhor teve um delta de 4%, a média foi 23%, o pior foi 134%
| desligado | |
| Ocioso | |
| Carga |
|
Key:
min: | |
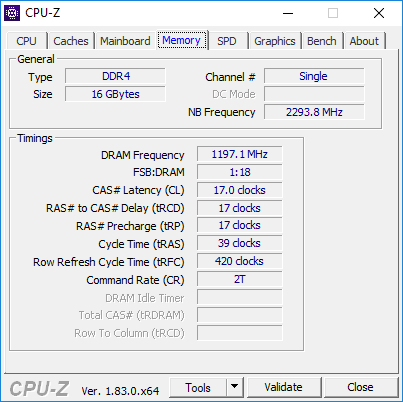
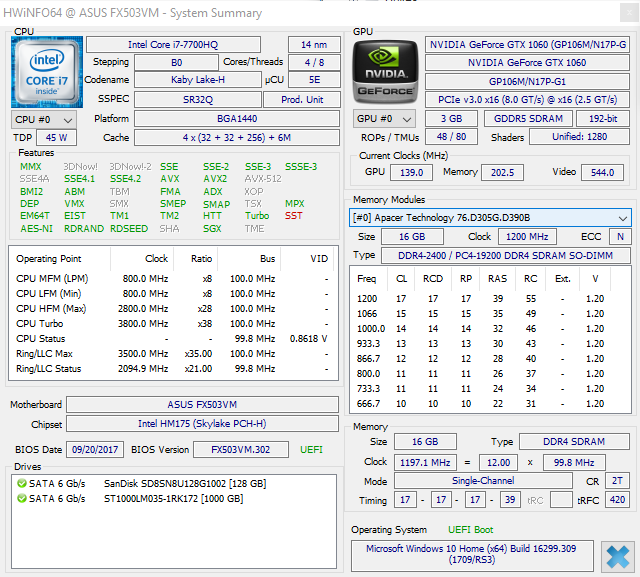
| Asus FX503VM-EH73 i7-7700HQ, GeForce GTX 1060 Mobile, SanDisk SD8SN8U128G1002, IPS, 1920x1080, 15.6" | Asus FX502VM-AS73 i7-7700HQ, GeForce GTX 1060 Mobile, SK Hynix HFS256G39TND-N210A, TN LED, 1920x1080, 15.6" | Dell Inspiron 15 7000 7577 i5-7300HQ, GeForce GTX 1060 Max-Q, Samsung PM961 MZVLW256HEHP, IPS, 1920x1080, 15.6" | Lenovo Legion Y520-15IKBM 80YY001APB i5-7300HQ, GeForce GTX 1060 Max-Q, ADATA SX7000NP 256 GB, IPS, 1920x1080, 15.6" | HP Omen 15-ce002ng i7-7700HQ, GeForce GTX 1060 Max-Q, Samsung PM961 MZVLW256HEHP, IPS, 1920x1080, 15.6" | Acer Aspire VN7-593G-73HP V15 Nitro BE i7-7700HQ, GeForce GTX 1060 Mobile, Seagate Mobile HDD 1TB ST1000LM035, AH-IPS, Normally Black, Transmissive, 1920x1080, 15.6" | Acer Nitro 5 AN515-51-788E i7-7700HQ, GeForce GTX 1050 Ti Mobile, Intel SSD 600p SSDPEKKW256G7, IPS, 1920x1080, 15.6" | Acer Aspire VX5-591G-75C4 VX15 i7-7700HQ, GeForce GTX 1050 Ti Mobile, Toshiba MQ01ABD100, IPS, 1920x1080, 15.6" | |
|---|---|---|---|---|---|---|---|---|
| Power Consumption | -10% | 34% | 21% | -31% | 8% | 28% | 20% | |
| Idle Minimum * (Watt) | 12.8 | 14.9 -16% | 7.1 45% | 3.9 70% | 18 -41% | 7.2 44% | 4.1 68% | 7 45% |
| Idle Average * (Watt) | 15.4 | 15.1 2% | 7.6 51% | 10.7 31% | 23 -49% | 10.5 32% | 6.9 55% | 10.2 34% |
| Idle Maximum * (Watt) | 15.9 | 15.2 4% | 8.6 46% | 11.2 30% | 30 -89% | 16 -1% | 9.5 40% | 14 12% |
| Load Average * (Watt) | 78 | 105.8 -36% | 59.5 24% | 111.5 -43% | 85 -9% | 82 -5% | 83 -6% | 78 -0% |
| Witcher 3 ultra * (Watt) | 107.3 | 89 17% | 96 11% | 124 -16% | 108 -1% | |||
| Load Maximum * (Watt) | 143.4 | 148.8 -4% | 112.8 21% | 115.5 19% | 158 -10% | 155 -8% | 126 12% | 127 11% |
* ... menor é melhor
| Asus FX503VM-EH73 i7-7700HQ, GeForce GTX 1060 Mobile, 64 Wh | Asus FX502VM-AS73 i7-7700HQ, GeForce GTX 1060 Mobile, 64 Wh | Dell Inspiron 15 7000 7577 i5-7300HQ, GeForce GTX 1060 Max-Q, 56 Wh | HP Omen 15-ce002ng i7-7700HQ, GeForce GTX 1060 Max-Q, 70 Wh | Acer Aspire VN7-593G-73HP V15 Nitro BE i7-7700HQ, GeForce GTX 1060 Mobile, 69 Wh | Acer Nitro 5 AN515-51-788E i7-7700HQ, GeForce GTX 1050 Ti Mobile, 48 Wh | Acer Aspire VX5-591G-75C4 VX15 i7-7700HQ, GeForce GTX 1050 Ti Mobile, 52.5 Wh | |
|---|---|---|---|---|---|---|---|
| Duração da bateria | 2% | 63% | -12% | 65% | 69% | 10% | |
| Reader / Idle (h) | 5.7 | 6.1 7% | 11 93% | 4.3 -25% | 8.4 47% | 14.9 161% | 5.4 -5% |
| WiFi v1.3 (h) | 4.6 | 4.6 0% | 6.9 50% | 3.3 -28% | 6 30% | 6.7 46% | 5 9% |
| Load (h) | 1.1 | 1.1 0% | 1.6 45% | 1.3 18% | 2.4 118% | 1.1 0% | 1.4 27% |
Pro
Contra

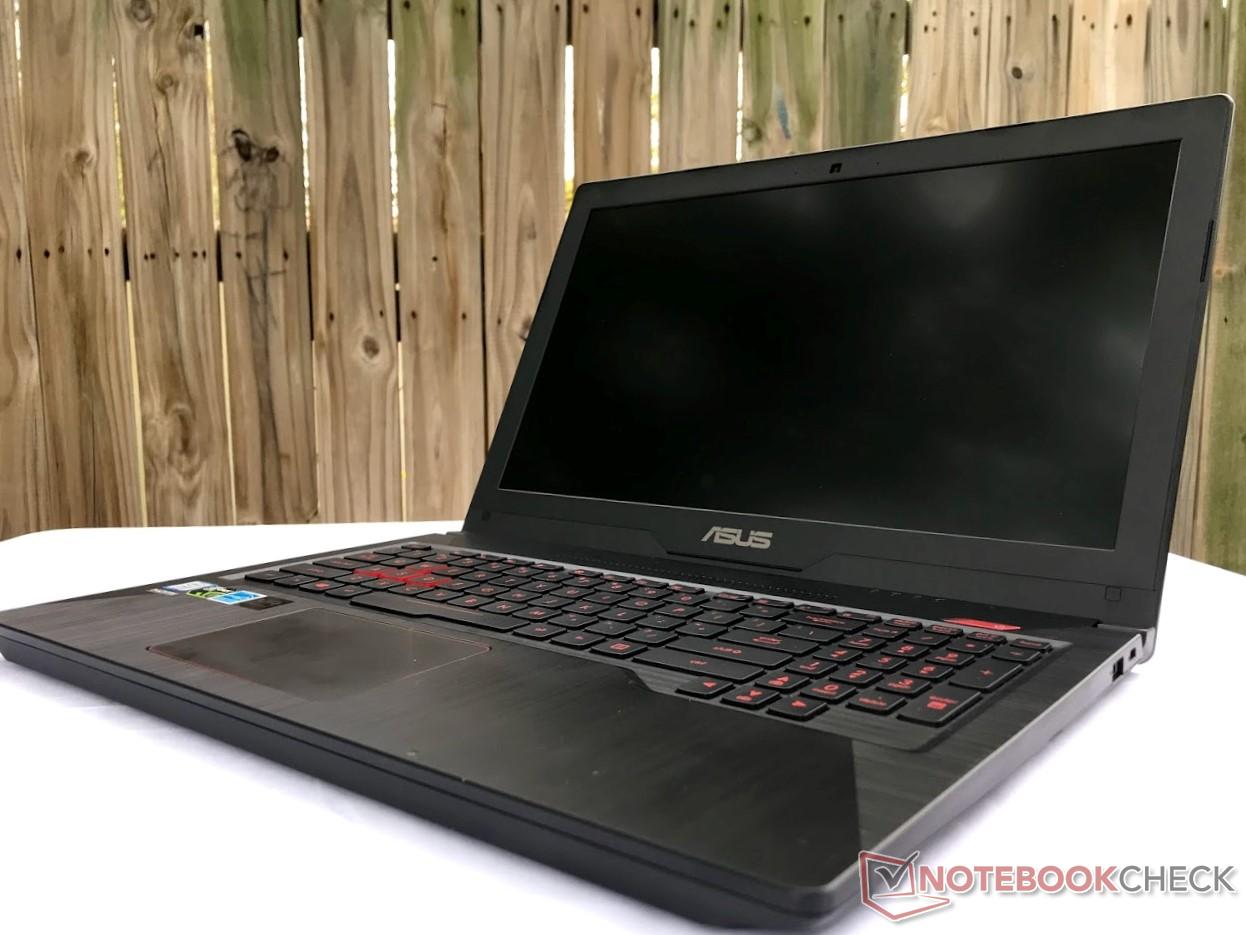
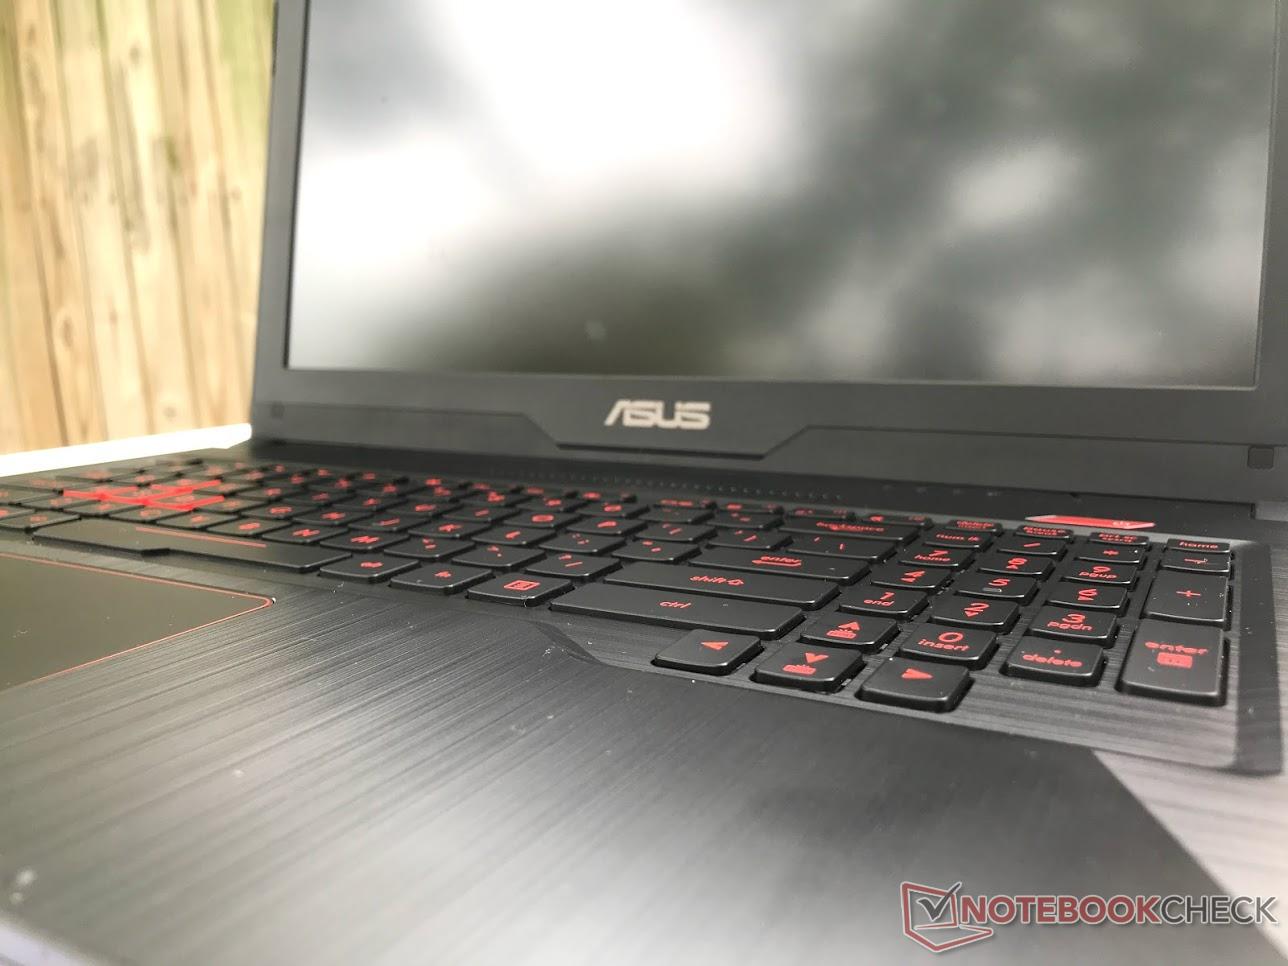
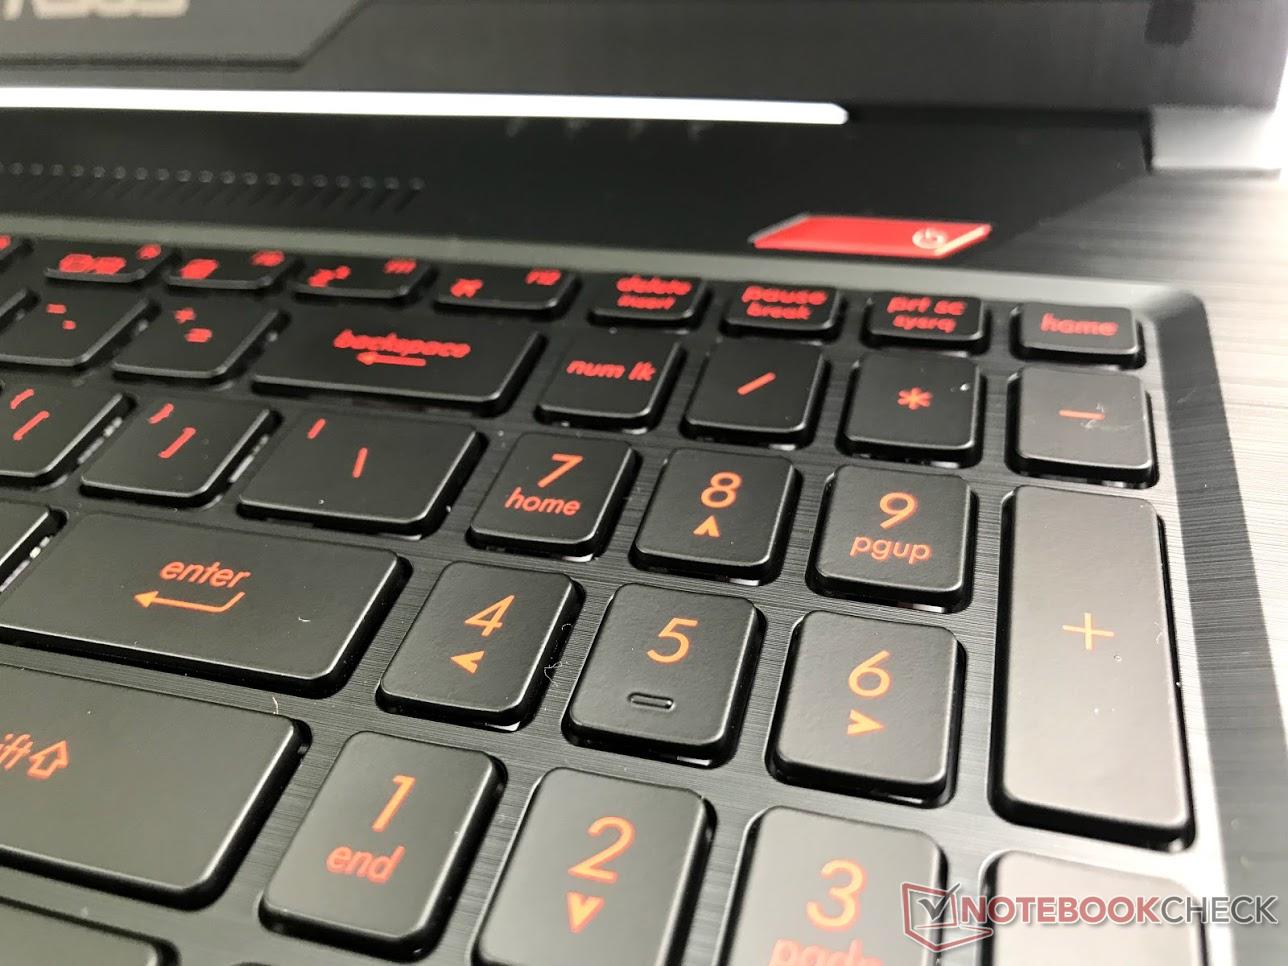
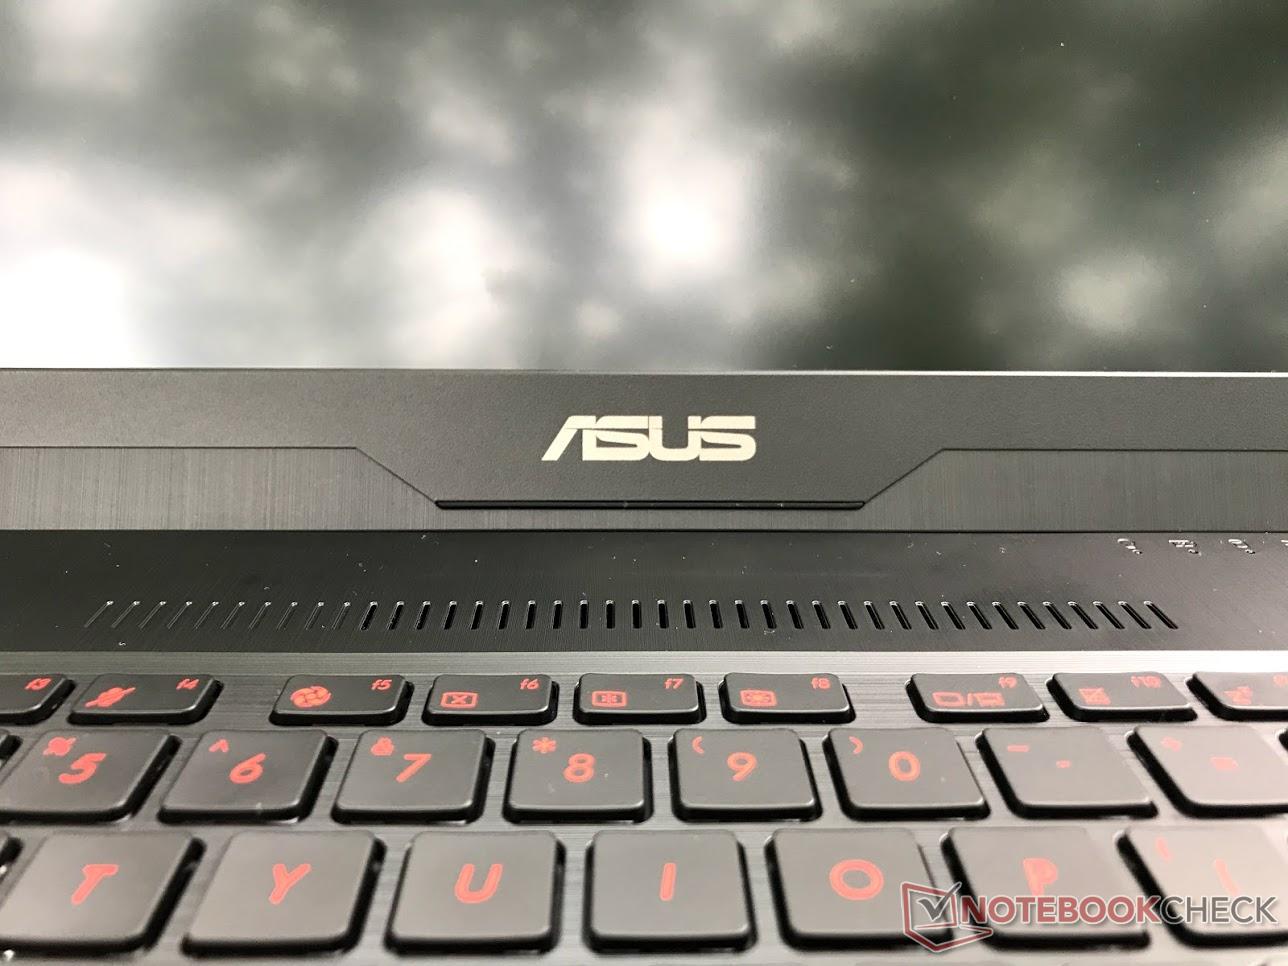
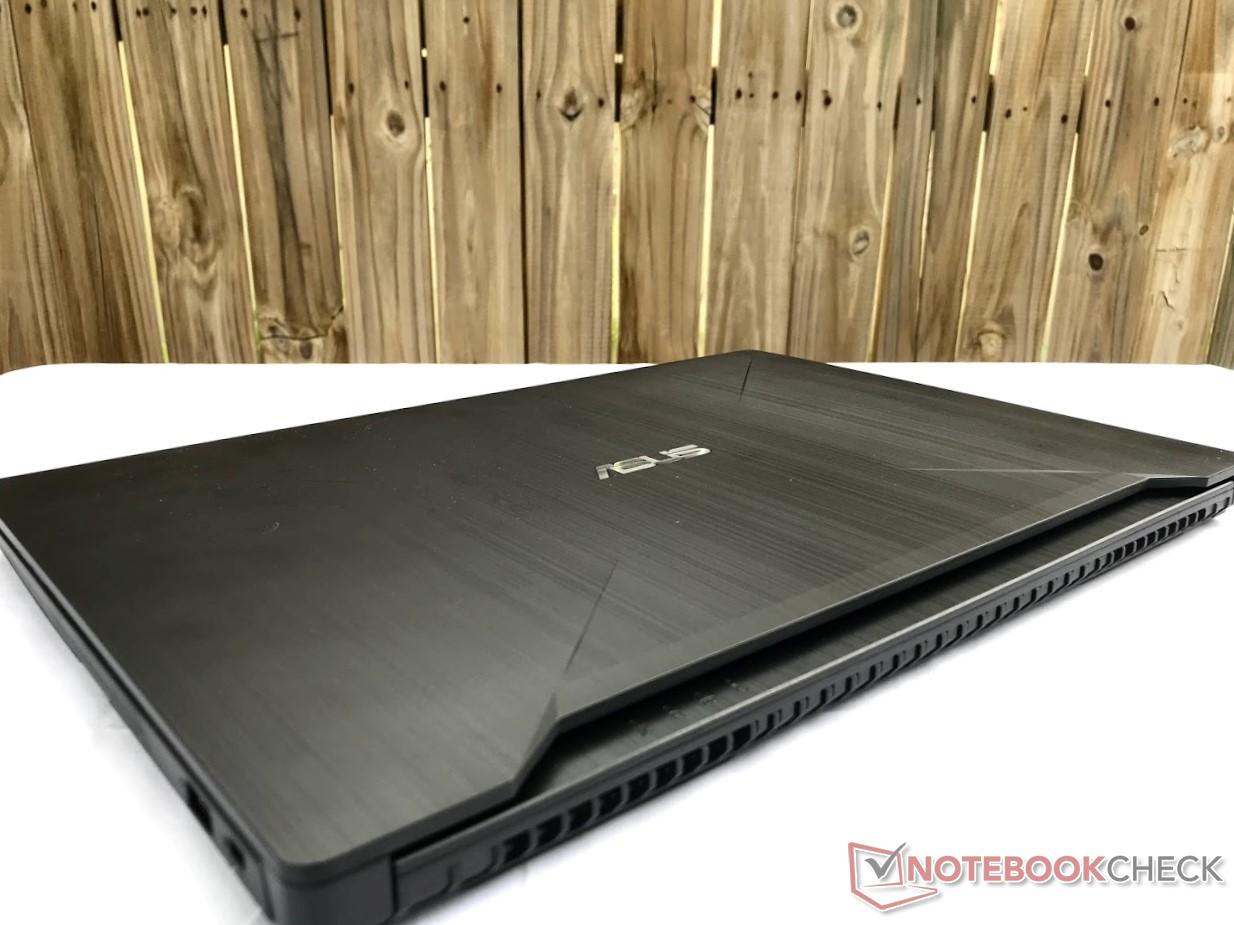
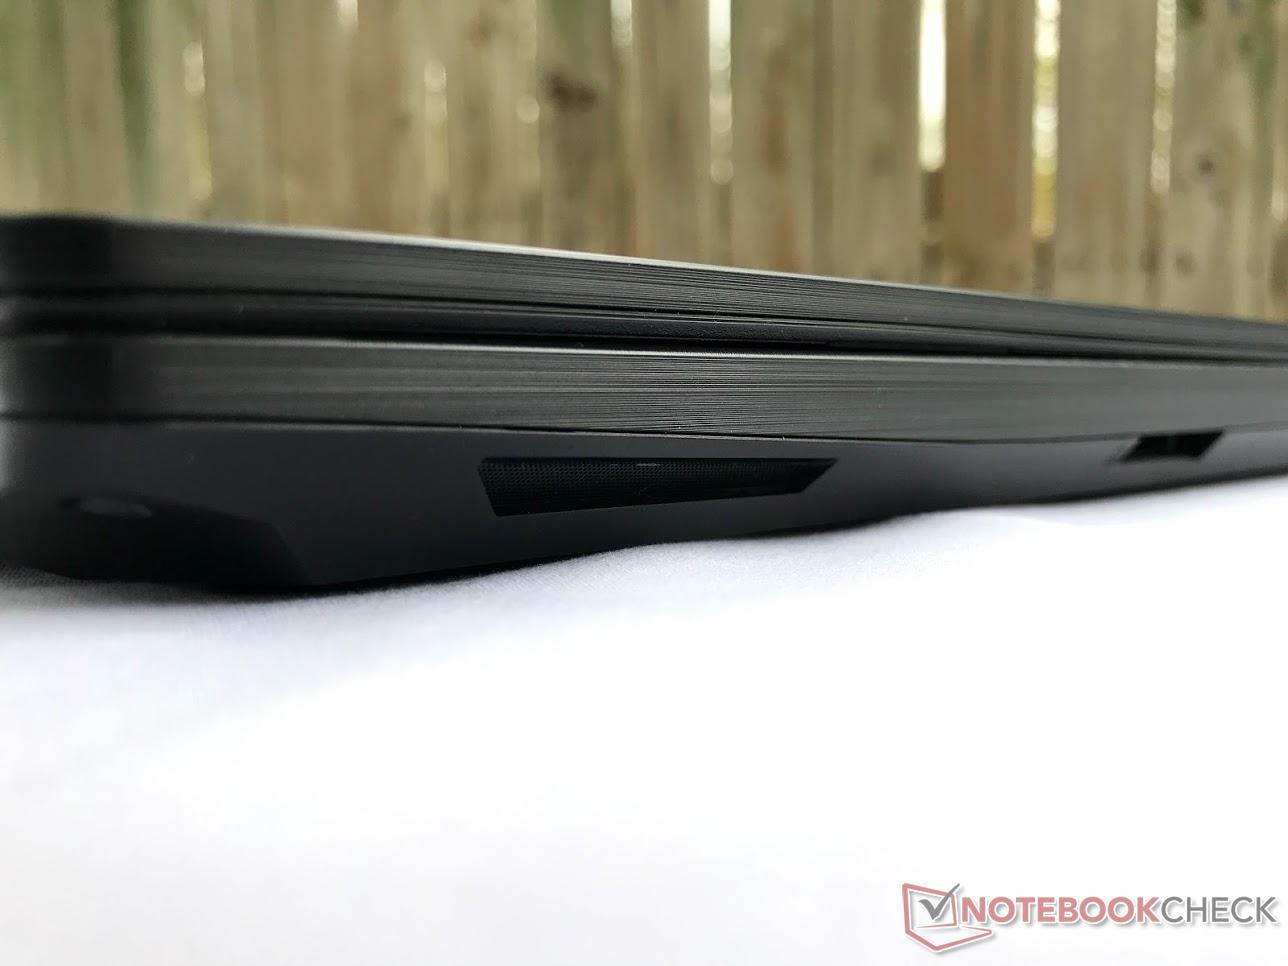
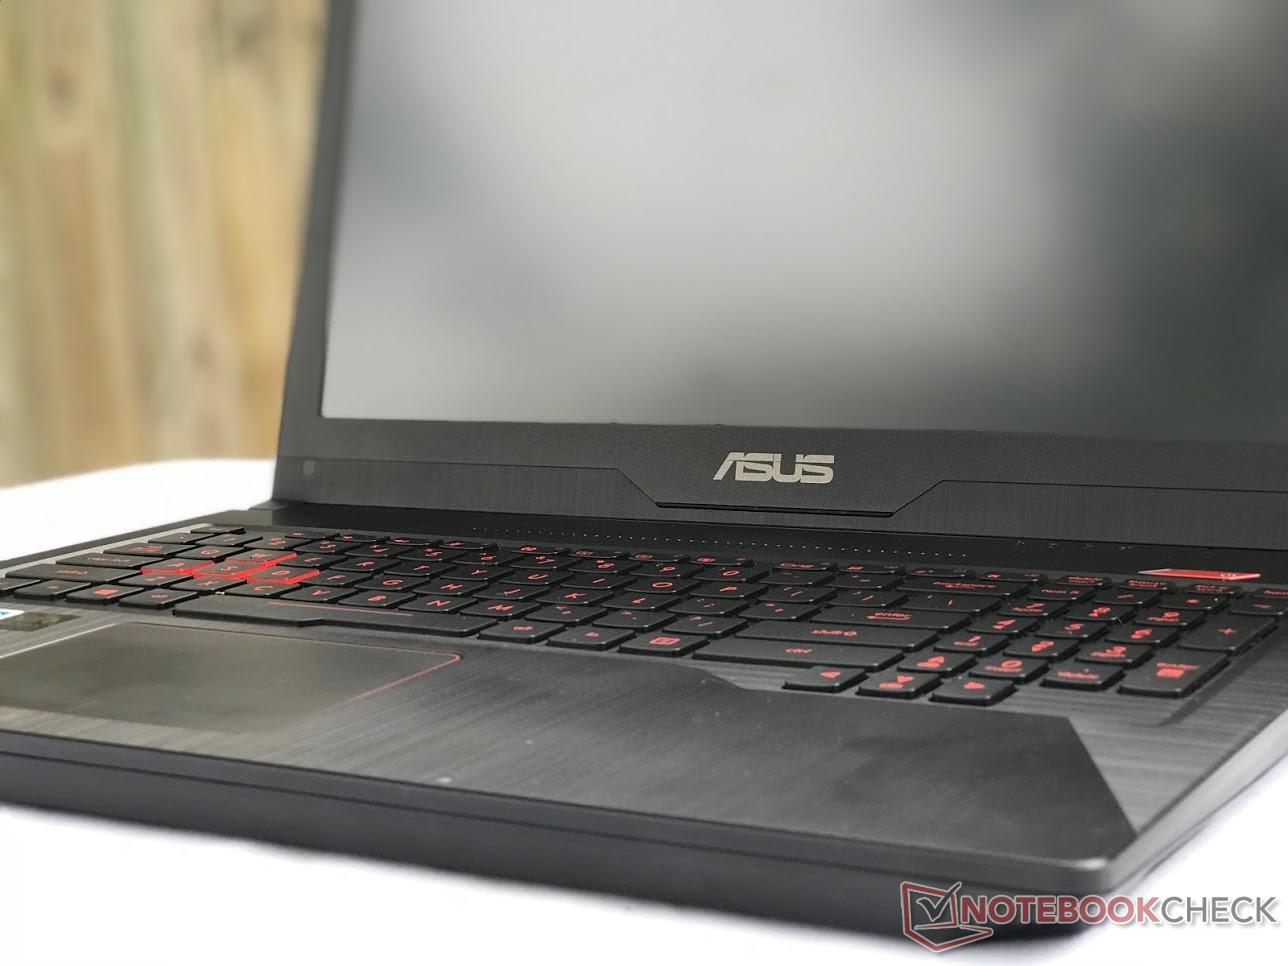
O FX503VM tenta misturar o estilo de um portátil para jogos de gama alta com o preço de um de nível intermediário e, em sua maior parte, é bem-sucedido. Há várias coisas que gostar sobre o FX503VM, incluindo o bom teclado, excelente desempenho do sistema e design sutil (mas marcante). No entanto, existem alguns sacrifícios que deve fazer, como o frágil touchpad e a carcaça que ses ente barata. A ausência de suporte para G-Sync (mesmo na versão de alta taxa de atualização) também é um ponto negativo.
Comparado com outros portáteis de jogos de gama média, o FX503VM se destaca em alguns pontos, enquanto falha em outros. No entanto, comparado ao GL503 que ele imita, o FX503VM oferece desempenho similar e opções de atualização com um visual bastante similar, a um preço muito mais baixo. Por cerca de $500 a menos, o FX503VM mantém o mesmo perfil fino e desempenho enquanto sacrifica a construção mais premium. A tela opcional de 120 Hz é apenas uma cereja no topo do bolo. Os jogadores em busca de um portátil de jogos atraente, mas pragmático, terão muito o que gostar no FX503VM. Está começando a haver escassez da máquina nos varejistas. Se pode ser encontrada à venda, é um ótimo negócio.
Tudo dito, o FX503VM traz um excelente desempenho dos jogos a um preço razoável e em um pacote atraente. A máquina é subjetivamente milhas à frente no design do que outros portáteis de jogos com preços similares, sem sacrificar muito o desempenho dos jogos. No entanto, deve ser considerado o que o FX503VM sacrifica. A tampa da tela é frágil, os 3 GB de VRAM limitam algumas configurações e resoluções de jogos em comparação com outros portáteis com 6 GB, e as imprecisões de cores podem causar distração. O ruído do ventilador também é bastante alto, mesmo para um portátil de jogos.
A maioria dos portáteis de jogos neste preço tem uma aparência barata e plástica. O FX503VM consegue algo que eles não: ele traz uma sensação de estilo para portáteis de jogos de gama média de preços mais baixos. Se você está procurando um portátil para jogos, fino e leve, com um orçamento mais apertado, esta é a máquina que deve procurar.
Asus FX503VM-EH73
- 03/24/2018 v6 (old)
Sam Medley
Price comparison
