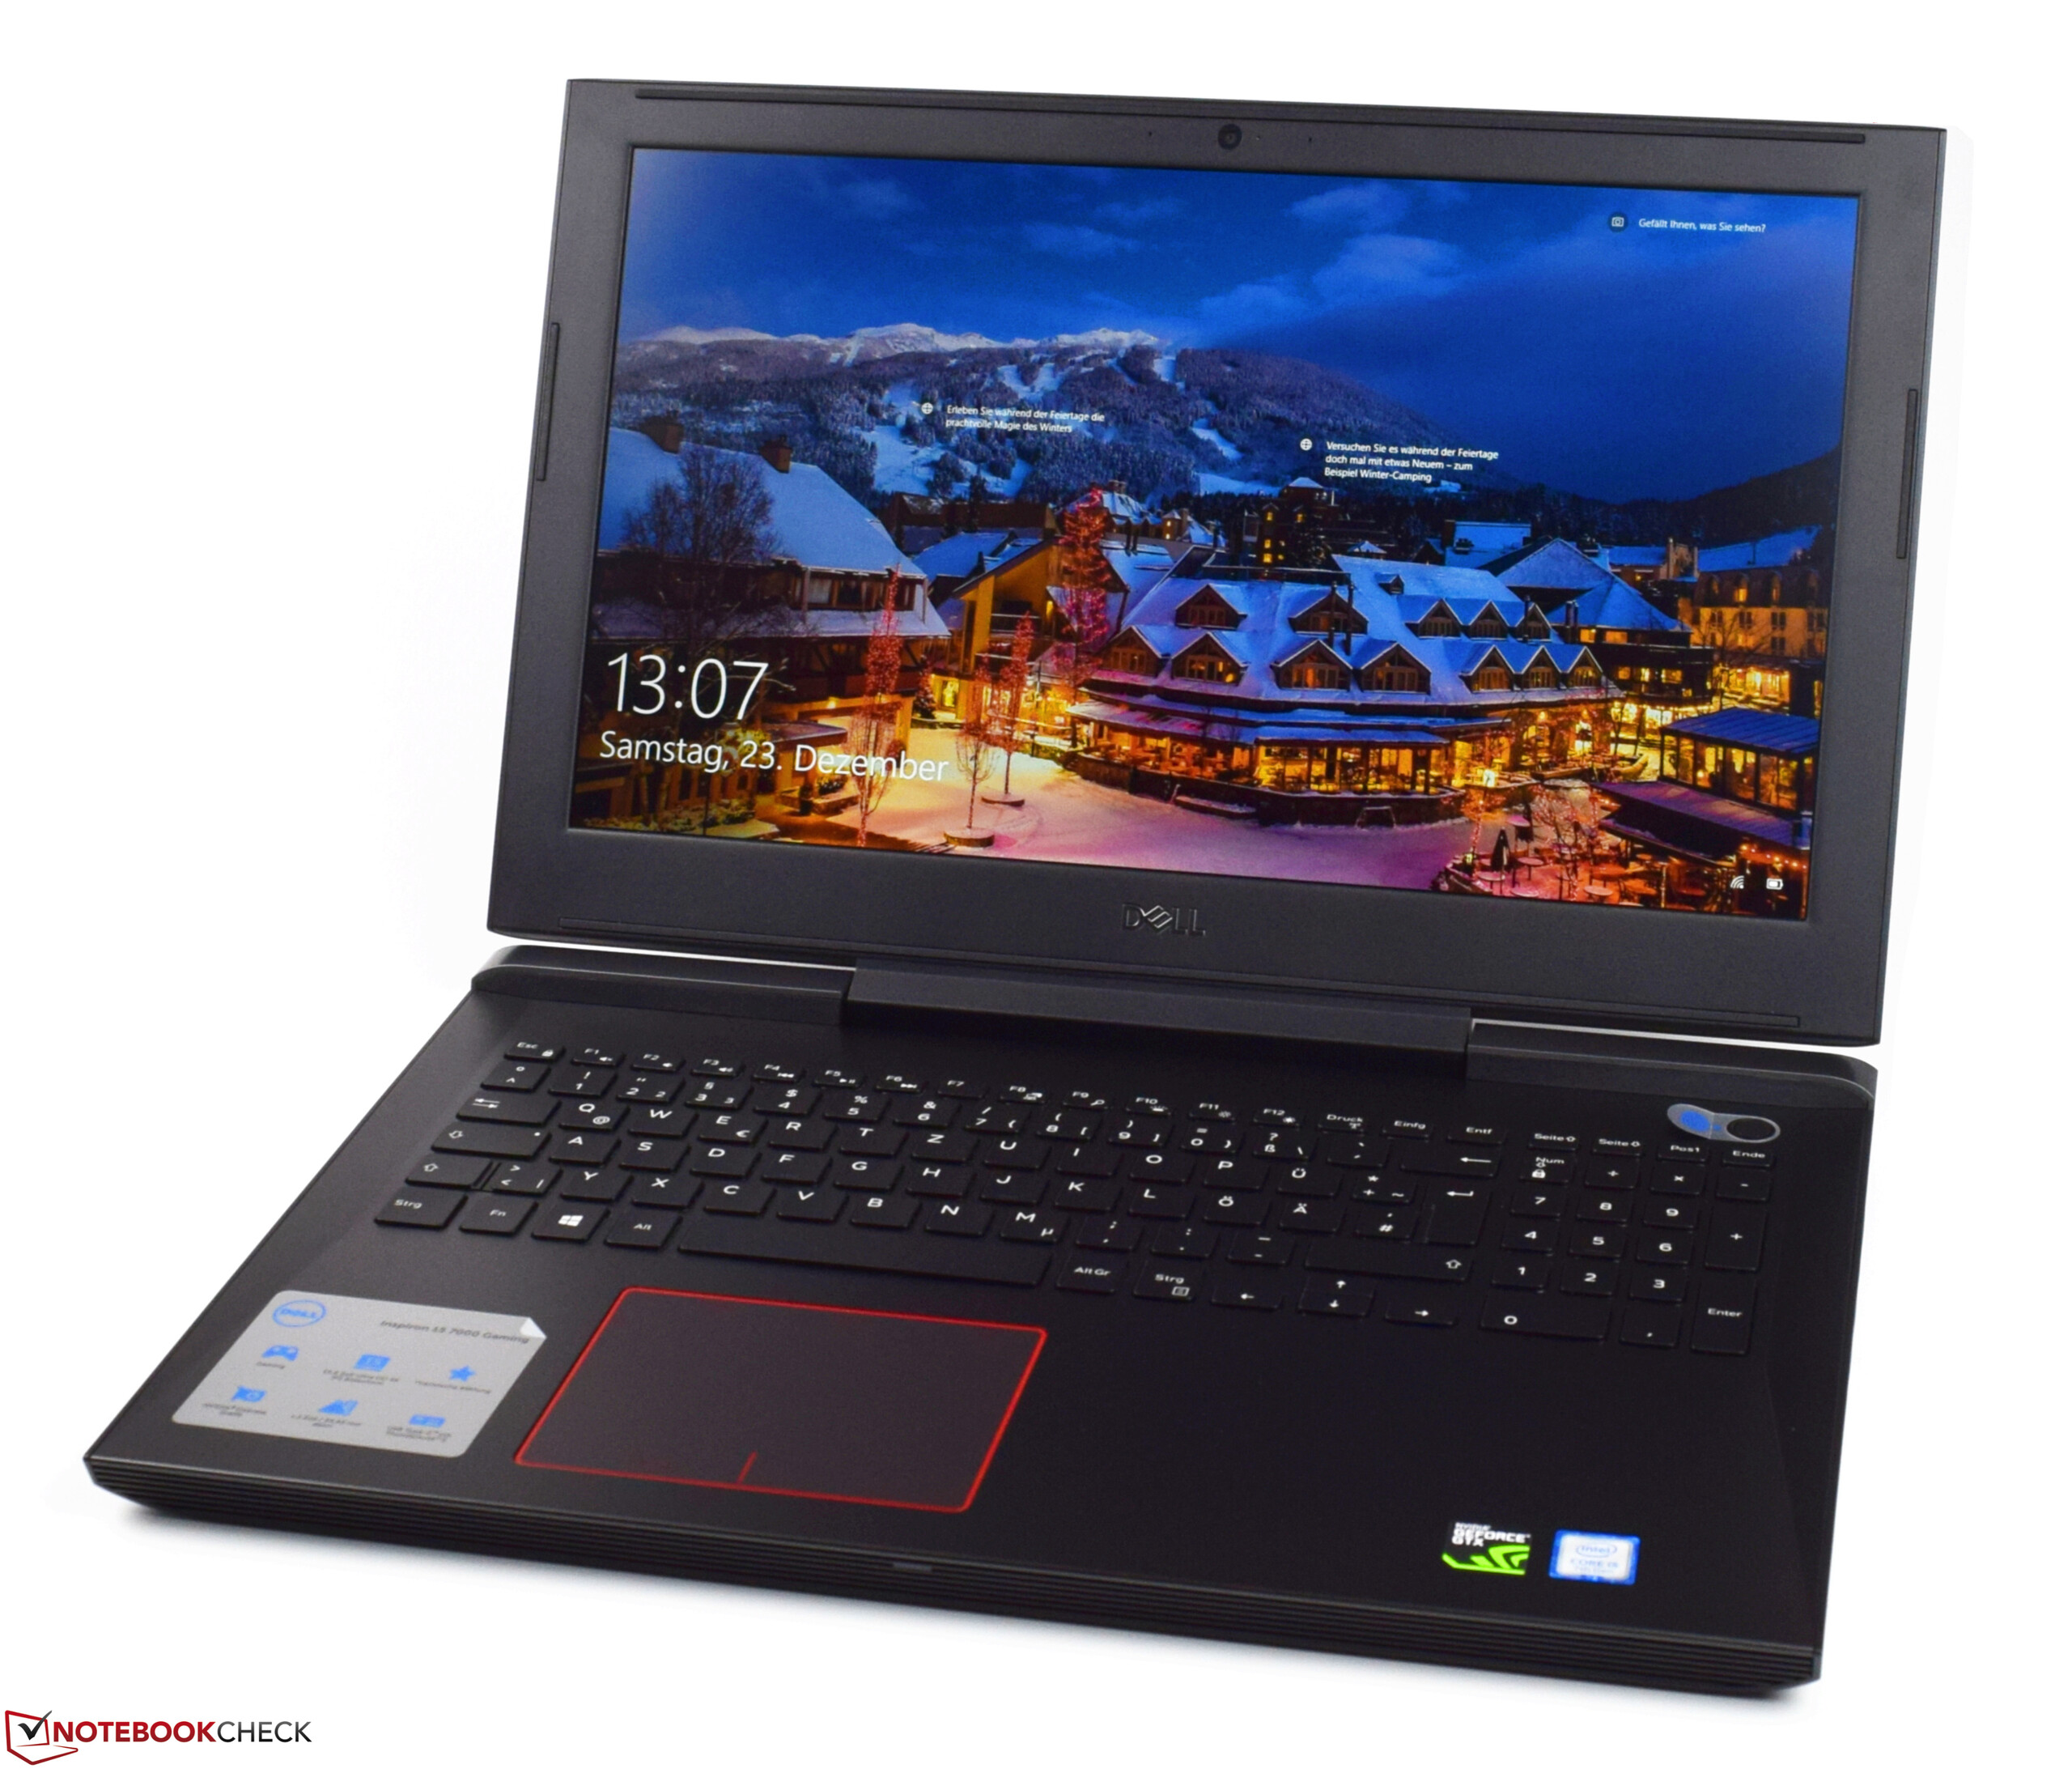
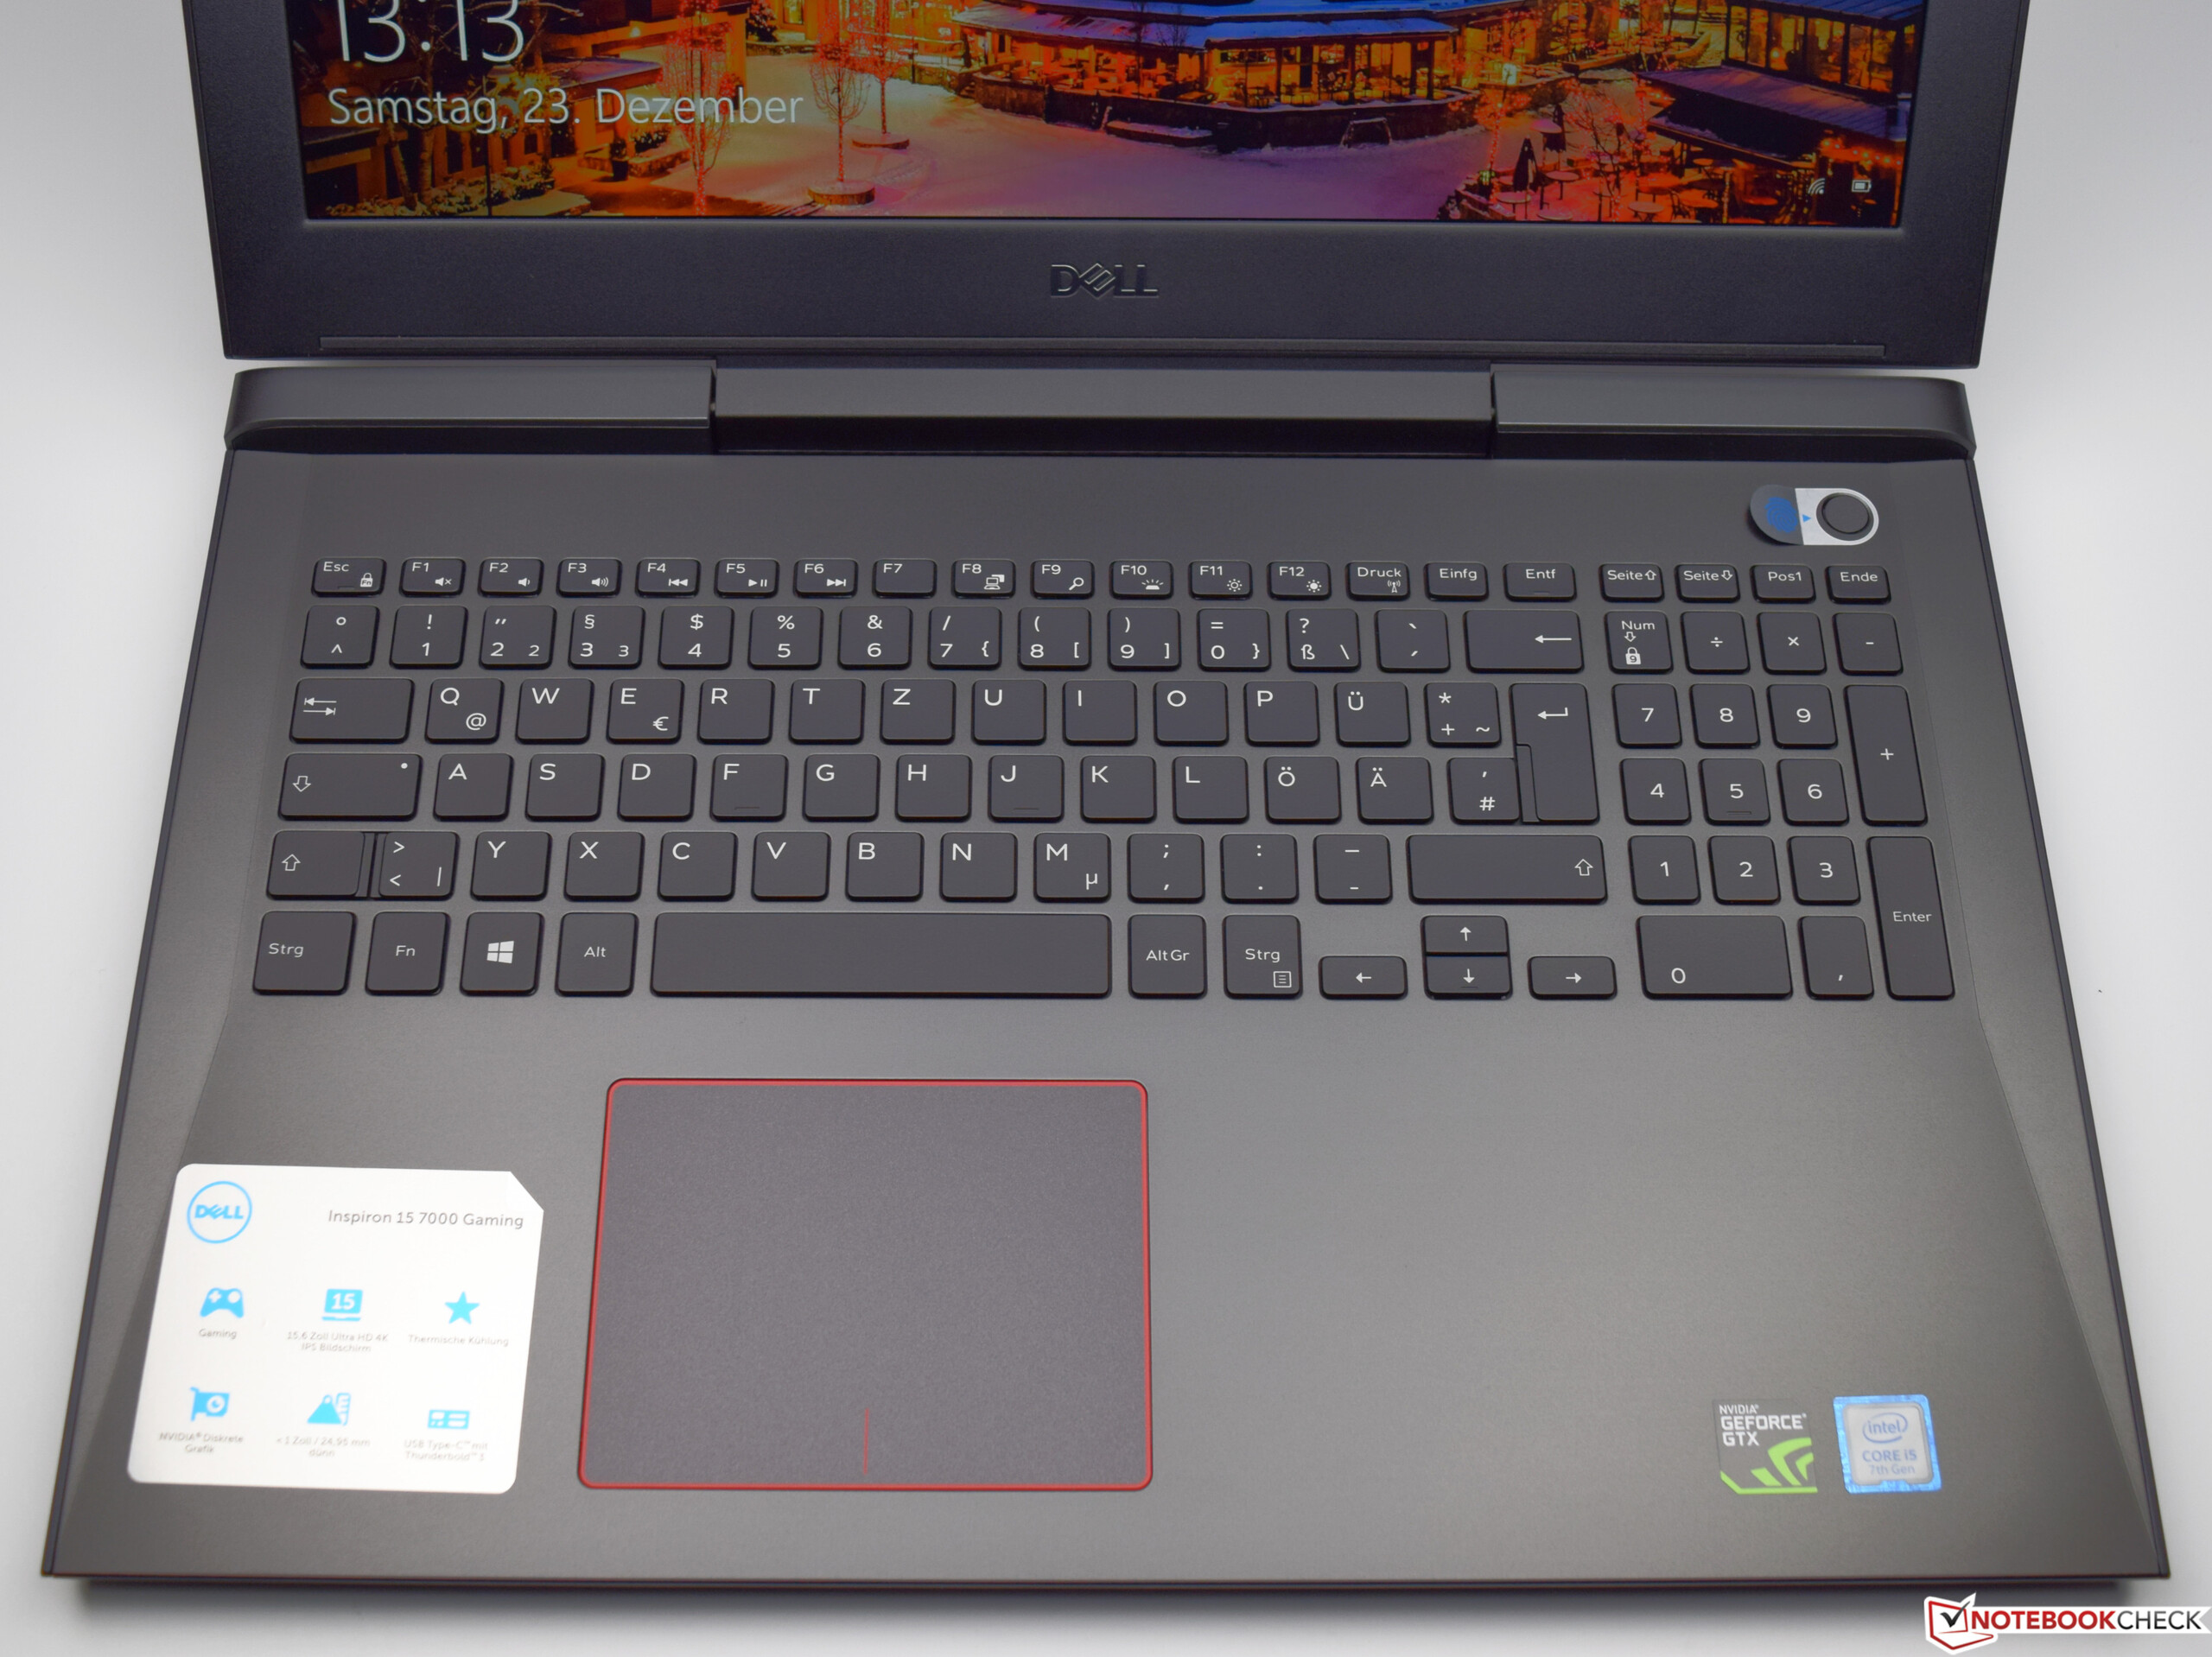
Breve Análise do Portátil Dell Inspiron 15 7000 7577 (i5-7300HQ, GTX 1050, 1080p)
| SD Card Reader | |
| average JPG Copy Test (av. of 3 runs) | |
| Dell Inspiron 15 7000 7577 (Toshiba Exceria Pro SDXC 64 GB UHS-II) | |
| MSI GL62M 7RD-077 (Toshiba Exceria Pro SDXC 64 GB UHS-II) | |
| Acer Aspire VX15 VX5-591G-589S (Toshiba Exceria Pro SDXC 64 GB UHS-II) | |
| Dell Inspiron 15 7000 7577 (Toshiba Exceria Pro SDXC 64 GB UHS-II) | |
| maximum AS SSD Seq Read Test (1GB) | |
| Dell Inspiron 15 7000 7577 (Toshiba Exceria Pro SDXC 64 GB UHS-II) | |
| Dell Inspiron 15 7000 7577 (Toshiba Exceria Pro SDXC 64 GB UHS-II) | |
| MSI GL62M 7RD-077 (Toshiba Exceria Pro SDXC 64 GB UHS-II) | |
| Acer Aspire VX15 VX5-591G-589S (Toshiba Exceria Pro SDXC 64 GB UHS-II) | |
| |||||||||||||||||||||||||
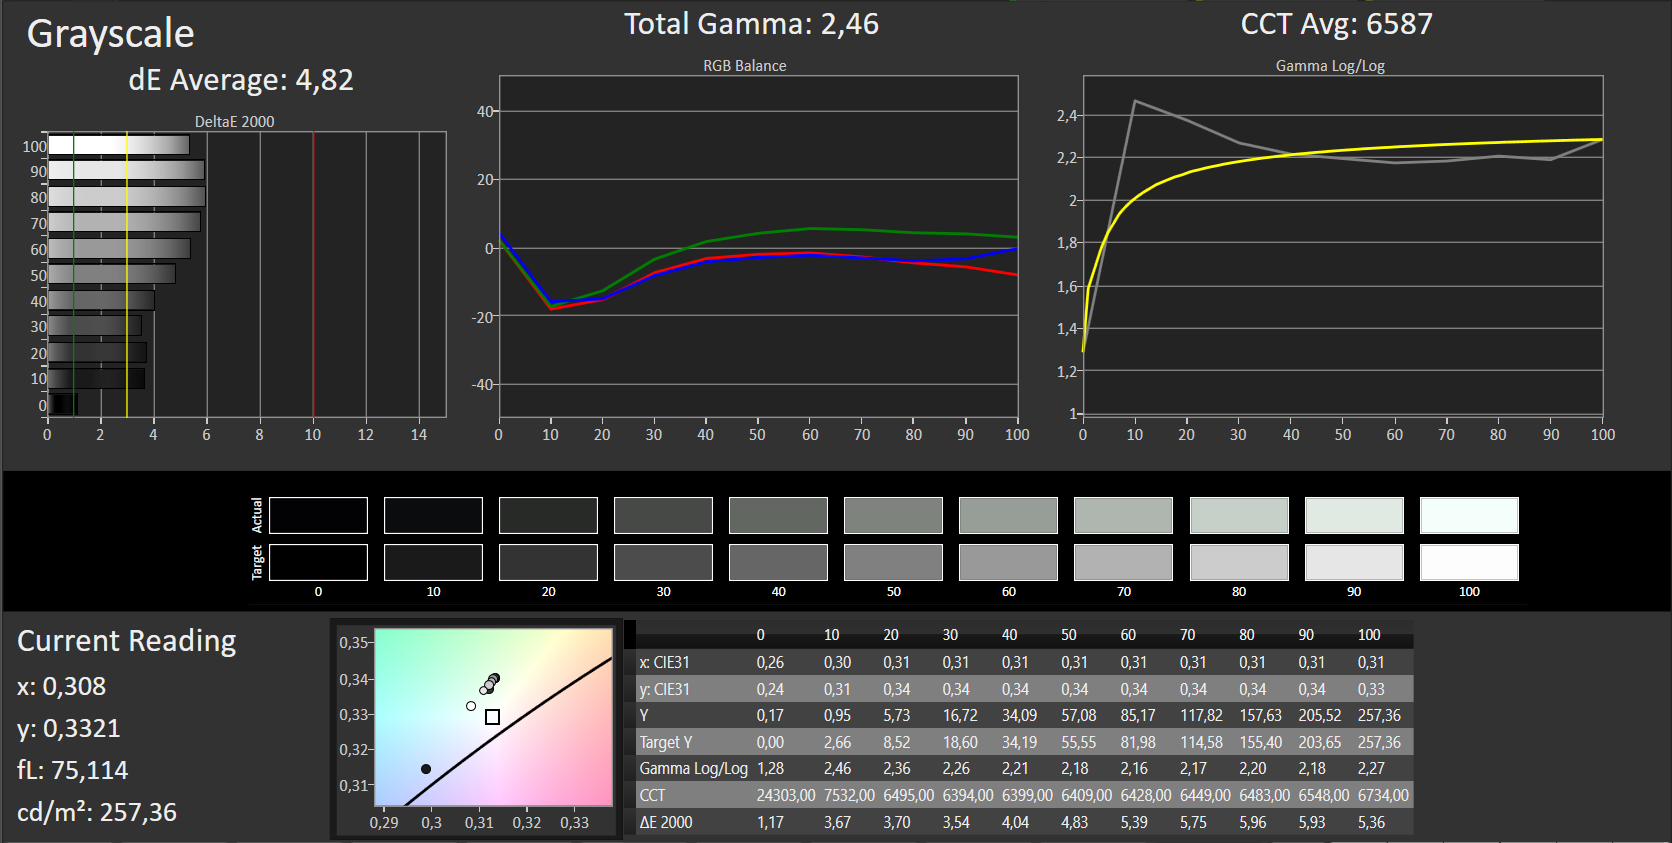
iluminação: 84 %
iluminação com acumulador: 256 cd/m²
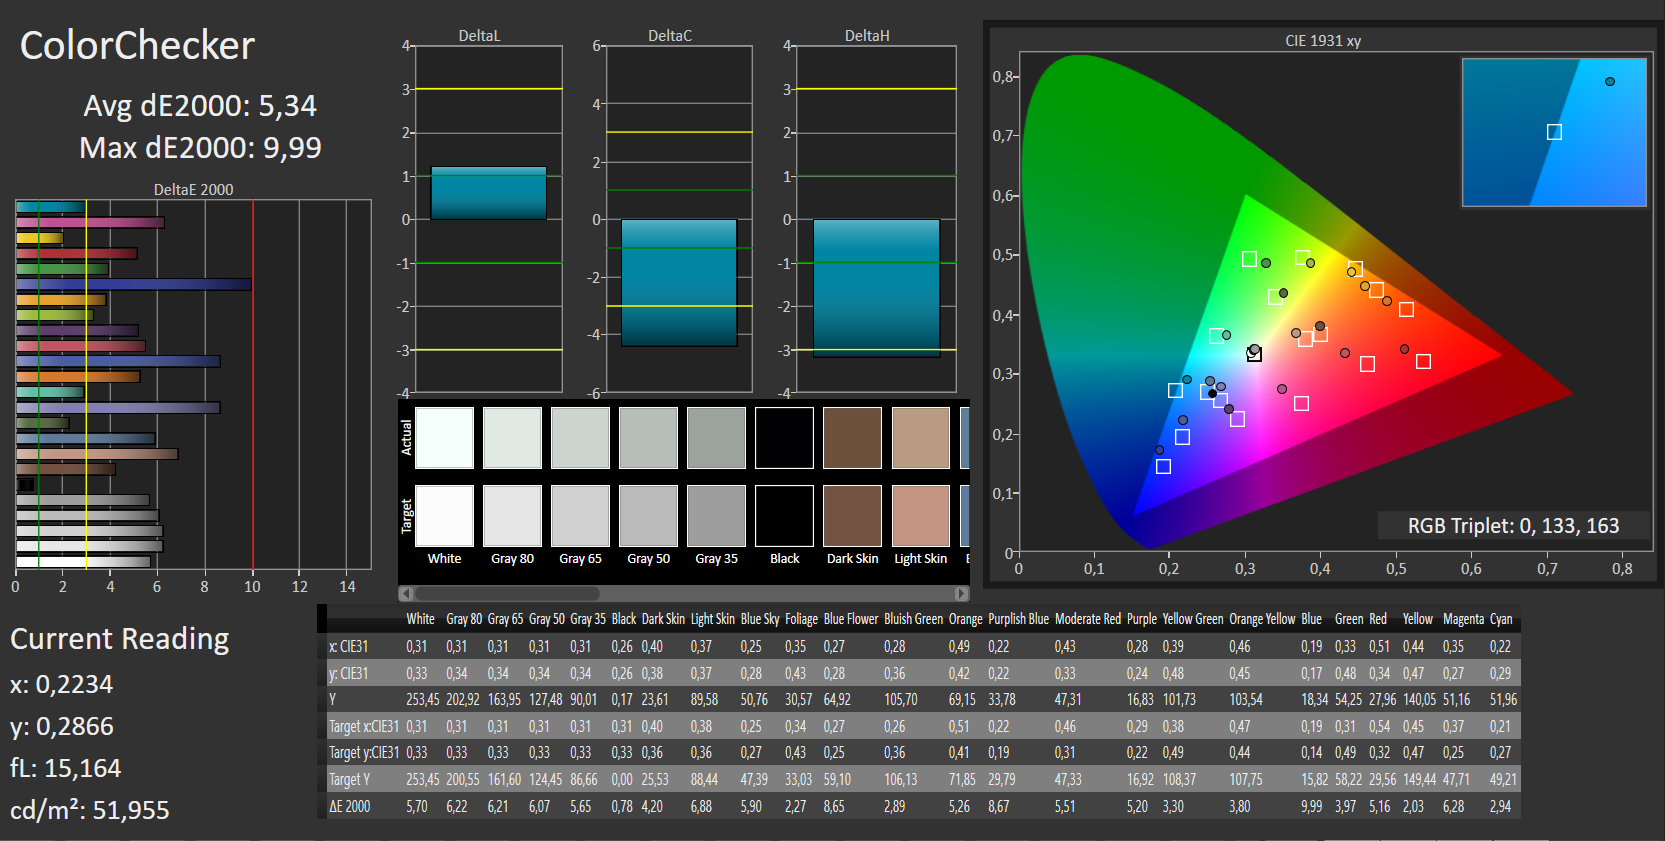
Contraste: 1512:1 (Preto: 0.17 cd/m²)
ΔE ColorChecker Calman: 5.34 | ∀{0.5-29.43 Ø4.71}
ΔE Greyscale Calman: 4.82 | ∀{0.09-98 Ø4.96}
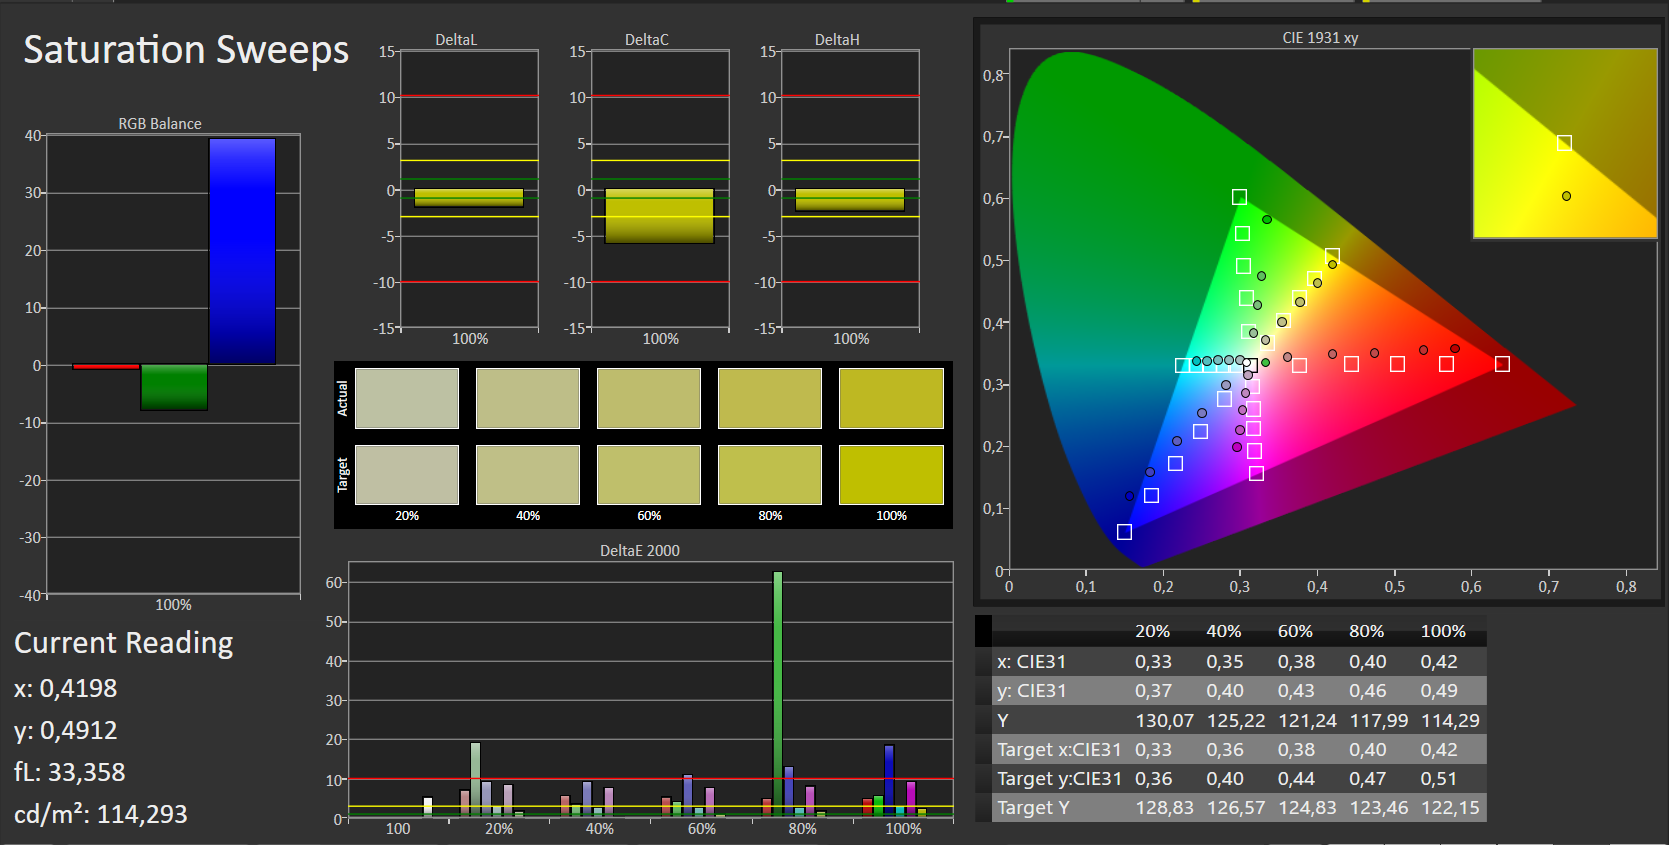
60% sRGB (Argyll 1.6.3 3D)
38% AdobeRGB 1998 (Argyll 1.6.3 3D)
41.77% AdobeRGB 1998 (Argyll 3D)
60.5% sRGB (Argyll 3D)
40.4% Display P3 (Argyll 3D)
Gamma: 2.46
CCT: 6587 K
| Dell Inspiron 15 7000 7577 ID: LG Philips LGD053F, Name: 156WF6, Dell P/N: 4XK13, 1920x1080, 15.6" | Dell Inspiron 15 7000 7577 ID: LG Philips LGD053F, Name: 156WF6, Dell P/N: 4XK13, 1920x1080, 15.6" | Lenovo Legion Y520-15IKBN 80WK0042GE LG Philips LP156WF6-SPK3, 1920x1080, 15.6" | Acer Aspire VX15 VX5-591G-589S BOE CQ NV156HFM-N42, 1920x1080, 15.6" | MSI GL62M 7RD-077 Chi Mei N156HGE-EAL, 1920x1080, 15.6" | |
|---|---|---|---|---|---|
| Display | -8% | -3% | -1% | 92% | |
| Display P3 Coverage (%) | 40.4 | 37.07 -8% | 39.01 -3% | 40.56 0% | 85.4 111% |
| sRGB Coverage (%) | 60.5 | 55.6 -8% | 58.4 -3% | 59.4 -2% | 100 65% |
| AdobeRGB 1998 Coverage (%) | 41.77 | 38.32 -8% | 40.34 -3% | 41.9 0% | 83.8 101% |
| Response Times | 7% | 1% | -17% | -6% | |
| Response Time Grey 50% / Grey 80% * (ms) | 41 ? | 35.6 ? 13% | 39 ? 5% | 46 ? -12% | 44 ? -7% |
| Response Time Black / White * (ms) | 28 ? | 27.6 ? 1% | 29 ? -4% | 34 ? -21% | 29 ? -4% |
| PWM Frequency (Hz) | 21000 ? | 20000 ? | 198 ? | ||
| Screen | -21% | -19% | 0% | -39% | |
| Brightness middle (cd/m²) | 257 | 235.4 -8% | 283 10% | 277 8% | 258 0% |
| Brightness (cd/m²) | 229 | 223 -3% | 281 23% | 268 17% | 234 2% |
| Brightness Distribution (%) | 84 | 91 8% | 91 8% | 91 8% | 79 -6% |
| Black Level * (cd/m²) | 0.17 | 0.28 -65% | 0.39 -129% | 0.26 -53% | 0.54 -218% |
| Contrast (:1) | 1512 | 841 -44% | 726 -52% | 1065 -30% | 478 -68% |
| Colorchecker dE 2000 * | 5.34 | 5.6 -5% | 6.1 -14% | 5.05 5% | 9.74 -82% |
| Colorchecker dE 2000 max. * | 9.99 | 20.3 -103% | 11.08 -11% | 8.93 11% | 14.6 -46% |
| Greyscale dE 2000 * | 4.82 | 3.6 25% | 5.69 -18% | 2.97 38% | 11.59 -140% |
| Gamma | 2.46 89% | 2.23 99% | 2.44 90% | 2.39 92% | 2.19 100% |
| CCT | 6587 99% | 7214 90% | 6702 97% | 6466 101% | 11851 55% |
| Color Space (Percent of AdobeRGB 1998) (%) | 38 | 35.2 -7% | 37 -3% | 38 0% | 76 100% |
| Color Space (Percent of sRGB) (%) | 60 | 55.4 -8% | 58 -3% | 59 -2% | 100 67% |
| Média Total (Programa/Configurações) | -7% /
-15% | -7% /
-13% | -6% /
-2% | 16% /
-8% |
* ... menor é melhor
Exibir tempos de resposta
| ↔ Tempo de resposta preto para branco | ||
|---|---|---|
| 28 ms ... ascensão ↗ e queda ↘ combinadas | ↗ 15 ms ascensão | 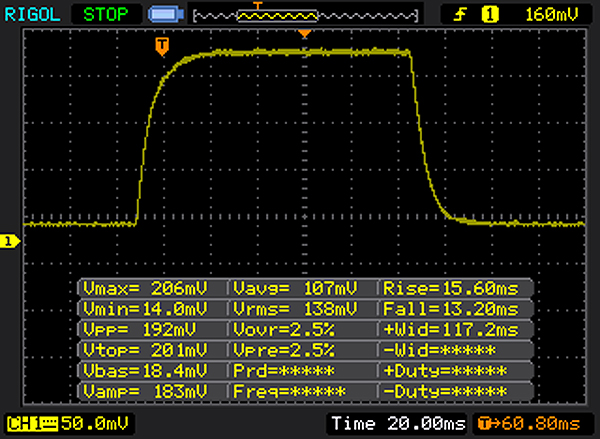 |
| ↘ 13 ms queda | ||
| A tela mostra taxas de resposta relativamente lentas em nossos testes e pode ser muito lenta para os jogadores. Em comparação, todos os dispositivos testados variam de 0.1 (mínimo) a 240 (máximo) ms. » 71 % de todos os dispositivos são melhores. Isso significa que o tempo de resposta medido é pior que a média de todos os dispositivos testados (19.8 ms). | ||
| ↔ Tempo de resposta 50% cinza a 80% cinza | ||
| 41 ms ... ascensão ↗ e queda ↘ combinadas | ↗ 20 ms ascensão | 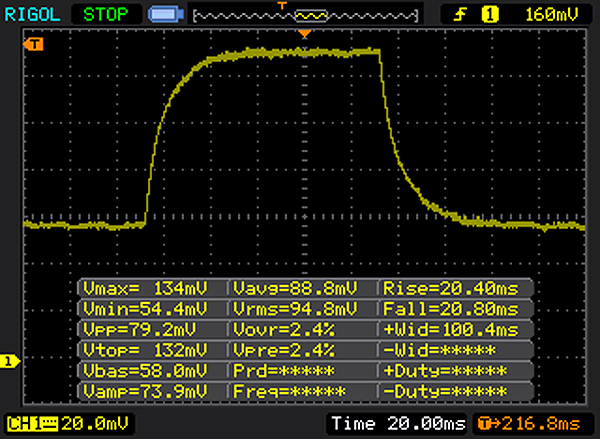 |
| ↘ 21 ms queda | ||
| A tela mostra taxas de resposta lentas em nossos testes e será insatisfatória para os jogadores. Em comparação, todos os dispositivos testados variam de 0.165 (mínimo) a 636 (máximo) ms. » 65 % de todos os dispositivos são melhores. Isso significa que o tempo de resposta medido é pior que a média de todos os dispositivos testados (31 ms). | ||
Cintilação da tela / PWM (modulação por largura de pulso)
| Tela tremeluzindo / PWM não detectado | ||
[pwm_comparison] Em comparação: 52 % de todos os dispositivos testados não usam PWM para escurecer a tela. Se PWM foi detectado, uma média de 7754 (mínimo: 5 - máximo: 343500) Hz foi medida. | ||

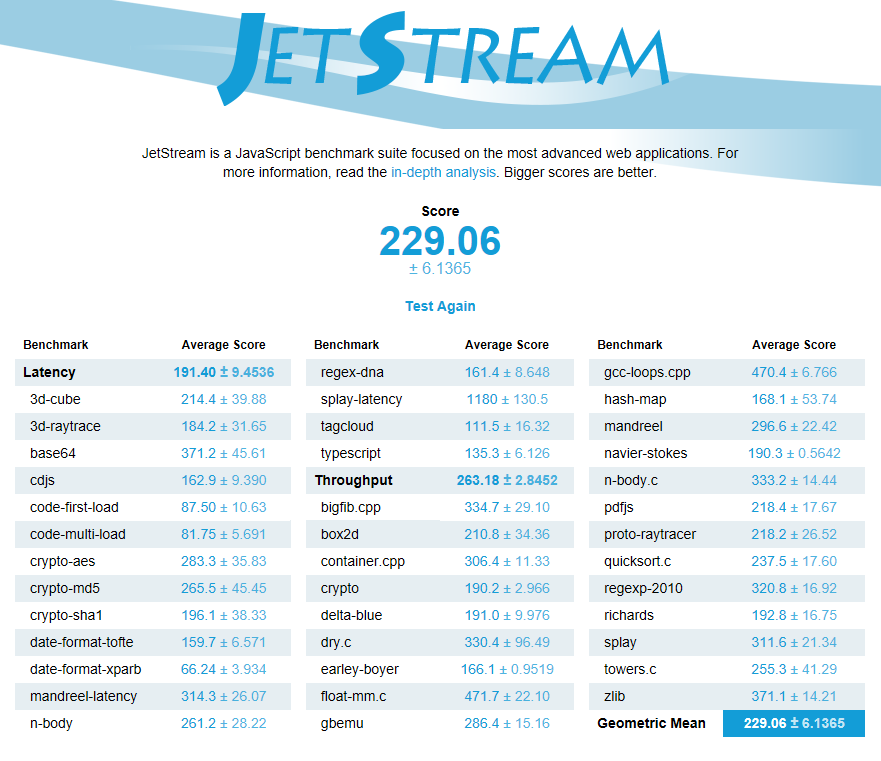
| JetStream 1.1 - 1.1 Total | |
| MSI GL62M 7RD-077 | |
| Acer Aspire VX15 VX5-591G-589S | |
| Lenovo Legion Y520-15IKBN 80WK0042GE | |
| Dell Inspiron 15 7000 7577 | |
| Octane V2 - Total Score | |
| MSI GL62M 7RD-077 | |
| Lenovo Legion Y520-15IKBN 80WK0042GE | |
| Dell Inspiron 15 7000 7577 | |
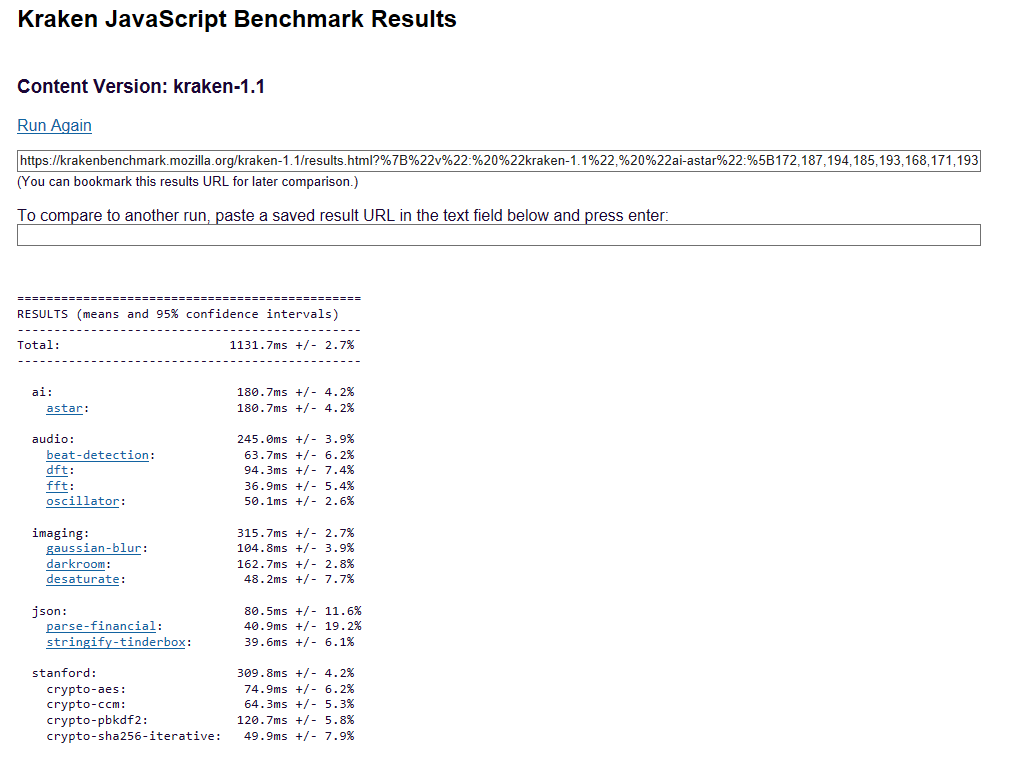
| Mozilla Kraken 1.1 - Total | |
| Dell Inspiron 15 7000 7577 | |
| Lenovo Legion Y520-15IKBN 80WK0042GE | |
| MSI GL62M 7RD-077 | |
* ... menor é melhor

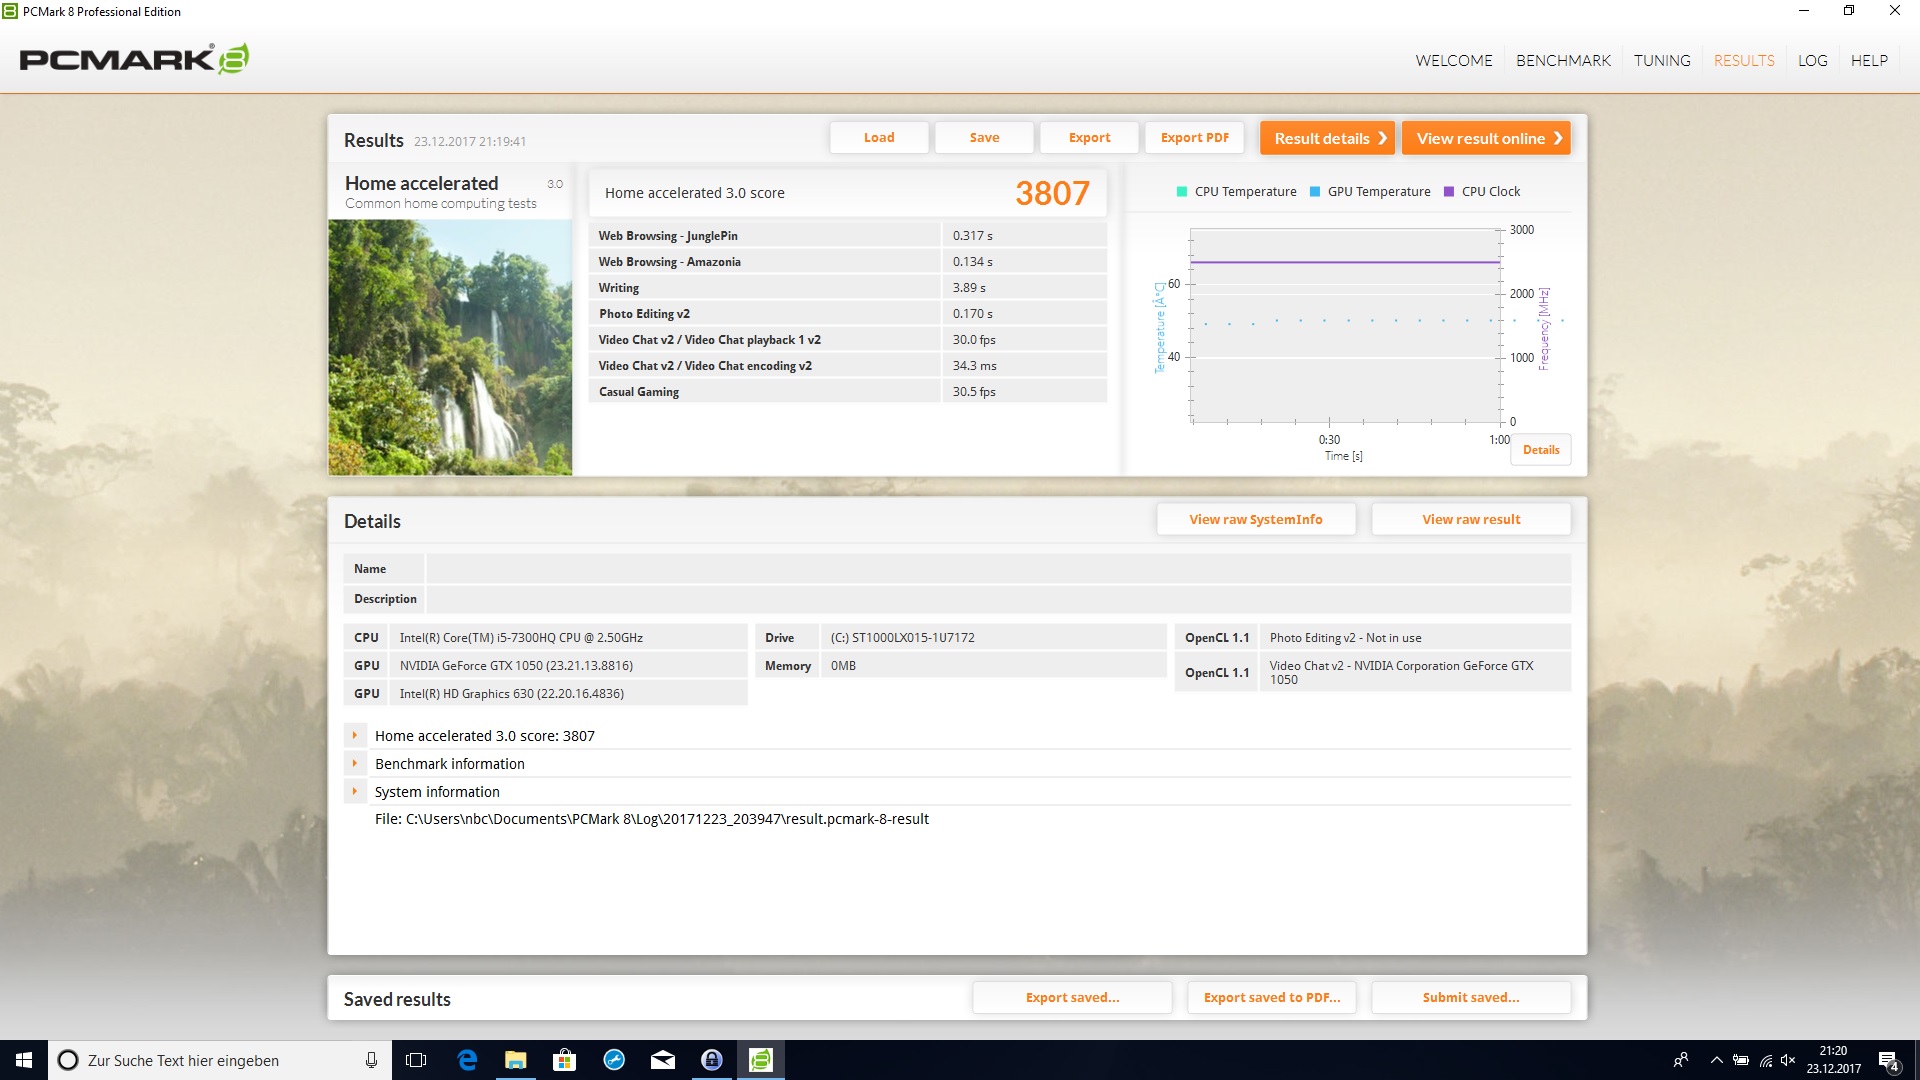
| PCMark 8 | |
| Home Score Accelerated v2 | |
| MSI GL62M 7RD-077 | |
| Dell Inspiron 15 7000 7577 | |
| Dell Inspiron 15 7000 7577 | |
| Acer Aspire VX15 VX5-591G-589S | |
| Lenovo Legion Y520-15IKBN 80WK0042GE | |
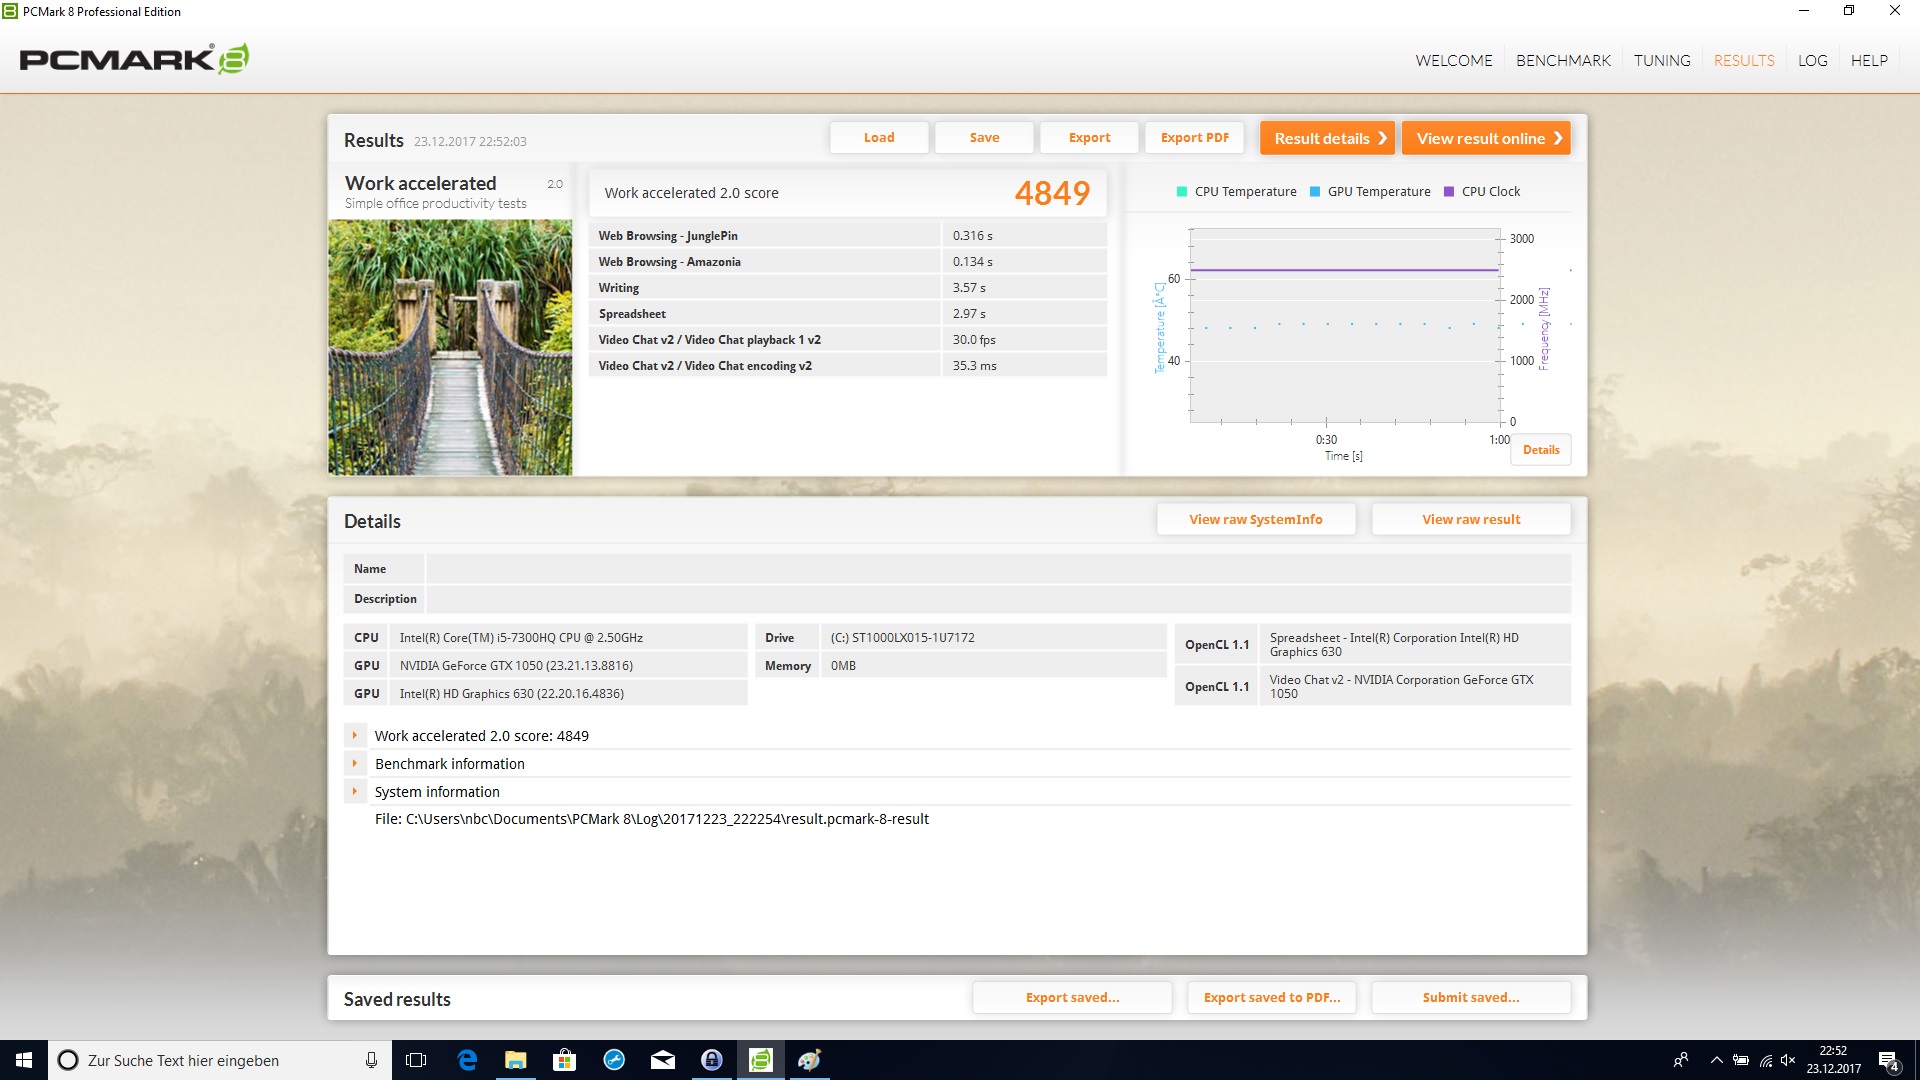
| Work Score Accelerated v2 | |
| Dell Inspiron 15 7000 7577 | |
| Dell Inspiron 15 7000 7577 | |
| MSI GL62M 7RD-077 | |
| Lenovo Legion Y520-15IKBN 80WK0042GE | |
| PCMark 8 Home Score Accelerated v2 | 3807 pontos | |
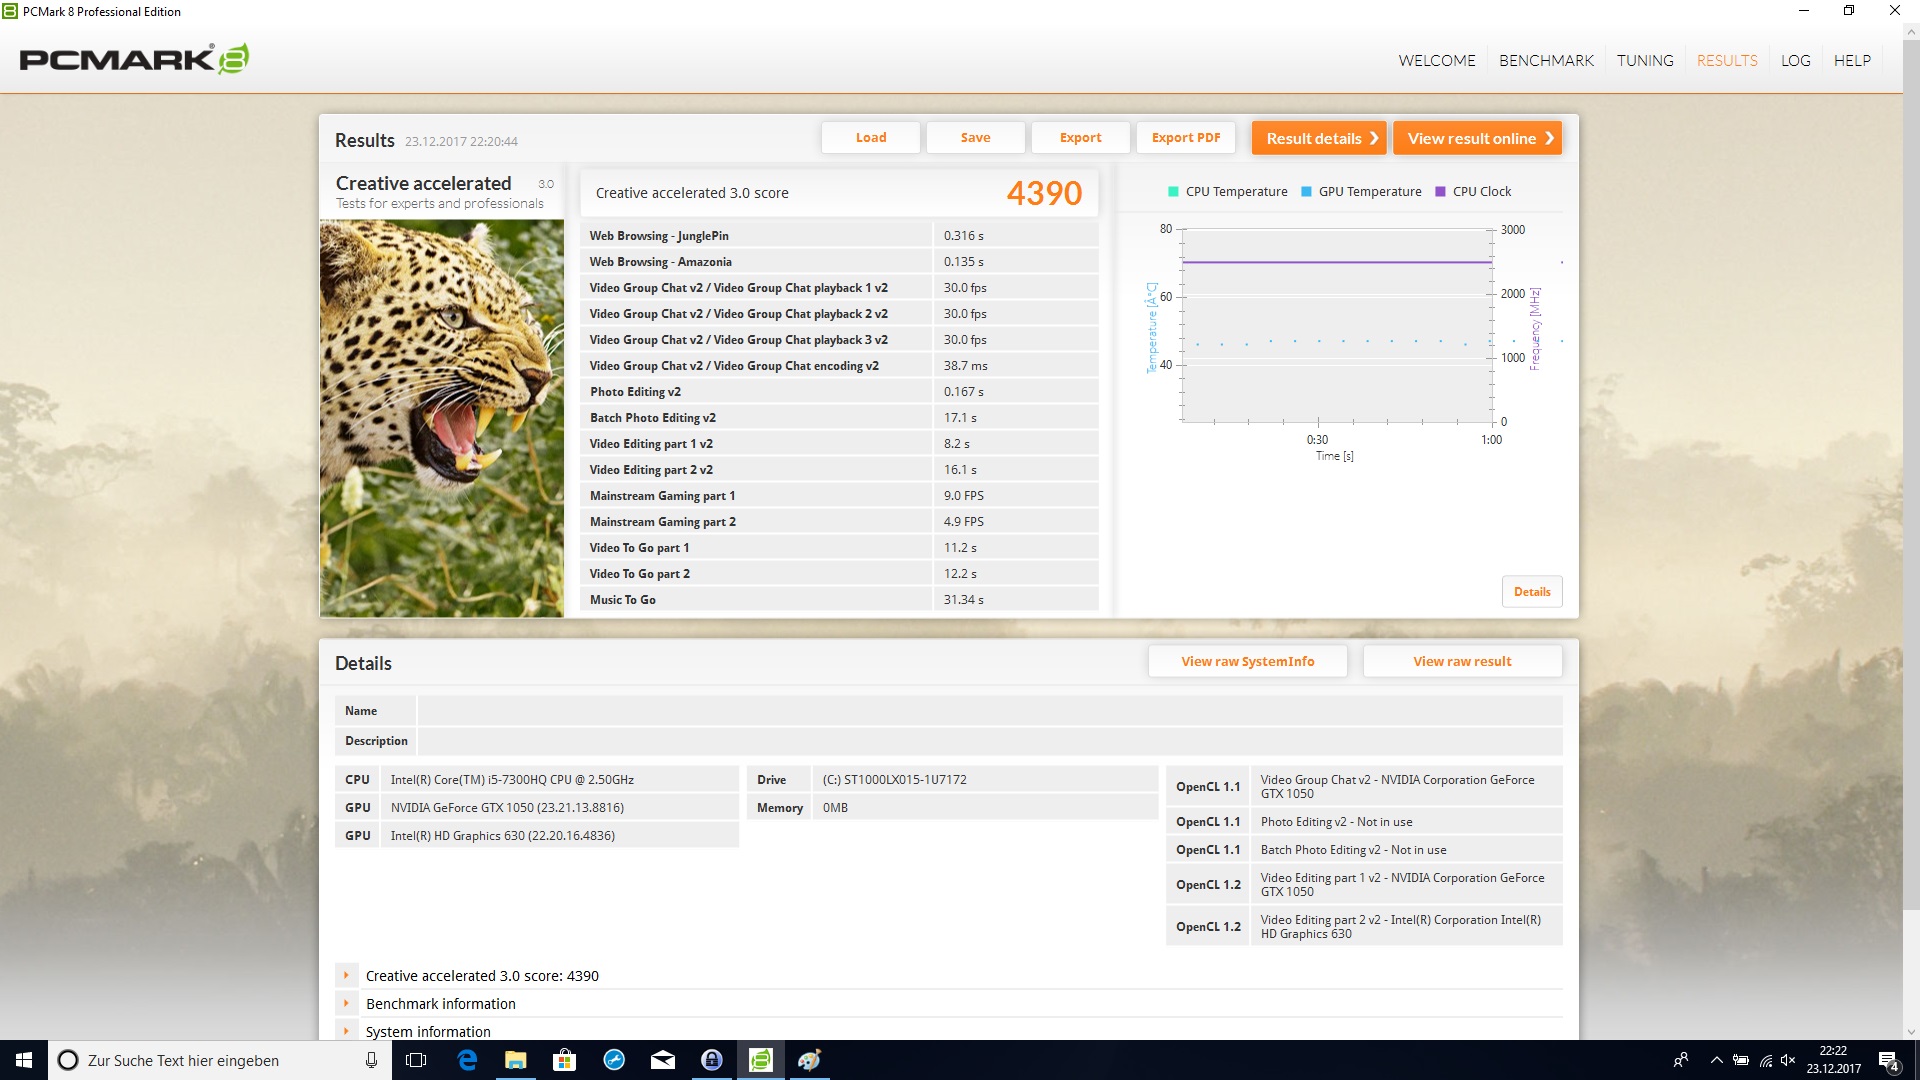
| PCMark 8 Creative Score Accelerated v2 | 4390 pontos | |
| PCMark 8 Work Score Accelerated v2 | 4849 pontos | |
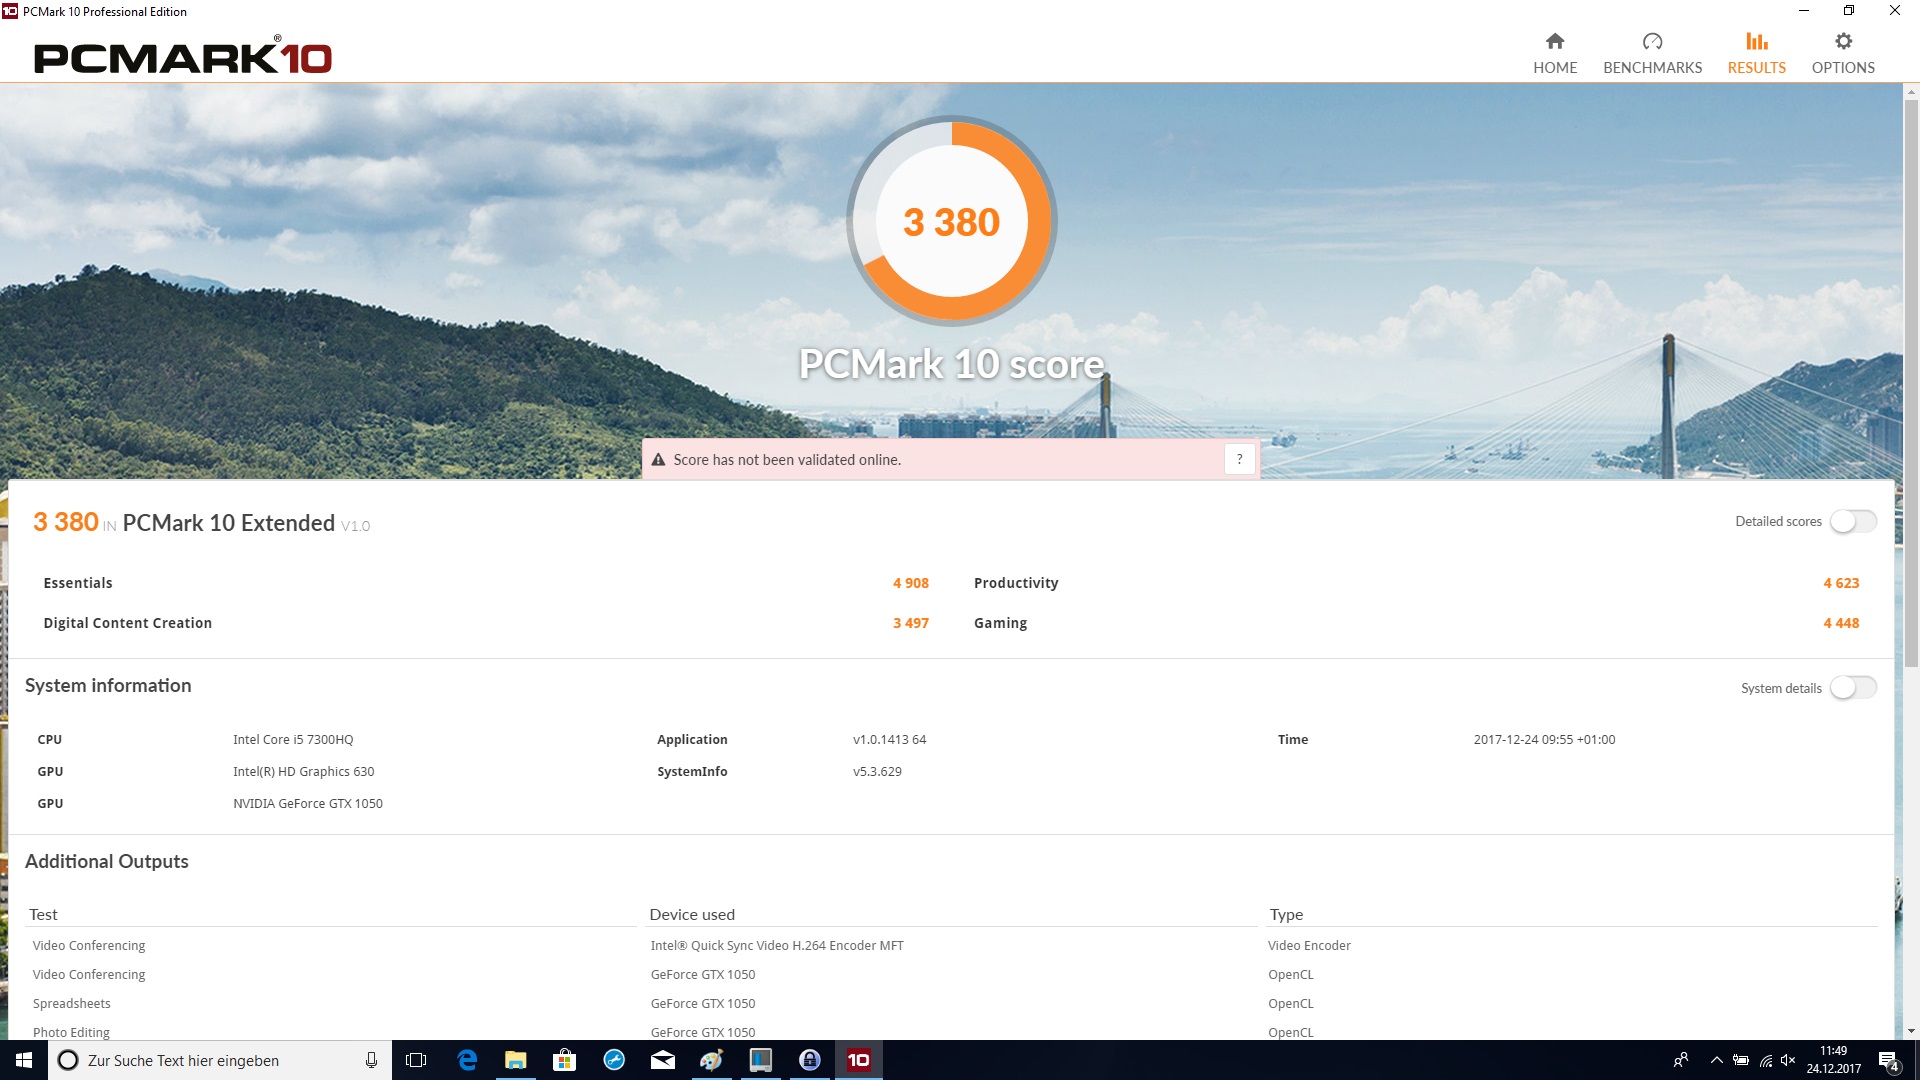
| PCMark 10 Score | 3380 pontos | |
Ajuda | ||
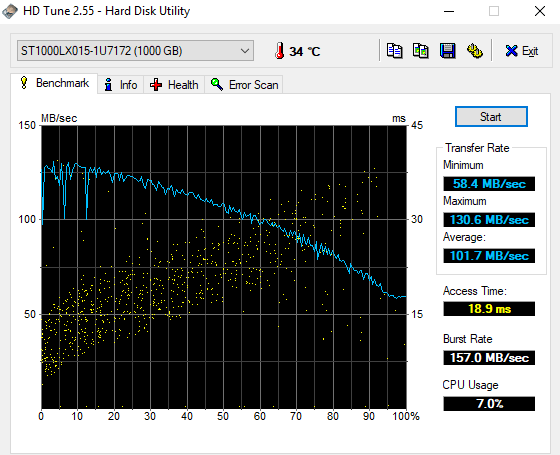
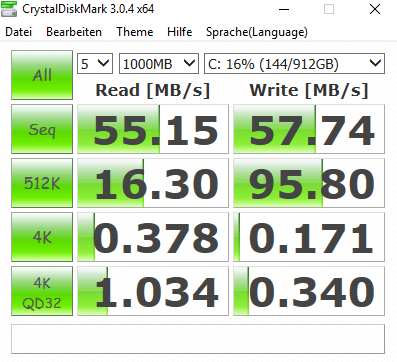
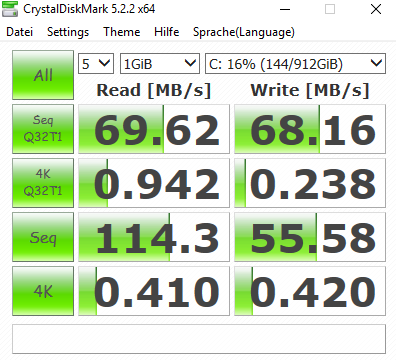
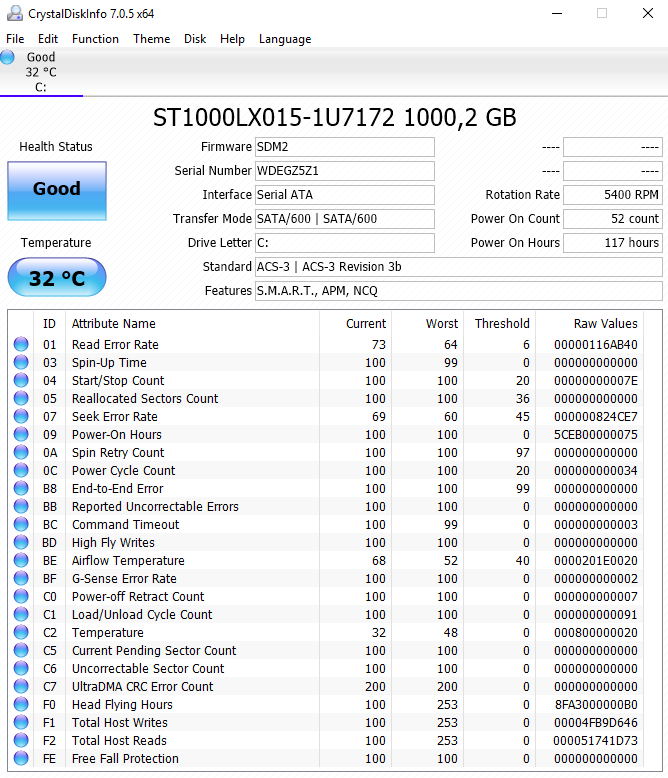
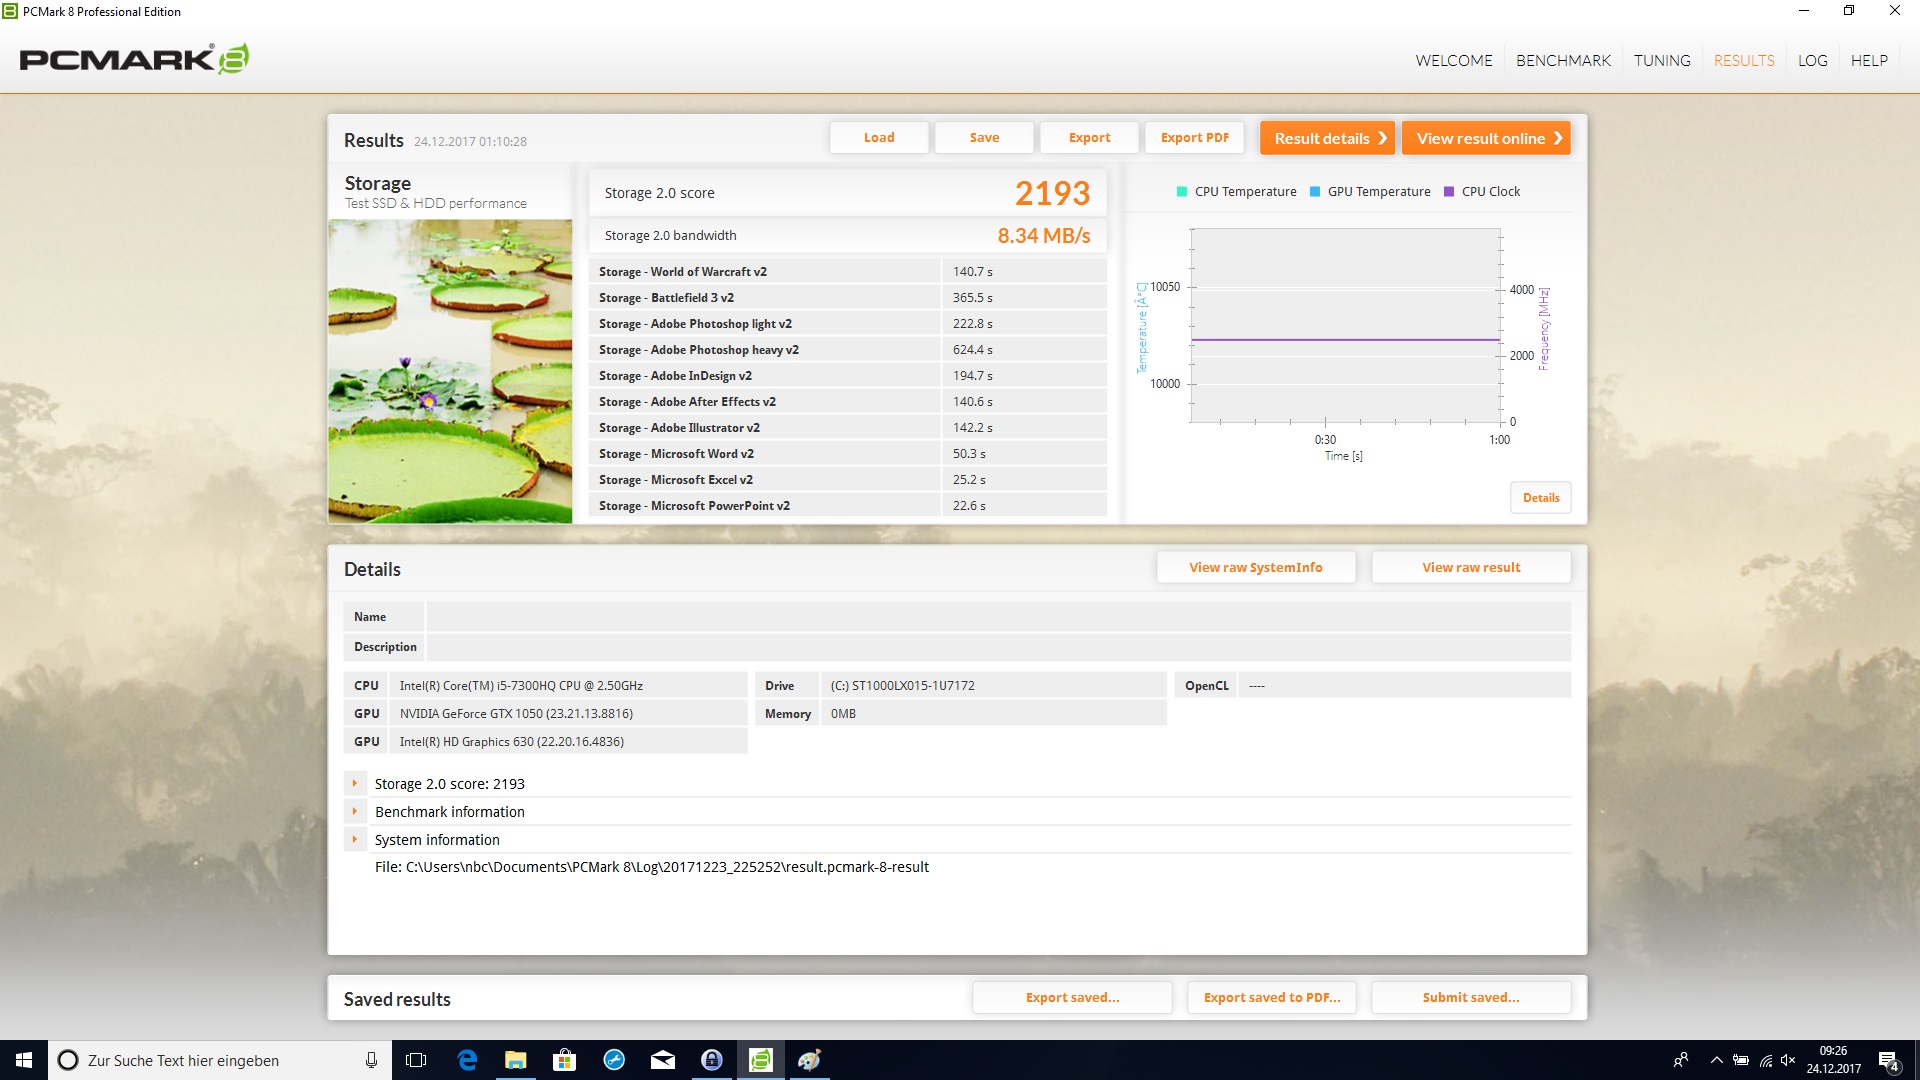
| Dell Inspiron 15 7000 7577 Seagate Mobile HDD 1TB ST1000LX015-1U7172 | Lenovo Legion Y520-15IKBN 80WK0042GE Samsung PM961 NVMe MZVLW128HEGR | Acer Aspire VX15 VX5-591G-589S Hynix HFS128G39TND | MSI GL62M 7RD-077 HGST Travelstar 7K1000 HTS721010A9E630 | |
|---|---|---|---|---|
| CrystalDiskMark 3.0 | 25854% | 18785% | 146% | |
| Read Seq (MB/s) | 55.2 | 2127 3753% | 510 824% | 112.4 104% |
| Write Seq (MB/s) | 57.7 | 796 1280% | 137.6 138% | 107.3 86% |
| Read 512 (MB/s) | 16.3 | 455.6 2695% | 362.1 2121% | 43.19 165% |
| Write 512 (MB/s) | 95.8 | 196.7 105% | 137.2 43% | 57 -41% |
| Read 4k (MB/s) | 0.378 | 46.07 12088% | 35.18 9207% | 0.494 31% |
| Write 4k (MB/s) | 0.171 | 154.8 90426% | 104.8 61187% | 1.122 556% |
| Read 4k QD32 (MB/s) | 1.034 | 480.9 46409% | 375.8 36244% | 1.088 5% |
| Write 4k QD32 (MB/s) | 0.34 | 170.6 50076% | 138.1 40518% | 1.234 263% |

| 3DMark | |
| 1280x720 Cloud Gate Standard Graphics | |
| Dell Inspiron 15 7000 7577 | |
| Lenovo Legion Y520-15IKBN 80WK0042GE | |
| MSI GL62M 7RD-077 | |
| Dell Inspiron 15 7000 7577 | |
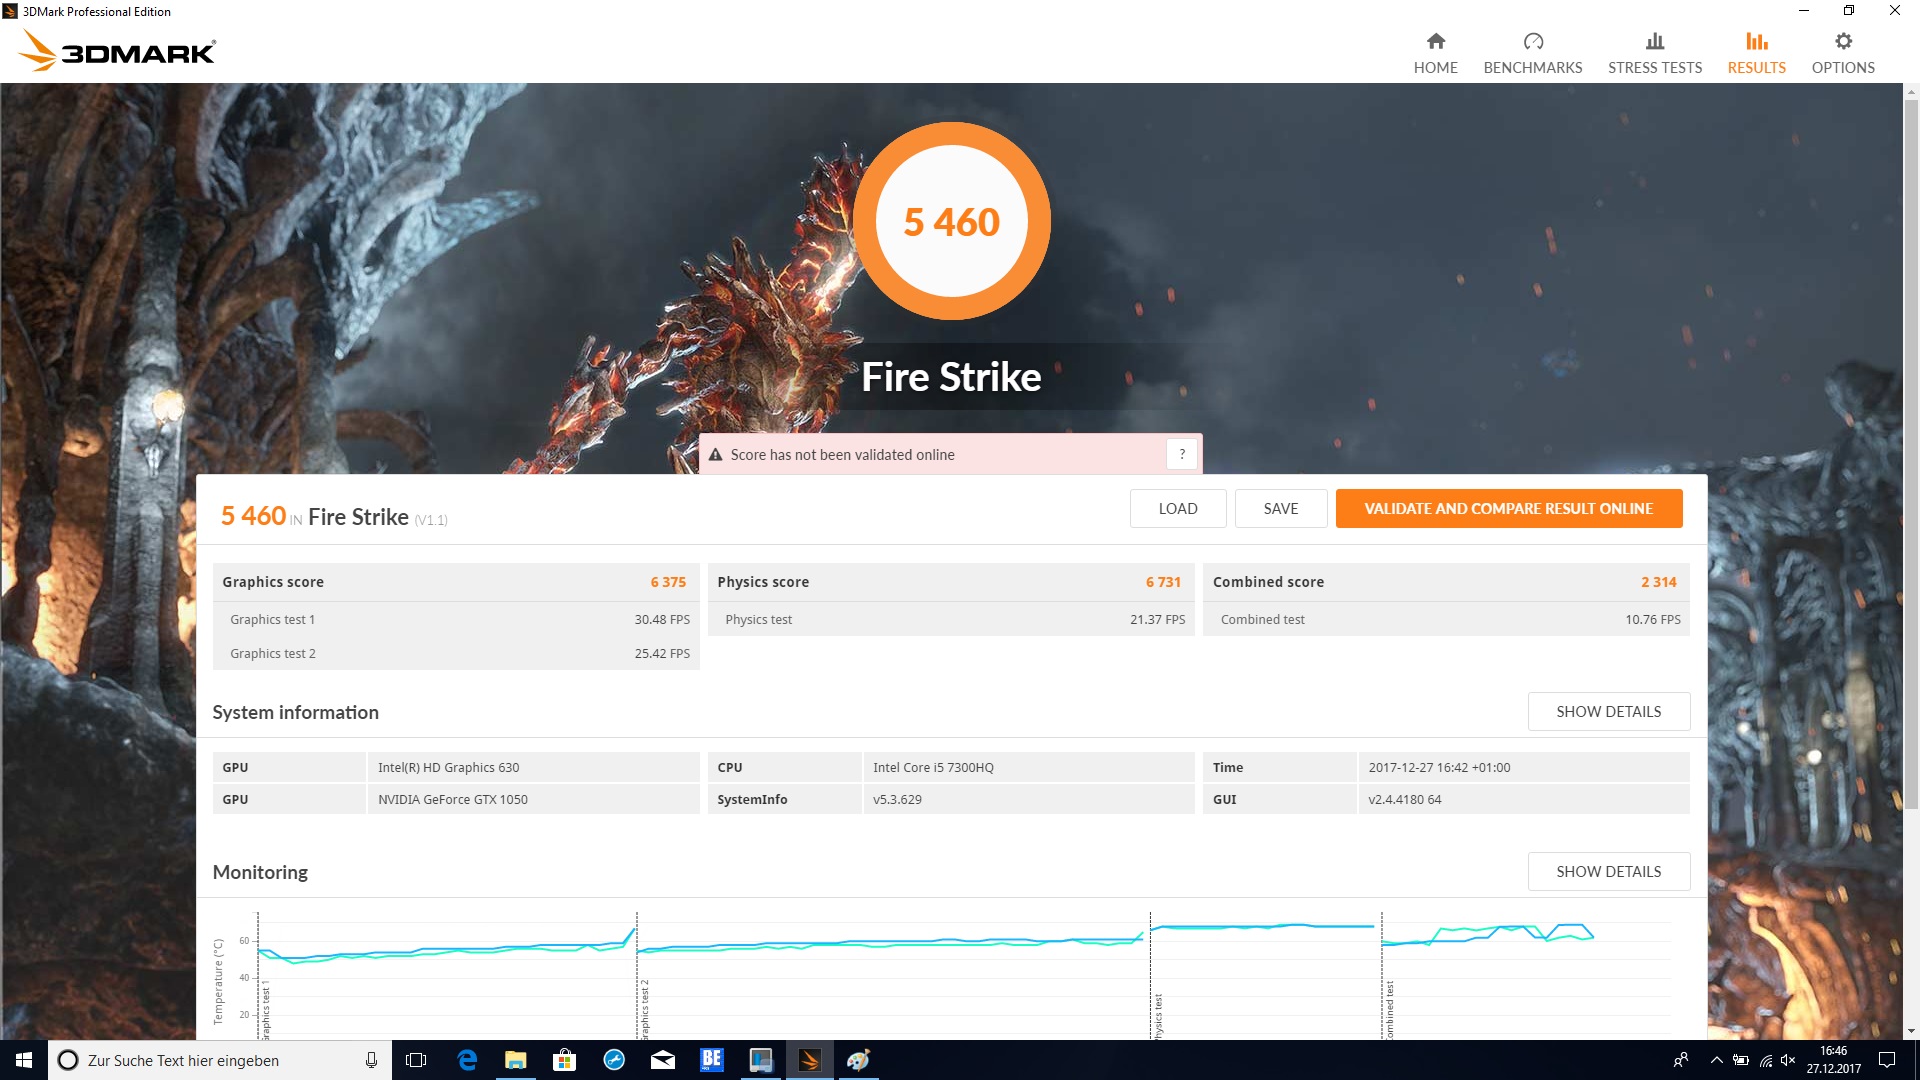
| 1920x1080 Fire Strike Graphics | |
| Dell Inspiron 15 7000 7577 | |
| Lenovo Legion Y520-15IKBN 80WK0042GE | |
| MSI GL62M 7RD-077 | |
| Dell Inspiron 15 7000 7577 | |
| 3DMark 11 - 1280x720 Performance GPU | |
| Dell Inspiron 15 7000 7577 | |
| Lenovo Legion Y520-15IKBN 80WK0042GE | |
| MSI GL62M 7RD-077 | |
| Dell Inspiron 15 7000 7577 | |
| Acer Aspire VX15 VX5-591G-589S | |
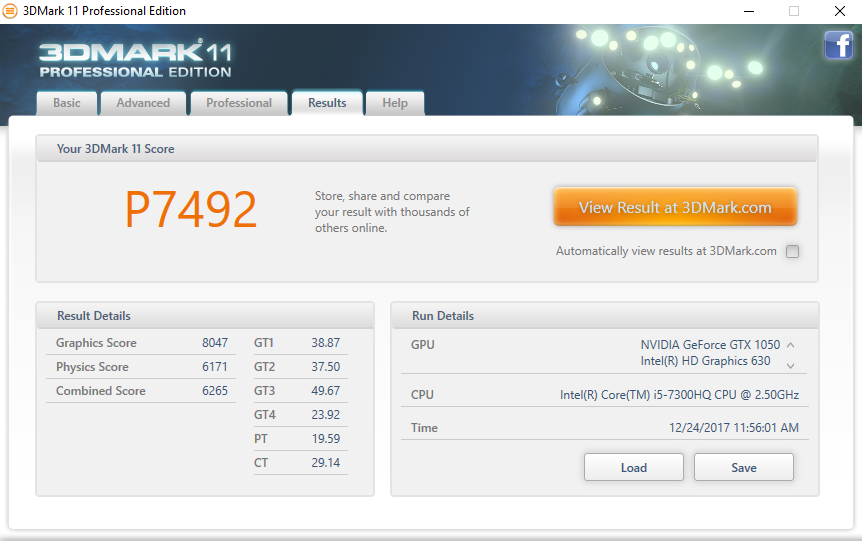
| 3DMark 11 Performance | 7492 pontos | |
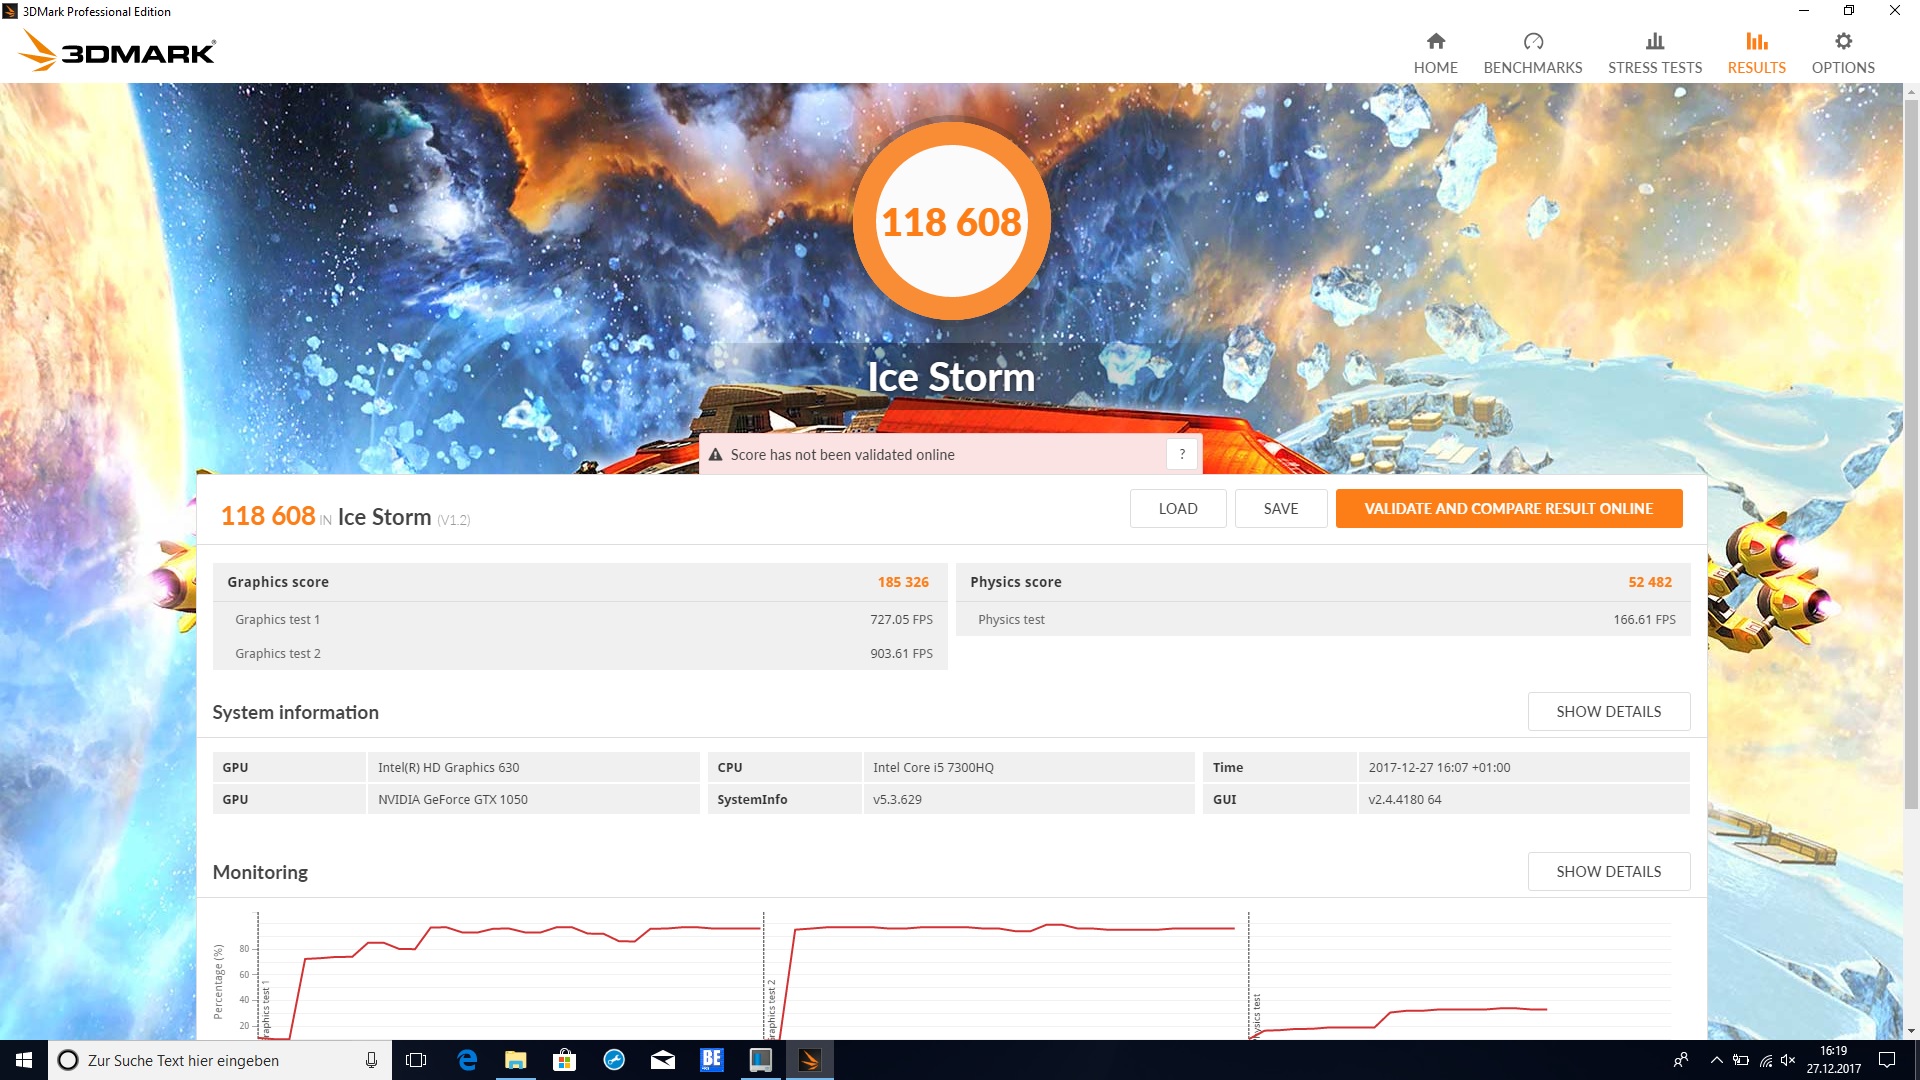
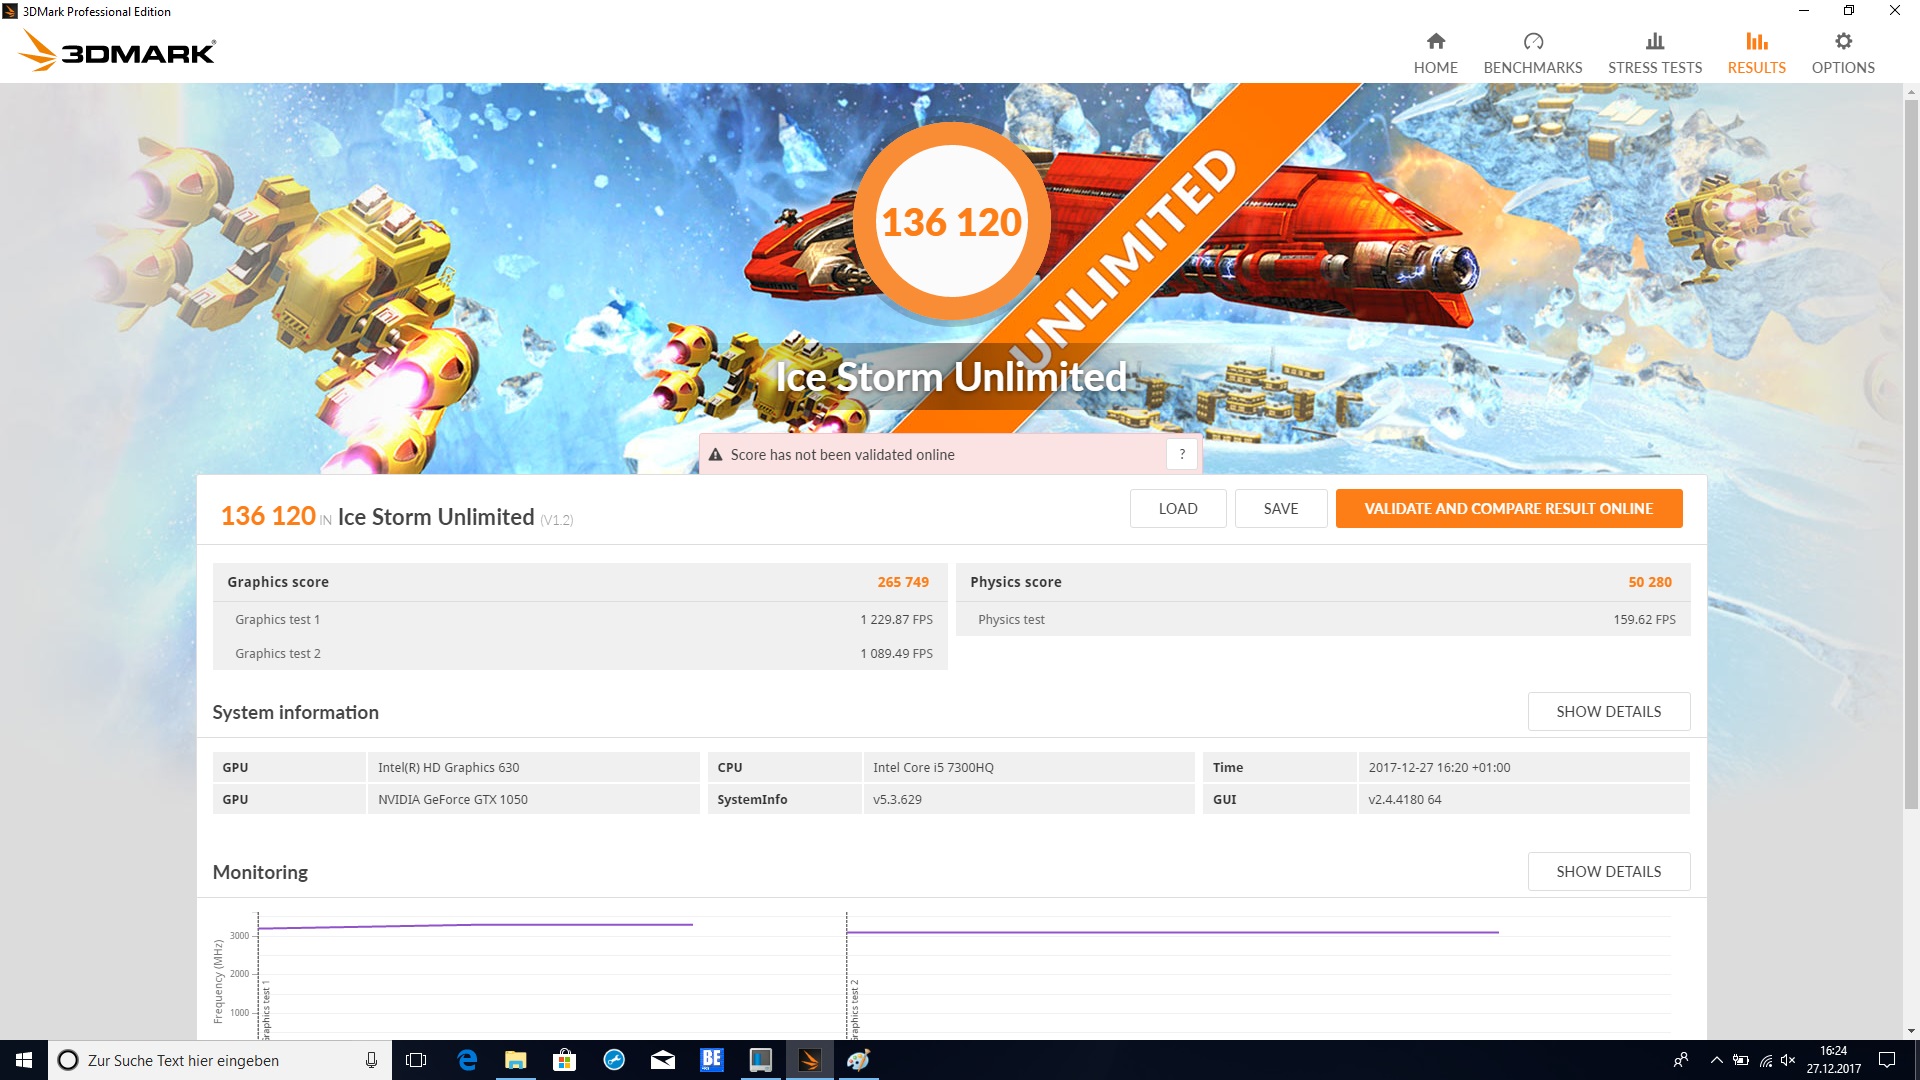
| 3DMark Ice Storm Standard Score | 118608 pontos | |
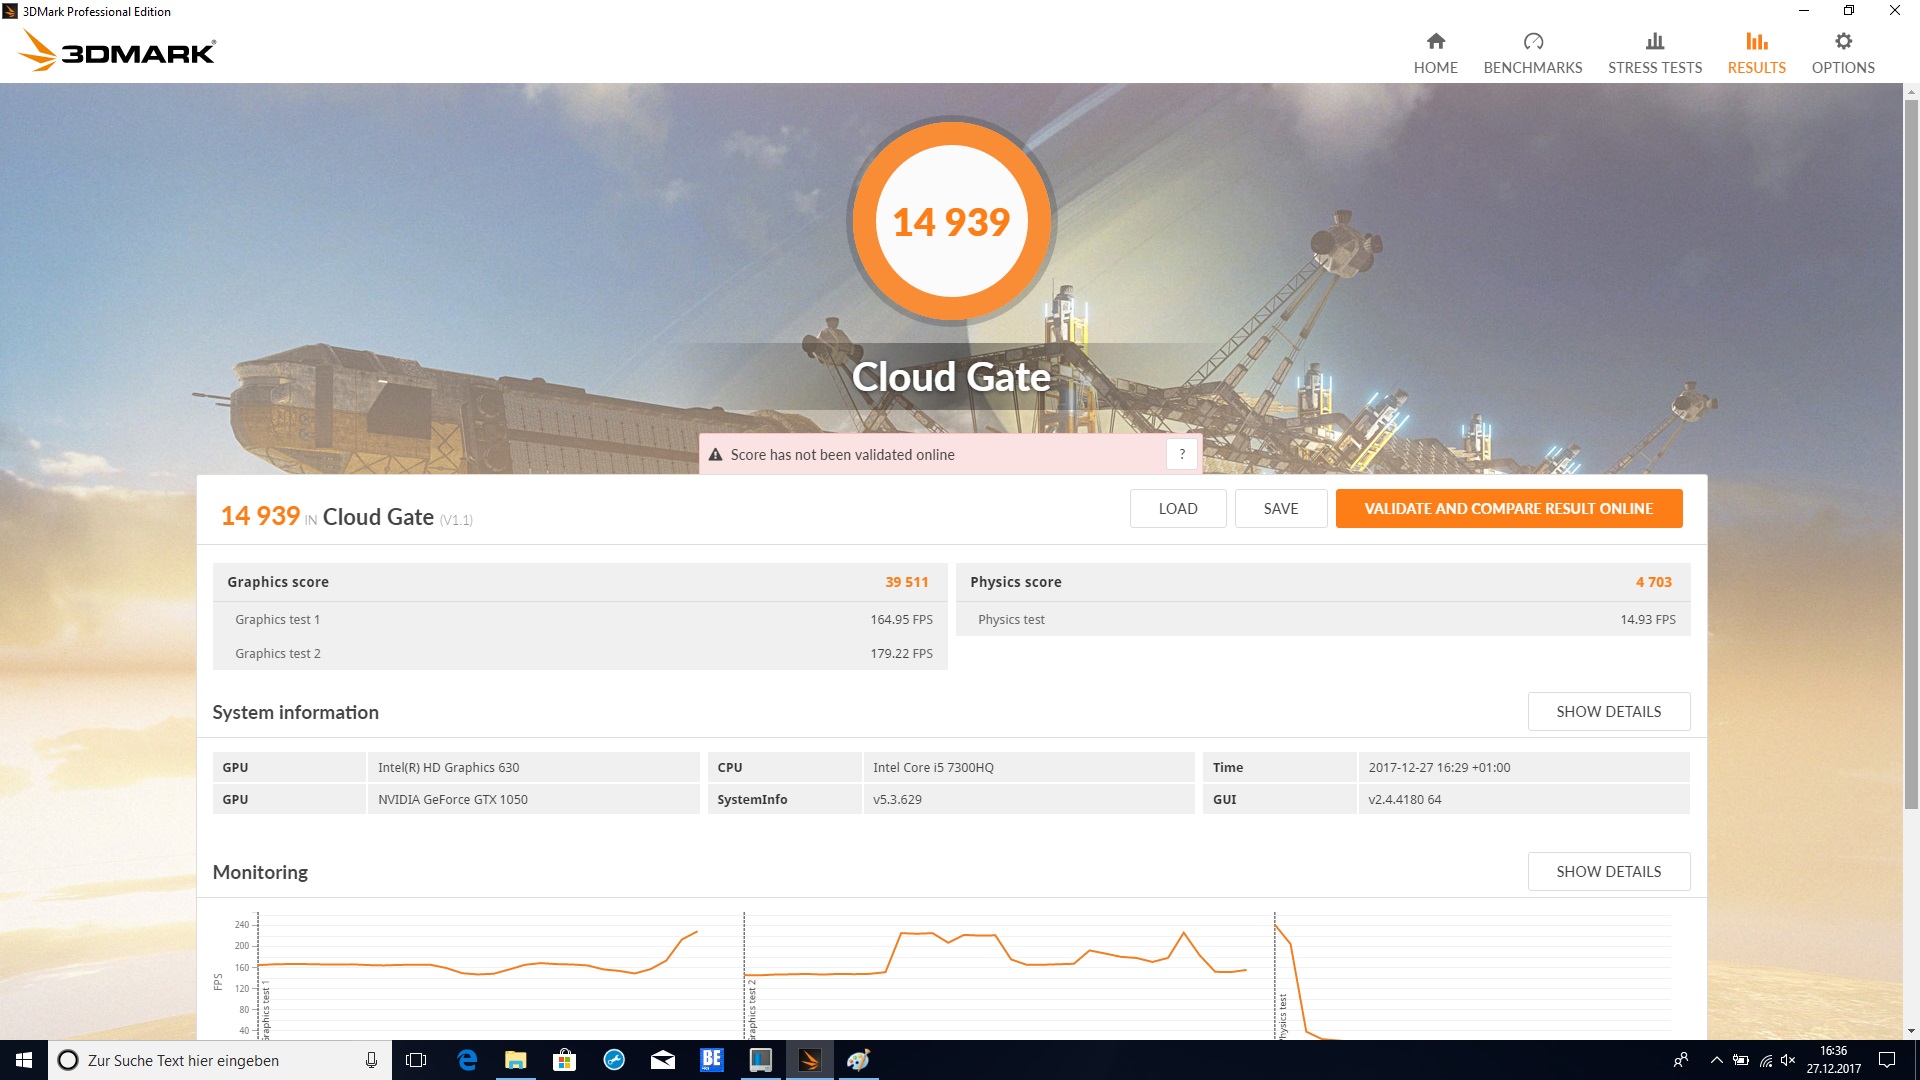
| 3DMark Cloud Gate Standard Score | 14939 pontos | |
| 3DMark Fire Strike Score | 5460 pontos | |
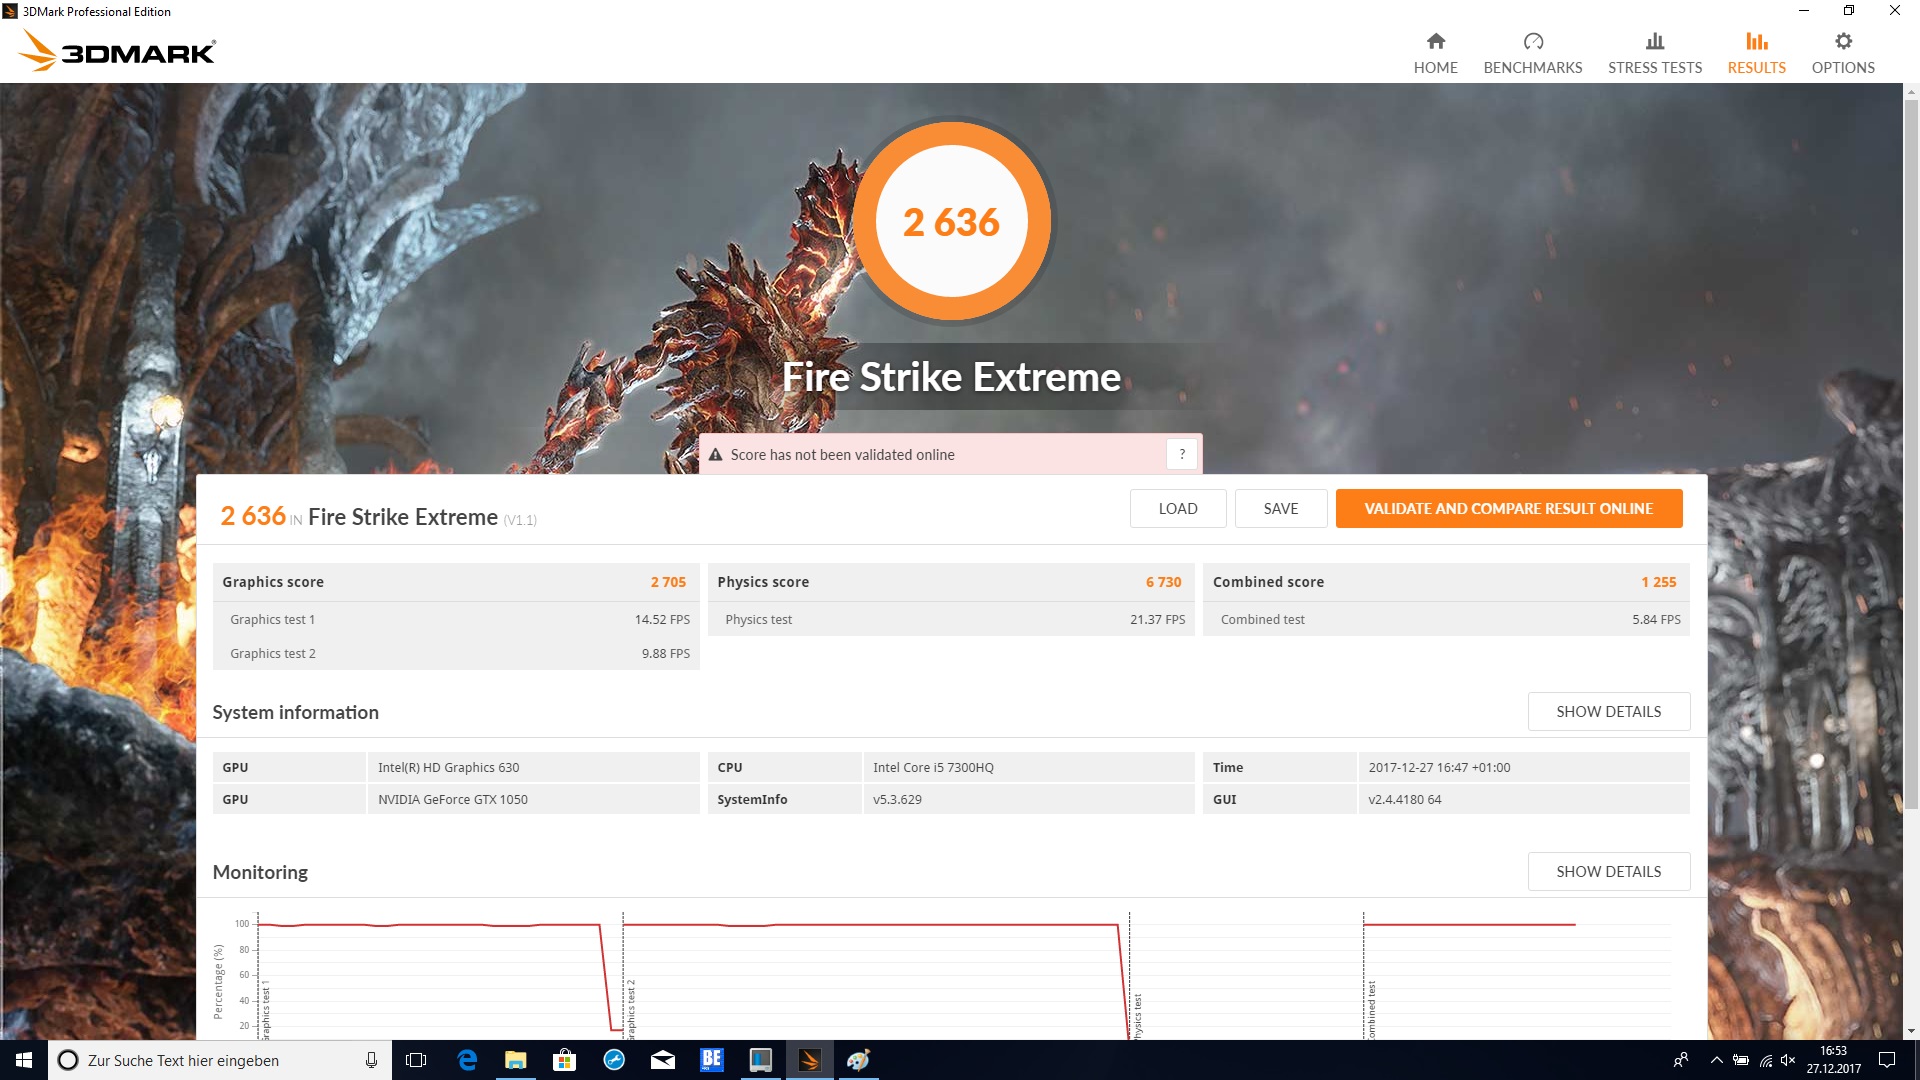
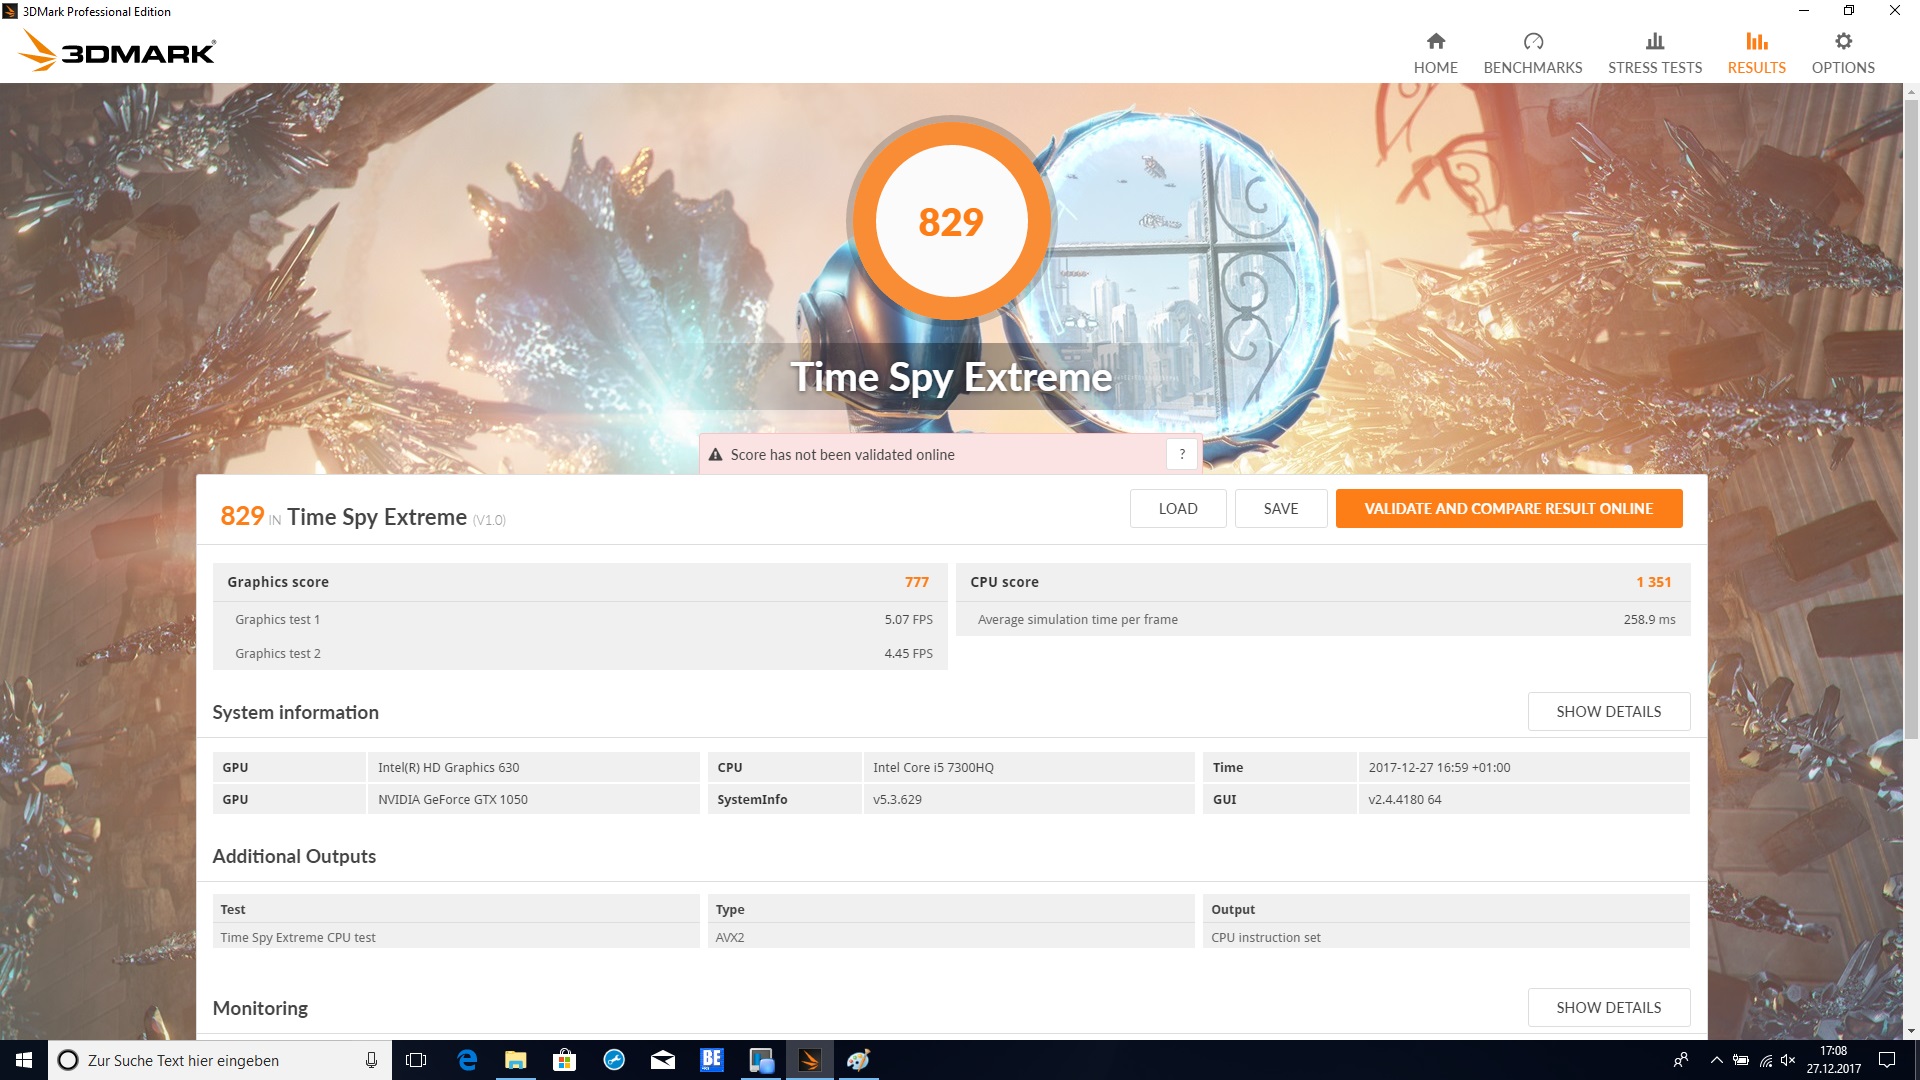
| 3DMark Fire Strike Extreme Score | 2636 pontos | |
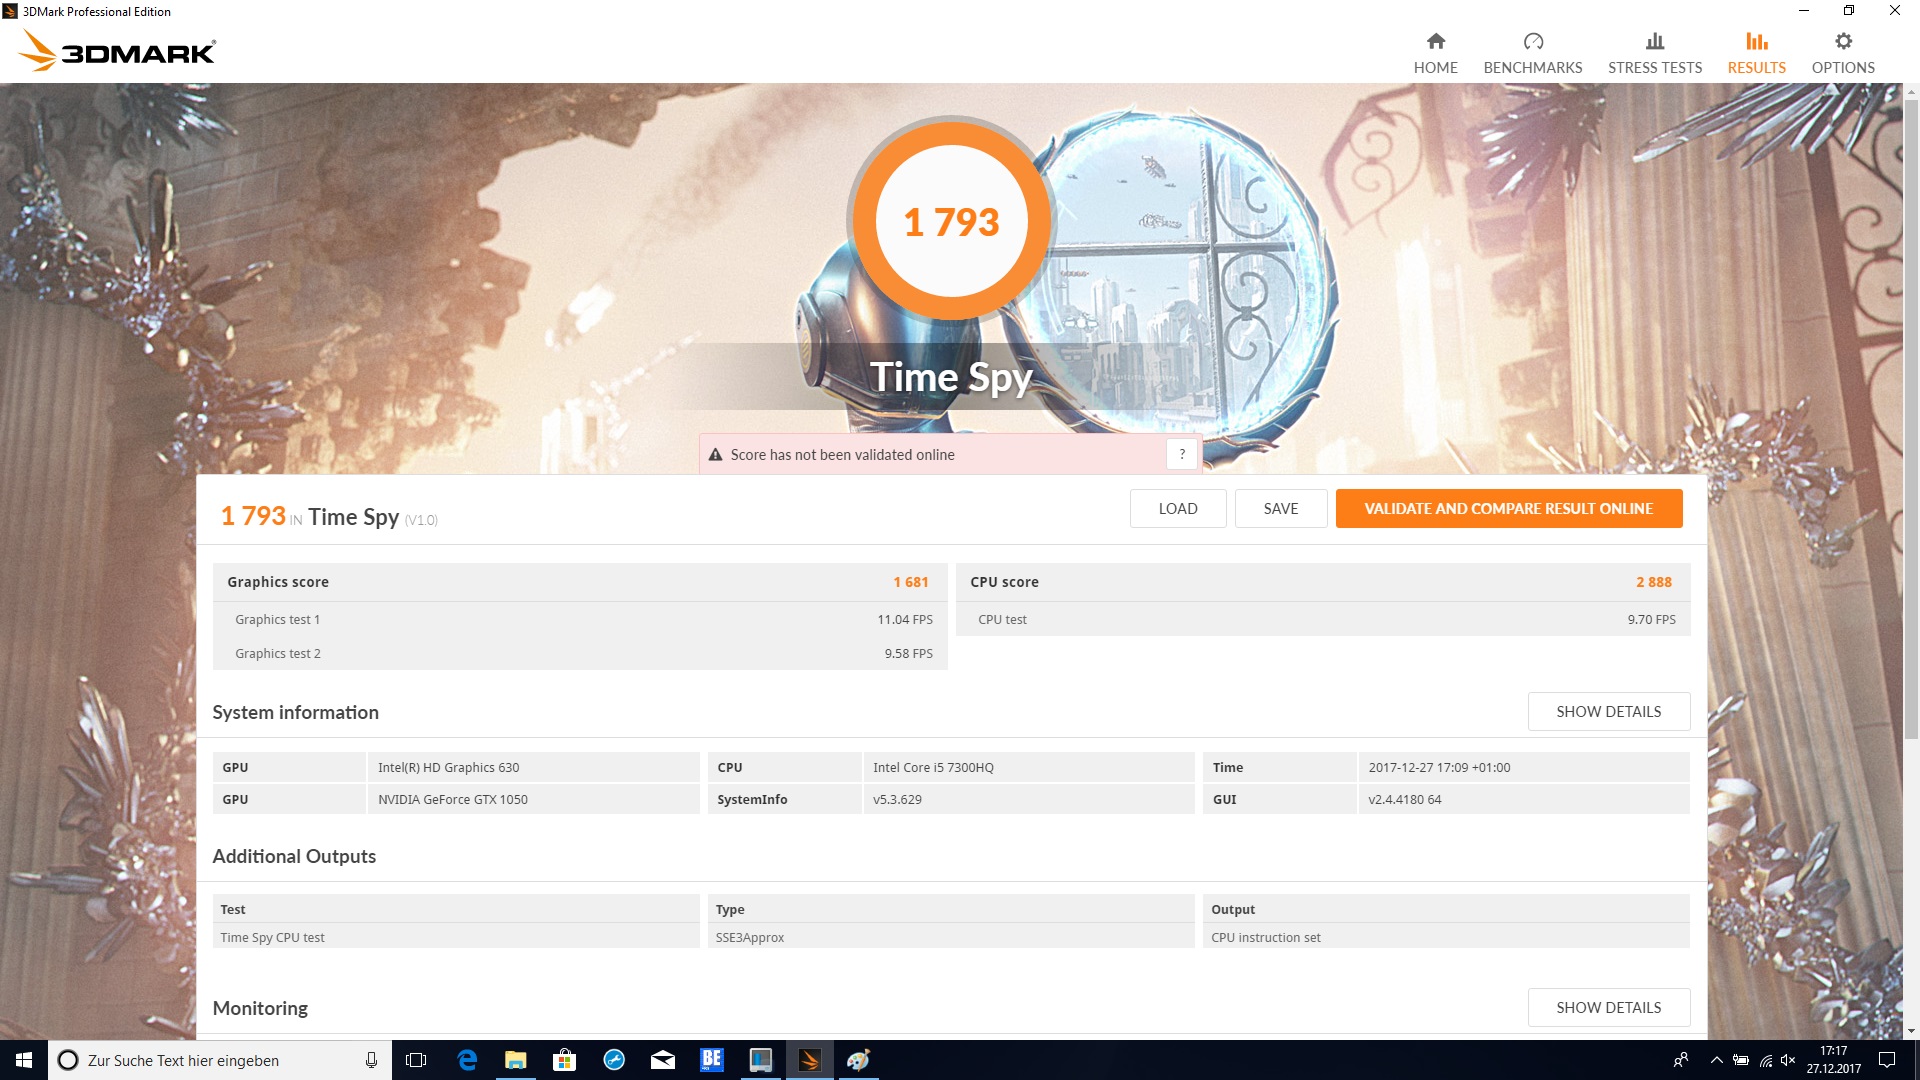
| 3DMark Time Spy Score | 1793 pontos | |
Ajuda | ||
| baixo | média | alto | ultra | |
|---|---|---|---|---|
| BioShock Infinite (2013) | 217.4 | 158.3 | 146.6 | 64.3 |
| Battlefield 4 (2013) | 170 | 143.7 | 124.3 | 51.5 |
| The Witcher 3 (2015) | 115.1 | 72.9 | 41 | 22.6 |
| Rise of the Tomb Raider (2016) | 124.2 | 73.8 | 39.6 | 33.1 |
Barulho
| Ocioso |
| 32.7 / 32.7 / 32.7 dB |
| HDD |
| 33 dB |
| Carga |
| 38.7 / 44.6 dB |
 | ||
30 dB silencioso 40 dB(A) audível 50 dB(A) ruidosamente alto |
||
min: | ||
| Dell Inspiron 15 7000 7577 GeForce GTX 1050 Mobile, i5-7300HQ, Seagate Mobile HDD 1TB ST1000LX015-1U7172 | Dell Inspiron 15 7000 7577 GeForce GTX 1060 Max-Q, i5-7300HQ, Samsung PM961 MZVLW256HEHP | Lenovo Legion Y520-15IKBN 80WK0042GE GeForce GTX 1050 Ti Mobile, i5-7300HQ, Samsung PM961 NVMe MZVLW128HEGR | Acer Aspire VX15 VX5-591G-589S GeForce GTX 1050 Mobile, i5-7300HQ, Hynix HFS128G39TND | MSI GL62M 7RD-077 GeForce GTX 1050 Mobile, i7-7700HQ, HGST Travelstar 7K1000 HTS721010A9E630 | |
|---|---|---|---|---|---|
| Noise | 10% | 3% | 9% | -1% | |
| desligado / ambiente * (dB) | 31 | 28 10% | 30.6 1% | 30 3% | 30.6 1% |
| Idle Minimum * (dB) | 32.7 | 28 14% | 31.9 2% | 30 8% | 32.5 1% |
| Idle Average * (dB) | 32.7 | 28 14% | 31.9 2% | 30 8% | 32.5 1% |
| Idle Maximum * (dB) | 32.7 | 28 14% | 31.9 2% | 31.1 5% | 32.5 1% |
| Load Average * (dB) | 38.7 | 30.3 22% | 34.6 11% | 31.3 19% | 36.4 6% |
| Witcher 3 ultra * (dB) | 39 | 39.5 -1% | 39.3 -1% | ||
| Load Maximum * (dB) | 44.6 | 46.5 -4% | 41.7 7% | 38.9 13% | 52.4 -17% |
* ... menor é melhor
(+) A temperatura máxima no lado superior é 35.9 °C / 97 F, em comparação com a média de 40.4 °C / 105 F , variando de 21.2 a 68.8 °C para a classe Gaming.
(±) A parte inferior aquece até um máximo de 41.6 °C / 107 F, em comparação com a média de 43.2 °C / 110 F
(+) Em uso inativo, a temperatura média para o lado superior é 26.4 °C / 80 F, em comparação com a média do dispositivo de 33.9 °C / ### class_avg_f### F.
(+) Jogando The Witcher 3, a temperatura média para o lado superior é 28.4 °C / 83 F, em comparação com a média do dispositivo de 33.9 °C / ## #class_avg_f### F.
(+) Os apoios para as mãos e o touchpad são mais frios que a temperatura da pele, com um máximo de 29.1 °C / 84.4 F e, portanto, são frios ao toque.
(±) A temperatura média da área do apoio para as mãos de dispositivos semelhantes foi 28.8 °C / 83.8 F (-0.3 °C / -0.6 F).
| Dell Inspiron 15 7000 7577 GeForce GTX 1050 Mobile, i5-7300HQ, Seagate Mobile HDD 1TB ST1000LX015-1U7172 | Dell Inspiron 15 7000 7577 GeForce GTX 1060 Max-Q, i5-7300HQ, Samsung PM961 MZVLW256HEHP | Lenovo Legion Y520-15IKBN 80WK0042GE GeForce GTX 1050 Ti Mobile, i5-7300HQ, Samsung PM961 NVMe MZVLW128HEGR | Acer Aspire VX15 VX5-591G-589S GeForce GTX 1050 Mobile, i5-7300HQ, Hynix HFS128G39TND | MSI GL62M 7RD-077 GeForce GTX 1050 Mobile, i7-7700HQ, HGST Travelstar 7K1000 HTS721010A9E630 | |
|---|---|---|---|---|---|
| Heat | -3% | 11% | -11% | -3% | |
| Maximum Upper Side * (°C) | 35.9 | 44 -23% | 39.6 -10% | 47.2 -31% | 44.9 -25% |
| Maximum Bottom * (°C) | 41.6 | 43.8 -5% | 38.4 8% | 42.2 -1% | 38.2 8% |
| Idle Upper Side * (°C) | 27.9 | 26 7% | 22.8 18% | 31.8 -14% | 27.4 2% |
| Idle Bottom * (°C) | 30.5 | 28 8% | 22.1 28% | 29.5 3% | 29 5% |
* ... menor é melhor
Dell Inspiron 15 7000 7577 análise de áudio
(-) | alto-falantes não muito altos (###valor### dB)
Graves 100 - 315Hz
(±) | graves reduzidos - em média 9.3% menor que a mediana
(+) | o baixo é linear (6.1% delta para a frequência anterior)
Médios 400 - 2.000 Hz
(±) | médios mais altos - em média 6.1% maior que a mediana
(+) | médios são lineares (5.7% delta para frequência anterior)
Altos 2 - 16 kHz
(±) | máximos mais altos - em média 6% maior que a mediana
(±) | a linearidade dos máximos é média (10.4% delta para frequência anterior)
Geral 100 - 16.000 Hz
(±) | a linearidade do som geral é média (19% diferença em relação à mediana)
Comparado com a mesma classe
» 63% de todos os dispositivos testados nesta classe foram melhores, 8% semelhantes, 28% piores
» O melhor teve um delta de 6%, a média foi 18%, o pior foi 132%
Comparado com todos os dispositivos testados
» 45% de todos os dispositivos testados foram melhores, 7% semelhantes, 48% piores
» O melhor teve um delta de 4%, a média foi 23%, o pior foi 134%
Lenovo Legion Y520-15IKBN 80WK0042GE análise de áudio
(-) | alto-falantes não muito altos (###valor### dB)
Graves 100 - 315Hz
(-) | quase nenhum baixo - em média 16.9% menor que a mediana
(±) | a linearidade dos graves é média (13.9% delta para a frequência anterior)
Médios 400 - 2.000 Hz
(+) | médios equilibrados - apenas 4.6% longe da mediana
(±) | a linearidade dos médios é média (8.8% delta para frequência anterior)
Altos 2 - 16 kHz
(+) | agudos equilibrados - apenas 3.6% longe da mediana
(±) | a linearidade dos máximos é média (12.7% delta para frequência anterior)
Geral 100 - 16.000 Hz
(±) | a linearidade do som geral é média (22.6% diferença em relação à mediana)
Comparado com a mesma classe
» 81% de todos os dispositivos testados nesta classe foram melhores, 5% semelhantes, 14% piores
» O melhor teve um delta de 6%, a média foi 18%, o pior foi 132%
Comparado com todos os dispositivos testados
» 67% de todos os dispositivos testados foram melhores, 6% semelhantes, 28% piores
» O melhor teve um delta de 4%, a média foi 23%, o pior foi 134%
| desligado | |
| Ocioso | |
| Carga |
|
Key:
min: | |
| Dell Inspiron 15 7000 7577 i5-7300HQ, GeForce GTX 1050 Mobile, Seagate Mobile HDD 1TB ST1000LX015-1U7172, IPS, 1920x1080, 15.6" | Dell Inspiron 15 7000 7577 i5-7300HQ, GeForce GTX 1060 Max-Q, Samsung PM961 MZVLW256HEHP, IPS, 1920x1080, 15.6" | Lenovo Legion Y520-15IKBN 80WK0042GE i5-7300HQ, GeForce GTX 1050 Ti Mobile, Samsung PM961 NVMe MZVLW128HEGR, IPS, 1920x1080, 15.6" | Acer Aspire VX15 VX5-591G-589S i5-7300HQ, GeForce GTX 1050 Mobile, Hynix HFS128G39TND, IPS, 1920x1080, 15.6" | MSI GL62M 7RD-077 i7-7700HQ, GeForce GTX 1050 Mobile, HGST Travelstar 7K1000 HTS721010A9E630, TN LED, 1920x1080, 15.6" | |
|---|---|---|---|---|---|
| Power Consumption | 4% | 7% | -21% | -47% | |
| Idle Minimum * (Watt) | 5.3 | 7.1 -34% | 5.2 2% | 8.4 -58% | 10.6 -100% |
| Idle Average * (Watt) | 8.8 | 7.6 14% | 8.3 6% | 13.1 -49% | 14.5 -65% |
| Idle Maximum * (Watt) | 9.7 | 8.6 11% | 10.1 -4% | 14.2 -46% | 15 -55% |
| Load Average * (Watt) | 100 | 59.5 40% | 62.7 37% | 50 50% | 90 10% |
| Witcher 3 ultra * (Watt) | 87 | 89 -2% | 94 -8% | ||
| Load Maximum * (Watt) | 109 | 112.8 -3% | 100 8% | 111 -2% | 135 -24% |
* ... menor é melhor

| Dell Inspiron 15 7000 7577 i5-7300HQ, GeForce GTX 1050 Mobile, 56 Wh | Dell Inspiron 15 7000 7577 i5-7300HQ, GeForce GTX 1060 Max-Q, 56 Wh | Lenovo Legion Y520-15IKBN 80WK0042GE i5-7300HQ, GeForce GTX 1050 Ti Mobile, 45 Wh | Acer Aspire VX15 VX5-591G-589S i5-7300HQ, GeForce GTX 1050 Mobile, 52.5 Wh | MSI GL62M 7RD-077 i7-7700HQ, GeForce GTX 1050 Mobile, 41 Wh | |
|---|---|---|---|---|---|
| Duração da bateria | -4% | -16% | -19% | -44% | |
| Reader / Idle (h) | 11.1 | 11 -1% | 10.6 -5% | 6.5 -41% | |
| H.264 (h) | 5.2 | 4.5 -13% | 3.6 -31% | ||
| WiFi v1.3 (h) | 6.8 | 6.9 1% | 5.2 -24% | 5.5 -19% | 3.8 -44% |
| Load (h) | 1.8 | 1.6 -11% | 1.4 -22% | 0.7 -61% |
Pro
Contra

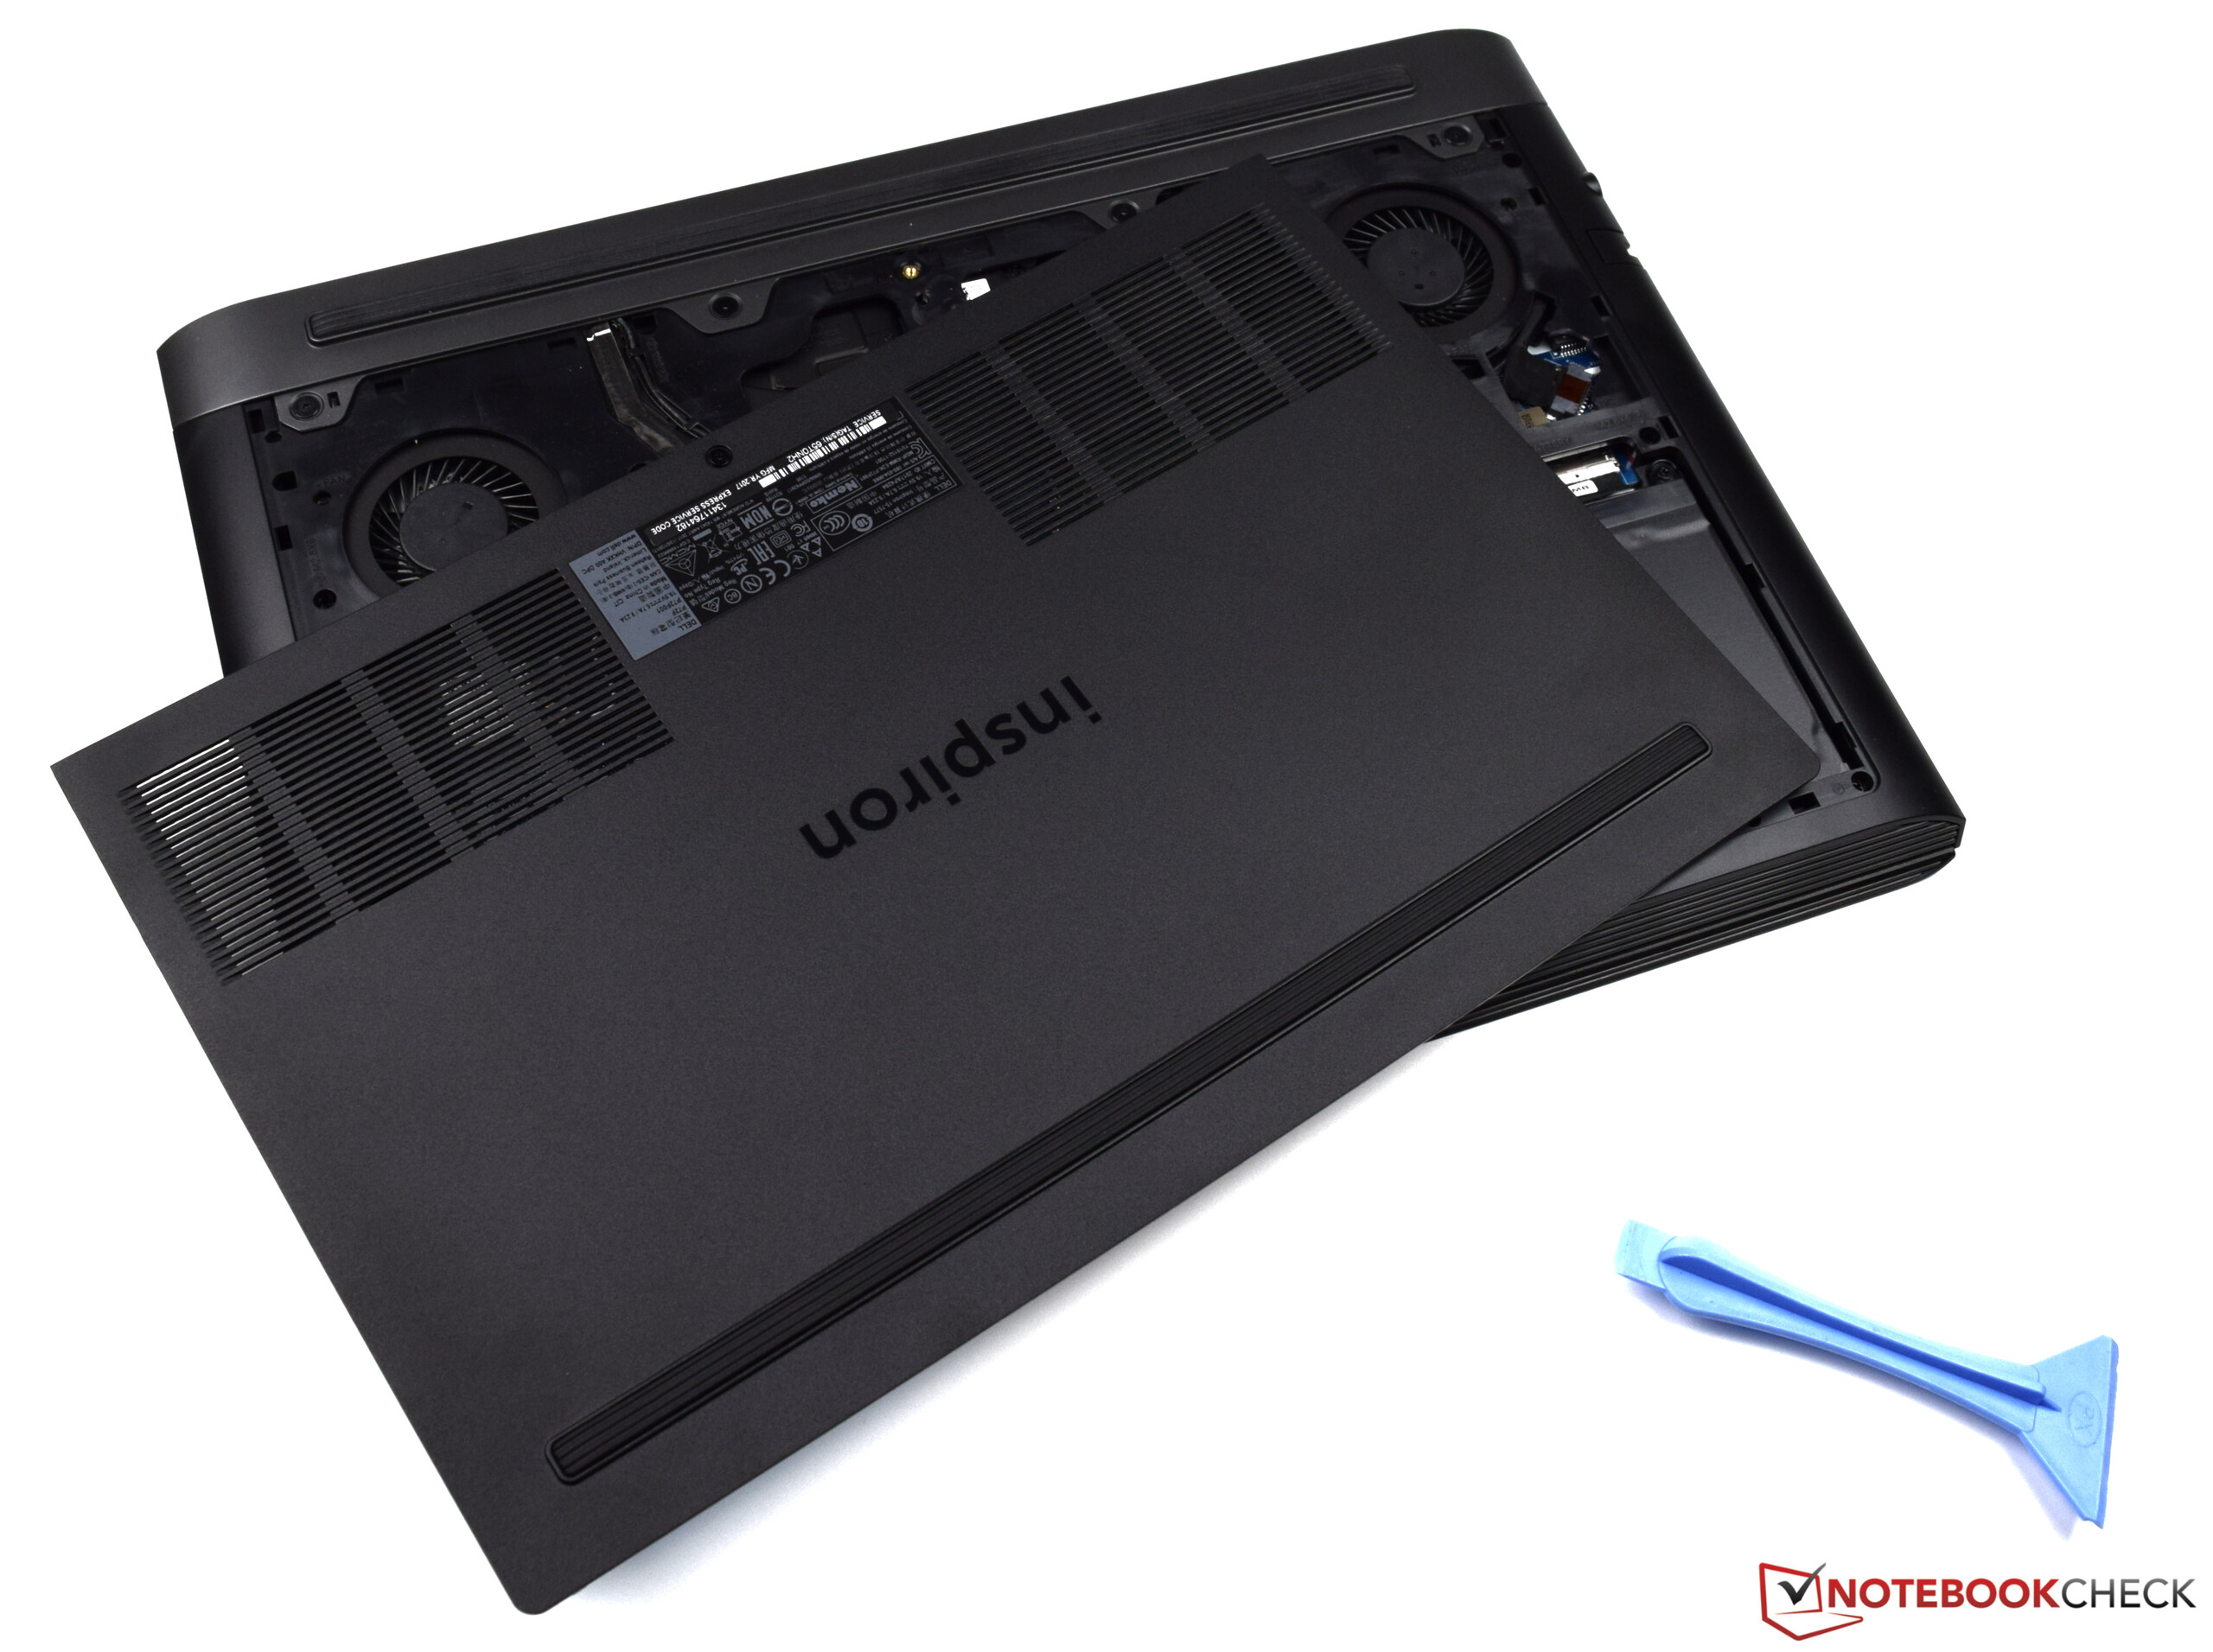
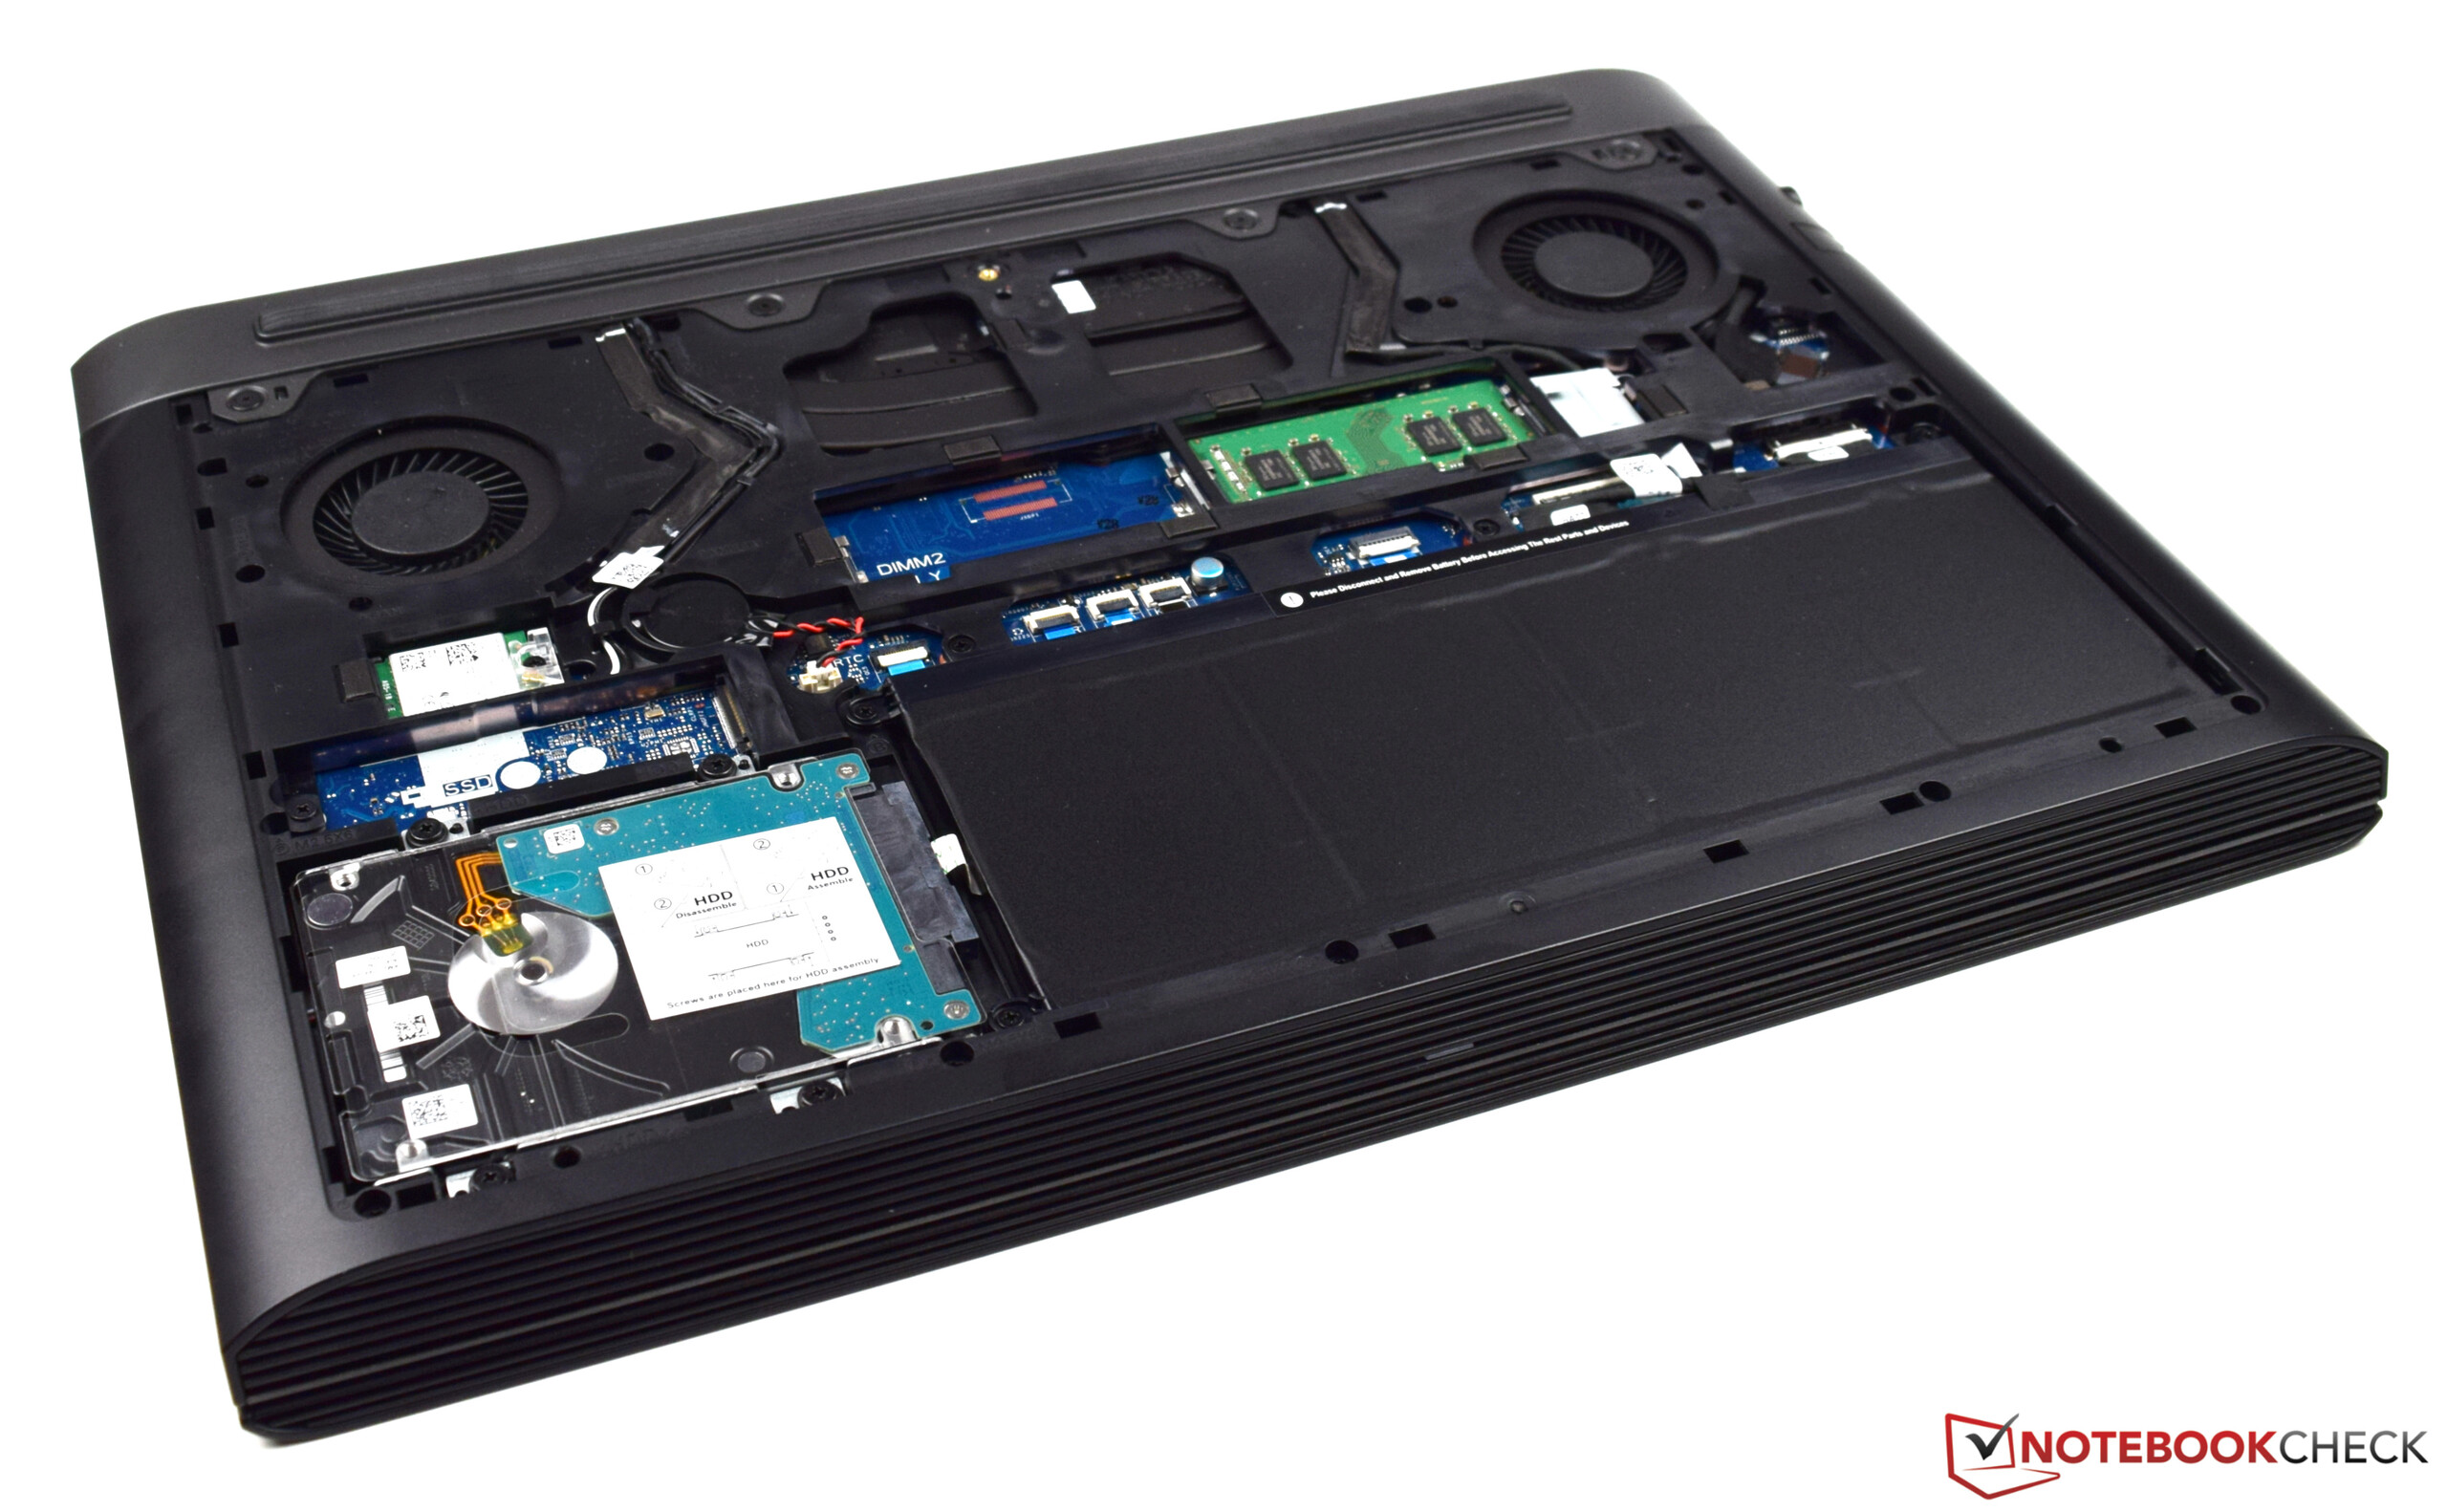
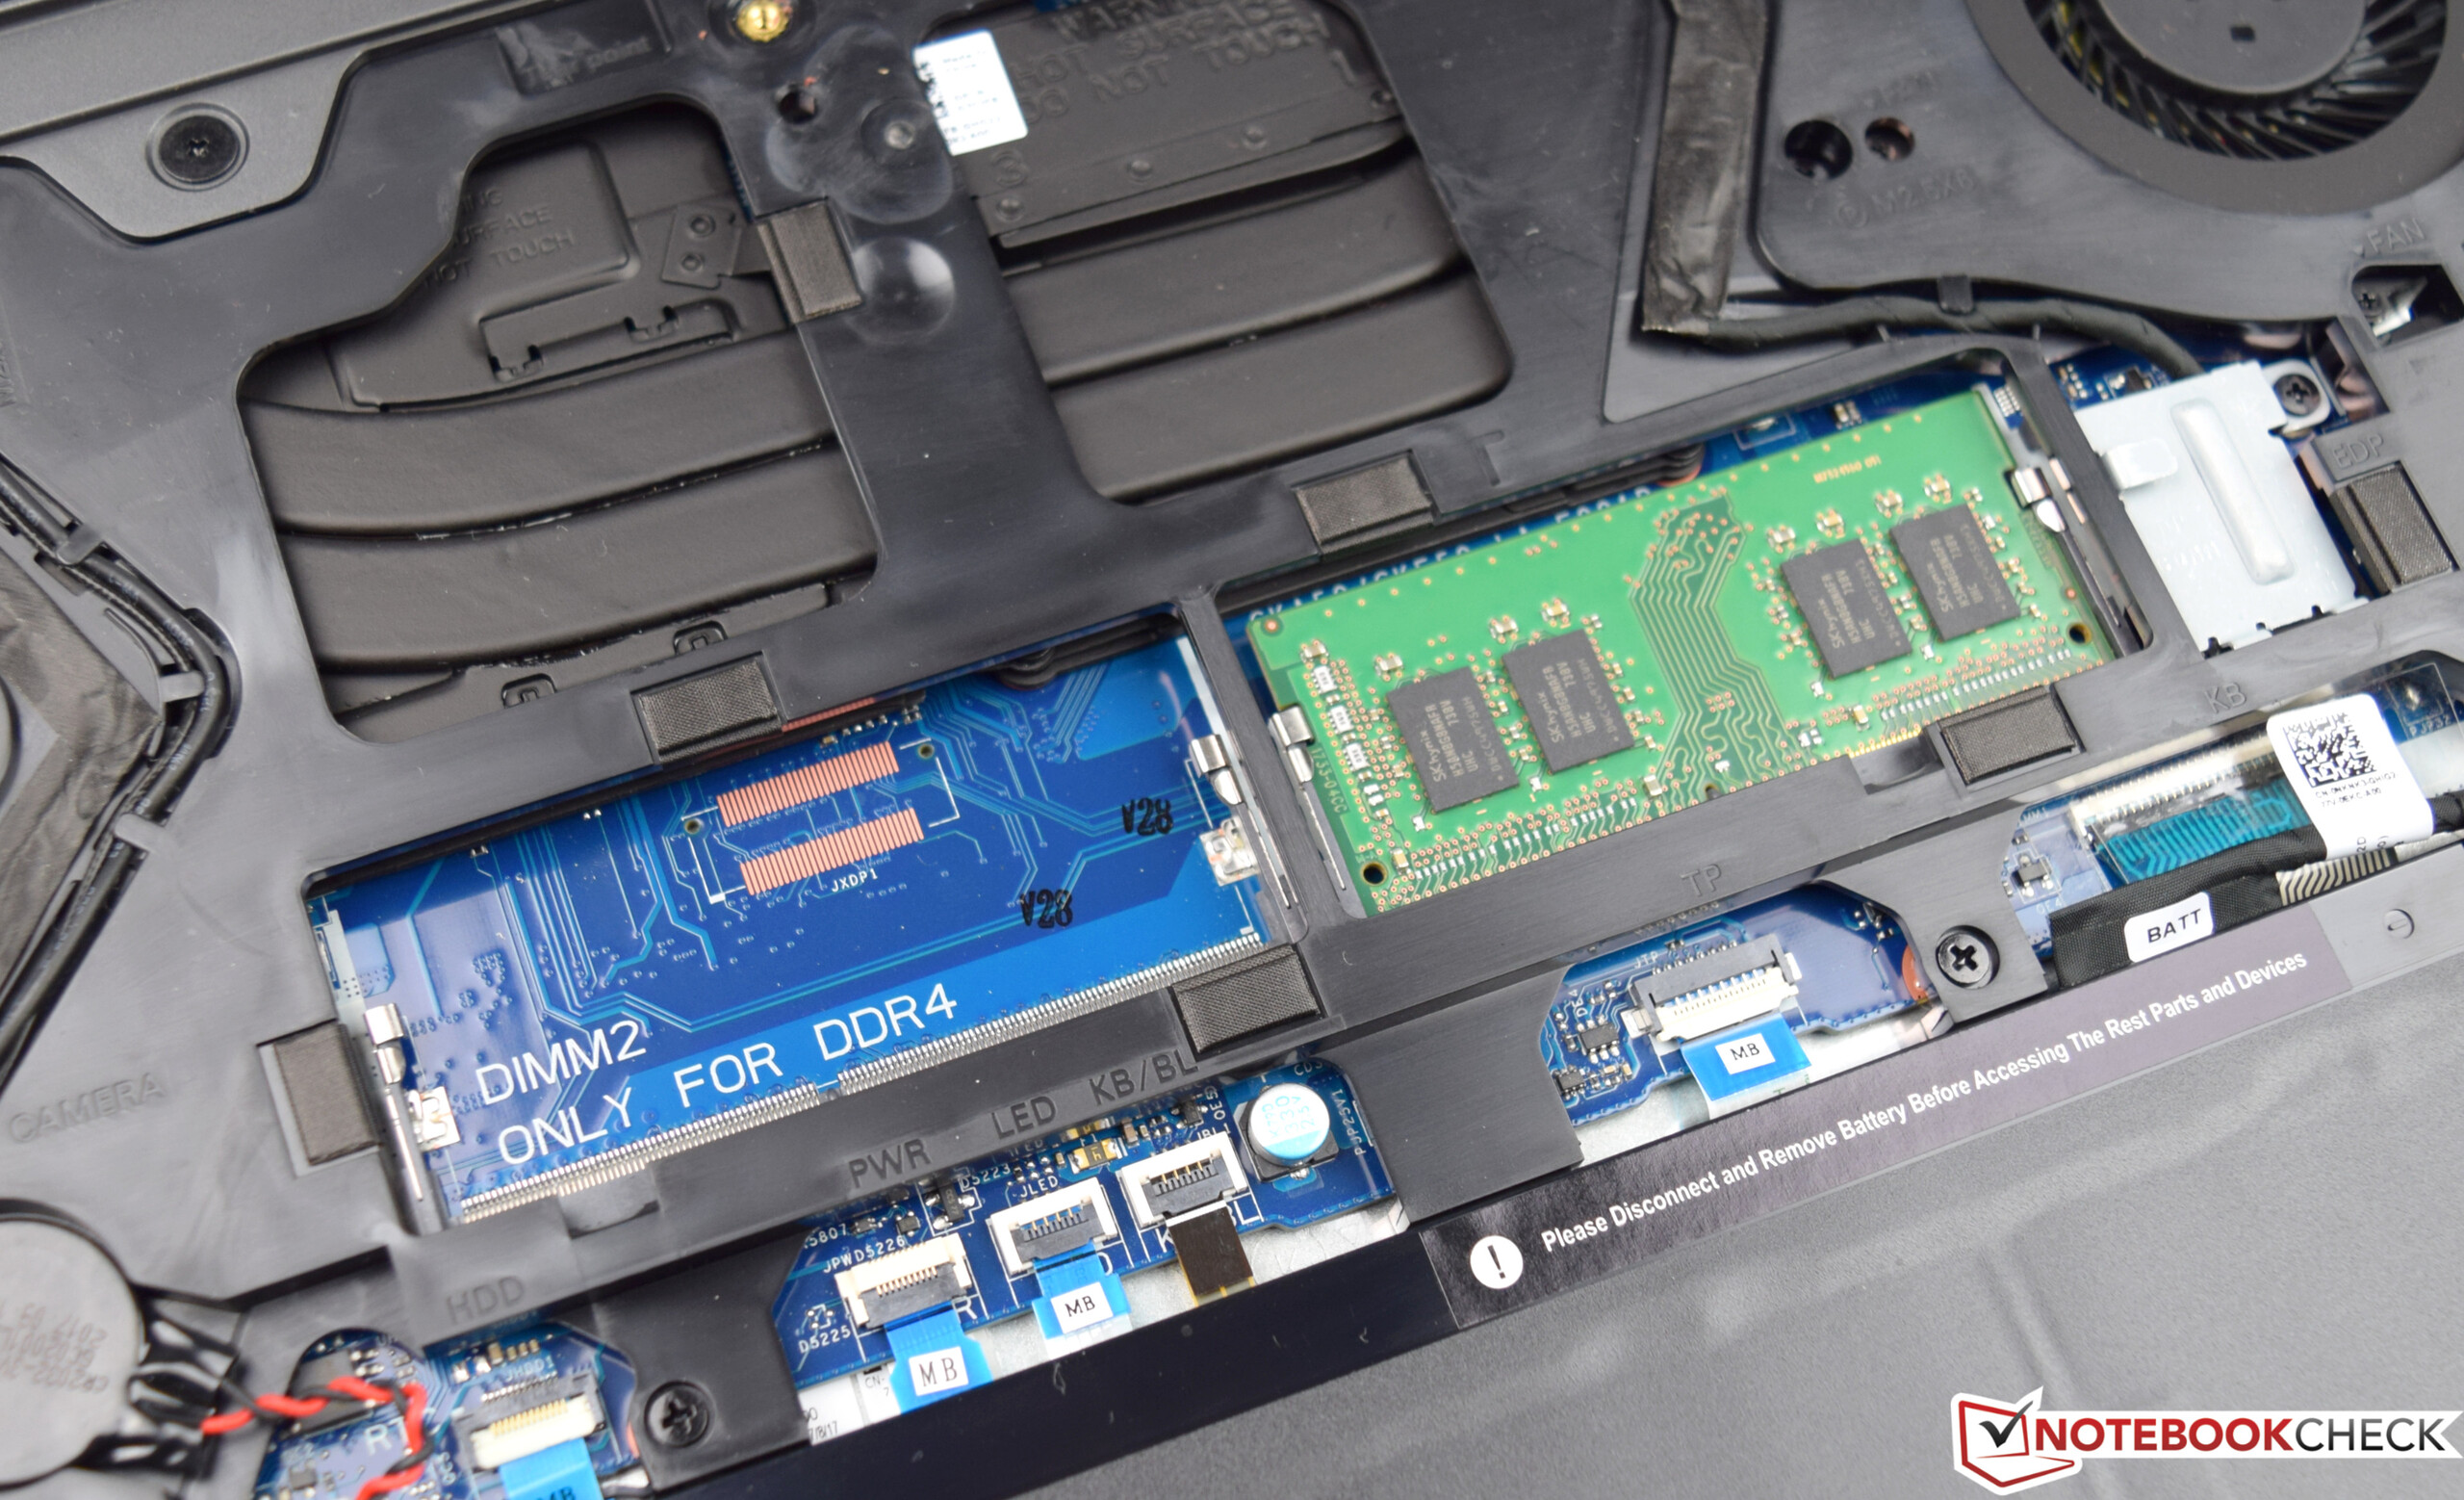
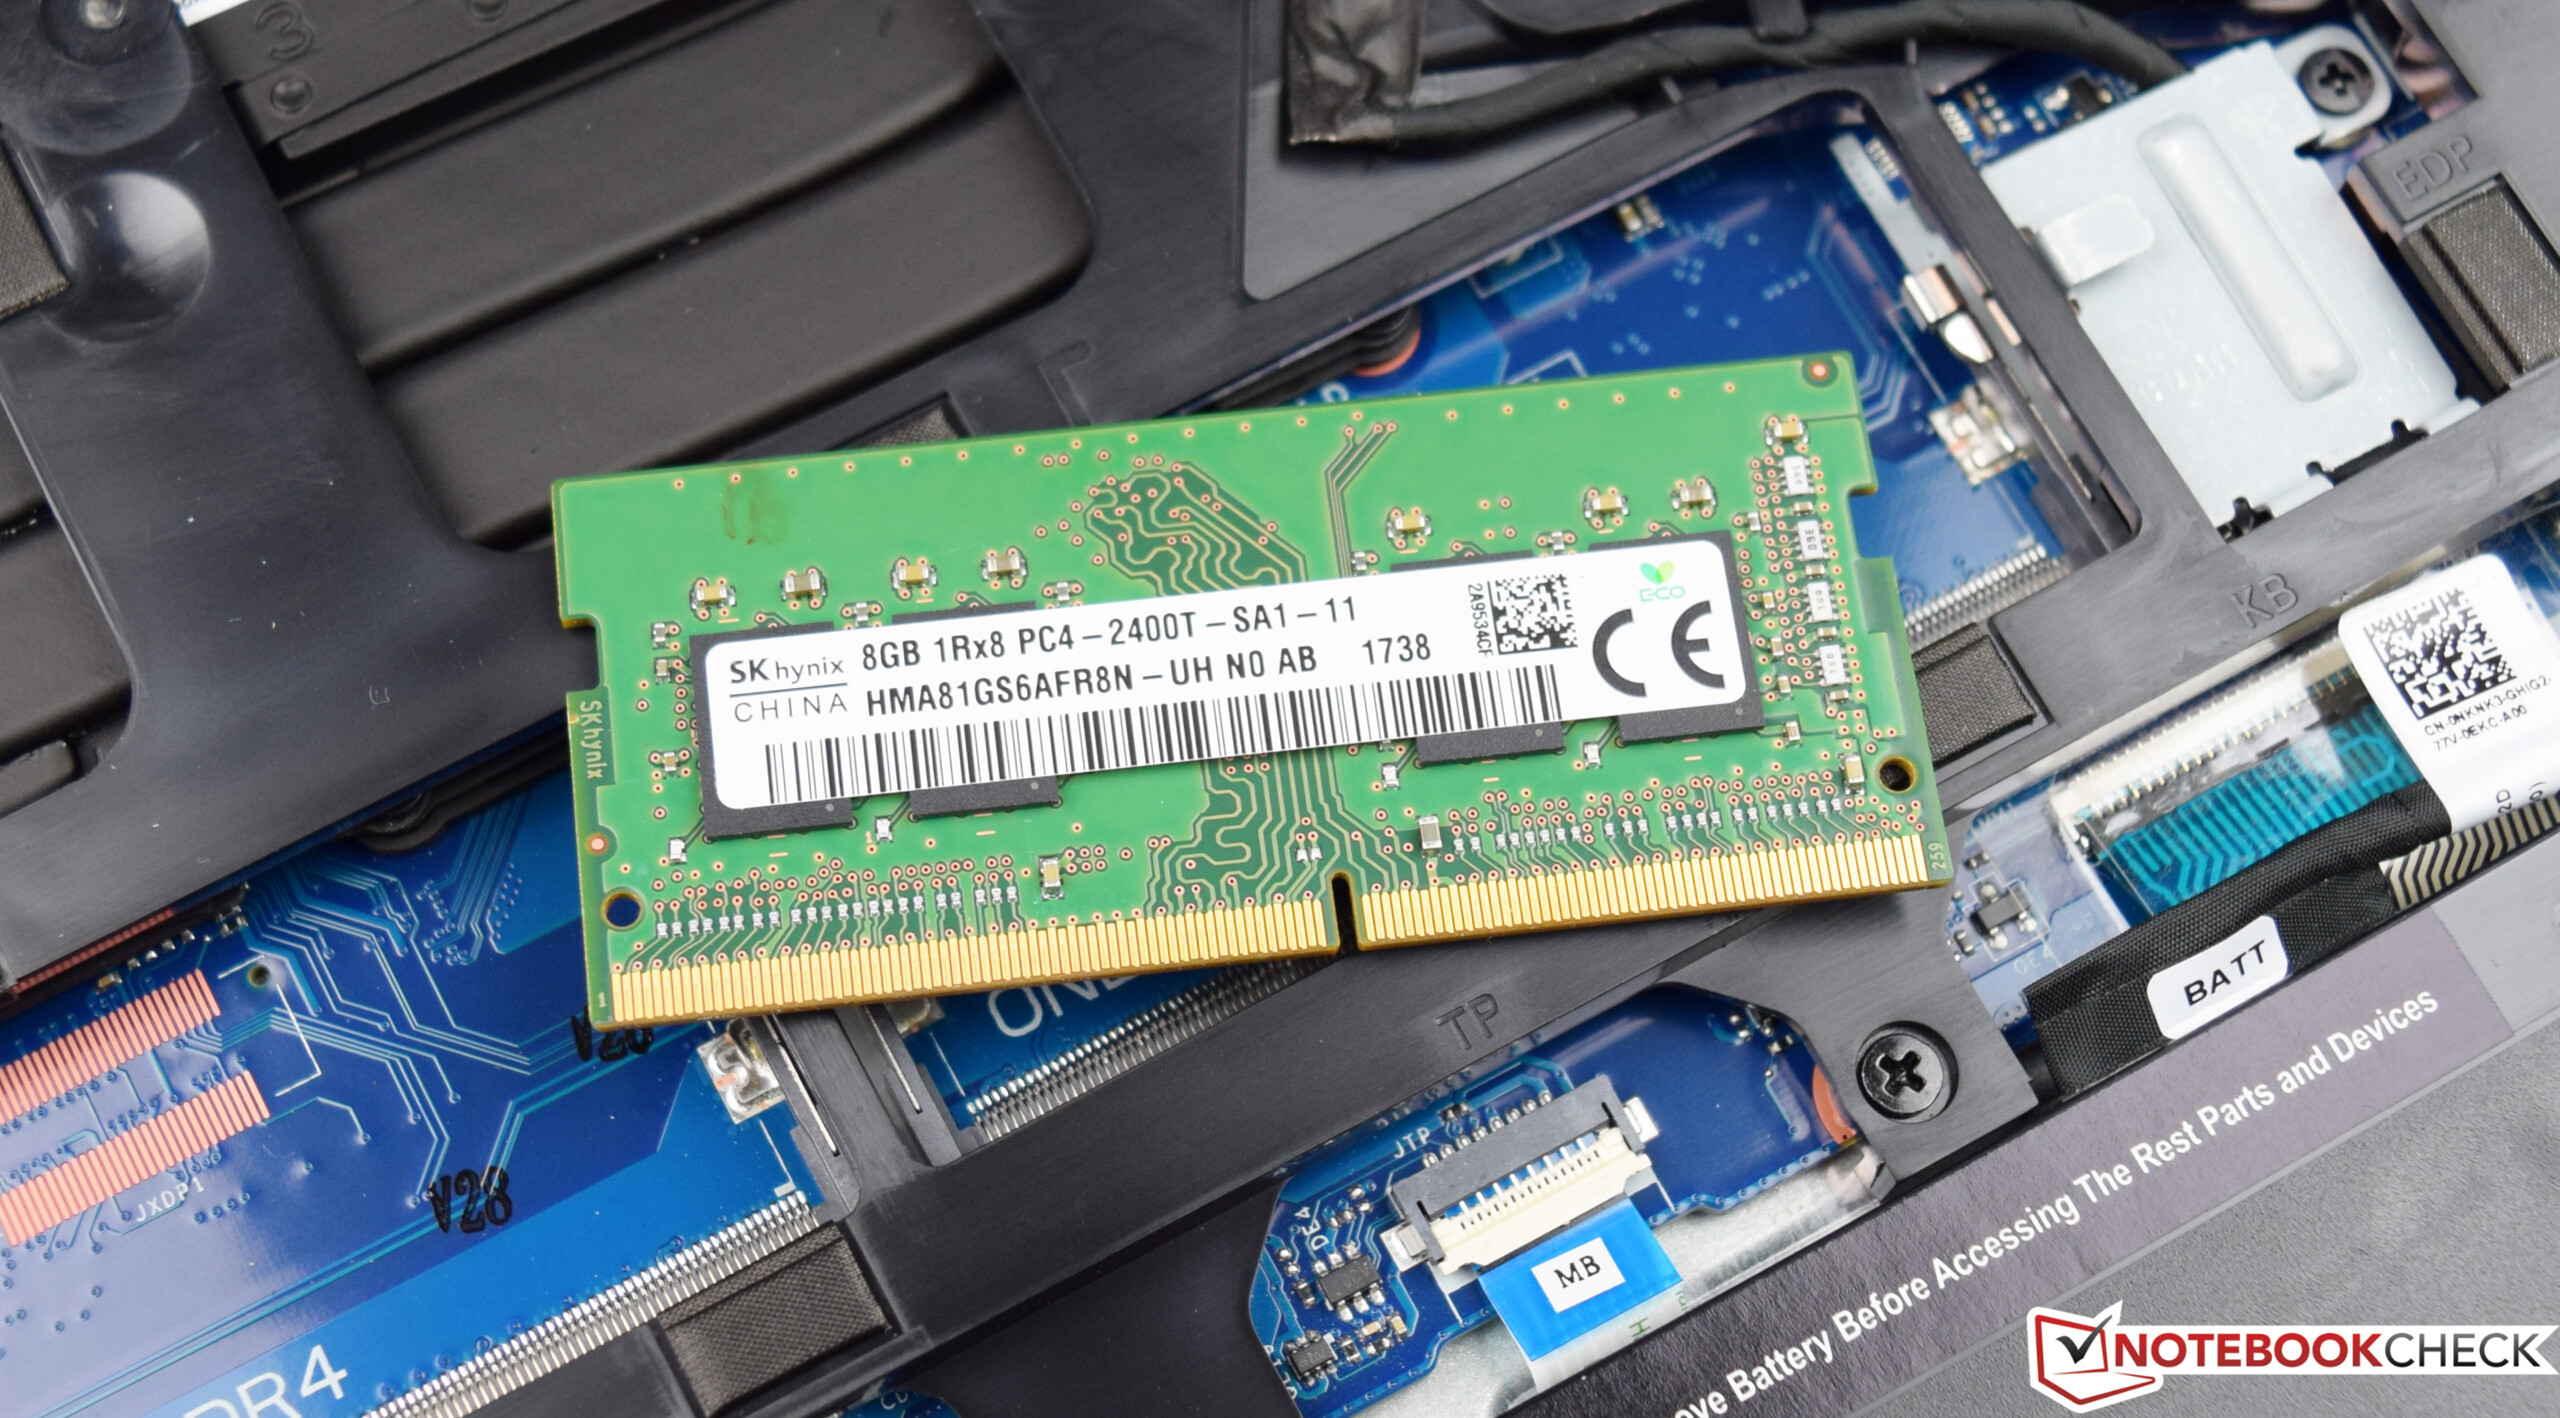
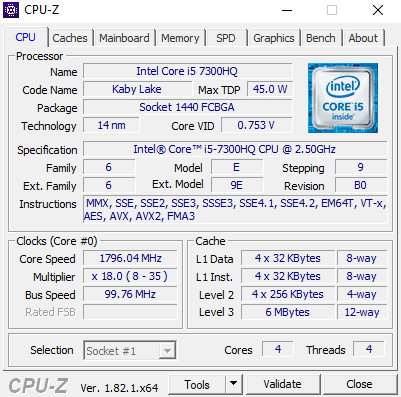
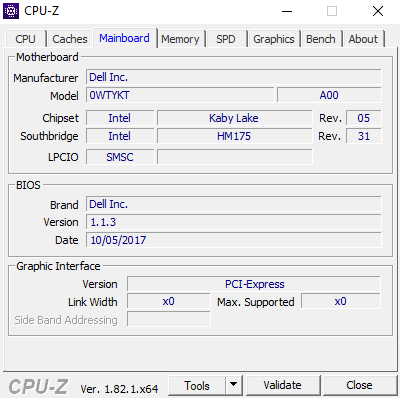
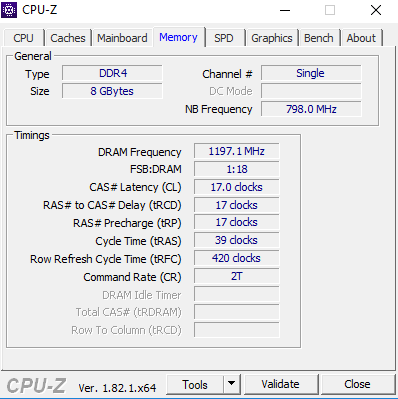
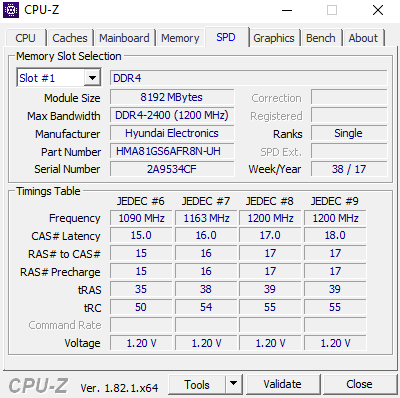
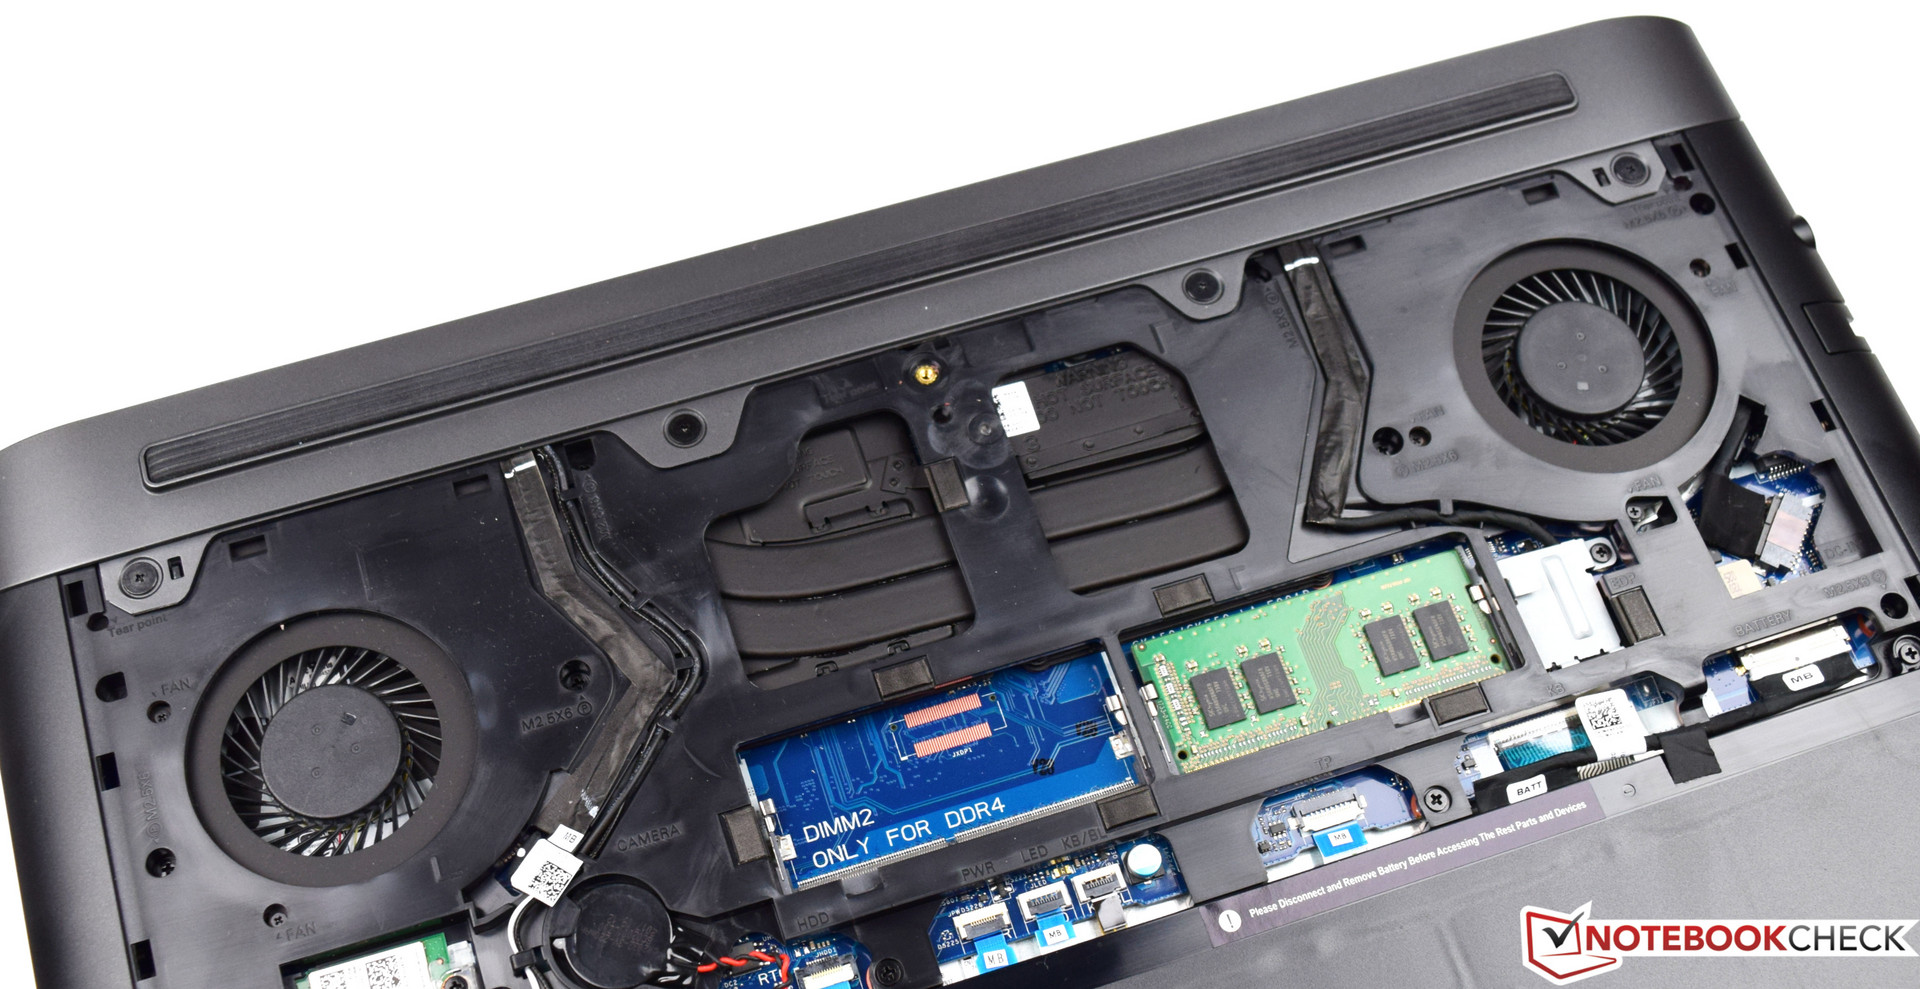
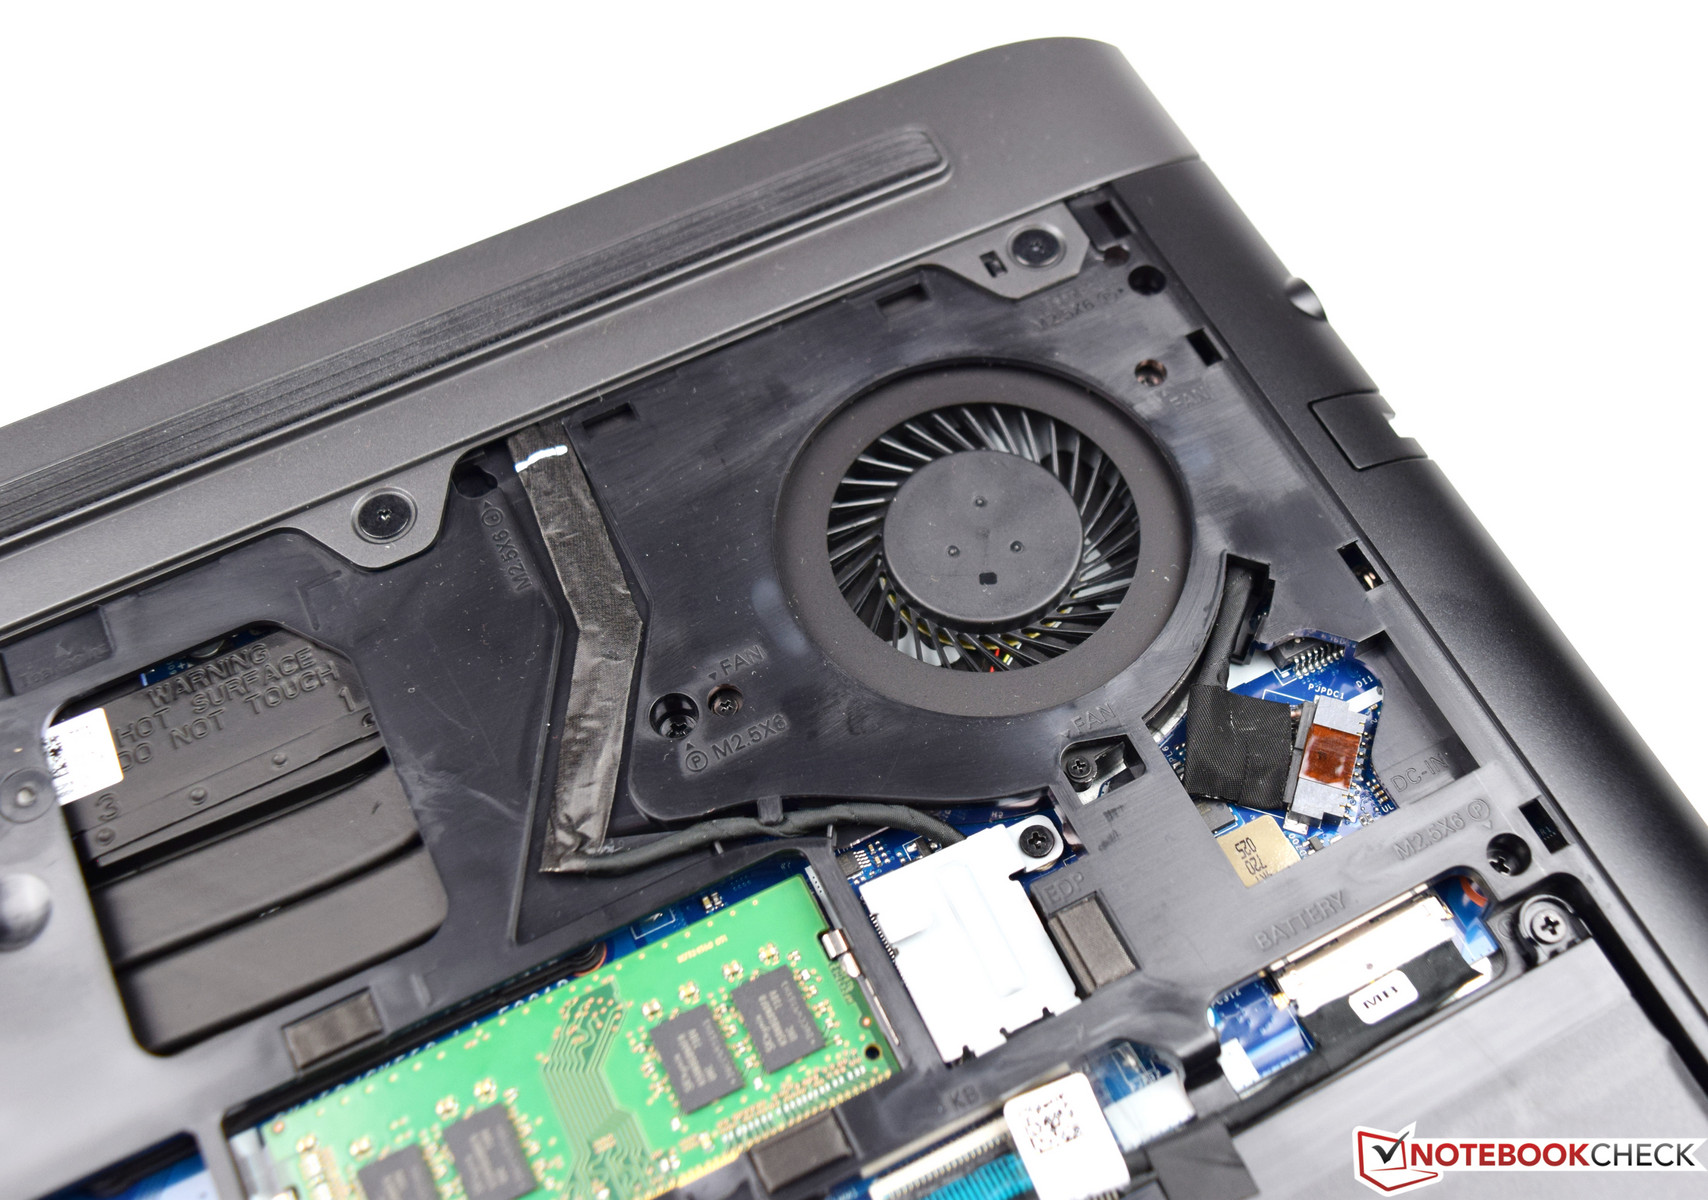
A Dell fez muitas escolhas boas com o Inspiron 15 7000 7577 e combina adequação para jogos com uma bateria duradoura. O dispositivo é feito de componentes bem conhecidos, como o Intel Core i5-7300HQ, que ainda tem alguma vida nele. Os 8 GB de RAM DDR4 são suficientes e a expansão da memória é muito fácil. A carcaça estável e simples nos deu uma boa impressão geral, assim como fez o desempenho do Nvidia GeForce GTX 1050. Por $750, os potenciais compradores receberão um portátil de jogos que pode exibir os jogos novos sem problemas. Gostaríamos de destacar as longas durações da bateria, que muitas vezes faltam em portáteis de jogos.
A Dell apresentou um portátil de jogos acessível - o Inspiron 15 7000 7577. Mas o dispositivo de armazenamento híbrido não pode substituir as vantagens de um SSD.
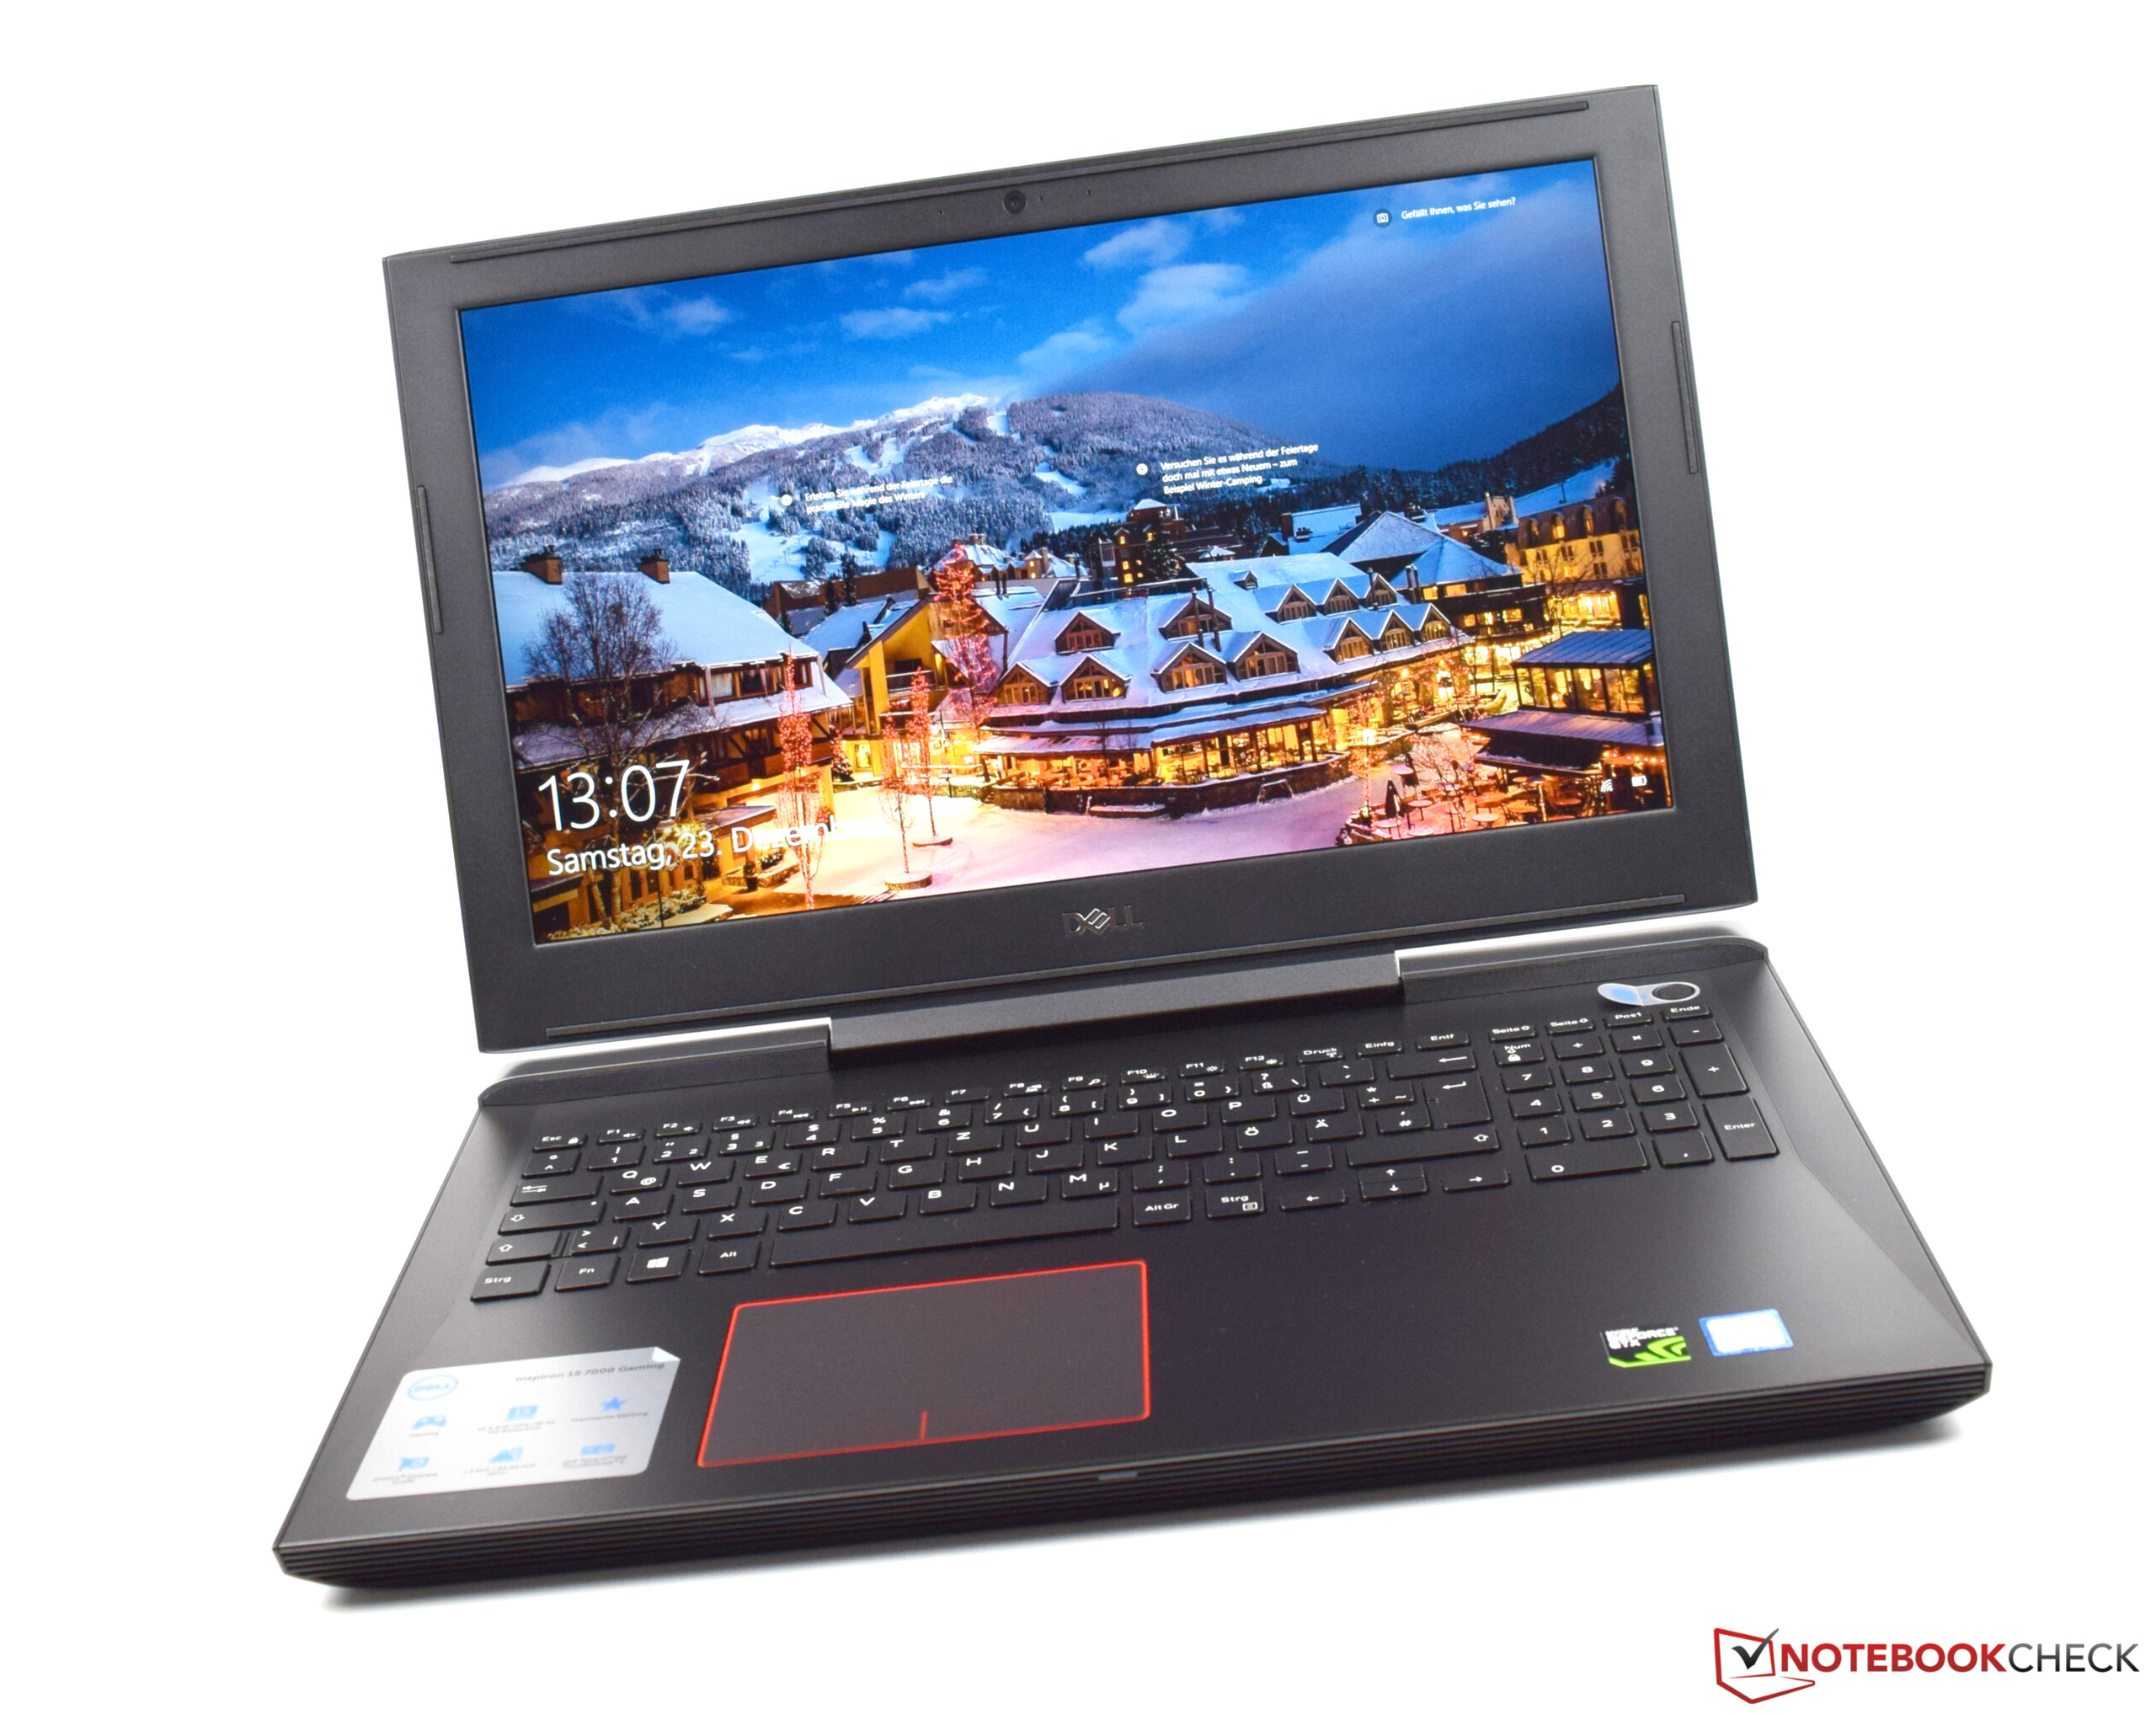
Devemos reduzir alguns pontos pela ausência do SSD. O dispositivo de armazenamento híbrido faz um bom trabalho, mas mesmo as atividades cotidianas podem exigir alguma espera, o que pode ser irritante. Se você está realmente interessado em comprar este dispositivo, você deve procurar uma combinação de SSD e HD. A tela também nos deu impressões misturadas. Graças à tecnologia IPS, impressionou com ótimos ângulos de visão muito bons. No entanto, a baixa cobertura de espaço de cores e o brilho da tela custaram ao dispositivo alguns pontos.
Dell Inspiron 15 7000 7577
- 01/02/2018 v6 (old)
Sebastian Bade
Price comparison
