Breve Análise do Portátil Dell Vostro 15 5568 (i7-7500U, 940MX)
| SD Card Reader | |
| average JPG Copy Test (av. of 3 runs) | |
| HP Spectre x360 15-bl002xx (Toshiba Exceria Pro SDXC 64 GB UHS-II) | |
| Acer TravelMate P658-G2-MG-7327 (Toshiba Exceria Pro SDXC 64 GB UHS-II) | |
| Lenovo ThinkPad T570-20HAS01E00 (Toshiba Exceria Pro SDXC 64 GB UHS-II) | |
| Dell Vostro 15-5568 (Toshiba Exceria Pro SDXC 64 GB UHS-II) | |
| Dell Vostro 15-5568 (Toshiba Exceria Pro SDXC 64 GB UHS-II) | |
| maximum AS SSD Seq Read Test (1GB) | |
| HP Spectre x360 15-bl002xx (Toshiba Exceria Pro SDXC 64 GB UHS-II) | |
| Lenovo ThinkPad T570-20HAS01E00 (Toshiba Exceria Pro SDXC 64 GB UHS-II) | |
| Acer TravelMate P658-G2-MG-7327 (Toshiba Exceria Pro SDXC 64 GB UHS-II) | |
| Dell Vostro 15-5568 (Toshiba Exceria Pro SDXC 64 GB UHS-II) | |
| Dell Vostro 15-5568 (Toshiba Exceria Pro SDXC 64 GB UHS-II) | |
| Networking | |
| iperf3 transmit AX12 | |
| Huawei MateBook D 15, i7-7500U 940MX | |
| HP Spectre x360 15-bl002xx | |
| Lenovo ThinkPad T570-20HAS01E00 | |
| Dell Vostro 15-5568 | |
| Dell Vostro 15-5568 | |
| Acer TravelMate P658-G2-MG-7327 | |
| iperf3 receive AX12 | |
| Huawei MateBook D 15, i7-7500U 940MX | |
| Lenovo ThinkPad T570-20HAS01E00 | |
| HP Spectre x360 15-bl002xx | |
| Acer TravelMate P658-G2-MG-7327 | |
| Dell Vostro 15-5568 | |
| Dell Vostro 15-5568 | |
| |||||||||||||||||||||||||
iluminação: 86 %
iluminação com acumulador: 242 cd/m²
Contraste: 556:1 (Preto: 0.43 cd/m²)
ΔE ColorChecker Calman: 10.11 | ∀{0.5-29.43 Ø4.71}
ΔE Greyscale Calman: 10.88 | ∀{0.09-98 Ø4.96}
60% sRGB (Argyll 1.6.3 3D)
38% AdobeRGB 1998 (Argyll 1.6.3 3D)
41.5% AdobeRGB 1998 (Argyll 3D)
60% sRGB (Argyll 3D)
40.14% Display P3 (Argyll 3D)
Gamma: 2.33
CCT: 11924 K
| Dell Vostro 15-5568 Chi Mei CMN15C4, , 1920x1080, 15.6" | HP Spectre x360 15-bl002xx UHD UWVA eDP BrightView WLED-backlit , , 3840x2160, 15.6" | Acer TravelMate P658-G2-MG-7327 LG Philips LP156WF6-SPP1, , 1920x1080, 15.6" | Huawei MateBook D 15, i7-7500U 940MX BOE070C, , 1920x1080, 15.6" | Lenovo ThinkPad T570-20HAS01E00 BOE NV156QUM-N44, , 3840x2160, 15.6" | Dell Vostro 15-5568 Chi Mei CMN154C-8KV42 , , 1920x1080, 15.6" | |
|---|---|---|---|---|---|---|
| Display | 57% | 52% | 3% | 62% | ||
| Display P3 Coverage (%) | 40.14 | 67.9 69% | 64.9 62% | 41.79 4% | 70 74% | |
| sRGB Coverage (%) | 60 | 88.2 47% | 85.9 43% | 61.5 2% | 91.1 52% | |
| AdobeRGB 1998 Coverage (%) | 41.5 | 64.4 55% | 62.8 51% | 43.17 4% | 66.7 61% | |
| Response Times | -83% | -40% | -79% | -1% | -49% | |
| Response Time Grey 50% / Grey 80% * (ms) | 41 ? | 44 ? -7% | 38 ? 7% | 46.4 ? -13% | 41.6 ? -1% | 47.6 ? -16% |
| Response Time Black / White * (ms) | 15 ? | 38.8 ? -159% | 28 ? -87% | 36.8 ? -145% | 15.2 ? -1% | 27.2 ? -81% |
| PWM Frequency (Hz) | 26000 ? | 1000 ? | 21000 ? | 21190 | 926 ? | |
| Screen | 63% | 40% | 13% | 45% | -6% | |
| Brightness middle (cd/m²) | 239 | 351.5 47% | 284 19% | 268 12% | 339 42% | 229 -4% |
| Brightness (cd/m²) | 219 | 336 53% | 276 26% | 258 18% | 314 43% | 222 1% |
| Brightness Distribution (%) | 86 | 83 -3% | 82 -5% | 92 7% | 89 3% | 82 -5% |
| Black Level * (cd/m²) | 0.43 | 0.24 44% | 0.295 31% | 0.47 -9% | 0.36 16% | 0.56 -30% |
| Contrast (:1) | 556 | 1465 163% | 963 73% | 570 3% | 942 69% | 409 -26% |
| Colorchecker dE 2000 * | 10.11 | 3.3 67% | 4.07 60% | 5.7 44% | 4.2 58% | 10.36 -2% |
| Colorchecker dE 2000 max. * | 17.33 | 7.3 58% | 10.52 39% | 21.7 -25% | 7.8 55% | 14.95 14% |
| Greyscale dE 2000 * | 10.88 | 1.9 83% | 3.13 71% | 4.2 61% | 5.1 53% | 10.9 -0% |
| Gamma | 2.33 94% | 2.09 105% | 2.41 91% | 2.3 96% | 2.16 102% | 2.21 100% |
| CCT | 11924 55% | 6784 96% | 7082 92% | 6820 95% | 6569 99% | 10084 64% |
| Color Space (Percent of AdobeRGB 1998) (%) | 38 | 64.4 69% | 56 47% | 43.2 14% | 59.4 56% | 37.69 -1% |
| Color Space (Percent of sRGB) (%) | 60 | 88.2 47% | 86 43% | 61.5 2% | 91 52% | 57.92 -3% |
| Média Total (Programa/Configurações) | 12% /
42% | 17% /
32% | -21% /
-1% | 35% /
42% | -28% /
-13% |
* ... menor é melhor
Exibir tempos de resposta
| ↔ Tempo de resposta preto para branco | ||
|---|---|---|
| 15 ms ... ascensão ↗ e queda ↘ combinadas | ↗ 11 ms ascensão | 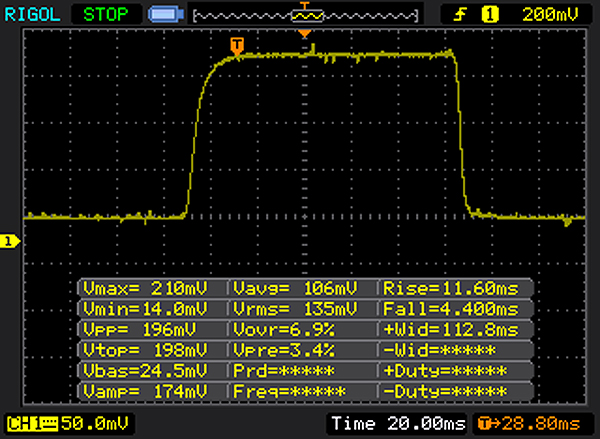 |
| ↘ 4 ms queda | ||
| A tela mostra boas taxas de resposta em nossos testes, mas pode ser muito lenta para jogadores competitivos. Em comparação, todos os dispositivos testados variam de 0.1 (mínimo) a 240 (máximo) ms. » 36 % de todos os dispositivos são melhores. Isso significa que o tempo de resposta medido é melhor que a média de todos os dispositivos testados (19.8 ms). | ||
| ↔ Tempo de resposta 50% cinza a 80% cinza | ||
| 41 ms ... ascensão ↗ e queda ↘ combinadas | ↗ 24 ms ascensão | 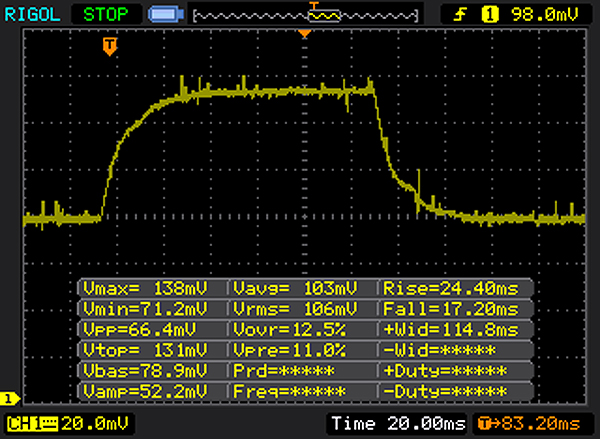 |
| ↘ 17 ms queda | ||
| A tela mostra taxas de resposta lentas em nossos testes e será insatisfatória para os jogadores. Em comparação, todos os dispositivos testados variam de 0.165 (mínimo) a 636 (máximo) ms. » 65 % de todos os dispositivos são melhores. Isso significa que o tempo de resposta medido é pior que a média de todos os dispositivos testados (31 ms). | ||
Cintilação da tela / PWM (modulação por largura de pulso)
| Tela tremeluzindo/PWM detectado | 26000 Hz | ≤ 20 % configuração de brilho | 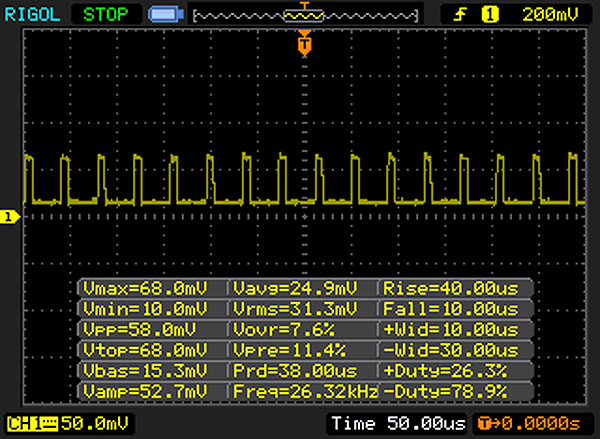 |
A luz de fundo da tela pisca em 26000 Hz (pior caso, por exemplo, utilizando PWM) Cintilação detectada em uma configuração de brilho de 20 % e abaixo. Não deve haver cintilação ou PWM acima desta configuração de brilho. A frequência de 26000 Hz é bastante alta, então a maioria dos usuários sensíveis ao PWM não deve notar nenhuma oscilação. [pwm_comparison] Em comparação: 52 % de todos os dispositivos testados não usam PWM para escurecer a tela. Se PWM foi detectado, uma média de 7754 (mínimo: 5 - máximo: 343500) Hz foi medida. | |||
| Cinebench R15 | |
| CPU Single 64Bit | |
| Huawei MateBook D 15, i7-7500U 940MX | |
| Acer TravelMate P658-G2-MG-7327 | |
| Dell Vostro 15-5568 | |
| HP Spectre x360 15-bl002xx | |
| Lenovo ThinkPad T570-20HAS01E00 | |
| Dell Vostro 15-5568 | |
| CPU Multi 64Bit | |
| Acer TravelMate P658-G2-MG-7327 | |
| Lenovo ThinkPad T570-20HAS01E00 | |
| Huawei MateBook D 15, i7-7500U 940MX | |
| Dell Vostro 15-5568 | |
| HP Spectre x360 15-bl002xx | |
| Dell Vostro 15-5568 | |
| PCMark 8 | |
| Home Score Accelerated v2 | |
| Acer TravelMate P658-G2-MG-7327 | |
| Huawei MateBook D 15, i7-7500U 940MX | |
| Dell Vostro 15-5568 | |
| Dell Vostro 15-5568 | |
| HP Spectre x360 15-bl002xx | |
| Lenovo ThinkPad T570-20HAS01E00 | |
| Work Score Accelerated v2 | |
| Acer TravelMate P658-G2-MG-7327 | |
| Huawei MateBook D 15, i7-7500U 940MX | |
| Dell Vostro 15-5568 | |
| Dell Vostro 15-5568 | |
| HP Spectre x360 15-bl002xx | |
| Lenovo ThinkPad T570-20HAS01E00 | |
| PCMark 8 Home Score Accelerated v2 | 3672 pontos | |
| PCMark 8 Work Score Accelerated v2 | 4821 pontos | |
Ajuda | ||
| Dell Vostro 15-5568 Micron SSD 1100 (MTFDDAV256TBN) | HP Spectre x360 15-bl002xx Toshiba XG4 NVMe (THNSN5512GPUK) | Acer TravelMate P658-G2-MG-7327 Liteonit CV3-8D512 | Huawei MateBook D 15, i7-7500U 940MX SanDisk SD8SN8U128G1027 | Lenovo ThinkPad T570-20HAS01E00 Samsung PM961 NVMe MZVLW512HMJP | Dell Vostro 15-5568 SanDisk X400 256GB, SATA (SD8SB8U-256G) | |
|---|---|---|---|---|---|---|
| CrystalDiskMark 3.0 | 184% | 24% | 24% | 222% | 44% | |
| Read Seq (MB/s) | 476.2 | 1266 166% | 526 10% | 478.4 0% | 1210 154% | 497.8 5% |
| Write Seq (MB/s) | 238.7 | 982 311% | 256.9 8% | 314.9 32% | 1134 375% | 466.8 96% |
| Read 512 (MB/s) | 312.9 | 834 167% | 227.1 -27% | 331.2 6% | 789 152% | 363.4 16% |
| Write 512 (MB/s) | 161.7 | 714 342% | 246.3 52% | 181.4 12% | 903 458% | 368.5 128% |
| Read 4k (MB/s) | 21.87 | 40.72 86% | 25.74 18% | 36.84 68% | 58.4 167% | 29.02 33% |
| Write 4k (MB/s) | 93.6 | 139.4 49% | 68.8 -26% | 82.7 -12% | 144.1 54% | 56 -40% |
| Read 4k QD32 (MB/s) | 172.8 | 527 205% | 354.8 105% | 368.5 113% | 559 223% | 296 71% |
| Write 4k QD32 (MB/s) | 161.2 | 395.2 145% | 248.8 54% | 123.2 -24% | 474.4 194% | 229.4 42% |

| 3DMark 11 - 1280x720 Performance GPU | |
| Huawei MateBook D 15, i7-7500U 940MX | |
| Lenovo ThinkPad T570-20HAS01E00 | |
| Dell Vostro 15-5568 | |
| HP Spectre x360 15-bl002xx | |
| Acer TravelMate P658-G2-MG-7327 | |
| Dell Vostro 15-5568 | |
| 3DMark | |
| 1280x720 Cloud Gate Standard Graphics | |
| Huawei MateBook D 15, i7-7500U 940MX | |
| Lenovo ThinkPad T570-20HAS01E00 | |
| HP Spectre x360 15-bl002xx | |
| Dell Vostro 15-5568 | |
| Dell Vostro 15-5568 | |
| 1920x1080 Fire Strike Graphics | |
| Huawei MateBook D 15, i7-7500U 940MX | |
| Lenovo ThinkPad T570-20HAS01E00 | |
| HP Spectre x360 15-bl002xx | |
| Dell Vostro 15-5568 | |
| Dell Vostro 15-5568 | |
| 3DMark 11 Performance | 2769 pontos | |
| 3DMark Cloud Gate Standard Score | 8208 pontos | |
| 3DMark Fire Strike Score | 1905 pontos | |
Ajuda | ||
| BioShock Infinite | |
| 1920x1080 Ultra Preset, DX11 (DDOF) | |
| Huawei MateBook D 15, i7-7500U 940MX | |
| HP Spectre x360 15-bl002xx | |
| Lenovo ThinkPad T570-20HAS01E00 | |
| Dell Vostro 15-5568 | |
| Acer TravelMate P658-G2-MG-7327 | |
| Dell Vostro 15-5568 | |
| 1366x768 High Preset | |
| Lenovo ThinkPad T570-20HAS01E00 | |
| HP Spectre x360 15-bl002xx | |
| Huawei MateBook D 15, i7-7500U 940MX | |
| Dell Vostro 15-5568 | |
| Acer TravelMate P658-G2-MG-7327 | |
| Dell Vostro 15-5568 | |
| 1366x768 Medium Preset | |
| Lenovo ThinkPad T570-20HAS01E00 | |
| HP Spectre x360 15-bl002xx | |
| Huawei MateBook D 15, i7-7500U 940MX | |
| Dell Vostro 15-5568 | |
| Acer TravelMate P658-G2-MG-7327 | |
| Dell Vostro 15-5568 | |
| 1280x720 Very Low Preset | |
| Lenovo ThinkPad T570-20HAS01E00 | |
| HP Spectre x360 15-bl002xx | |
| Dell Vostro 15-5568 | |
| Huawei MateBook D 15, i7-7500U 940MX | |
| Acer TravelMate P658-G2-MG-7327 | |
| Dell Vostro 15-5568 | |
| baixo | média | alto | ultra | |
|---|---|---|---|---|
| BioShock Infinite (2013) | 112.1 | 61.9 | 52.4 | 20.29 |
| Thief (2014) | 43.3 | 24.3 | 17.2 | 12.5 |
| Dragon Age: Inquisition (2014) | 61.8 | 42.1 | 9.6 |
Barulho
| Ocioso |
| 30.2 / 30.2 / 30.2 dB |
| Carga |
| 40.4 / 40.6 dB |
 | ||
30 dB silencioso 40 dB(A) audível 50 dB(A) ruidosamente alto |
||
min: | ||
(±) A temperatura máxima no lado superior é 43.5 °C / 110 F, em comparação com a média de 34.3 °C / 94 F , variando de 21.2 a 62.5 °C para a classe Office.
(-) A parte inferior aquece até um máximo de 56.2 °C / 133 F, em comparação com a média de 36.8 °C / 98 F
(+) Em uso inativo, a temperatura média para o lado superior é 25.2 °C / 77 F, em comparação com a média do dispositivo de 29.5 °C / ### class_avg_f### F.
(+) Os apoios para as mãos e o touchpad são mais frios que a temperatura da pele, com um máximo de 28.4 °C / 83.1 F e, portanto, são frios ao toque.
(±) A temperatura média da área do apoio para as mãos de dispositivos semelhantes foi 27.5 °C / 81.5 F (-0.9 °C / -1.6 F).
Dell Vostro 15-5568 análise de áudio
(-) | alto-falantes não muito altos (###valor### dB)
Graves 100 - 315Hz
(-) | quase nenhum baixo - em média 19.3% menor que a mediana
(±) | a linearidade dos graves é média (12.6% delta para a frequência anterior)
Médios 400 - 2.000 Hz
(±) | médios mais altos - em média 7.9% maior que a mediana
(±) | a linearidade dos médios é média (8% delta para frequência anterior)
Altos 2 - 16 kHz
(+) | agudos equilibrados - apenas 2.2% longe da mediana
(±) | a linearidade dos máximos é média (7.5% delta para frequência anterior)
Geral 100 - 16.000 Hz
(±) | a linearidade do som geral é média (26.8% diferença em relação à mediana)
Comparado com a mesma classe
» 82% de todos os dispositivos testados nesta classe foram melhores, 6% semelhantes, 11% piores
» O melhor teve um delta de 7%, a média foi 21%, o pior foi 53%
Comparado com todos os dispositivos testados
» 82% de todos os dispositivos testados foram melhores, 4% semelhantes, 14% piores
» O melhor teve um delta de 4%, a média foi 23%, o pior foi 134%
Apple MacBook 12 (Early 2016) 1.1 GHz análise de áudio
(+) | os alto-falantes podem tocar relativamente alto (###valor### dB)
Graves 100 - 315Hz
(±) | graves reduzidos - em média 11.3% menor que a mediana
(±) | a linearidade dos graves é média (14.2% delta para a frequência anterior)
Médios 400 - 2.000 Hz
(+) | médios equilibrados - apenas 2.4% longe da mediana
(+) | médios são lineares (5.5% delta para frequência anterior)
Altos 2 - 16 kHz
(+) | agudos equilibrados - apenas 2% longe da mediana
(+) | os máximos são lineares (4.5% delta da frequência anterior)
Geral 100 - 16.000 Hz
(+) | o som geral é linear (10.2% diferença em relação à mediana)
Comparado com a mesma classe
» 7% de todos os dispositivos testados nesta classe foram melhores, 2% semelhantes, 90% piores
» O melhor teve um delta de 5%, a média foi 18%, o pior foi 53%
Comparado com todos os dispositivos testados
» 5% de todos os dispositivos testados foram melhores, 1% semelhantes, 94% piores
» O melhor teve um delta de 4%, a média foi 23%, o pior foi 134%
| desligado | |
| Ocioso | |
| Carga |
|
Key:
min: | |
| Dell Vostro 15-5568 i7-7500U, GeForce 940MX, Micron SSD 1100 (MTFDDAV256TBN), TN LED, 1920x1080, 15.6" | HP Spectre x360 15-bl002xx i7-7500U, GeForce 940MX, Toshiba XG4 NVMe (THNSN5512GPUK), IPS, 3840x2160, 15.6" | Acer TravelMate P658-G2-MG-7327 i7-7500U, GeForce 940MX, Liteonit CV3-8D512, IPS, 1920x1080, 15.6" | Huawei MateBook D 15, i7-7500U 940MX i7-7500U, GeForce 940MX, SanDisk SD8SN8U128G1027, IPS, 1920x1080, 15.6" | Lenovo ThinkPad T570-20HAS01E00 i7-7500U, GeForce 940MX, Samsung PM961 NVMe MZVLW512HMJP, IPS, 3840x2160, 15.6" | Dell Vostro 15-5568 i5-7200U, HD Graphics 620, SanDisk X400 256GB, SATA (SD8SB8U-256G), TN LED, 1920x1080, 15.6" | |
|---|---|---|---|---|---|---|
| Power Consumption | -73% | -28% | -27% | -48% | 5% | |
| Idle Minimum * (Watt) | 3.1 | 8.14 -163% | 3.9 -26% | 5.14 -66% | 4.7 -52% | 3.3 -6% |
| Idle Average * (Watt) | 6.3 | 10.91 -73% | 7.9 -25% | 9.07 -44% | 9.9 -57% | 6.8 -8% |
| Idle Maximum * (Watt) | 6.5 | 12.26 -89% | 11.3 -74% | 9.33 -44% | 10.9 -68% | 7.7 -18% |
| Load Average * (Watt) | 46 | 45.67 1% | 47 -2% | 46.76 -2% | 56.1 -22% | 30.9 33% |
| Load Maximum * (Watt) | 54 | 74.94 -39% | 62 -15% | 42.59 21% | 75 -39% | 40.3 25% |
| Witcher 3 ultra * (Watt) | 40.18 |
* ... menor é melhor
| Dell Vostro 15-5568 i7-7500U, GeForce 940MX, 42 Wh | HP Spectre x360 15-bl002xx i7-7500U, GeForce 940MX, 79.2 Wh | Acer TravelMate P658-G2-MG-7327 i7-7500U, GeForce 940MX, 55 Wh | Huawei MateBook D 15, i7-7500U 940MX i7-7500U, GeForce 940MX, 43.3 Wh | Lenovo ThinkPad T570-20HAS01E00 i7-7500U, GeForce 940MX, 56 Wh | Dell Vostro 15-5568 i5-7200U, HD Graphics 620, 42 Wh | |
|---|---|---|---|---|---|---|
| Duração da bateria | 69% | 95% | 38% | 61% | 35% | |
| Reader / Idle (h) | 13.3 | 14.4 8% | 15.9 20% | 13.3 0% | 16.9 27% | |
| WiFi v1.3 (h) | 4.3 | 8.9 107% | 8.4 95% | 7.4 72% | 6.9 60% | 6 40% |
| Load (h) | 1.3 | 2.5 92% | 1.6 23% | 2.9 123% | 1.8 38% | |
| H.264 (h) | 8.1 | 8.5 |
Pro
Contra
O Vostro 15 5568 ainda é um portátil empresarial econômico. O desempenho oferecido é apropriado para o baixo preço. O baixo desempenho de WLAN e o teclado ruim, em particular, podem desencorajar os clientes interessados. Se os recursos de segurança minimalistas devem ser tomados em consideração para a decisão de compra é algo que os potenciais compradores devem decidir por si mesmos.
Com o Vostro 15 5568, a Dell oferece um portátil empresarial visualmente agradável. A WLAN e os recursos de segurança apresentam algumas falhas.
Para os clientes interessados que procuram um portátil empresarial barato, o Vostro 15 5568 certamente ainda é adequado. O dispositivo pode rodar aplicativos de escritório padrão (apresentações, análise de planilhas e e-mails) sem problemas. No entanto, a tela ruim deve ser levada em consideração, especialmente para aplicativos 3D que exigem uma placa gráfica dedicada. Se os ângulos de visão oferecidos e a cobertura do espaço de cores forem suficientes, este portátil é uma opção de compra válida.
Dell Vostro 15-5568
- 12/04/2017 v6 (old)
Mike Wobker