Breve Análise do Portátil Dell XPS 13 9300 Core i7: O novo design do Chassi é mais emocionante que a nova CPU
Avaliação | Data | Modelo | Peso | Altura | Size | Resolução | Preço |
|---|---|---|---|---|---|---|---|
| 88.9 % v7 (old) | 03/2020 | Dell XPS 13 9300 Core i7-1065G7 i7-1065G7, Iris Plus Graphics G7 (Ice Lake 64 EU) | 1.2 kg | 14.8 mm | 13.40" | 1920x1200 | |
| 85.9 % v7 (old) | 11/2019 | Dell XPS 13 7390 Core i7-10710U i7-10710U, UHD Graphics 620 | 1.2 kg | 11.6 mm | 13.30" | 3840x2160 | |
| 86.3 % v7 (old) | 10/2019 | Dell XPS 13 7390 2-in-1 Core i7 i7-1065G7, Iris Plus Graphics G7 (Ice Lake 64 EU) | 1.3 kg | 13 mm | 13.40" | 1920x1200 | |
| 86.6 % v6 (old) | 05/2019 | Asus ZenBook S13 UX392FN i7-8565U, GeForce MX150 | 1.1 kg | 12.9 mm | 13.90" | 1920x1080 | |
| 84 % v7 (old) | 03/2020 | Microsoft Surface Laptop 3 13 Core i5-1035G7 i5-1035G7, Iris Plus Graphics G7 (Ice Lake 64 EU) | 1.3 kg | 14.5 mm | 13.50" | 2256x1504 |
| SD Card Reader | |
| average JPG Copy Test (av. of 3 runs) | |
| Dell XPS 13 7390 Core i7-10710U (Toshiba Exceria Pro M501 64 GB UHS-II) | |
| Dell XPS 13 9300 Core i7-1065G7 (Toshiba Exceria Pro M501 64 GB UHS-II) | |
| Dell XPS 13 7390 2-in-1 Core i7 (Toshiba Exceria Pro M501 64 GB UHS-II) | |
| Asus ZenBook S13 UX392FN (Toshiba Exceria Pro M501 64 GB UHS-II) | |
| maximum AS SSD Seq Read Test (1GB) | |
| Dell XPS 13 7390 Core i7-10710U (Toshiba Exceria Pro M501 64 GB UHS-II) | |
| Dell XPS 13 7390 2-in-1 Core i7 (Toshiba Exceria Pro M501 64 GB UHS-II) | |
| Dell XPS 13 9300 Core i7-1065G7 (Toshiba Exceria Pro M501 64 GB UHS-II) | |
| Asus ZenBook S13 UX392FN (Toshiba Exceria Pro M501 64 GB UHS-II) | |

| |||||||||||||||||||||||||
iluminação: 96 %
iluminação com acumulador: 607.6 cd/m²
Contraste: 1519:1 (Preto: 0.4 cd/m²)
ΔE ColorChecker Calman: 3.23 | ∀{0.5-29.43 Ø4.72}
calibrated: 1.01
ΔE Greyscale Calman: 5.5 | ∀{0.09-98 Ø4.97}
97.5% sRGB (Argyll 1.6.3 3D)
63% AdobeRGB 1998 (Argyll 1.6.3 3D)
68.5% AdobeRGB 1998 (Argyll 3D)
97.3% sRGB (Argyll 3D)
66.3% Display P3 (Argyll 3D)
Gamma: 2.12
CCT: 6413 K
| Dell XPS 13 9300 Core i7-1065G7 Sharp LQ134N1, IPS, 13.4", 1920x1200 | Dell XPS 13 7390 Core i7-10710U AU Optronics B133ZAN, Dell P/N: 90NTH, IPS, 13.3", 3840x2160 | Dell XPS 13 7390 2-in-1 Core i7 Sharp LQ134N1, IPS, 13.4", 1920x1200 | Huawei Matebook X Pro i5 Tianma XM, IPS, 13.9", 3000x2000 | Asus ZenBook S13 UX392FN Tianma XM, IPS, 13.9", 1920x1080 | Microsoft Surface Laptop 3 13 Core i5-1035G7 Sharp LQ135P1JX51, IPS, 13.5", 2256x1504 | |
|---|---|---|---|---|---|---|
| Display | -5% | 4% | -1% | 0% | -0% | |
| Display P3 Coverage (%) | 66.3 | 63.4 -4% | 69.9 5% | 65.9 -1% | 67.5 2% | 65.7 -1% |
| sRGB Coverage (%) | 97.3 | 93.7 -4% | 99.2 2% | 95.2 -2% | 95.8 -2% | 98.6 1% |
| AdobeRGB 1998 Coverage (%) | 68.5 | 64.3 -6% | 71.5 4% | 67.6 -1% | 69 1% | 67.8 -1% |
| Response Times | -2% | 9% | 21% | 16% | -22% | |
| Response Time Grey 50% / Grey 80% * (ms) | 50 ? | 51.6 ? -3% | 47.6 ? 5% | 40.4 ? 19% | 47.2 ? 6% | 59.2 ? -18% |
| Response Time Black / White * (ms) | 33.2 ? | 33.6 ? -1% | 29.2 ? 12% | 25.6 ? 23% | 24.8 ? 25% | 41.6 ? -25% |
| PWM Frequency (Hz) | 2500 ? | 2500 ? | 21740 ? | |||
| Screen | -30% | 7% | -8% | 2% | 13% | |
| Brightness middle (cd/m²) | 607.6 | 408.2 -33% | 549.8 -10% | 442.7 -27% | 466 -23% | 403.4 -34% |
| Brightness (cd/m²) | 595 | 399 -33% | 520 -13% | 428 -28% | 462 -22% | 397 -33% |
| Brightness Distribution (%) | 96 | 89 -7% | 86 -10% | 84 -12% | 90 -6% | 89 -7% |
| Black Level * (cd/m²) | 0.4 | 0.39 2% | 0.39 2% | 0.31 23% | 0.33 17% | 0.34 15% |
| Contrast (:1) | 1519 | 1047 -31% | 1410 -7% | 1428 -6% | 1412 -7% | 1186 -22% |
| Colorchecker dE 2000 * | 3.23 | 4.6 -42% | 2.12 34% | 2.24 31% | 1.93 40% | 0.94 71% |
| Colorchecker dE 2000 max. * | 8.67 | 11.84 -37% | 3.66 58% | 7.19 17% | 4.26 51% | 2.92 66% |
| Colorchecker dE 2000 calibrated * | 1.01 | 2.03 -101% | 1.37 -36% | 1.11 -10% | 1.99 -97% | 0.99 2% |
| Greyscale dE 2000 * | 5.5 | 7.5 -36% | 2.6 53% | 9.7 -76% | 1.7 69% | 0.9 84% |
| Gamma | 2.12 104% | 2.12 104% | 2.3 96% | 1.42 155% | 2.15 102% | 2.13 103% |
| CCT | 6413 101% | 7966 82% | 6884 94% | 6227 104% | 6382 102% | 6620 98% |
| Color Space (Percent of AdobeRGB 1998) (%) | 63 | 59.5 -6% | 65.4 4% | 61.6 -2% | 62.2 -1% | 62.3 -1% |
| Color Space (Percent of sRGB) (%) | 97.5 | 93.5 -4% | 99.7 2% | 95 -3% | 95.7 -2% | 98.7 1% |
| Média Total (Programa/Configurações) | -12% /
-22% | 7% /
7% | 4% /
-3% | 6% /
3% | -3% /
6% |
* ... menor é melhor
Exibir tempos de resposta
| ↔ Tempo de resposta preto para branco | ||
|---|---|---|
| 33.2 ms ... ascensão ↗ e queda ↘ combinadas | ↗ 16 ms ascensão | 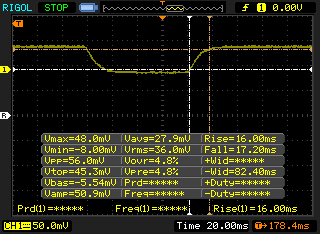 |
| ↘ 17.2 ms queda | ||
| A tela mostra taxas de resposta lentas em nossos testes e será insatisfatória para os jogadores. Em comparação, todos os dispositivos testados variam de 0.1 (mínimo) a 240 (máximo) ms. » 90 % de todos os dispositivos são melhores. Isso significa que o tempo de resposta medido é pior que a média de todos os dispositivos testados (19.8 ms). | ||
| ↔ Tempo de resposta 50% cinza a 80% cinza | ||
| 50 ms ... ascensão ↗ e queda ↘ combinadas | ↗ 22 ms ascensão | 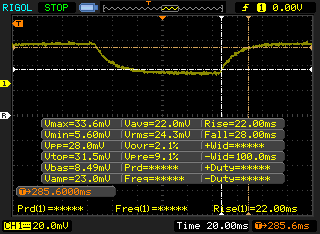 |
| ↘ 28 ms queda | ||
| A tela mostra taxas de resposta lentas em nossos testes e será insatisfatória para os jogadores. Em comparação, todos os dispositivos testados variam de 0.165 (mínimo) a 636 (máximo) ms. » 86 % de todos os dispositivos são melhores. Isso significa que o tempo de resposta medido é pior que a média de todos os dispositivos testados (31 ms). | ||
Cintilação da tela / PWM (modulação por largura de pulso)
| Tela tremeluzindo/PWM detectado | 2500 Hz | ≤ 25 % configuração de brilho | 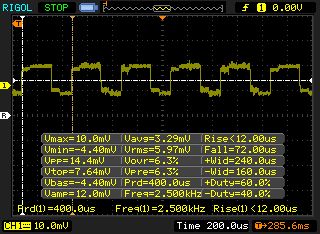 |
A luz de fundo da tela pisca em 2500 Hz (pior caso, por exemplo, utilizando PWM) Cintilação detectada em uma configuração de brilho de 25 % e abaixo. Não deve haver cintilação ou PWM acima desta configuração de brilho. A frequência de 2500 Hz é bastante alta, então a maioria dos usuários sensíveis ao PWM não deve notar nenhuma oscilação. [pwm_comparison] Em comparação: 52 % de todos os dispositivos testados não usam PWM para escurecer a tela. Se PWM foi detectado, uma média de 7775 (mínimo: 5 - máximo: 343500) Hz foi medida. | |||
| Cinebench R10 | |
| Rendering Multiple CPUs 32Bit | |
| Dell XPS 13 7390 Core i7-10710U | |
| Asus ZenBook 15 UX534FTC-A8190T | |
| Microsoft Surface Pro 7 Core i5-1035G4 | |
| Média Intel Core i7-1065G7 (16551 - 26481, n=4) | |
| Dynabook Portege A30-E-174 | |
| Dell XPS 13 7390 2-in-1 Core i3 | |
| Rendering Single 32Bit | |
| Dell XPS 13 7390 Core i7-10710U | |
| Asus ZenBook 15 UX534FTC-A8190T | |
| Média Intel Core i7-1065G7 (7083 - 7390, n=4) | |
| Microsoft Surface Pro 7 Core i5-1035G4 | |
| Dell XPS 13 7390 2-in-1 Core i3 | |
| Dynabook Portege A30-E-174 | |
| wPrime 2.10 - 1024m | |
| Dell XPS 13 7390 2-in-1 Core i3 | |
| Microsoft Surface Pro 7 Core i5-1035G4 | |
| Média Intel Core i7-1065G7 (233 - 354, n=3) | |
| Dell XPS 13 7390 Core i7-10710U | |
* ... menor é melhor
| PCMark 8 Home Score Accelerated v2 | 3825 pontos | |
| PCMark 8 Work Score Accelerated v2 | 5039 pontos | |
| PCMark 10 Score | 4154 pontos | |
Ajuda | ||
| Dell XPS 13 9300 Core i7-1065G7 Intel SSDPEMKF512G8 NVMe SSD | Dell XPS 13 7390 Core i7-10710U SK Hynix PC601 NVMe 512 GB | Dell XPS 13 7390 2-in-1 Core i7 Toshiba BG4 KBG40ZPZ512G | Microsoft Surface Laptop 3 13 Core i5-1035G7 SK hynix BC501 HFM256GDGTNG | Asus ZenBook S13 UX392FN WDC PC SN520 SDAPNUW-512G | |
|---|---|---|---|---|---|
| AS SSD | 30% | -20% | -23% | 39% | |
| Seq Read (MB/s) | 1956 | 1804 -8% | 1801 -8% | 1387 -29% | 1224 -37% |
| Seq Write (MB/s) | 1227 | 1000 -19% | 1125 -8% | 504 -59% | 907 -26% |
| 4K Read (MB/s) | 63 | 45.1 -28% | 39.7 -37% | 42.35 -33% | 41.46 -34% |
| 4K Write (MB/s) | 156.6 | 115 -27% | 67 -57% | 120 -23% | 126.2 -19% |
| 4K-64 Read (MB/s) | 475.6 | 893 88% | 1253 163% | 497.4 5% | 1021 115% |
| 4K-64 Write (MB/s) | 539 | 732 36% | 209 -61% | 354.9 -34% | 1251 132% |
| Access Time Read * (ms) | 0.042 | 0.044 -5% | 0.069 -64% | 0.055 -31% | 0.053 -26% |
| Access Time Write * (ms) | 0.105 | 0.095 10% | 0.625 -495% | 0.093 11% | 0.027 74% |
| Score Read (Points) | 734 | 1119 52% | 1472 101% | 678 -8% | 1185 61% |
| Score Write (Points) | 818 | 947 16% | 388 -53% | 525 -36% | 1468 79% |
| Score Total (Points) | 1915 | 2608 36% | 2583 35% | 1520 -21% | 3250 70% |
| Copy ISO MB/s (MB/s) | 1022 | 1515 48% | 1293 27% | 764 -25% | 1404 37% |
| Copy Program MB/s (MB/s) | 302.8 | 535 77% | 560 85% | 256.1 -15% | 402.4 33% |
| Copy Game MB/s (MB/s) | 491.4 | 1211 146% | 927 89% | 368.4 -25% | 902 84% |
| CrystalDiskMark 5.2 / 6 | 12% | -13% | -35% | -9% | |
| Write 4K (MB/s) | 186.8 | 134 -28% | 106.7 -43% | 112.3 -40% | 149.2 -20% |
| Read 4K (MB/s) | 71.4 | 42.91 -40% | 49.94 -30% | 42.13 -41% | 47.18 -34% |
| Write Seq (MB/s) | 1203 | 1841 53% | 1223 2% | 630 -48% | 750 -38% |
| Read Seq (MB/s) | 2600 | 1707 -34% | 1801 -31% | 1023 -61% | 1137 -56% |
| Write 4K Q32T1 (MB/s) | 514 | 394.7 -23% | 325.3 -37% | 336.6 -35% | 749 46% |
| Read 4K Q32T1 (MB/s) | 570 | 398.5 -30% | 551 -3% | 399.6 -30% | 478.7 -16% |
| Write Seq Q32T1 (MB/s) | 786 | 2250 186% | 1224 56% | 821 4% | 1453 85% |
| Read Seq Q32T1 (MB/s) | 2947 | 3265 11% | 2350 -20% | 2030 -31% | 1713 -42% |
| Média Total (Programa/Configurações) | 21% /
24% | -17% /
-18% | -29% /
-28% | 15% /
21% |
* ... menor é melhor

| 3DMark 11 Performance | 4866 pontos | |
| 3DMark Ice Storm Standard Score | 67829 pontos | |
| 3DMark Cloud Gate Standard Score | 14272 pontos | |
| 3DMark Fire Strike Score | 2753 pontos | |
| 3DMark Time Spy Score | 937 pontos | |
Ajuda | ||
| Shadow of the Tomb Raider - 1280x720 Lowest Preset | |
| Desktop PC | |
| MSI Modern 15 A10RB | |
| Dell Inspiron 15 5000 5585 | |
| Dell XPS 13 9300 Core i7-1065G7 | |
| Média Intel Iris Plus Graphics G7 (Ice Lake 64 EU) (15.6 - 33, n=13) | |
| Dell XPS 13 7390 Core i7-10710U | |
| The Witcher 3 | |
| 1024x768 Low Graphics & Postprocessing | |
| Huawei MateBook 13 i7 | |
| MSI Modern 15 A10RB | |
| Dell Inspiron 15 5000 5585 | |
| Dell XPS 13 9300 Core i7-1065G7 | |
| Média Intel Iris Plus Graphics G7 (Ice Lake 64 EU) (28.2 - 58, n=20) | |
| Dell XPS 13 7390 Core i7-10710U | |
| HP Pavilion x360 15-dq0065cl | |
| 1366x768 Medium Graphics & Postprocessing | |
| MSI Modern 15 A10RB | |
| Huawei MateBook 13 i7 | |
| Dell XPS 13 9300 Core i7-1065G7 | |
| Média Intel Iris Plus Graphics G7 (Ice Lake 64 EU) (20.8 - 36.8, n=18) | |
| HP Pavilion x360 15-dq0065cl | |
| 1920x1080 High Graphics & Postprocessing (Nvidia HairWorks Off) | |
| HP Pavilion Gaming 15t-cx0000 | |
| MSI Modern 15 A10RB | |
| Huawei MateBook 13 i7 | |
| Dell Inspiron 15 5000 5585 | |
| Dell XPS 13 9300 Core i7-1065G7 | |
| Média Intel Iris Plus Graphics G7 (Ice Lake 64 EU) (10.9 - 20.1, n=18) | |
| baixo | média | alto | ultra | |
|---|---|---|---|---|
| BioShock Infinite (2013) | 104.2 | 66.8 | 56.7 | 21.1 |
| The Witcher 3 (2015) | 50.7 | 33.5 | 18.4 | 9.1 |
| Rocket League (2017) | 85.5 | 53.6 | 38.3 | |
| Shadow of the Tomb Raider (2018) | 28 |
| Dell XPS 13 9300 Core i7-1065G7 Iris Plus Graphics G7 (Ice Lake 64 EU), i7-1065G7, Intel SSDPEMKF512G8 NVMe SSD | Dell XPS 13 7390 Core i7-10710U UHD Graphics 620, i7-10710U, SK Hynix PC601 NVMe 512 GB | Dell XPS 13 7390 2-in-1 Core i7 Iris Plus Graphics G7 (Ice Lake 64 EU), i7-1065G7, Toshiba BG4 KBG40ZPZ512G | Huawei Matebook X Pro i5 GeForce MX150, i5-8250U, Samsung PM961 MZVLW256HEHP | Microsoft Surface Laptop 3 13 Core i5-1035G7 Iris Plus Graphics G7 (Ice Lake 64 EU), i5-1035G7, SK hynix BC501 HFM256GDGTNG | Dell XPS 13 9300 i5 FHD UHD Graphics G1 (Ice Lake 32 EU), i5-1035G1, Toshiba XG6 KXG60ZNV512G | |
|---|---|---|---|---|---|---|
| Noise | -3% | -2% | -5% | 0% | 2% | |
| desligado / ambiente * (dB) | 28.3 | 28 1% | 28.1 1% | 27.9 1% | 28.5 -1% | 29.3 -4% |
| Idle Minimum * (dB) | 28.3 | 28 1% | 28.1 1% | 27.9 1% | 28.5 -1% | 29.3 -4% |
| Idle Average * (dB) | 28.3 | 28 1% | 28.1 1% | 27.9 1% | 28.5 -1% | 29.3 -4% |
| Idle Maximum * (dB) | 28.3 | 28 1% | 28.1 1% | 27.9 1% | 28.5 -1% | 29.3 -4% |
| Load Average * (dB) | 32.5 | 33.7 -4% | 31.7 2% | 36.2 -11% | 28.5 12% | 30 8% |
| Witcher 3 ultra * (dB) | 39.3 | 43.4 -10% | 45 -15% | 40.4 -3% | ||
| Load Maximum * (dB) | 39.3 | 46.5 -18% | 43.4 -10% | 45.2 -15% | 40.4 -3% | 32.4 18% |
* ... menor é melhor
Barulho
| Ocioso |
| 28.3 / 28.3 / 28.3 dB |
| Carga |
| 32.5 / 39.3 dB |
 | ||
30 dB silencioso 40 dB(A) audível 50 dB(A) ruidosamente alto |
||
min: | ||
(-) A temperatura máxima no lado superior é 46.6 °C / 116 F, em comparação com a média de 35.9 °C / 97 F , variando de 21.4 a 59 °C para a classe Subnotebook.
(±) A parte inferior aquece até um máximo de 44.8 °C / 113 F, em comparação com a média de 39.2 °C / 103 F
(+) Em uso inativo, a temperatura média para o lado superior é 27.4 °C / 81 F, em comparação com a média do dispositivo de 30.8 °C / ### class_avg_f### F.
(±) Jogando The Witcher 3, a temperatura média para o lado superior é 33.9 °C / 93 F, em comparação com a média do dispositivo de 30.8 °C / ## #class_avg_f### F.
(+) Os apoios para as mãos e o touchpad são mais frios que a temperatura da pele, com um máximo de 29.8 °C / 85.6 F e, portanto, são frios ao toque.
(±) A temperatura média da área do apoio para as mãos de dispositivos semelhantes foi 28.2 °C / 82.8 F (-1.6 °C / -2.8 F).
| desligado | |
| Ocioso | |
| Carga |
|
Key:
min: | |
| Dell XPS 13 9300 Core i7-1065G7 i7-1065G7, Iris Plus Graphics G7 (Ice Lake 64 EU), Intel SSDPEMKF512G8 NVMe SSD, IPS, 1920x1200, 13.4" | Dell XPS 13 7390 Core i7-10710U i7-10710U, UHD Graphics 620, SK Hynix PC601 NVMe 512 GB, IPS, 3840x2160, 13.3" | Dell XPS 13 7390 2-in-1 Core i7 i7-1065G7, Iris Plus Graphics G7 (Ice Lake 64 EU), Toshiba BG4 KBG40ZPZ512G, IPS, 1920x1200, 13.4" | Huawei Matebook X Pro i5 i5-8250U, GeForce MX150, Samsung PM961 MZVLW256HEHP, IPS, 3000x2000, 13.9" | Asus ZenBook S13 UX392FN i7-8565U, GeForce MX150, WDC PC SN520 SDAPNUW-512G, IPS, 1920x1080, 13.9" | Microsoft Surface Laptop 3 13 Core i5-1035G7 i5-1035G7, Iris Plus Graphics G7 (Ice Lake 64 EU), SK hynix BC501 HFM256GDGTNG, IPS, 2256x1504, 13.5" | Dell XPS 13 9300 i5 FHD i5-1035G1, UHD Graphics G1 (Ice Lake 32 EU), Toshiba XG6 KXG60ZNV512G, IPS, 1920x1200, 13.4" | |
|---|---|---|---|---|---|---|---|
| Power Consumption | -16% | 4% | -27% | -17% | -14% | -3% | |
| Idle Minimum * (Watt) | 4.2 | 4.7 -12% | 2.6 38% | 3.5 17% | 3.4 19% | 4.4 -5% | 3.4 19% |
| Idle Average * (Watt) | 6.9 | 8.3 -20% | 5.3 23% | 8.9 -29% | 6.3 9% | 7.5 -9% | 6 13% |
| Idle Maximum * (Watt) | 7.5 | 9 -20% | 7 7% | 12.3 -64% | 10.4 -39% | 7.8 -4% | 10.2 -36% |
| Load Average * (Watt) | 33.3 | 42 -26% | 43.1 -29% | 54.2 -63% | 51 -53% | 41.9 -26% | 36.6 -10% |
| Witcher 3 ultra * (Watt) | 37.1 | 43.1 -16% | 42.4 -14% | 39 -5% | 40.8 -10% | ||
| Load Maximum * (Watt) | 48.4 | 49 -1% | 49 -1% | 52.1 -8% | 62.7 -30% | 63.9 -32% | 49.3 -2% |
* ... menor é melhor
| Dell XPS 13 9300 Core i7-1065G7 i7-1065G7, Iris Plus Graphics G7 (Ice Lake 64 EU), 52 Wh | Dell XPS 13 7390 Core i7-10710U i7-10710U, UHD Graphics 620, 52 Wh | Dell XPS 13 7390 2-in-1 Core i7 i7-1065G7, Iris Plus Graphics G7 (Ice Lake 64 EU), 51 Wh | Huawei Matebook X Pro i5 i5-8250U, GeForce MX150, 57.4 Wh | Asus ZenBook S13 UX392FN i7-8565U, GeForce MX150, 50 Wh | Microsoft Surface Laptop 3 13 Core i5-1035G7 i5-1035G7, Iris Plus Graphics G7 (Ice Lake 64 EU), 45 Wh | Dell XPS 13 9300 i5 FHD i5-1035G1, UHD Graphics G1 (Ice Lake 32 EU), 52 Wh | |
|---|---|---|---|---|---|---|---|
| Duração da bateria | -34% | -29% | -27% | -34% | -35% | -8% | |
| WiFi v1.3 (h) | 12.7 | 8.4 -34% | 9 -29% | 9.3 -27% | 8.4 -34% | 8.3 -35% | 11.7 -8% |
| Reader / Idle (h) | 20.7 | 28.5 | 34.4 | ||||
| Load (h) | 2.2 | 1.7 | 1.9 | 3.4 |
Pro
Contra
O salto do SKU Core i5-1035G1 para o SKU Core i7-1065G7 trará um desempenho de CPU aproximadamente 23% mais rápido e um desempenho da GPU 70% mais rápido, sem custo adicional de energia. Portanto, a maior razão para possuir o SKU Core i7 sobre o SKU Core i5 seria a vantagem gráfica em aplicativos como edição leve de fotos ou jogos ocasionais do Rocket League ou LoL. Porém, se suas atividades principais envolvem processamento de texto, navegação na Web ou streaming de vídeo, a configuração Core i5 será mais que suficiente. De fato, você também pode considerar um modelo Whiskey Lake-U Core i5-8265U ou Core i7-8565U mais antigo, pois o Core i5-1035G1 funciona de maneira muito semelhante a essas CPUs de última geração.
O desempenho da CPU começa a diminuir ao executar cargas extremas por longos períodos. Provavelmente, isso não se aplicará ao público-alvo do subportátil, pois qualquer usuário avançado deve considerar portáteis mais potentes, como o XPS 15 ou Asus ZenBook Pro.
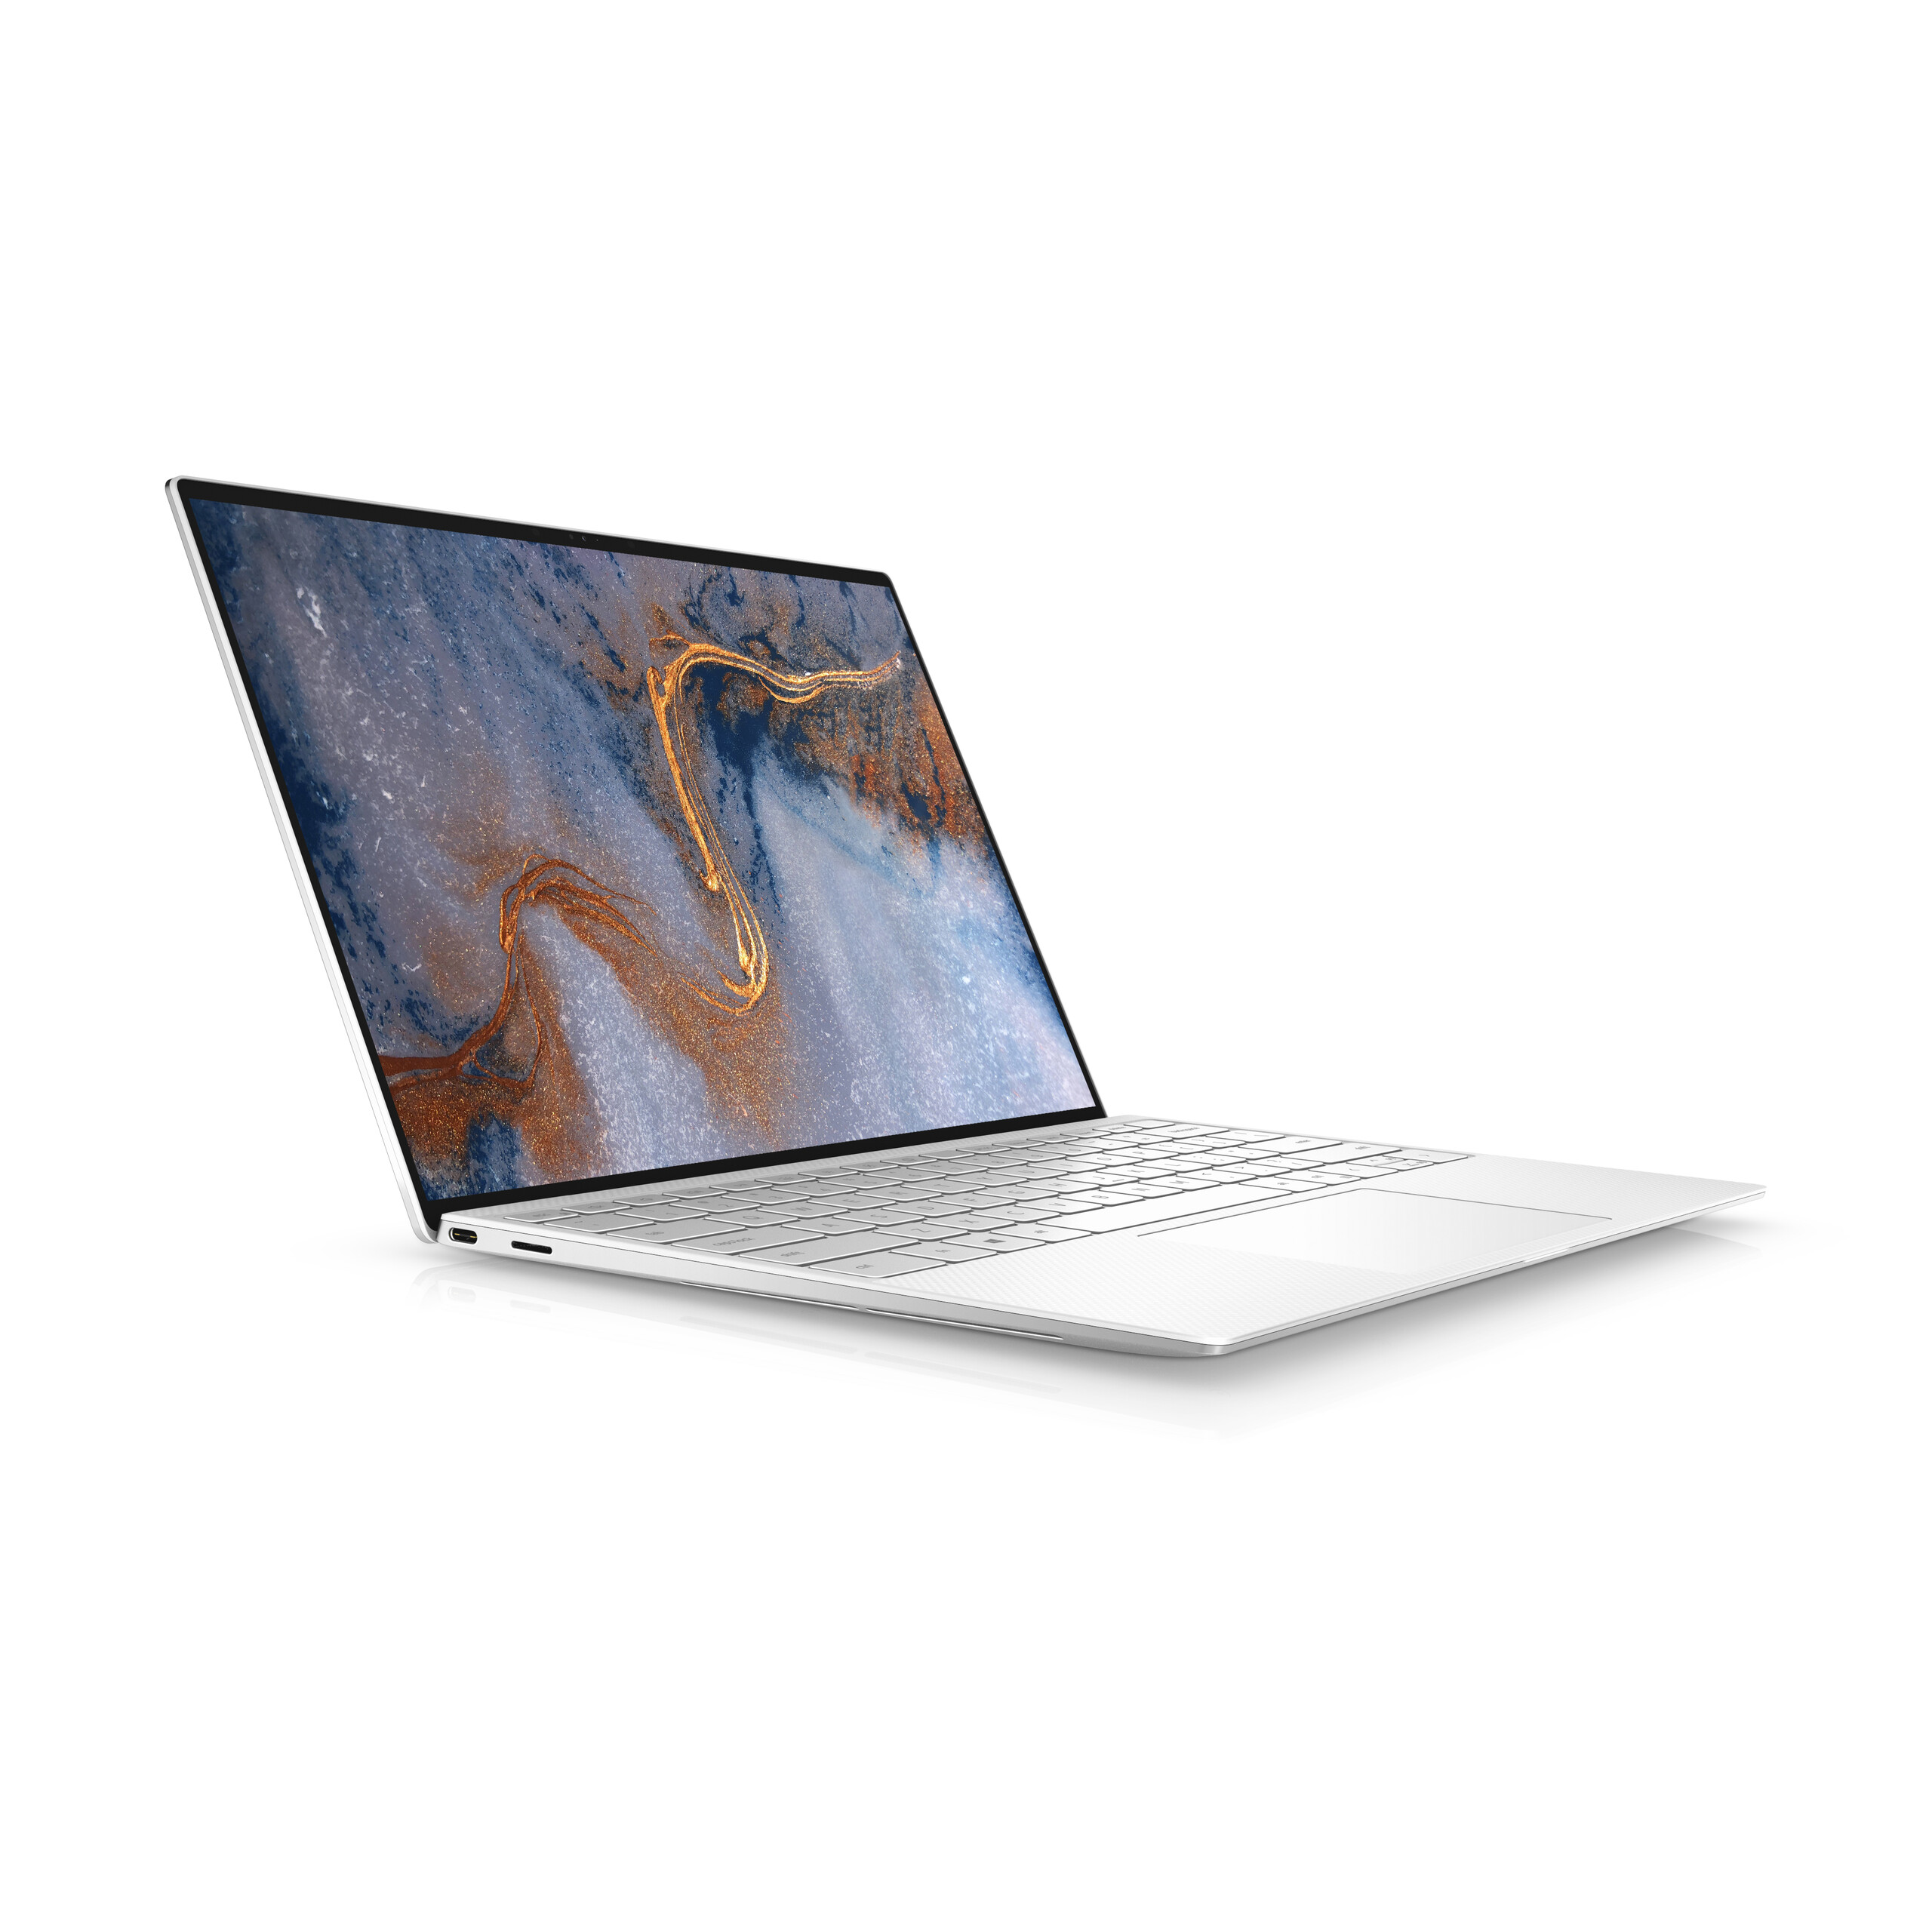
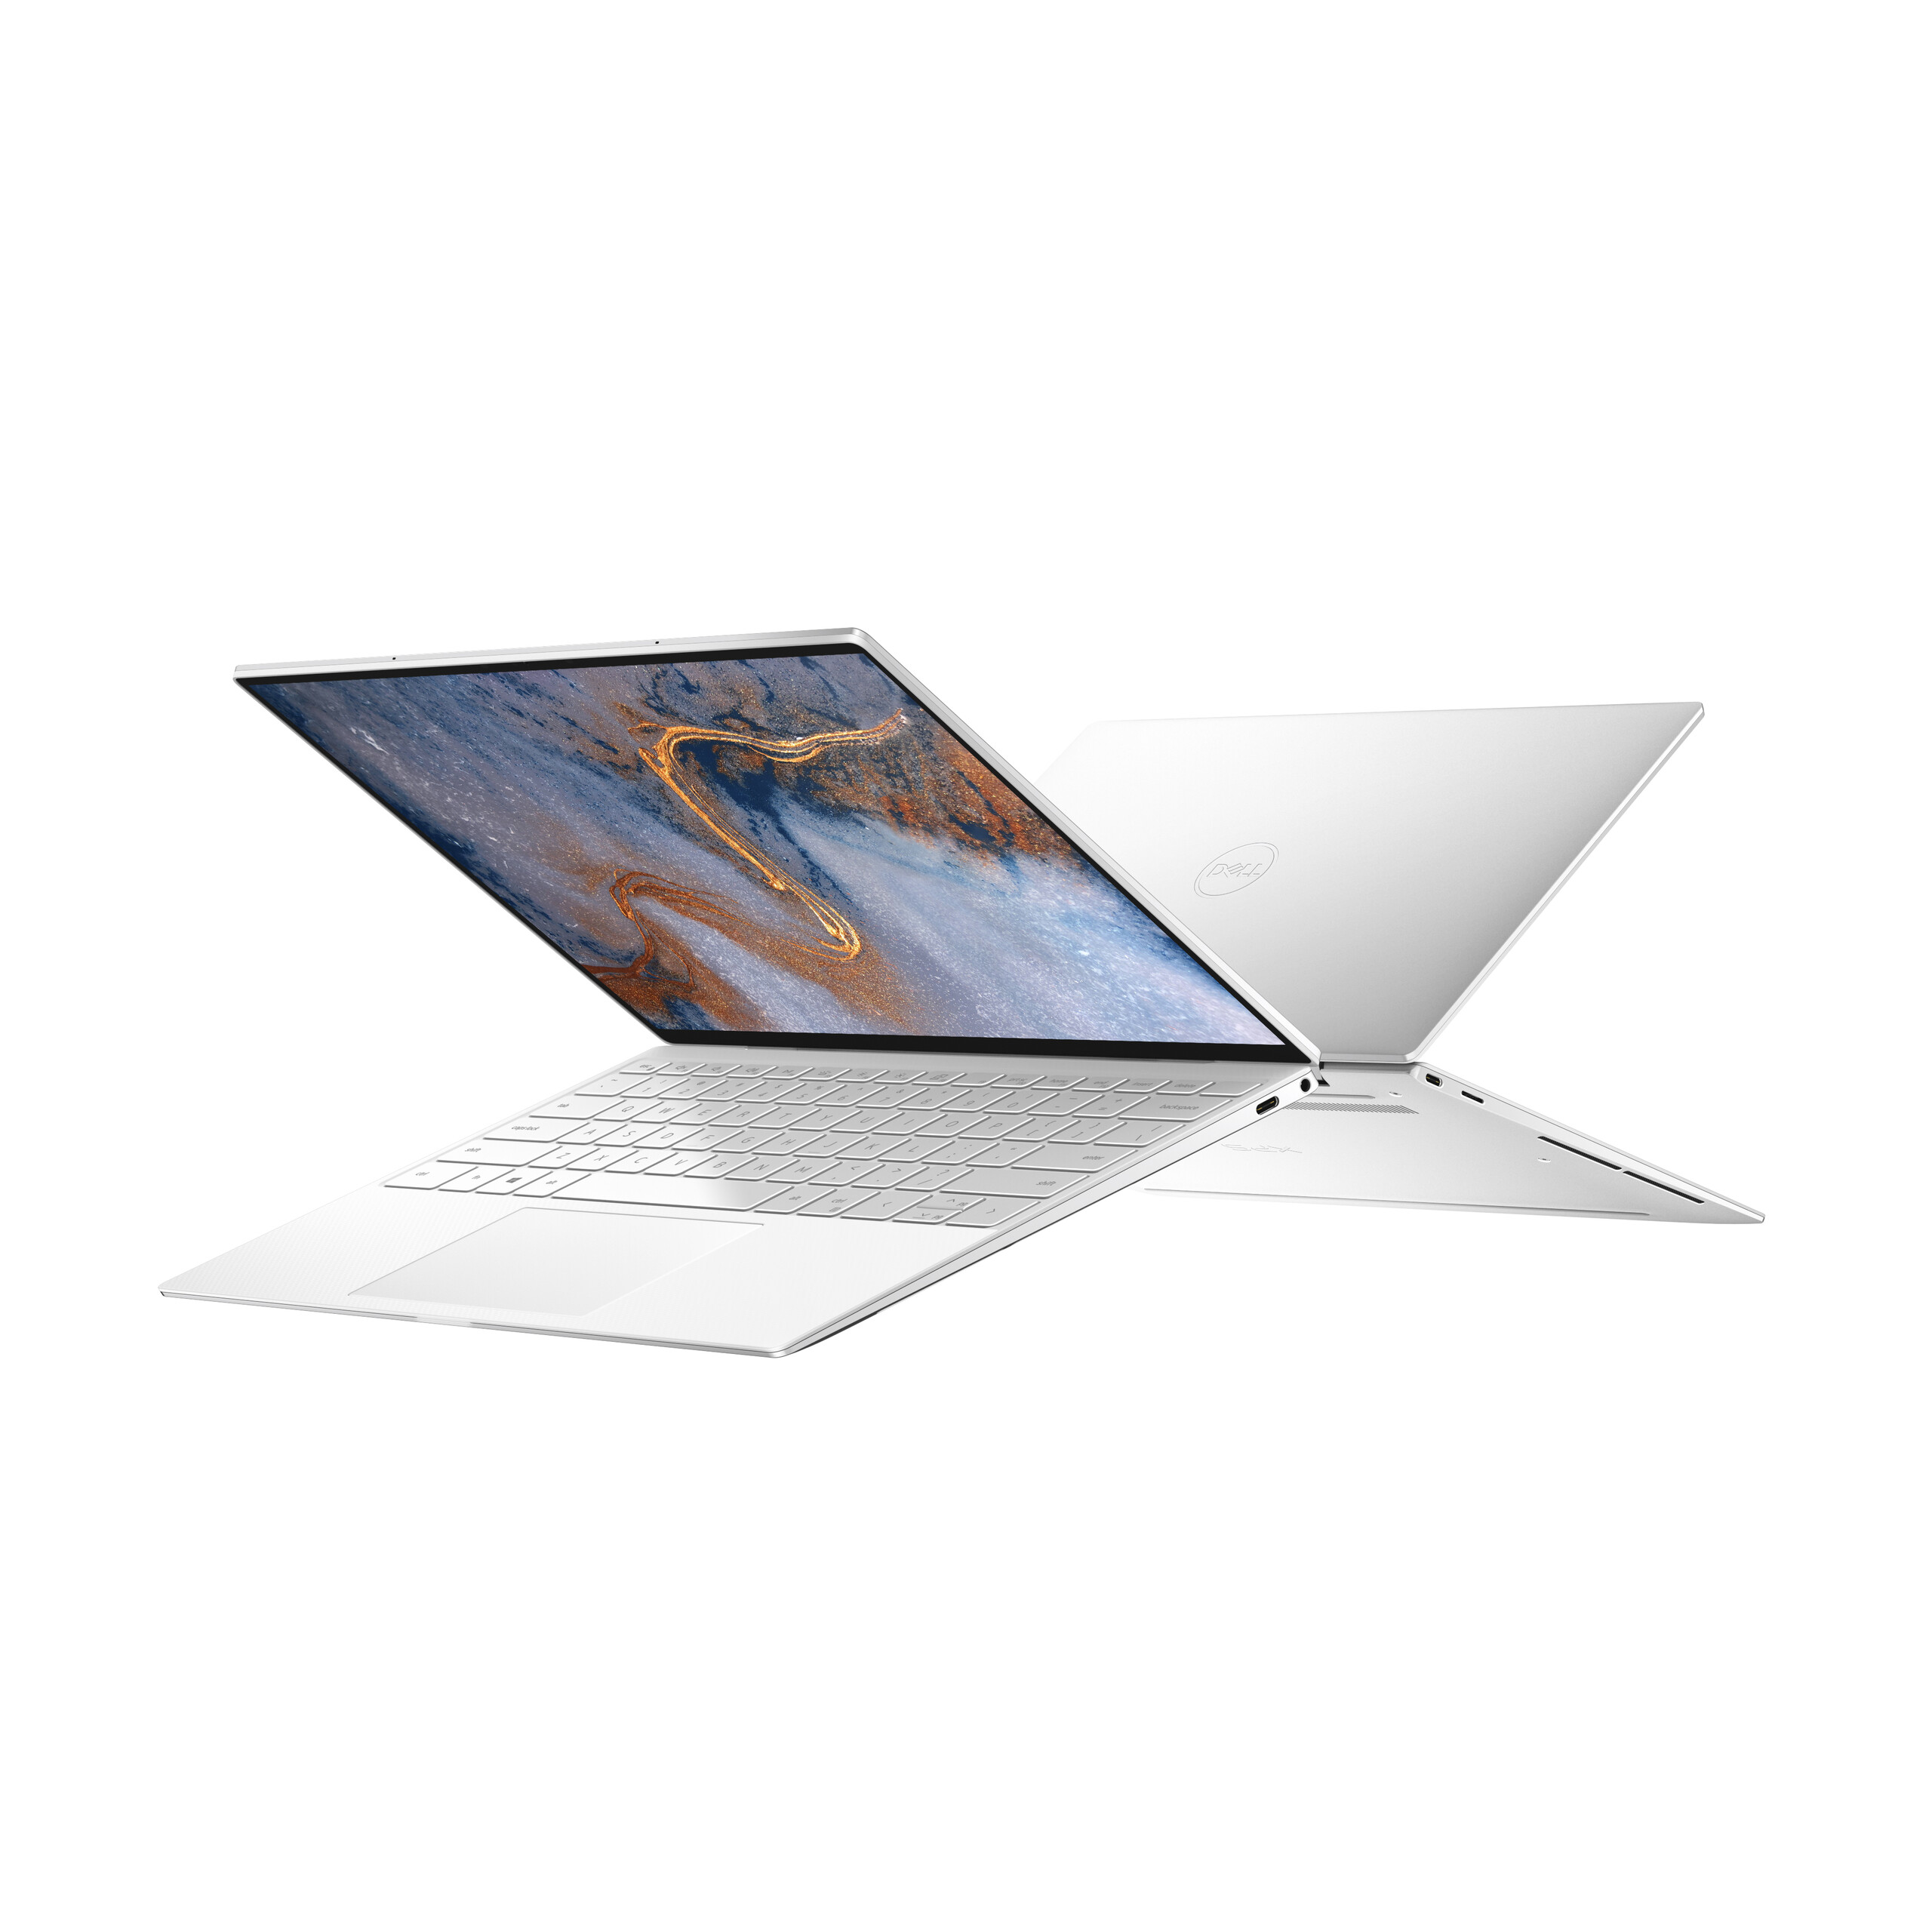
O aspecto mais atraente do XPS 13 9300 é sua tela no formato maior 16:10, que trará benefícios mais óbvios para o usuário quando comparado às atualizações de desempenho relativamente menores. Essa é provavelmente uma das medidas mais inteligentes da Dell se eles quiseram atrair mais usuários do MacBook Air ou MacBook Pro 13 que desfrutam de monitores 16:10 há anos. Consideramos a relação de aspecto um bom meio termo entre os portáteis tradicionais 16:9 e os portáteis de escritório completos 3:2, como o Huawei MateBook X Pro ou a série Microsoft Surface.
O XPS 13 está se tornando uma alternativa melhor ao MacBook a cada ano. Seu novo design adiciona uma tela 16:10 e um clickpad maiores, sem sacrificar nenhum dos principais recursos do modelo do ano passado.
Dell XPS 13 9300 Core i7-1065G7
- 03/25/2020 v7 (old)
Allen Ngo
Price comparison
