Breve Análise do Portátil Dell XPS 13 9360R (i5-8250U, QHD)

| SD Card Reader | |
| average JPG Copy Test (av. of 3 runs) | |
| Dell XPS 13 i5-8250U (Toshiba Exceria Pro SDXC 64 GB UHS-II) | |
| HP Envy 13-ad006ng (Toshiba Exceria Pro SDXC 64 GB UHS-II) | |
| maximum AS SSD Seq Read Test (1GB) | |
| Dell XPS 13 i5-8250U (Toshiba Exceria Pro SDXC 64 GB UHS-II) | |
| HP Envy 13-ad006ng (Toshiba Exceria Pro SDXC 64 GB UHS-II) | |
| |||||||||||||||||||||||||
iluminação: 72 %
iluminação com acumulador: 342 cd/m²
Contraste: 1094:1 (Preto: 0.33 cd/m²)
ΔE ColorChecker Calman: 5.26 | ∀{0.5-29.43 Ø4.71}
ΔE Greyscale Calman: 5.69 | ∀{0.09-98 Ø4.96}
92% sRGB (Argyll 1.6.3 3D)
59% AdobeRGB 1998 (Argyll 1.6.3 3D)
65.7% AdobeRGB 1998 (Argyll 3D)
91.7% sRGB (Argyll 3D)
63.9% Display P3 (Argyll 3D)
Gamma: 1.63
CCT: 6499 K
| Dell XPS 13 i5-8250U ID: Sharp SHP144A, Name: LQ133Z1, , 3200x1800, 13.3" | Dell XPS 13 i7-8550U ID: Sharp SHP144A, Name: LQ133Z1, , 3200x1800, 13.3" | HP Spectre 13-v131ng CMN1374, , 1920x1080, 13.3" | Apple MacBook Pro 13 2017 APPA033, , 2560x1600, 13.3" | Huawei MateBook X Chi Mei CMN8201 / P130ZDZ-EF1, , 2160x1440, 13.3" | HP Envy 13-ad006ng BOE070E, , 1920x1080, 13.3" | Apple MacBook 12 (Early 2016) 1.1 GHz APPA027, , 2304x1440, 12" | Dell XPS 13 9360 FHD i7 Iris SHP1449, , 1920x1080, 13.3" | |
|---|---|---|---|---|---|---|---|---|
| Display | 0% | -1% | 32% | 3% | -2% | 4% | -18% | |
| Display P3 Coverage (%) | 63.9 | 63.6 0% | 64.6 1% | 99.2 55% | 65.8 3% | 66.8 5% | 66.8 5% | 51.6 -19% |
| sRGB Coverage (%) | 91.7 | 93 1% | 88.8 -3% | 99.9 9% | 96.2 5% | 86.3 -6% | 95.4 4% | 77.4 -16% |
| AdobeRGB 1998 Coverage (%) | 65.7 | 65.4 0% | 64.8 -1% | 87.1 33% | 66.8 2% | 63.1 -4% | 68 4% | 53.3 -19% |
| Response Times | -7% | -35% | -22% | 3% | -37% | -22% | -21% | |
| Response Time Grey 50% / Grey 80% * (ms) | 29 ? | 35.6 ? -23% | 46 ? -59% | 42.8 ? -48% | 33 ? -14% | 48 ? -66% | 41.2 ? -42% | 41.2 ? -42% |
| Response Time Black / White * (ms) | 30 ? | 27.2 ? 9% | 33 ? -10% | 28.8 ? 4% | 24 ? 20% | 32 ? -7% | 30.4 ? -1% | 30 ? -0% |
| PWM Frequency (Hz) | 19500 ? | 19690 ? | 1000 ? | 19530 ? | ||||
| Screen | 7% | 2% | 39% | 23% | -1% | 17% | 15% | |
| Brightness middle (cd/m²) | 361 | 386.1 7% | 404 12% | 588 63% | 408 13% | 281 -22% | 387 7% | 461 28% |
| Brightness (cd/m²) | 303 | 357 18% | 382 26% | 561 85% | 395 30% | 264 -13% | 358 18% | 418 38% |
| Brightness Distribution (%) | 72 | 83 15% | 91 26% | 92 28% | 88 22% | 83 15% | 88 22% | 85 18% |
| Black Level * (cd/m²) | 0.33 | 0.33 -0% | 0.35 -6% | 0.45 -36% | 0.45 -36% | 0.23 30% | 0.47 -42% | 0.2 39% |
| Contrast (:1) | 1094 | 1170 7% | 1154 5% | 1307 19% | 907 -17% | 1222 12% | 823 -25% | 2305 111% |
| Colorchecker dE 2000 * | 5.26 | 4.2 20% | 5.37 -2% | 1.7 68% | 1.55 71% | 4.83 8% | 1.6 70% | 5.4 -3% |
| Colorchecker dE 2000 max. * | 7.79 | 7.6 2% | 9.46 -21% | 3.5 55% | 2.19 72% | 8.89 -14% | 4 49% | 12.2 -57% |
| Greyscale dE 2000 * | 5.69 | 5.7 -0% | 6.44 -13% | 1.9 67% | 1.91 66% | 6.63 -17% | 1 82% | 5.4 5% |
| Gamma | 1.63 135% | 2.28 96% | 2.52 87% | 2.33 94% | 2.34 94% | 1.85 119% | 2.26 97% | 2.15 102% |
| CCT | 6499 100% | 7336 89% | 6738 96% | 6738 96% | 6491 100% | 6794 96% | 6680 97% | 7258 90% |
| Color Space (Percent of AdobeRGB 1998) (%) | 59 | 59 0% | 58 -2% | 77.92 32% | 61 3% | 56 -5% | 61.6 4% | 48.6 -18% |
| Color Space (Percent of sRGB) (%) | 92 | 92.2 0% | 89 -3% | 99.94 9% | 96 4% | 86 -7% | 82.2 -11% | 76.9 -16% |
| Média Total (Programa/Configurações) | 0% /
4% | -11% /
-3% | 16% /
30% | 10% /
16% | -13% /
-6% | -0% /
10% | -8% /
3% |
* ... menor é melhor
Exibir tempos de resposta
| ↔ Tempo de resposta preto para branco | ||
|---|---|---|
| 30 ms ... ascensão ↗ e queda ↘ combinadas | ↗ 18 ms ascensão | 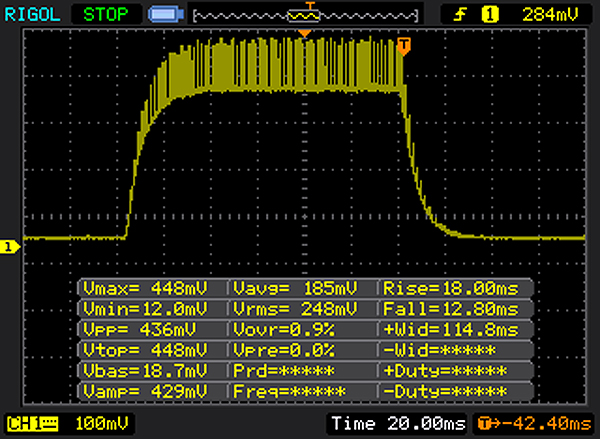 |
| ↘ 12 ms queda | ||
| A tela mostra taxas de resposta lentas em nossos testes e será insatisfatória para os jogadores. Em comparação, todos os dispositivos testados variam de 0.1 (mínimo) a 240 (máximo) ms. » 80 % de todos os dispositivos são melhores. Isso significa que o tempo de resposta medido é pior que a média de todos os dispositivos testados (19.8 ms). | ||
| ↔ Tempo de resposta 50% cinza a 80% cinza | ||
| 29 ms ... ascensão ↗ e queda ↘ combinadas | ↗ 19 ms ascensão | 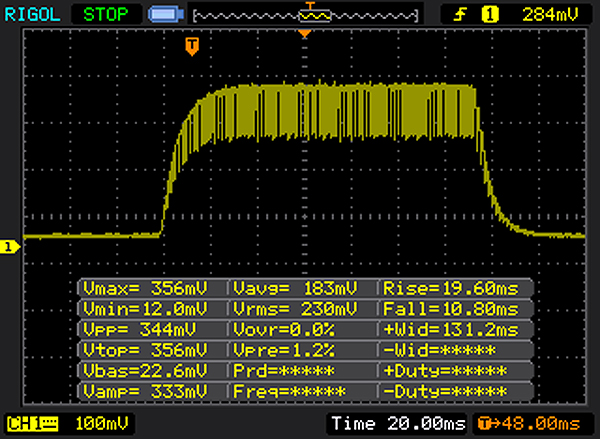 |
| ↘ 10 ms queda | ||
| A tela mostra taxas de resposta relativamente lentas em nossos testes e pode ser muito lenta para os jogadores. Em comparação, todos os dispositivos testados variam de 0.165 (mínimo) a 636 (máximo) ms. » 39 % de todos os dispositivos são melhores. Isso significa que o tempo de resposta medido é semelhante à média de todos os dispositivos testados (31 ms). | ||
Cintilação da tela / PWM (modulação por largura de pulso)
| Tela tremeluzindo/PWM detectado | 19500 Hz | ≤ 100 % configuração de brilho | 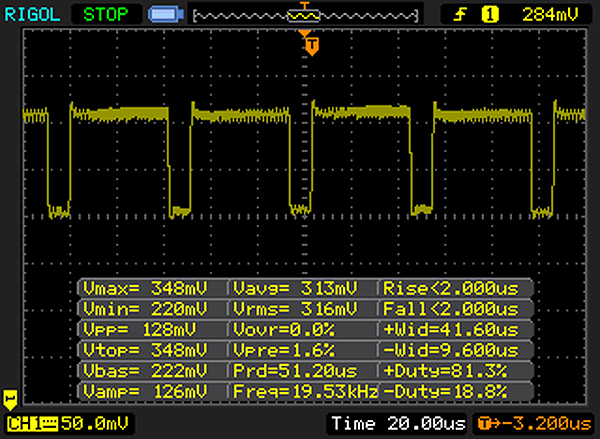 |
A luz de fundo da tela pisca em 19500 Hz (pior caso, por exemplo, utilizando PWM) Cintilação detectada em uma configuração de brilho de 100 % e abaixo. Não deve haver cintilação ou PWM acima desta configuração de brilho. A frequência de 19500 Hz é bastante alta, então a maioria dos usuários sensíveis ao PWM não deve notar nenhuma oscilação. [pwm_comparison] Em comparação: 52 % de todos os dispositivos testados não usam PWM para escurecer a tela. Se PWM foi detectado, uma média de 7757 (mínimo: 5 - máximo: 343500) Hz foi medida. | |||
| PCMark 8 Home Score Accelerated v2 | 3186 pontos | |
| PCMark 8 Creative Score Accelerated v2 | 4501 pontos | |
| PCMark 8 Work Score Accelerated v2 | 4092 pontos | |
Ajuda | ||
| Dell XPS 13 i5-8250U Toshiba XG5 KXG50ZNV256G | Huawei MateBook X LITEON CB1-SD256 | HP Spectre 13-v131ng Samsung PM961 NVMe MZVLW512HMJP | HP Envy 13-ad006ng Toshiba NVMe THNSN5256GPUK | Dell XPS 13 9360 FHD i7 Iris Toshiba XG4 NVMe (THNSN5512GPUK) | Dell XPS 13-9350 Samsung PM951 NVMe MZ-VLV256D | Dell XPS 13 9360 QHD+ i5 Toshiba NVMe THNSN5256GPUK | Dell XPS 13 9343 Core i7 Samsung SSD PM851 M.2 2280 256GB | Dell XPS 13-9343 Lite-On IT L8T-256L9G | |
|---|---|---|---|---|---|---|---|---|---|
| CrystalDiskMark 3.0 | 2% | 92% | -1% | 54% | 2% | 29% | -17% | -1% | |
| Read Seq (MB/s) | 1046 | 741 -29% | 1090 4% | 1019 -3% | 1314 26% | 1097 5% | 1168 12% | 527 -50% | 489.6 -53% |
| Write Seq (MB/s) | 337.4 | 461.2 37% | 1088 222% | 195.4 -42% | 617 83% | 307.7 -9% | 329 -2% | 237.2 -30% | 424.2 26% |
| Read 512 (MB/s) | 443.9 | 504 14% | 753 70% | 735 66% | 1058 138% | 684 54% | 1015 129% | 420.5 -5% | 371.9 -16% |
| Write 512 (MB/s) | 265.7 | 310.3 17% | 911 243% | 172.3 -35% | 502 89% | 308.6 16% | 307 16% | 241.6 -9% | 395.5 49% |
| Read 4k (MB/s) | 26.67 | 29.48 11% | 57.5 116% | 34.5 29% | 37.31 40% | 38.52 44% | 33 24% | 28.29 6% | 34.76 30% |
| Write 4k (MB/s) | 115.6 | 68.1 -41% | 140.2 21% | 109.4 -5% | 133.6 16% | 113 -2% | 132 14% | 103.7 -10% | 79.3 -31% |
| Read 4k QD32 (MB/s) | 365.5 | 498.9 36% | 497.1 36% | 494.6 35% | 425.1 16% | 244.7 -33% | 525 44% | 352.4 -4% | 354 -3% |
| Write 4k QD32 (MB/s) | 345.8 | 257.5 -26% | 416 20% | 161.3 -53% | 431.3 25% | 151.5 -56% | 325 -6% | 239 -31% | 326.3 -6% |

| 3DMark 11 Performance | 1856 pontos | |
| 3DMark Cloud Gate Standard Score | 8773 pontos | |
Ajuda | ||
| Rise of the Tomb Raider - 1024x768 Lowest Preset | |
| HP Envy 13-ad006ng | |
| Apple MacBook Pro 13 2017 | |
| Dell XPS 13 i5-8250U | |
| Acer Spin 5 SP513-52N-566U | |
| Dell XPS 13 9360 QHD+ i5 | |
| HP Spectre 13-v131ng | |
| Farming Simulator 17 - 1280x720 Low Preset | |
| Acer Spin 5 SP513-52N-566U | |
| Huawei MateBook X | |
| Dell XPS 13 i5-8250U | |
| baixo | média | alto | ultra | |
|---|---|---|---|---|
| BioShock Infinite (2013) | 71 | 35 | 31 | 9 |
| Rise of the Tomb Raider (2016) | 23.4 | 14 | 6.8 | |
| Farming Simulator 17 (2016) | 19 | 8 |
Barulho
| Ocioso |
| 30.4 / 30.4 / 30.4 dB |
| Carga |
| 38.3 / 33.6 dB |
 | ||
30 dB silencioso 40 dB(A) audível 50 dB(A) ruidosamente alto |
||
min: | ||
| Dell XPS 13 i5-8250U UHD Graphics 620, i5-8250U, Toshiba XG5 KXG50ZNV256G | Dell XPS 13 9360 FHD i7 Iris Iris Plus Graphics 640, i7-7560U, Toshiba XG4 NVMe (THNSN5512GPUK) | Dell XPS 13 9360 QHD+ i5 HD Graphics 620, i5-7200U, Toshiba NVMe THNSN5256GPUK | Dell XPS 13-9343 HD Graphics 5500, 5200U, Lite-On IT L8T-256L9G | Apple MacBook Pro 13 2017 Iris Plus Graphics 640, i5-7360U, Apple SSD AP0128 | HP Spectre 13-v131ng HD Graphics 620, i7-7500U, Samsung PM961 NVMe MZVLW512HMJP | |
|---|---|---|---|---|---|---|
| Emissions | ||||||
| Fan Noise (dB(A)) | 38.3 | 34.9 -9% | 38.5 1% | 39.3 3% | 40 4% | |
| Noise | 2% | -1% | -6% | 0% | -4% | |
| desligado / ambiente * (dB) | 30.4 | 29.9 2% | 30.3 -0% | 30.2 1% | 30.4 -0% | |
| Idle Minimum * (dB) | 30.4 | 29.9 2% | 30.6 -1% | 30.2 1% | 30.2 1% | 30.4 -0% |
| Idle Average * (dB) | 30.4 | 29.9 2% | 30.6 -1% | 30.3 -0% | 30.2 1% | 30.4 -0% |
| Idle Maximum * (dB) | 30.4 | 30.3 -0% | 32.2 -6% | 30.4 -0% | 30.2 1% | 30.4 -0% |
| Load Average * (dB) | 38.3 | 33.9 11% | 32.2 16% | 34.4 10% | 32.9 14% | 40 -4% |
| Load Maximum * (dB) | 33.6 | 34.9 -4% | 38.5 -15% | 48 -43% | 39.3 -17% | 40 -19% |
| Média Total (Programa/Configurações) | -4% /
1% | 0% /
-1% | -6% /
-6% | 2% /
1% | 0% /
-3% |
* ... menor é melhor
(±) A temperatura máxima no lado superior é 41.3 °C / 106 F, em comparação com a média de 35.9 °C / 97 F , variando de 21.4 a 59 °C para a classe Subnotebook.
(-) A parte inferior aquece até um máximo de 46.5 °C / 116 F, em comparação com a média de 39.2 °C / 103 F
(+) Em uso inativo, a temperatura média para o lado superior é 22.9 °C / 73 F, em comparação com a média do dispositivo de 30.8 °C / ### class_avg_f### F.
(+) Os apoios para as mãos e o touchpad são mais frios que a temperatura da pele, com um máximo de 30.2 °C / 86.4 F e, portanto, são frios ao toque.
(±) A temperatura média da área do apoio para as mãos de dispositivos semelhantes foi 28.2 °C / 82.8 F (-2 °C / -3.6 F).
| Dell XPS 13 i5-8250U UHD Graphics 620, i5-8250U, Toshiba XG5 KXG50ZNV256G | Dell XPS 13 9360 FHD i7 Iris Iris Plus Graphics 640, i7-7560U, Toshiba XG4 NVMe (THNSN5512GPUK) | Dell XPS 13-9343 HD Graphics 5500, 5200U, Lite-On IT L8T-256L9G | Dell XPS 13 9360 QHD+ i5 HD Graphics 620, i5-7200U, Toshiba NVMe THNSN5256GPUK | Apple MacBook Pro 13 2017 Iris Plus Graphics 640, i5-7360U, Apple SSD AP0128 | HP Spectre 13-v131ng HD Graphics 620, i7-7500U, Samsung PM961 NVMe MZVLW512HMJP | |
|---|---|---|---|---|---|---|
| Emissions | ||||||
| Fan Noise (dB(A)) | 38.3 | 34.9 -9% | 38.5 1% | 39.3 3% | 40 4% | |
| Heat | -15% | -11% | -8% | -3% | -12% | |
| Maximum Upper Side * (°C) | 41.3 | 46.2 -12% | 40.6 2% | 40 3% | 43.5 -5% | 54.2 -31% |
| Maximum Bottom * (°C) | 46.5 | 48.8 -5% | 41.2 11% | 42 10% | 40.6 13% | 37.7 19% |
| Idle Upper Side * (°C) | 24.1 | 28.3 -17% | 31.2 -29% | 28 -16% | 27 -12% | 29 -20% |
| Idle Bottom * (°C) | 23.9 | 29.7 -24% | 30.6 -28% | 31 -30% | 26.1 -9% | 27.6 -15% |
| Média Total (Programa/Configurações) | -12% /
-13% | -11% /
-11% | -4% /
-6% | 0% /
-2% | -4% /
-9% |
* ... menor é melhor
Dell XPS 13 i5-8250U análise de áudio
(±) | o volume do alto-falante é médio, mas bom (###valor### dB)
Graves 100 - 315Hz
(-) | quase nenhum baixo - em média 16.9% menor que a mediana
(±) | a linearidade dos graves é média (12% delta para a frequência anterior)
Médios 400 - 2.000 Hz
(±) | médios mais altos - em média 5.5% maior que a mediana
(+) | médios são lineares (5.9% delta para frequência anterior)
Altos 2 - 16 kHz
(+) | agudos equilibrados - apenas 4.2% longe da mediana
(+) | os máximos são lineares (6.9% delta da frequência anterior)
Geral 100 - 16.000 Hz
(±) | a linearidade do som geral é média (20.4% diferença em relação à mediana)
Comparado com a mesma classe
» 65% de todos os dispositivos testados nesta classe foram melhores, 8% semelhantes, 26% piores
» O melhor teve um delta de 5%, a média foi 18%, o pior foi 53%
Comparado com todos os dispositivos testados
» 54% de todos os dispositivos testados foram melhores, 8% semelhantes, 38% piores
» O melhor teve um delta de 4%, a média foi 23%, o pior foi 134%
HP Spectre 13-v131ng análise de áudio
(-) | alto-falantes não muito altos (###valor### dB)
Graves 100 - 315Hz
(-) | quase nenhum baixo - em média 23.7% menor que a mediana
(±) | a linearidade dos graves é média (9.6% delta para a frequência anterior)
Médios 400 - 2.000 Hz
(±) | médios reduzidos - em média 5.1% menor que a mediana
(±) | a linearidade dos médios é média (7.6% delta para frequência anterior)
Altos 2 - 16 kHz
(±) | máximos mais altos - em média 7.7% maior que a mediana
(+) | os máximos são lineares (3.1% delta da frequência anterior)
Geral 100 - 16.000 Hz
(±) | a linearidade do som geral é média (28.6% diferença em relação à mediana)
Comparado com a mesma classe
» 90% de todos os dispositivos testados nesta classe foram melhores, 2% semelhantes, 7% piores
» O melhor teve um delta de 5%, a média foi 18%, o pior foi 53%
Comparado com todos os dispositivos testados
» 86% de todos os dispositivos testados foram melhores, 3% semelhantes, 11% piores
» O melhor teve um delta de 4%, a média foi 23%, o pior foi 134%
| desligado | |
| Ocioso | |
| Carga |
|
Key:
min: | |
| Dell XPS 13 i5-8250U i5-8250U, UHD Graphics 620, Toshiba XG5 KXG50ZNV256G, IGZO IPS, 3200x1800, 13.3" | Dell XPS 13 i7-8550U i5-8550U, UHD Graphics 620, Toshiba XG5 KXG50ZNV256G, IGZO IPS, 3200x1800, 13.3" | Dell XPS 13 9360 FHD i7 Iris i7-7560U, Iris Plus Graphics 640, Toshiba XG4 NVMe (THNSN5512GPUK), IPS, 1920x1080, 13.3" | Acer Spin 5 SP513-52N-566U i5-8250U, UHD Graphics 620, Micron 1100 MTFDDAV256TBN, , 1920x1080, 13.3" | Razer Blade Stealth QHD i7-8550U i5-8550U, UHD Graphics 620, Samsung PM961 NVMe MZVLW512HMJP, , 3200x1800, 13.3" | Huawei MateBook X i5-7200U, HD Graphics 620, LITEON CB1-SD256, , 2160x1440, 13.3" | Apple MacBook Pro 13 2017 i5-7360U, Iris Plus Graphics 640, Apple SSD AP0128, IPS, 2560x1600, 13.3" | HP Spectre 13-v131ng i7-7500U, HD Graphics 620, Samsung PM961 NVMe MZVLW512HMJP, IPS UWVA, 1920x1080, 13.3" | |
|---|---|---|---|---|---|---|---|---|
| Power Consumption | 9% | 17% | 4% | -2% | -16% | 6% | 10% | |
| Idle Minimum * (Watt) | 3.6 | 4.1 -14% | 3.32 8% | 3.6 -0% | 5.6 -56% | 4.6 -28% | 3.7 -3% | 3.6 -0% |
| Idle Average * (Watt) | 7.9 | 5.8 27% | 5.27 33% | 9.5 -20% | 7.5 5% | 11 -39% | 5.2 34% | 6.4 19% |
| Idle Maximum * (Watt) | 8.5 | 6 29% | 6.32 26% | 9.5 -12% | 8.4 1% | 12 -41% | 7.6 11% | 9.2 -8% |
| Load Average * (Watt) | 43 | 42.5 1% | 32 26% | 32.9 23% | 33.7 22% | 39.5 8% | 41.6 3% | 34 21% |
| Load Maximum * (Watt) | 43 | 41.4 4% | 45.9 -7% | 31.4 27% | 34.6 20% | 34.6 20% | 50.5 -17% | 34.4 20% |
| Witcher 3 ultra * (Watt) | 30 | 31 |
* ... menor é melhor
| Dell XPS 13 i5-8250U i5-8250U, UHD Graphics 620, 60 Wh | Dell XPS 13 i7-8550U i5-8550U, UHD Graphics 620, 60 Wh | Dell XPS 13 9360 FHD i7 Iris i7-7560U, Iris Plus Graphics 640, 60 Wh | Dell XPS 13-9343 5200U, HD Graphics 5500, 52 Wh | Apple MacBook Pro 13 2017 i5-7360U, Iris Plus Graphics 640, 54.5 Wh | HP Spectre 13-v131ng i7-7500U, HD Graphics 620, 38 Wh | |
|---|---|---|---|---|---|---|
| Duração da bateria | -4% | 14% | -10% | -24% | -41% | |
| Reader / Idle (h) | 18.2 | 18.5 2% | 25.4 40% | 15.2 -16% | 12 -34% | |
| WiFi v1.3 (h) | 11.5 | 9.8 -15% | 10.9 -5% | 11.4 -1% | 6.6 -43% | |
| Load (h) | 2.4 | 2.4 0% | 2.6 8% | 2.3 -4% | 1.3 -46% | 1.3 -46% |
| H.264 (h) | 15 | 11.4 | 6.1 | |||
| WiFi (h) | 9.7 |
Pro
Contra
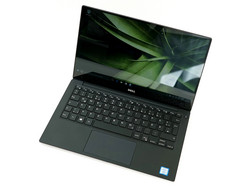
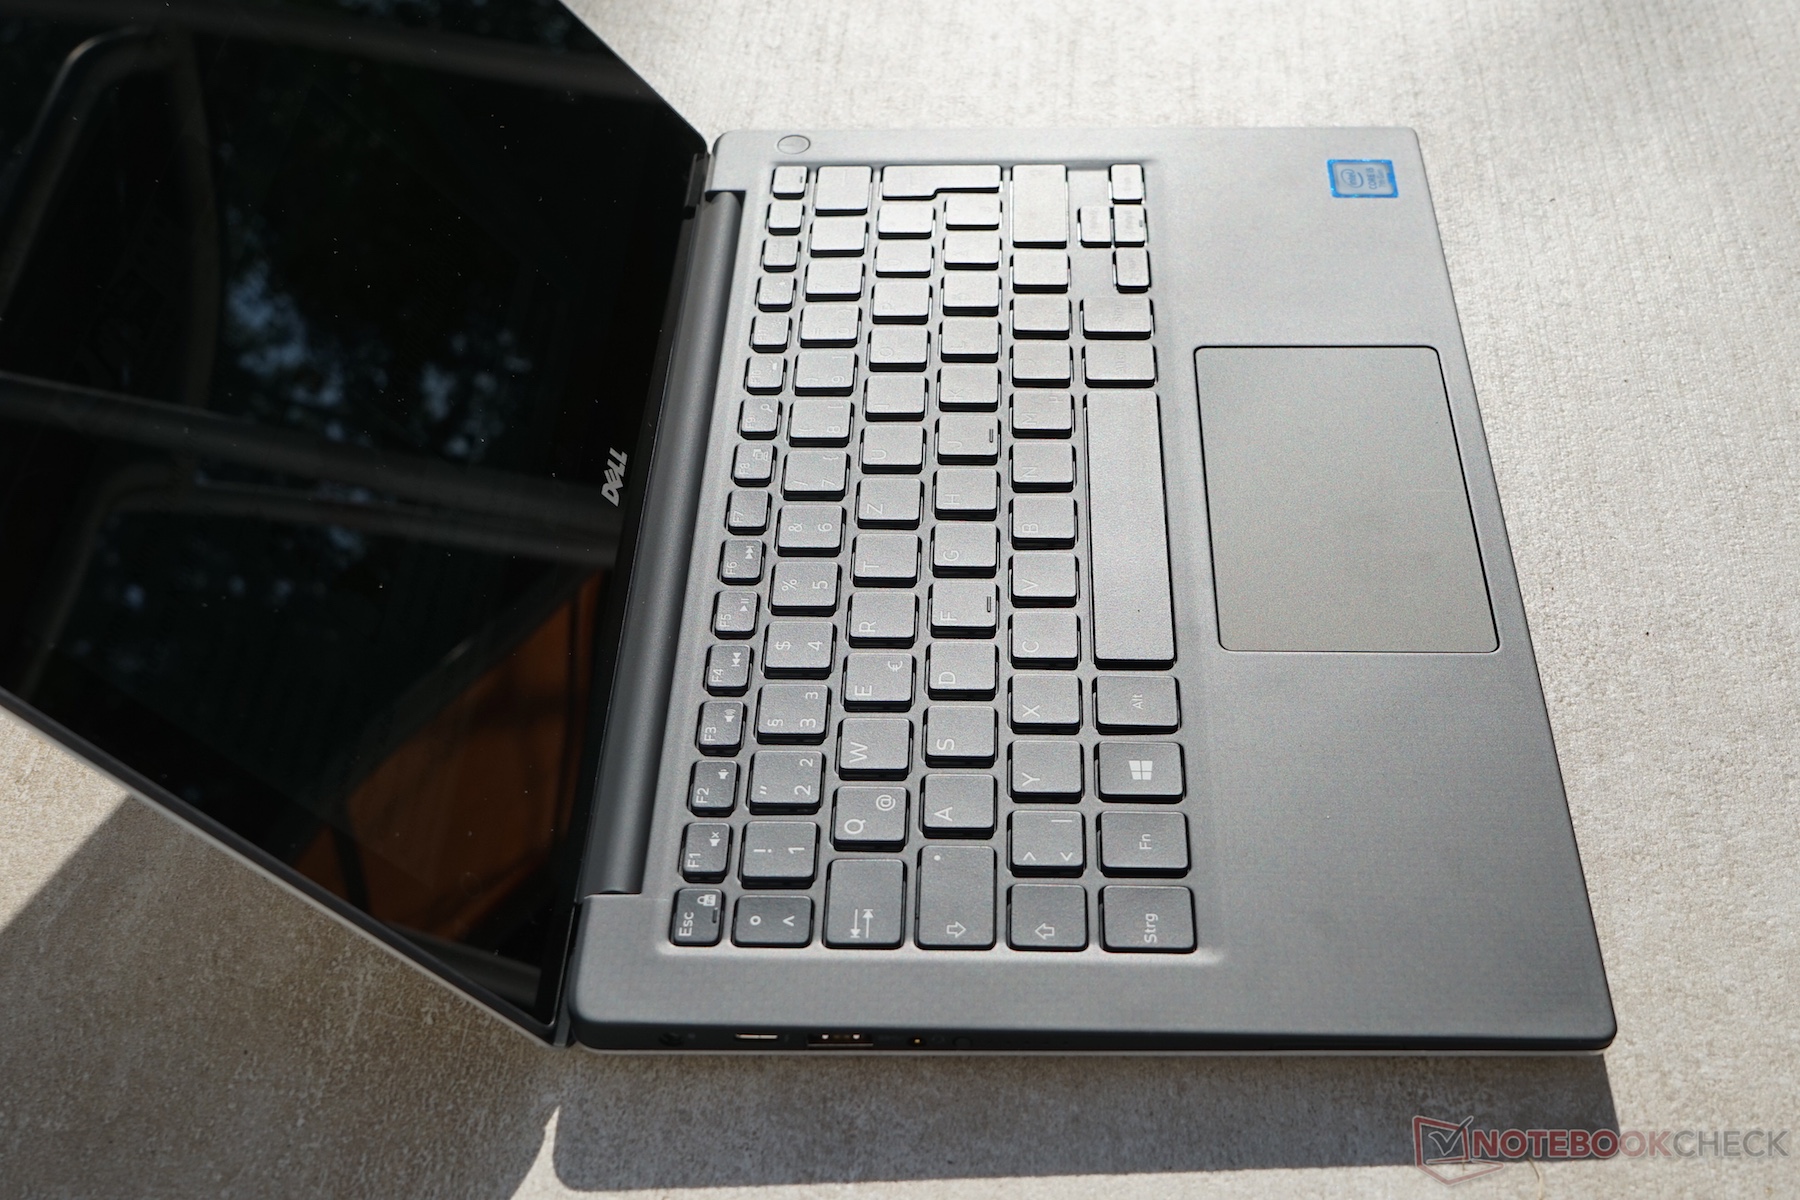
O Dell XPS 13 ainda é um excelente subportátil e, como tal, definitivamente merece aparecer novamente em nossa lista Top 10. Uma duração de 11,5 horas, uma tela com de 90% de cobertura sRGB e brilho decente, chassi de alumínio robusto, sistema de ventilação silencioso, som decente dado o tamanho, muitas portas e facilidade de manutenção - todos esses atributos formam um portátil desejável de 13 polegadas.
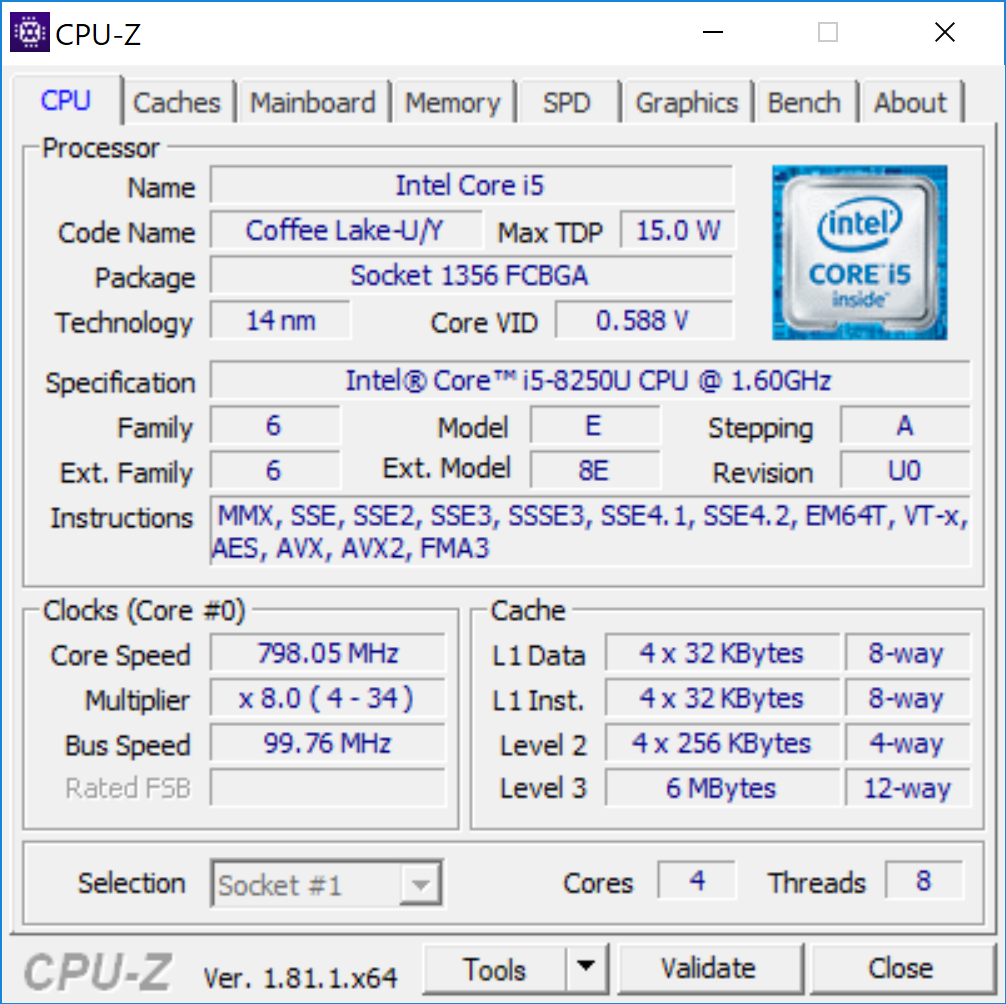
A questão principal que nos perguntamos no início desta análise: A PU Kaby Lake R i5 é adequada ou a atualização para a i7 vale o dinheiro?
Em nossa opinião, o SoC inferior é mais do que suficiente para a maioria dos usuários - a menos que a intenção seja principalmente executar aplicativos paralelizados. Tanto os processadores i5 como os i7 reduzem a velocidade quando submetidos a cargas prolongadas e o desempenho cai em 8 e 9%, respectivamente. Em nenhum momento, durante os nossos testes, os núcleos atingiram as suas respectivas velocidades máximas Turbo de 3,4 e 4,0 GHz. A diferença de desempenho de CPU entre as versões i5 e i7 do XPS 13 é muito pequena e varia de +19% no máximo para +7% no pior dos casos (testes single vs. multi-threaded). O i7 sai um pouco na frente quando se trata de desempenho do sistema (+ 8%).
Ambas as versões XPS 13 superam outros subportáteis como o HP Envy 13-ad006ng ou Apple MacBook Pro 13 2017 na potência de suas CPUs - Kaby Lake R com 8 threads. O i7, por exemplo, tem um desempenho adicional de 70% (R15 Multi, Kaby i7 vs Kaby R i7). O novo quad-core i5 é até 75% mais rápido do que o antigo 7200U dual-core (R15 Multi).
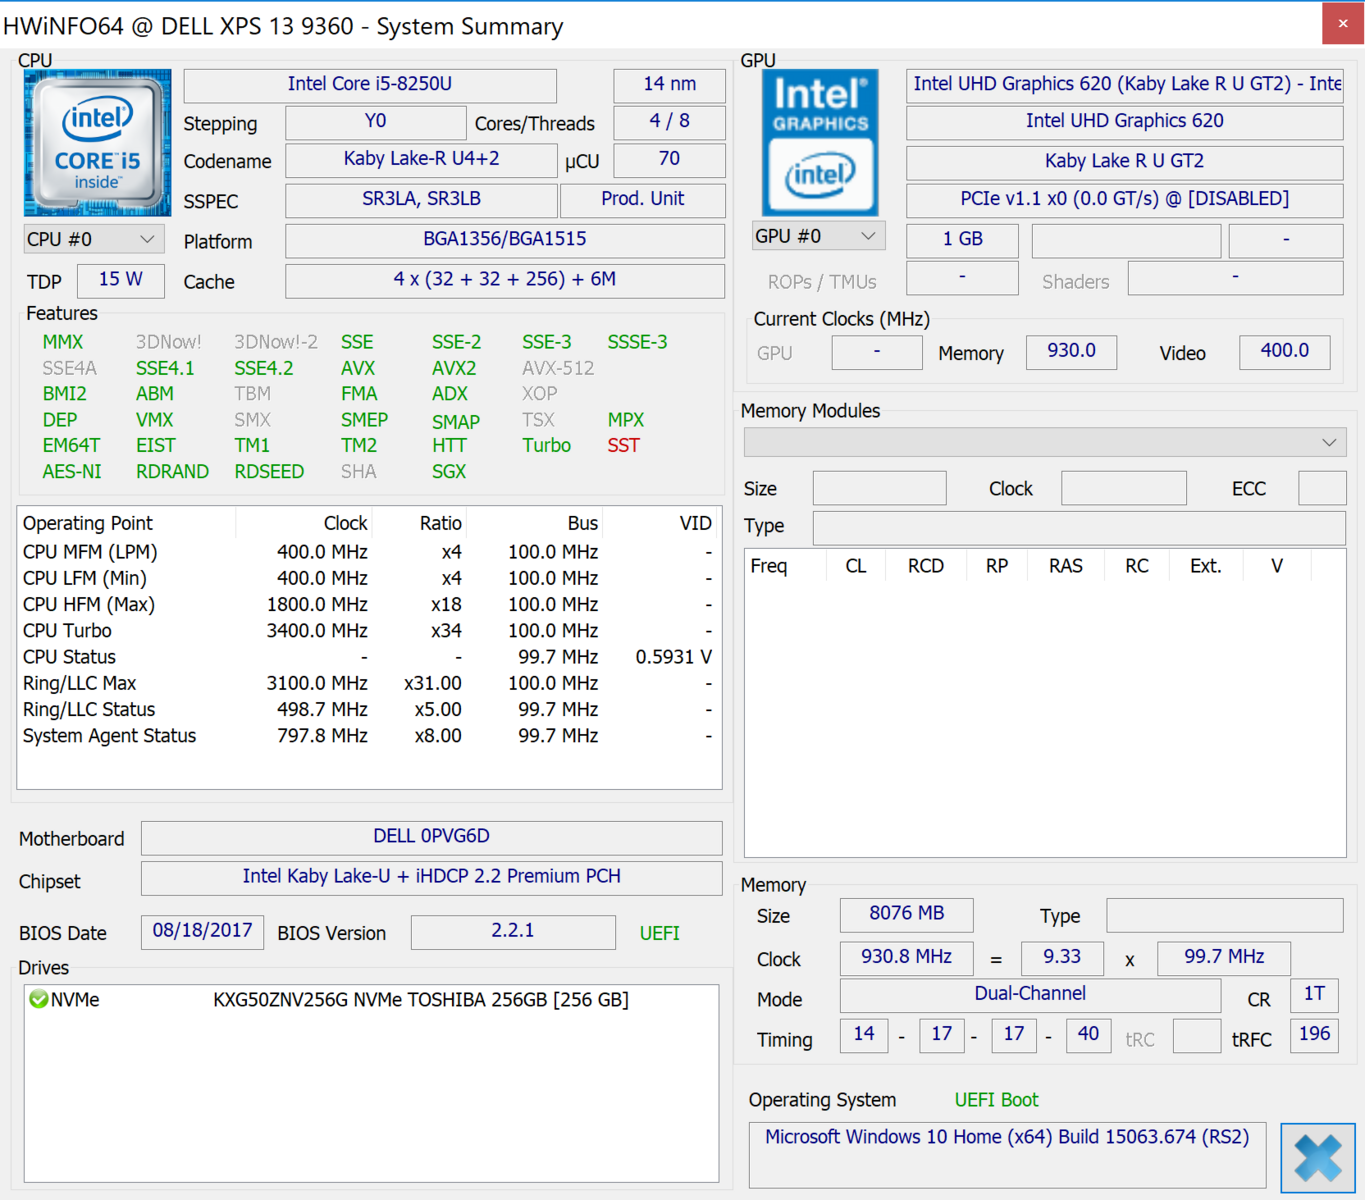
Dell XPS 13 i5-8250U
- 11/16/2017 v6 (old)
Sebastian Jentsch
Price comparison
